Article

Calibration of Parameters for Leaf-Stem-Cutting Model of Tuber Mustard (Brassica juncea L.) Based on Discrete Element Method

1
Nanjing Institute of Agricultural Mechanization, Ministry of Agriculture and Rural Affairs, Nanjing 210014, China
2
College of Mechanical Engineering, Henan Polytechnic Institute, Nanyang 473000, China
3
Graduate School of Chinese Academy of Agricultural Sciences, Beijing 100083, China
4
Chongqing Academy of Agricultural Sciences, Chongqing 401329, China
*
Authors to whom correspondence should be addressed.
Agriculture 2025, 15(7), 773; https://doi.org/10.3390/agriculture15070773
Submission received: 23 January 2025 / Revised: 17 March 2025 / Accepted: 31 March 2025 / Published: 2 April 2025
(This article belongs to the Section Agricultural Technology)

Abstract

:
The cutting of leaf stems is a critical step in the mechanized harvesting of tuber mustard (Brassica juncea L.). This study focuses on the calibration of parameters for the discrete element model of mustard leaf stems to visualize the cutting process and facilitate numerical simulations. Intrinsic material properties were measured based on mechanical testing, and EDEM2022 simulation software was utilized to calibrate the model parameters. The Hertz–Mindlin (no-slip) model was employed to simulate the stacking angle of mustard leaf stems, and the contact parameters for the discrete element model were determined using a combination of two-level factorial design, steepest ascent, and CCD (central composite design) tests. The results showed that the coefficient of restitution, coefficient of static friction, and coefficient of rolling friction for the leaf stems were 0.45, 0.457, and 0.167, respectively, while for interactions between the leaf stems and the working parts, these values were 0.45, 0.55, and 0.175, respectively. Based on the Hertz–Mindlin with bonding model, the primary bonding parameters were calculated, and a BBD (Box–Behnken design) test was applied for optimization. The comparison between the simulation and experimental results showed that the relative error in the maximum shear force was within 5%, indicating that the calibrated model can serve as a reliable theoretical reference for the design and optimization of tuber mustard harvesting and cutting equipment.

1. Introduction

Tuber mustard (Brassica juncea L.) is a distinctive agricultural product in China, cultivated across more than 20 provinces. Among these, Chongqing and Zhejiang account for over 1.5 million acres, representing approximately half of the national cultivation area [1,2]. The product “Fuling pickled mustard tuber” is internationally recognized as one of the world’s three most renowned pickles [3,4]. The harvesting process involves cutting leaf stems with cutting blades while clamping tubers with chains to collect edible tubers [5,6,7]. However, incomplete leaf cutting often leads to blockages and high levels of leaf impurities, restricting the widespread adoption of mechanized harvesting, and resulting in labor-intensive manual processes [8,9].
The discrete element method (DEM) has emerged as a powerful tool for simulating the harvesting process, providing a visual and parameterized approach to analyze the interactions between crops and mechanical components [10,11,12]. DEM simulations require key parameters, including intrinsic, surface contact, and bonding parameters [13,14,15]. While intrinsic and contact parameters can be determined through physical tests [16,17], bonding parameters are calibrated using the Hertz–Mindlin with bonding model, typically based on mechanical performance tests [18]. The DEM has been successfully applied to analyze the cutting mechanisms of various crops, such as Panax notoginseng stems [19], Chinese water chestnut (Eleocharis dulcis L.) [20], oilseed rape (Brassica napus L.) stems [21], and banana straw [22]. These studies have demonstrated the DEM’s potential for optimizing harvesting equipment by providing insights into the mechanical properties and failure mechanisms of crop stems. However, existing research has primarily focused on crops with relatively uniform stem structures, and while these studies have successfully calibrated DEM parameters for such crops, the unique structural and mechanical properties of tuber mustard leaf stems present distinct challenges. Unlike the relatively uniform stems of other crops, tuber mustard leaf stems exhibit significant variability in size, shape, and mechanical strength, making the direct application of existing DEM models inadequate. Furthermore, previous studies have simplified the internal structure of stems by treating them as homogeneous materials, which may not accurately capture the complex failure mechanisms during cutting.
Given the significant differences in the structure and mechanical properties of tuber mustard stems compared to other crops, it is necessary to construct and calibrate the primary parameters of the DEM simulation model accordingly. This study focuses on the calibration of DEM parameters specifically for tuber mustard leaf stems by combining mechanical testing with simulation methods to develop a more reliable DEM model that captures the unique characteristics of tuber mustard leaf stems.

2. Materials and Methods

2.1. Materials and Measurement of the Physical Parameters

The tuber mustard was taken from the experimental field of the Chongqing Academy of Agricultural Sciences (CAAS) on 7 January 2024, with “Yuzao 100” as the test object. The field was planted in September, with single-ridge and double-row planting. The main agronomic parameters are shown in Figure 1.
Basic physical parameter measurements were taken using the five-point sampling method. Twenty plants were selected from each site, and plant height was measured with a tape measure (accuracy: 1 mm). The moisture content, density, and stacking angle were determined according to the standerd GB/T 5262-2008 “Measuring methods for agriculturalmachinery testing conditions-General rules [23]”. (GB/T 5262-2008). The moisture content of the leaf stems was determined using a DGF30/7-IA electric quick freeze-drying oven (Nanjing Experimental Instrument Factory, Nanjing, China), following the drying method. Density was measured using the liquid displacement method. Each of the tests was repeated ten times, and the average values are shown in Table 1.

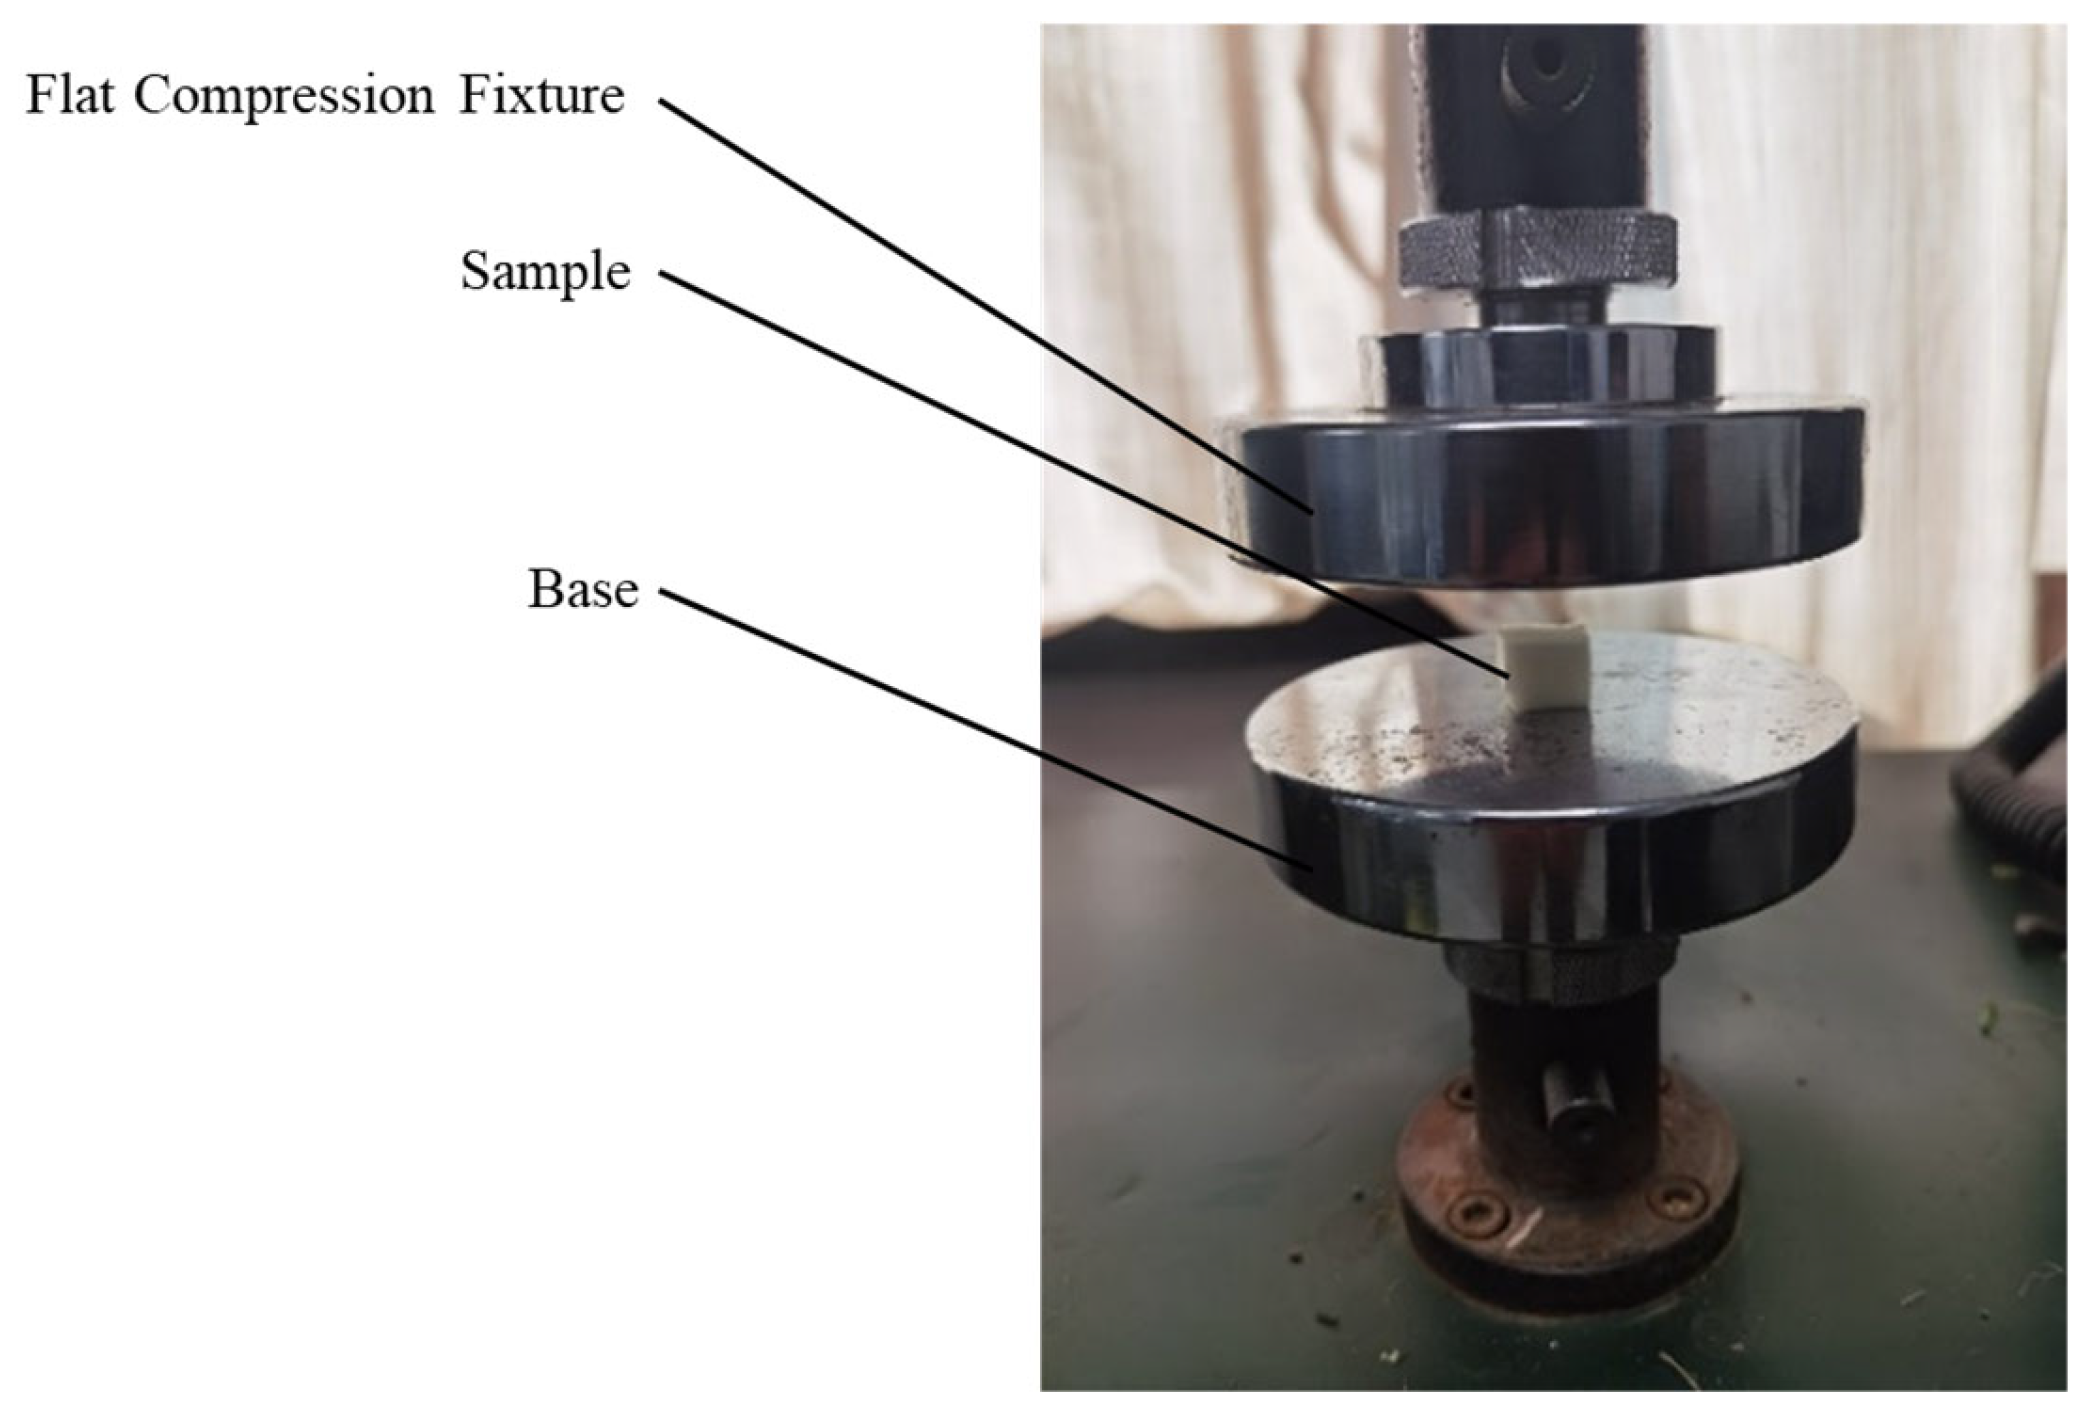
2.2. Measurement of Intrinsic Parameters

The measurements primarily involved determining Poisson’s ratio (µ) and the elastic modulus (E). Poisson’s ratio (µ) is the ratio of the lateral deformation to axial deformation when a sample is subjected to uniaxial tension or compression. It serves as an index of the material’s lateral deformation elasticity. The elastic modulus (E) reflects the ability of the tuber mustard leaf stem to resist elastic deformation. A uniaxial compression test was designed [21], and the measurements were taken according to Formula (1):
μ = Δ ε x Δ ε z = Δ L x Δ L z E = δ ε = F L S Δ L z
where μ is the Poisson’s ratio, ε x is the crosswise strain increment (mm/mm), ε z is the lengthwise strain increment (mm/mm), L x is the crosswise deformation (mm), L Z is the lengthwise deformation (mm), E is the elasticity modulus (Mpa), σ is the axial compressive strength (Mpa), ε is the axial strain (mm), F is the maximum force at the stage of deformation (N), S is the cross-sectional area of the sample (mm2), and L is the initial length of the sample (mm).
The samples of tuber mustard leaf stem were selected and tested in the Mechanics Laboratory of Nanjing Agricultural Mechanization Research Institute, Ministry of Agriculture and Rural Affairs, and the instrument used for the test was a DWD-type electronic universal testing machine (SUNS, Shenzhen, China), with a displacement resolution of 0.01 mm and a maximum loading rate of 0.01 m/min. Samples were collected from the middle segment of the stem (5 cm from the tuber, avoiding nodes and visible damage). Cube standard specimens with a side length of 10 mm were prepared, and a circular compression test fixture (with a diameter of 120 mm and thickness of 20 mm) was used to conduct the compression test and obtain the load–displacement relationship. The uniaxial compression test is shown in Figure 2.
Through the tests, the results were averaged to obtain a Poisson’s ratio of 0.41 ± 0.07 and an elastic modulus of 1.64 ± 0.33 MPa for the leaf stem samples of tuber mustard.

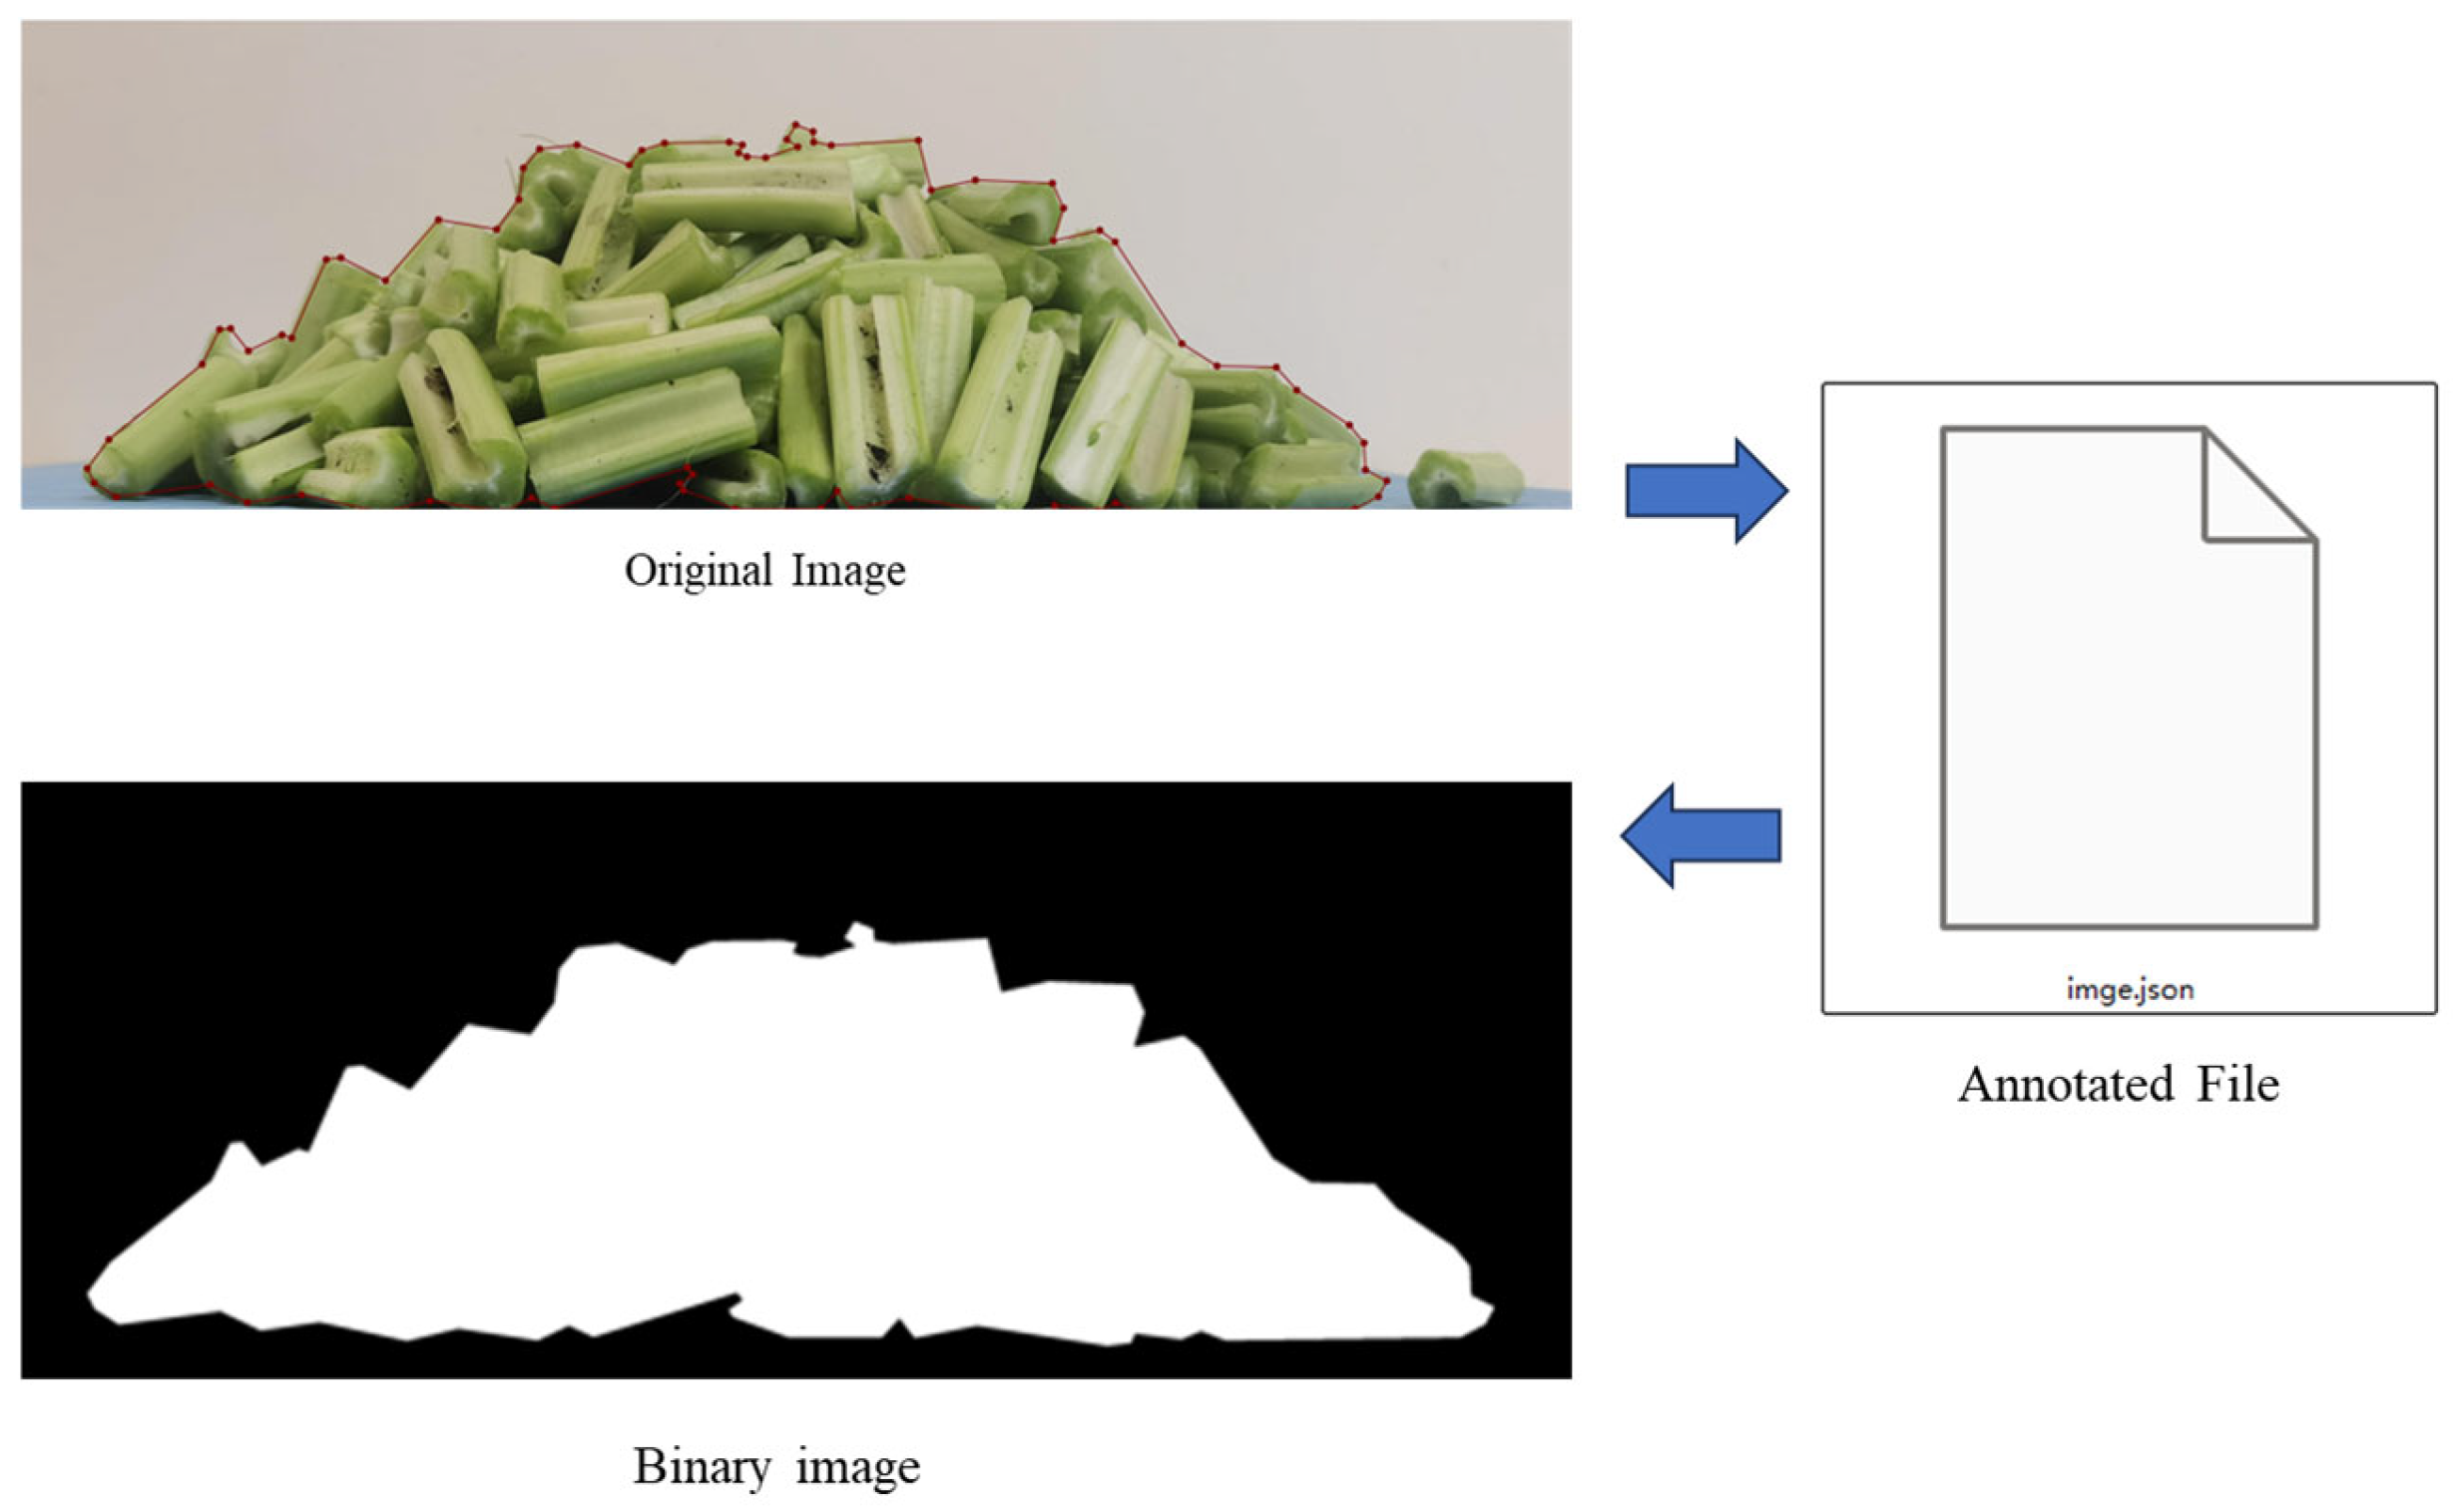
2.3. The Measurement of the Stacking Angle

The stacking angle is a critical parameter for calibrating the contact properties of the leaf stems in the discrete element model. It reflects the flowability and interaction between the stems. The stacking angle was measured using the cylinder lifting method [22]. A steel cylinder with an inner diameter of 300 mm and a height of 150 mm was fixed to a universal testing machine (SUNS, Shenzhen, China), with its bottom surface in contact with the test bench. To ensure sample consistency and minimize size-related variability, leaf stems were collected from 20 mature tuber mustard plants. The stems were processed into test samples, each measuring 60 mm in length, which were placed into the cylinder. Subsequently, the cylinder was lifted upward at a speed of 0.05 m/s, allowing the samples to naturally accumulate. The stacking angle of the leaf stems was then measured, as illustrated in Figure 3.
To minimize manual measurement errors, images were processed systematically. The open-source annotation software Labelme 5.5 was used for manual annotation of the original heap angle images. The images were then converted into binary format using the OpenCV image processing toolkit. The contour data extracted from the images were imported into the digitization tool of Origin2022 software (OriginLab Corporation, Northampton, MA, USA), where a linear fit was applied to the profile coordinates. The slope of the fitted line represented the stacking angle, which was then converted into degrees.

2.4. Discrete Element Simulation Modeling

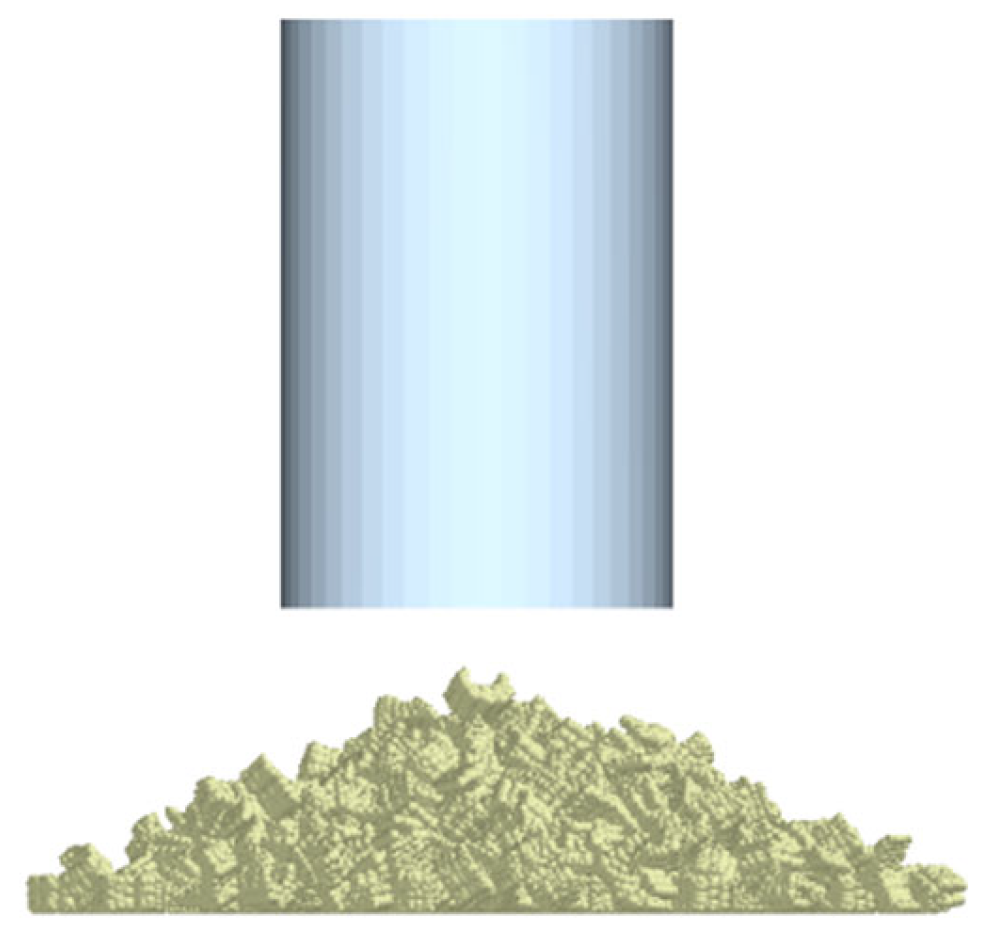
2.4.1. Simulation Modeling of Stacking Angle

The Hertz–Mindlin (no-slip) model, implemented in the EDEM simulation software (Altair, Edinburgh, Scotland), was used to simulate the contact behavior of the leaf stems. Due to the significant variation in leaf stem sizes within the same plant, the simulation model was simplified to reflect the actual cross-sectional shape and size range of the stems. Four different leaf stem models, each with a length of 60 mm, were created. The ball–particle fast-filling method was employed to construct these models. Table 2 shows the cross-sectional shapes of each model and the proportions of the simulation models used.
In addition to the leaf stem model, a virtual cylinder was created to simulate the lifting process. During the simulation pre-processing phase, a virtual cylinder, identical in size to the actual one, was constructed and set up as a particle factory. Leaf stem particles were generated with an initial velocity of 0.5 m/s, directed downward along the central axis of the cylinder. The particle generation rate was set to 500 particles per second for 2 s. After particle stabilization, the cylinder moved along the central axis at a constant speed of 0.03 m/s. Once the cylinder was completely removed, the leaf stem particles naturally formed a pile, as shown in Figure 4.
Based on the results of the physical tests and the contact parameter ranges for tuberous materials [17,24,25,26,27,28,29], the variation ranges of each simulated contact parameter are shown in Table 3.

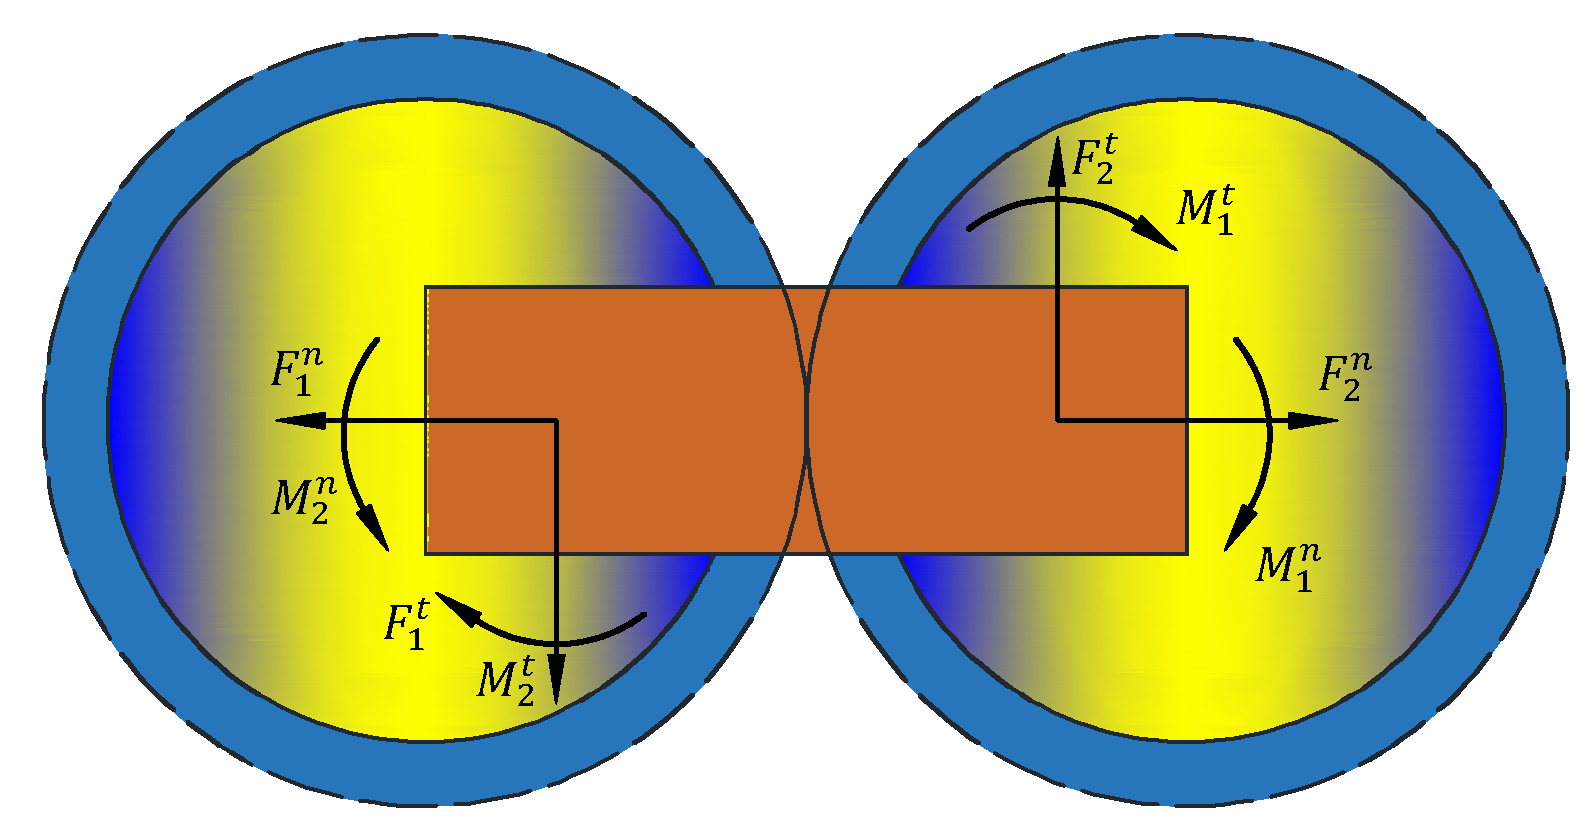
2.4.2. Bonding of Leaf Stem Simulation Model

The interior of the leaf stem consists of water and dense plant fibers, making it difficult to directly observe particle adhesion and select an appropriate discrete element model, such as for planting soil. Therefore, the model type was determined based on observed damage during the cutting process. As shown in Figure 5, the Hertz–Mindlin with bonding contact model was selected for the simulation.
In the EDEM software, the Hertz–Mindlin with bonding model was applied to perform the shear simulation tests. During the tests, the cross-sectional image of the leaf stem was extracted and fitted according to its actual cross-sectional shape, using SolidWorks 2020. Although it is not possible to fully replicate the internal structure of the leaf stem, the model can be considered accurate by ensuring consistency in both the internal and external mechanical properties based on simplified modeling [20,30]. The leaf stem model was then created with a length of 80 mm using SolidWorks 2020, and then imported into EDEM to generate the discrete element model with bonding, as shown in Figure 6.
The box geometry of 120 mm × 70 mm × 80 mm was established in EDEM software, and the processed model was imported into its interior, with the type set to virtual. A large number of particles were generated and densely packed within the box. Once the particles stabilized, the shell of the leaf stem was set to the physical type. The box was then changed back to the virtual type, and excess particles were automatically removed as they exited the simulation domain under gravity. When the internal particles reached a stable state, bonds were created to aggregate the particles. Afterward, the shell was deleted, resulting in a model composed solely of particles. The smaller the particle radius in the discrete element model, the closer the simulation is to real-world conditions, although this increases the computational complexity. The model consisted of spherical particles bonded together to form the shape of a leaf stem. Under the action of the shear tool, the bonds were fractured, generating breaks and fractures.
The internal structure of the leaf stems was modeled as a cohesive particle system with mechanical strength, where adhesion between particles defines the bonding relationships. The mechanical properties are characterized by forces and torques at the contact points [21,23]. Each set of bonding interactions experiences load increments in four directions: normal force, normal torque, tangential force, and tangential torque, which can be expressed as Equation (2):
δ F b n = v n S n A δ t δ F b t = v n S t A δ t δ M b n = ω n S t J δ t δ M b t = ω t S n J 2 δ t
where δ t is the timestep (s), v n is the normal velocity of the particle (m/s), v t is the tangential velocity of the particle (m/s), ω n is the normal angular velocity of the particle (rad/s), ω t is the tangential angular velocity of the particle (rad/s), J is the inertia torque (m4), A is the contact area (m2), δ M b n is the normal torque ( N · m ) , δ M b t is the tangential torque ( N · m ), S n is the normal stiffness per unit area (N/m3), S t is the tangential stiffness per unit area (N/m3), δ F b n is the normal adhesion (N), and δ F b t is the tangential adhesion (N).
δ M b n and δ M b t are the torques of the bonds in the normal and tangential directions, respectively; they are reflected in the bending and torsion of the bonds. δ F b n and δ F b t represent the normal and tangential stretching of the bonds, respectively. When the external force exceeds any of the above 4 forces, it will cause the bond to break, which can be expressed as shown in Equation (3):
σ max < F n A + 2 M b t J R b τ max < F t A + 2 M b n J R b
where σ m a x is the normal critical stress (Pa) and τ m a x is the tangential critical stress (Pa).
To obtain a reliable discrete element simulation model, four parameters—normal stiffness, tangential stiffness, tangential critical stress, and normal critical stress—need to be calculated for the bonding model according to the following formulae:
K n = F n y n
K τ = 1 3 2 3 K n
σ n = F n A n
σ τ = F τ A τ
where K n is the normal stiffness (N/m), K τ is the tangential stiffness (N/m), F n is the load increment in the axial direction (N), y n is the deformation increment in the axial direction (mm), σ n is the normal critical stress (Mpa), σ τ is the tangential critical stress (Mpa), F n is the compressive ultimate load (N), A n is the cross-sectional area of the compressed specimen (mm2), F τ is the shear ultimate load (N), and A τ is the cross-sectional area (mm2).

2.5. Calibration Test of Contact Parameters in Discrete Element Model

2.5.1. Two-Level Factorial Tests

Based on the leaf stem stacking angle simulation model developed in the previous phase, the simulation approximation prediction method was employed to calibrate the surface contact parameters. The stacking angle from the simulation tests was used as the evaluation criterion. The maximum and minimum values for each parameter, as shown in Table 3, were selected as the high and low levels, respectively. A two-level factorial experimental design was constructed using Design-Expert 13.0.12 software (Stat-Ease, Minneapolis, MN, USA), based on the Box–Behnken central composite design, to identify the main parameters significantly influencing the stacking angle.

2.5.2. Steepest Climbing Test

For the main parameters identified, a steepest climbing test was conducted to approximate the optimal values. Non-significant basic contact parameters were set to intermediate levels in the two-level factorial test, while significant parameters were incremented stepwise. A leaf stem particle model was established to simulate the stacking angle, and the relative error between the simulation results and physical test measurements was recorded. The optimal values were determined by analyzing the trend of changes in the relative error.

2.5.3. Central Composite Design Test

Building on the results from the two-level factorial and steepest climbing tests, a stacking angle simulation test was conducted using the high, medium, and low levels of the significant parameters, which were selected from the region near the optimal value. These levels were then applied in the central composite design (CCD) test. The non-significant parameters in the simulation model were kept the same as in the steepest climbing test.

2.6. Calibration and Correction of Bonding Parameters

During the simulation tests, discrepancies were observed between the maximum shear force experienced by the sample and the actual values. To address this, a virtual shear test was conducted in the EDEM software based on the calculated bonding parameters. The test setup and loading parameters were consistent with those described in Section 2.2.
A shear tool (with a blade thickness of 2 mm, double-edged geometry, and blade angle of 20°) was selected for the simulation. The maximum shear force (F) was used as the response variable, and the particle radius was set to 2 mm. Four bonding parameters—normal stiffness, tangential stiffness, tangential critical stress, and normal critical stress—were further adjusted to minimize the discrepancies between the simulation and the experimental results. Following the principles of Box–Behnken design (BBD), a four-factor, three-level experimental design was implemented to optimize the bonding parameters and determine the best values.

3. Results and Discussion

3.1. Analysis of Contact Parameter Calibration Test Results

3.1.1. Results of Two-Level Factorial Tests

According to the contact parameter calibration method, the experimental design was carried out with the stacking angle as the test target value and the coefficient of restitution between leaf stems (A), the coefficient of static friction between leaf stems (B), the coefficient of rolling friction between leaf stems (C), the coefficient of restitution between leaf stems and steel (D), the coefficient of static friction between leaf stems and steel (E), and the coefficient of rolling friction between leaf stems and steel (F) as the test factors; the design of the test and the results are shown in Table 4. The effect of each parameter was determined by ANOVA, as shown in Table 5.
Based on the results of the significance analysis, the coefficient of static friction between leaf stems (B) and the coefficient of rolling friction between leaf stems (C), which had a significant effect on the stacking angle, were selected for the steepest climbing test. The coefficient of restitution between leaf stems (A), the coefficient of restitution between leaf stems and steel (D), the coefficient of static friction between leaf stems and steel (E), and the coefficient of rolling friction between leaf stems and steel (F) had no significant effect on the stacking angle; these parameters were set to intermediate values.

3.1.2. Results of Steepest Climbing Test

The results of the steepest climbing test are shown in Table 6. Based on the stacking angles determined by the steepest climbing test and physical test, the relative error was calculated as follows:
γ = θ θ θ
where θ is the stacking angle of the simulation test and θ is the stacking angle of the physical test.
According to the test results, when the coefficient of static friction (B) and the coefficient of rolling friction (C) between leaf stems increase, the stacking angle of the simulation test gradually increases, while the relative error between the stacking angles from the simulation and physical tests initially decreases and then increases. The smallest relative error occurred in Test 3. Therefore, the parameters from Test 3 were selected as the zero level, the parameters from Test 2 were set to the low level, and the parameters from Test 4 were set to the high level. The stacking angle served as the response value for the subsequent central composite test to determine the optimal solution.

3.1.3. Results of Central Composite Test

Based on the results of the two-level factorial test and the steepest climbing test, the response surface optimization test was carried out by using the central composite module in the Design-Expert software (Stat-Ease, MN, USA) to identify the optimal parameter combinations for the coefficient of static friction (B) and the coefficient of rolling friction (C) between the leaf stems. The other parameters in this test were set according to the results of the steepest climbing test. The test program and factor coding are shown in Table 7, while the test results are presented in Table 8.
As shown in Table 8, the resultant data were analyzed by quadratic regression to establish a regression model for the stacking angle in relation to the coefficient of static friction (B) and the coefficient of rolling friction (C) between the leaf stems:
θ = 33.13 + 1.2 B + 0.43 C 0.01 B C + 0.39 B 2 0.19 C 2
The results of the central composite test were analyzed by ANOVA through Design-Expert software, and the results are shown in Table 9, which shows that the p-value of the quadratic regression model for the stacking angle is less than 0.0001, indicating that the regression model is highly significant. The p-value for the lack of fit is 0.3103, which is not significant. The model’s coefficient of determination is 0.9751, which indicates that the quadratic regression model of the stacking angle is well fitted.
In the regression model, B, C, and B2 are important model terms, which have highly significant effects on the stacking angle (p < 0.05), while BC and C2 have insignificant effects on the stacking angle (p > 0.05).
Based on the results from the central composite test and the regression equations, the optimal solution analysis of factors B and C was conducted, with the goal of minimizing the relative error of the stacking angle obtained from the test. The objective function and constraints were set as follows:
( s . t . ) m i n γ ( B , C ) 0.36 B 0.64 0.08 C 0.22
The optimal values for B and C are 0.457 and 0.167, respectively, representing the optimal parameter combination for verification. The other parameters were kept consistent with those used in the central composite test. A simulation model of the stacking angle was established, and a simulation test was conducted. The average stacking angle in five repetitions was 34.23°, with a relative error of 3.85% compared to the actual stacking angle. This result is in close agreement with the physical test results, indicating that the method for determining the contact parameters of the leaf stems of tuber mustard is feasible.

3.2. Calculation and Correction of Bonding Parameters

As shown in Figure 7, the axial load–displacement curve from the compression test can be divided into three distinct stages. In the first stage (o–a), the slope of the curve gradually increases as the specimen comes into contact with the contactor and begins to compress. In the second stage (a–b), the slope remains relatively constant, indicating that the specimen has entered the elastic deformation phase. In the third stage (b–c), the curve exhibits significant fluctuations, signifying the onset of plastic deformation in the specimen.
Using origin2020 software (OriginLab, Northampton, MA, USA) to fit the slope of the curve in segment a-b, the normal stiffness ( K n ) can be calculated, and the tangential stiffness ( K τ ) is 2/3 of the normal stiffness [11]. Based on the results of the axial compression tests and the average value obtained from 10 test repetitions, the parameters of the bonding model for the leaf stems were determined as K n = 5.61 × 10 4 N/m, K τ = 3.74 × 10 4 N/m, σ n = 0.83 Mpa, and σ τ   = 0.48 Mpa.
Based on the calculation results and methodologies from similar studies [17], the experimental levels for each factor were determined to ensure that they covered the expected optimal values while avoiding unrealistic extremes. The bonding parameters were then refined according to the principles of the Box–Behnken design (BBD). The coded values of the experimental factors and the corresponding simulation results are presented in Table 10.
A variance analysis was performed on the Box–Behnken response surface experimental results, as shown in Table 11. The coefficient of determination (R2) of the model was 0.9927, indicating a good fit. The model was significant, and the lack of fit was not significant. Among the factors, K τ , σ n ,   and   σ τ had a significant impact on the shear force. Significant interactions were observed between K n K τ , K τ σ n , K τ σ τ , σ n ,   a n d   σ τ , while the remaining interactions showed no significant effect.
A regression analysis was performed on the experimental results, and the regression equation with maximum shear force as the response variable is given by Equation (11):
F = 68.98 + 6.71 K τ + 1.12 σ n + 5.33 σ τ + 2.93 K n K τ 1.2 K τ σ n 2 K τ σ τ + 1.32 σ n σ τ 0.43 K n 2 + 2.45 K τ 2 + 4.46 σ τ 2
The response surface plots illustrating the influence of significant factor interactions on the maximum shear force, based on the regression equation, are shown in Figure 8.
The optimization objective was to minimize the error between the actual shear force and the simulated shear force. Parameter optimization was conducted using Design-Expert, and the optimal values obtained were as follows: K n = 3.19 × 10 4 N/m, K τ = 7.67 × 10 4 N/m, σ n = 1.15 Mpa, and σ τ = 0.34 Mpa.

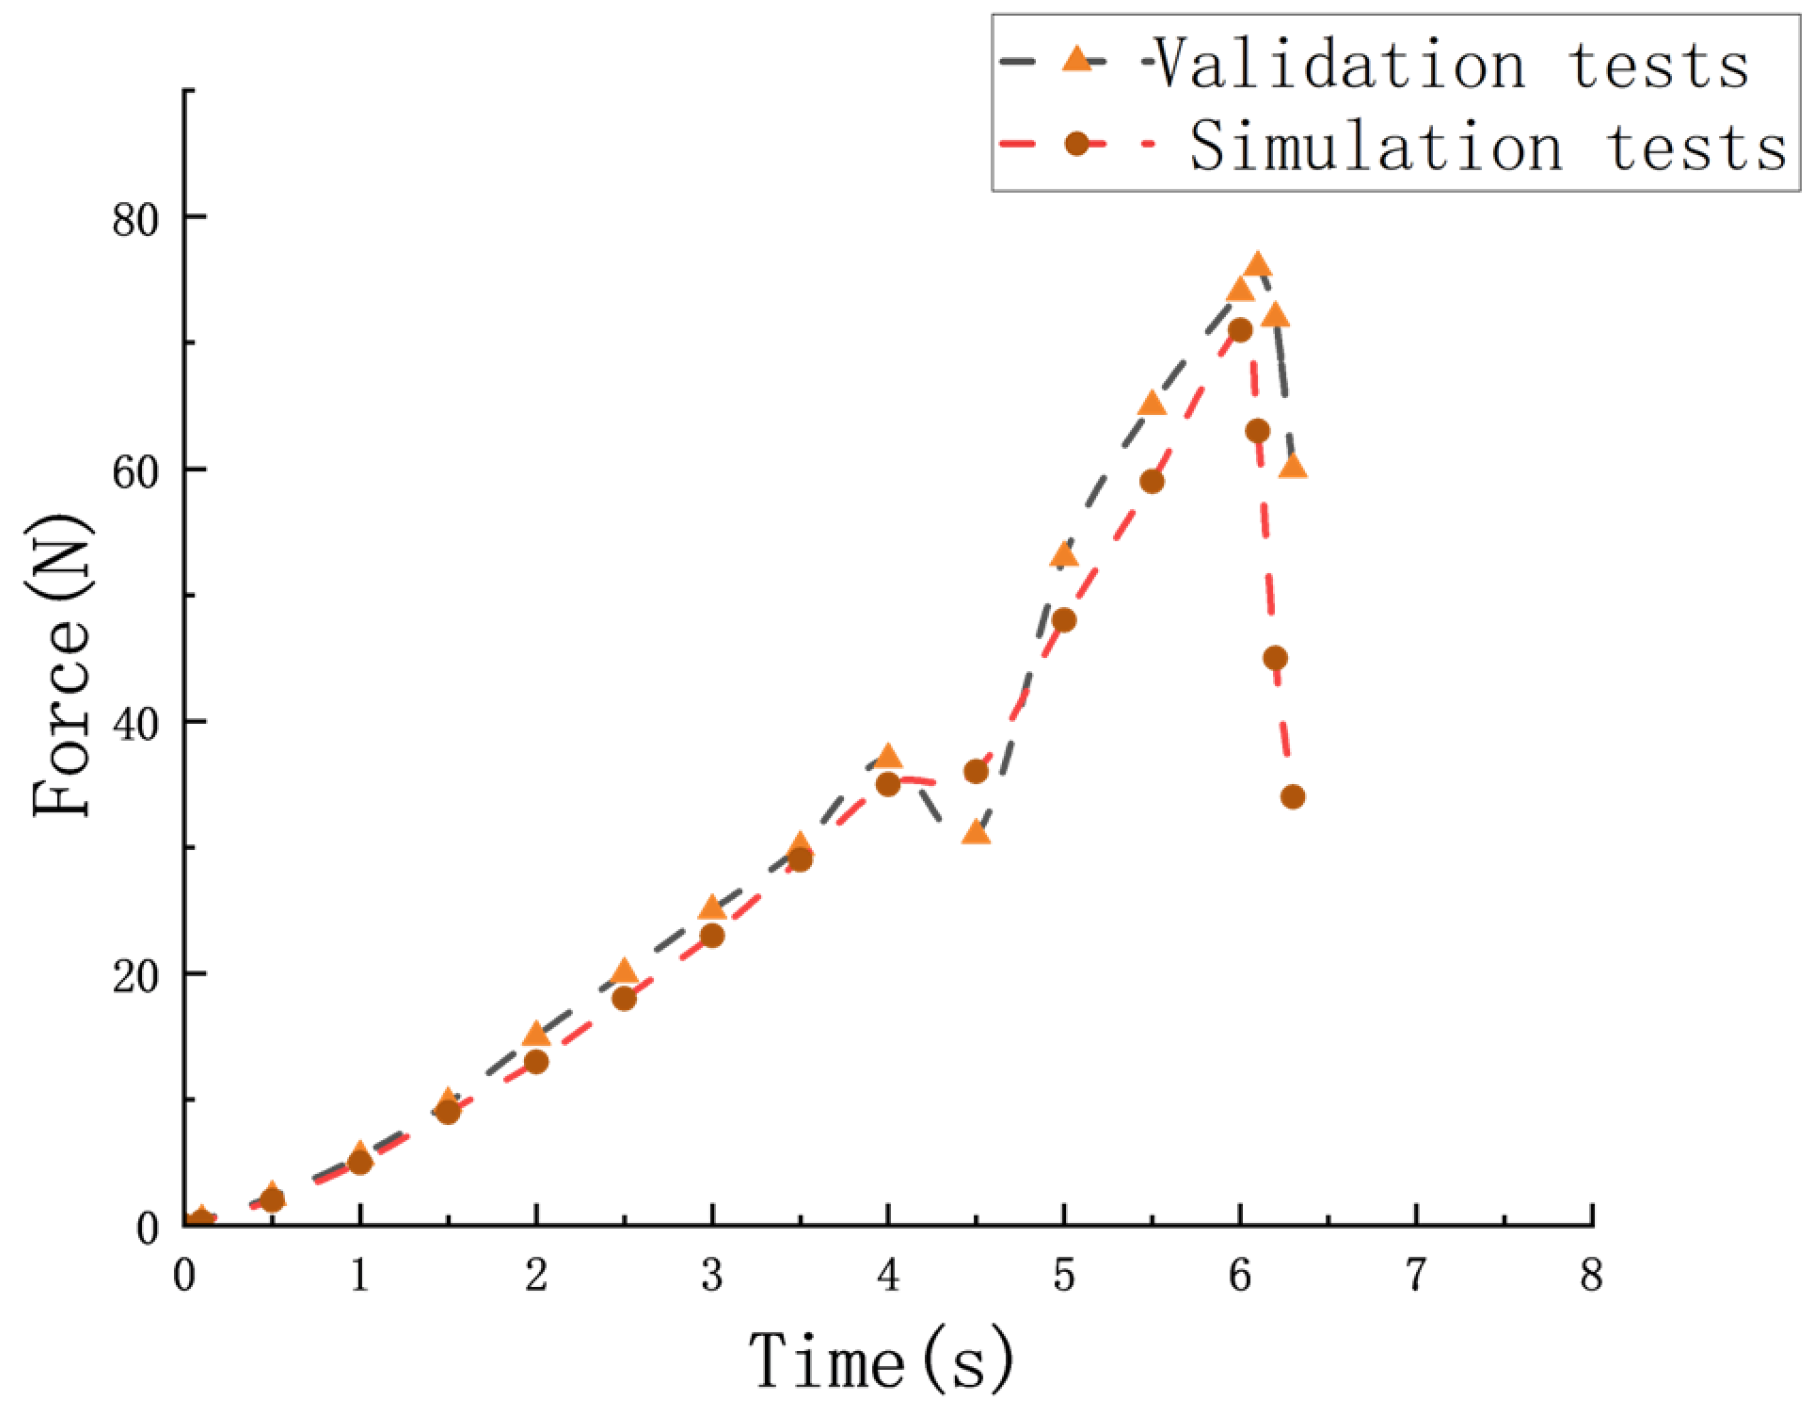
3.3. Model Validation

To verify the reliability and accuracy of the bonding parameters in the discrete element model, a simulation model was developed based on the actual cross-sectional shapes of the stems combined with the calibrated bonding parameters, and validation tests were conducted, as shown in Figure 9. The maximum shear force was displayed using the post-processing module of EDEM, and the simulated shear process was compared with the actual shear process, as shown in Figure 10.
As shown in Figure 10, both the simulation and the experimental tests exhibited an overall increasing trend in shear force over time. In the initial 0–6 s, the shear force gradually increased to a peak value before decreasing. Specifically, from 0 to 1 s, the shear force increased approximately linearly with time. Between 1 and 6 s, fluctuations in the shear force were observed due to varying factors during the shearing process.
These fluctuations were primarily attributed to the rupture of the outer skin and the inner fibers of the leaf stem. When these structures were damaged, the shear force decreased abruptly. Additionally, the irregular cross-sectional shape of the leaf stems caused inconsistencies in the shear force variations. As the shear depth increased, the contact area between the cutting tool and the leaf stem expanded, resulting in greater friction and an increase in shear force.
In the simulation tests, the bonding between particles in the discrete element model caused the cutting tool to break these bonds as it moved downward. Once the bonds were broken, the shear force temporarily decreased. However, as the cutting tool continued to penetrate deeper, the friction increased, and the shear force gradually rose—mirroring the trend observed in the physical test—until the leaf stem was fully severed. A total of 20 validation tests were conducted, and the results showed that the overall trend of shear force in both the simulation and the experimental tests was similar. The relative error between the maximum shear force in the simulation and that in the experimental tests was 4.34%, which demonstrates the reliability of the discrete element bonding model.

3.4. Discussion

The intrinsic parameters of materials are particle property parameters that can be measured through physical experiments, with force measurement being the most commonly used method. However, due to the complex texture, irregular shape, and individual differences of leaf stems, directly measuring Poisson’s ratio is difficult. Although uniaxial compression tests cannot fully replicate the internal structure of leaf stems, the model can be considered accurate by ensuring consistency in both the internal and external mechanical properties of the leaf stems based on simplified modeling [24].
Contact parameters, including the recovery coefficient, static friction coefficient, and dynamic friction coefficient, were calibrated through a combination of experiments and simulations, following methodologies from similar studies [10,11,30,31,32,33]. The cutting force gradually reached a maximum and then decreased abruptly, which is consistent with other studies. The discrepancy in the timing of shear force reduction between the simulation and the actual tests was primarily due to the simplification of the leaf stem model as isotropic particles to reduce the computational load and improve the simulation efficiency, leading to a slightly asynchronous behavior between the breaking time of bonds and the actual fiber rupture time.
The results indicated that the tangential stiffness ( K τ ) and critical tangential stress ( σ τ ) had the most significant impact on the shear force, followed by the normal stiffness ( K n ) and critical normal stress ( σ n ). These findings are consistent with the mechanical behavior observed during the cutting process, where tangential forces played a dominant role in the failure of the bonds, compared with those of other crops, such as oilseed rape and banana stalks. The results show that the static friction coefficient and rolling friction coefficient for tuber mustard are lower than those of oilseed rape, likely due to differences in moisture content and fiber density. In contrast, the critical normal stress and critical tangential stress for tuber mustard are higher than those of banana stalks, reflecting the stronger mechanical properties of mustard stems. These comparisons demonstrate the unique characteristics of tuber mustard and the need for crop-specific parameter calibration.
There are still some shortcomings in this study, such as the following:
(1)
Among the contact parameters, such as collision recovery coefficient, static friction coefficient, and dynamic friction coefficient, that can be measured by the experiments, the parameters used in this study are ranges based on similar studies. The accuracy of the calibration value can be measured by testing first to reduce the range of the calibration parameters.
(2)
The leaf stem, in reality, consists of multiple components, including the epidermis, surface layers, phloem, xylem, and other parts. For a more accurate bonding model, it is important to consider that the parameters of these different parts vary. However, in this study, the test focused solely on the maximum cutting force, without considering the influence of these anatomical differences. As a result, the actual shear behavior may differ from the results obtained in the simulation.
Further research is needed to establish more precise calibration methods for the parameters. Incorporating a more detailed representation of the leaf stem’s anatomical structure, including components like the epidermis, phloem, and xylem, would provide a more realistic bonding model and lead to a better understanding of how these internal variations impact the cutting process. Furthermore, further research is needed to explore the dynamic interactions between the cutting tool and the leaf stem under varying harvesting conditions, such as different moisture levels and cutting speeds.

4. Conclusions

Based on the Hertz–Mindlin (no-slip) model and the Hertz–Mindlin with bonding model, in combination with physical experiments and virtual calibration tests, the discrete element simulation parameters for mustard leaf stems were calibrated, resulting in a cutting model suitable for leaf stem simulations. The main conclusions of this study are as follows:
(1)
The contact and bonding parameters for the discrete element model of tuber mustard leaf stems were successfully calibrated. The collision recovery, static friction, and rolling friction coefficients between the leaf stems were determined as 0.45, 0.457, and 0.167, respectively. For interactions between leaf stems and steel, these values were 0.45, 0.55, and 0.175, respectively. The bonding parameters, including normal stiffness ( K n = 3.19 × 10 4 N/m), tangential stiffness ( K τ = 7.67 × 10 4 N/m), and critical stresses ( σ n = 1.15 MPa, σ τ = 0.34 MPa), were optimized using the Hertz–Mindlin with bonding model.
(2)
The calibrated model was validated through simulation and physical shear tests, showing a relative error of less than 5% in the maximum shear force. This confirms the model’s accuracy and reliability for simulating the cutting process of tuber mustard leaf stems.
(3)
This study provides essential parameter references for the design and optimization of tuber mustard harvesting equipment, making the cutting process of leaf stems more visually interpretable. Future research should focus on incorporating the anatomical structure of stems and expanding the range of contact parameters to further enhance the model’s precision and applicability.

Author Contributions

Conceptualization, Z.H., F.G. and B.W.; methodology, F.G. and B.W.; software, J.L.; validation, H.S.; formal analysis, B.W.; investigation, L.P. and S.S.; resources, M.G.; data curation, M.G.; writing—original draft preparation, M.G.; writing—review and editing, M.G.; visualization, W.L.; supervision, H.S.; project administration, Z.H.; funding acquisition, F.G. All authors have read and agreed to the published version of the manuscript.

Funding

Special item for basic scientific research business expenses of central public welfare scientific research institutes, grant number S202202; Innovation Engineering Project of the Chinese Academy of Agricultural Sciences; 2024.

Institutional Review Board Statement

Not applicable.

Data Availability Statement

The data presented in this study are available in the article.

Conflicts of Interest

The authors declare no conflicts of interest.

References

  1. Gong, J. Research on the Design and Optimization of the Cabbage Head Cutting Device. Master’s Thesis, Southwest University, Chongqing, China, 2019. [Google Scholar]
  2. Yu, G.; Zheng, H.; Xue, X.; Yang, H. Research Status and Prospect of Mustard Harvesting Equipment. J. Chin. Agric. Mach. Chem. 2021, 42, 17–20. [Google Scholar] [CrossRef]
  3. Ye, J. Design and Experimental Study of Mustard Harvesting Machine for Hilly Areas in Fuling District. Master’s Thesis, Zhejiang Agriculture and Forestry University, Hangzhou, China, 2023. [Google Scholar]
  4. Xiang, W.; Sun, Y.; Liu, F.; Li, M.; Xie, S.; Ke, C.; Huang, Y. Development of a Shrinking Stem Sliding Cutter for Cabbage Head. Trans. Chin. Soc. Agric. Eng. 2023, 39, 266–275. [Google Scholar]
  5. Wang, T.; Lou, T.; Fei, Y.; Liu, G.; Zhang, J. Key Technologies for Mechanized Harvesting of Mustard in Hilly Areas. J. Chin. Agric. Mach. Chem. 2023, 44, 11–16. [Google Scholar] [CrossRef]
  6. Wang, L.; Ye, J.; Yang, S.; Liu, L.; Chen, J. Design and Experiment of Pulling and Conveying Mechanism for Mustard Harvesting Machine. J. Agric. Mech. Res. 2018, 40, 138–141+246. [Google Scholar] [CrossRef]
  7. Xue, X.; Zheng, H.; Ye, Y.; Yu, G.; Wu, M.; Ren, N. Design and Experiment of Fixed Knife Sliding Cutter for Mustard Harvesting Machine. J. Chin. Agric. Mach. Chem. 2023, 44, 48–55. [Google Scholar] [CrossRef]
  8. Jin, Y.; Xiao, H.; Song, Z.; Jiang, Q.; Zhang, J.; Yang, G. Design and Experiment of Hand-Pushed Self-Propelled Cabbage Head Harvester. J. Chin. Agric. Mach. Chem. 2020, 41, 45–50. [Google Scholar] [CrossRef]
  9. Zheng, H.; Xue, X.; Yu, G. Cutting Mechanical Characteristics of Mustard Shortened Stems. Zhejiang Agric. Sci. 2021, 33, 1939–1945. [Google Scholar]
  10. Zeng, Z.; Ma, X.; Cao, X.; Li, Z.; Wang, X. Application Status and Prospect of Discrete Element Method in Agricultural Engineering. J. Agric. Mech. 2021, 52, 1–20. [Google Scholar]
  11. Li, N.; Liu, L.; Xu, P.; Li, J.; Jiang, H.; Wang, W. Simulation and Experiment of Soapberry Seed Separation Based on Discrete Element Method. J. Chin. Agric. Mach. Chem. 2023, 44, 163–169. [Google Scholar] [CrossRef]
  12. Luo, Q.; Huang, X.; Wu, J.; Mou, X.; Xu, Y.; Li, S.; Ma, G.; Wan, F.; Peng, L. Simulation Analysis and Parameter Optimization of Seed-Flesh Separation Process of Seed Melon Crushing and Seed Extraction Separator Based on DEM. Agriculture 2024, 14, 1008. [Google Scholar] [CrossRef]
  13. Zhang, J.; Jiang, X.; Yu, Y. Modeling Method of Corn Kernel Based on Discrete Element Method and Its Experimental Study. Agriculture 2024, 14, 2195. [Google Scholar] [CrossRef]
  14. Wang, X.; Tian, H.; Xiao, Z.; Zhao, K.; Li, D.; Wang, D. Numerical Simulation and Experimental Study of Corn Straw Grinding Process Based on Computational Fluid Dynamics–Discrete Element Method. Agriculture 2024, 14, 325. [Google Scholar] [CrossRef]
  15. Hosseinpour-Zarnaq, M.; Minaei, S.; Bazyar, P. Determination of the Mechanical Properties of Parsley Stems Related to the Design of Processing Machines. Chem. Proc. 2022, 10, 16. [Google Scholar] [CrossRef]
  16. Ma, Y.; Song, C.; Xuan, C.; Wang, H.; Yang, S.; Wu, P. Simulation Parameter Calibration of Alfalfa Straw Compression Using Discrete Element Method. Trans. Chin. Soc. Agric. Eng. 2020, 36, 22–30. [Google Scholar]
  17. Hu, Y.; Xiang, W.; Duan, Y.; Yan, B.; Ma, L.; Liu, J.; Lyu, J. Calibration of Ramie Stalk Contact Parameters Based on the Discrete Element Method. Agriculture 2023, 13, 1070. [Google Scholar] [CrossRef]
  18. Zhao, Y.; Tang, Z.; Chen, S. Loading Model and Mechanical Properties of Mature Broccoli (Brassica oleracea L. Var. Italica Plenck) Stems at Harvest. Agriculture 2022, 12, 1519. [Google Scholar] [CrossRef]
  19. Zhang, Z.; Xu, H.; Xue, H.; Ni, C.; Wang, C. Discrete Element Parameter Calibration and Testing of Ginseng Stems. J. Agric. Mech. 2023, 54, 61–70+91. [Google Scholar]
  20. Zhang, G.; Chen, L.; Liu, H.; Dong, Z.; Zhang, Q.; Zhou, Y. Discrete Element Simulation Parameter Calibration and Testing for Water Chestnut. Trans. Chin. Soc. Agric. Eng. 2022, 38, 41–50. [Google Scholar]
  21. Xie, W.; Peng, L.; Jiang, P.; Meng, D.; Wang, X. Establishment and Optimization of Dual-Layer Bonding Discrete Element Model for Oilseed Rape Stem at Harvest. J. Agric. Mech. 2023, 54, 112–120. [Google Scholar]
  22. Zhang, X.; Hu, X.; Liu, J.; Yang, Y.; Li, Y. Discrete Element Simulation Bonding Model Parameter Calibration and Testing of Banana Stems. J. Agric. Mech. 2023, 54, 121–130. [Google Scholar]
  23. GB/T 5262-2008; Measuring Methods for Agricultural Machinery Testing Conditions—General Rules. Standardization Administration of China: Beijing, China, 2008.
  24. Fan, J.; Li, Y.; Wang, B.; Gu, F.; Wu, F.; Yang, H.; Yu, Z.; Hu, Z. An Experimental Study of Axial Poisson’s Ratio and Axial Young’s Modulus Determination of Potato Stems Using Image Processing. Agriculture 2022, 12, 1026. [Google Scholar] [CrossRef]
  25. Zhang, F.; Song, X.; Zhang, X.; Zhang, F.; Wei, W.; Dai, F. Mechanical Characteristics and Simulation of Corn Straw Crushing Process. Trans. Chin. Soc. Agric. Eng. 2019, 35, 58–65. [Google Scholar]
  26. Hu, S. Design and Experimental Study of Water Celery Stalk Cutting Test Platform. Master’s Thesis, Yangzhou University, Yangzhou, China, 2024. [Google Scholar]
  27. Zhang, H. Design and Experiment of Small-Row Mustard Planting Device Based on Mechanical-Crop-Soil Coupling Model. Master’s Thesis, Shandong Agricultural University, Tai’an, China, 2024. [Google Scholar]
  28. Zhang, T.; Li, Y.; Song, S.; Pang, Y.; Shao, W.; Tang, X. Design and Experiment of Cabbage Head Harvester Based on Flexible Clamping. J. Agric. Mech. 2020, 51, 162–169+190. [Google Scholar]
  29. Liao, Y.; Liao, Q.; Tian, B.; Shu, C.; Wang, J.; Ma, A. Experimental Study on Mechanical Properties of Reeds at the Bottom of the Stem During Harvest. Trans. Chin. Soc. Agric. Eng. 2007, 124–129. [Google Scholar]
  30. Chen, K.; Yin, X.; Ma, W.; Jin, C.; Liao, Y. Contact Parameter Calibration for Discrete Element Potato Minituber Seed Simulation. Agriculture 2024, 14, 2298. [Google Scholar] [CrossRef]
  31. Luo, W.; Chen, X.; Qin, M.; Guo, K.; Ling, J.; Gu, F.; Hu, Z. Design and Experiment of Uniform Seed Device for Wide-Width Seeder of Wheat after Rice Stubble. Agriculture 2023, 13, 2173. [Google Scholar] [CrossRef]
  32. Xu, Y.; Zhang, X.; Wu, S.; Chen, C.; Wang, J.; Yuan, S.; Chen, B.; Li, P.; Xu, R. Numerical simulation of particle motion at cucumber straw grinding process based on EDEM. Int. J. Agric. Biol. Eng. 2020, 13, 227–235. [Google Scholar]
  33. Shi, Y.; Xin, S.; Wang, X.; Hu, Z.; Newman, D.; Ding, W. Numerical simulation and field tests of minimum-tillage planter with straw smashing and strip laying based on EDEM software. Comput. Electron. Agric. 2019, 166, 105021. [Google Scholar]
Figure 1. Agronomic parameters of tuber mustard cultivation.
Agriculture 15 00773 g001
Figure 2. Uniaxial compression test.
Agriculture 15 00773 g002
Figure 3. Measurement of stacking angle.
Agriculture 15 00773 g003
Figure 4. Discrete element simulation test of stacking angle.
Agriculture 15 00773 g004
Figure 5. Bonding model.
Agriculture 15 00773 g005
Figure 6. The simulation model of shear tests: (a) Particle filling model. (b) Shear simulation test model.
Agriculture 15 00773 g006
Figure 7. Diagram of deformation and load.
Agriculture 15 00773 g007
Figure 8. Effect of interaction on maximum shear force.
Agriculture 15 00773 g008
Figure 9. Shear test of leaf stems: (a) Discrete element simulation shear test. (b) Physical shear test.
Agriculture 15 00773 g009
Figure 10. Curves of shear force and time.
Agriculture 15 00773 g010
Table 1. Measurement of basic physical parameters.
ParametersMaximumMinimumAverage ValueStandard Deviation
Plant height (mm)61753556531.19
Density (g/cm3)0.980.870.9290.03
Moisture content (%)81.8377.9179.721.19
Table 2. Proportion of cross-sectional shape of leaf stems with different specifications.
TypeShapeDiscrete Element ModelProportion
aAgriculture 15 00773 i001Agriculture 15 00773 i0020.12
bAgriculture 15 00773 i003Agriculture 15 00773 i0040.53
cAgriculture 15 00773 i005Agriculture 15 00773 i0060.27
dAgriculture 15 00773 i007Agriculture 15 00773 i0080.08
Table 3. Parameter settings for leaf stem contact of tuber mustard in EDEM.
Discrete Element ParameterValueRemarks
Poisson’s ratio, μ 0.41Measured value
Shear modulus, G /Mpa1.6Measured value
Density, ρ 0.929Measured value
Coefficient of restitution between leaf stems, A0.2–0.7Reference range of variables
Coefficient of static friction between leaf stems, B0.3–0.8Reference range of variables
Coefficient of rolling friction between leaf stems, C0.05–0.3Reference range of variables
Coefficient of restitution between leaf stems and steel, D0.2–0.7Reference range of variables
Coefficient of static friction between leaf stems and steel, E0.3–0.8Reference range of variables
Coefficient of rolling friction between leaf stems and steel, F0.05–0.3Reference range of variables
Table 4. Two-level factorial experimental design and results.
No.ABCDEFStacking Angle
10.70.30.30.20.80.0536.36
20.20.30.30.70.30.0533.29
30.70.30.050.20.30.325.57
40.20.30.050.70.80.329.32
50.20.30.30.70.30.0533.09
60.20.80.050.20.80.0536.26
70.70.80.050.70.30.0527.37
80.70.80.30.70.80.345.56
90.70.30.30.20.80.0533.67
100.70.80.050.70.30.0525.58
110.20.80.050.20.80.0530.26
120.70.30.050.20.30.326.33
130.70.80.30.70.80.342.52
140.20.30.050.70.80.329.54
150.20.80.30.20.30.342.52
160.20.80.30.20.30.341.93
Table 5. Significance analysis of parameters.
ParameterEffectMean Square SumContributionSignificance Ranking
A−1.0110.971.665
B7.18125.6118.992
C12.60387.2058.541
D−1.062.750.426
E4.4548.347.313
F4.3946.967.104
Table 6. Results of steepest climbing test.
No.BCStacking Angle (°)Relative Error (%)
10.30.0528.3114.11
20.40.130.278.16
30.50.1533.170.6
40.60.235.628.07
50.70.2538.3116.23
60.80.340.9624.3
Table 7. Codes of central composite test.
CodeCoefficient of Static Friction (B)Coefficient of Rolling Friction (C)
−1.4140.360.08
−10.40.1
00.50.15
10.60.2
1.4140.640.22
Table 8. Program and results of central composite test.
No.Coefficient of Static Friction BRolling Friction Factor CStacking Angle (°)Relative Error (%)
10.60.134.253.91
20.640.1535.628.07
30.40.232.351.85
40.50.1532.760.61
50.50.1533.270.94
60.40.131.793.55
70.50.0831.963.03
80.60.234.765.46
90.50.1533.451.49
100.50.2233.622
110.360.1532.262.12
120.50.1533.270.94
130.50.1532.890.21
Table 9. Analysis of variance for the central composite test.
SourceSum of SquaresDegrees of FreedomMean SquareFp
Model14.4852.9036.59<0.0001 **
B11.57111.57146.25<0.0001 **
C1.4611.4618.450.0036 **
BC0.000610.00060.00790.9317
B21.0411.0413.140.0085 **
C20.246910.24693.120.1207 *
Residual0.528970.0756
Lack of fit0.362430.12082.900.1650
Pure error0.166540.0416
Cor total15.0612
Note: p < 0.01 (highly significant, **); 0.01 < p < 0.05 (significant, *).
Table 10. Box–Behnken experimental design and results.
No.Normal Stiffness KnTangential Stiffness KτNormal Critical Stress σnTangential Critical Stress στMaximum Shear Force Ft
155,000 (0)100,000 (1)1.2 (1)0.5 (0)78.3
255,000 (0)10,000 (−1)0.4 (−1)0.5 (0)63.6
310,000 (−1)55,000 (0)0.4 (−1)0.5 (0)67.3
455,000 (0)55,000 (0)0.8 (0)0.5 (0)69.8
555,000 (0)55,000 (0)0.4 (−1)0.9 (1)77.2
610,000 (−1)10,000 (−1)0.8 (0)0.5 (0)66.6
710,000 (−1)55,000 (0)0.8 (0)0.1 (−1)68.2
855,000 (0)100,000 (1)0.8 (0)0.1 (−1)79.9
955,000 (0)55,000 (0)0.8 (0)0.5 (0)68.2
10100,000 (1)55,000 (0)0.4 (−1)0.5 (0)68.3
1155,000 (0)100,000 (1)0.4 (−1)0.5 (0)78.5
1210,000 (−1)55,000 (0)0.8 (0)0.9 (1)78.7
1355,000 (0)55,000 (0)1.2 (1)0.1 (−1)67.9
14100,000 (1)55,000 (0)0.8 (0)0.9 (1)78.9
1555,000 (0)10,000 (−1)0.8 (0)0.9 (1)75.6
16100,000 (1)55,000 (0)0.8 (0)0.1 (−1)67.1
1755,000 (0)10,000 (−1)1.2 (1)0.5 (0)68.2
1855,000 (0)100,000 (1)0.8 (0)0.9 (1)85.2
1955,000 (0)55,000 (0)1.2 (1)0.9 (1)82.1
2055,000 (0)55,000 (0)0.8 (0)0.5 (0)69.6
2110,000 (−1)55,000 (0)1.2 (1)0.5 (0)69.5
22100,000 (1)10,000 (−1)0.8 (0)0.5 (0)61.1
2355,000 (0)55,000 (0)0.8 (0)0.5 (0)69.1
2455,000 (0)55,000 (0)0.8 (0)0.5 (0)68.2
2510,000 (−1)100,000 (1)0.8 (0)0.5 (0)74.9
2655,000 (0)55,000 (0)0.4 (−1)0.1 (−1)68.3
27100,000 (1)100,000 (1)0.8 (0)0.5 (0)81.1
2855,000 (0)10,000 (−1)0.8 (0)0.1 (−1)62.3
29100,000 (1)55,000 (0)1.2 (1)0.5 (0)70.6
Table 11. ANOVA.
Table 11. ANOVA.
SourceSum of SquaresDegrees of FreedomMean SquareFp
Model1123.471480.25135.9<0.0001 **
K n 0.300810.30080.50940.4871
K τ 540.021540.02914.5<0.0001 **
σ n 14.96114.9625.340.0002 **
σ τ 341.331341.33578.03<0.0001 **
K n K τ 34.22134.2257.95<0.0001 **
K n σ n 0.002510.00250.00420.949
K n σ τ 0.422510.42250.71550.4119
K τ σ n 5.7615.769.750.0075 **
K τ σ τ 1611627.10.0001 **
σ n σ τ 7.0217.0211.890.0039 **
K n 21.1911.192.010.1784
K τ 238.86138.8665.8<0.0001 **
σ n 21.6911.692.860.1131
σ τ 2129.031129.03218.5<0.0001 **
Residual8.27140.5905
Lack of fit5.98100.59791.050.5283
Error2.2940.572
Total1131.7428
Note: p < 0.01 (highly significant, **).
Disclaimer/Publisher’s Note: The statements, opinions and data contained in all publications are solely those of the individual author(s) and contributor(s) and not of MDPI and/or the editor(s). MDPI and/or the editor(s) disclaim responsibility for any injury to people or property resulting from any ideas, methods, instructions or products referred to in the content.

