Article

Research on an Apple Recognition and Yield Estimation Model Based on the Fusion of Improved YOLOv11 and DeepSORT

1
Key Laboratory of Tarim Oasis Agriculture, Ministry of Education, College of Information Engineering, Tarim University, Alar 843300, China
2
National-Local Joint Engineering Laboratory of High Efficiency and Superior-Quality Cultivation and Fruit Deep Processing Technology on Characteristic Fruit Trees, Alar 843300, China
3
Modern Agricultural Engineering Key Laboratory, Universities of Education Department of Xinjiang Uygur Autonomous Region, Alar 843300, China
4
College of Information and Electrical Engineering, China Agricultural University (CAU), Beijing 100107, China
*
Author to whom correspondence should be addressed.
Agriculture 2025, 15(7), 765; https://doi.org/10.3390/agriculture15070765
Submission received: 5 March 2025 / Revised: 30 March 2025 / Accepted: 31 March 2025 / Published: 2 April 2025
(This article belongs to the Section Digital Agriculture)

Abstract

Accurate apple yield estimation is essential for effective orchard management, market planning, and ensuring growers’ income. However, complex orchard conditions, such as dense foliage occlusion and overlapping fruits, present challenges to large-scale yield estimation. This study introduces APYOLO, an enhanced apple detection algorithm based on an improved YOLOv11, integrated with the DeepSORT tracking algorithm to improve both detection accuracy and operational speed. APYOLO incorporates a multi-scale channel attention (MSCA) mechanism and an enhanced multi-scale prior distribution intersection over union (EnMPDIoU) loss function to enhance target localization and recognition under complex environments. Experimental results demonstrate that APYOLO outperforms the original YOLOv11 by improving mAP@0.5, mAP@0.5–0.95, accuracy, and recall by 2.2%, 2.1%, 0.8%, and 2.3%, respectively. Additionally, the combination of a unique ID with the region of line (ROL) strategy in DeepSORT further boosts yield estimation accuracy to 84.45%, surpassing the performance of the unique ID method alone. This study provides a more precise and efficient system for apple yield estimation, offering strong technical support for intelligent and refined orchard management.

1. Introduction

Apples are among the most important and widely cultivated fruit crops worldwide, playing a key role in global agriculture and economies [1]. Accurate yield estimation is crucial for improving orchard management, stabilizing market supply and demand, and ensuring the economic well-being of growers. However, traditional yield estimation methods rely mainly on field surveys and visual inspections, which have three main limitations: (1) they are labor-intensive and time-consuming; (2) they vary depending on the observer; and (3) they are not scalable to meet the needs of modern precision agriculture. These limitations highlight the need for new technologies to develop automated, data-driven yield estimation systems.
With the rapid growth of computational capabilities in agriculture, apple yield estimation has seen significant improvements, especially with the integration of computer vision and machine learning. These technologies have greatly enhanced crop analysis and yield predictions. Image recognition, in particular, plays a key role in this shift, showing great promise. Recent research has focused on detecting apples at different scales using deep learning models, with several key advancements: (1) architecture optimization: Tian et al. enhanced YOLOv3’s ability to detect small apples by adding DenseNet-based feature networks, achieving 89.7% accuracy across different growth stages. However, this improvement was limited by an insufficient loss function optimization, leading to unstable predictions when apples overlapped [2]. (2) Model compression: Wang et al. reduced the size of YOLOv5s by 43% while maintaining high accuracy for detecting young apples. However, this approach is most effective for small apples and struggles with apples of different sizes [3]. (3) Loss function innovation: Chen et al. developed a new version of the AP-Loss function that addresses class imbalance, improving accuracy by 6.8%. However, it still faces challenges with occlusions and complex backgrounds [4].
In addition, multi-object tracking (MOT) systems have become essential in modern yield estimation. Juan et al. showed that DeepSORT performs well in handling occlusions, achieving 82.4% tracking accuracy in dense orchards [5]. Gao et al. further improved tracking by incorporating tree structure information, boosting throughput by 23% [6].
Despite these advancements, occlusions and overlapping apples remain major challenges in apple detection. In dense orchards, apples can be hidden by leaves, branches, or other fruits, making them difficult to detect. Overlapping fruits also create additional complications, especially in closely planted orchards. These issues often lead to underestimations of yield, as missed or misidentified apples result in fewer apples being counted by the system.
To address these challenges, this study introduces an enhanced apple recognition and yield estimation model that combines an improved YOLOv11 with the DeepSORT tracking algorithm. The model features a new multi-scale channel attention (MSCA) mechanism that improves the detection of small apples by enhancing the model’s ability to capture features at different scales. This makes it more adaptable to varying orchard conditions. We also introduce the EnMPDIoU loss function, which helps more accurately locate apples, even when they are partially obscured or vary in shape, reducing the impact of size differences on detection accuracy. This improvement allows the model to perform better in complex environments, handling apples at different distances and angles with greater precision. Additionally, the integration of a line-crossing detection mechanism into DeepSORT resolves issues of redundant calculations, improving tracking accuracy and stability. This research aims to create a more efficient and accurate apple detection system, providing valuable support for modern orchard management and advancing intelligent agricultural practices.

2. Materials and Methods

2.1. Data Sources and Pre-Processing
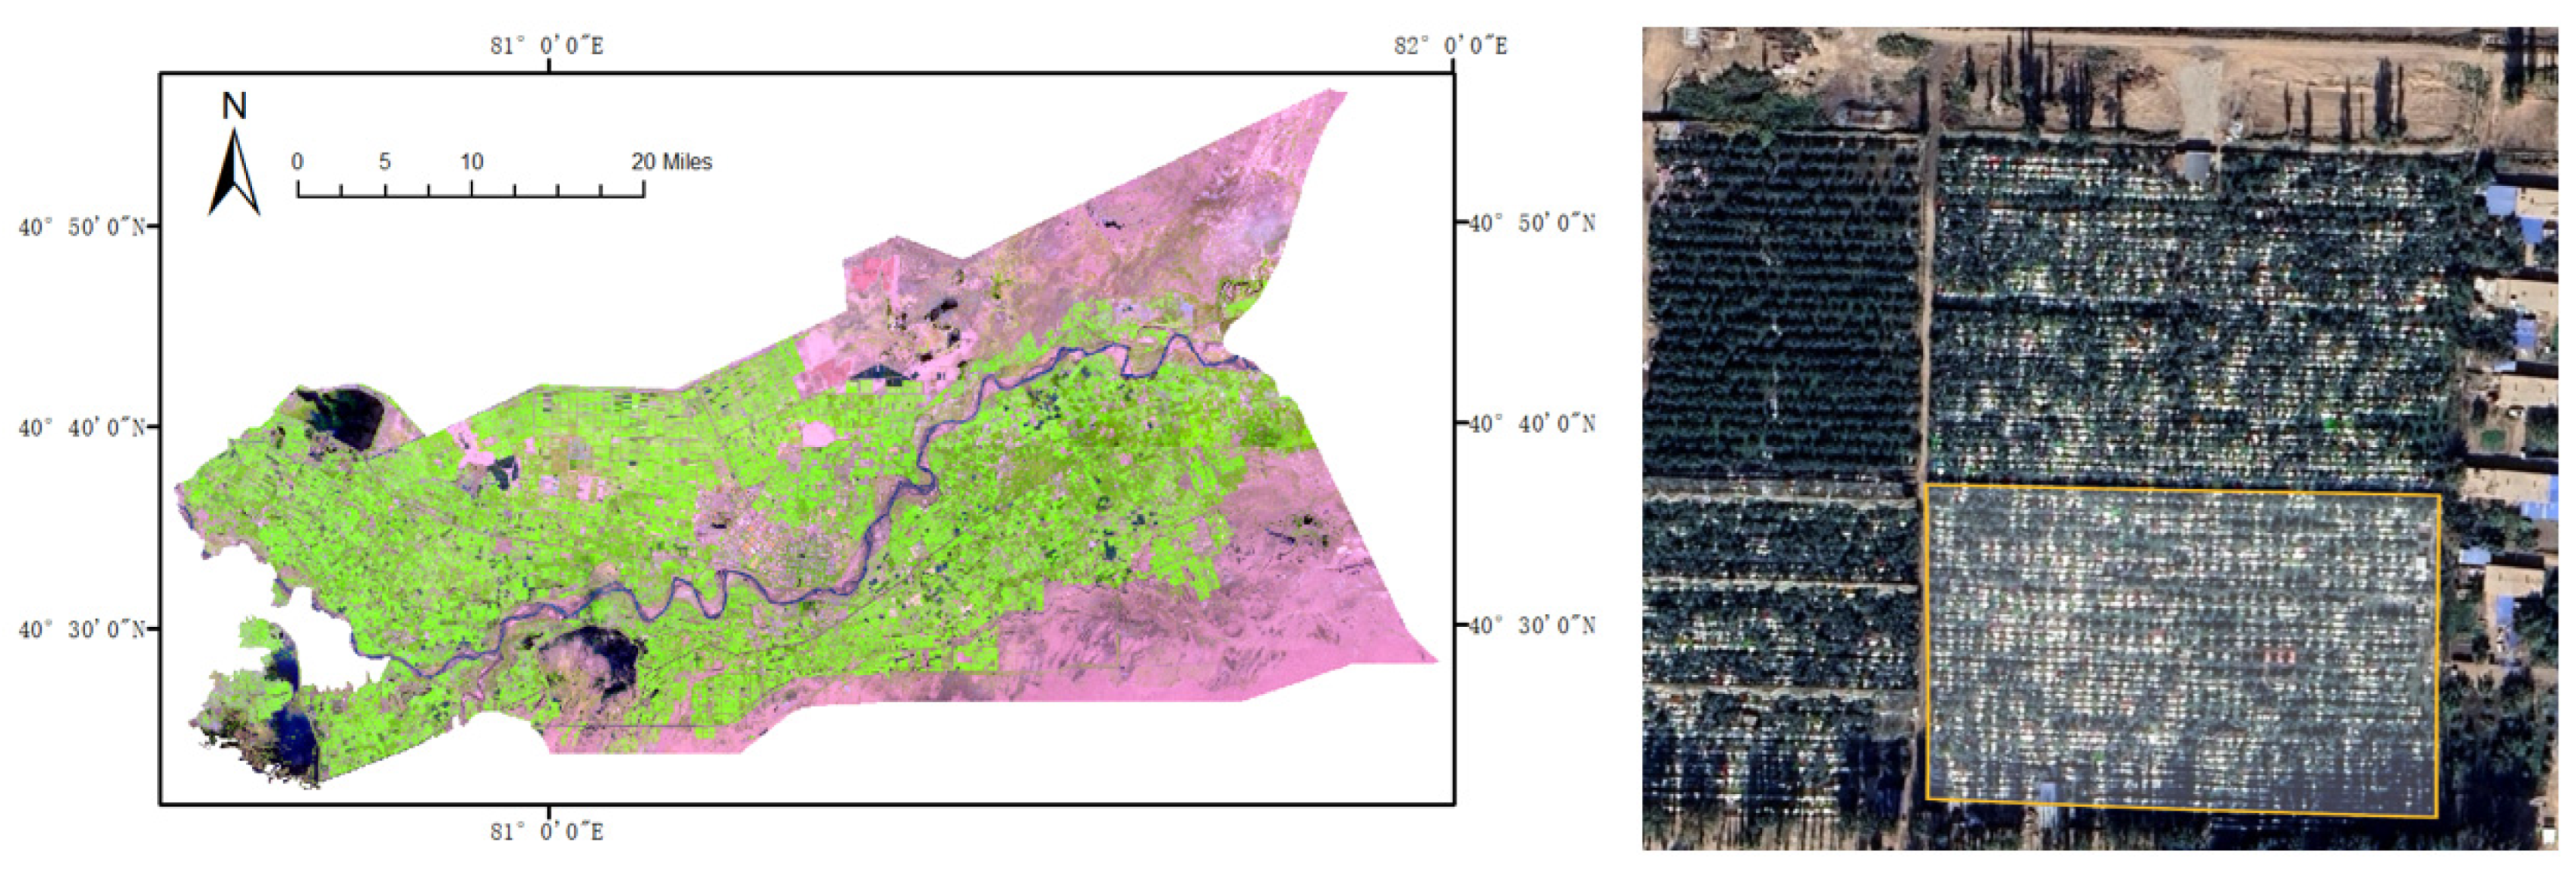
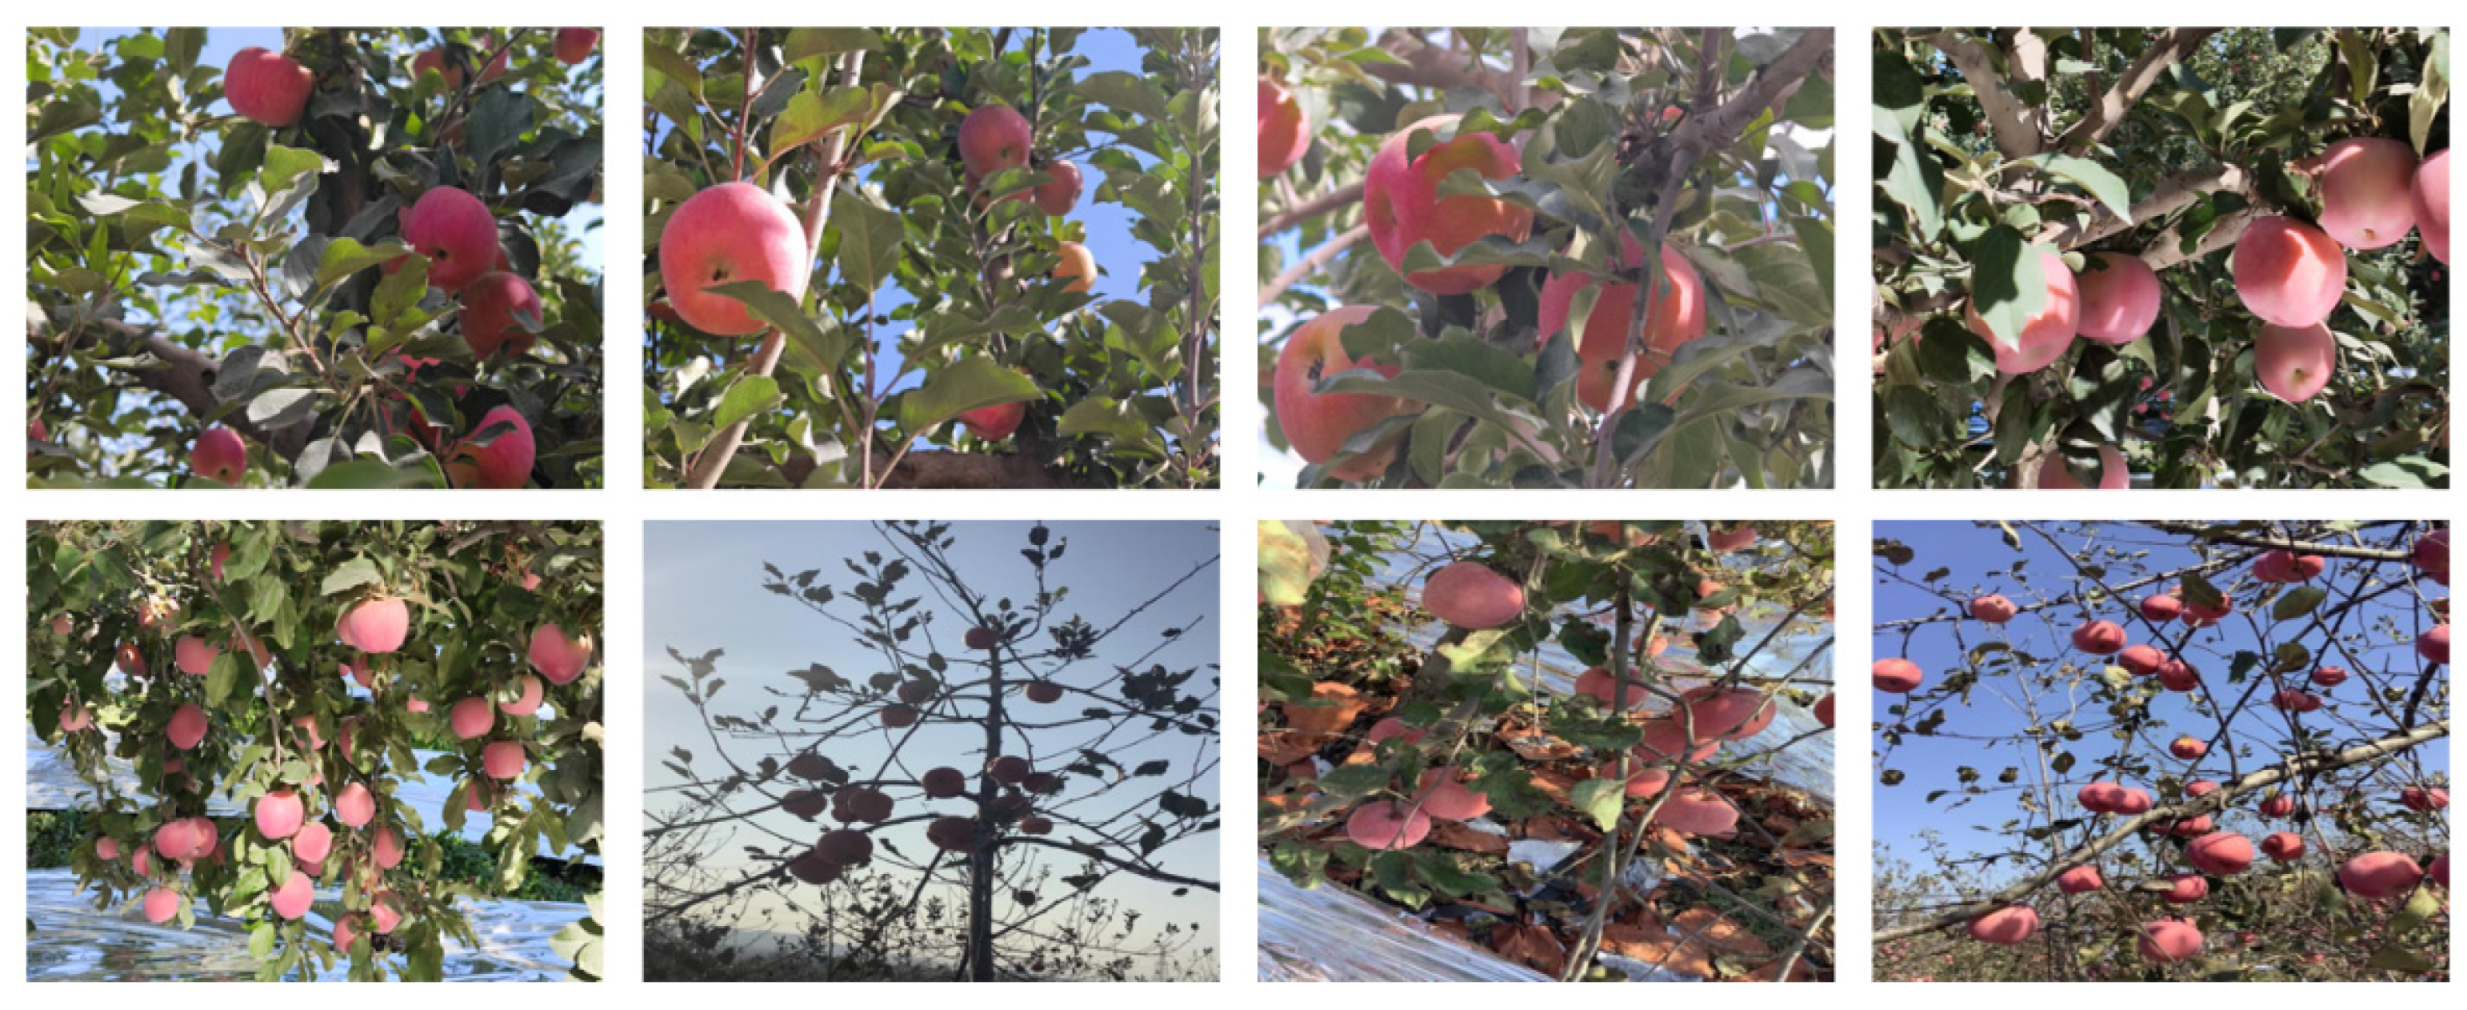
2.1.1. Data Sources

In this study, a total of 3780 apple images and 10 video files of fruit trees were collected from an orchard located in Alar, Xinjiang (41°20′58.0″ N, 80°48′01.2″ E). The orchard spans an area of 12,871.17 square meters and contains approximately 2000 apple trees, including both standard and dwarf varieties (Figure 1).
The images were captured between 1 October 2024 and 7 October 2024, with temperatures ranging from 10 °C to 25 °C, using an iPhone 13 smartphone with a resolution of 1279 × 1706 pixels. Various factors, including shooting angles, lighting conditions, and shooting distances, were considered during the image capture process to ensure the diversity of the data for apple recognition. Specifically, images were taken on both sunny and cloudy days to account for the impact of different lighting conditions. The apple images primarily feature fruits nearing the harvest stage, with a focus on non-bagged apples. Due to limited resources, 10 randomly selected fruit trees were manually counted, from which 200 apples were harvested, weighed, and recorded. The average mass of apples from these 10 trees, as well as the overall average mass of apples in the orchard, was estimated to be approximately 0.254 kg. Figure 2 presents images of apples taken from different shooting angles and illustrates the distribution of images under various lighting conditions and growth stages (Table 1 and Figure 3).

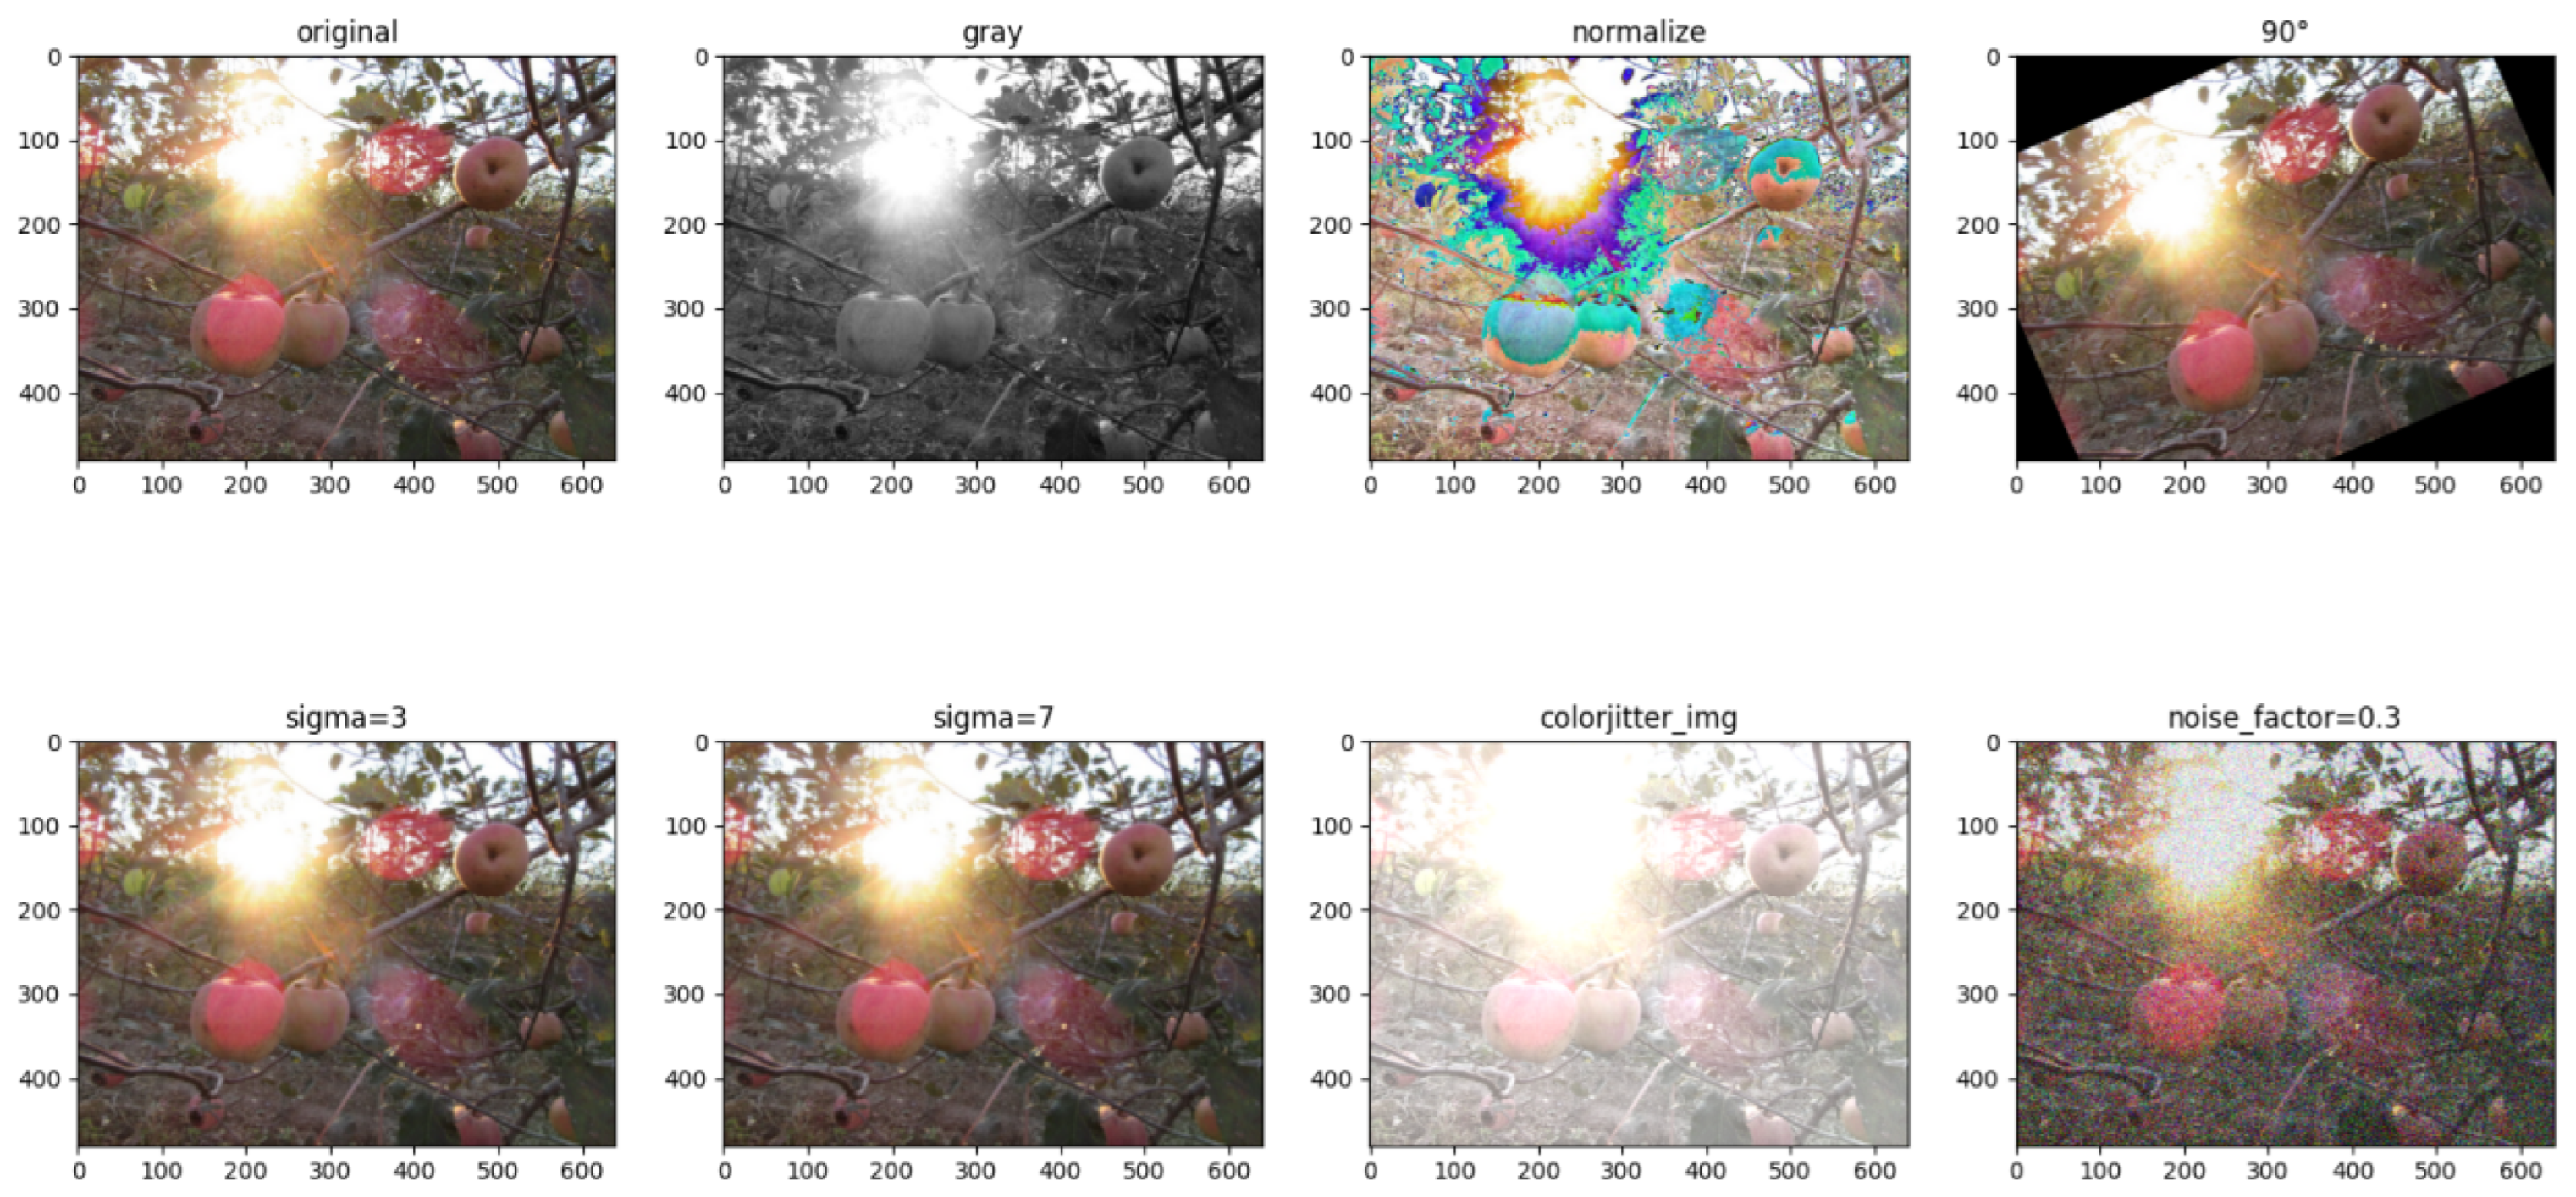
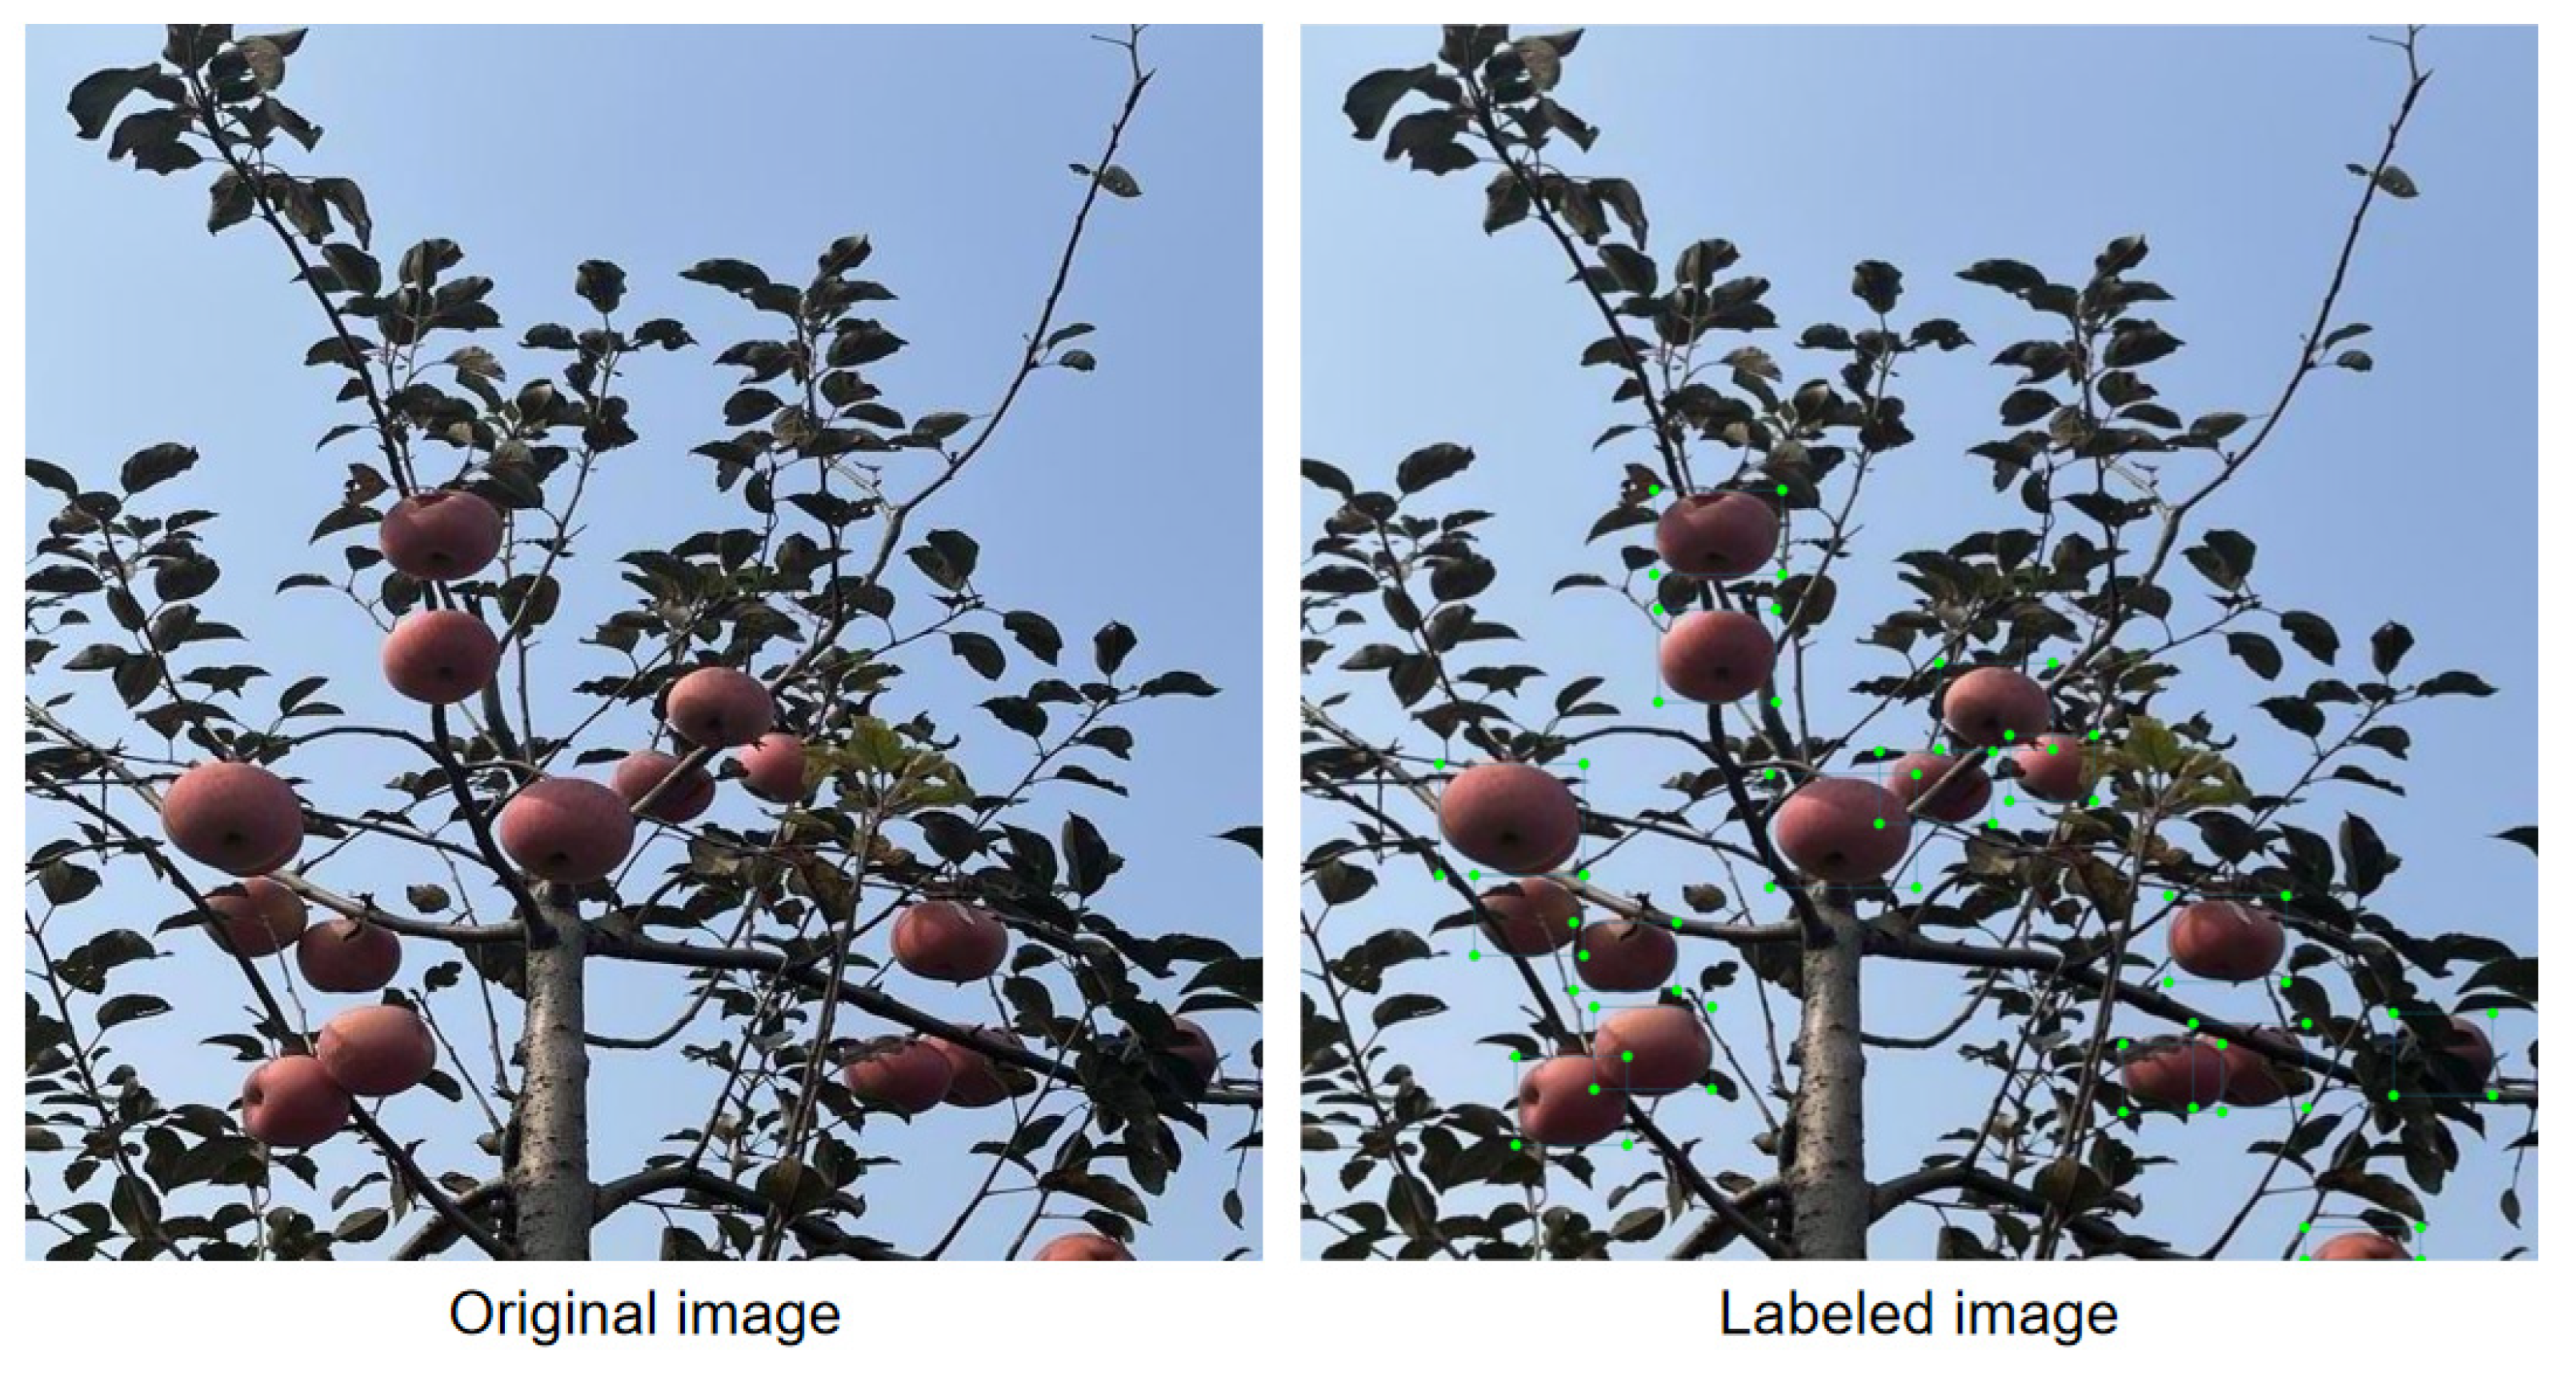
2.1.2. Data Pre-Processing

Initially, basic pre-processing was performed on the image dataset, including the removal of highly similar images to refine the dataset. To enhance the accuracy and robustness of the model, a series of image augmentation techniques was applied to increase the diversity of the apple dataset. These techniques included grayscale transformation, normalization, rotation, brightness adjustment, the addition of Gaussian noise, and Gaussian blurring. These manipulations were intended to simulate various shooting conditions encountered with mobile phones, thereby improving the model’s ability to recognize apples in complex environments (Figure 4).
After the elimination and augmentation processes, the total number of images remained the same as the original count. The dataset was then randomly split into three subsets: a training set, a validation set, and a test set, with a distribution ratio of 8:1:1. Consequently, the training set contained 3024 images, while the validation and test sets each contained 378 images. Label files in TXT format were generated using LabelImg (Version 1.8.6) software, which was used to annotate the categories of detection targets along with their respective positional information (Figure 5).

2.2. Experimental Environment and Parameter Configuration

In this study, the experiments were performed using an NVIDIA GeForce RTX 3090 GPU (Austin, TX, USA), which provided high computational power for deep learning tasks. The operating system used for the experiments was Windows 10 (Version 21H2). The model was developed using the PyTorch deep learning framework, with PyTorch version 1.12.1 and CUDA version 11.2 employed to ensure optimal performance. A custom dataset, specifically curated for this research, was used to train the model. The detailed experimental parameters are summarized in Table 2.
In this study, key hyperparameters were selected through extensive experimentation to optimize both performance and generalization. An initial learning rate of 0.01 was used for the SGD optimizer, providing a balanced trade-off between convergence speed and stability. Learning rate decay was applied to adjust the learning rate dynamically during training, based on validation set performance. A batch size of 32 was chosen to balance training speed and memory usage, while still enabling effective generalization. To promote a simpler and more generalizable solution, a weight decay factor of 0.0005 was applied to penalize large weights, helping to avoid overfitting, particularly when dealing with noisy or complex data. Early stopping was also implemented to monitor the model’s performance on the validation set. If the validation loss did not improve for 30 consecutive epochs, training was halted to prevent unnecessary computations, reducing training time.

2.3. Evaluation Index
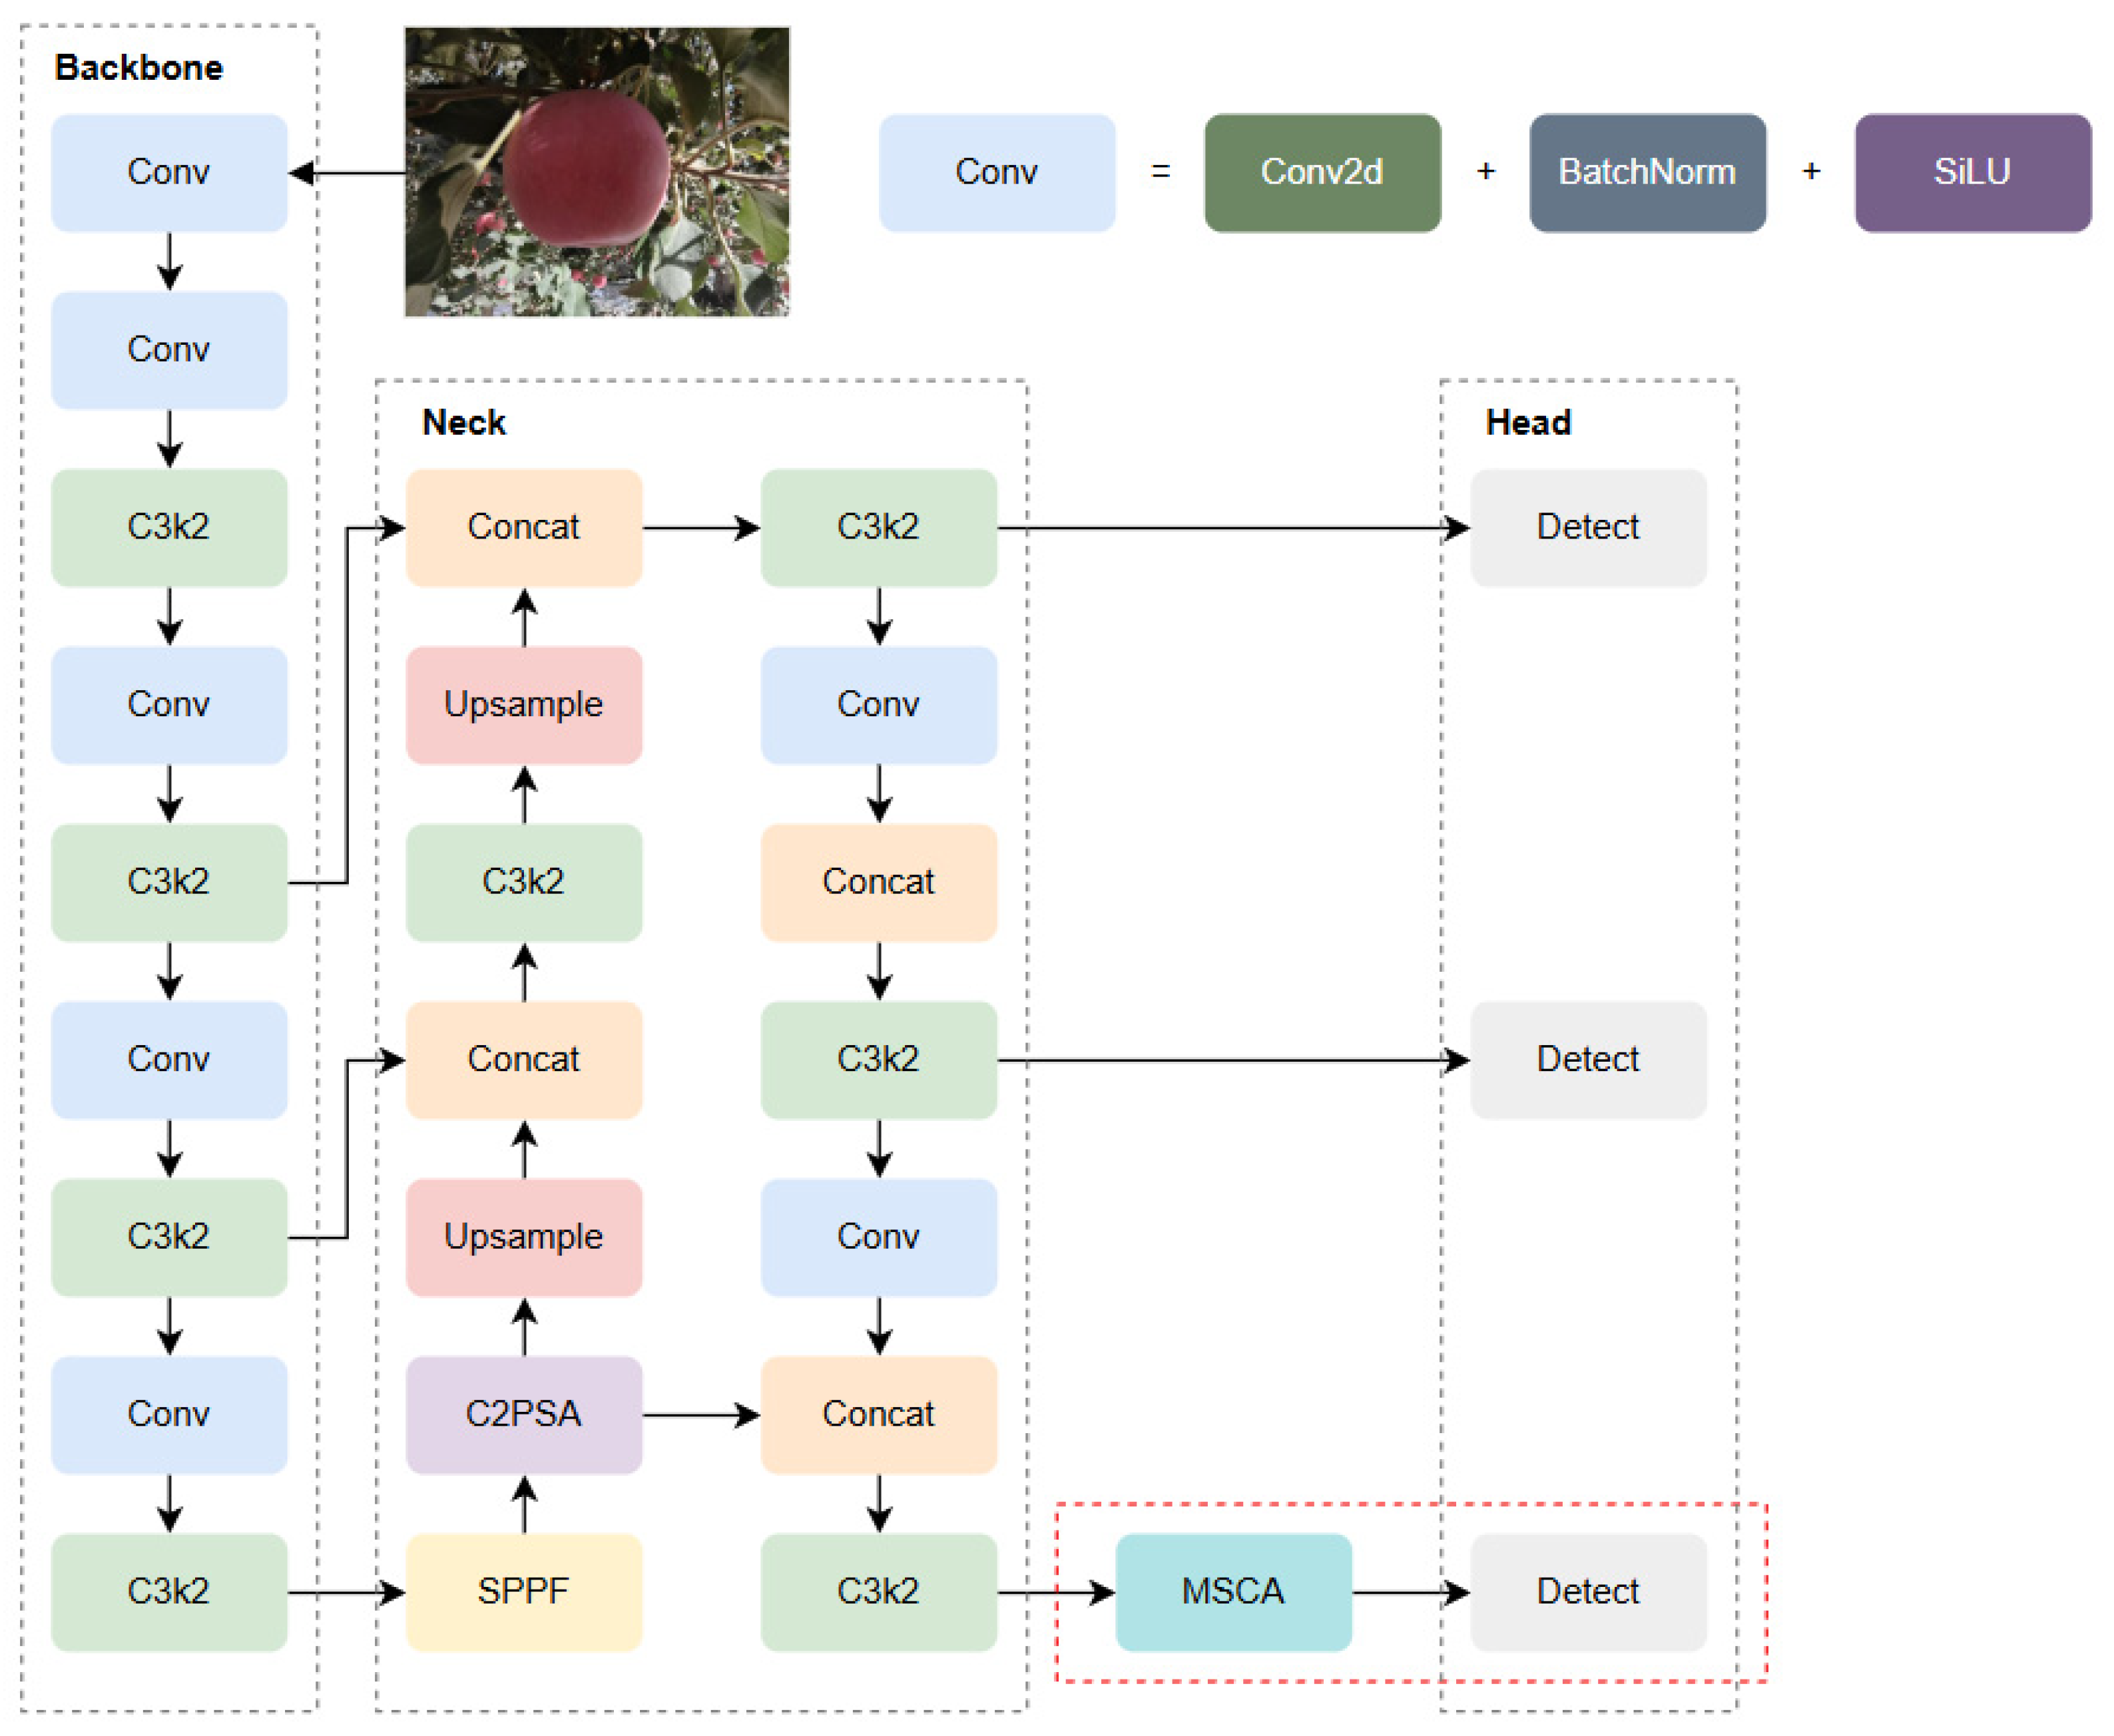
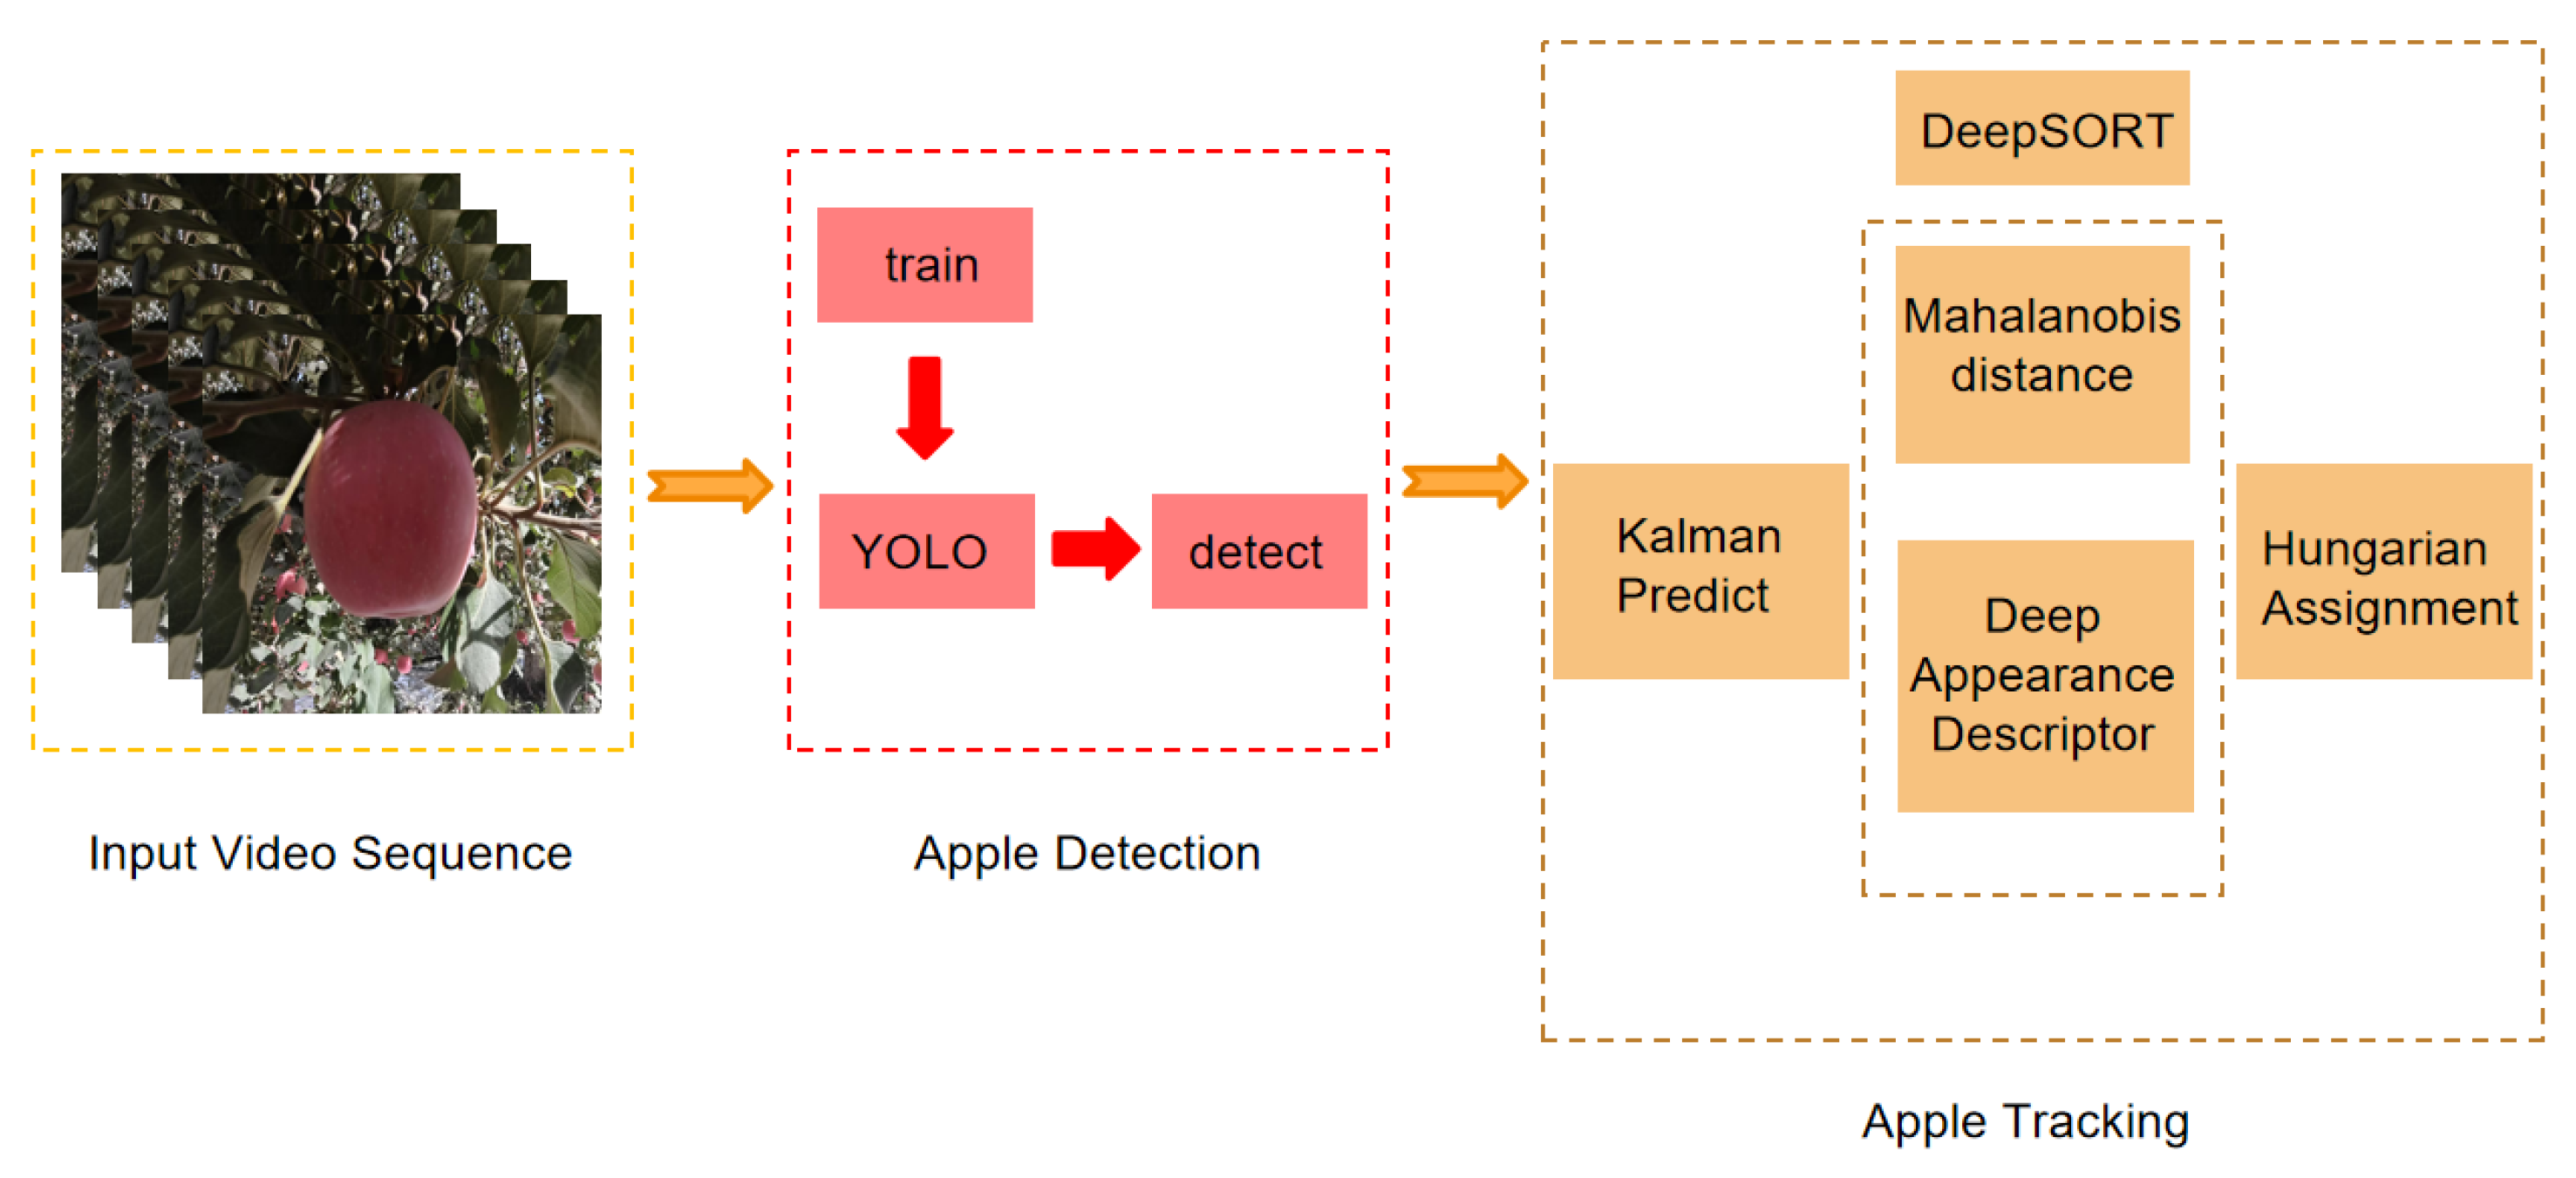
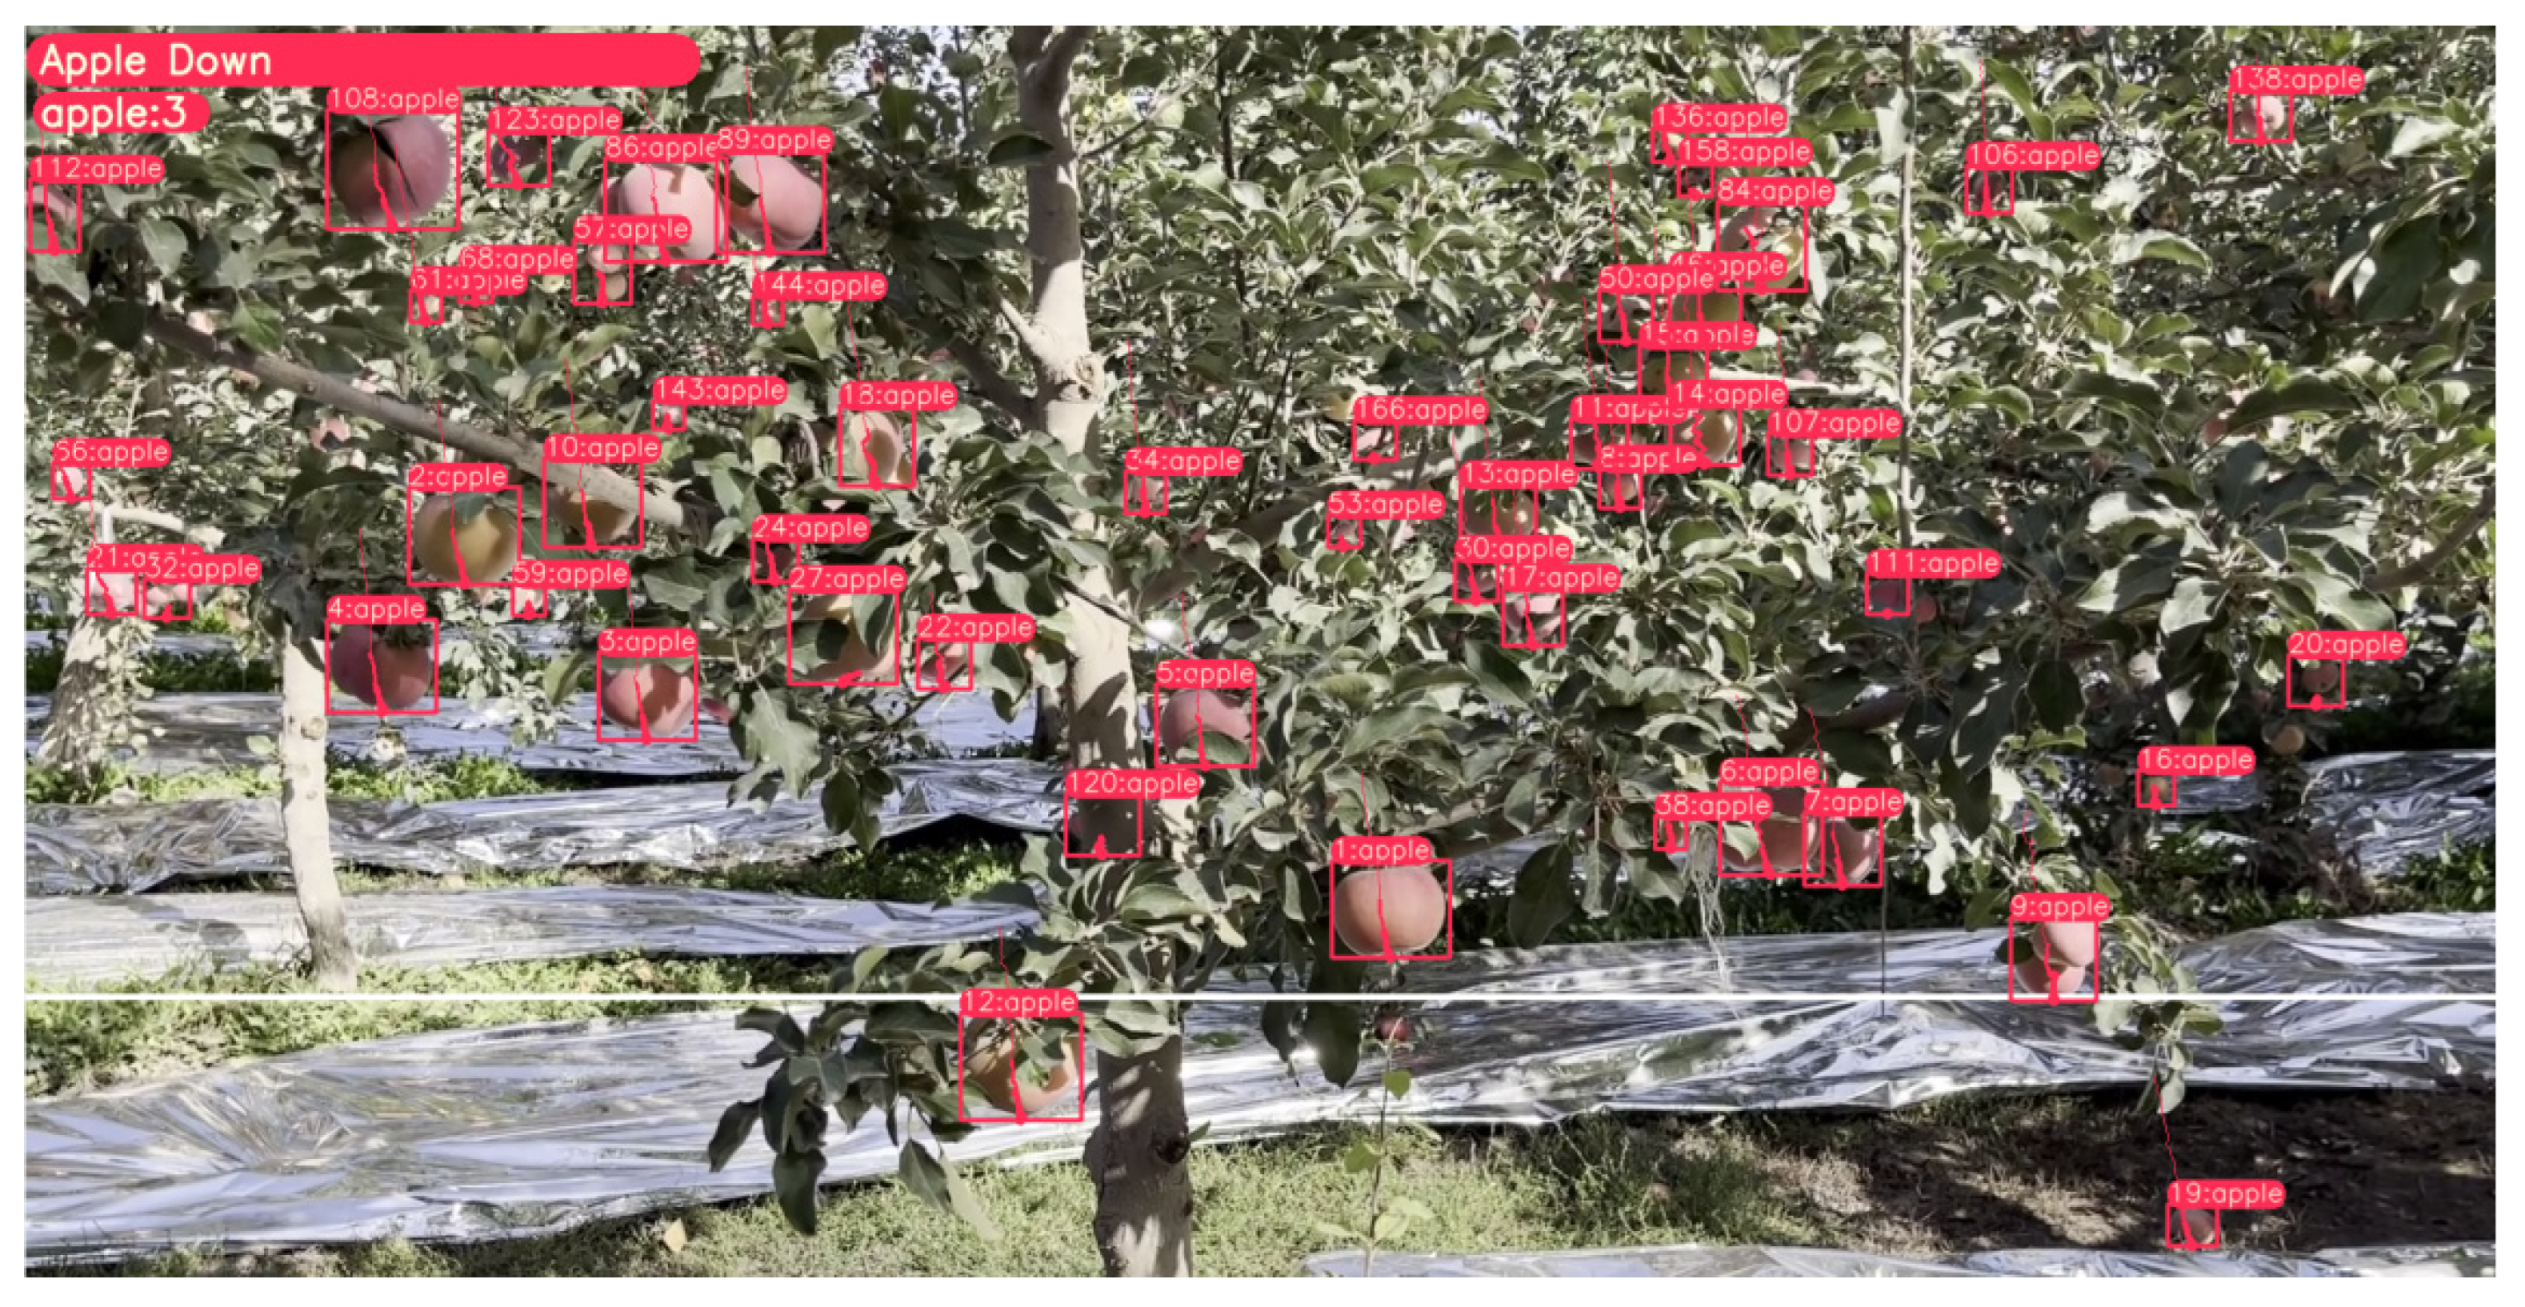
To evaluate the performance of the target detection model, it is essential to select appropriate metrics. The confusion matrix, a widely used tool in classification tasks, provides a comprehensive method for performance assessment. It compares the actual class labels (true values) with the predicted labels from the model, offering a detailed statistical summary of the classification results. The confusion matrix consists of four key components, true positive (TP), true negative (TN), false positive (FP), and false negative (FN), each of which highlights specific aspects of the model’s prediction accuracy. Based on the confusion matrix, several common evaluation metrics can be derived, including the following six types.
Precision (P) and recall (R) are fundamental for evaluating the accuracy and completeness of apple detection. Precision indicates the proportion of detected apples that are true positives, while recall reflects the proportion of actual apples in the field that are detected. High precision ensures that detected apples are accurately classified, minimizing false positives, which directly enhances the reliability of yield estimation. High recall ensures that most apples are detected, even if some false positives are included, leading to more comprehensive yield estimates.
Mean average precision (mAP), particularly at IoU thresholds such as mAP@0.5, provides an overall measure of the model’s ability to correctly localize and classify apples. A higher mAP indicates better performance in detecting apples across various scenarios and IoU levels, directly improving yield estimation accuracy. mAP@0.5–0.95 further assesses the model’s robustness across varying overlap levels, which is crucial for accurate yield estimation in complex orchard environments.
These metrics are essential for ensuring both the quantity and localization of apples are accurately captured, directly influencing the accuracy of yield estimation. Improvements in these metrics reflect the model’s enhanced ability to detect apples more accurately, leading to more precise yield predictions.
A c c u r a c y = ( T P + T N ) ( T P + F N + F P + T N )
R e c a l l = T P ( T P + F N )
F 1 = 2 × ( P r e c i s i o n × R e c a l l ) ( P r e c i s i o n + R e c a l l )
P r e c i s i o n = T P ( T P + F P )
A P = 0 1 P r e c i s i o n ( R e c a l l ) d ( R e c a l l )
m A P = 1 N i = 1 N A P i

2.4. APYOLO Model

The YOLO (You Only Look Once) framework has revolutionized real-time object detection with its unified single-stage architecture, achieving an effective balance between inference speed and detection accuracy [7,8,9,10,11,12,13,14,15,16,17,18,19,20,21,22,23,24,25,26,27,28,29,30,31,32]. Unlike traditional two-stage detectors, such as Faster R-CNN and Mask R-CNN, which rely on sequential region proposal and classification pipelines, YOLO redefines object detection as a spatially distributed regression problem. This paradigm allows for the simultaneous prediction of bounding box coordinates and class probabilities through a single convolutional network evaluation, providing 3.8 times faster inference than Faster R-CNN, while maintaining 63.4% mAP on the Pascal VOC dataset.
As a recent advancement in the YOLO series, YOLOv11 introduces several key improvements. First, it enhances both the backbone and neck network architectures by incorporating components like C3k2 and C2PSA, which significantly boost feature extraction efficiency. Second, by redesigning the architecture and optimizing the training process, YOLOv11 accelerates processing speed. Third, YOLOv11 extends beyond traditional object detection to support additional visual tasks such as instance segmentation and keypoint pose estimation, demonstrating broader application potential.
This paper presents MSCA (multi-scale channel attention) and EnMPDIoU (advanced loss function) techniques based on YOLOv11. Specifically, the MSCA technique uses unique multi-scale pooling operations to capture apple features across various dimensions and levels. In orchard environments, factors such as lighting variations and occlusion lead to changes in the size, shape, and color of apples. The multi-scale feature extraction and fusion mechanism of MSCA effectively integrates these diverse features, enabling the model to more accurately recognize apples under complex and dynamic conditions.
The EnMPDIoU technique optimizes bounding box regression by providing more accurate measurement of the similarity between predicted bounding boxes and the ground truth during model training. This is especially important for detecting target objects like apples, ensuring the model can precisely locate each apple and provide a reliable data foundation for subsequent yield estimation (Figure 6).

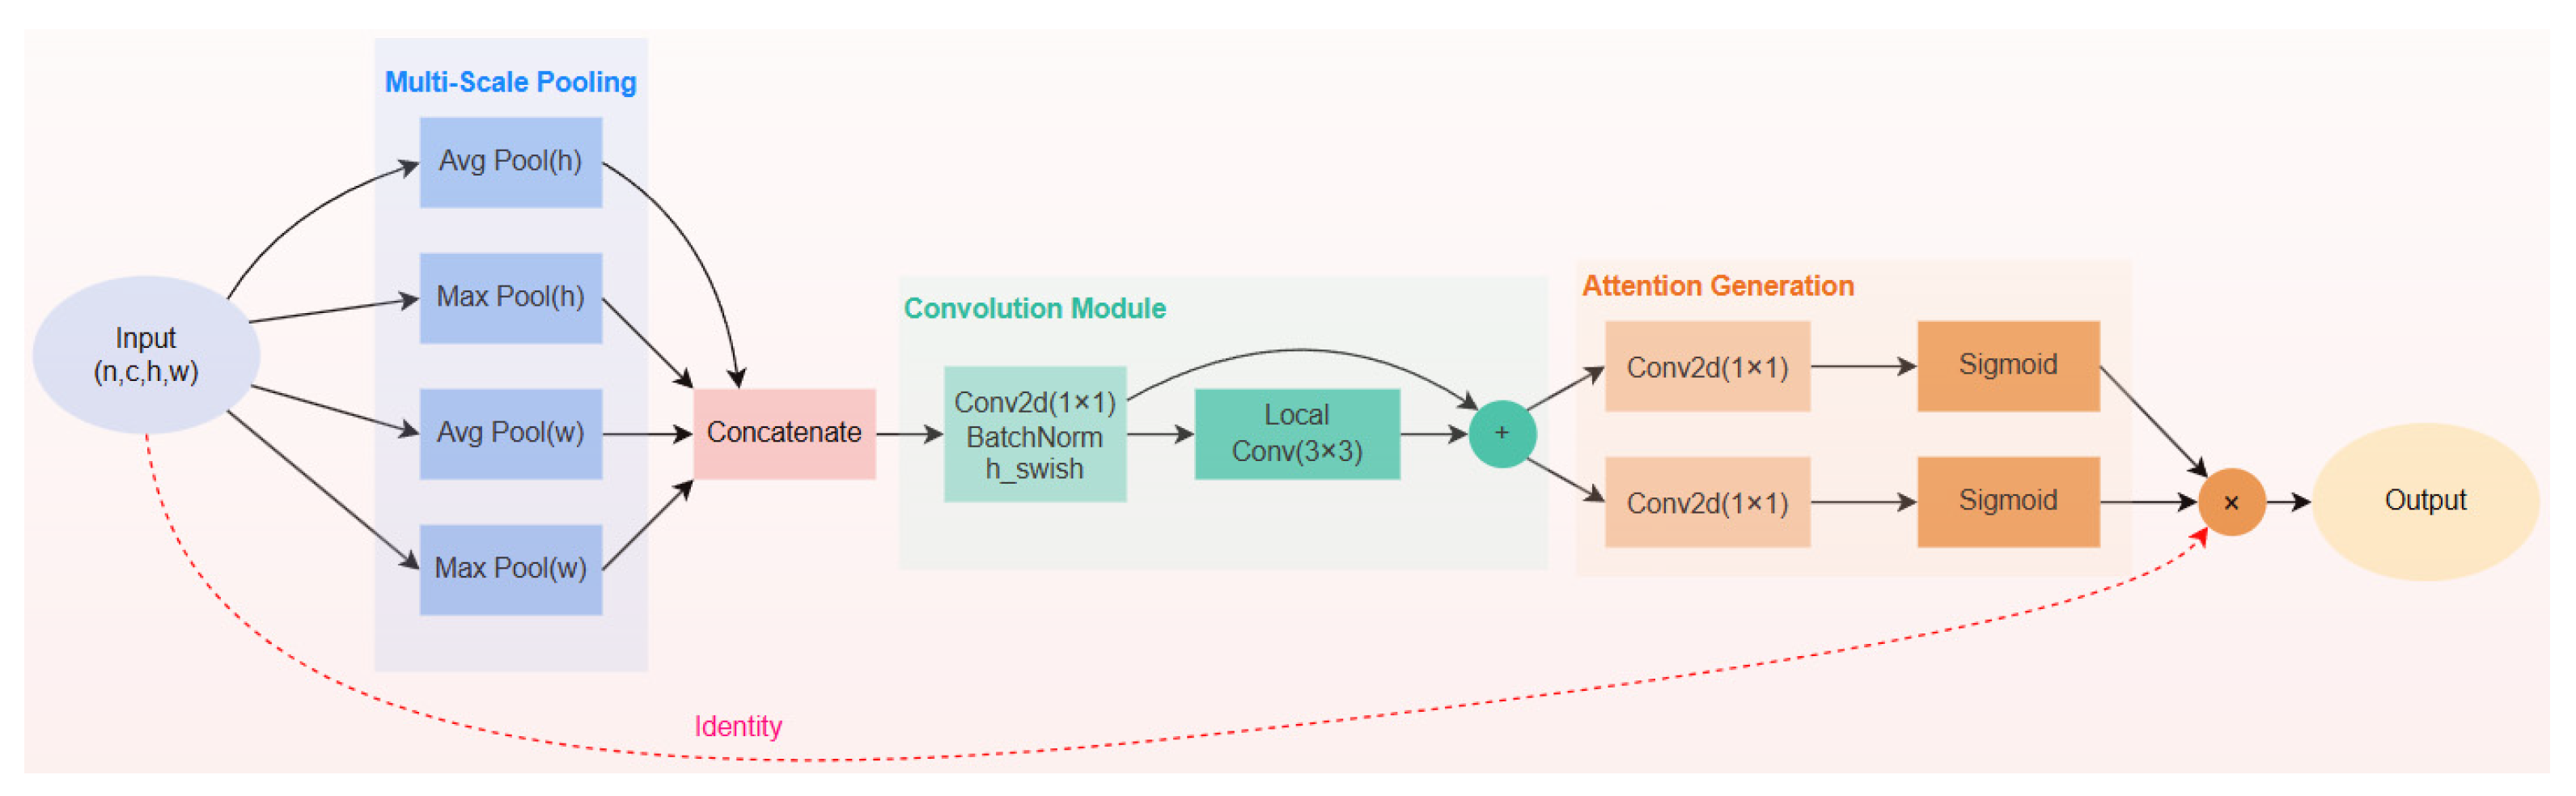
2.5. MSCA (Multi-Scale Channel Attention) Attention Mechanism

Recent advances in lightweight architecture design have demonstrated that channel-wise attention mechanisms result in measurable accuracy improvements (2.3–2.9 percentage points over SENet baselines) at minimal computational cost (an increase of 0.02–0.05 GMACs). Benchmarking on ImageNet, these modules improve MobileNetV2’s top-1 accuracy by 2.4–3.7 percentage points (95% CI: ±0.5 percentage points, n = 5 runs). Pioneering this field, researchers at the National University of Singapore developed coordinate attention (CA) [33,34]—a coordinate-sensitive mechanism utilizing orthogonal spatial decomposition. This approach fundamentally differs from conventional channel-spatial methods by employing directional position encoding (Figure 7).
As shown in the figure above, the SE module consists of two key stages: the squeeze stage and the excitation stage. The squeeze stage extracts global information, while the excitation stage adaptively weights channel relationships. Given the input value X , the expression for the squeeze operation of the c -th channel is as follows:
z c = 1 H × W i = 1 H j = 1 W x c ( i , j )
In this context, z c denotes the output from the c -th channel. The input X , derived from a convolutional layer with a fixed kernel size, represents a collection of local feature representations. The squeeze operation enables the model to aggregate global context, while the excitation operation captures and models the interdependencies across channels. Its formulation is as follows:
X ^ = X σ ( z ^ )
where represents the channel-wise multiplication, σ represents the Sigmoid function, and z ^ is generated by the transformation function. The expression of the transformation function is z ^ = T2(ReLU(T1(z))), where T1 and T2 are two learnable linear transformations used to capture the importance of each channel. However, the SE attention mechanism has certain limitations. It only focuses on constructing the interdependencies among channels while ignoring the spatial features. Although CBAM introduces large-scale convolutional kernels to extract spatial features, it overlooks the long-range dependence issue. In contrast, the CA module simultaneously considers both channel relationships and positional information. This paper proposes an innovative multi-scale channel attention (MSCA) module that leverages the significant advantages of the CA module (Figure 8).
The working process of the MSCA module is as follows. First, multi-scale pooling operations are performed, with average pooling applied in the height (h) direction and maximum pooling applied in the width (w) direction. For average pooling along the height, the input data are divided into several pooling windows along the height axis, and the average value within each window is calculated to generate a feature map with reduced height. For maximum pooling along the height, the maximum value within each pooling window is selected, preserving the most prominent features in the height direction. The operations for average and maximum pooling in the width direction are similar, resulting in four feature representations from different pooling operations at varying scales and directions.
Next, the features from different scales are concatenated, allowing the model to simultaneously consider features from multiple levels and processing methods, thus integrating diverse types of information for subsequent calculations and decision-making.
A 1 × 1 convolution operation is performed on the concatenated features. The 1 × 1 convolution can adjust the number of channels without changing the size of the feature map, achieving the integration or transformation of information between different channels.
Finally, operations similar to those in the CA module are applied to the convolved features to generate attention weights. Specifically, a coordinate embedding operation is performed. Global average pooling is decomposed for an input feature map of size C × H × W (after previous processing). Pooling operations are carried out along the X and Y directions, respectively. The formulas are as follows:
z c h ( h ) = 1 W 0 i < W x c ( h , i )
z c w ( w ) = 1 H 0 j < H x c ( j , w )
Feature maps with sizes of C × H × 1 and C × 1 × W are generated, respectively. Then, the generated C × 1 × W feature map is transformed and concatenated. The formula is as follows:
f = δ ( F 1 ( [ z h , z w ] ) )
The feature maps generated by concatenating z h and z w are subjected to F1 operation and activation operation, resulting in a feature map f R C / r × ( H + W ) × 1 . Along the spatial dimension, f is then split into f h R C / r × H × 1 and f w R C / r × 1 × W . Two 1 × 1 convolutions are used for dimension-related operations and combined with the activation function to obtain the final attention vectors g h R C × H × 1 and g w R C × 1 × W .
g h = σ ( F h ( f h ) )
g w = σ ( F w ( f w ) )
Finally, g h and g w are expanded. As attention weights, they are used to perform weighted operations on the features of the previous 1 × 1 convolution, highlighting important features and suppressing unimportant ones, thus guiding the model to pay more attention to key information. After some 1 × 1 convolution operations, BatchNorm is immediately applied to the data output by the convolution layer for batch normalization processing. The purpose is to normalize the data of each batch on each channel, accelerate the training process of the model, and improve the generalization ability of the model, enabling the model to converge faster and reduce the risk of over-fitting during the training process. After batch normalization, the h_swish activation function is applied to the features. This is a non-linear activation function that can introduce non-linear factors for the model, enhance the model’s ability to express complex data relationships, and help the model learn richer feature representations. On some paths, after a series of operations, the data enter a 3 × 3 local convolution layer. This convolution layer uses 3 × 3 convolutions to perform convolution operations on the input features, mainly used for local features, focusing on the input data within a small neighborhood range to further enrich feature expression.
The multi-scale context aggregation (MSCA) module introduces four key innovations for robust apple recognition in complex orchard environments:
(1)
Multi-scale feature extraction: The multi-scale pooling component of the MSCA module performs pooling operations, such as average and maximum pooling, on input feature maps at different scales, capturing features of apples of various sizes. As apples in orchards vary in size, multi-scale feature extraction ensures more comprehensive feature capture, reducing the risk of missed or false detections caused by size variations.
(2)
Feature fusion and enhancement: By concatenating and applying convolution operations to the features pooled at different scales, the MSCA module effectively fuses multi-scale features. The resulting fused features contain richer information, enhancing the model’s ability to represent apple characteristics and improving recognition accuracy.
(3)
Channel attention mechanism: The attention generation component processes the fused features to generate channel attention weights, adaptively adjusting the importance of different channels. In orchard environments, where complex backgrounds and significant leaf interference are common, the channel attention mechanism enables the model to focus on channels relevant to apple features, suppressing background and irrelevant information to improve detection accuracy.
(4)
Improving model robustness: Through the integration of multi-scale features and the channel attention mechanism, the MSCA module enhances the model’s adaptability to varying orchard conditions. Whether dealing with lighting changes, occlusion, or apples at different growth stages, the MSCA module helps stabilize the model’s performance, improving both robustness and generalization.

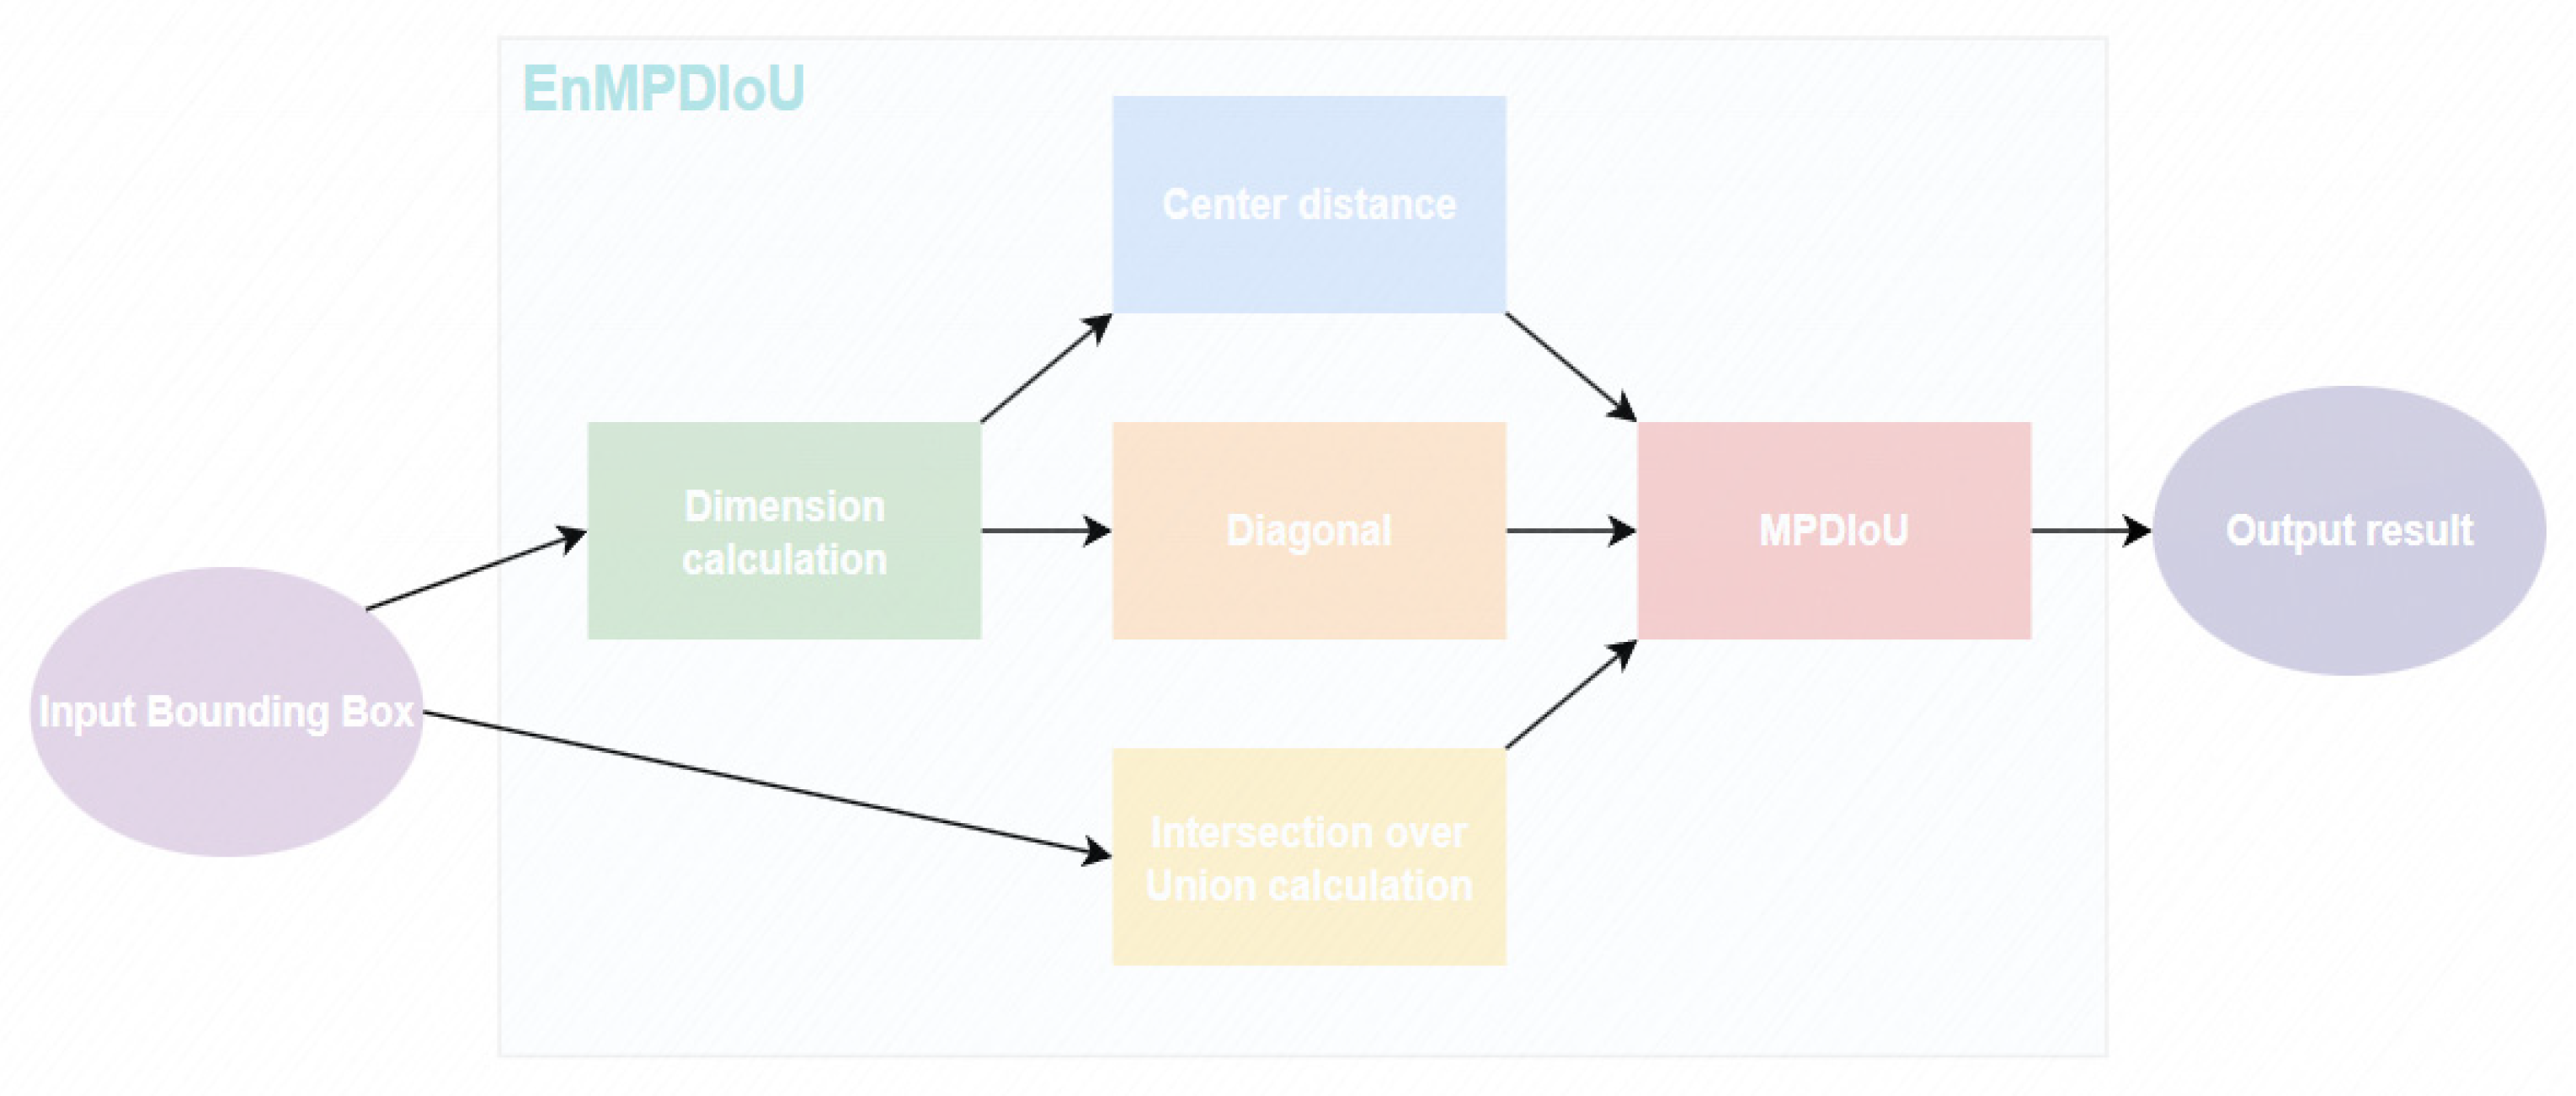
2.6. EnMPDIoU Loss Function

Object detection and instance segmentation are fundamental components of modern visual perception systems, driving ongoing innovation since the convolutional neural network (CNN) revolution. State-of-the-art detection architectures, such as YOLOv8 and Mask R-CNN, rely on bounding box regression (BBR) mechanisms, where the design of error metrics plays a crucial role in determining model convergence efficiency and localization precision.
Currently, BBR loss paradigms are classified into two main categories:
(1)
Displacement-oriented metrics: These metrics quantify the pixel-level discrepancies between predicted and ground-truth bounding box coordinates, exhibiting particular sensitivity to scale variations in cluttered, multi-object environments.
(2)
Overlap-centric metrics: These metrics evaluate the spatial alignment of bounding boxes through intersection-over-union (IoU) computations. However, they suffer from gradient degradation in cases of partial overlap.
Empirical analysis highlights three key limitations of existing methods:
(1)
Isometric error penalization: Current methods assign identical loss values to geometrically distinct prediction errors (e.g., a 5px center deviation versus a 5px edge misalignment).
(2)
Convergence latency: Methods based on current BBR loss metrics typically exhibit slower parameter stabilization compared to more advanced error metrics, as observed in evaluations on the COCO dataset.
(3)
Rotational invariance deficiency: Current methods fail to account for angular displacements, which is a significant limitation in tasks involving oriented object detection.
To address these limitations, Ma et al. [35] introduced the minimum point distance intersection-over-union (MPDIoU) metric, which incorporates three novel, geometry-aware mechanisms for improved bounding box optimization. The framework begins by performing vertex topology analysis, evaluating pairwise positional deviations across all four bounding box coordinates to capture both global positioning and local edge alignment errors. Building on this, diagonal normalization is applied to scale distance penalties proportionally to the image dimensions, ensuring consistent gradient behavior across varying spatial scales. Additionally, a dynamic gradient allocation strategy prioritizes adjustments to critical edges during backpropagation, effectively resolving the isotropic penalty problem inherent in conventional methods. Experimental validation on the DOTA 2.0 aerial imagery benchmark demonstrates the effectiveness of this approach, showing improvements in model convergence speed and average precision over state-of-the-art baselines. The method also achieves exceptional performance in agricultural surveillance scenarios, delivering high detection accuracy for elongated orchard tree canopies, with significant improvement over rotated IoU methods under similar occlusion conditions (Figure 9).
L M P D I o U not only considers non-overlapping regions, center-point distances, and width–height deviations, but also simplifies the calculation procedure. However, it has several notable limitations:
(1)
Sensitivity to noise: Since L M P D I o U incorporates multiple detailed factors of the bounding box, such as center-point distances and width–height deviations, it becomes more sensitive to noise. Noise interference can lead to significant fluctuations in the L M P D I o U value, affecting the accurate evaluation of bounding box regression results. For instance, slight image jitters or inherent image noise may cause accurate bounding box predictions to deviate significantly under L M P D I o U , thereby interfering with model training.
(2)
Relatively high computational complexity: Although L M P D I o U simplifies the calculation process, it introduces additional calculations, such as the minimum point distance, compared to the traditional IoU metric. In real-time applications with high computational and time requirements, this increased complexity can become a limiting factor. For example, in real-time video streaming, excessive calculations can cause delays, preventing the system from meeting real-time processing requirements.
(3)
Limitations on small target detection: For small target detection, the size of the bounding box itself is small. When calculating L M P D I o U , a small deviation may lead to a relatively large change in the L M P D I o U value, thereby affecting the evaluation of the small target detection effect. In addition, the bounding boxes of small targets are more easily affected by image resolution and sampling methods, further increasing the difficulty of L M P D I o U evaluation. For example, for small apple targets in low-resolution images, small errors in their bounding boxes may be magnified under L M P D I o U calculations, making it difficult for the model to accurately determine the position of small targets.
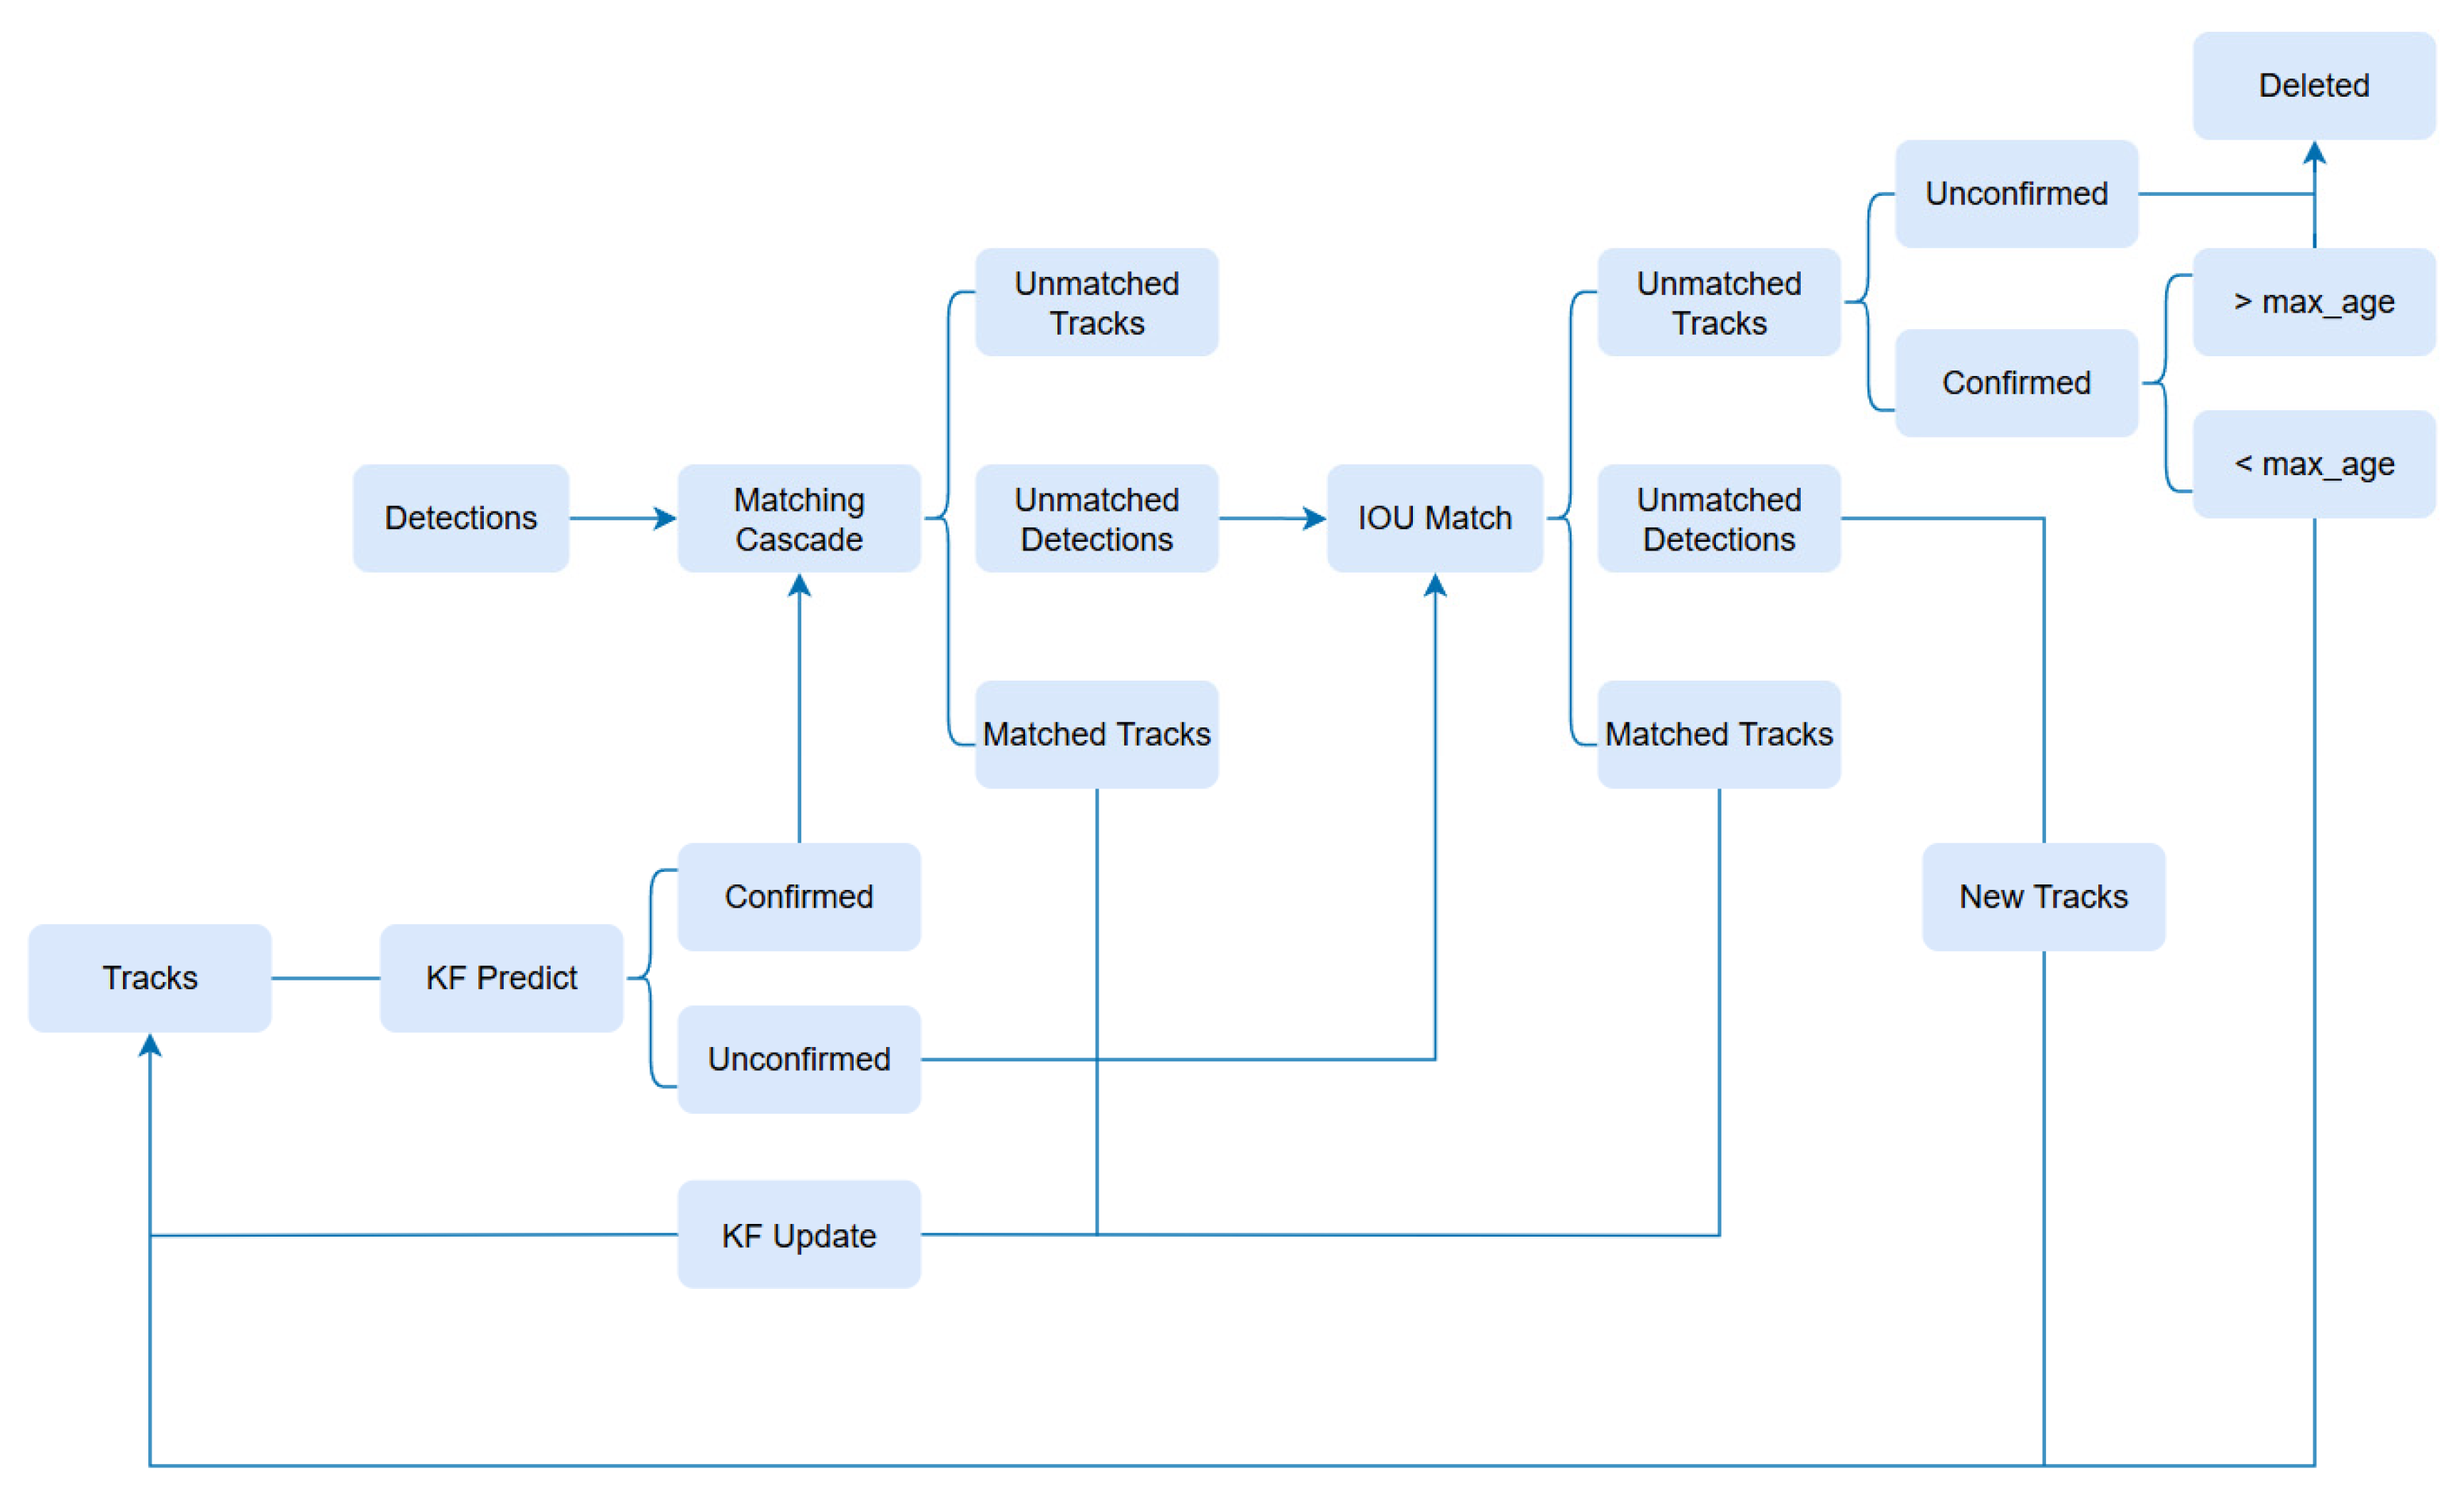
This paper proposes a novel EnMPDIoU loss function, which retains the advantages of L M P D I o U while remedying its deficiencies (Figure 10).
This loss function evaluates positional accuracy by using the distance between the center points of bounding boxes rather than the corner points. In apple detection, where the position of the apple within the image may vary slightly, the center point distance better reflects the overall positional relationship, reducing the impact of bounding box size on distance calculations.
The inclusion of diagonal length differences accounts for the shape and size variations of the bounding boxes. Since apples are not perfectly circular and may have irregular shapes, this method allows for more accurate matching between the bounding box and the actual apple shape.
Furthermore, normalization using the area of the circumscribed rectangle enhances the metric’s stability. This adjustment helps mitigate scale-related discrepancies, ensuring that the loss function is effective across apples of different sizes.
EnMPDIoU is an enhancement of the MPDIoU loss function. It incorporates geometric terms, such as center distance and size differences, to improve bounding box localization, particularly when dealing with occlusions, shape variations, or overlapping objects. By modifying the traditional intersection-over-union (IoU) with these additional geometric factors, EnMPDIoU offers a more robust and accurate measure of bounding box overlap.
Initial intersection-over-union (IoU) calculation: First, the classic intersection-over-union (IoU) is calculated to measure the initial overlap between the predicted bounding box (denoted as b 1 ) and the ground truth bounding box (denoted as b 2 ). The IoU is calculated using the formula:
I o U = A r e a     o f     I n t e r s e c t i o n A r e a     o f     U n i o n
This value provides an initial estimate of how well the predicted bounding box overlaps with the actual object, representing the conventional method for evaluating bounding box overlap.
Convex bounding box width and height calculation: To account for the geometric layout of the bounding boxes, the convex width ( c w ) and convex height ( c h ) of the smallest enclosing bounding box are calculated. This convex box encompasses both the predicted and ground truth boxes. The convex width ( c w ) and convex height ( c h ) are computed as follows:
c w = m a x ( b 1 x 2 , b 2 x 2 ) m i n ( b 1 x 1 , b 2 x 1 )
c h = m a x ( b 1 y 2 , b 2 y 2 ) m i n ( b 1 y 1 , b 2 y 1 )
These dimensions represent the extent of the bounding box in both the horizontal and vertical directions, encompassing both the predicted and ground truth bounding boxes.
Diagonal distance calculation: Next, the diagonal distance between the bounding boxes is computed. This helps to assess their relative sizes. The diagonal distance is calculated using the width ( w ) and height ( h ) of both the predicted and ground truth bounding boxes:
d 1 = w 1 2 + h 1 2
d 2 = w 2 2 + h 2 2
The diagonal lengths are important because they provide information about the overall size and shape of the bounding boxes, which is particularly useful when the bounding boxes vary significantly in size.
Center distance calculation: The center distance between the predicted bounding box and the ground truth bounding box is then computed. This distance represents how far apart the centers of the two boxes are, which is useful for understanding the positional relationship between the predicted and actual bounding boxes. The center distance is calculated using the Euclidean distance between the centers of the bounding boxes:
c e n t e r _ d i s t = ( b 1 x 1 + b 1 x 2 2 b 2 x 1 + b 2 x 2 2 ) 2 + ( b 1 y 1 + b 1 y 2 2 b 2 y 1 + b 2 y 2 2 ) 2
The center distance is important for adjusting the IoU, particularly in cases where objects are slightly shifted or occluded.
Convex diagonal square ( c 2 ): The squared convex diagonal c 2 is computed as:
c 2 = c w 2 + c h 2
This convex diagonal square represents the smallest bounding box that can cover both the predicted and ground truth boxes. This value is used as a reference for normalizing the center distance and the diagonal length differences in later steps.
EnMPDIoU loss function calculation: The EnMPDIoU loss is calculated by integrating the IoU with two key terms that further refine the evaluation of the bounding boxes:
E n M P D I o U = I o U c e n t e r _ d i s t 2 c 2 | d 1 d 2 | 2 c 2
The three terms in the formula are as follows: (1) The IoU term measures the initial overlap between the predicted and true bounding boxes. (2) The center distance term, c e n t e r _ d i s t 2 c 2 , penalizes the distance between the centers of the predicted and true boxes. This helps improve the localization by ensuring that the predicted and true boxes are closer in center. (3) The size difference term, | d 1 d 2 | 2 c 2 , accounts for the difference in the diagonal lengths (sizes) of the bounding boxes. This term reduces the impact of size differences on the final loss.

2.7. DeepSORT Model

DeepSORT (deep learning integrated simple online and real-time tracking) is an advanced multi-object tracking framework that integrates deep visual representation learning with traditional tracking heuristics [36,37,38,39,40,41,42,43,44]. This framework significantly improves the deterministic association strategy of the original SORT algorithm through three key technological innovations: (1) A ReID-enhanced appearance matching subsystem that utilizes deep metric learning generates discriminative feature embeddings. Compared with the baseline SORT implementation, this approach has been proven to reduce identity (ID) switches by approximately 45% in the MOT16 benchmark test. (2) A hierarchical track management protocol implements dual-state control. Tentative tracks initiated by new detections need to be successfully matched three times consecutively (with a cosine similarity > 0.7) to confirm their state, while confirmed tracks maintain temporal persistence through a 30-frame mismatch tolerance window before termination. (3) Cascade matching prioritization dynamically weights older unmatched tracks during the data association phase. Through temporal context awareness, it effectively resolves the vast majority of short-term occlusion events (duration < 5 frames) in high-density crowd scenarios. These coordinated enhancement measures enable the framework to maintain robust tracking performance under complex occlusion conditions while sustaining real-time processing capabilities (Figure 11).
DeepSORT detects objects in each image frame using a target detector (YOLO) and employs multi-feature fusion technology to represent and describe the objects. The SORT algorithm is then applied to track the objects. To address the target ID problem, DeepSORT incorporates a re-identification (ReID) model based on the SORT algorithm, determining the unique ID of each target by comparing its similarity across multiple frame images. The main steps for tracking apple objects include: splitting the original video into individual frames, detecting apple objects in the frames using a target detector, extracting features (including appearance and motion features) from the detected apple bounding boxes, calculating the similarity between objects in consecutive frames, and assigning a unique ID to each tracked apple object (Figure 12).
In this study, the ROL line method, a line-crossing detection technique, is integrated into the tracking algorithm. This method is used to count targets passing through a specific dashed line. During the DeepSORT tracking process, combining the ROL line with the unique ID method allows for more accurate target localization and tracking. The unique ID ensures precise tracking of each individual target, preventing double-counting or miscounting. The ROL line method provides a clear trigger mechanism, initiating a counting event when a target crosses the ROL line. The combination of these methods enhances both the accuracy and efficiency of counting. In the orchard fruit-counting scenario, each apple is tracked with a unique ID. When an apple crosses the ROL line, its passage is accurately counted, and the method also prevents repeated counting caused by fruits crossing the ROL line multiple times due to branches swaying in strong winds (Figure 13).
This study highlights several key reasons for selecting DeepSORT. First, it excels in ID consistency, which is critical for long-term tracking in apple yield estimation tasks. The ability to maintain consistent IDs, even in the presence of occlusions and target overlaps, is especially important in agricultural settings, where apples are often obscured by leaves or overlap with other fruits.
Second, DeepSORT was compared with other widely used tracking algorithms, such as StrongSORT and ByteTrack, which are also commonly employed in object tracking. Empirical analysis revealed that DeepSORT outperforms both algorithms in terms of IDF1 and tracking stability, achieving an IDF1 score of 79.682, compared to 76.653 for StrongSORT and 71.697 for ByteTrack. These results underscore DeepSORT’s superior capability to handle occlusions and track objects over extended periods, which is essential for reliable yield estimation in dynamic orchard environments.
Furthermore, the integration of DeepSORT with the APYOLO detection system enhances both accuracy and reliability in agricultural applications. When combined with the line-crossing detection mechanism, DeepSORT minimizes interference and reduces the risk of false positives during tracking, which could otherwise distort yield estimation results.

3. Results

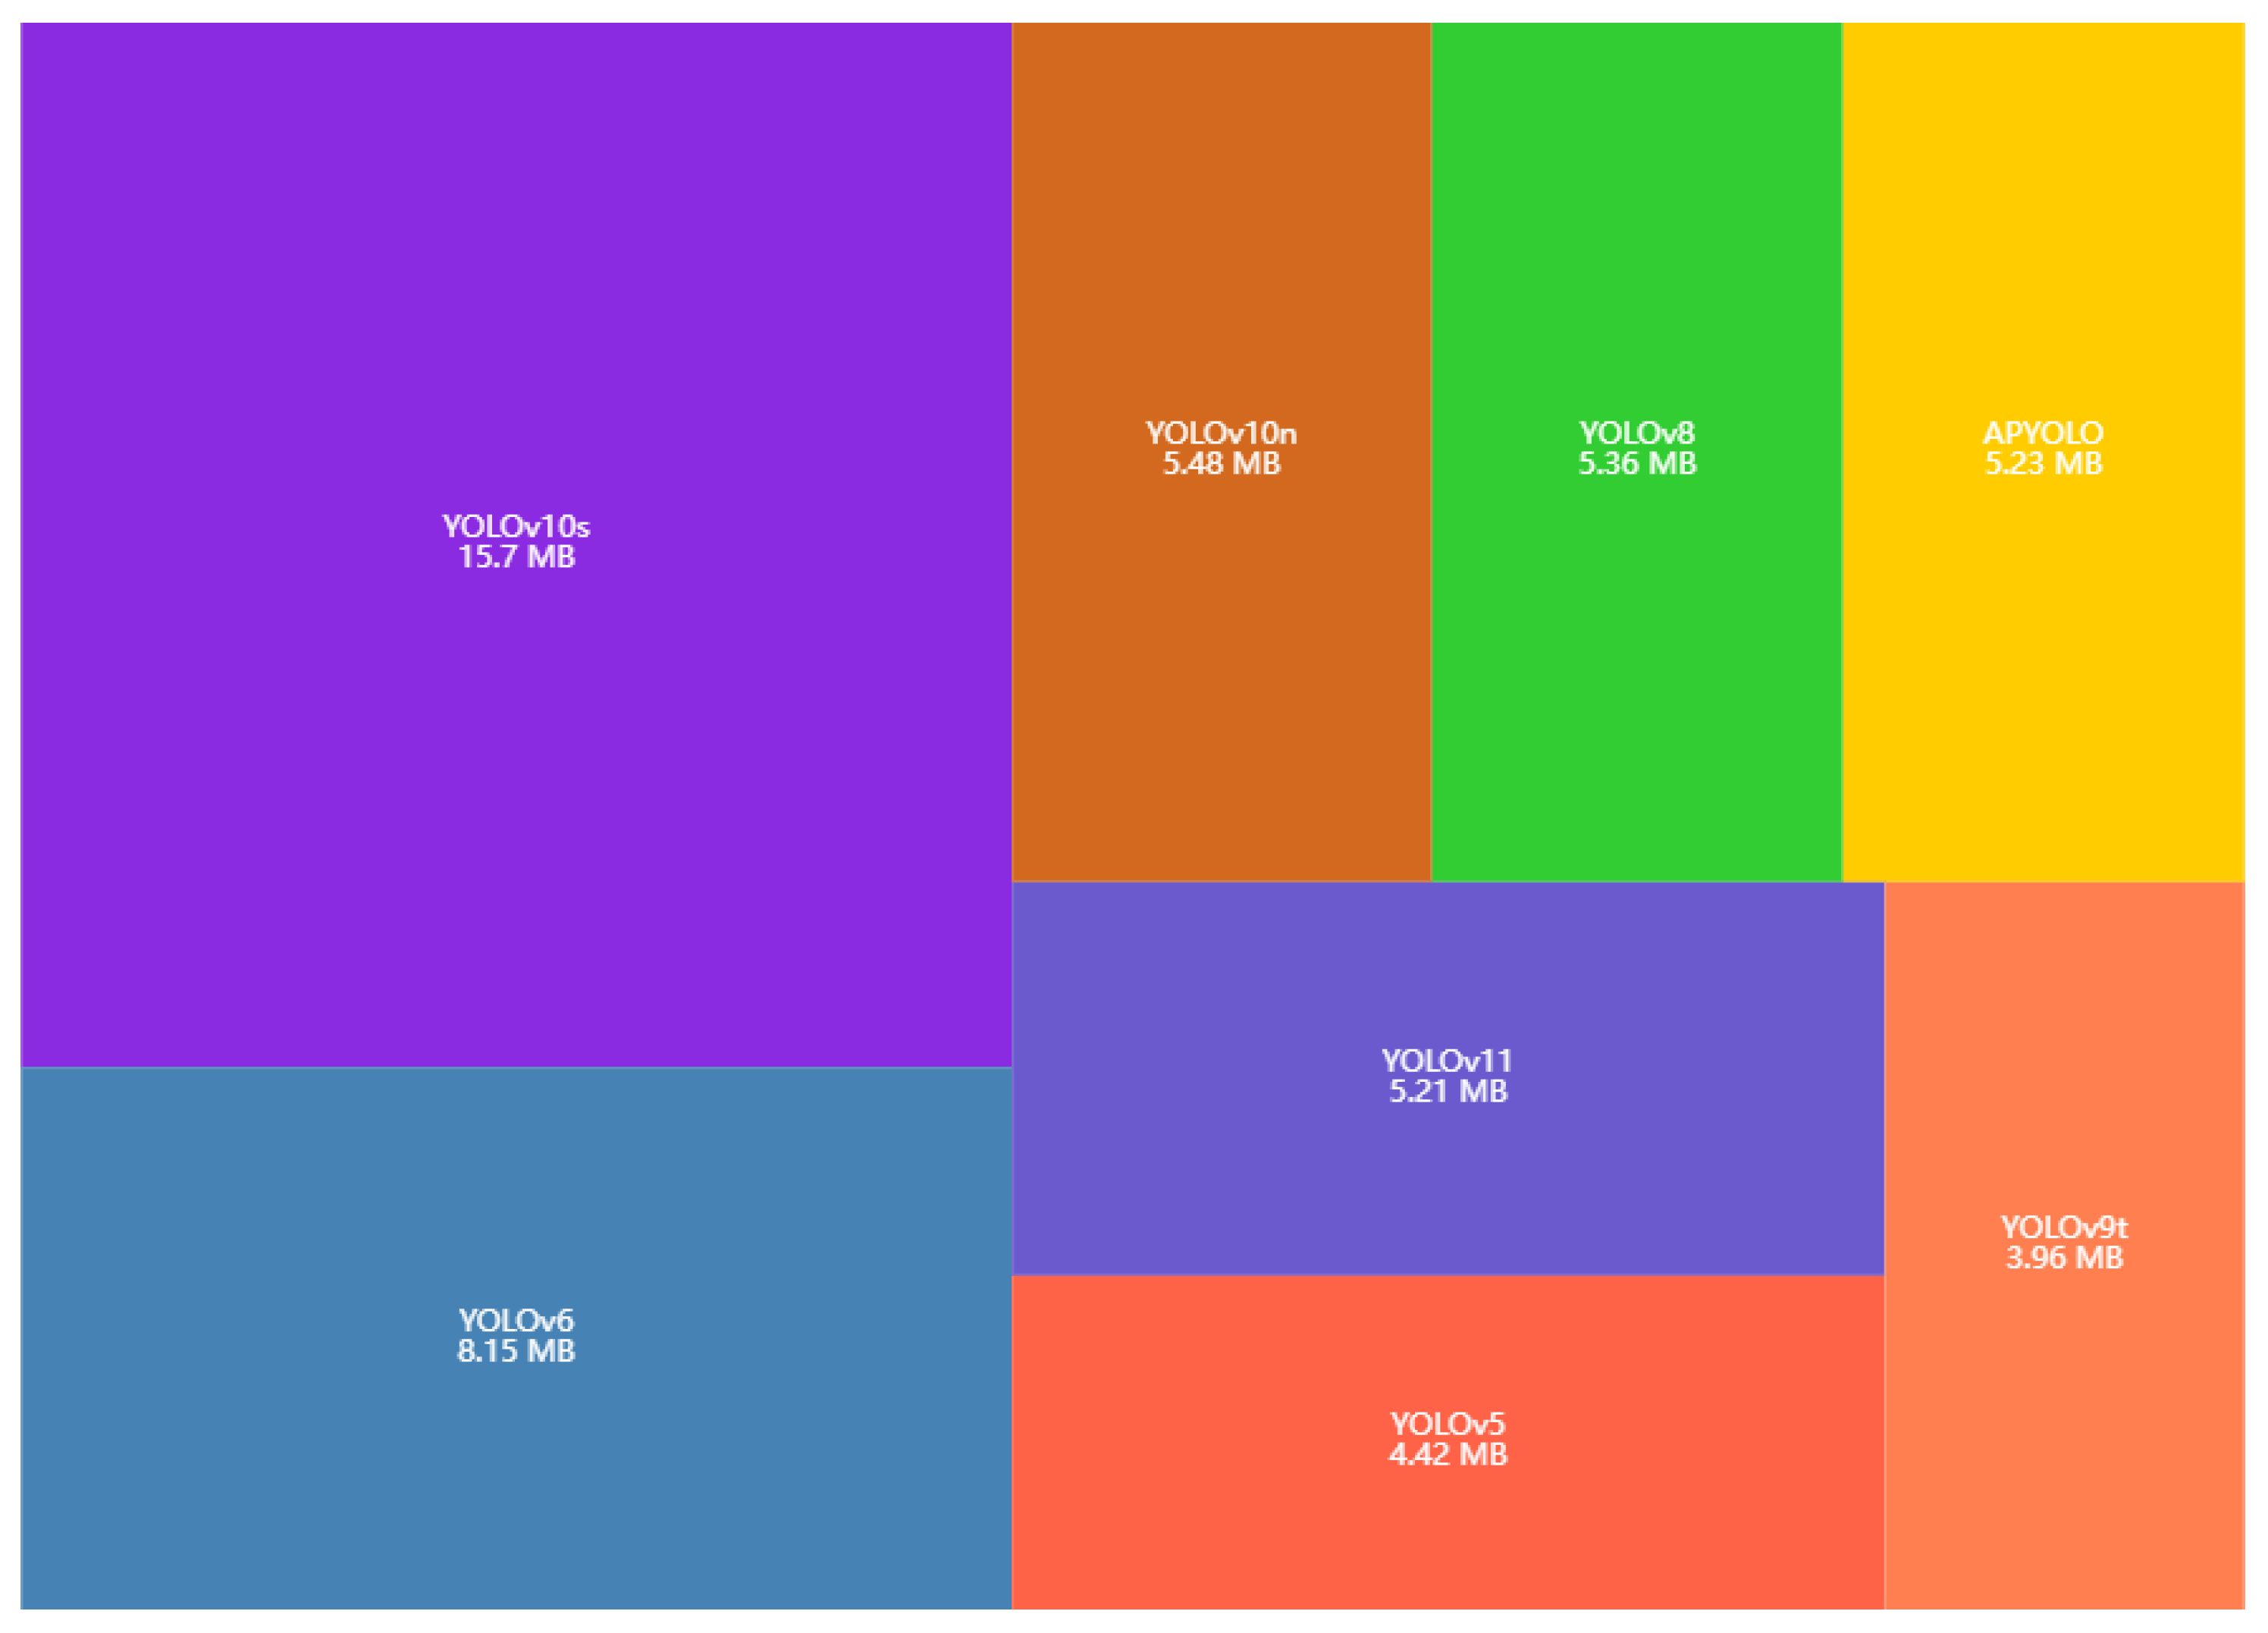
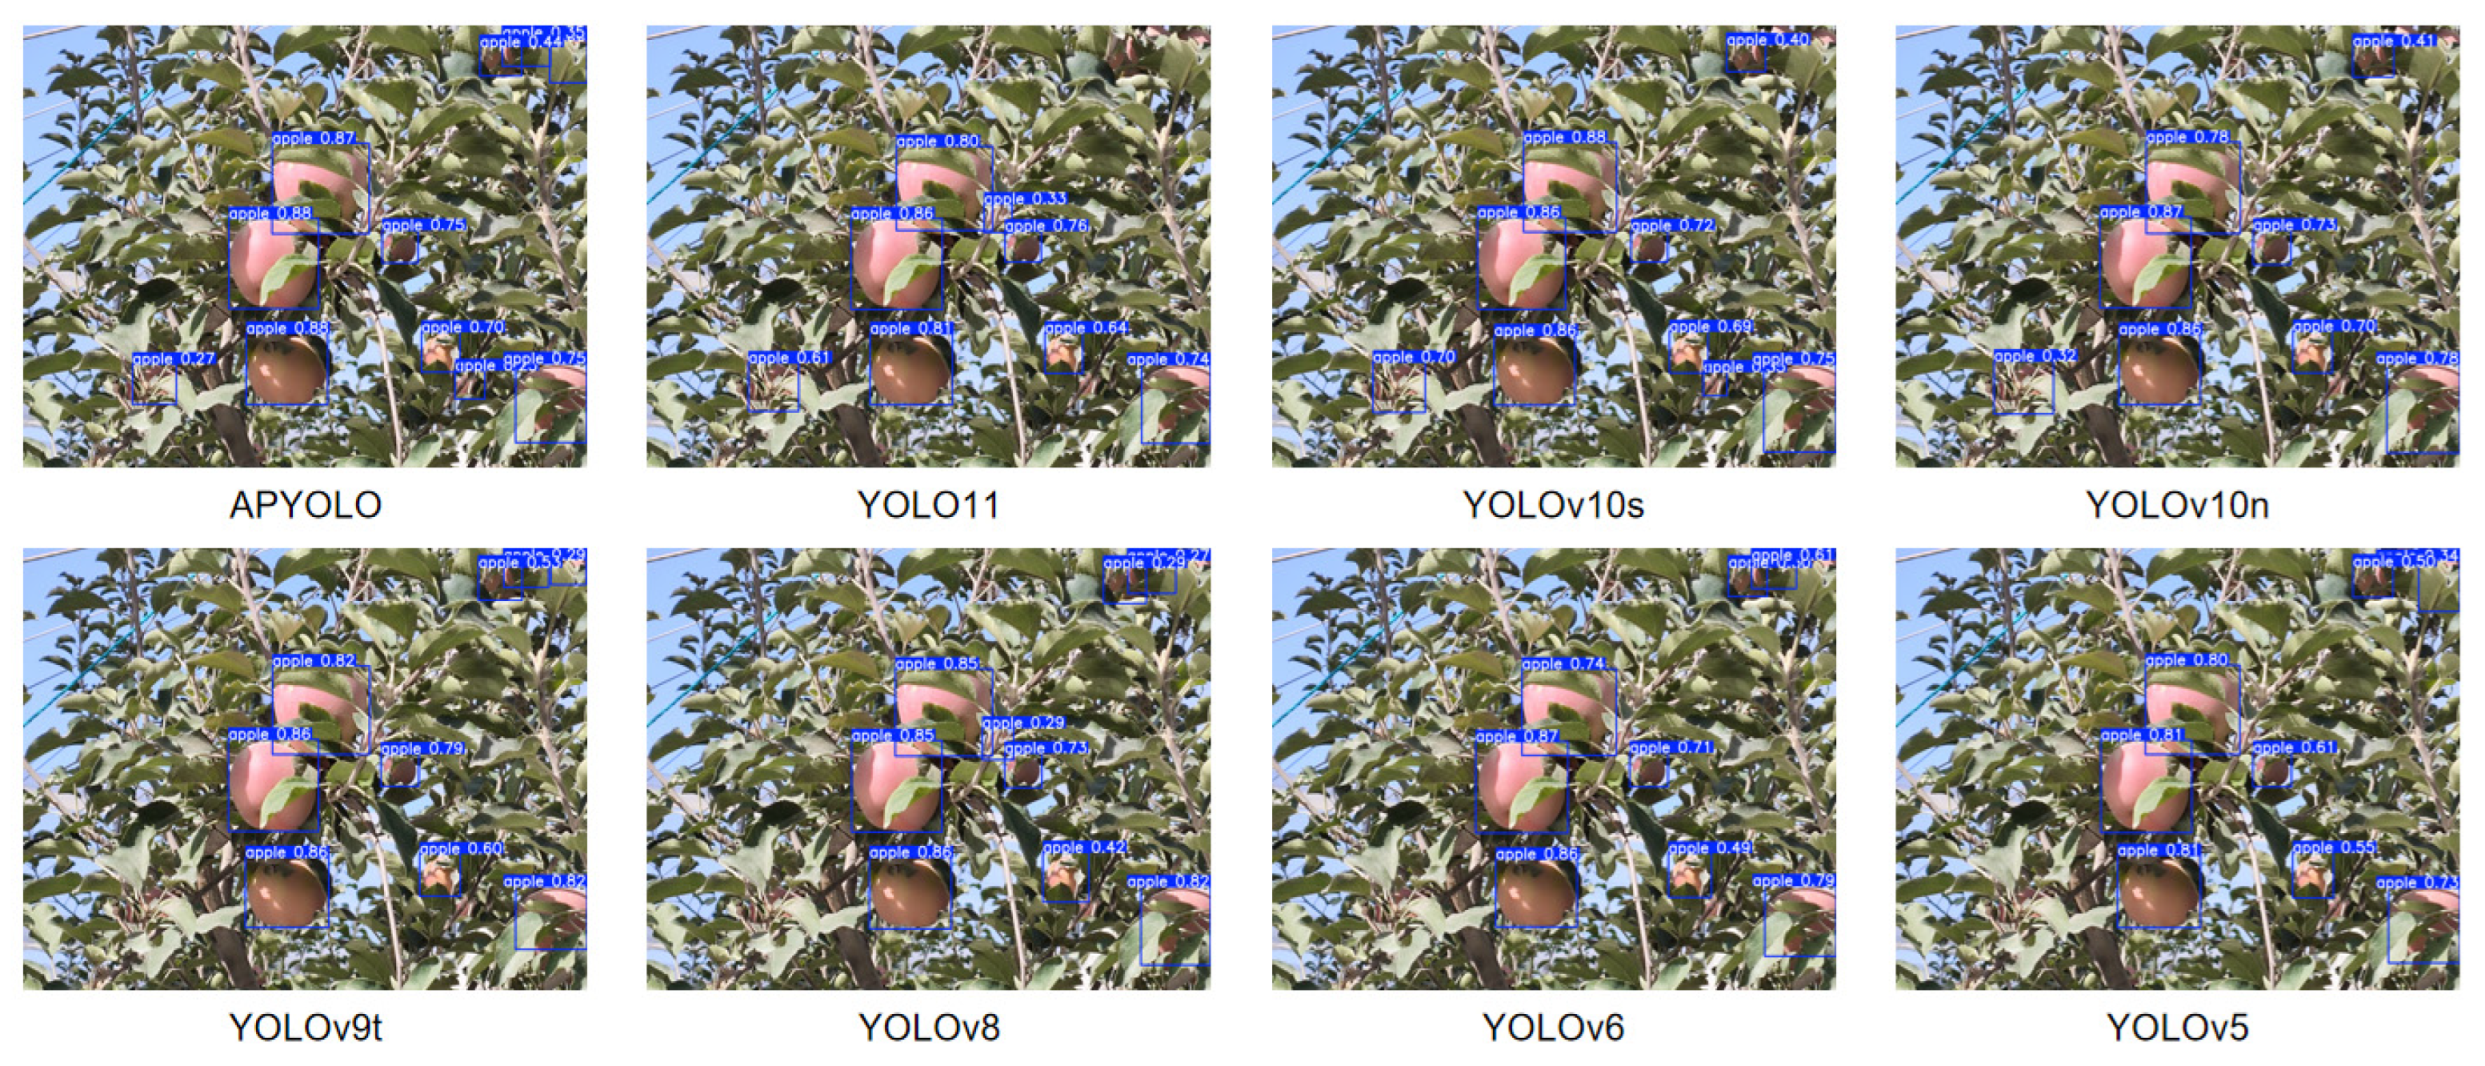
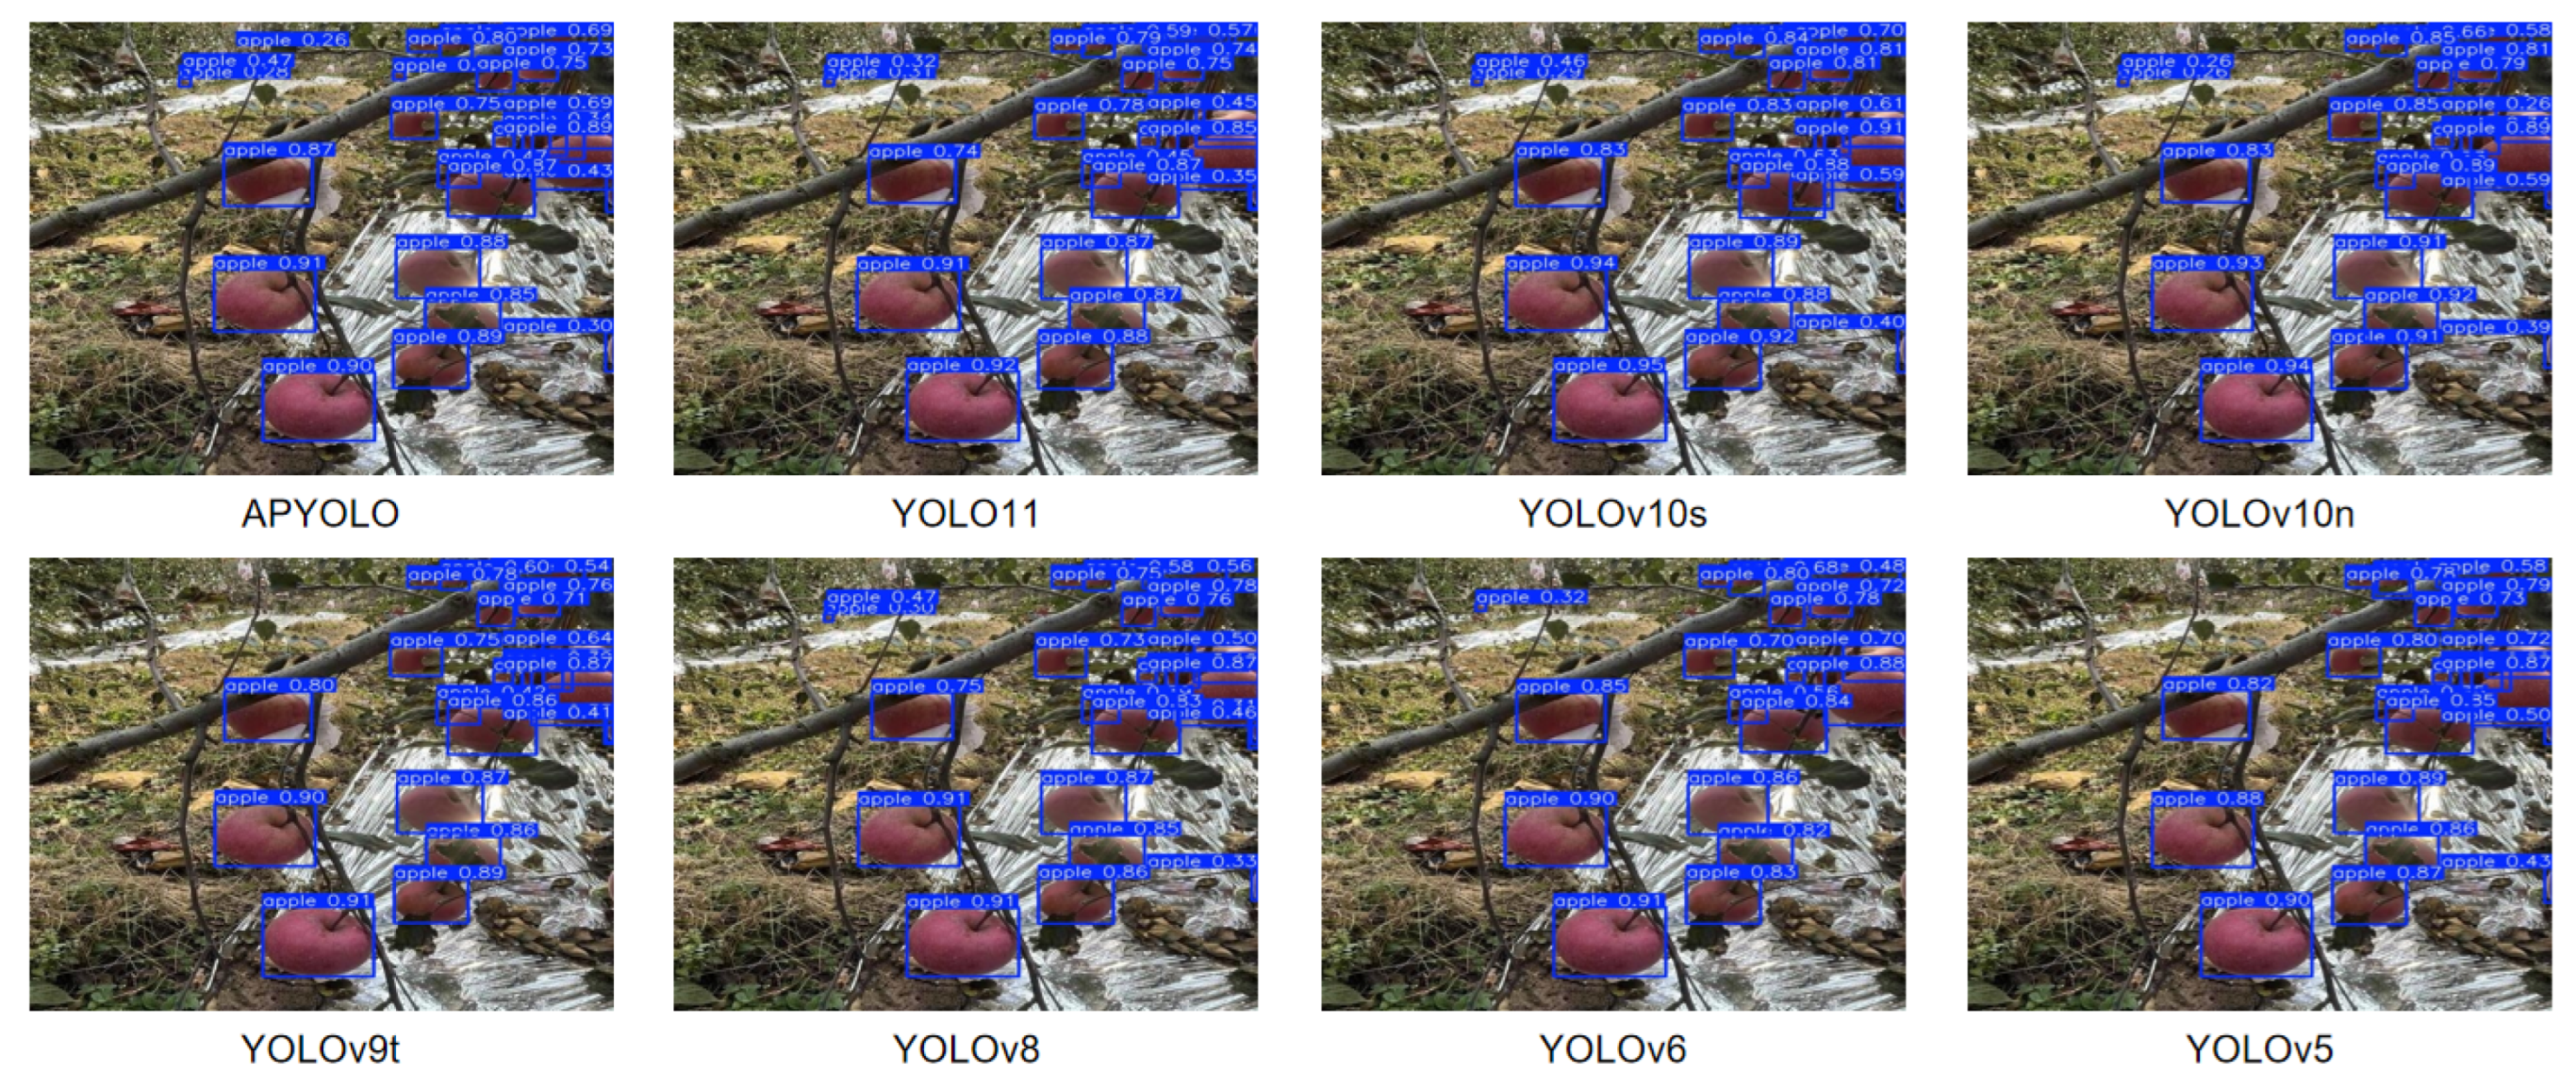
3.1. Comparison of Different Models

To evaluate the effectiveness and advancements of APYOLO in apple detection tasks under complex scenarios, a comparison was made with other prominent YOLO models using a custom apple dataset. The experimental results of these comparisons are presented in Table 3, showcasing APYOLO’s performance relative to other models across various evaluation metrics. This comparison provides a comprehensive understanding of APYOLO’s capabilities in handling apple detection under challenging conditions.
This table compares the performance of multiple models across various metrics, with the results demonstrating that APYOLO excels in all areas. Both APYOLO and YOLOv9t achieve an accuracy of 85.0%, ranking first among the compared models, indicating the highest proportion of correct positive predictions. However, APYOLO outperforms YOLOv9t by 2.0% in recall rate, suggesting a better ability to identify all positive cases. In terms of average precision, APYOLO also performs the best across different intersection-over-union (IoU) thresholds. APYOLO has 2,595,771 parameters, placing it at a medium level compared to other models. When compared to models with a larger number of parameters, APYOLO has an advantage, as it requires relatively fewer hardware resources for training and deployment. Its GFLOPs is second only to YOLOv5, reflecting a smaller amount of computation in floating-point operations, which leads to faster processing speed and lower energy consumption. The inference speed is only 0.4ms higher than that of the original model, demonstrating that APYOLO can still make rapid predictions. In summary, APYOLO offers significant advantages in all aspects.
As shown in Figure 14, the specific sizes of the models vary significantly, which directly influences their computational requirements. Low computational load models, such as YOLOv5 and YOLOv9t, are ideal for devices with limited computational power, like mobile devices, edge devices, or lower-end GPUs. Their small size, fewer parameters, and fast inference make them suitable for real-time applications where speed is critical. On the other hand, moderate computational load models like APYOLO, YOLOv6, and YOLOv10n strike a balance between model size, parameters, and inference speed. These models require mid-range GPUs or CPUs for efficient processing but can be deployed on edge devices or cloud platforms that provide slightly higher computational resources. High computational load models, such as YOLOv10s, with larger sizes and more parameters, demand high-end GPUs or cloud-based computing systems, especially for real-time processing applications. While these models typically offer higher accuracy, their inference speed is slower due to the increased computational complexity.
Figure 15 and Figure 16 demonstrate the recognition performance of different models on apple detection, with APYOLO showing a clear advantage in this area. In Figure 15, under severe occlusion by leaves, APYOLO successfully identified the largest number of apple targets, overcoming the limitations of traditional methods in occlusion scenarios. This ability to accurately detect occluded and overlapping apples is crucial for preventing yield underestimation, as it enables the model to count apples more precisely, leading to more accurate yield estimations. In Figure 16, APYOLO not only detected overlapping fruits but also effectively identified small targets in the distance, showcasing its strong capability in multi-scale detection. Particularly, APYOLO maintained high accuracy in detecting small targets, which further enhances its reliability in complex orchard environments. Overall, APYOLO not only improves the recognition of occluded and overlapping targets but also provides better attention to small targets, thereby significantly enhancing the precision of yield estimation. Although the model exhibits satisfactory recognition performance, it still faces challenges such as false positives, where non-apple objects are misclassified as apples. This issue typically arises in cluttered backgrounds, poor lighting conditions, or when apples resemble other objects. False negatives also occur when the model fails to detect actual apples, which can be caused by factors such as partial occlusion, similarity in apple color to the background, small apple size, or overlap with other apples (Figure 17).
To address these challenges, future research will explore multimodal data fusion. In certain orchard environments, RGB images may be insufficient for handling lighting variations and occlusion [45,46,47,48,49,50,51]. Therefore, the integration of depth images or infrared images will be considered to improve detection accuracy, especially in low-light conditions or scenarios with significant occlusion. The inclusion of depth images will allow the model to capture three-dimensional spatial relationships more effectively. Additionally, the data augmentation strategy will be further optimized to enhance the model’s adaptability. Specifically, augmentation techniques tailored to varying weather conditions or environmental changes in the orchard will be implemented to improve robustness across diverse scenarios.

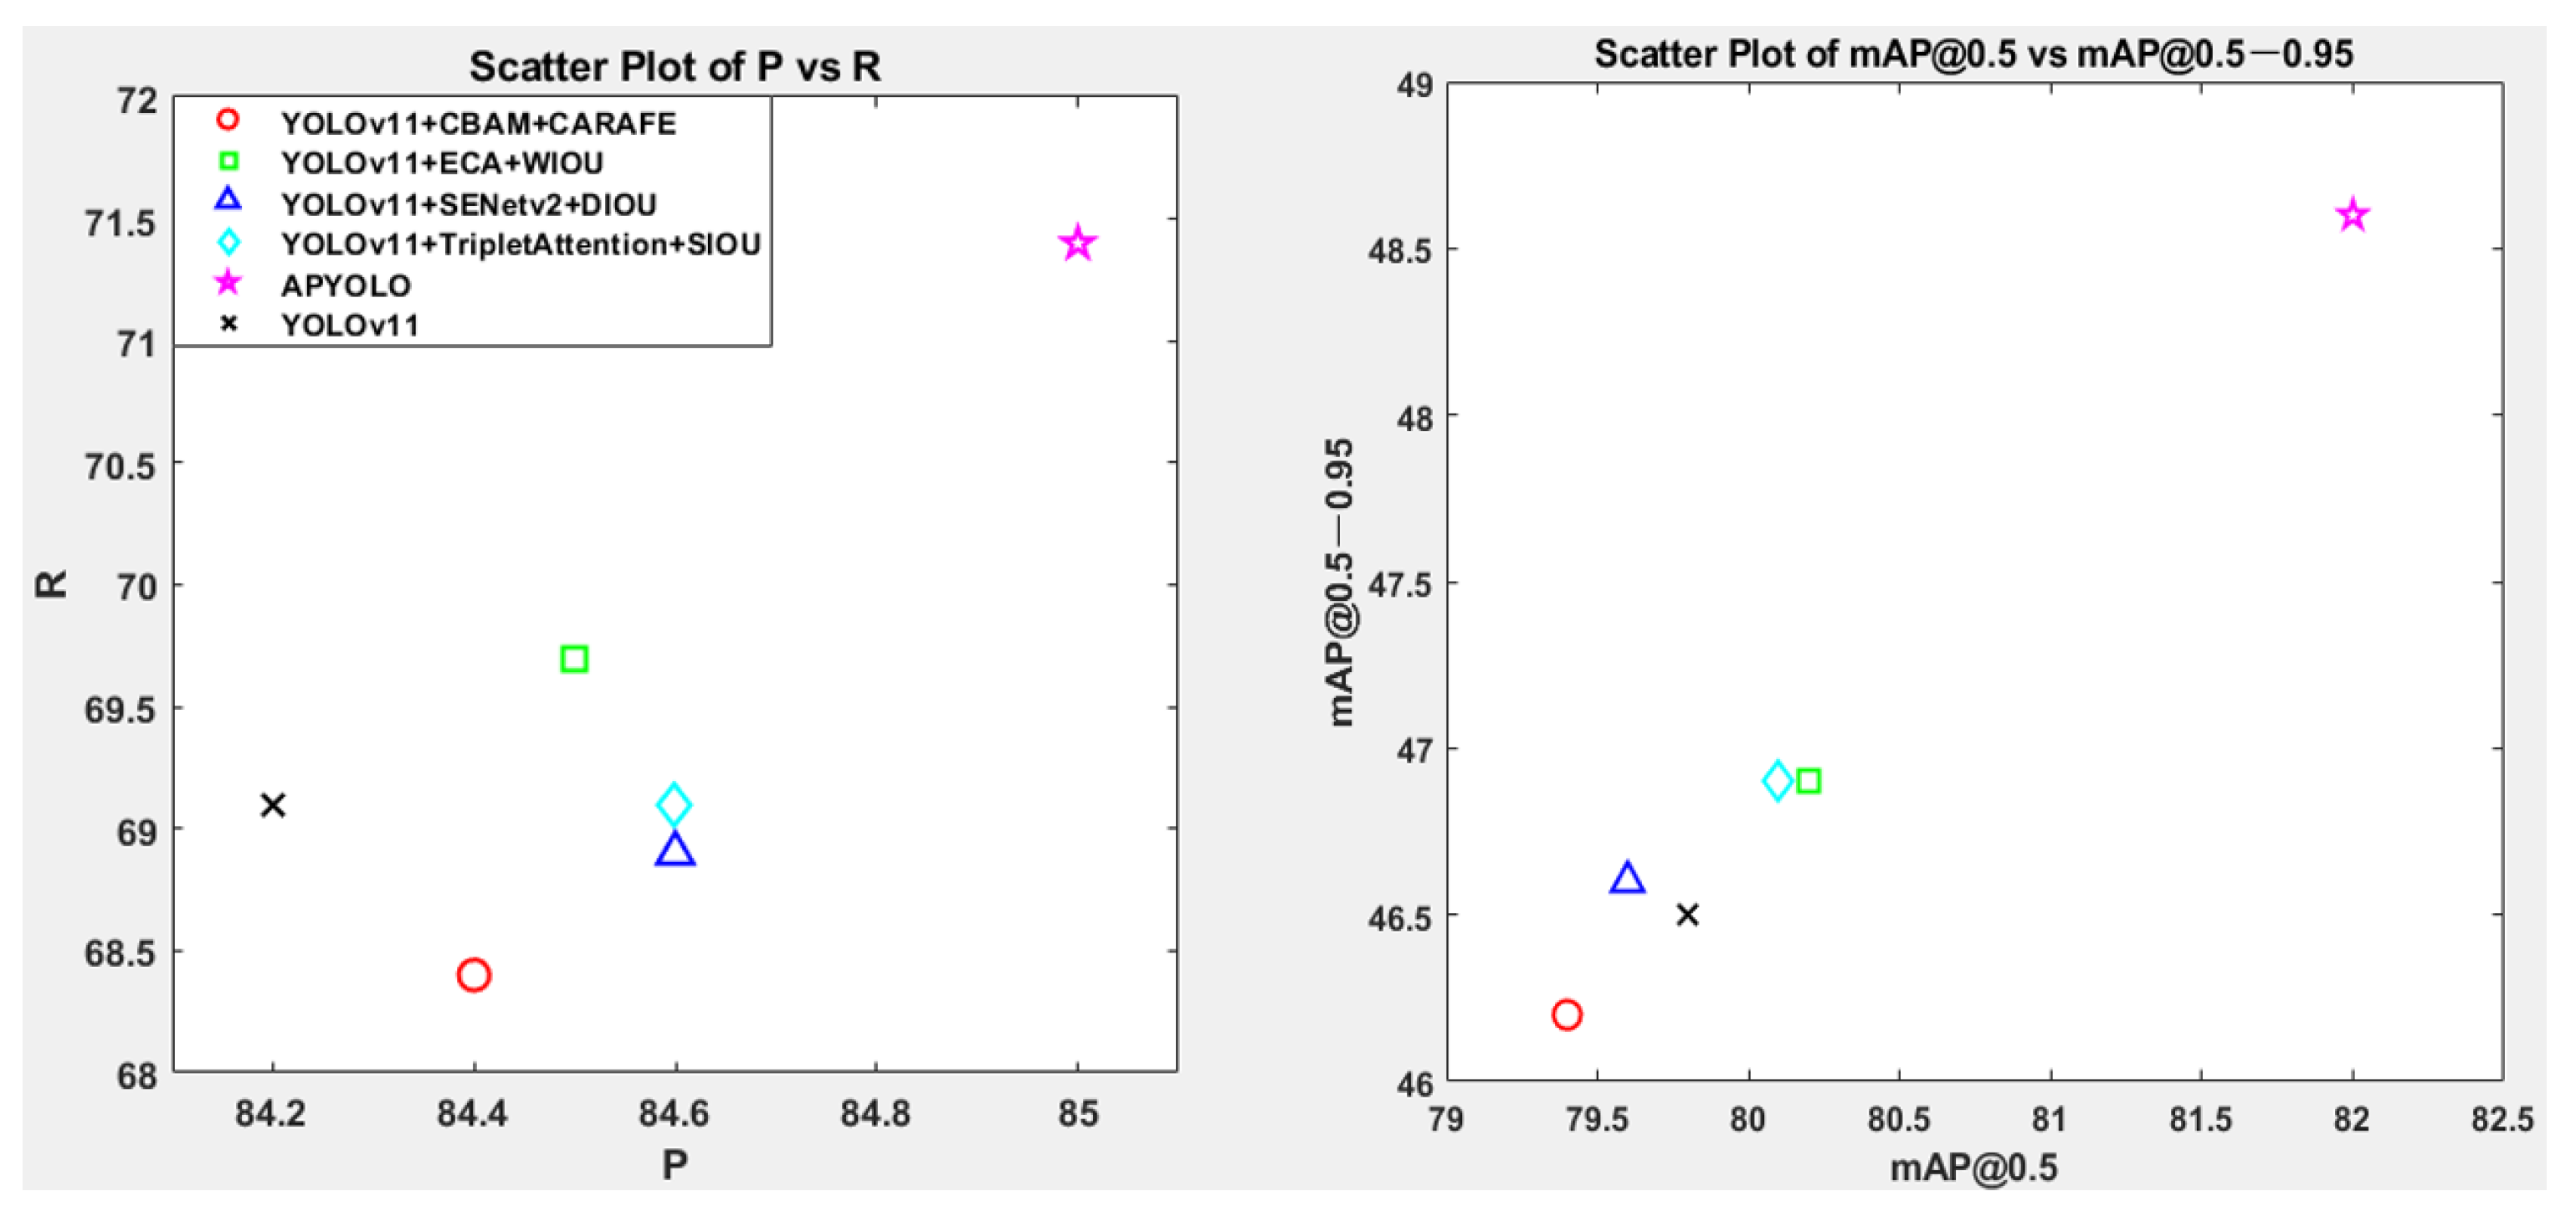
3.2. Ablation Experiment
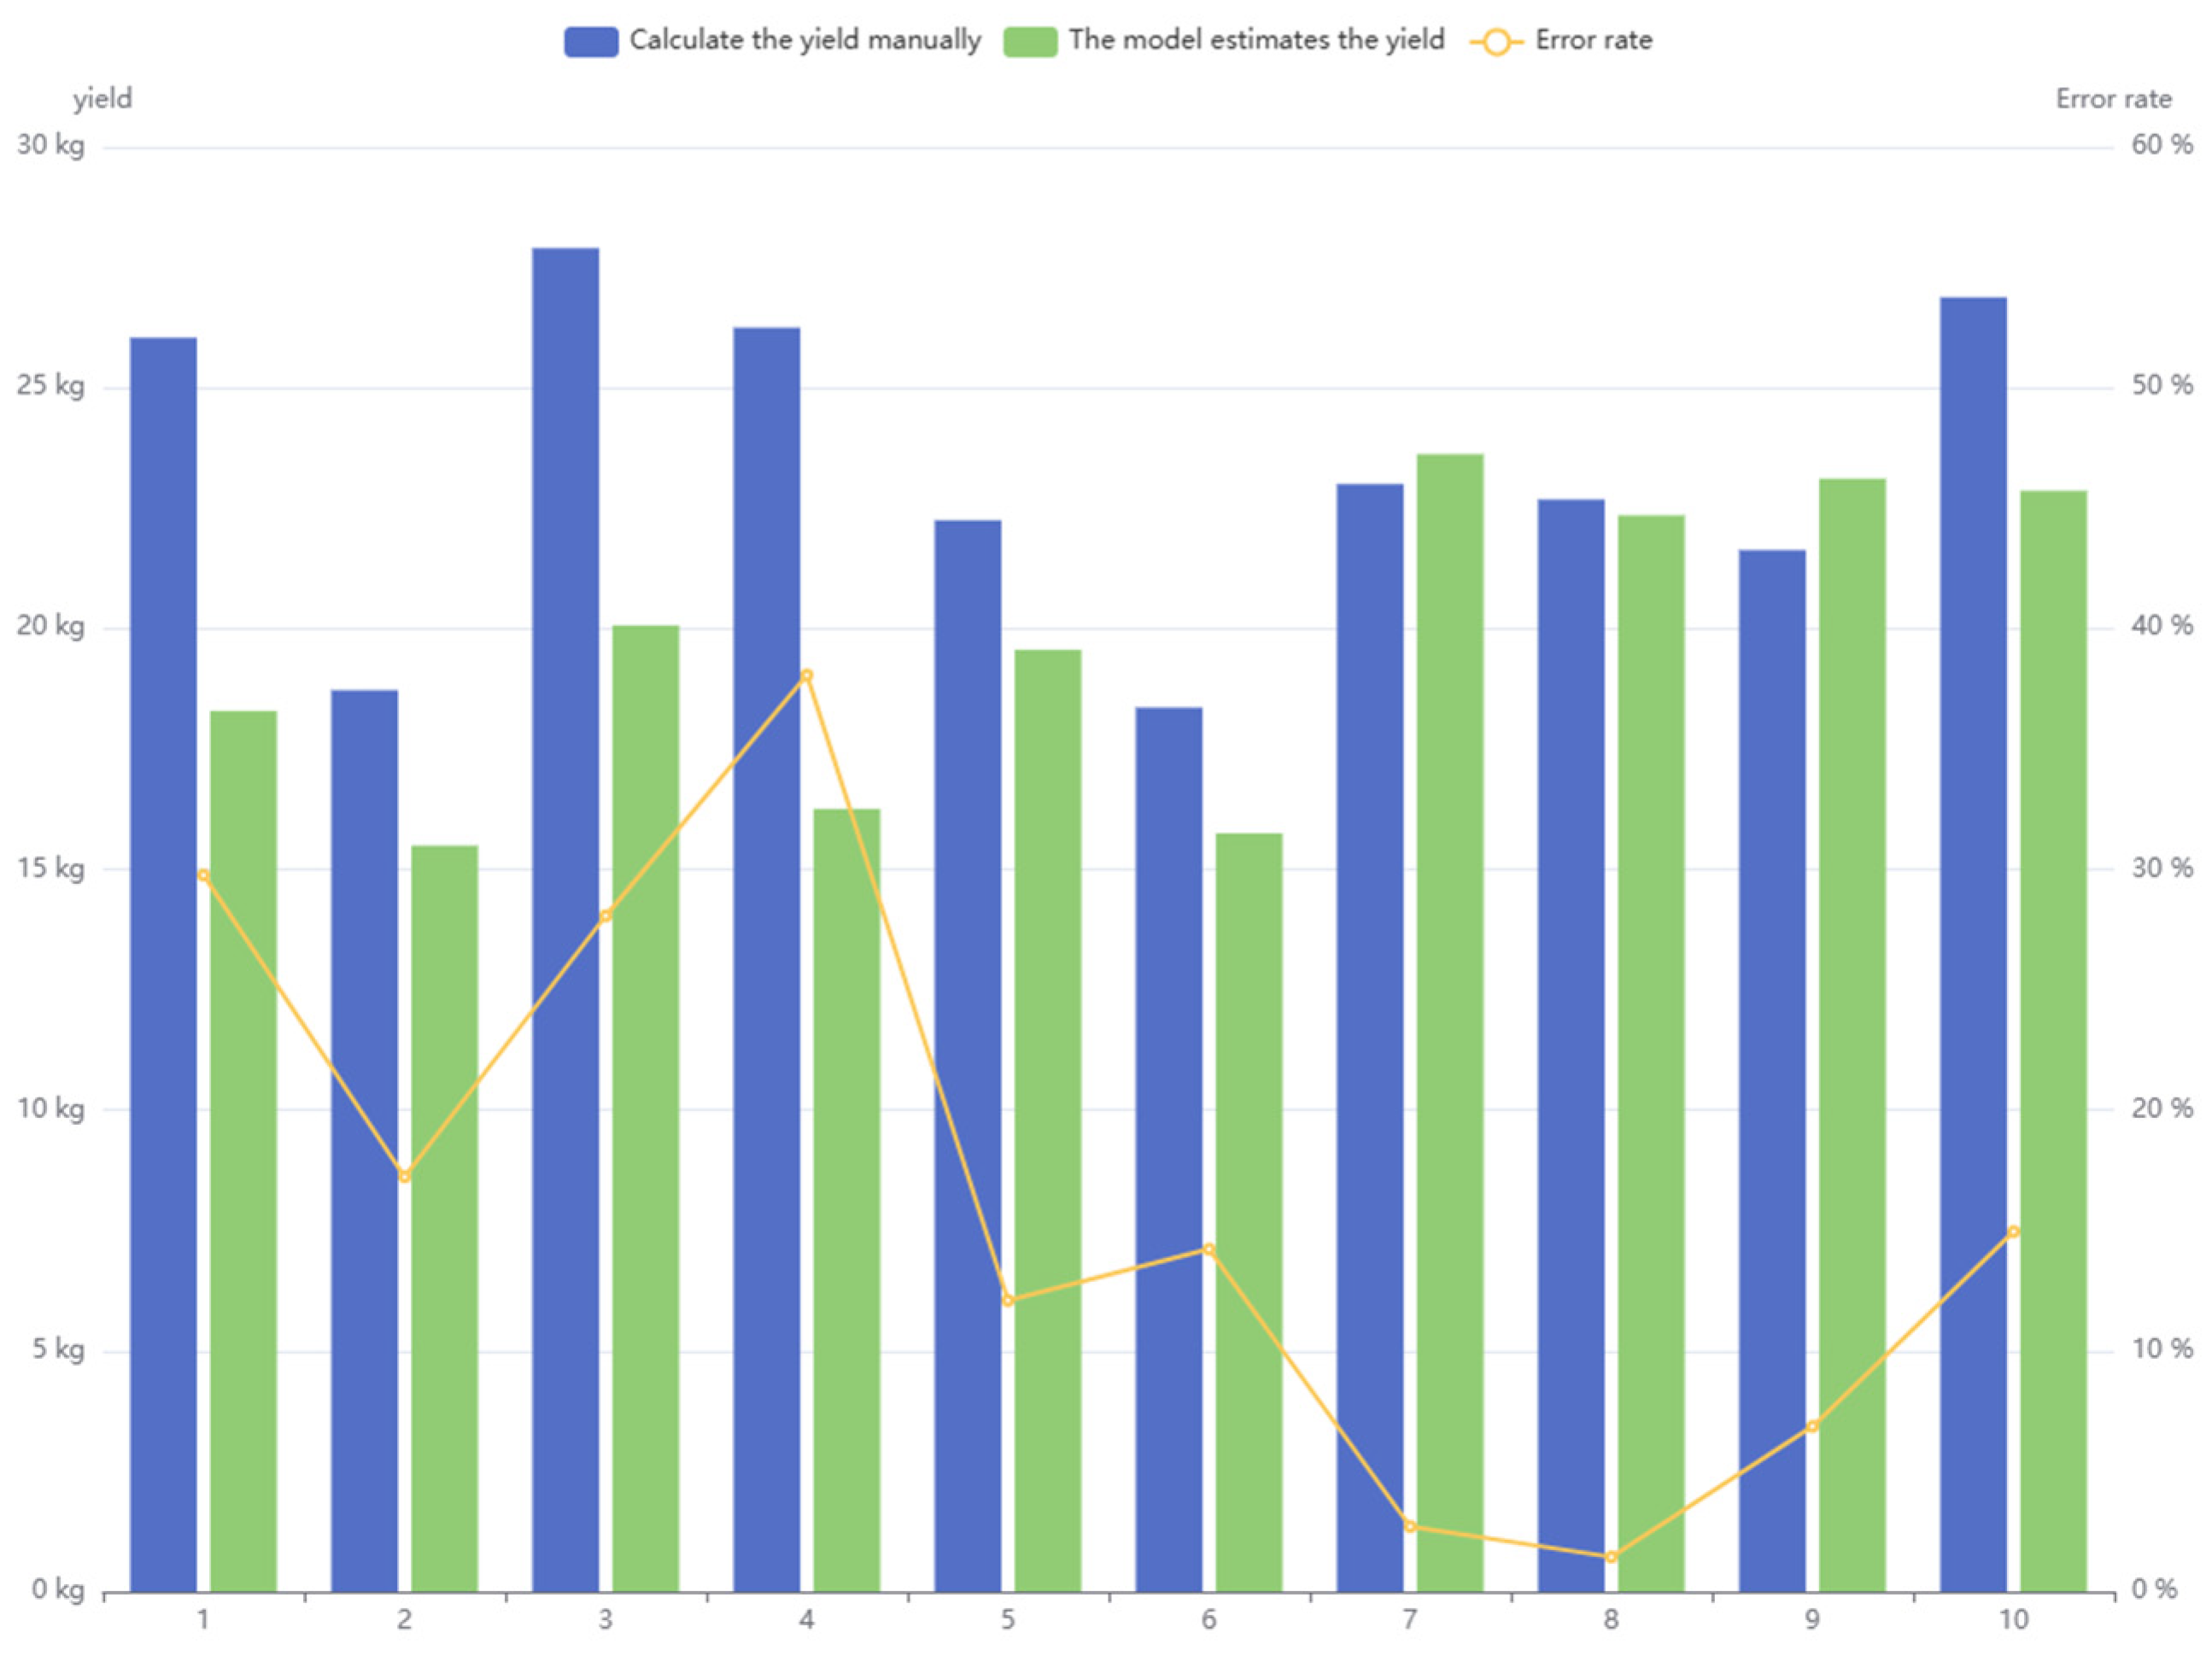
To evaluate the contribution of each module to the overall performance improvement of the APYOLO model, a series of ablation experiments was conducted, and the results are summarized in Table 4 below. The baseline YOLOv11 model achieved an accuracy of 84.2%, a recall rate of 69.1%, an mAP@0.5 of 79.8%, and an mAP@0.5–0.95 of 46.5%, with a total of 2,590,035 parameters, a computation value of 6.44 GFLOPs, and an inference speed of 10.2 ms.
In Experiment 2, incorporating the multi-scale channel attention (MSCA) mechanism resulted in significant improvements: accuracy increased by 4.3%, recall rose by 2.2%, mAP@0.5 improved by 2.3%, and mAP@0.5–0.95 increased by 2.0%. These gains are attributed to MSCA’s enhanced ability to extract multi-scale features, particularly for small or partially occluded apples. This improvement enabled the model to better handle complex orchard conditions, thereby increasing detection accuracy. However, the number of parameters increased by 5736, and the inference speed rose by 0.4 ms due to the added complexity of the attention mechanism.
In Experiment 3, the introduction of the EnMPDIoU loss function resulted in further gains. The recall rate increased by 2.6%, mAP@0.5 improved by 2.0%, and mAP@0.5–0.95 rose by 2.2%. The EnMPDIoU loss function enhanced the model’s ability to accurately localize apple targets, particularly in cases of partial occlusion and scale variations, which are common in orchard environments. These improvements were achieved without changing the number of parameters or inference speed. However, accuracy decreased slightly by 0.2%, likely due to the specialized focus of the loss function on improving localization at the expense of overall classification accuracy.
Finally, combining all modules in the APYOLO model resulted in a 0.8% improvement in accuracy, a 2.3% increase in recall, a 2.2% rise in mAP@0.5, and a 2.1% increase in mAP@0.5–0.95. The combined effect of MSCA and EnMPDIoU enhanced both detection and localization, ensuring more robust performance in diverse orchard environments. The number of parameters increased by 5736, and the inference speed increased by 0.4 ms, demonstrating that the improvements were achieved with a manageable computational cost.
These results clearly demonstrate the contribution of each module to the overall performance enhancement of the APYOLO model, with each improvement addressing specific challenges in apple detection and yield estimation. By integrating these innovations, the model achieves better accuracy, recall, and mAP values while maintaining computational efficiency, making it suitable for real-time applications in agricultural settings.

4. Discussion

A total of ten video files featuring fruit trees were used to evaluate the model’s performance. The detection results produced by the model were compared with those obtained through manual detection. The outcomes of this experimental comparison are presented in the following figure, providing a visual representation of the model’s performance relative to manual detection.
The results presented in this study clearly demonstrate the effectiveness of the APYOLO + DeepSORT model for apple detection and yield estimation. Figure 18 and Figure 19 illustrate a strong correlation between the apple counts detected by the model and those counted manually, with the model achieving a fitting coefficient of 0.96556. This high correlation indicates that the model performs reliably in apple counting tasks, making it well-suited for yield estimation in orchards. Moreover, as shown in Figure 19, the model’s error rate reaches a minimal 1.4% at its best, with an overall accuracy of approximately 84.45%, further emphasizing its ability to provide precise yield estimates. Generally, in field applications, the acceptable error rate for yield estimation ranges from 5% to 15%. Notably, the error rate of our model falls within this range, demonstrating that our results are consistent with industry standards for agricultural yield estimation.
While these results are promising, several limitations must be addressed. First, although APYOLO shows significant improvements over previous models, the increase in the model’s parameter scale and inference time remain an unavoidable trade-off. The addition of the multi-scale channel attention (MSCA) mechanism and the EnMPDIoU loss function, which significantly enhance detection performance, also contribute to an increase in computational cost. This trade-off must be carefully considered when deploying the model in real-time applications, particularly in resource-constrained environments. Future research should focus on optimizing the model’s computational efficiency without compromising detection accuracy.
Additionally, the introduction of the ROL line detection mechanism in the DeepSORT algorithm has led to a slight decrease in the model’s sensitivity. While the ROL line improves the model’s tracking and counting accuracy, it reduces responsiveness to minor movements and occlusions. This could affect overall tracking performance, particularly in dense orchards with heavy leaf coverage or overlapping fruits. Further refinement of the ROL line integration or the exploration of alternative tracking mechanisms could enhance the model’s robustness and sensitivity in such environments.
Furthermore, although the model performs well under the controlled conditions of this study, further research is needed to assess its performance in dynamic, real-world orchard environments. Future work could involve testing the model under varying environmental conditions, such as different lighting, weather, and orchard layouts. The potential incorporation of multimodal sensors, such as depth cameras or infrared sensors, could further improve the model’s ability to handle challenging conditions like occlusion and overlapping fruits, leading to more reliable yield estimation.
Despite these limitations, the APYOLO + DeepSORT model has shown considerable promise in apple detection and yield estimation, providing a robust framework for real-time agricultural applications. By addressing computational trade-offs and refining tracking mechanisms, future versions of the model can achieve even greater accuracy and applicability in complex orchard environments.

5. Conclusions

This study introduces the multi-scale channel attention (MSCA) mechanism and the EnMPDIoU loss function, seamlessly integrated with the DeepSORT tracking algorithm. This integration significantly enhances the accuracy of apple fruit recognition and improves yield estimation in complex orchard environments.
The synergy between these two innovative techniques and DeepSORT results in notable improvements in key performance metrics, including accuracy, recall, mAP@0.5, and mAP@0.5–0.95. These performance gains demonstrate the model’s superior ability to detect small and partially occluded apples, which are typically challenging in crop yield estimation. Notably, these improvements were achieved without increasing computational load, ensuring that the model remains efficient and scalable for practical applications.
A key contribution of this research is addressing the limitations of traditional yield estimation methods, which are labor-intensive and often reliant on subjective human judgment. By integrating computer vision and deep learning, the proposed model effectively overcomes challenges such as occlusion and target overlap—issues that have traditionally hindered accurate yield estimation. The MSCA mechanism improves the model’s ability to adapt to varying orchard conditions, enhancing detection accuracy even under partial occlusion and changing environmental factors.
Despite these advancements, challenges such as weather variations, varying degrees of occlusion, and hardware limitations remain in real-world applications. Orchard environments, in particular, are affected by weather changes (e.g., fog, thunderstorms, or sandstorms), which may reduce the model’s recognition accuracy. Since the dataset was collected under relatively stable conditions, future work will focus on expanding the dataset to include diverse weather scenarios, further improving the model’s robustness. Additionally, while the line-crossing detection mechanism helps reduce interference by focusing on targets crossing the line, it introduces computational complexity, potentially affecting tracking accuracy. Future research will aim to optimize the matching algorithm and integrate additional features to improve tracking performance in occluded environments.
Although the model performs well in real-time inference, its processing capabilities may be limited on resource-constrained platforms such as edge or embedded devices. While the model is highly efficient on standard hardware, future optimization efforts will explore lightweight algorithms, such as model pruning and distillation, and specific adjustments to optimize the YOLO architecture for embedded devices. These optimizations aim to ensure the model’s efficient deployment across various hardware platforms, including those with limited computational resources, facilitating practical, on-site applications in agricultural settings.
In conclusion, this research presents a novel, efficient, and reliable solution for apple yield estimation, significantly contributing to the advancement of agricultural automation technology. By addressing the challenges of crop detection and yield estimation in complex orchard environments, the proposed system improves accuracy and scalability for real-world applications. Future work will focus on further integrating apple detection technologies with apple-picking robotic arms, expanding the applicability of this technology and enhancing agricultural productivity.

Author Contributions

Conceptualization, Z.Y. and W.Z.; methodology, Z.Y., S.Z. and Y.W.; writing—original draft preparation, Z.Y.; writing—review and editing, X.L.; supervision, Y.W.; funding acquisition, X.L. All authors have read and agreed to the published version of the manuscript.

Funding

The authors acknowledge funding from the Joint Fund of China Agricultural University and Tarim University, ZNLH202402.

Institutional Review Board Statement

Not applicable.

Data Availability Statement

The data presented in this study are available on request from the corresponding author. The data are not publicly available because they will be used in the author’s graduate thesis.

Conflicts of Interest

The authors declare no conflicts of interest.

References

  1. Guo, Z.; Fu, H.; Wu, J.; Han, W.; Huang, W.; Zheng, W.; Li, T. Dynamic Task Planning for Multi-Arm Apple-Harvesting Robots Using LSTM-PPO Reinforcement Learning Algorithm. Agriculture 2025, 15, 588. [Google Scholar] [CrossRef]
  2. Tian, Y.; Yang, G.; Wang, Z.; Wang, H.; Li, E.; Liang, Z. Apple detection during different growth stages in orchards using the improved YOLO-V3 model. Comput. Electron. Agric. 2019, 157, 417–426. [Google Scholar] [CrossRef]
  3. Wang, D.; He, D. Channel pruned YOLO V5s-based deep learning approach for rapid and accurate apple fruitlet detection before fruit thinning. Biosyst. Eng. 2021, 210, 271–281. [Google Scholar] [CrossRef]
  4. Chen, W.; Zhang, J.; Guo, B.; Wei, Q.; Zhu, Z. An Apple Detection Method Based on Des-YOLO v4 Algorithm for Harvesting Robots in Complex Environment. Math. Probl. Eng. 2021, 2021, 7351470. [Google Scholar]
  5. Villacrés, J.; Viscaino, M.; Delpiano, J.; Vougioukas, S.; Cheein, F.A. Apple orchard production estimation using deep learning strategies: A comparison of tracking-by-detection algorithms. Comput. Electron. Agric. 2023, 204, 107513. [Google Scholar] [CrossRef]
  6. Gao, F.; Fang, W.; Sun, X.; Wu, Z.; Zhao, G.; Li, G.; Li, R.; Fu, L.; Zhang, Q. A novel apple fruit detection and counting methodology based on deep learning and trunk tracking in modern orchard. Comput. Electron. Agric. 2022, 197, 107000. [Google Scholar] [CrossRef]
  7. Jiang, P.; Ergu, D.; Liu, F.; Cai, Y.; Ma, B. A Review of Yolo algorithm developments. Procedia Comput. Sci. 2022, 199, 1066–1073. [Google Scholar] [CrossRef]
  8. Wang, X.; Yang, T.; Chen, Z.; Liu, J.; He, Y. NLDETR-YOLO: A decision-making method for apple thinning period. Sci. Hortic. 2025, 341, 113991. [Google Scholar]
  9. Wang, C.; Wang, Y.; Liu, S.; Lin, G.; He, P.; Zhang, Z.; Zhou, Y. Study on pear flowers detection performance of YOLO-PEFL model trained with synthetic target images. Front. Plant Sci. 2022, 13, 911473. [Google Scholar] [CrossRef]
  10. Shi, Y.; Duan, Z.; Qing, S.; Zhao, L.; Wang, F.; Yuwen, X. YOLOV9S-Pear: A lightweight YOLOV9S-Based improved model for young Red Pear Small-Target recognition. Agronomy 2024, 14, 2086. [Google Scholar] [CrossRef]
  11. Badgujar, C.M.; Poulose, A.; Gan, H. Agricultural object detection with you look only once (yolo) algorithm: A bibliometric and systematic literature review. arXiv 2024, arXiv:2401.10379. [Google Scholar] [CrossRef]
  12. Liu, Z.; Abeyrathna, R.R.D.; Sampurno, R.M.; Nakaguchi, V.M.; Ahamed, T. Faster-YOLO-AP: A lightweight apple detection algorithm based on improved YOLOv8 with a new efficient PDWConv in orchard. Comput. Electron. Agric. 2024, 223, 109118. [Google Scholar] [CrossRef]
  13. Sekharamantry, P.K.; Melgani, F.; Malacarne, J.; Ricci, R.; Silva, R.d.A.; Junior, J.M. A seamless deep learning approach for apple detection, depth estimation, and tracking using YOLO models enhanced by multi-head attention mechanism. Computers 2024, 13, 83. [Google Scholar] [CrossRef]
  14. Wei, P.; Yan, X.; Yan, W.; Sun, L.; Xu, J.; Yuan, H. Precise extraction of targeted apple tree canopy with YOLO-Fi model for advanced UAV spraying plans. Comput. Electron. Agric. 2024, 226, 109425. [Google Scholar] [CrossRef]
  15. Wu, H.; Mo, X.; Wen, S.; Wu, K.; Ye, Y.; Wang, Y.; Zhang, Y. DNE-YOLO: A method for apple fruit detection in Diverse Natural Environments. J. King Saud Univ. Comput. Inf. Sci. 2024, 36, 102220. [Google Scholar] [CrossRef]
  16. Zhang, S.; Wang, J.; Yang, K.; Guan, M. YOLO-ACT: An adaptive cross-layer integration method for apple leaf disease detection. Front. Plant Sci. 2024, 15, 1451078. [Google Scholar]
  17. Akdoğan, C.; Özer, T.; Oğuz, Y. PP-YOLO: Deep learning based detection model to detect apple and cherry trees in orchard based on Histogram and Wavelet preprocessing techniques. Comput. Electron. Agric. 2025, 232, 110052. [Google Scholar]
  18. Gwak, H.J.; Jeong, Y.; Chun, I.J.; Lee, C.H. Estimation of fruit number of apple tree based on YOLOv5 and regression model. J. IKEEE 2024, 28, 150–157. [Google Scholar]
  19. Lin, Y.; Huang, Z.; Liang, Y.; Liu, Y.; Jiang, W. Ag-Yolo: A rapid citrus fruit detection algorithm with global context fusion. Agriculture 2024, 14, 114. [Google Scholar] [CrossRef]
  20. Jing, J.; Zhang, S.; Sun, H.; Ren, R.; Cui, T. YOLO-PEM: A lightweight detection method for young “Okubo” peaches in complex orchard environments. Agronomy 2024, 14, 1757. [Google Scholar] [CrossRef]
  21. Sawant, K.; Shirwaikar, R.D.; Ugavekar, R.R.; Chodankar, C.S.; Tirodkar, B.N.; Padolkar, A.; Gawas, P. Fruit Identification using YOLO v8 and Faster R-CNN—A Commparative Study. In Proceedings of the 2024 International Conference on Distributed Computing and Optimization Techniques (ICDCOT), Bengaluru, India, 15–16 March 2024; IEEE: Piscataway, NJ, USA, 2024; pp. 1–6. [Google Scholar]
  22. Ali, M.L.; Zhang, Z. The YOLO framework: A comprehensive review of evolution, applications, and benchmarks in object detection. Computers 2024, 13, 336. [Google Scholar] [CrossRef]
  23. Karthikeyan, M.; Subashini, T.S.; Srinivasan, R.; Santhanakrishnan, C.; Ahilan, A. YOLOAPPLE: Augment Yolov3 deep learning algorithm for apple fruit quality detection. Signal Image Video Process. 2024, 18, 119–128. [Google Scholar]
  24. Gao, Z.; Zhou, K.; Hu, Y. Apple maturity detection based on improved YOLOv8. In Proceedings of the Fourth International Conference on Computer Vision, Application, and Algorithm (CVAA 2024), Chengdu, China, 11–13 October 2024; SPIE: Bellingham, DC, USA, 2025; Volume 13486, pp. 539–544. [Google Scholar]
  25. Wang, D.; Song, H.; Wang, B. YO-AFD: An improved YOLOv8-based deep learning approach for rapid and accurate apple flower detection. Front. Plant Sci. 2025, 16, 1541266. [Google Scholar]
  26. Han, B.; Zhang, J.; Almodfer, R.; Wang, Y.; Sun, W.; Bai, T.; Dong, L.; Hou, W. Research on Innovative Apple Grading Technology Driven by Intelligent Vision and Machine Learning. Foods 2025, 14, 258. [Google Scholar] [CrossRef]
  27. Bai, Y.; Yu, J.; Yang, S.; Ning, J. An improved YOLO algorithm for detecting flowers and fruits on strawberry seedlings. Biosyst. Eng. 2024, 237, 1–12. [Google Scholar]
  28. Zou, H.; Lv, P.; Zhao, M. Detection of Apple Leaf Diseases Based on LightYOLO-AppleLeafDx. Plants 2025, 14, 599. [Google Scholar] [CrossRef]
  29. Zhang, M.; Ye, S.; Zhao, S.; Wang, W.; Xie, C. Pear Object Detection in Complex Orchard Environment Based on Improved YOLO11. Symmetry 2025, 17, 255. [Google Scholar] [CrossRef]
  30. Del Brio, D.; Tassile, V.; Bramardi, S.J.; Fernández, D.E.; Reeb, P.D. Apple (Malus domestica) and pear (Pyrus communis) yield prediction after tree image analysis. Rev. Fac. Cienc. Agrar. UNCuyo 2023, 55, 1–11. [Google Scholar] [CrossRef]
  31. Huang, Z.; Zhang, X.; Wang, H.; Wei, H.; Zhang, Y.; Zhou, G. Pear Fruit Detection Model in Natural Environment Based on Lightweight Transformer Architecture. Agriculture 2024, 15, 24. [Google Scholar] [CrossRef]
  32. Zhang, Z.; Lei, X.; Huang, K.; Sun, Y.; Zeng, J.; Xyu, T.; Yuan, Q.; Qi, Y.; Herbst, A.; Lyu, X. Multi-Scenario pear tree inflorescence detection based on improved YOLOv7 object detection algorithm. Front. Plant Sci. 2024, 14, 1330141. [Google Scholar]
  33. Hou, Q.; Zhou, D.; Feng, J. Coordinate attention for efficient mobile network design. In Proceedings of the IEEE/CVF Conference on Computer Vision and Pattern Recognition, Nashville, TN, USA, 19–25 June 2021; pp. 13713–13722. [Google Scholar]
  34. Yang, R.; He, Y.; Hu, Z.; Gao, R.; Yang, H. CA-YOLOv5: A YOLO model for apple detection in the natural environment. Syst. Sci. Control Eng. 2024, 12, 2278905. [Google Scholar]
  35. Ma, S.; Xu, Y. Mpdiou: A loss for efficient and accurate bounding box regression. arXiv 2023, arXiv:2307.07662. [Google Scholar]
  36. Du, Y.; Zhao, Z.; Song, Y.; Zhao, Y.; Su, F.; Gong, T.; Meng, H. Strongsort: Make deepsort great again. IEEE Trans. Multimed. 2023, 25, 8725–8737. [Google Scholar] [CrossRef]
  37. Azhar, M.I.H.; Zaman, F.H.K.; Tahir, N.M.; Hashim, H. People tracking system using DeepSORT. In Proceedings of the 2020 10th IEEE International Conference on Control System, Computing and Engineering (ICCSCE), Penang, Malaysia, 21–22 August 2020; IEEE: Piscataway, NJ, USA, 2020; pp. 137–141. [Google Scholar]
  38. Pereira, R.; Carvalho, G.; Garrote, L.; Nunes, U.J. Sort and deep-SORT based multi-object tracking for mobile robotics: Evaluation with new data association metrics. Appl. Sci. 2022, 12, 1319. [Google Scholar] [CrossRef]
  39. Yang, F.; Zhang, X.; Liu, B. Video object tracking based on YOLOv7 and DeepSORT. arXiv 2022, arXiv:2207.12202. [Google Scholar]
  40. Parico, A.I.B.; Ahamed, T. Real time pear fruit detection and counting using YOLOv4 models and deep SORT. Sensors 2021, 21, 4803. [Google Scholar] [CrossRef] [PubMed]
  41. Itakura, K.; Narita, Y.; Noaki, S.; Hosoi, F. Automatic pear and apple detection by videos using deep learning and a Kalman filter. Osa Contin. 2021, 4, 1688–1695. [Google Scholar] [CrossRef]
  42. Kodors, S.; Lacis, G.; Zhukov, V.; Bartulsons, T. Pear and apple recognition using deep learning and mobile. Eng. Rural Dev. 2020, 20, 1795–1800. [Google Scholar]
  43. Wu, Z.; Sun, X.; Jiang, H.; Mao, W.; Li, R.; Andriyanov, N.; Soloviev, V.; Fu, L. NDMFCS: An automatic fruit counting system in modern apple orchard using abatement of abnormal fruit detection. Comput. Electron. Agric. 2023, 211, 108036. [Google Scholar] [CrossRef]
  44. Pan, S.; Ahamed, T. Pear Recognition System in an Orchard from 3D Stereo Camera Datasets Using Deep Learning Algorithms. In IoT and AI in Agriculture: Self-Sufficiency in Food Production to Achieve Society 5.0 and SDG’s Globally; Springer Nature: Singapore, 2023; pp. 219–252. [Google Scholar]
  45. Ma, J.; Liu, B.; Ji, L.; Zhu, Z.; Wu, Y.; Jiao, W. Field-Scale yield prediction of winter wheat under different irrigation regimes based on dynamic fusion of multimodal UAV imagery. Int. J. Appl. Earth Obs. Geoinf. 2023, 118, 103292. [Google Scholar] [CrossRef]
  46. Maimaitijiang, M.; Sagan, V.; Sidike, P.; Hartling, S.; Esposito, F.; Fritschi, F.B. Soybean yield prediction from UAV using multimodal data fusion and deep learning. Remote Sens. Environ. 2020, 237, 111599. [Google Scholar]
  47. Zhou, W.; Song, C.; Liu, C.; Fu, Q.; An, T.; Wang, Y.; Sun, X.; Wen, N.; Tang, H.; Wang, Q. A Prediction Model of Maize Field Yield Based on the Fusion of Multitemporal and Multimodal UAV Data: A Case Study in Northeast China. Remote Sens. 2023, 15, 3483. [Google Scholar] [CrossRef]
  48. Shamsuddin, D.; Danilevicz, M.F.; Al-Mamun, H.A.; Bennamoun, M.; Edwards, D. Multimodal Deep Learning Integration of Image, Weather, and Phenotypic Data Under Temporal Effects for Early Prediction of Maize Yield. Remote Sens. 2024, 16, 4043. [Google Scholar] [CrossRef]
  49. Cheng, T.; Li, M.; Quan, L.; Song, Y.; Lou, Z.; Li, H.; Du, X. A multimodal and temporal network-based yield Assessment Method for different heat-tolerant genotypes of wheat. Agronomy 2024, 14, 1694. [Google Scholar] [CrossRef]
  50. Kim, J.; Cho, J. Exploring a multimodal mixture-of-YOLOs framework for advanced real-time object detection. Appl. Sci. 2020, 10, 612. [Google Scholar] [CrossRef]
  51. Fei, X.; Guo, M.; Li, Y.; Yu, R.; Sun, L. ACDF-YOLO: Attentive and Cross-Differential Fusion Network for Multimodal Remote Sensing Object Detection. Remote Sens. 2024, 16, 3532. [Google Scholar] [CrossRef]
Figure 1. Collection site.
Agriculture 15 00765 g001
Figure 2. Display of some dataset images.
Agriculture 15 00765 g002
Figure 3. Display of the weights of some apples.
Agriculture 15 00765 g003
Figure 4. Images after enhancement.
Agriculture 15 00765 g004
Figure 5. Original pictures and annotated files.
Agriculture 15 00765 g005
Figure 6. Network structure diagram of APYOLO.
Agriculture 15 00765 g006
Figure 7. Comparative architecture of attention modules: (a) SE (squeeze-and-excitation) block with channel-wise recalibration, (b) CBAM (convolutional block attention module) implementing sequential channel-spatial attention, (c) CA (coordinate attention) incorporating directional position encoding.
Agriculture 15 00765 g007
Figure 8. Structure diagram of the MSCA (multi-scale channel attention) module.
Agriculture 15 00765 g008
Figure 9. The factors of L M P D I o U .
Agriculture 15 00765 g009
Figure 10. Structure diagram of the EnMPDIoU module.
Agriculture 15 00765 g010
Figure 11. Overall flow chart of DeepSORT.
Agriculture 15 00765 g011
Figure 12. DeepSORT architecture.
Agriculture 15 00765 g012
Figure 13. Apple recognition and counting system based on APYOLO and improved DeepSORT.
Agriculture 15 00765 g013
Figure 14. Model memory rectangular tree map.
Agriculture 15 00765 g014
Figure 15. Recognition effect of different models on severely occluded scenes.
Agriculture 15 00765 g015
Figure 16. Recognition effect of different models on fruit overlapping and small target scenes.
Agriculture 15 00765 g016
Figure 17. Some comparative effect diagrams of mainstream improved models.
Agriculture 15 00765 g017
Figure 18. Fitting of manual detection and model detection.
Agriculture 15 00765 g018
Figure 19. Comparison between manual yield estimation and model yield estimation.
Agriculture 15 00765 g019
Table 1. Information on fruit trees.
Number of Fruit TreesNumber of FruitsAverage Weight of Fruits (kg)
1840.31
2720.26
3930.30
4750.35
5890.25
6680.27
71150.20
81080.21
91030.21
10720.31
Table 2. Experimental parameters.
ParameterNumerical Value
OptimizerSGD
Initial learning rate0.01
Momentum factor0.937
Weight decay0.0005
Patience30
Batch size32
Image size640 × 640
Table 3. Apple recognition of different models in complex environments.
ModelP/%R/%mAP@0.5/%mAP@0.5–0.95/%ParamGFLOPsInference/ms
APYOLO85.071.482.048.62,595,7716.4410.6
YOLOv583.968.979.446.02,188,0195.929.36
YOLOv684.367.578.545.24,159,84311.569.55
YOLOv884.569.880.646.92,690,4036.9414.26
YOLOv9t85.069.480.146.81,765,1236.7026.96
YOLOv10n82.468.979.245.72,707,4308.3911.87
YOLOv10s83.069.979.946.18,067,12624.7717.74
YOLOv1184.269.179.846.52,590,0356.4410.20
Table 4. Experimental comparison of different modules of APYOLO.
NumberMSCAEnMPDIoUP/%R/%mAP@0.5/%mAP@0.5–0.95/%ParamGFLOPsInference/ms
1 84.269.179.846.52,590,0356.4410.2
2 88.571.382.148.52,595,7716.4410.6
3 84.071.781.848.72,590,0356.4410.2
485.071.482.048.62,595,7716.4410.6
Note: √ indicates that the module is integrated into the model.
Disclaimer/Publisher’s Note: The statements, opinions and data contained in all publications are solely those of the individual author(s) and contributor(s) and not of MDPI and/or the editor(s). MDPI and/or the editor(s) disclaim responsibility for any injury to people or property resulting from any ideas, methods, instructions or products referred to in the content.

