
Quantitative Analysis of the Labeling Quality of Biological Images for Semantic Segmentation Based on Attribute Agreement Analysis


Abstract

1. Introduction
2. Materials and Methods
2.1. Image Dataset
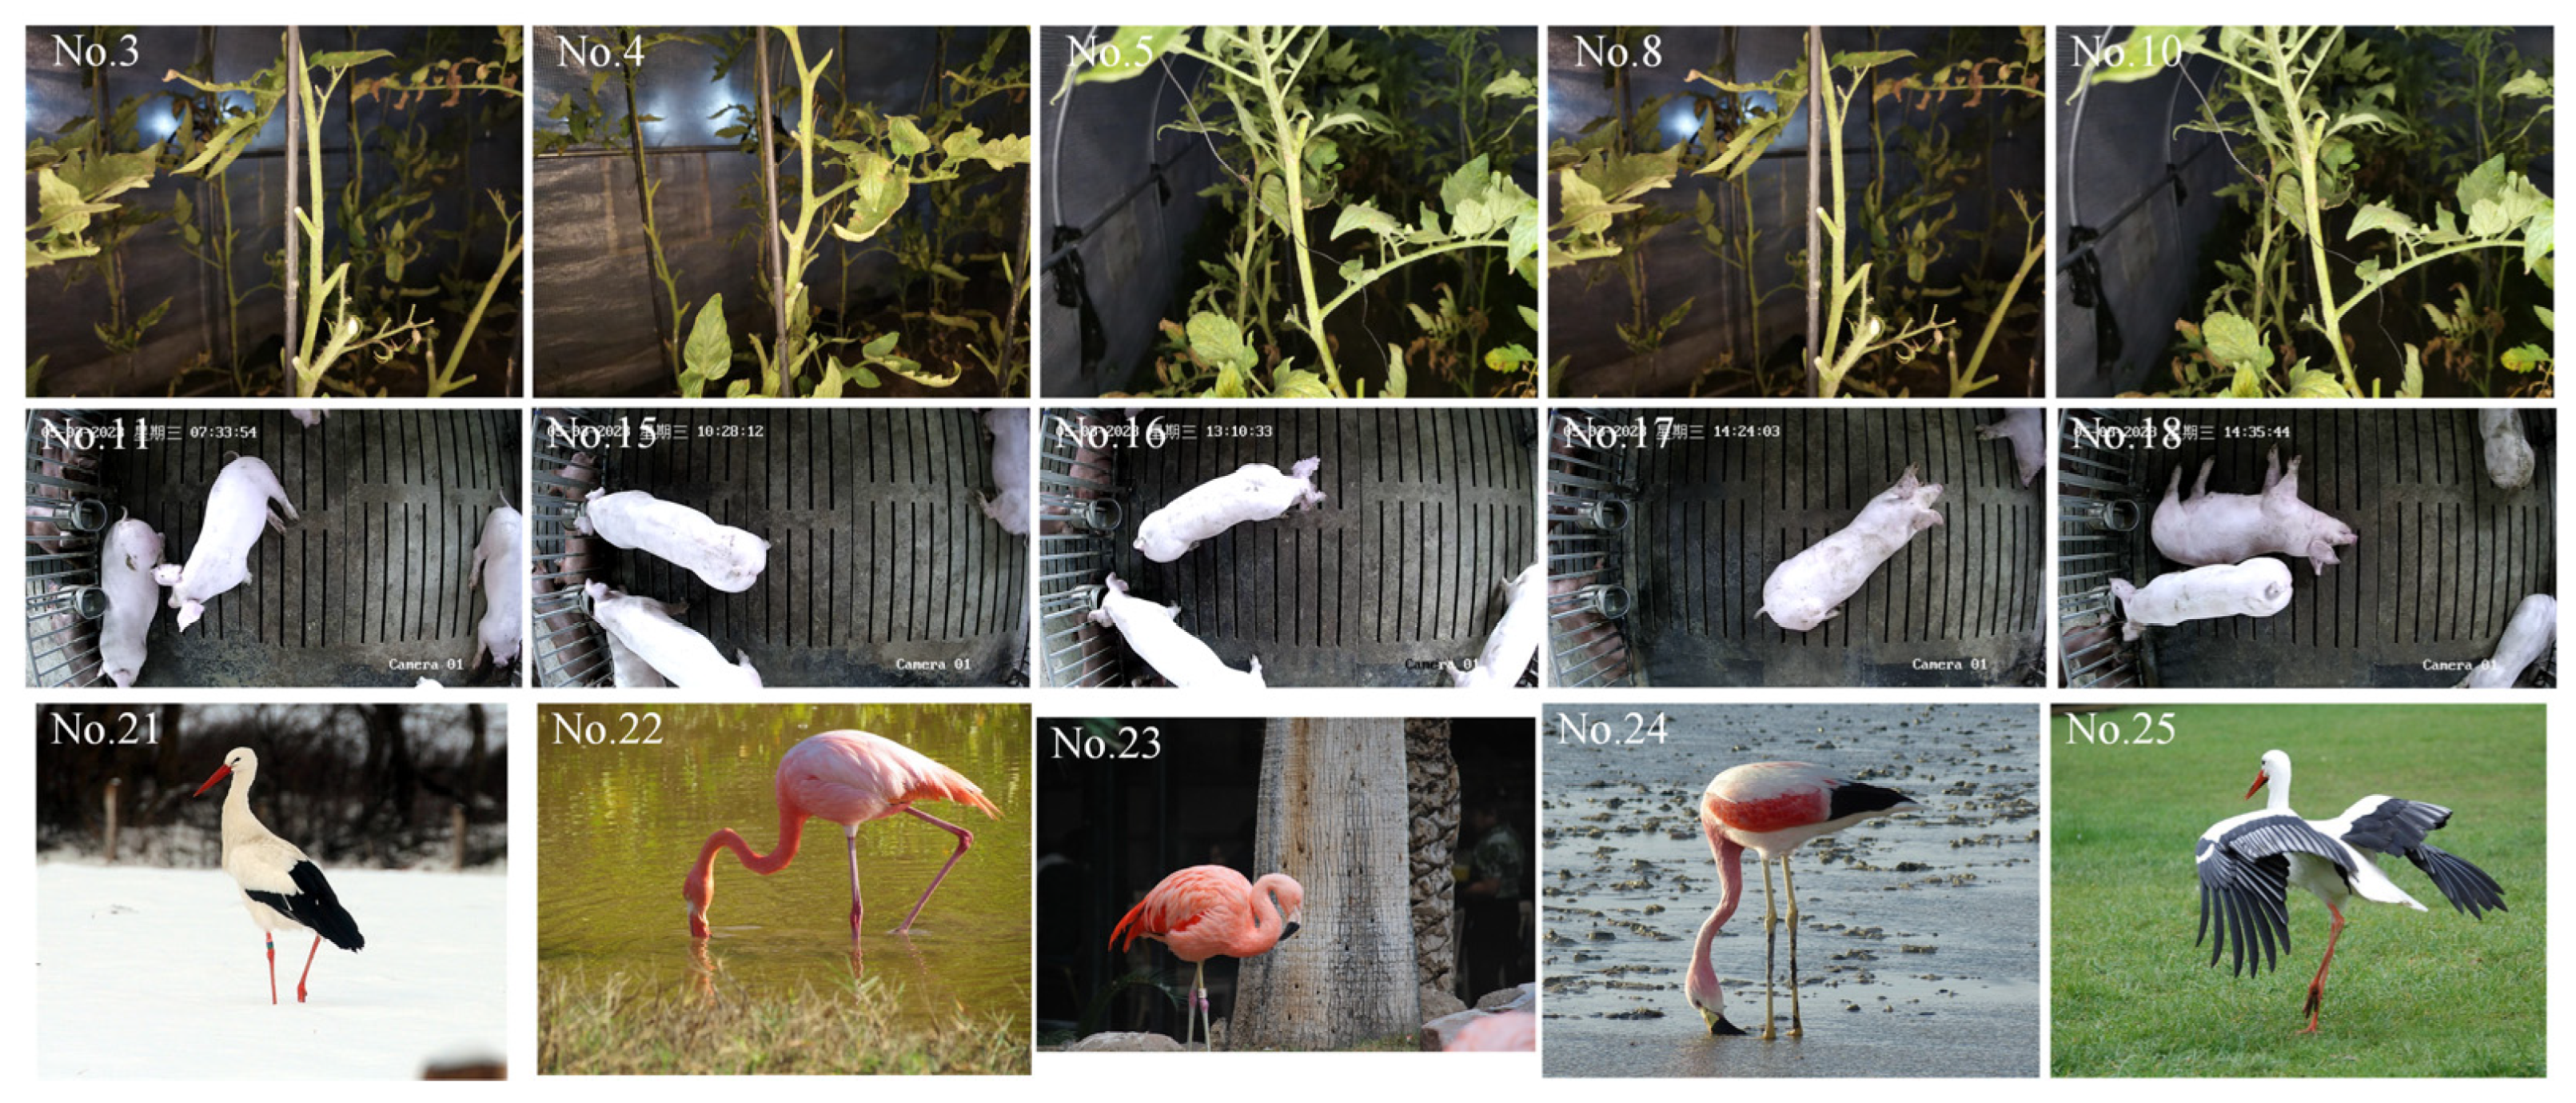
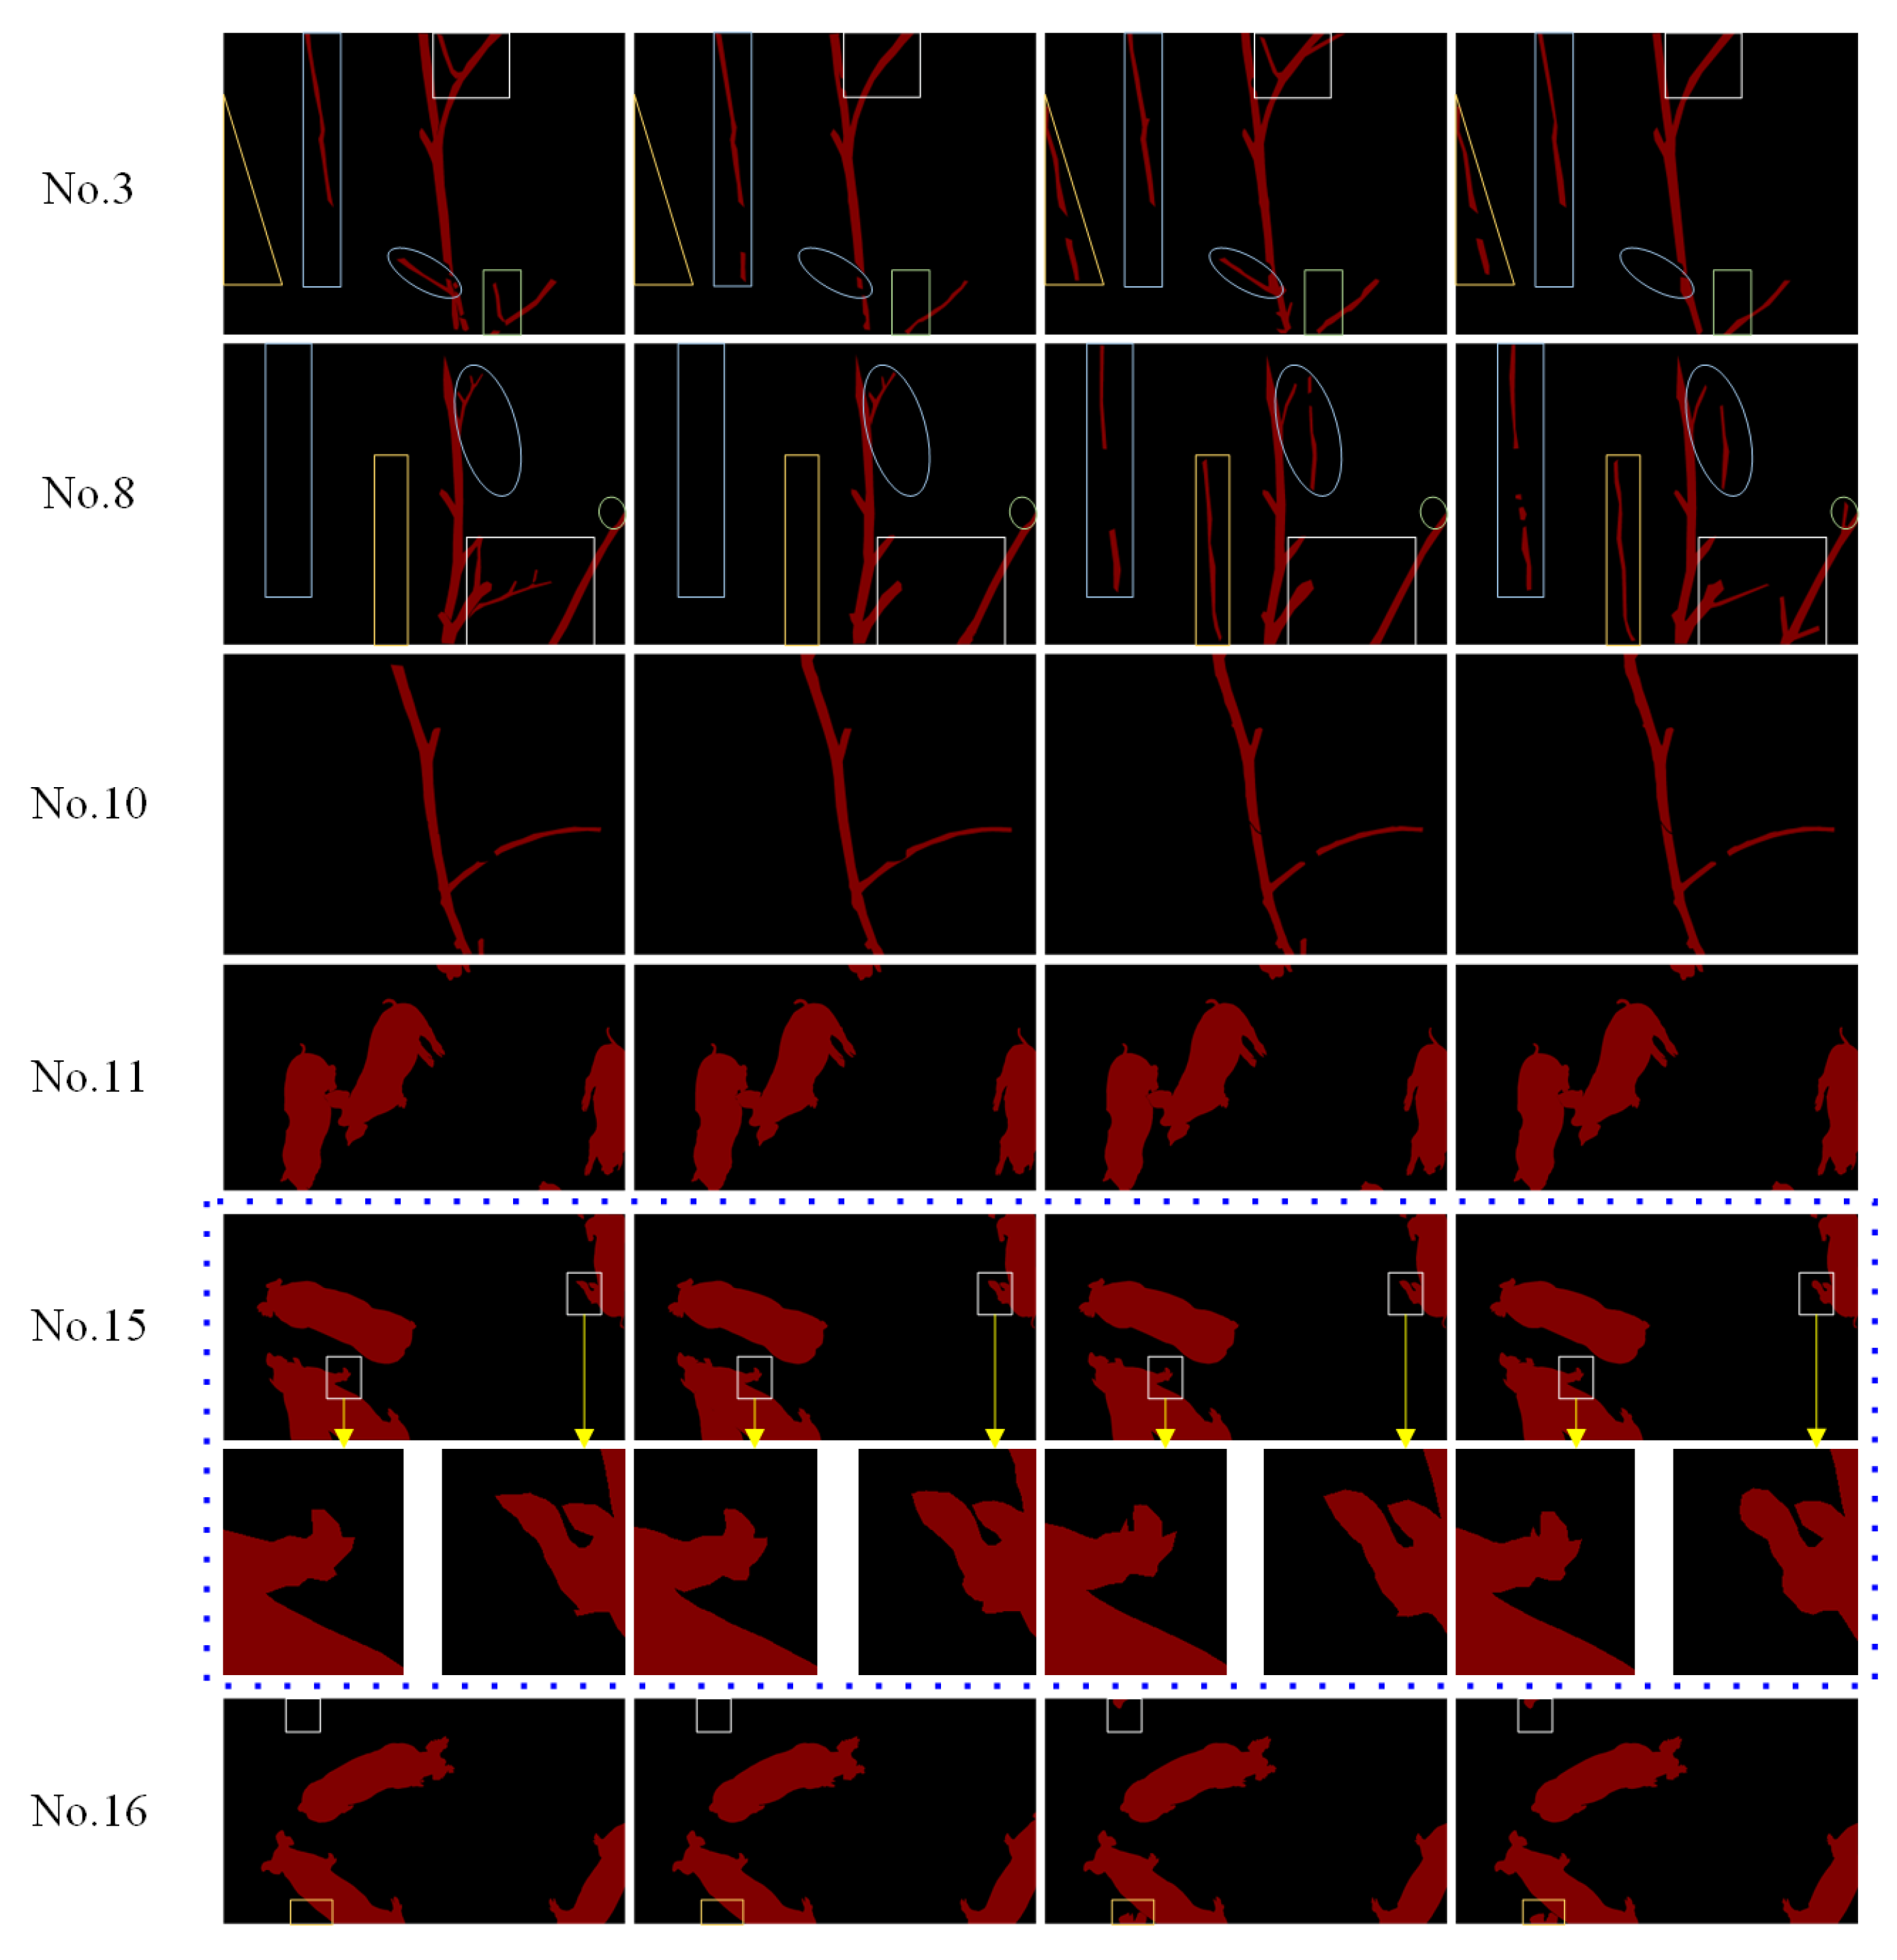
2.1.1. Biological Images for Semantic Segmentation
2.1.2. Image Labeling
2.2. Programming Tools and Environment
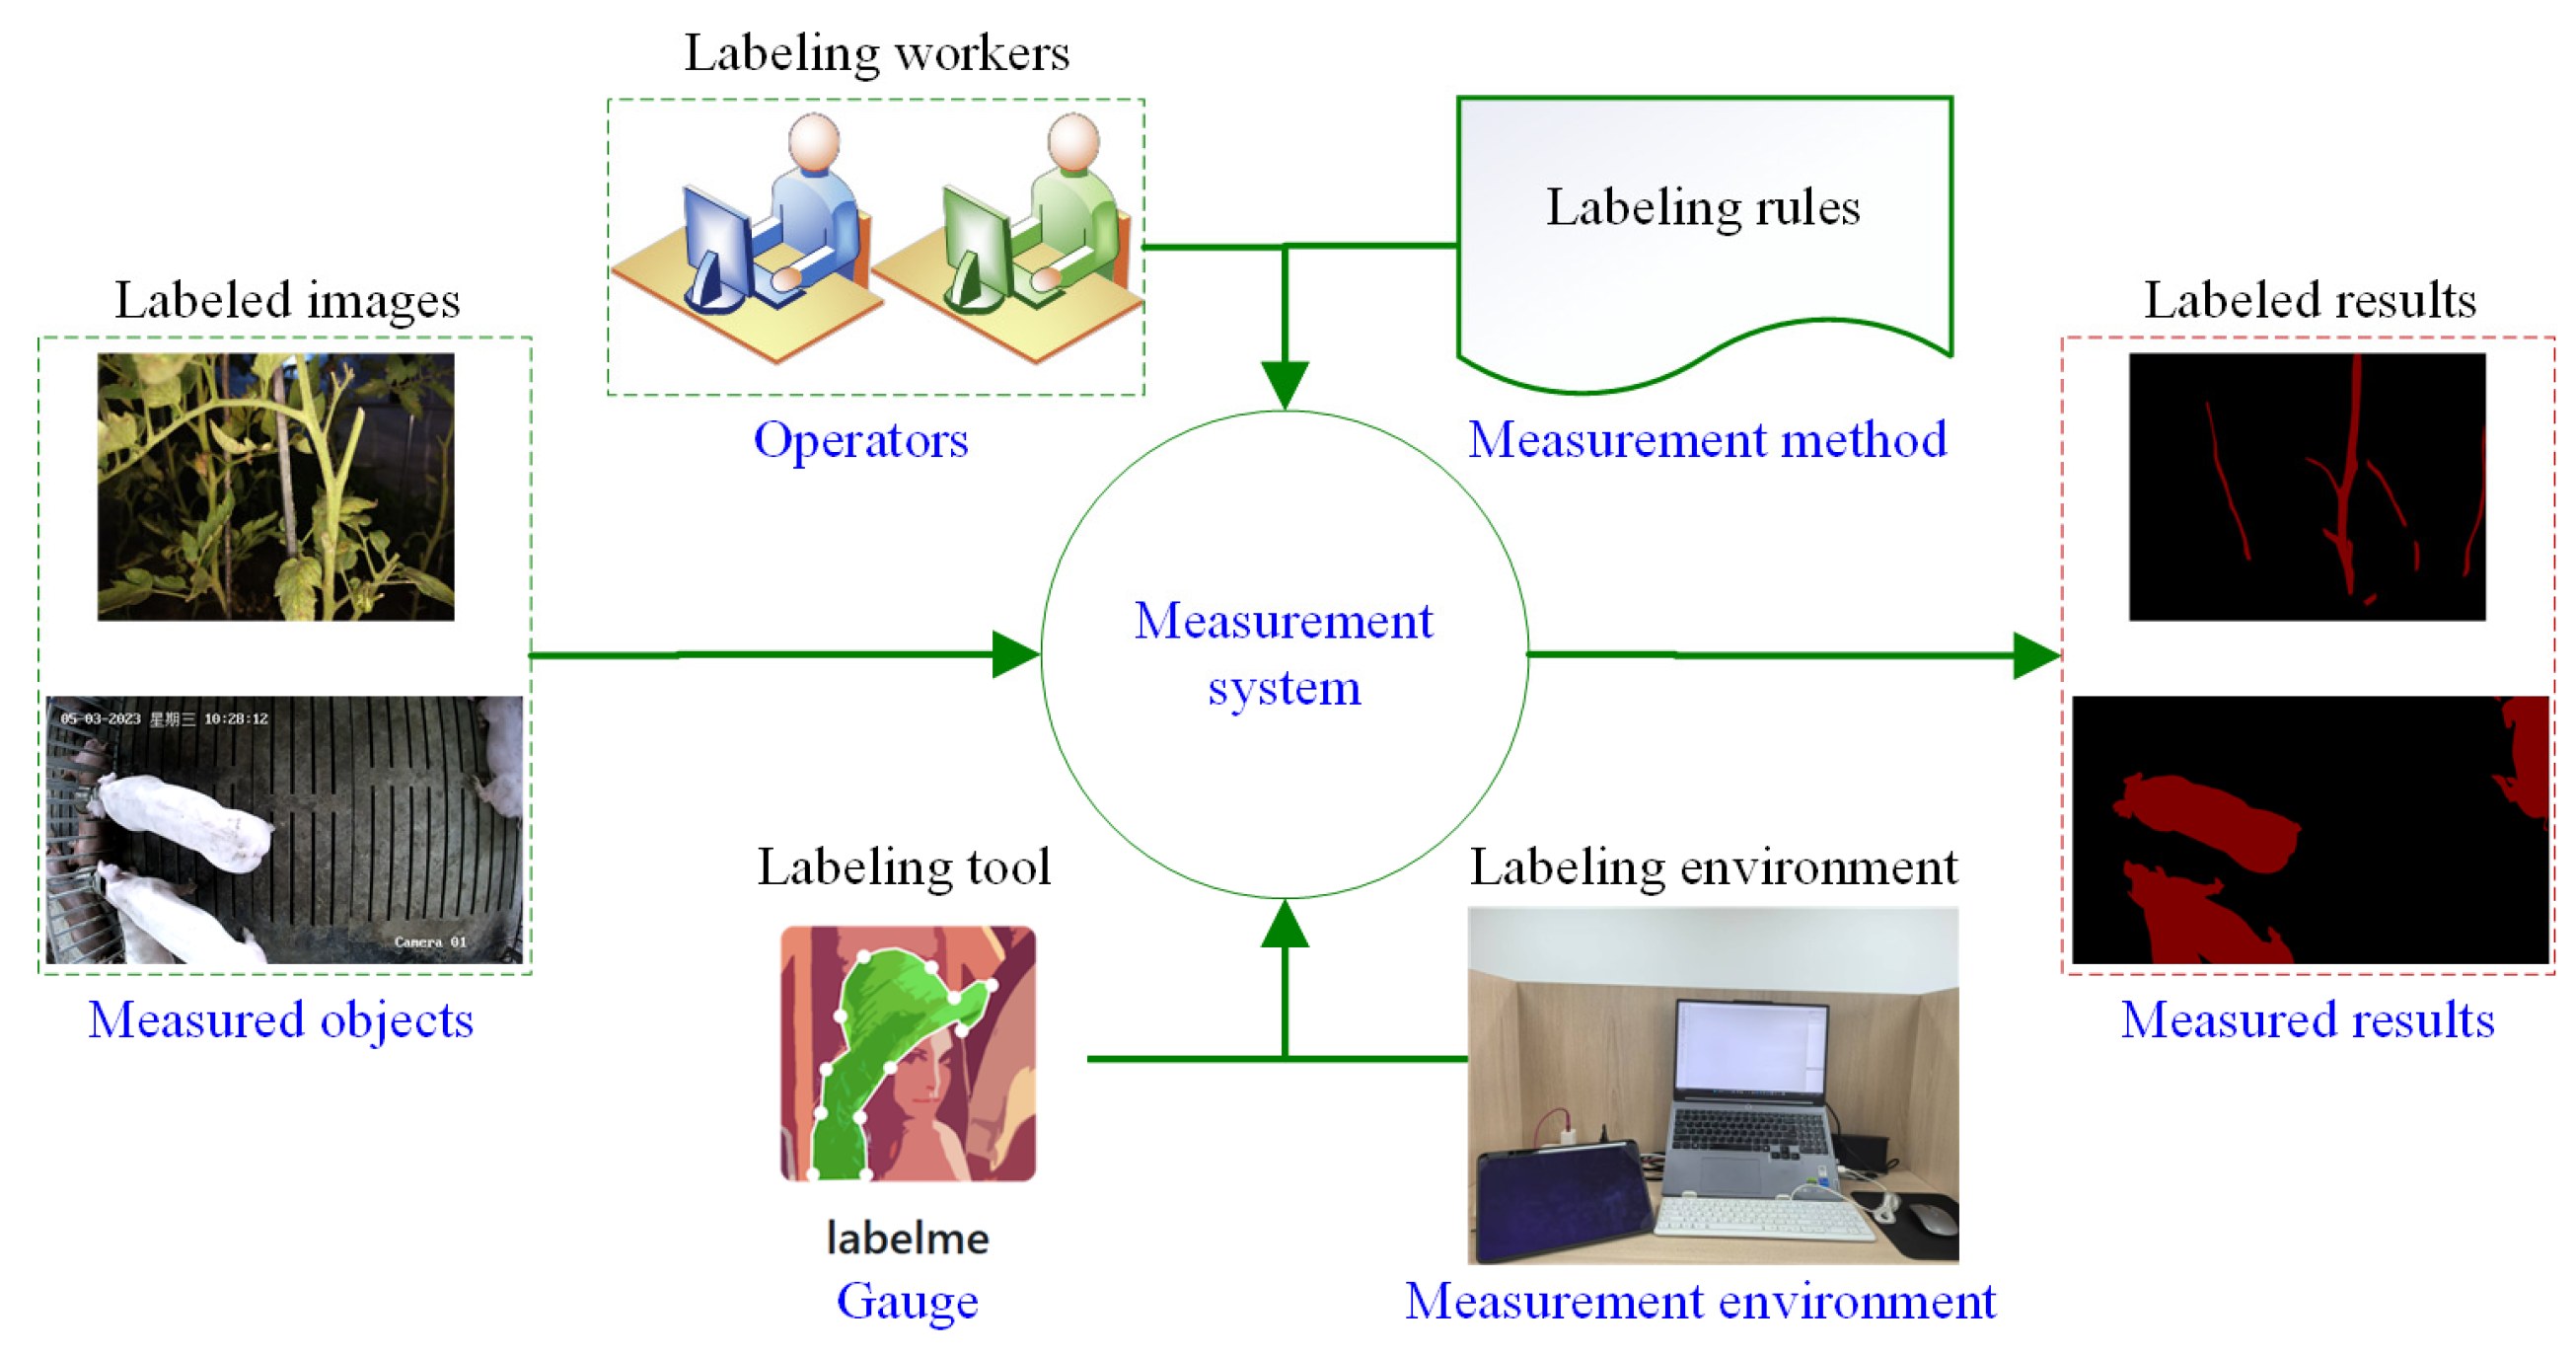
2.3. Measurement System Analysis
2.4. Quantitative Analysis Method for Labeling Variation
2.4.1. Attribute Agreement Analysis Method Based on Kappa Values
- (1)
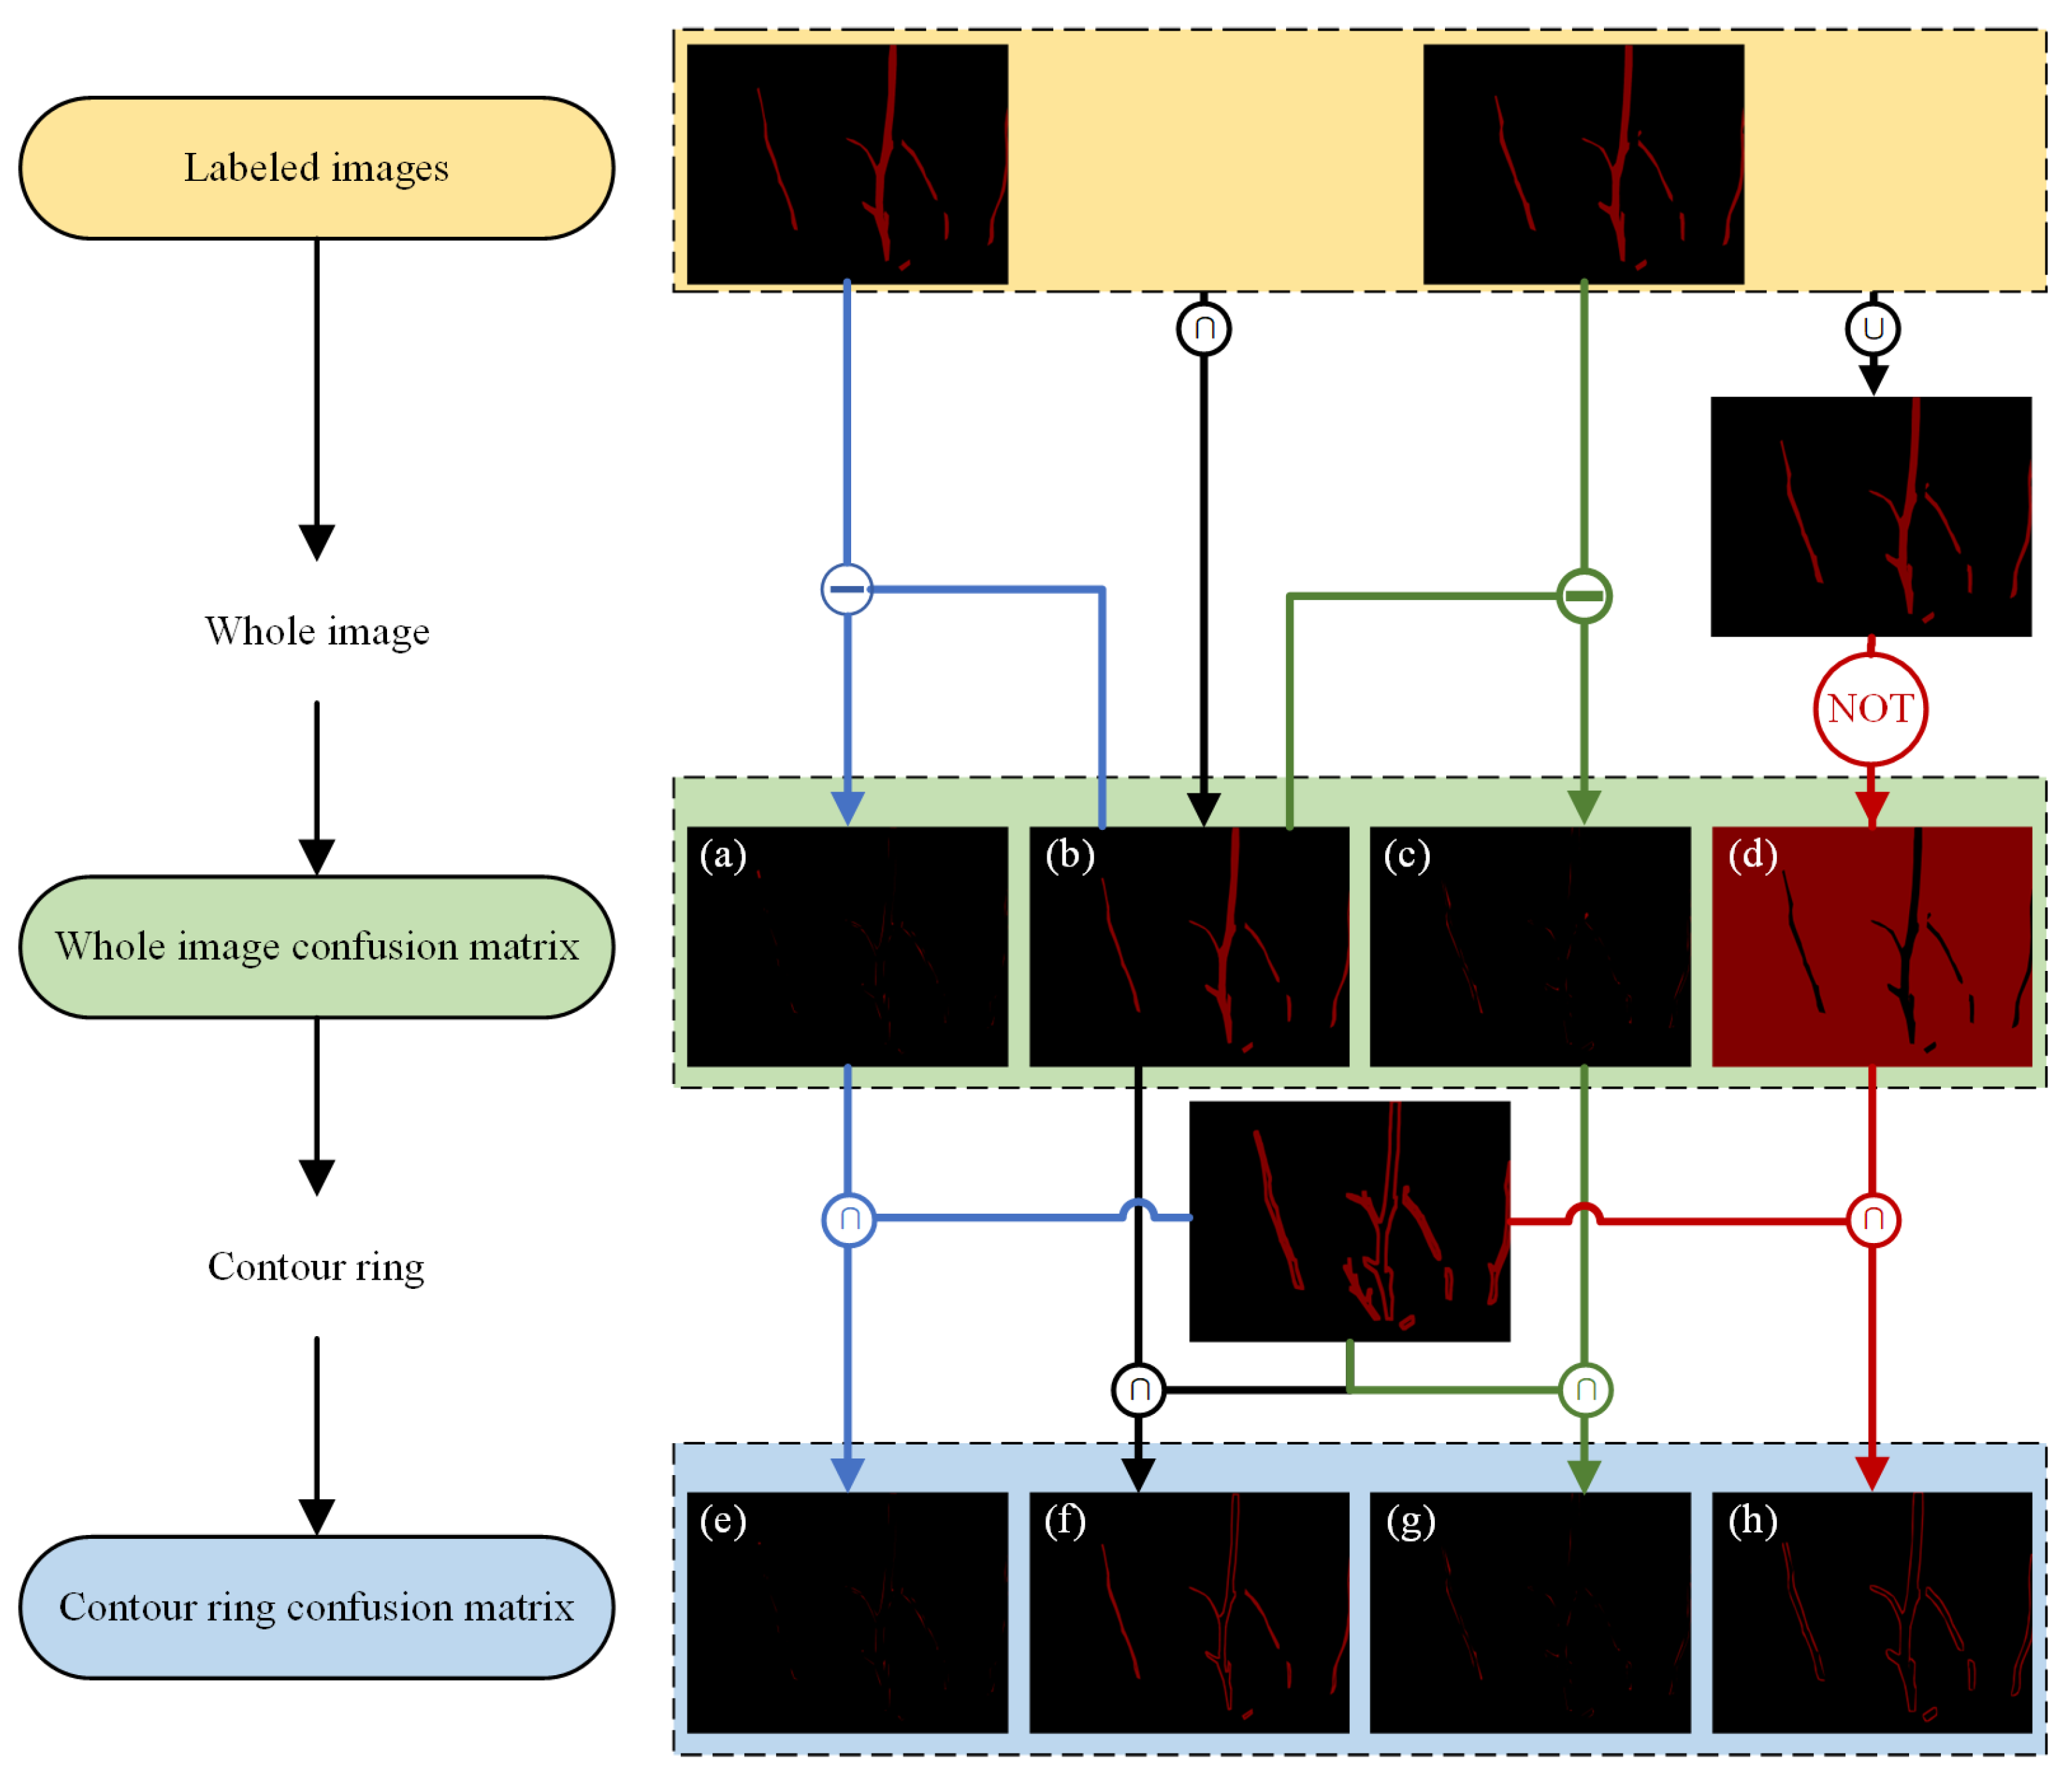
- Confusion matrix
- (a)
- Load two pixel-wise labeled binary images (foreground = 1, background = 0);
- (b)
- Iterate over each pixel and compare the two labeled values;
- (c)
- If both are foreground (1,1), increment TP by 1;
- (d)
- If both are background (0,0), increment TN by 1;
- (e)
- If A is background (0) and B is foreground (1), increment FP by 1;
- (f)
- If A is foreground (1) and B is background (0), increment FN by 1;
- (g)
- Compute the final confusion matrix and calculate the Kappa value.
- (2)
- Contour ring
- (3)
- Kappa values
- (4)
- Quantitative evaluation criteria for image annotation quality
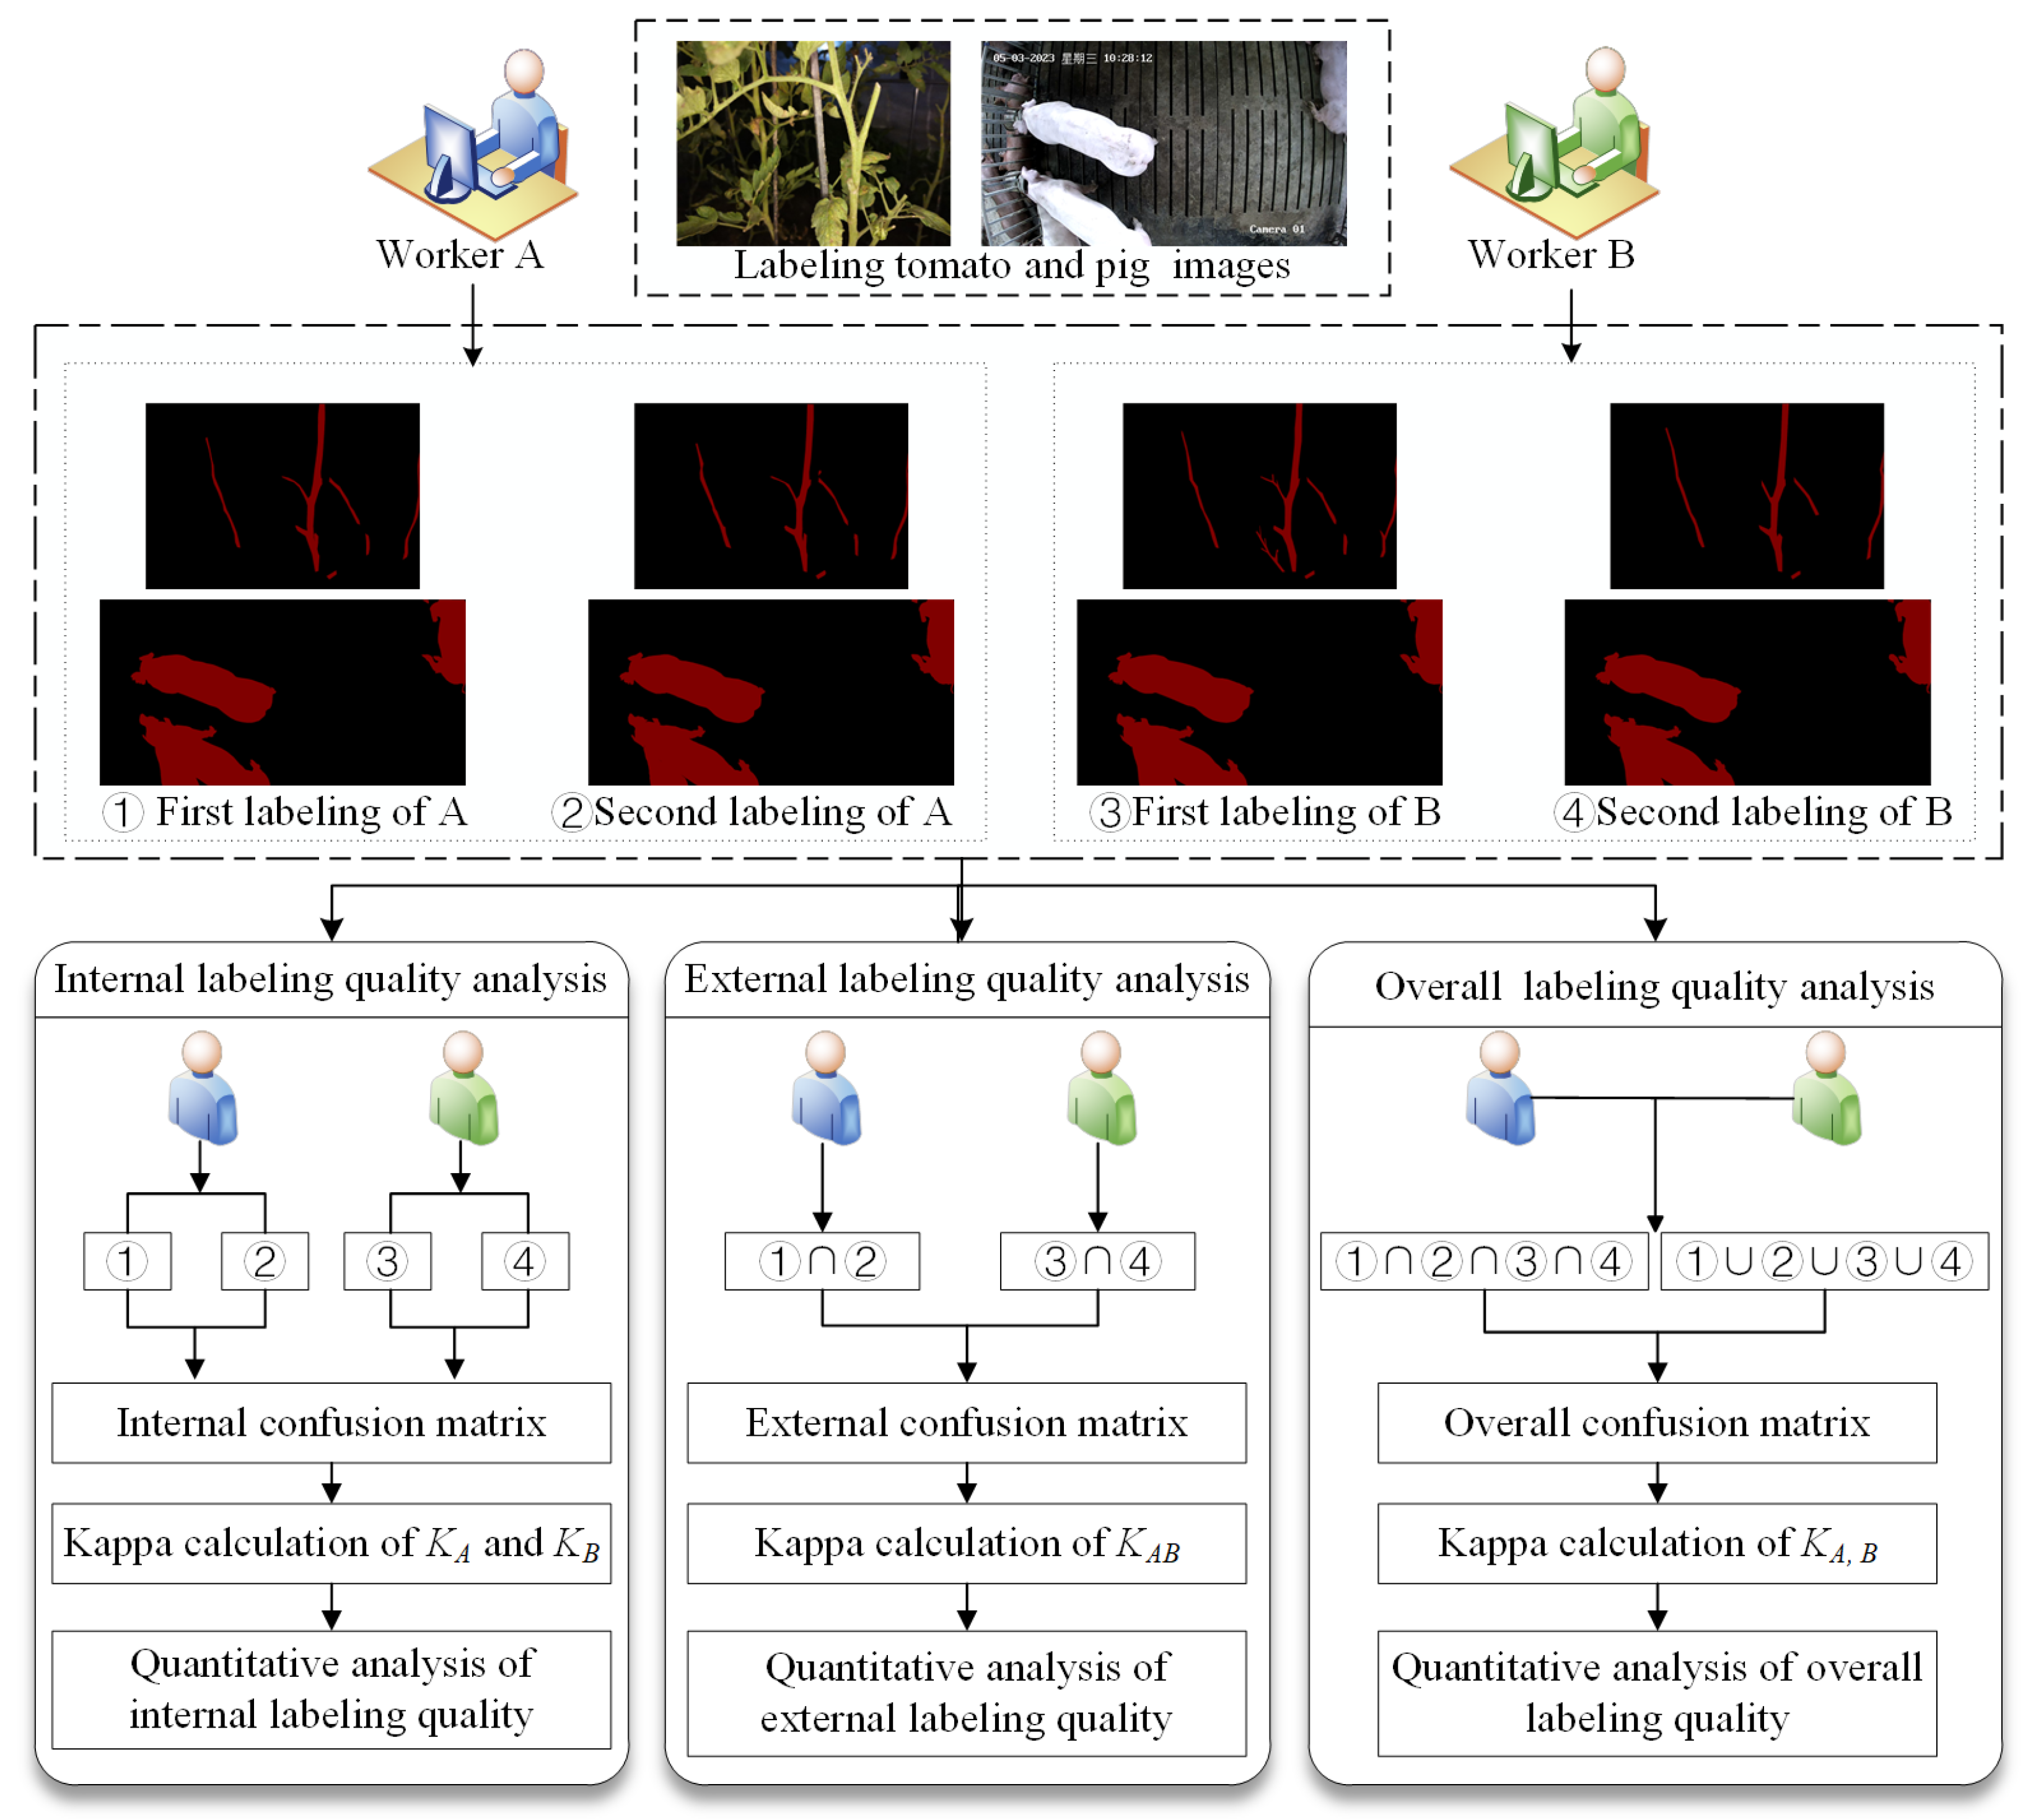
2.4.2. Internal Image Labeling Analysis
2.4.3. External Image Labeling Analysis
2.4.4. Overall Image Labeling Quality Analysis
2.4.5. Quantitative Analysis Method for Labeling Bias
3. Results and Discussion
3.1. Image Labeling Quality Analysis of Labeling Variation
- (1)
- Internal image labeling quality analysis (KA and KB)
- (2)
- External image labeling quality analysis (KAB)
- (3)
- Overall image labeling quality analysis (KA,B)
3.2. Image Labeling Quality Analysis of Labeling Bias
3.3. Comparative Analysis Between Whole Image Confusion Matrix and Contour Ring Confusion Matrix
3.4. Comparative Analysis of the Image Labeling Quality for Images with Different Labeling Difficulty
4. Conclusions
Author Contributions
Funding
Institutional Review Board Statement
Data Availability Statement
Acknowledgments
Conflicts of Interest
References
- Wang, Y.; Yu, X.; Yang, Y.; Zhang, X.; Zhang, Y.; Zhang, L.; Feng, R.; Xue, J. A multi-branched semantic segmentation network based on twisted information sharing pattern for medical images. Comput. Methods Programs Biomed. 2024, 243, 107914. [Google Scholar] [CrossRef]
- Ulusoy, U.; Eren, O.; Demirhan, A. Development of an obstacle avoiding autonomous vehicle by using stereo depth estimation and artificial intelligence based semantic segmentation. Eng. Appl. Artif. Intell. 2023, 126, 106808. [Google Scholar] [CrossRef]
- Wang, F.; Luo, X.; Wang, Q.; Li, L. Aerial-BiSeNet: A real-time semantic segmentation network for high resolution aerial imagery. Chin. J. Aeronaut. 2021, 34, 47–59. [Google Scholar] [CrossRef]
- Puthumanaillam, G.; Verma, U. Texture based prototypical network for few-shot semantic segmentation of forest cover: Generalizing for different geographical regions. Neurocomputing 2023, 538, 126201. [Google Scholar] [CrossRef]
- Luo, Z.; Yang, W.; Yuan, Y.; Gou, R.; Li, X. Semantic segmentation of agricultural images: A survey. Inf. Process. Agric. 2024, 11, 172–186. [Google Scholar] [CrossRef]
- Liu, Y.; Wang, B.; Sheng, Q.; Li, J.; Zhao, H.; Wang, S.; Liu, X.; He, H. Dual-polarization SAR rice growth model: A modeling approach for monitoring plant height by combining crop growth patterns with spatiotemporal SAR data. Comput. Electron. Agric. 2023, 215, 108358. [Google Scholar] [CrossRef]
- Polder, G.; Dieleman, J.A.; Hageraats, S.; Meinen, E. Imaging spectroscopy for monitoring the crop status of tomato plants. Comput. Electron. Agric. 2024, 216, 108504. [Google Scholar] [CrossRef]
- Cao, Y.; Chen, L.; Yuan, Y.; Sun, G. Cucumber disease recognition with small samples using image-text-label-based multi-modal language model. Comput. Electron. Agric. 2023, 211, 107993. [Google Scholar] [CrossRef]
- Talukder, M.S.H.; Bin Sulaiman, R.; Chowdhury, M.R.; Nipun, M.S.; Islam, T. PotatoPestNet: A CTInceptionV3-RS-based neural network for accurate identification of potato pests. Smart Agric. Technol. 2023, 5, 100297. [Google Scholar] [CrossRef]
- Su, J.; Anderson, S.; Javed, M.; Khompatraporn, C.; Udomsakdigool, A.; Mihaylova, L. Plant leaf deep semantic segmentation and a novel benchmark dataset for morning glory plant harvesting. Neurocomputing 2023, 555, 126609. [Google Scholar] [CrossRef]
- Ghimire, D.; Lee, K.; Kim, S. Loss-aware automatic selection of structured pruning criteria for deep neural network acceleration. Image Vis. Comput. 2023, 136, 104745. [Google Scholar] [CrossRef]
- Dairath, M.H.; Akram, M.W.; Mehmood, M.A.; Sarwar, H.U.; Akram, M.Z.; Omar, M.M.; Faheem, M. Computer vision-based prototype robotic picking cum grading system for fruits. Smart Agric. Technol. 2023, 4, 100210. [Google Scholar] [CrossRef]
- Hao, H.; Jincheng, Y.; Ling, Y.; Gengyuan, C.; Sumin, Z.; Huan, Z. An improved PointNet++ point cloud segmentation model applied to automatic measurement method of pig body size. Comput. Electron. Agric. 2023, 205, 107560. [Google Scholar] [CrossRef]
- Han, J.; Siegford, J.; Colbry, D.; Lesiyon, R.; Bosgraaf, A.; Chen, C.; Norton, T.; Steibel, J.P. Evaluation of computer vision for detecting agonistic behavior of pigs in a single-space feeding stall through blocked cross-validation strategies. Comput. Electron. Agric. 2023, 204, 107520. [Google Scholar] [CrossRef]
- Riaboff, L.; Shalloo, L.; Smeaton, A.F.; Couvreur, S.; Madouasse, A.; Keane, M.T. Predicting livestock behaviour using accelerometers: A systematic review of processing techniques for ruminant behaviour prediction from raw accelerometer data. Comput. Electron. Agric. 2022, 192, 106610. [Google Scholar] [CrossRef]
- Wang, H.; Shen, W.; Zhang, Y.; Gao, M.; Zhang, Q.; Xiaohui, A.; Du, H.; Qiu, B. Diagnosis of dairy cow diseases by knowledge-driven deep learning based on the text reports of illness state. Comput. Electron. Agric. 2023, 205, 107564. [Google Scholar] [CrossRef]
- Xu, B.; Wang, W.; Falzon, G.; Kwan, P.; Guo, L.; Chen, G.; Tait, A.; Schneider, D. Automated cattle counting using Mask R-CNN in quadcopter vision system. Comput. Electron. Agric. 2020, 171, 105300. [Google Scholar] [CrossRef]
- Li, J.; Chen, D.; Qi, X.; Li, Z.; Huang, Y.; Morris, D.; Tan, X. Label-efficient learning in agriculture: A comprehensive review. Comput. Electron. Agric. 2023, 215, 108412. [Google Scholar] [CrossRef]
- Xu, Z.; Lu, D.; Luo, J.; Wang, Y.; Yan, J.; Ma, K.; Zheng, Y.; Tong, R.K.Y. Anti-interference from noisy labels: Mean-teacher-assisted confident learning for medical image segmentation. IEEE Trans. Med. Imaging 2022, 41, 3062–3073. [Google Scholar] [CrossRef]
- Zhang, J.; Sheng, V.S.; Li, T.; Wu, X. Improving crowdsourced label quality using noise correction. IEEE Trans. Neural Netw. Learn. Syst. 2018, 29, 1675–1688. [Google Scholar] [CrossRef]
- Tao, F.; Jiang, L.; Li, C. Label similarity-based weighted soft majority voting and pairing for crowdsourcing. Knowl. Inf. Syst. 2020, 62, 2521–2538. [Google Scholar] [CrossRef]
- Pičuljan, N.; Car, Ž. Machine learning-based label quality assurance for object detection projects in requirements engineering. Appl. Sci. 2023, 13, 6234. [Google Scholar] [CrossRef]
- Wang, W.; Zhou, Z.H. Crowdsourcing label quality: A theoretical analysis. Sci. China Inf. Sci. 2015, 58, 1–12. [Google Scholar] [CrossRef]
- Wang, W.; Guo, X.Y.; Li, S.Y.; Jiang, Y.; Zhou, Z.H. Obtaining high-quality label by distinguishing between easy and hard items in crowdsourcing. In Proceedings of the Twenty-Sixth International Joint Conference on Artificial Intelligence, Melbourne, Australia, 19–25 August 2017. [Google Scholar] [CrossRef]
- Al-Refaie, A.; Bata, N. Evaluating measurement and process capabilities by GR&R with four quality measures. Measurement 2010, 43, 842–851. [Google Scholar] [CrossRef]
- Gao, W. Measurement System Analysis, 1st ed.; China Standards Press: Beijing, China, 2004. [Google Scholar]
- Montgomery, D.C. Introduction to Statistical Quality Control, 4th ed.; Wiley: Hoboken, NJ, USA, 2000. [Google Scholar]
- Mansilla, L.A.C.; Miranda, P.A.V.; Cappabianco, F.A.M. Oriented image foresting transform segmentation with connectivity constraints. In Proceedings of the 2016 IEEE International Conference on Image Processing (ICIP), Phoenix, AZ, USA, 25–28 September 2016. [Google Scholar] [CrossRef]
- Russell, B.C.; Torralba, A.; Murphy, K.P.; Freeman, W.T. LabelMe: A Database and Web-Based Tool for Image Annotation. Int. J. Comput. Vis. 2008, 77, 157–173. [Google Scholar] [CrossRef]
- Math, R.M.; Dharwadkar, N.V. Deep learning and computer vision for leaf miner infestation severity detection on muskmelon (Cucumis melo) leaves. Comput. Electr. Eng. 2023, 110, 108843. [Google Scholar] [CrossRef]
- Ferreira, I.S.B.; Peruchi, R.S.; Fernandes, N.J.; Rotella Junior, P. Measurement system analysis in angle of repose of fertilizers with distinct granulometries. Measurement 2021, 170, 108681. [Google Scholar] [CrossRef]
- Araújo, L.M.M.; Paiva, R.G.N.; Peruchi, R.S.; Junior, P.R.; Gomes, J.H.D.F. New indicators for measurement error detection in GR&R studies. Measurement 2019, 140, 557–564. [Google Scholar] [CrossRef]
- Xu, J.; Zhang, Y.; Miao, D. Three-way confusion matrix for classification: A measure driven view. Inf. Sci. 2020, 507, 772–794. [Google Scholar] [CrossRef]
- Wang, Y.; Jia, Y.; Tian, Y.; Xiao, J. Deep reinforcement learning with the confusion-matrix-based dynamic reward function for customer credit scoring. Expert Syst. Appl. 2022, 200, 117013. [Google Scholar] [CrossRef]
- Cohen, J. A Coefficient of Agreement for Nominal Scales. Educ. Psychol. Meas. 1960, 20, 37–46. [Google Scholar] [CrossRef]
- Valero-Carreras, D.; Alcaraz, J.; Landete, M. Comparing two SVM models through different metrics based on the confusion matrix. Comput. Oper. Res. 2023, 152, 106131. [Google Scholar] [CrossRef]
- Xiang, R.; Chen, Y.; Shen, J.W.; Hu, S. Method for assessing the quality of data used in evaluating the performance of recognition algorithms for fruits and vegetables. Biosyst. Eng. 2017, 156, 27–37. [Google Scholar] [CrossRef]

| Image No. | Kappa Values Based on Whole Image Confusion Matrix | Kappa Values Based on Contour Ring Confusion Matrix | ||||||
|---|---|---|---|---|---|---|---|---|
| KA | KB | KAB | KA,B | KA | KB | KAB | KA,B | |
| Tomato stem images | ||||||||
| No. 1 | 0.945 | 0.872 | 0.925 | 0.827 | 0.841 | 0.639 | 0.795 | 0.529 |
| No. 2 | 0.922 | 0.983 | 0.936 | 0.888 | 0.741 | 0.941 | 0.790 | 0.635 |
| No. 3 | 0.817 | 0.853 | 0.804 | 0.655 | 0.642 | 0.672 | 0.655 | 0.372 |
| No. 4 | 0.913 | 0.852 | 0.888 | 0.772 | 0.795 | 0.667 | 0.755 | 0.507 |
| No. 5 | 0.920 | 0.890 | 0.823 | 0.737 | 0.797 | 0.716 | 0.592 | 0.413 |
| No. 6 | 0.890 | 0.917 | 0.907 | 0.794 | 0.717 | 0.775 | 0.749 | 0.490 |
| No. 7 | 0.886 | 0.921 | 0.859 | 0.767 | 0.694 | 0.786 | 0.627 | 0.428 |
| No. 8 | 0.881 | 0.864 | 0.799 | 0.652 | 0.725 | 0.682 | 0.575 | 0.320 |
| No. 9 | 0.884 | 0.896 | 0.849 | 0.731 | 0.745 | 0.764 | 0.679 | 0.451 |
| No. 10 | 0.928 | 0.970 | 0.945 | 0.899 | 0.809 | 0.910 | 0.865 | 0.725 |
| Range | 0.128 | 0.131 | 0.146 | 0.247 | 0.199 | 0.302 | 0.290 | 0.405 |
| Group-reared pig images | ||||||||
| No. 11 | 0.987 | 0.992 | 0.987 | 0.980 | 0.805 | 0.834 | 0.805 | 0.662 |
| No. 12 | 0.991 | 0.993 | 0.992 | 0.984 | 0.776 | 0.840 | 0.819 | 0.631 |
| No. 13 | 0.990 | 0.991 | 0.986 | 0.976 | 0.801 | 0.812 | 0.772 | 0.598 |
| No. 14 | 0.986 | 0.993 | 0.989 | 0.979 | 0.749 | 0.853 | 0.805 | 0.614 |
| No. 15 | 0.988 | 0.994 | 0.991 | 0.983 | 0.698 | 0.852 | 0.752 | 0.572 |
| No. 16 | 0.989 | 0.993 | 0.979 | 0.967 | 0.772 | 0.857 | 0.752 | 0.560 |
| No. 17 | 0.991 | 0.993 | 0.991 | 0.983 | 0.764 | 0.826 | 0.786 | 0.606 |
| No. 18 | 0.990 | 0.993 | 0.990 | 0.982 | 0.777 | 0.840 | 0.785 | 0.614 |
| No. 19 | 0.990 | 0.993 | 0.992 | 0.983 | 0.764 | 0.841 | 0.808 | 0.618 |
| No. 20 | 0.989 | 0.991 | 0.991 | 0.980 | 0.749 | 0.808 | 0.803 | 0.579 |
| Range | 0.005 | 0.003 | 0.013 | 0.017 | 0.107 | 0.049 | 0.067 | 0.102 |
| Image No. | Kappa Values Based on Whole Image Confusion Matrix | Kappa Values Based on Contour Ring Confusion Matrix | ||||||||||
|---|---|---|---|---|---|---|---|---|---|---|---|---|
| KA | KB | KAB | KA,B | KAC | KBC | KA | KB | KAB | KA,B | KAC | KBC | |
| No. 21 | 0.984 | 0.984 | 0.987 | 0.970 | 0.985 | 0.985 | 0.867 | 0.869 | 0.888 | 0.675 | 0.875 | 0.874 |
| No. 22 | 0.975 | 0.971 | 0.975 | 0.947 | 0.968 | 0.970 | 0.826 | 0.802 | 0.826 | 0.650 | 0.791 | 0.804 |
| No. 23 | 0.975 | 0.975 | 0.975 | 0.951 | 0.979 | 0.979 | 0.787 | 0.794 | 0.792 | 0.605 | 0.823 | 0.832 |
| No. 24 | 0.982 | 0.976 | 0.981 | 0.961 | 0.977 | 0.979 | 0.863 | 0.820 | 0.853 | 0.709 | 0.820 | 0.843 |
| No. 25 | 0.970 | 0.979 | 0.977 | 0.953 | 0.976 | 0.981 | 0.786 | 0.851 | 0.835 | 0.675 | 0.836 | 0.872 |
| No. 26 | 0.983 | 0.980 | 0.983 | 0.964 | 0.982 | 0.984 | 0.857 | 0.848 | 0.872 | 0.726 | 0.861 | 0.875 |
| No. 27 | 0.949 | 0.948 | 0.948 | 0.898 | 0.951 | 0.955 | 0.842 | 0.841 | 0.843 | 0.691 | 0.858 | 0.868 |
| No. 28 | 0.979 | 0.977 | 0.979 | 0.957 | 0.978 | 0.980 | 0.848 | 0.827 | 0.846 | 0.693 | 0.850 | 0.857 |
| No. 29 | 0.947 | 0.966 | 0.962 | 0.917 | 0.952 | 0.949 | 0.753 | 0.842 | 0.819 | 0.626 | 0.789 | 0.775 |
| No. 30 | 0.980 | 0.979 | 0.980 | 0.961 | 0.980 | 0.981 | 0.842 | 0.829 | 0.838 | 0.692 | 0.846 | 0.851 |
| 20–30 | 0.972 | 0.974 | 0.975 | 0.948 | 0.973 | 0.974 | 0.828 | 0.832 | 0.841 | 0.674 | 0.835 | 0.845 |
| No. 31 | 0.973 | 0.975 | 0.970 | 0.946 | 0.969 | 0.971 | 0.883 | 0.893 | 0.864 | 0.762 | 0.857 | 0.874 |
| No. 32 | 0.979 | 0.800 | 0.978 | 0.958 | 0.984 | 0.981 | 0.809 | 0.807 | 0.818 | 0.639 | 0.855 | 0.828 |
| No. 33 | 0.971 | 0.975 | 0.976 | 0.950 | 0.970 | 0.973 | 0.808 | 0.831 | 0.839 | 0.668 | 0.814 | 0.829 |
| No. 34 | 0.974 | 0.978 | 0.978 | 0.953 | 0.977 | 0.981 | 0.814 | 0.839 | 0.838 | 0.667 | 0.838 | 0.865 |
| No. 35 | 0.987 | 0.987 | 0.990 | 0.976 | 0.989 | 0.991 | 0.773 | 0.750 | 0.799 | 0.587 | 0.815 | 0.847 |
| No. 36 | 0.971 | 0.971 | 0.975 | 0.948 | 0.974 | 0.976 | 0.766 | 0.770 | 0.807 | 0.599 | 0.805 | 0.823 |
| No. 37 | 0.980 | 0.977 | 0.979 | 0.959 | 0.983 | 0.980 | 0.815 | 0.786 | 0.799 | 0.626 | 0.846 | 0.833 |
| No. 38 | 0.983 | 0.984 | 0.973 | 0.958 | 0.983 | 0.974 | 0.824 | 0.810 | 0.807 | 0.648 | 0.826 | 0.787 |
| No. 39 | 0.969 | 0.972 | 0.972 | 0.946 | 0.974 | 0.970 | 0.824 | 0.836 | 0.839 | 0.694 | 0.855 | 0.832 |
| No. 40 | 0.975 | 0.977 | 0.973 | 0.949 | 0.974 | 0.977 | 0.815 | 0.820 | 0.805 | 0.634 | 0.822 | 0.844 |
| 30–40 | 0.976 | 0.960 | 0.976 | 0.954 | 0.978 | 0.977 | 0.813 | 0.814 | 0.822 | 0.652 | 0.833 | 0.836 |
| 1–40 | 0.974 | 0.967 | 0.976 | 0.951 | 0.975 | 0.976 | 0.820 | 0.823 | 0.831 | 0.663 | 0.834 | 0.841 |
| p-values | 0.702 | 0.473 | 0.840 | 0.701 | 0.586 | 0.736 | 0.636 | 0.390 | 0.352 | 0.488 | 0.941 | 0.722 |
| Image No. | Kappa Value for Confusion Matrix of Contour Ring I | Kappa Value for Confusion Matrix of Contour Ring II | ||||||
|---|---|---|---|---|---|---|---|---|
| KA | KB | KAB | KA,B | KA | KB | KAB | KA,B | |
| No. 41 | 0.912 | 0.941 | 0.914 | 0.859 | 0.912 | 0.942 | 0.914 | 0.859 |
| No. 42 | 0.922 | 0.942 | 0.934 | 0.863 | 0.922 | 0.942 | 0.934 | 0.863 |
| No. 43 | 0.921 | 0.927 | 0.894 | 0.823 | 0.925 | 0.932 | 0.898 | 0.828 |
| No. 44 | 0.894 | 0.942 | 0.918 | 0.838 | 0.894 | 0.945 | 0.920 | 0.839 |
| No. 45 | 0.894 | 0.948 | 0.915 | 0.844 | 0.894 | 0.948 | 0.915 | 0.844 |
| No. 46 | 0.923 | 0.950 | 0.866 | 0.791 | 0.922 | 0.950 | 0.866 | 0.790 |
| No. 47 | 0.920 | 0.933 | 0.917 | 0.850 | 0.920 | 0.933 | 0.917 | 0.850 |
| No. 48 | 0.918 | 0.944 | 0.921 | 0.855 | 0.918 | 0.944 | 0.921 | 0.855 |
| No. 49 | 0.912 | 0.942 | 0.930 | 0.855 | 0.912 | 0.942 | 0.929 | 0.855 |
| No. 50 | 0.905 | 0.921 | 0.917 | 0.821 | 0.905 | 0.921 | 0.917 | 0.821 |
Disclaimer/Publisher’s Note: The statements, opinions and data contained in all publications are solely those of the individual author(s) and contributor(s) and not of MDPI and/or the editor(s). MDPI and/or the editor(s) disclaim responsibility for any injury to people or property resulting from any ideas, methods, instructions or products referred to in the content. |
© 2025 by the authors. Licensee MDPI, Basel, Switzerland. This article is an open access article distributed under the terms and conditions of the Creative Commons Attribution (CC BY) license (https://creativecommons.org/licenses/by/4.0/).
Share and Cite
Xiang, R.; Yuan, X.; Zhang, Y.; Zhang, X. Quantitative Analysis of the Labeling Quality of Biological Images for Semantic Segmentation Based on Attribute Agreement Analysis. Agriculture 2025, 15, 680. https://doi.org/10.3390/agriculture15070680
Xiang R, Yuan X, Zhang Y, Zhang X. Quantitative Analysis of the Labeling Quality of Biological Images for Semantic Segmentation Based on Attribute Agreement Analysis. Agriculture. 2025; 15(7):680. https://doi.org/10.3390/agriculture15070680
Chicago/Turabian StyleXiang, Rong, Xinyu Yuan, Yi Zhang, and Xiaomin Zhang. 2025. "Quantitative Analysis of the Labeling Quality of Biological Images for Semantic Segmentation Based on Attribute Agreement Analysis" Agriculture 15, no. 7: 680. https://doi.org/10.3390/agriculture15070680
APA StyleXiang, R., Yuan, X., Zhang, Y., & Zhang, X. (2025). Quantitative Analysis of the Labeling Quality of Biological Images for Semantic Segmentation Based on Attribute Agreement Analysis. Agriculture, 15(7), 680. https://doi.org/10.3390/agriculture15070680