


Effect of Temperature of Two-Year Storage of Varietal Honeys on 5-Hydroxymethylfurfural Content, Diastase Number, and CIE Color Coordinates
 , , , and
Abstract
1. Introduction
2. Materials and Methods
2.1. Sampling
2.2. Stage I of Study
2.3. Stage II of Study
2.4. Statistical Analysis
3. Results
3.1. Fresh Honeys
3.2. Stored Honeys
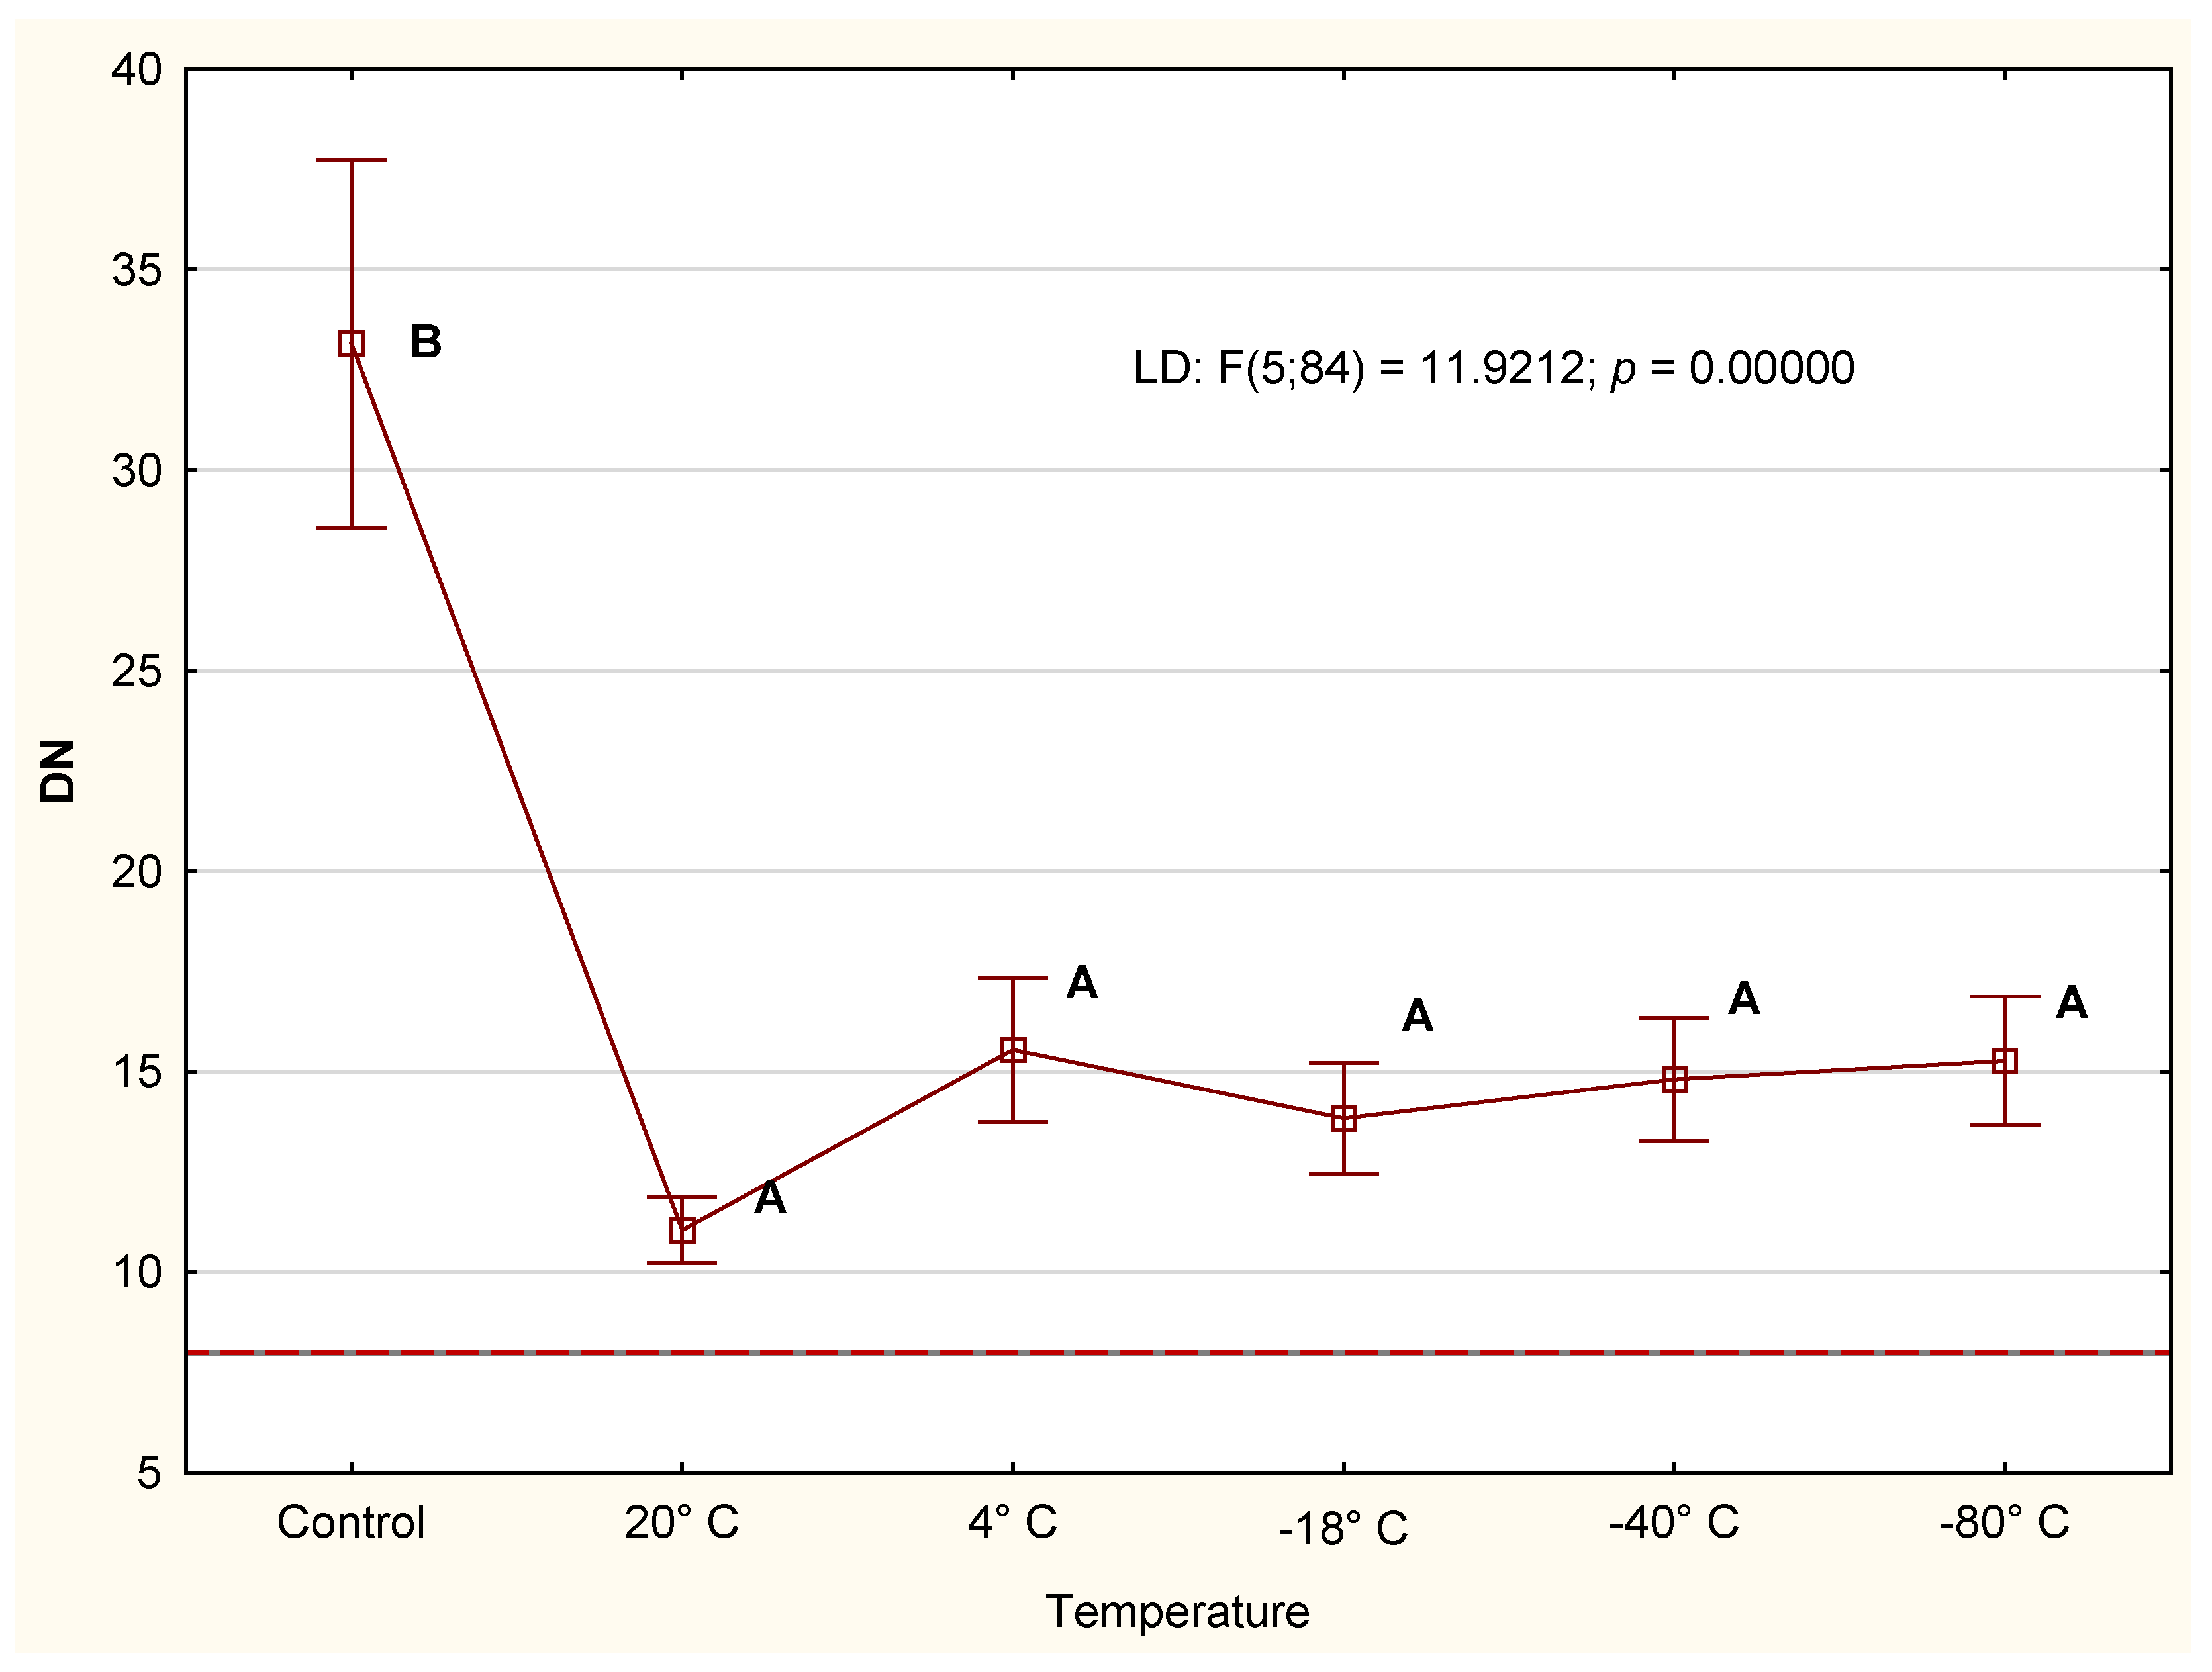
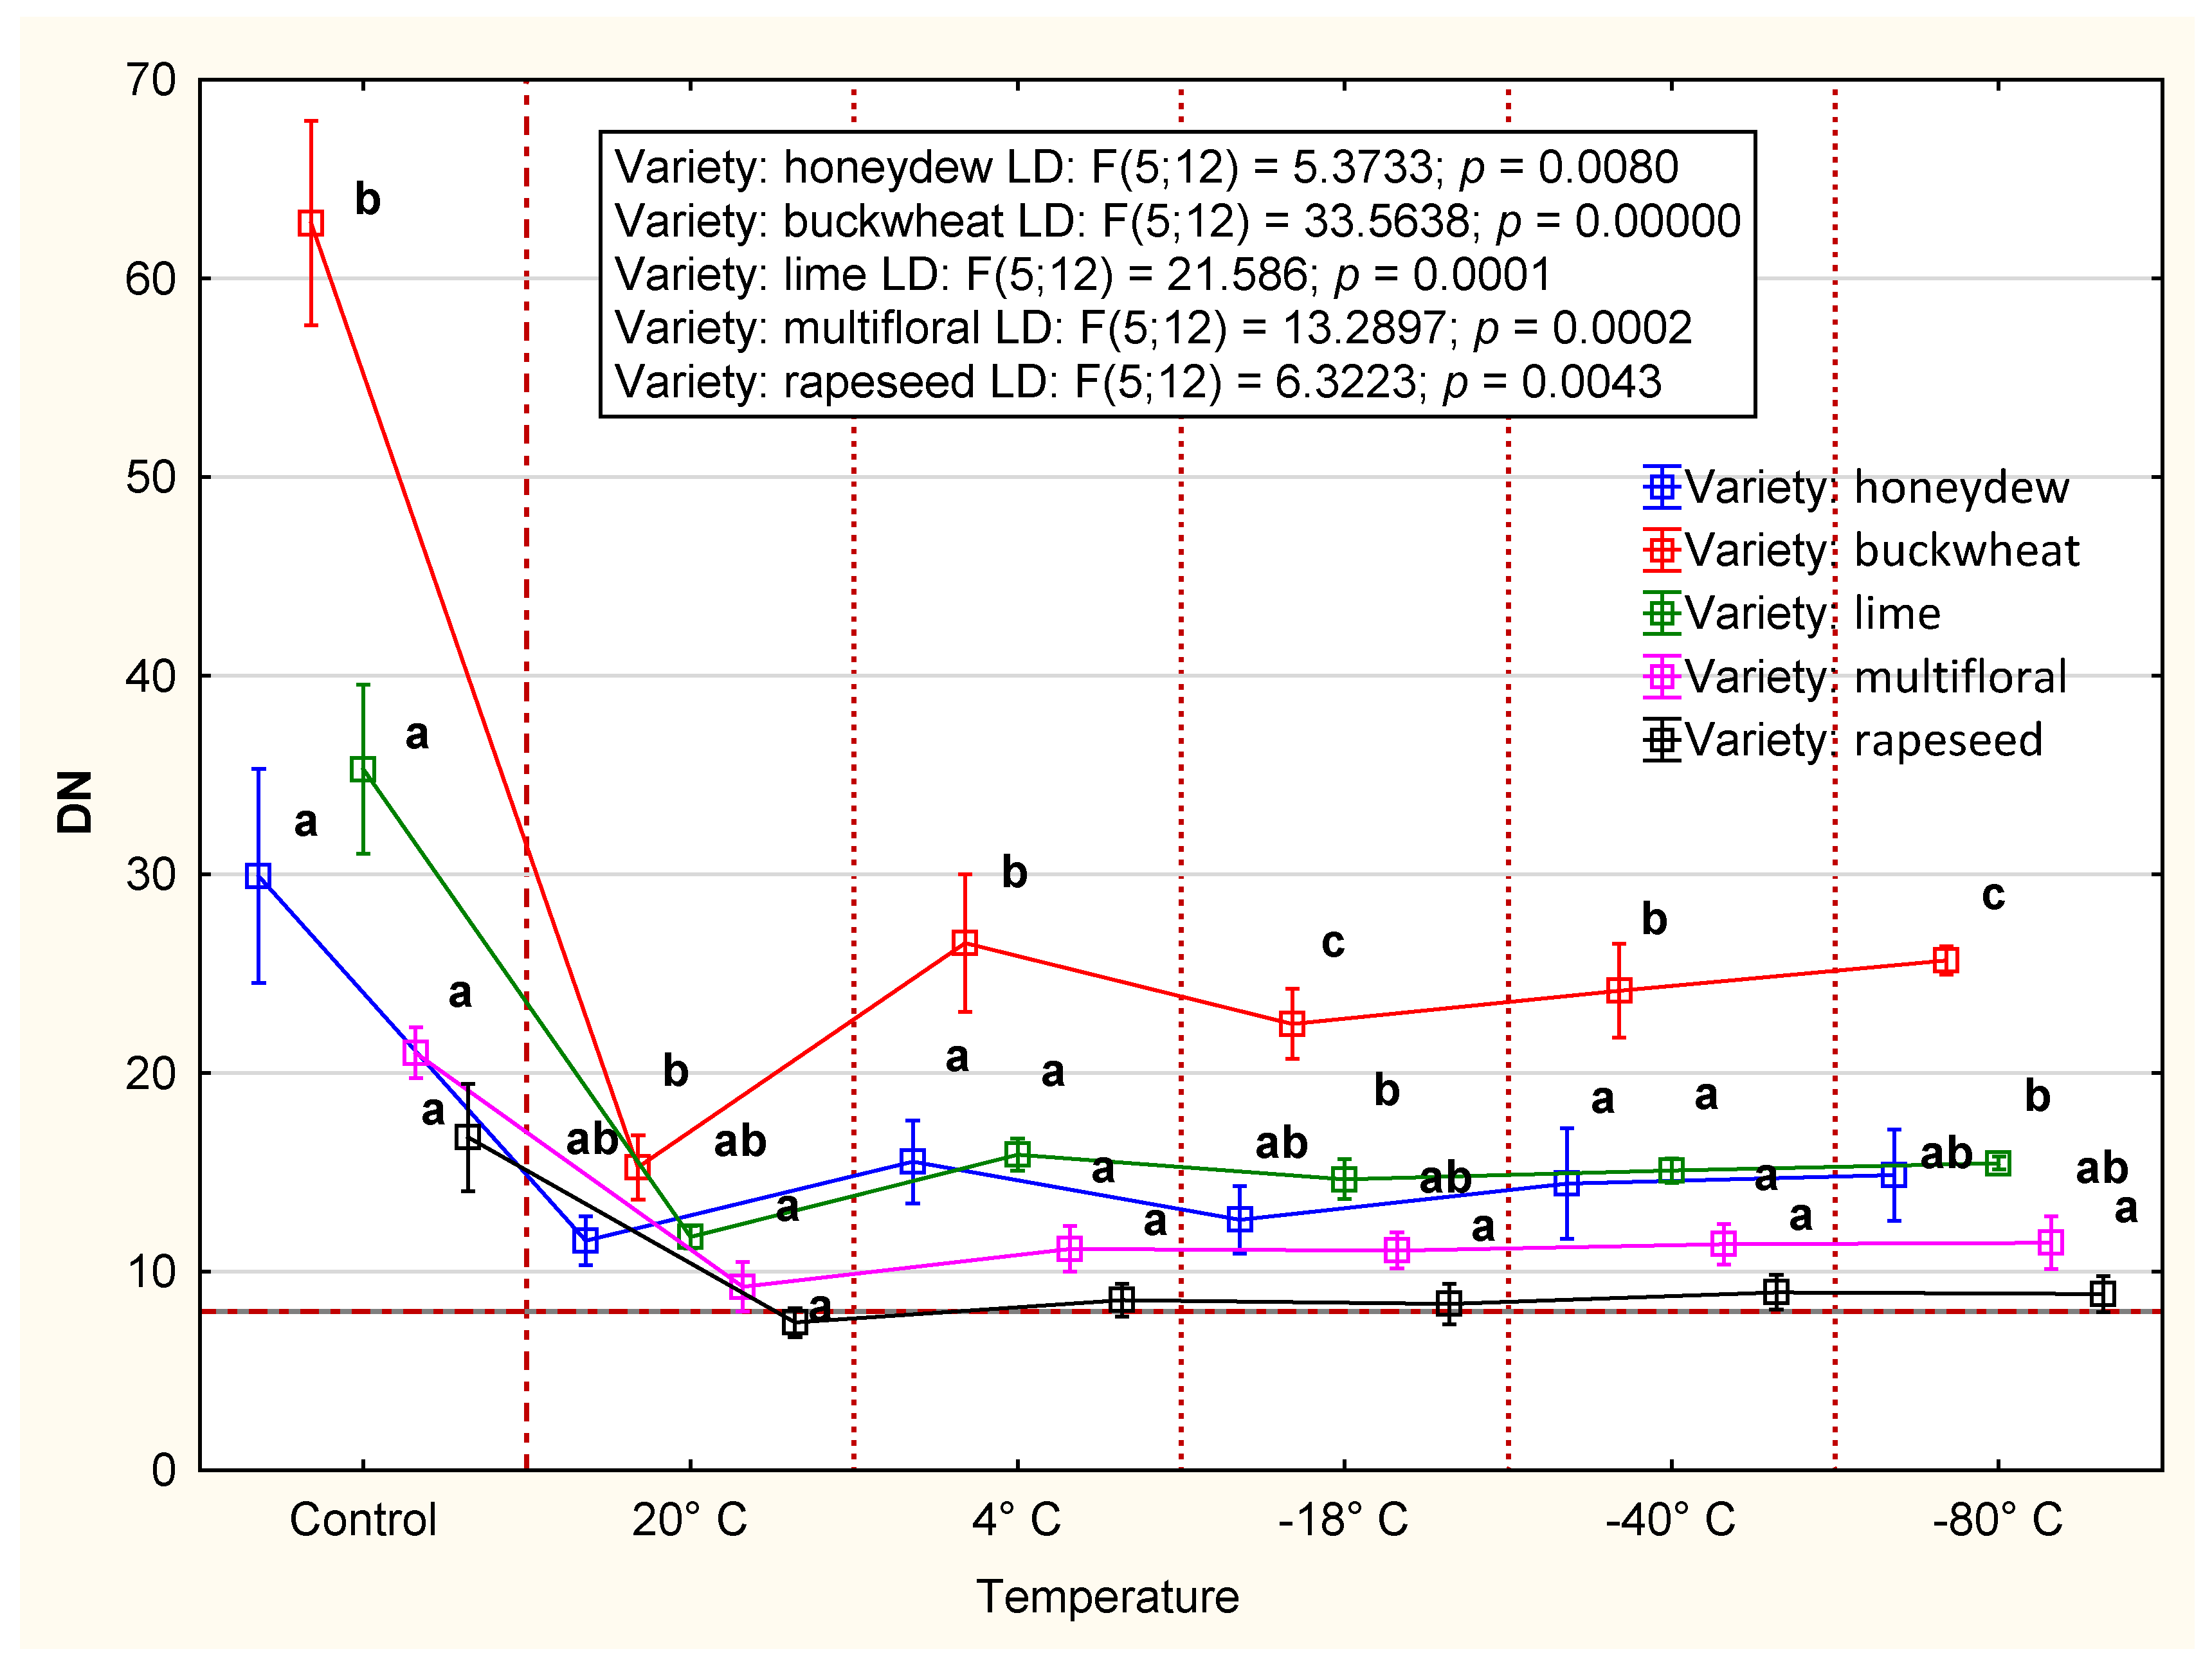
3.2.1. Diastase Number
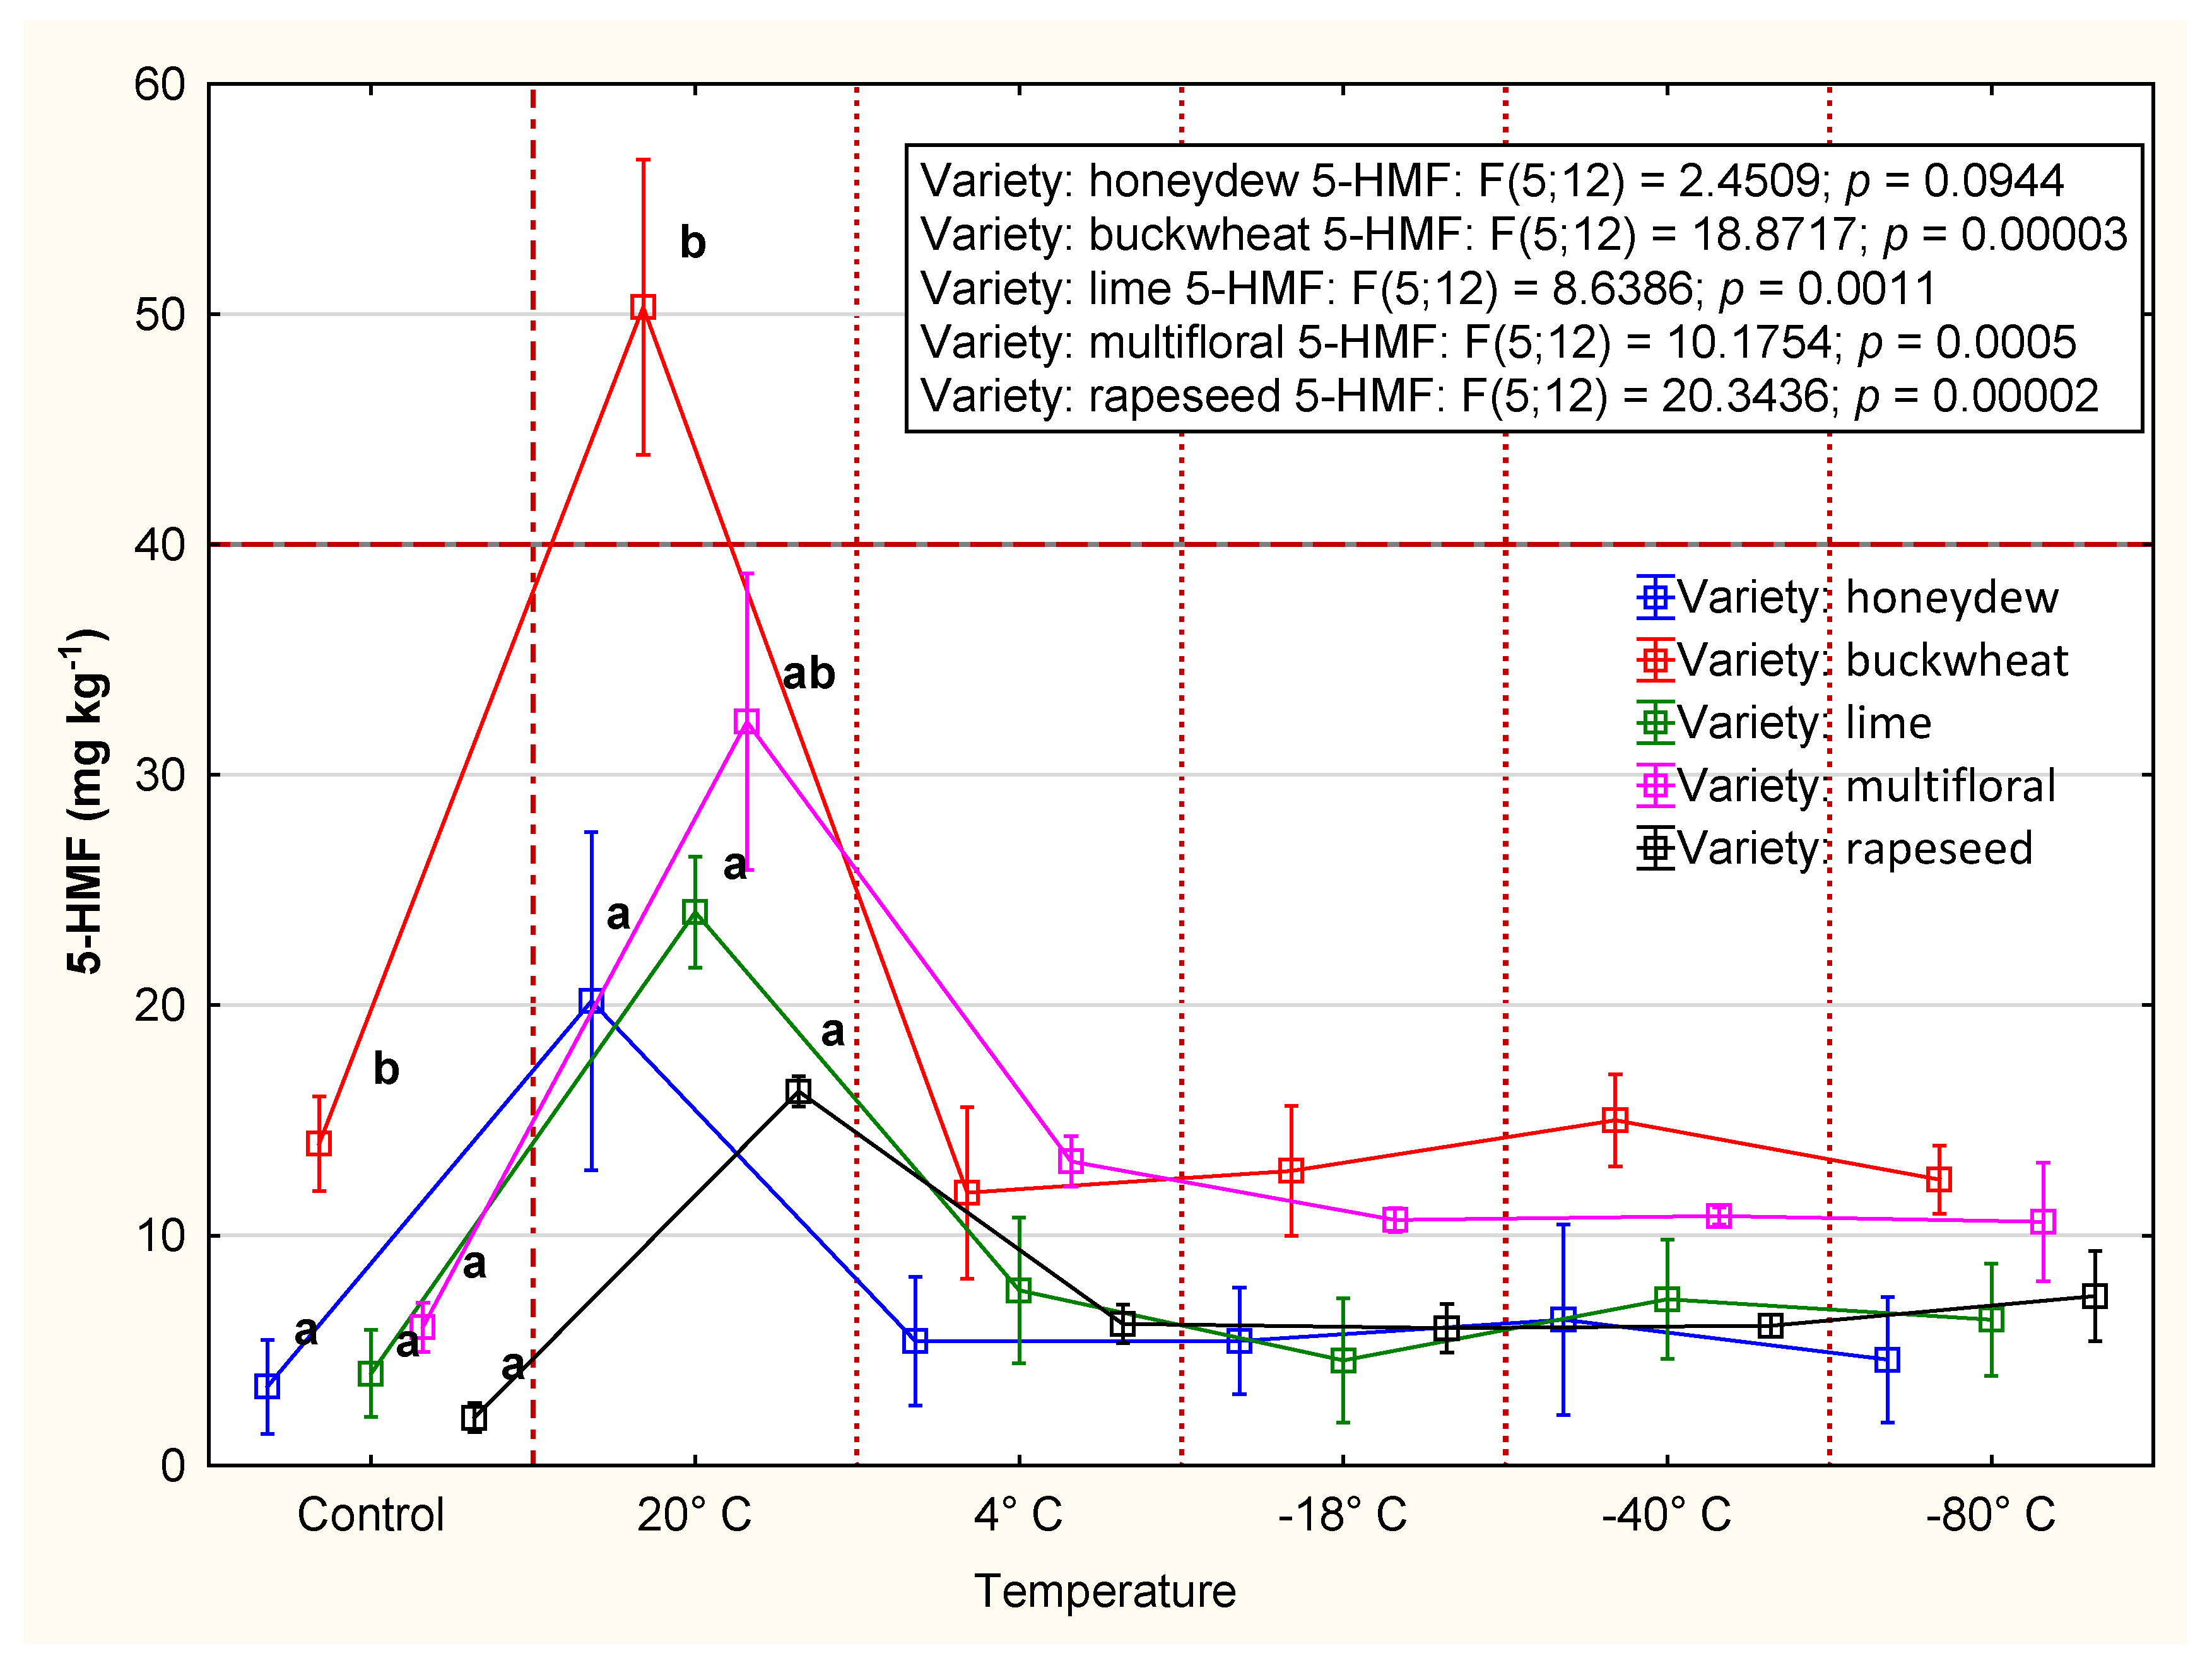
3.2.2. 5-HMF
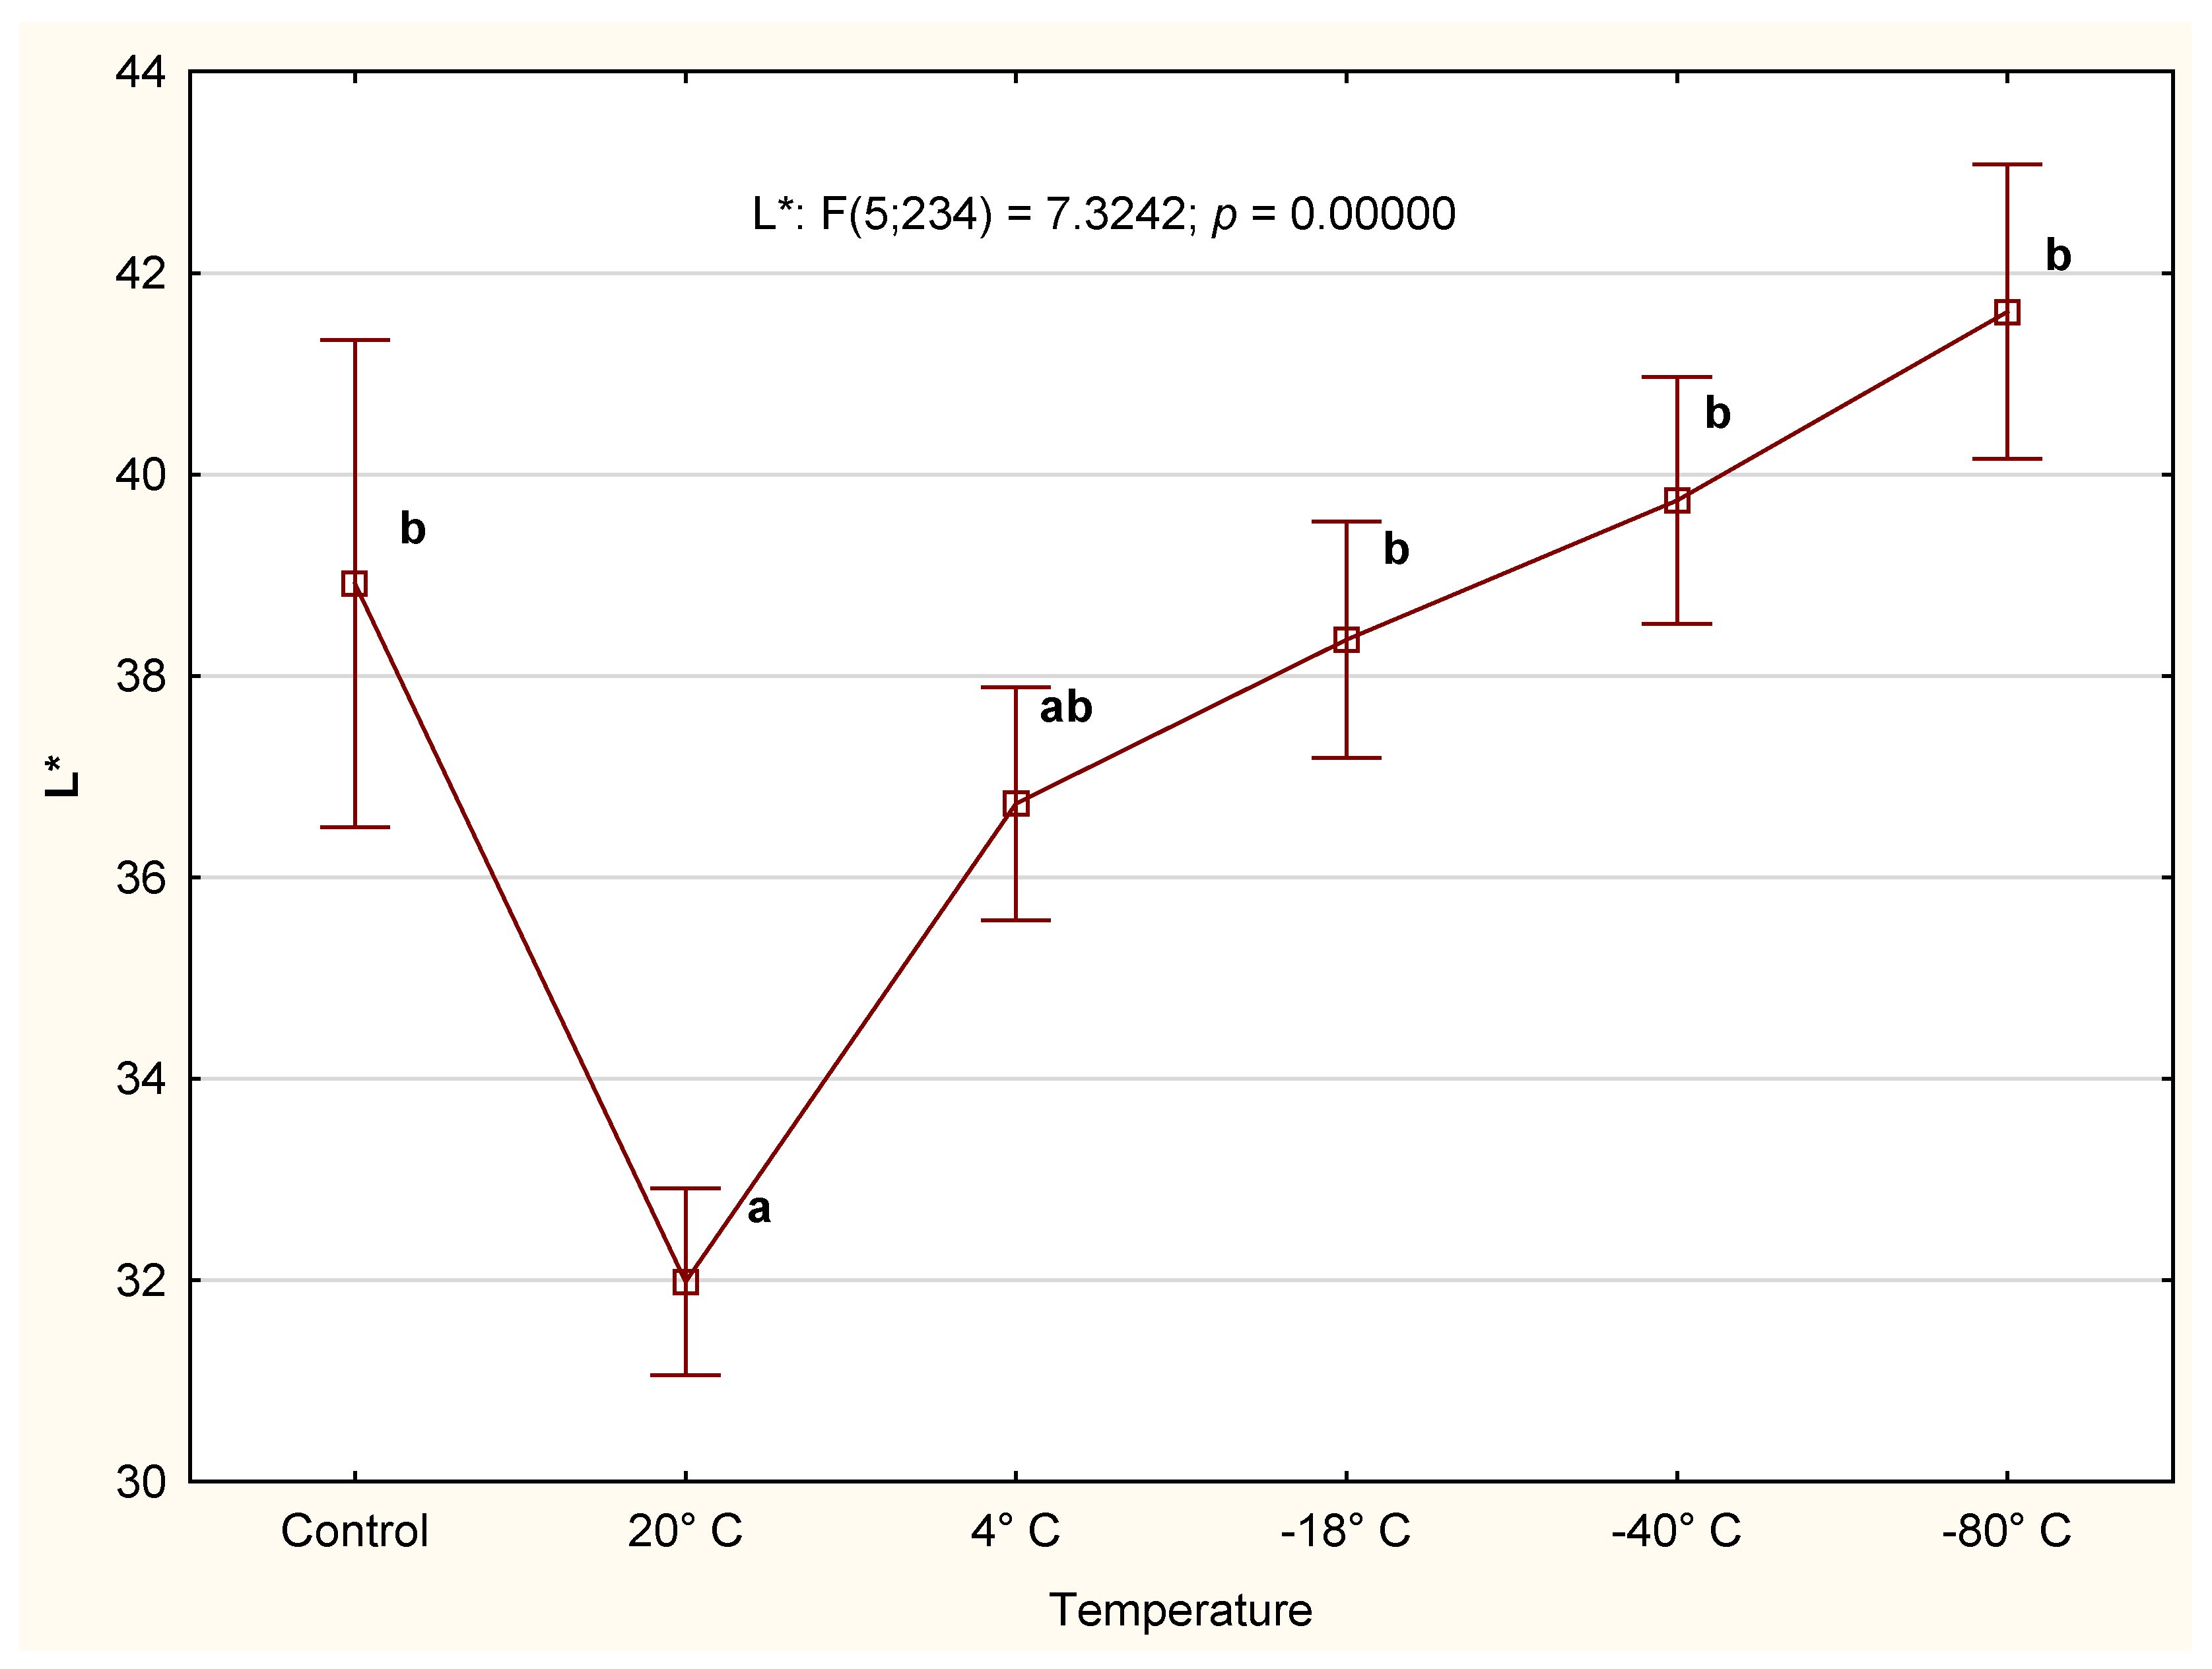
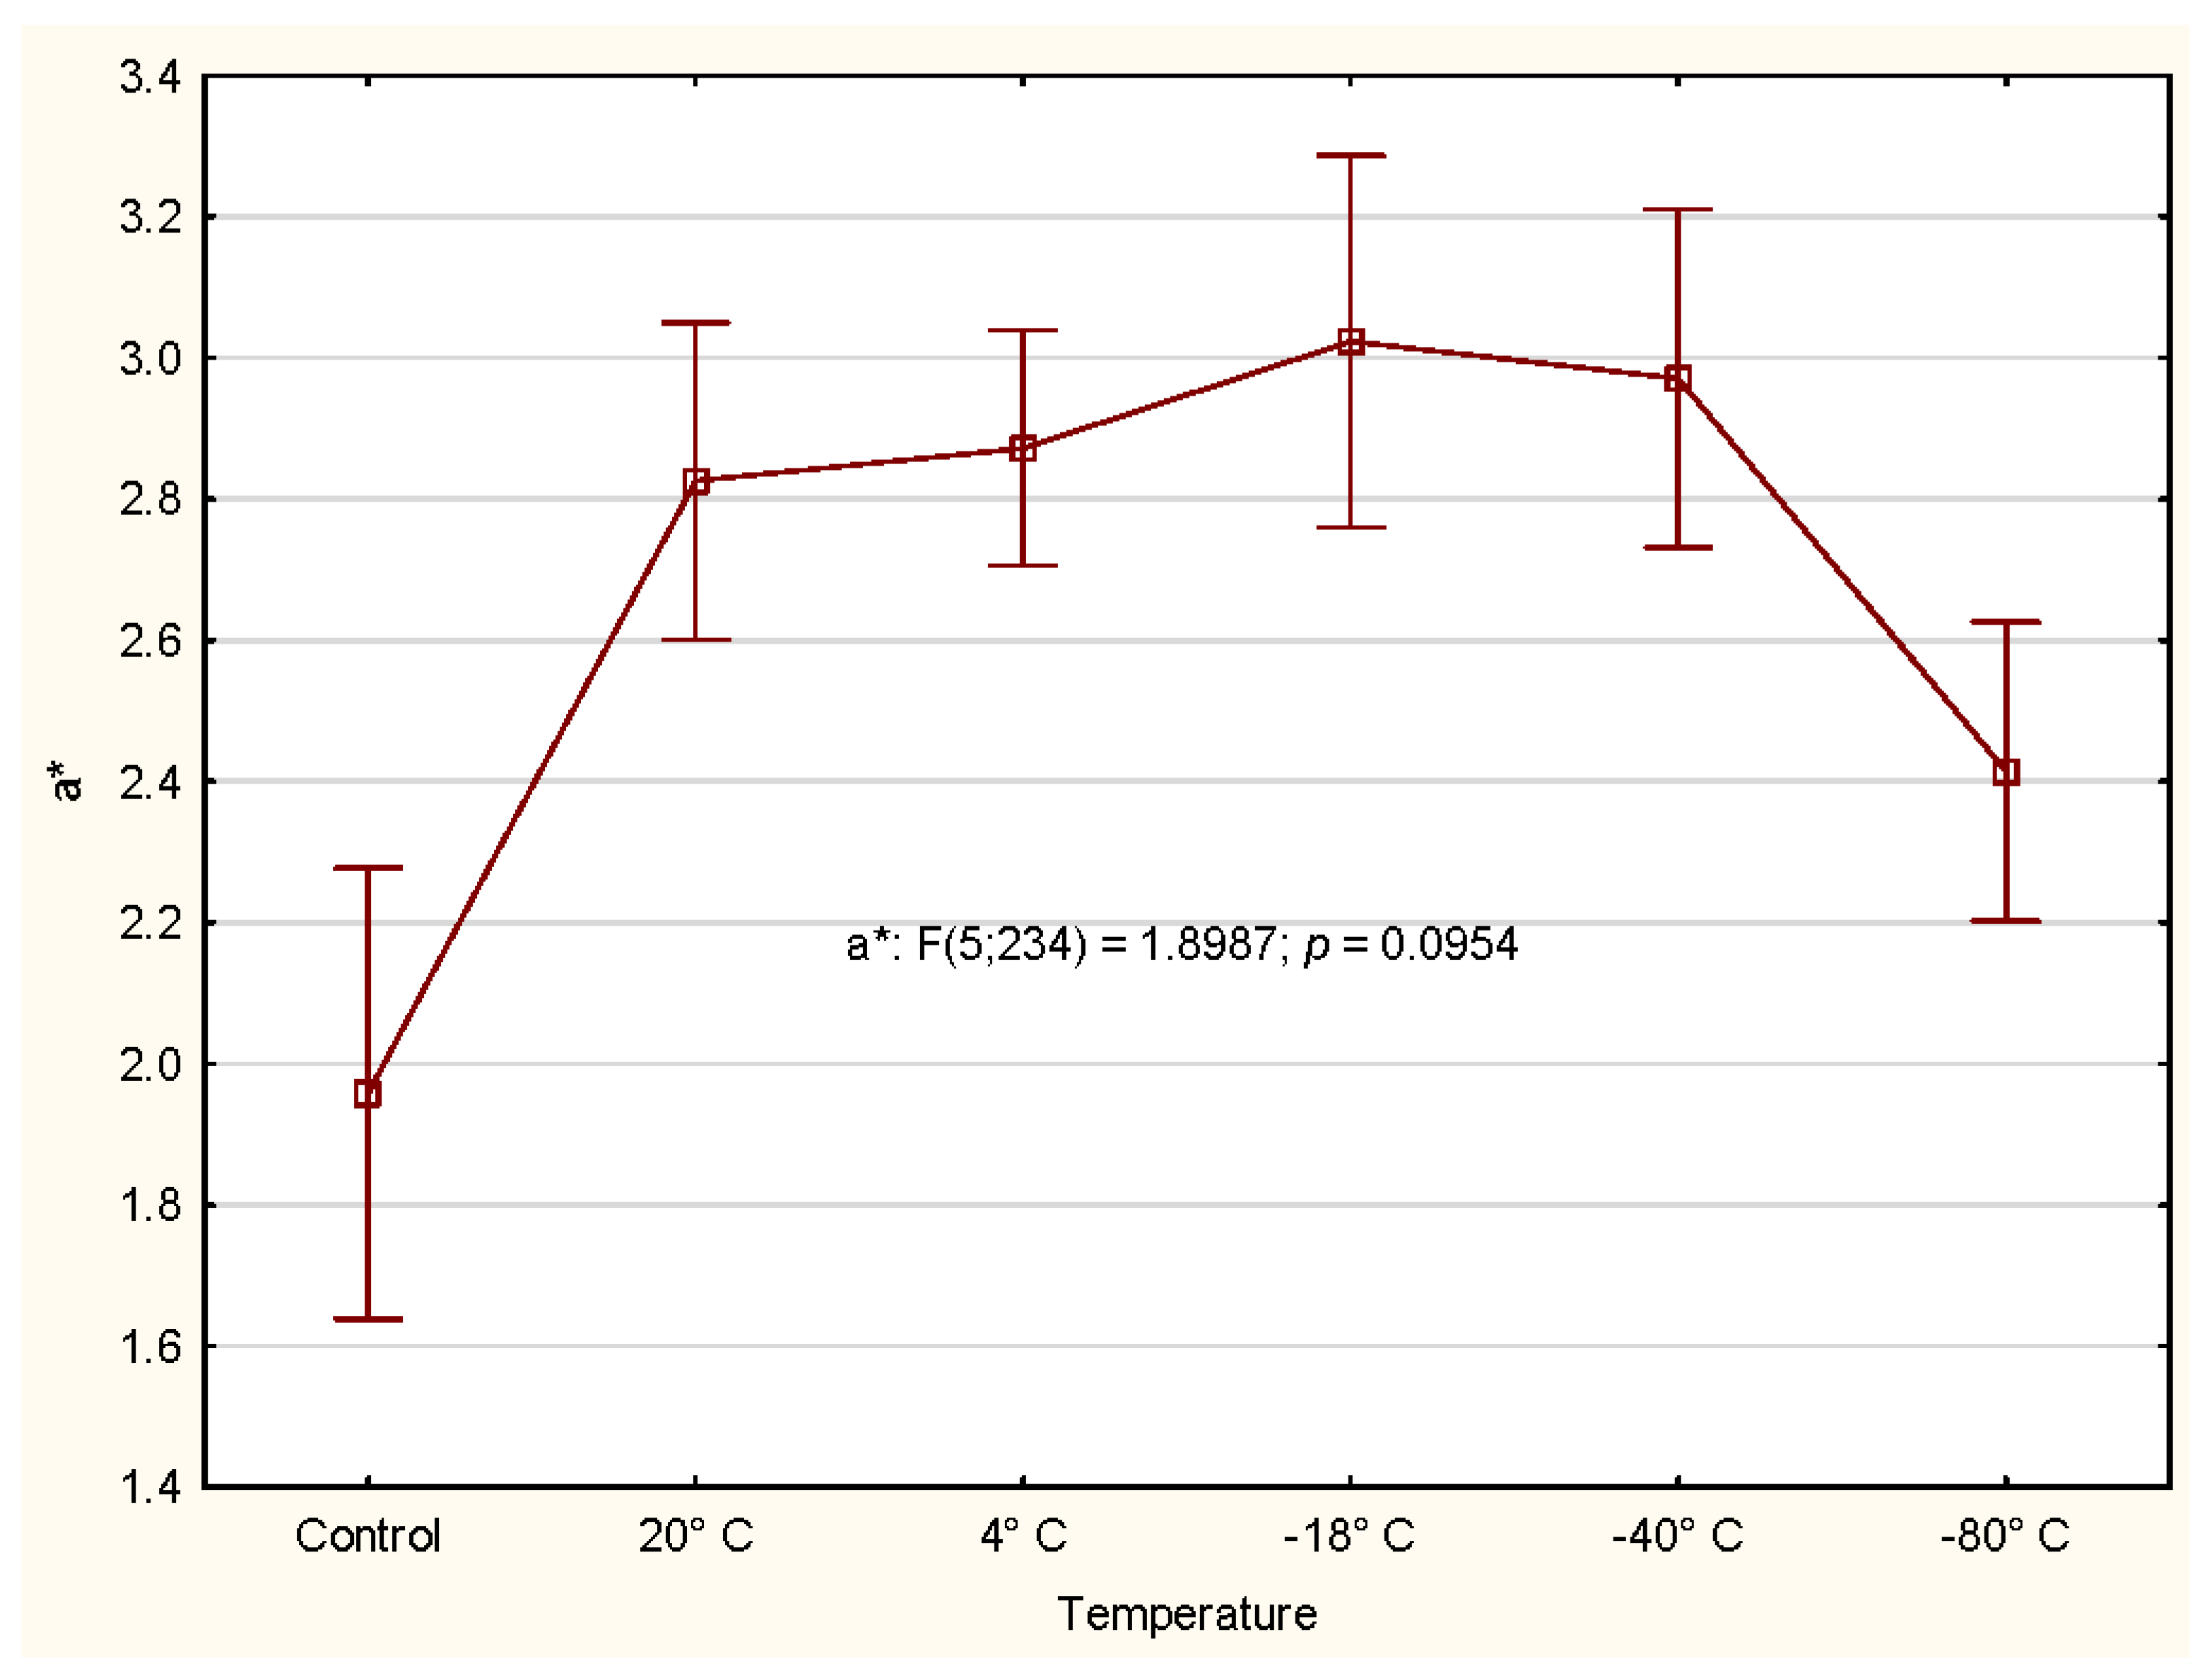
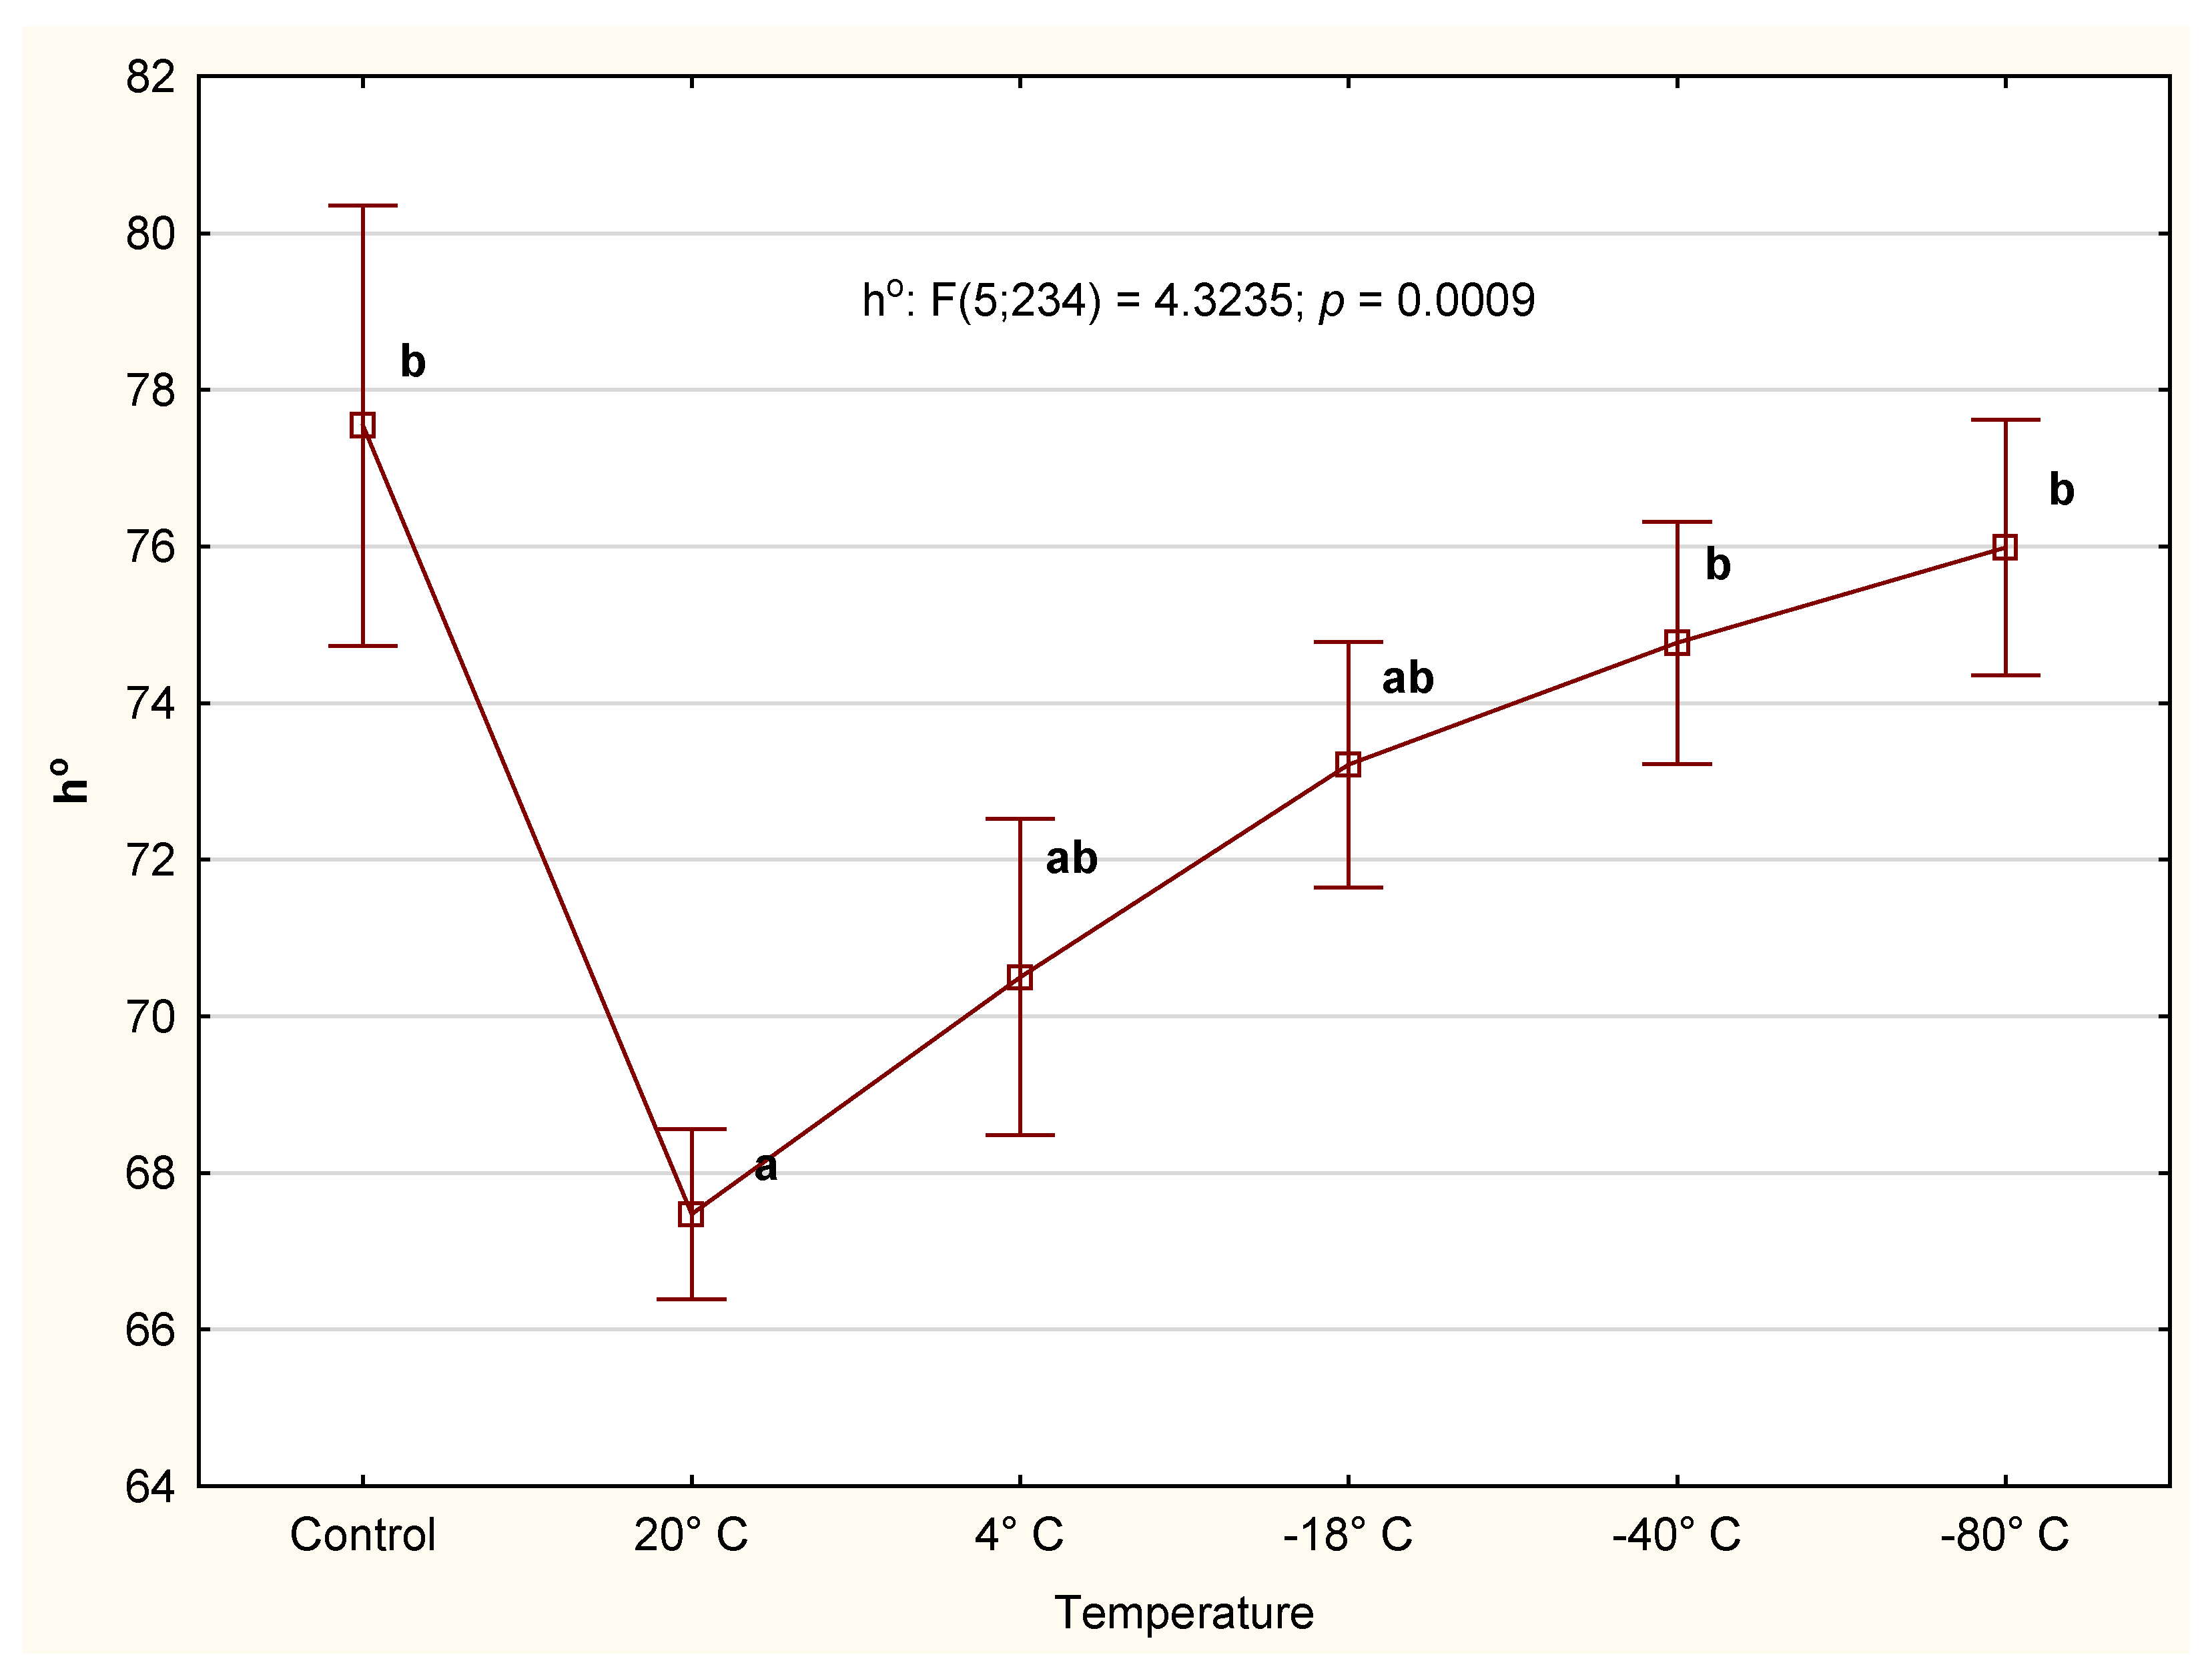
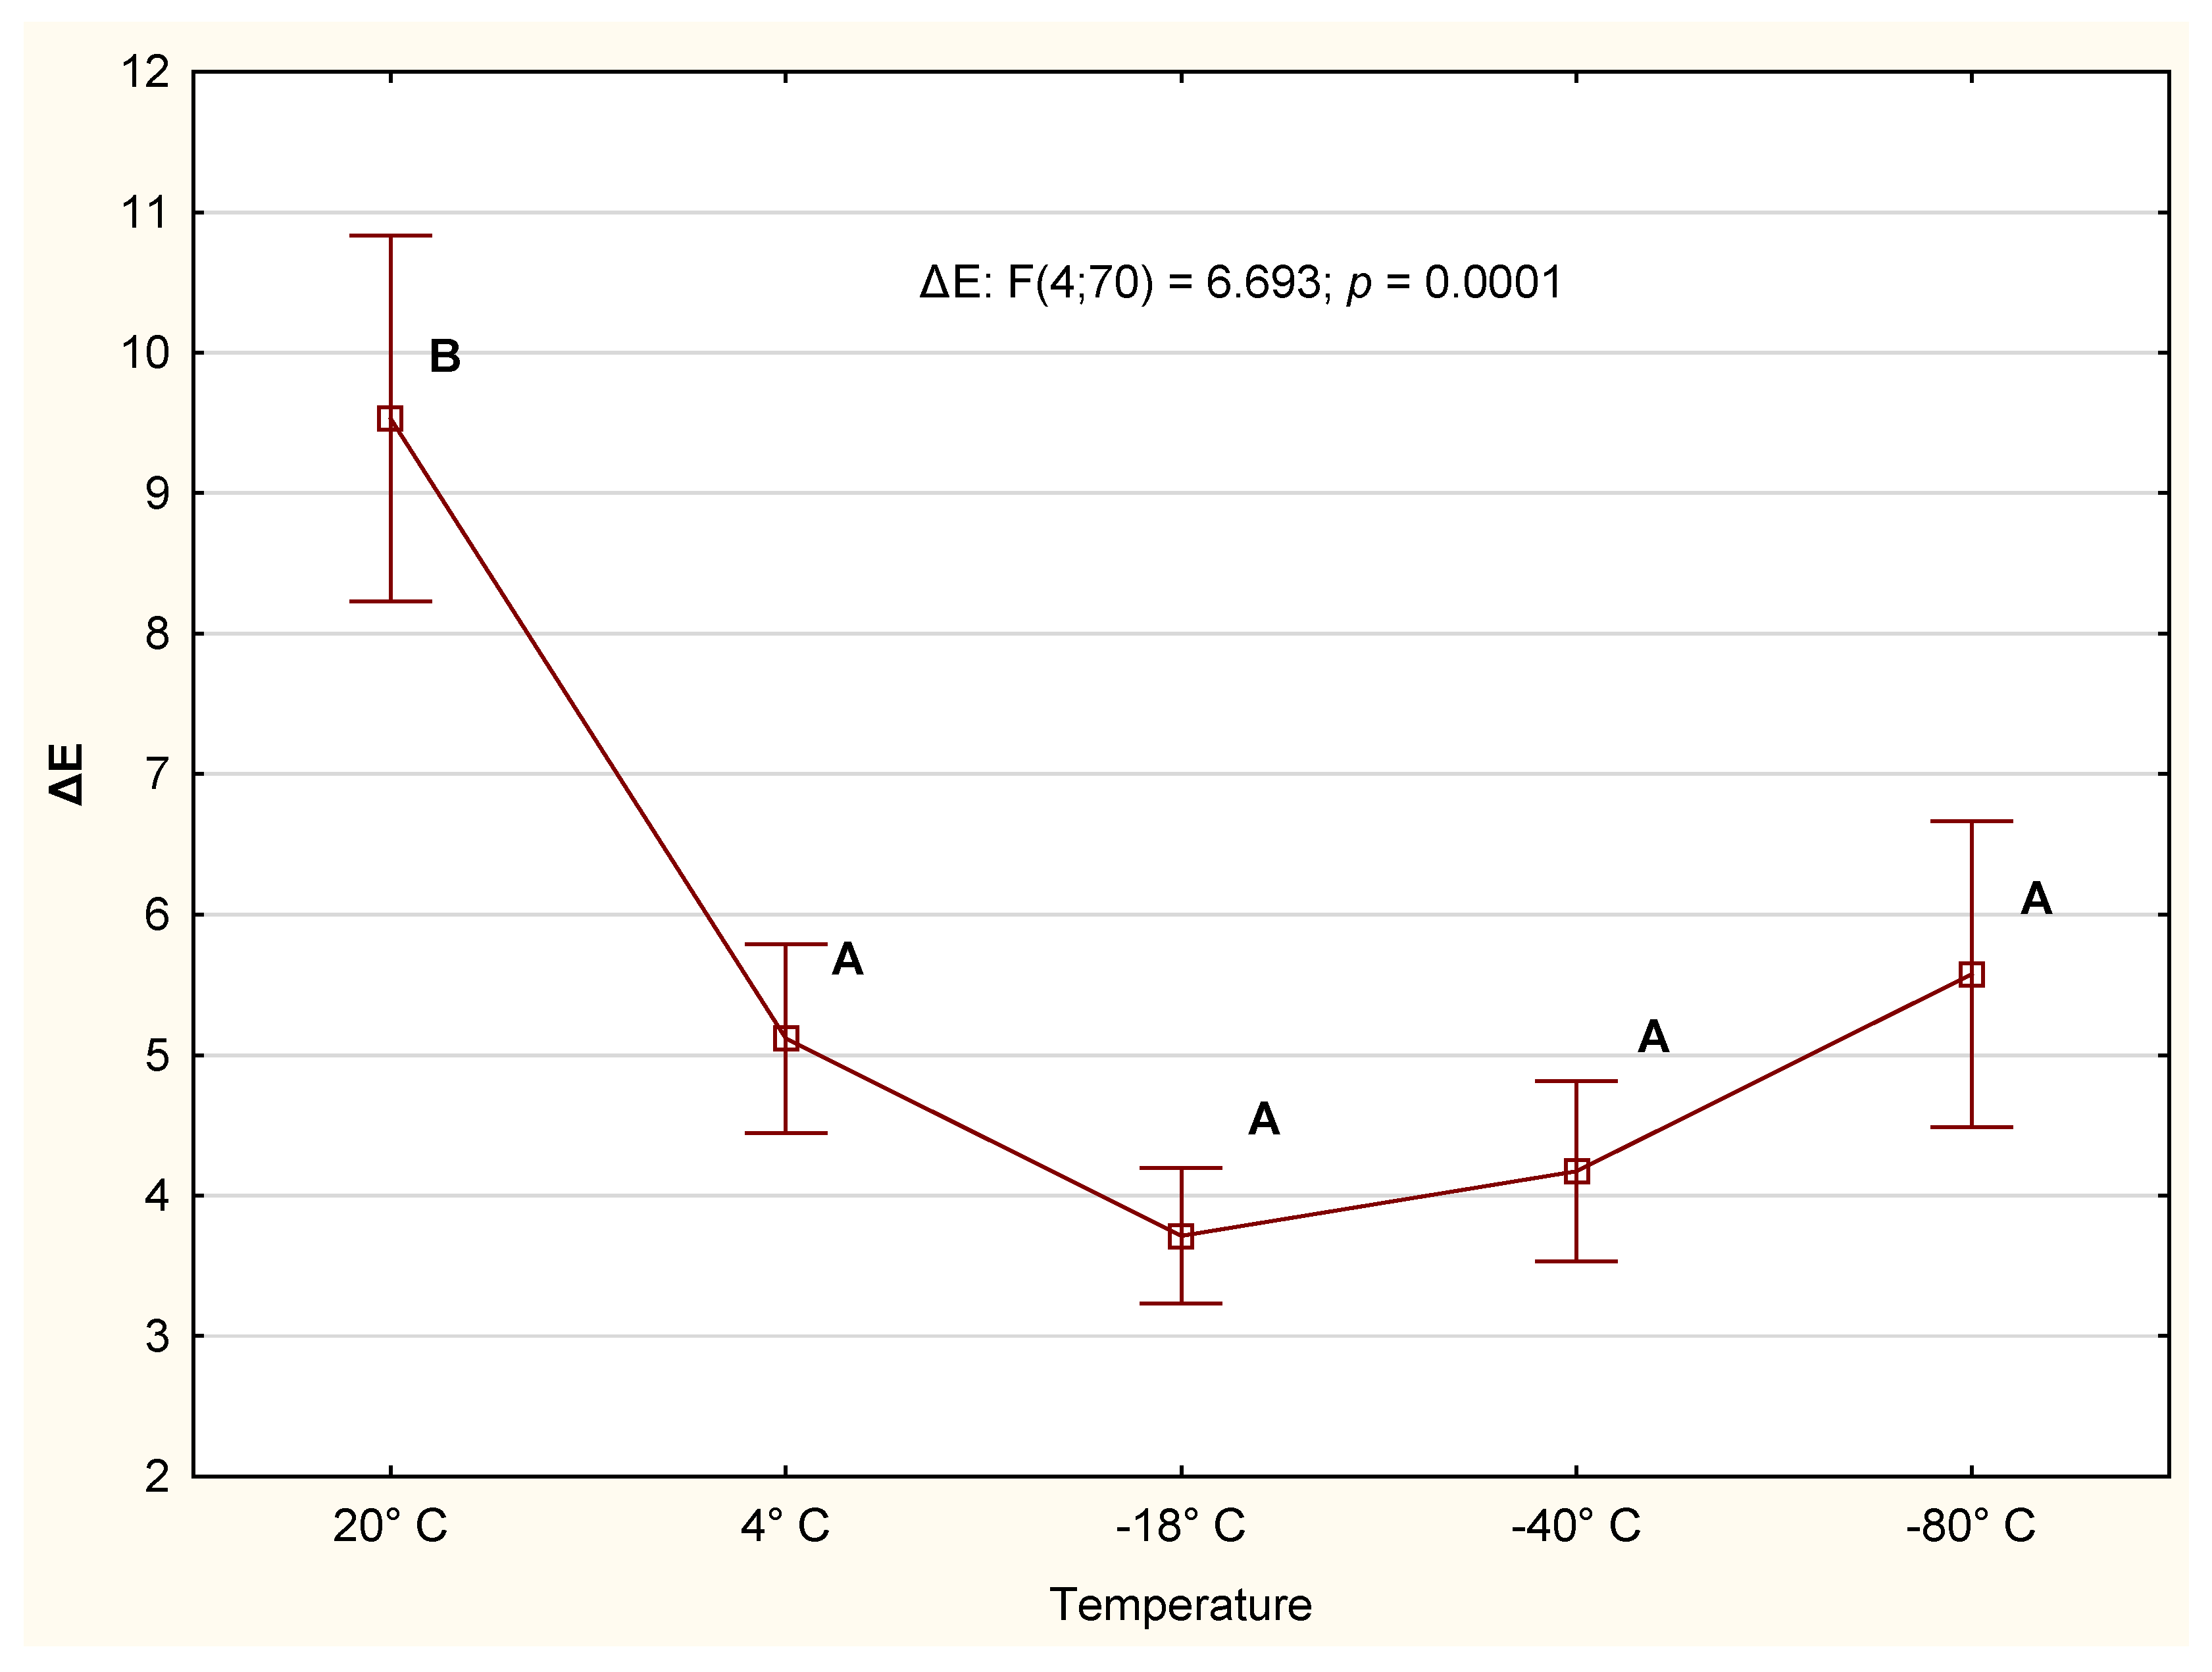
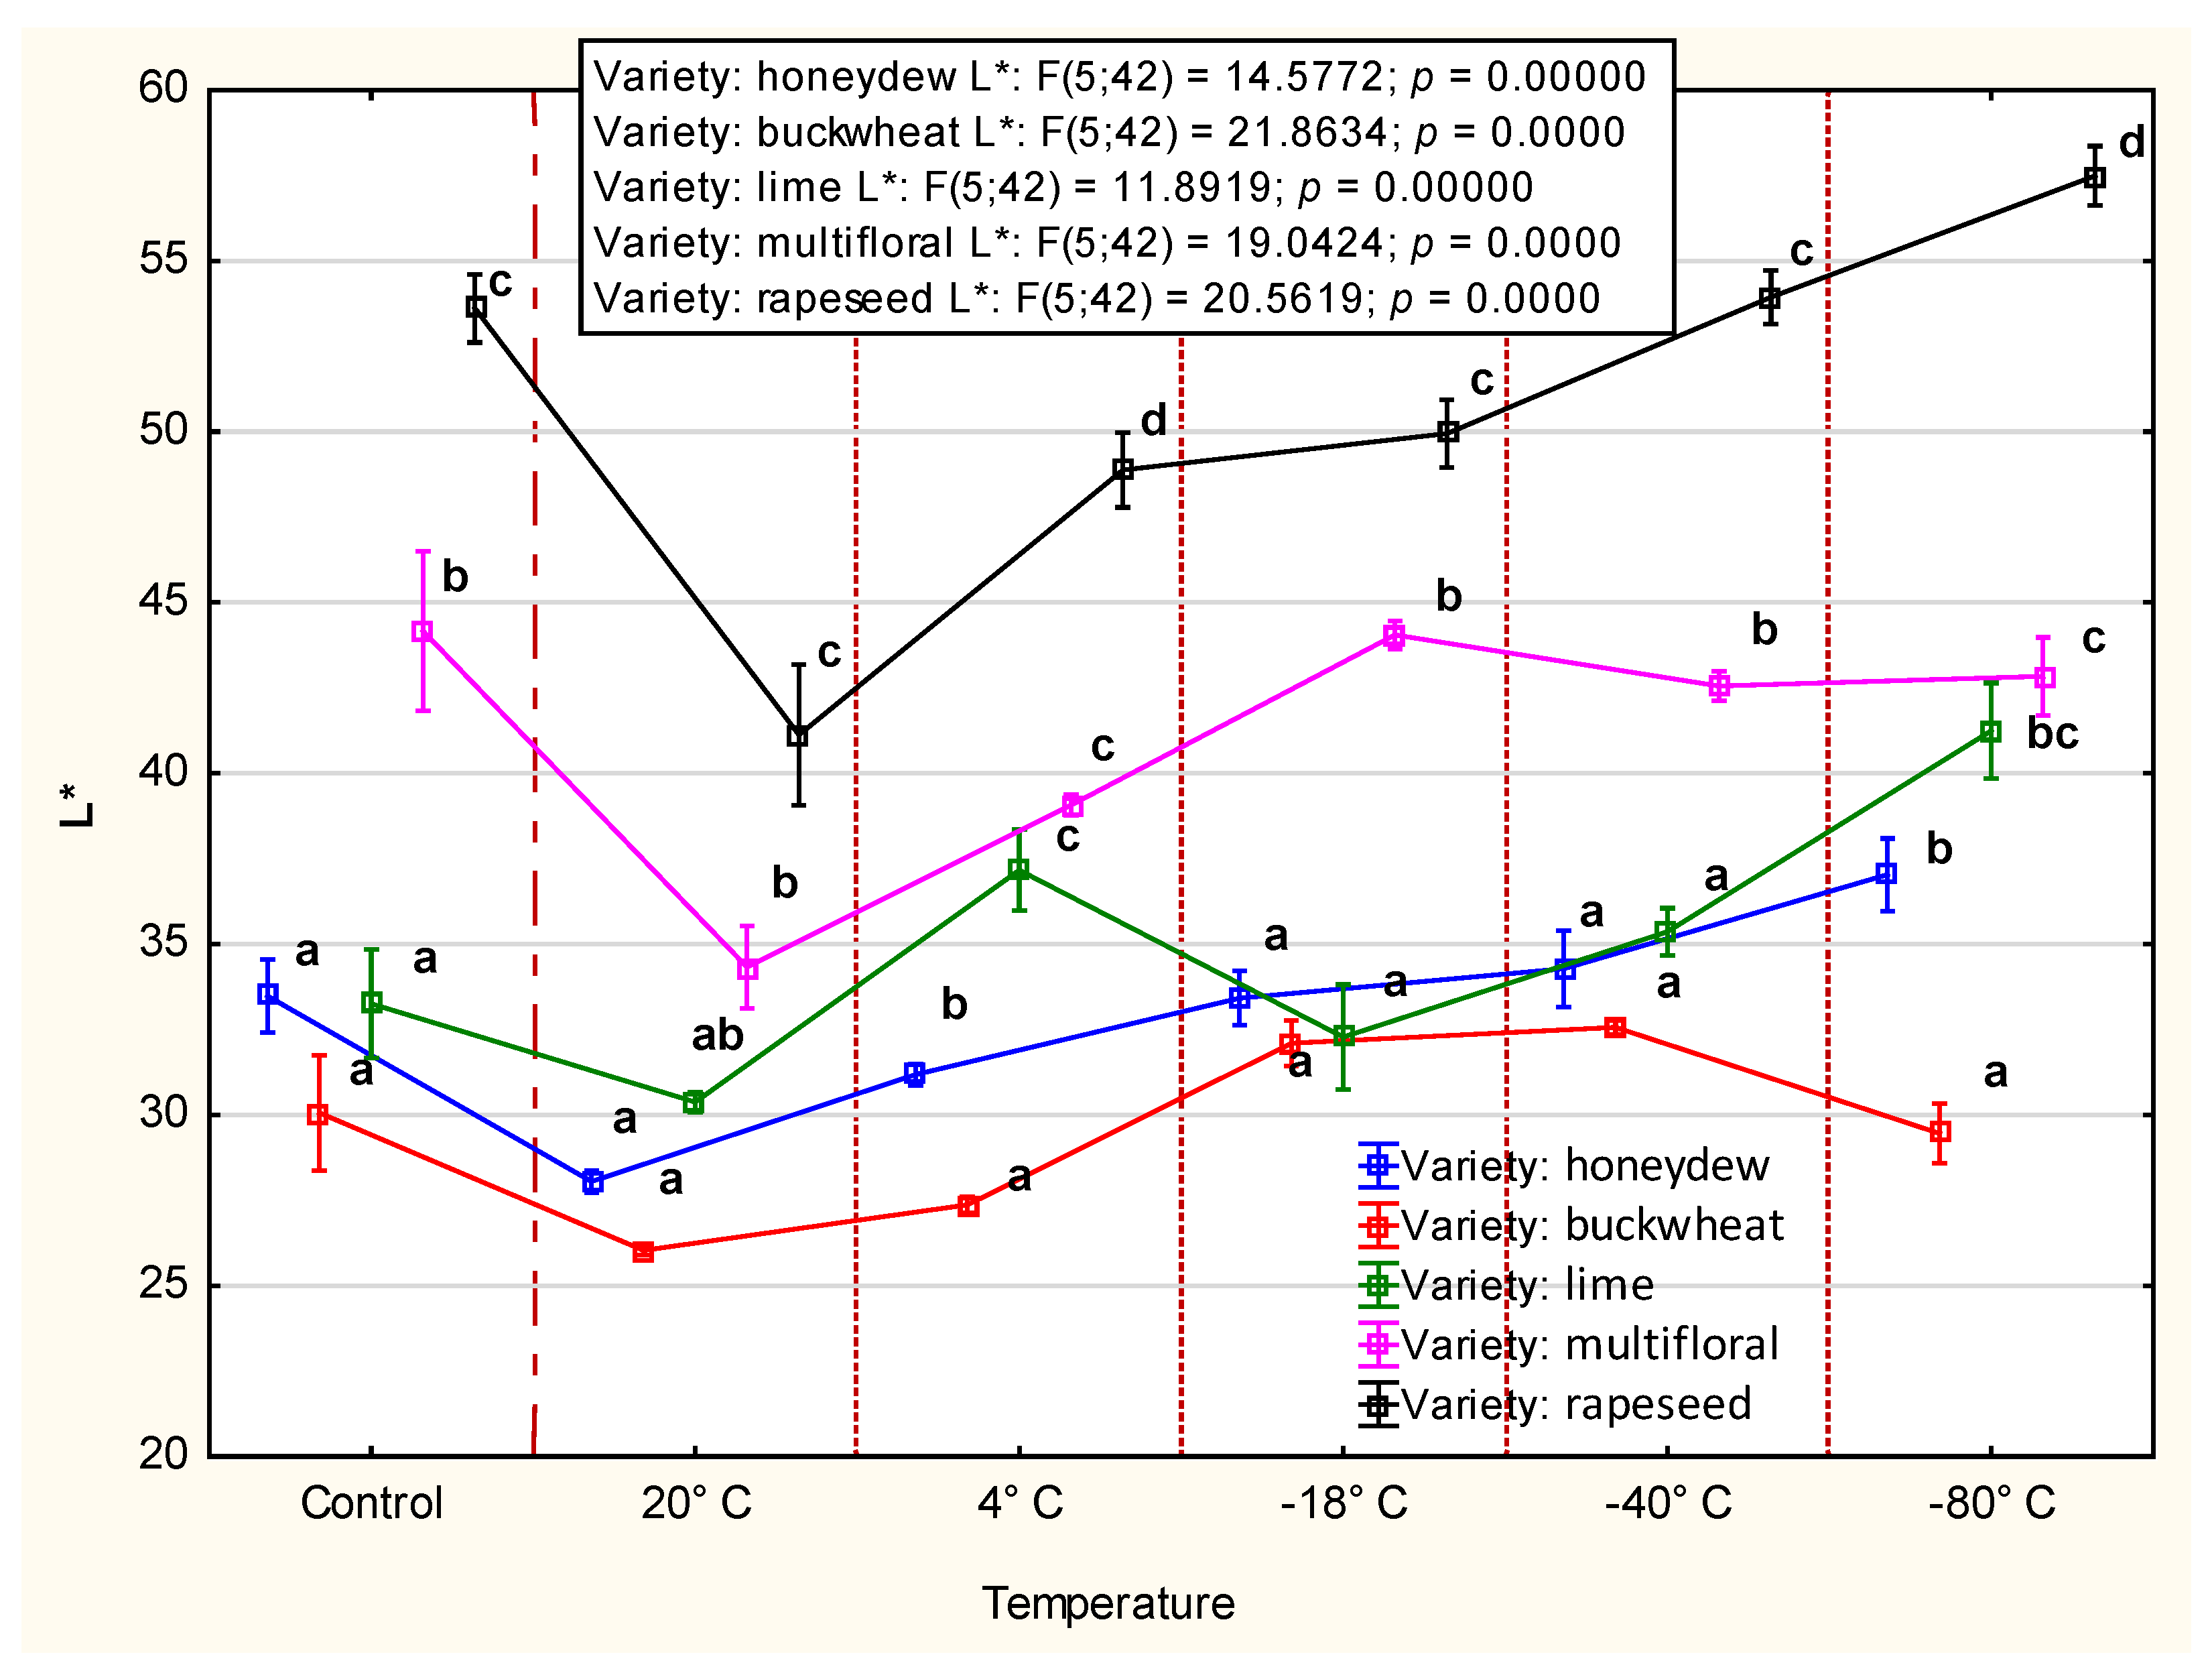
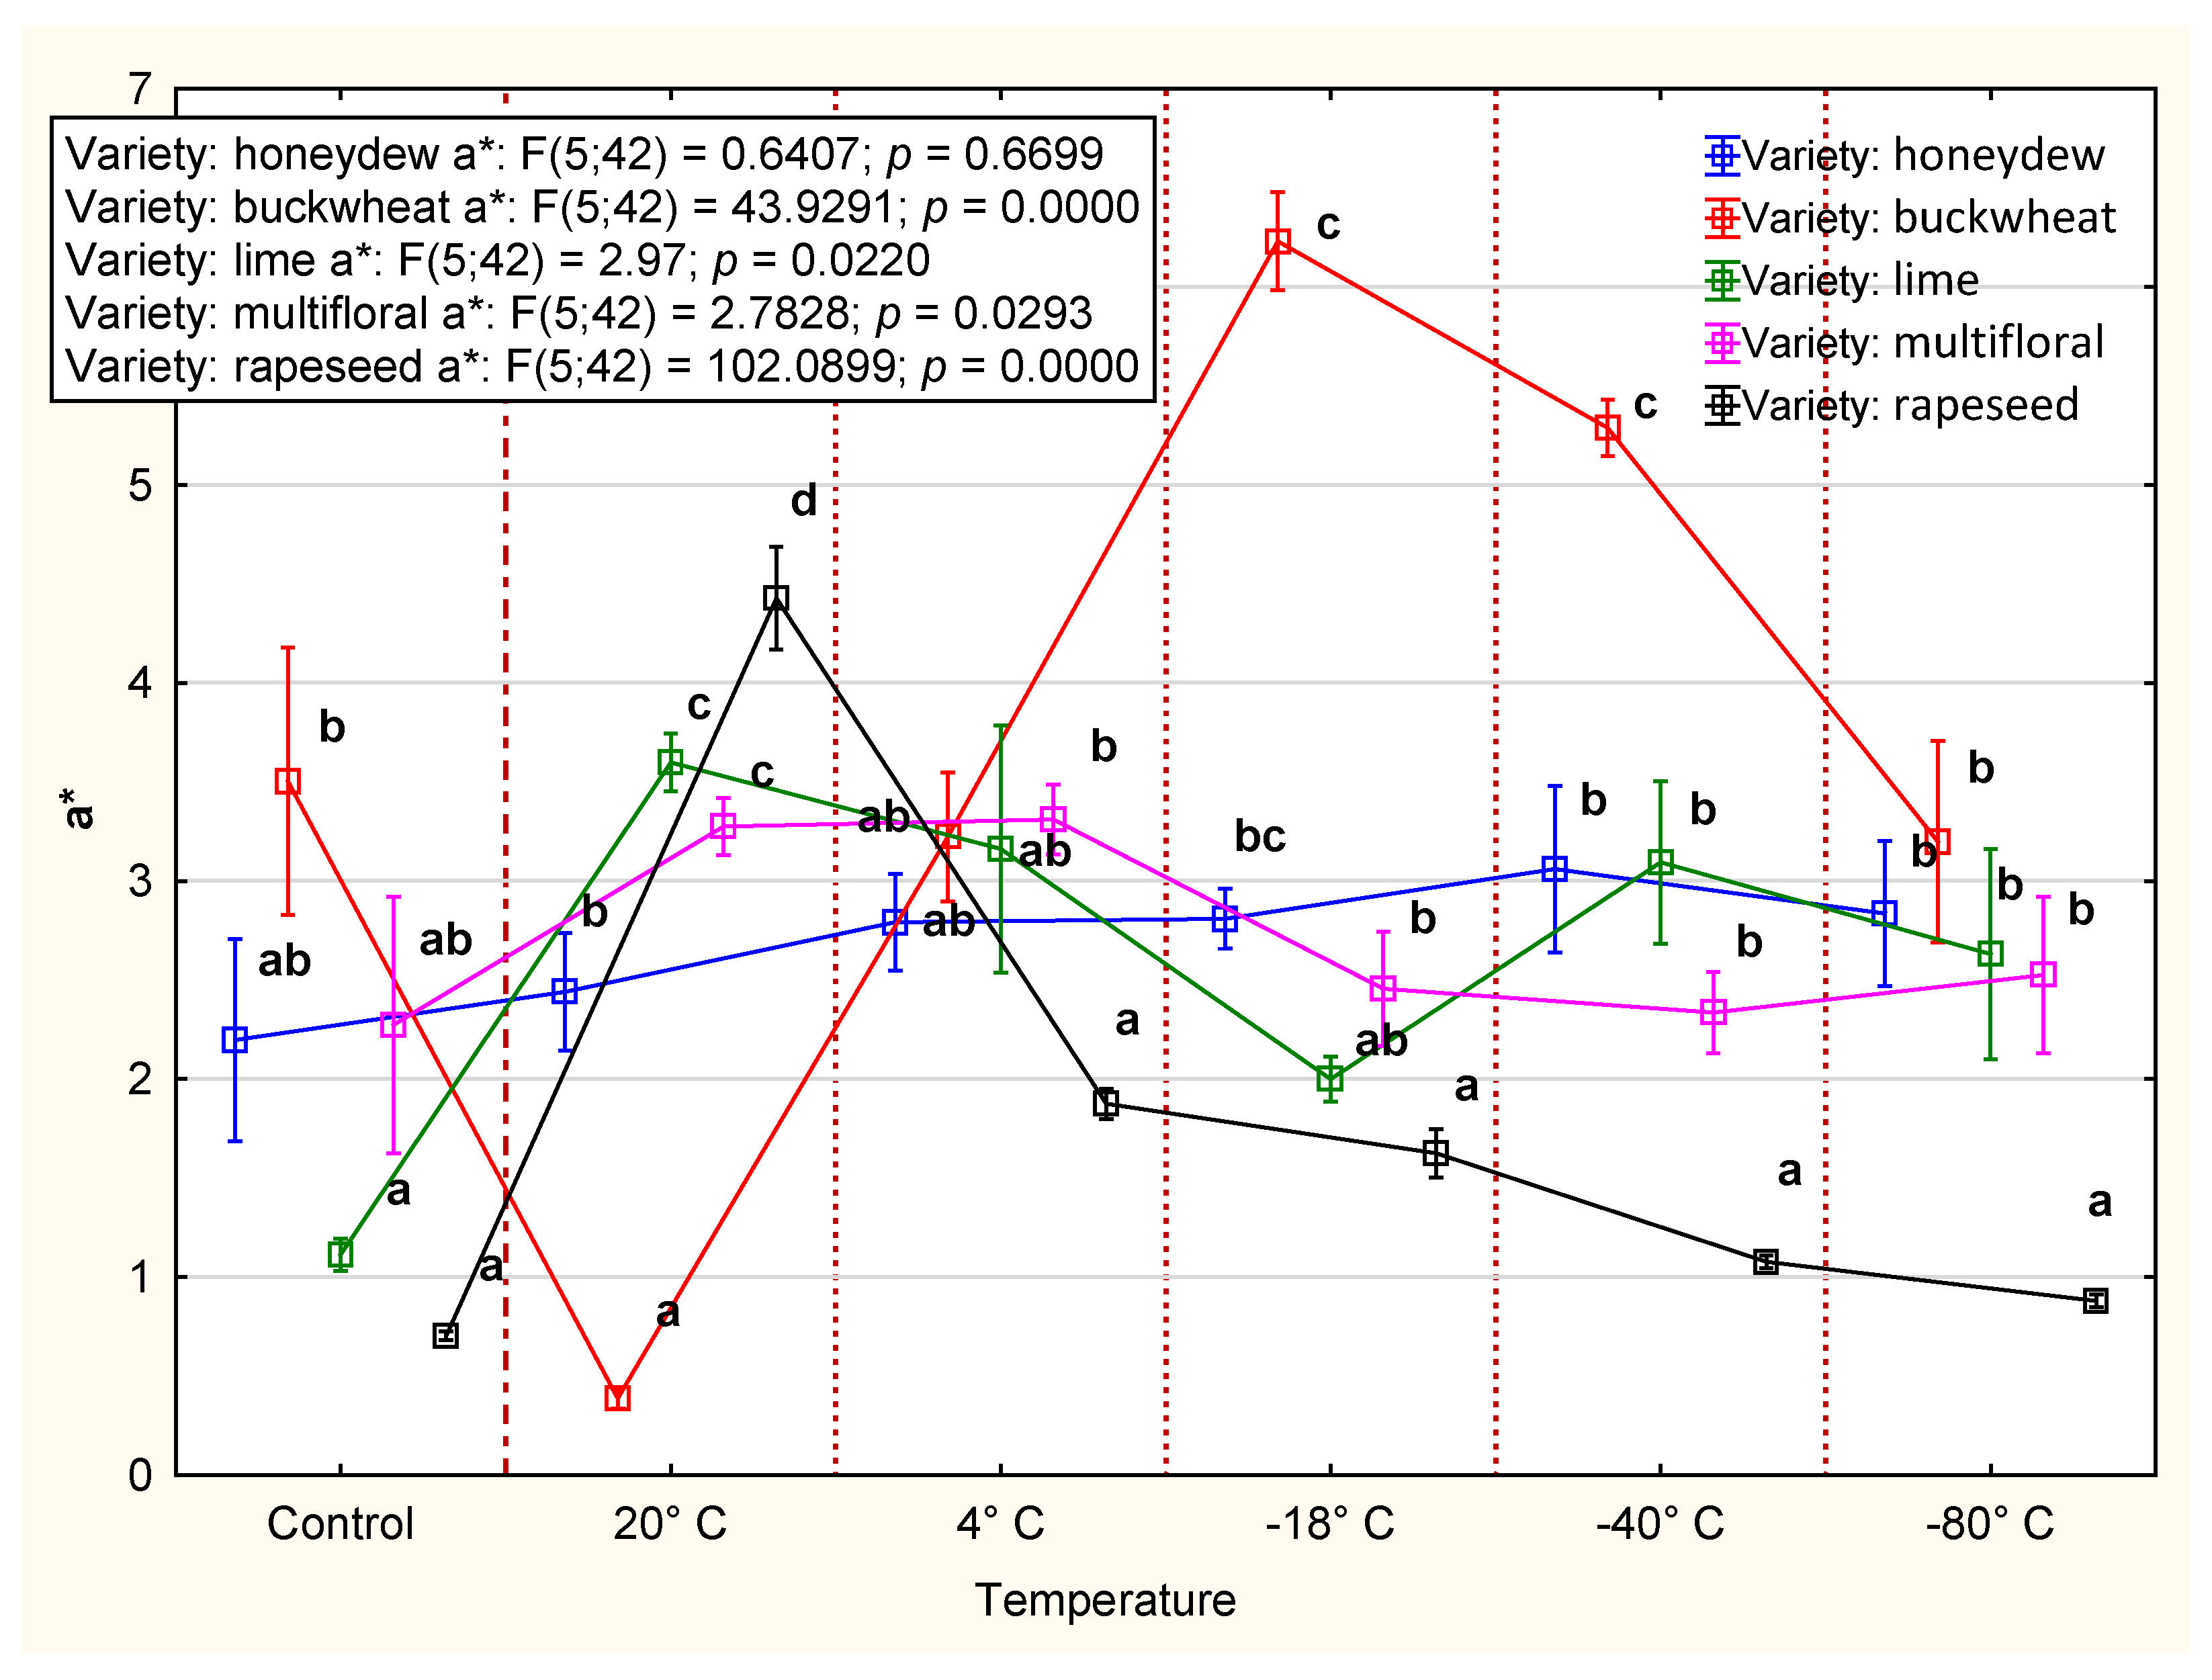
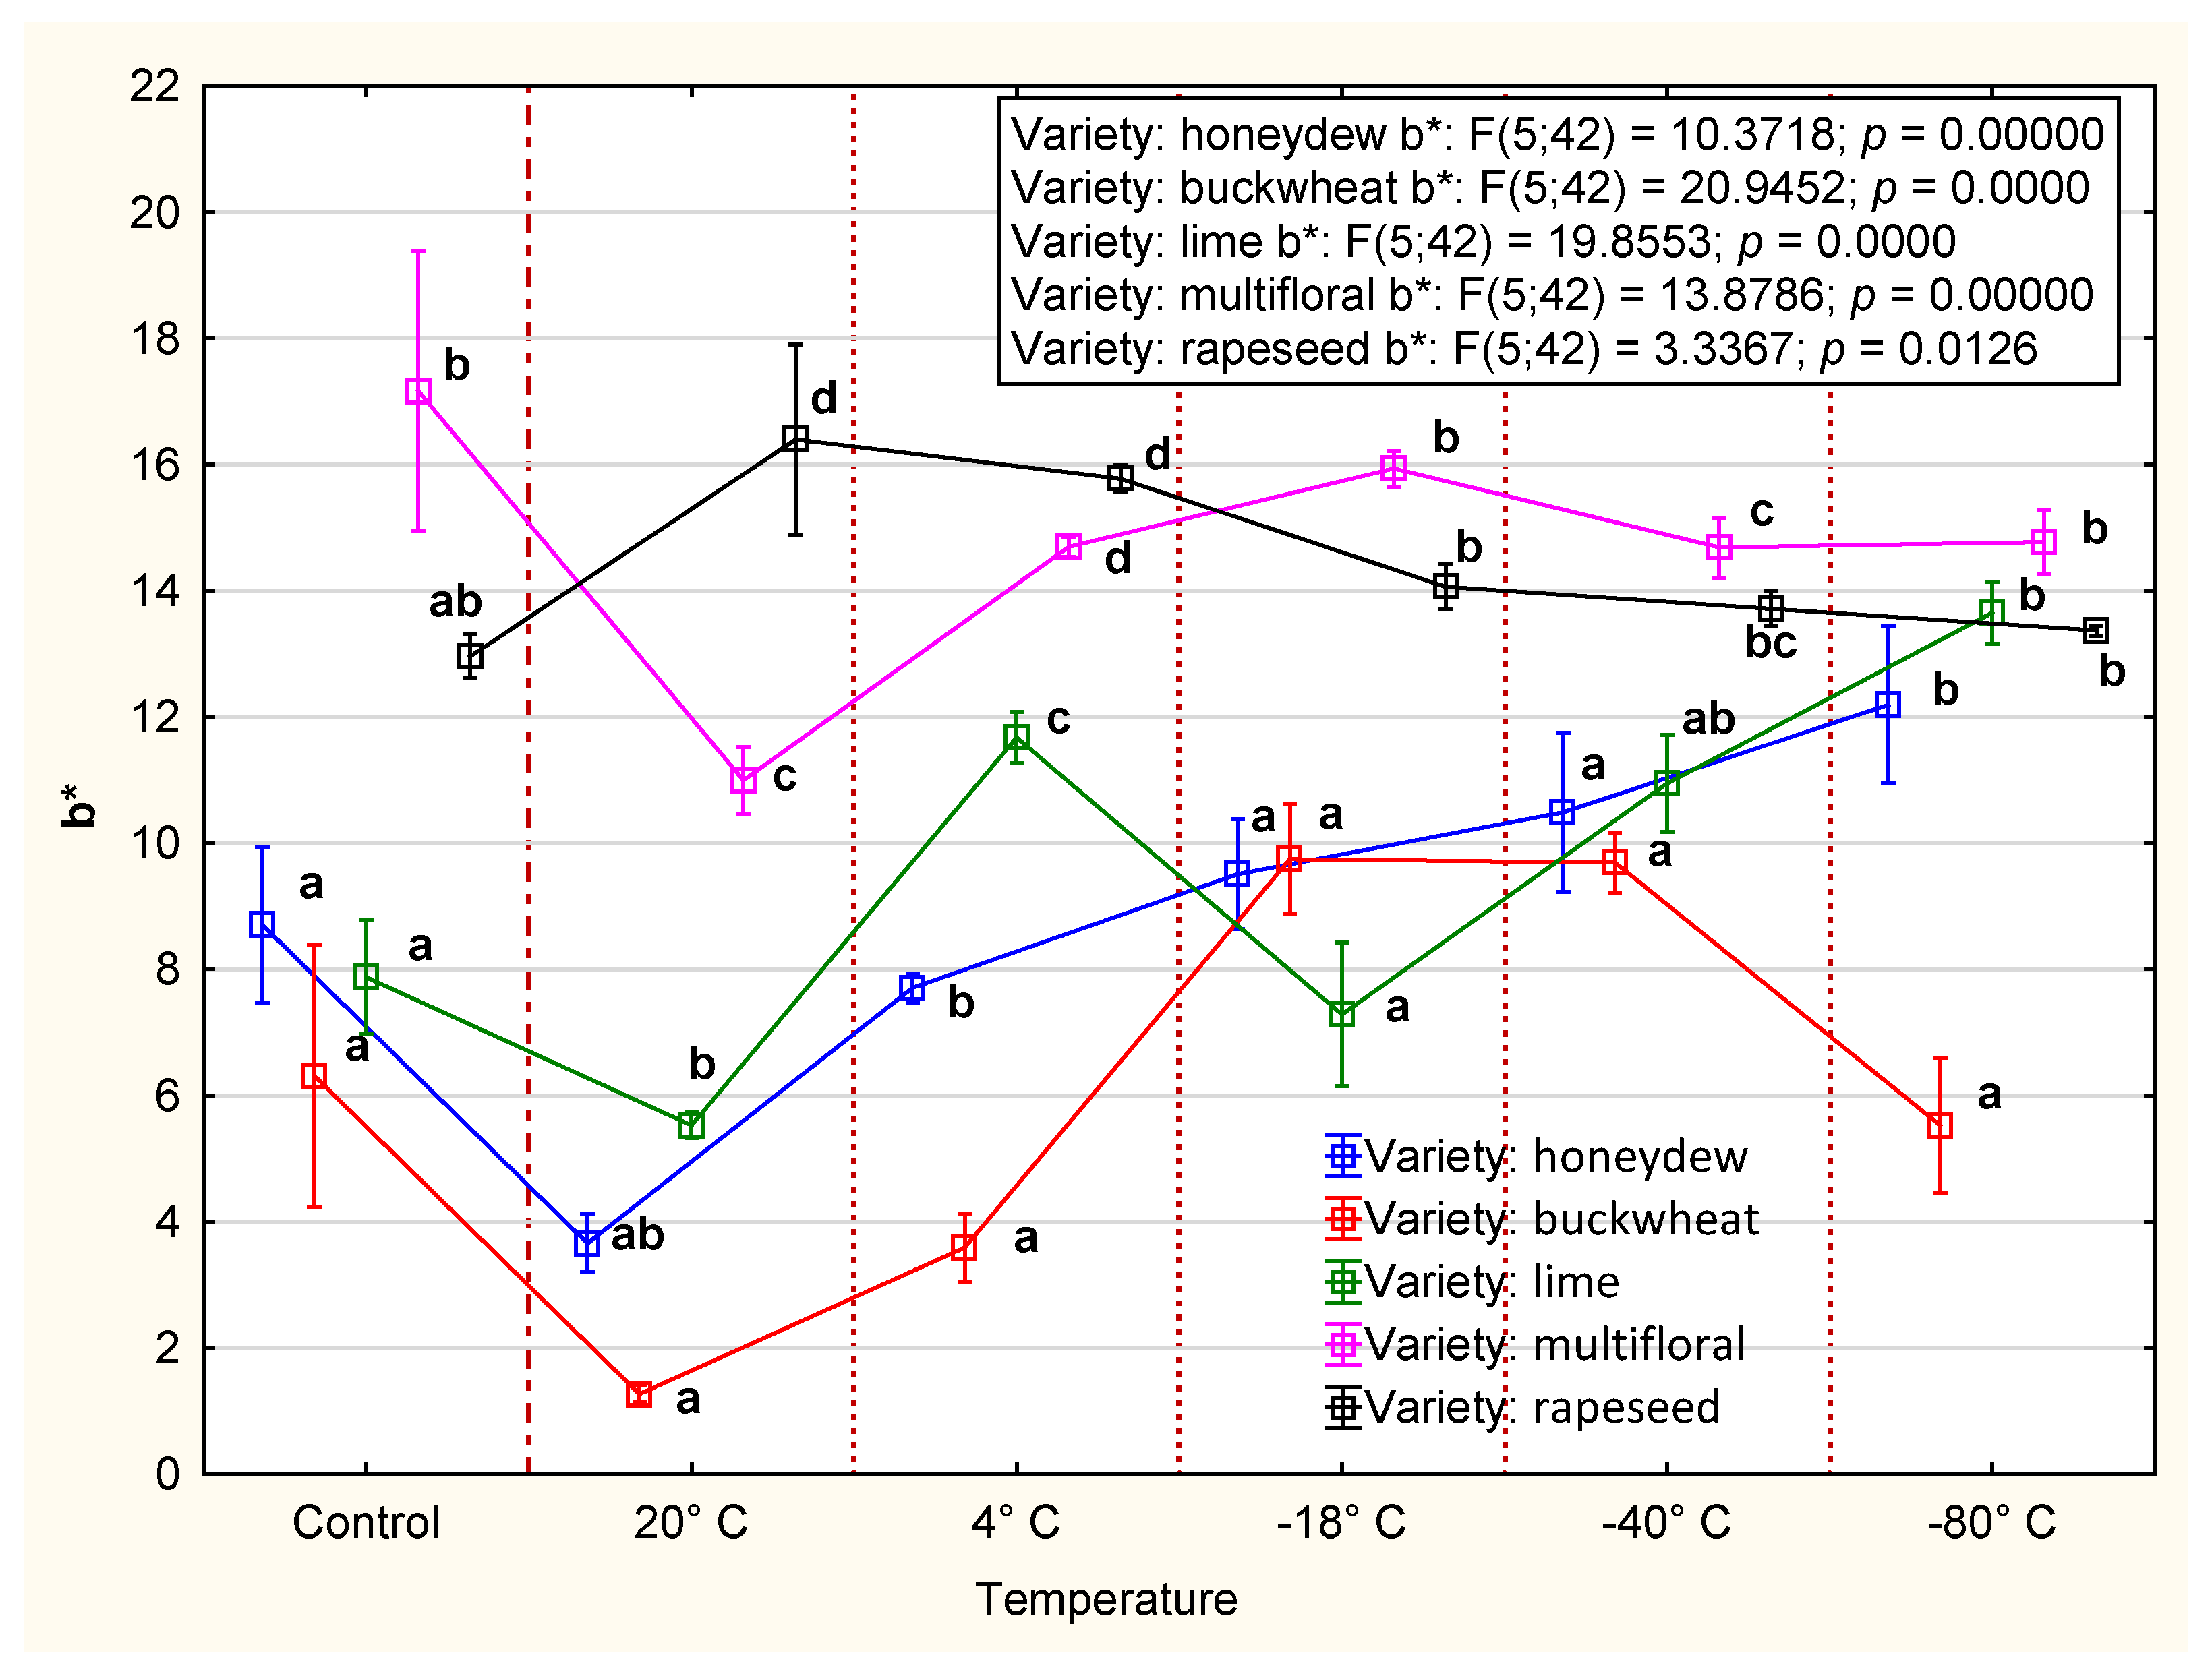
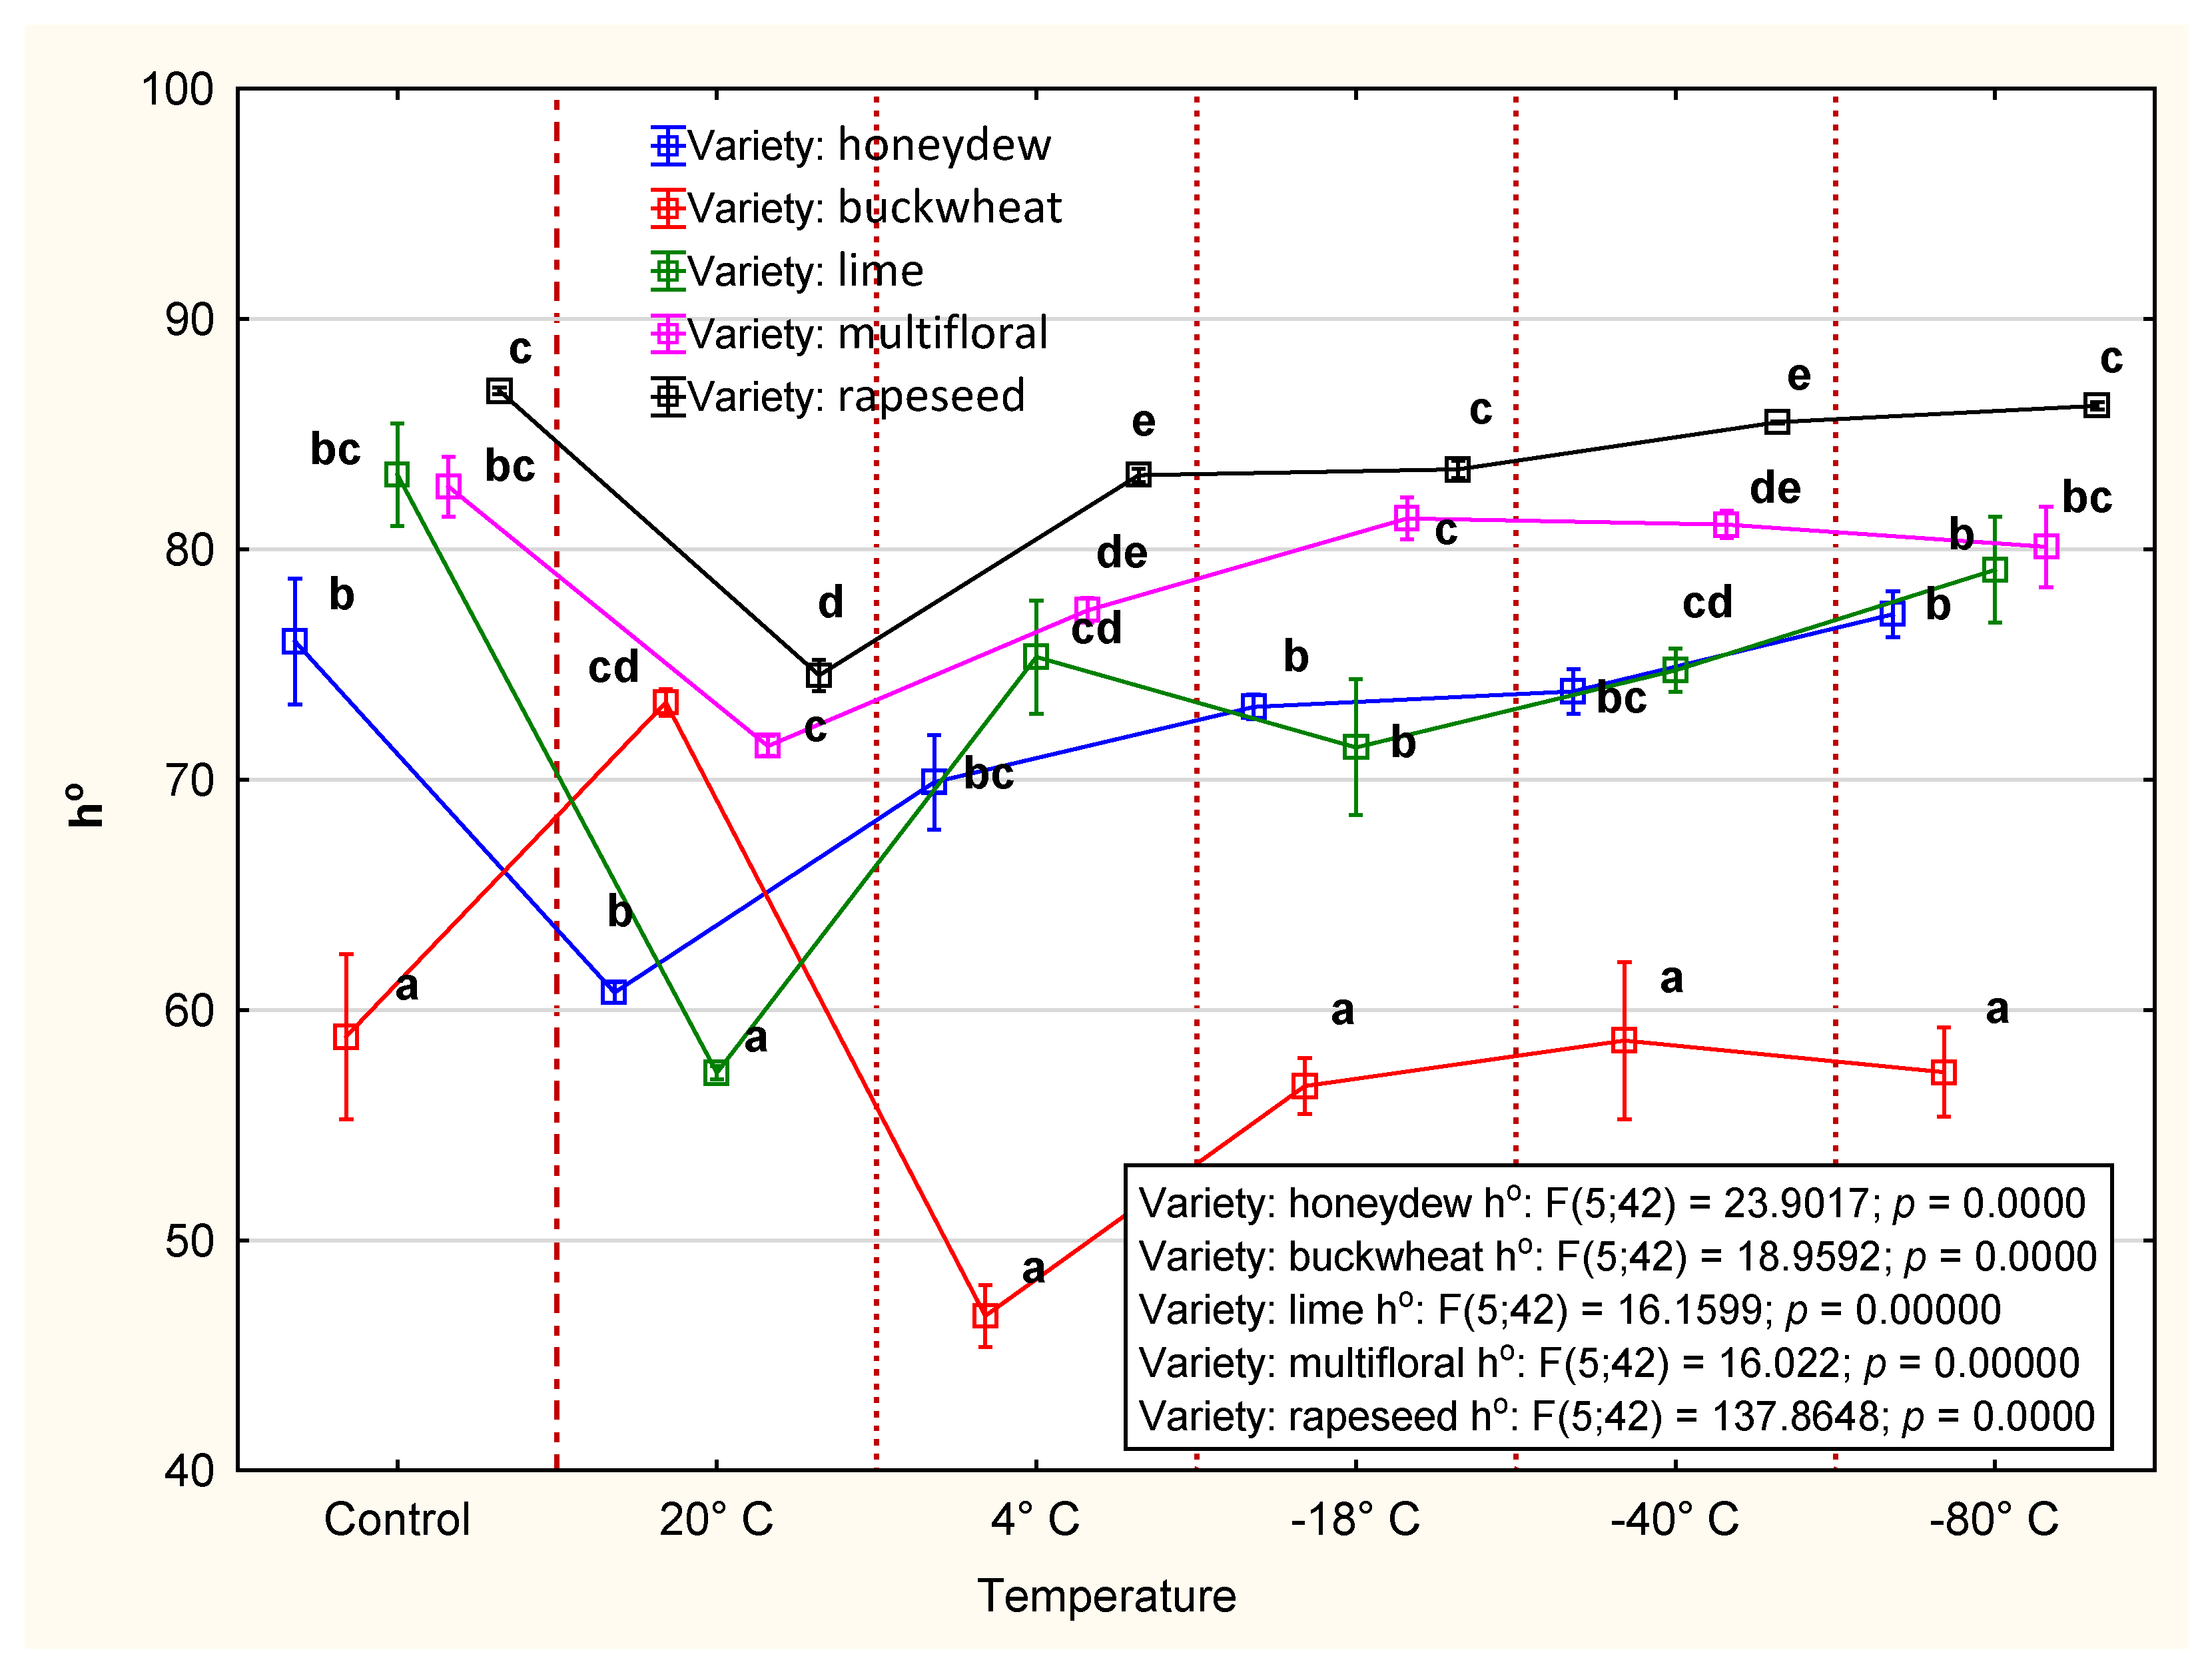
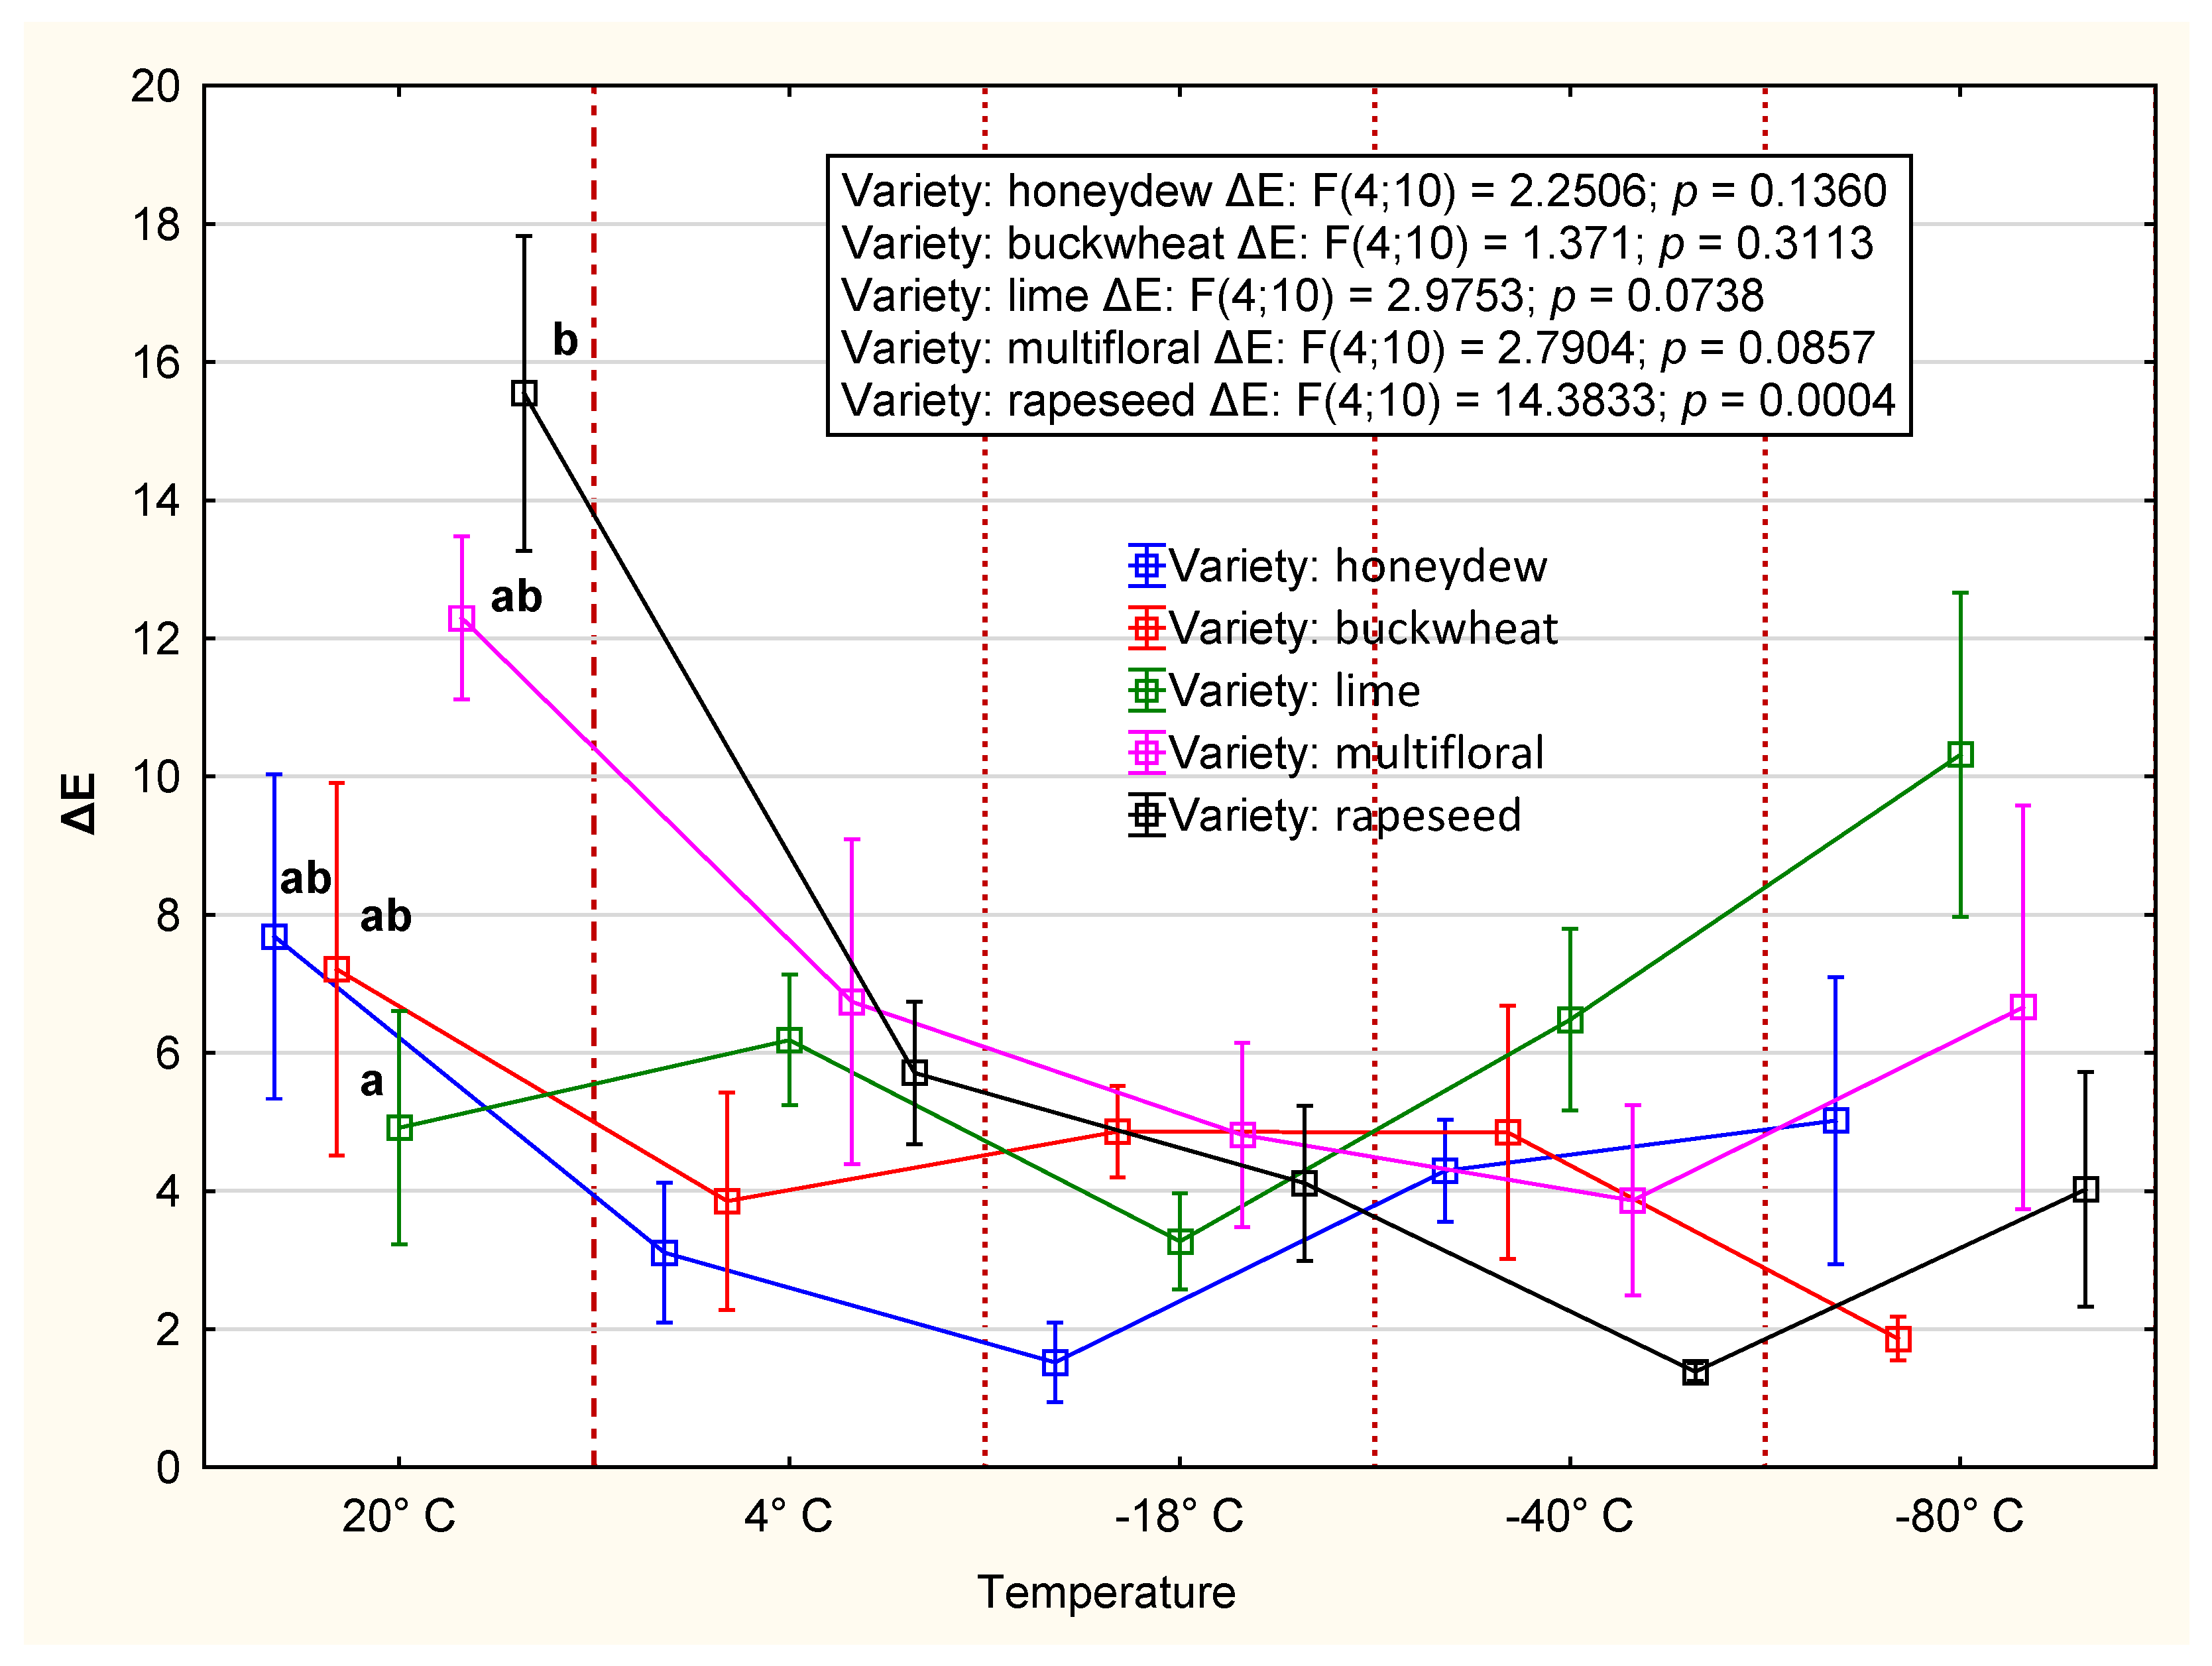
3.2.3. Color
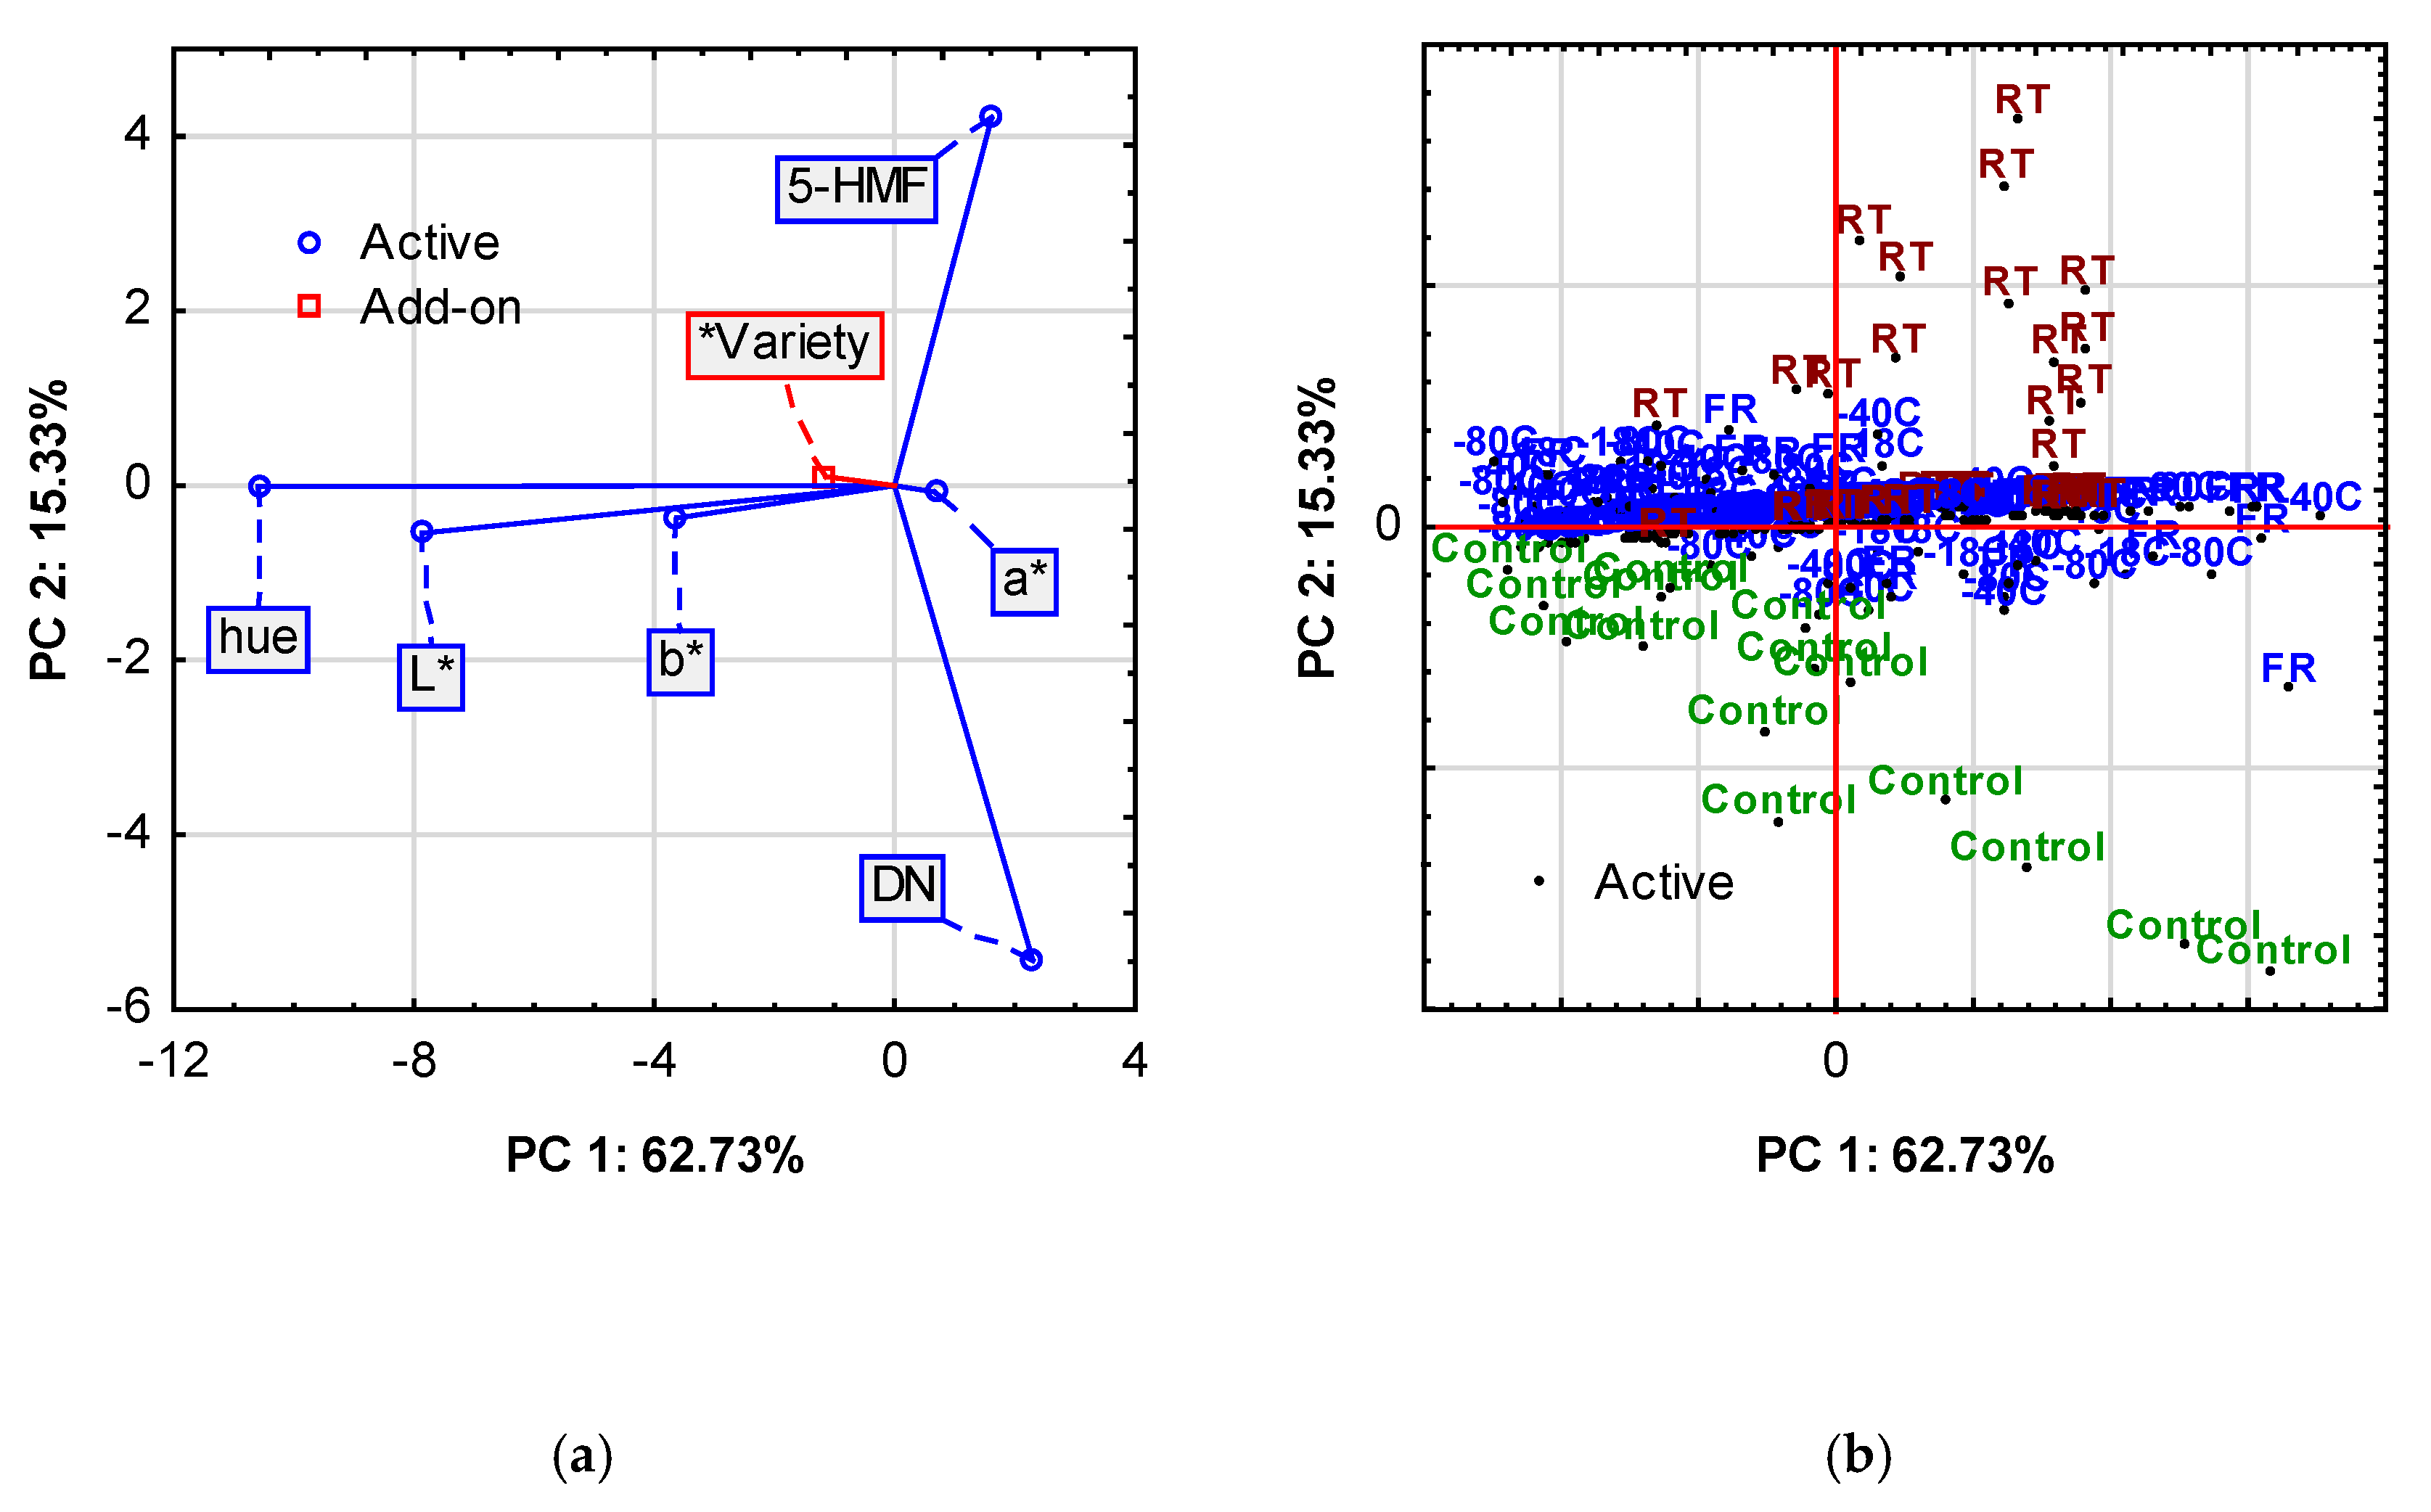
3.2.4. PCA
4. Discussion
4.1. DN and 5-HMF
4.2. CIE Color
5. Conclusions
Author Contributions
Funding
Institutional Review Board Statement
Data Availability Statement
Conflicts of Interest
References
- Alvarez-Suarez, J.M.; Tulipani, S.; Díaz, D.; Estevez, Y.; Romandini, S.; Giampieri, F.; Damiani, E.; Astolfi, P.; Bompadre, S.; Battino, M. Antioxidant and antimicrobial capacity of several monofloral Cuban honeys and their correlation with color, polyphenol content and other chemical compounds. Food Chem. Toxicol. 2010, 48, 2490–2499. [Google Scholar] [CrossRef] [PubMed]
- EU Council Directive 2001/110/EC of 20 December 2001 relating to honey. Off. J. Eur. Union 2002, L10, 47–52.
- Kędzierska-Matysek, M.; Florek, M.; Wolanciuk, A.; Skałecki, P. Effect of freezing and room temperatures storage for 18 months on quality of raw rapeseed honey (Brassica napus). J. Food Sci. Technol. 2016, 53, 3349–3355. [Google Scholar] [CrossRef] [PubMed]
- Scripcă, L.A.; Amariei, S. The Use of Ultrasound for Preventing Honey Crystallization. Foods 2021, 10, 773. [Google Scholar] [CrossRef]
- Tarapoulouzi, M.; Mironescu, M.; Drouza, C.; Mironescu, I.D.; Agriopoulou, S. Insight into the Recent Application of Chemometrics in Quality Analysis and Characterization of Bee Honey during Processing and Storage. Foods 2023, 12, 473. [Google Scholar] [CrossRef]
- FAO; WHO. Codex Alimentarius—International Food Standards; Standard for Honey CXS 12-1981. Adopted in 1981, Amended in 2019, 2022; FAO: Rome, Italy; WHO: Geneva, Switzerland, 2022; Available online: https://www.fao.org/fao-who-codexalimentarius/codex-texts/list-standards/en/ (accessed on 11 February 2025).
- Machado De-Melo, A.A.; Almeida-Muradian, L.B.D.; Sancho, M.T.; Pascual-Maté, A. Composition and properties of Apis mellifera honey: A review. J. Apic. Res. 2018, 57, 5–37. [Google Scholar] [CrossRef]
- Panseri, S.; Borgonovo, F.; Guarino, M.; Chiesa, L.; Piana, M.L.; Rizzi, R.; Mortarino, M. Monitoring Volatile Organic Compounds and Aroma Profile of Robinia pseudoacacia L. Honey at Different Storage Temperatures during Shelf Life. Foods 2023, 12, 3105. [Google Scholar] [CrossRef]
- Alaerjani, W.M.A.; Abu-Melha, S.; Alshareef, R.M.H.; Al-Farhan, B.S.; Ghramh, H.A.; Al-Shehri, B.M.A.; Bajaber, M.A.; Khan, K.A.; Alrooqi, M.M.; Modawe, G.A.; et al. Biochemical Reactions and Their Biological Contributions in Honey. Molecules 2022, 27, 4719. [Google Scholar] [CrossRef]
- Chou, W.M.; Liao, H.C.; Yang, Y.C.; Peng, C.C. Evaluation of honey quality with stored time and temperatures. J. Food Nutr. Res. 2020, 8, 591–599. [Google Scholar] [CrossRef]
- Bulut, L.; Kilic, M. Kinetics of hydroxymethylfurfural accumulation and color change in honey during storage in relation to moisture content. J. Food Process. Preserv. 2009, 33, 22–32. [Google Scholar] [CrossRef]
- Labuza, T.P.; Baisier, W.M. The kinetics of nonenzymatic browning. In Physical Chemistry of Foods; Schwartzberg, H.G., Hartel, R.W., Eds.; Marcel Dekker: New York, USA, 1992; pp. 595–649. [Google Scholar]
- Shapla, U.M.; Solayman, M.; Alam, N.; Khalil, M.I.; Gan, S.H. 5-Hydroxymethylfurfural (HMF) levels in honey and other food products: Effects on bees and human health. Chem. Cent. J. 2018, 12, 35. [Google Scholar] [CrossRef] [PubMed]
- Manickavasagam, G.; Saaid, M.; Lim, V. Impact of prolonged storage on quality assessment properties and constituents of honey: A systematic review. J. Food Sci. 2024, 89, 811–833. [Google Scholar] [CrossRef] [PubMed]
- Sajtos, Z.; Ragyák, Á.Z.; Hódi, F.; Szigeti, V.; Bellér, G.; Baranyai, E. Hydroxymethylfurfural content of old honey samples–Does the sticky treat really last forever? LWT 2024, 193, 115781. [Google Scholar] [CrossRef]
- Starowicz, M.; Ostaszyk, A.; Zieliński, H. The Relationship between the Browning Index, Total Phenolics, Color, and Antioxidant Activity of Polish-Originated Honey Samples. Foods 2021, 10, 967. [Google Scholar] [CrossRef]
- Piotraszewska-Pająk, A.; Gliszczyńska-Świgło, A. Directions of colour changes of nectar honeys depending on honey type and storage conditions. J. Apic. Sci. 2015, 59, 51–61. [Google Scholar] [CrossRef]
- Vaikousi, H.; Koutsoumanis, K.; Biliaderis, C.G. Kinetic modelling of non-enzymatic browning in honey and diluted honey systems subjected to isothermal and dynamic heating protocols. J. Food Eng. 2009, 95, 541–550. [Google Scholar] [CrossRef]
- Jones, Z.J.; Huang, Y.; Green, K.J.; Hammer, K.A. Changes in antibacterial activity, colour, and hydrogen peroxide content of Western Australian Jarrah and Marri honeys after storage at different temperatures over time. J. Appl. Microbiol. 2023, 134, lxad164. [Google Scholar] [CrossRef]
- Bhandari, B.; D’Arcy, B.; Kelly, C. Rheology and crystallization kinetics of honey: Present status. Int. J. Food Prop. 1999, 2, 217–226. [Google Scholar] [CrossRef]
- da Silva, P.M.; Gonzaga, L.V.; Biluca, F.C.; Schulz, M.; Vitali, L.; Micke, G.; Costa, A.C.O.; Fett, R. Stability of Brazilian Apis mellifera L. honey during prolonged storage: Physicochemical parameters and bioactive compounds. LWT 2020, 129, 109521. [Google Scholar] [CrossRef]
- Cavia, M.M.; Fernández-Muino, M.A.; Alonso-Torre, S.R.; Huidobro, J.F.; Sancho, M.T. Evolution of acidity of honeys from continental climates: Influence of induced granulation. Food Chem. 2007, 100, 1728–1733. [Google Scholar] [CrossRef]
- Braghini, F.; Biluca, F.C.; Ottequir, F.; Gonzaga, L.V.; da Silva, M.; Vitali, L.; Micke, G.A.; Costa, A.C.O.; Fett, R. Effect of different storage conditions on physicochemical and bioactive characteristics of thermally processed stingless bee honeys. LWT 2020, 131, 109724. [Google Scholar] [CrossRef]
- Ministry of Agriculture and Rural Development (MARD). Regulation of the Minister of Agriculture and Rural Development of 14 January 2009 on the methods of analysis related to the assessment of honey. J. Laws 2009, 17, 2018–2030. [Google Scholar]
- Bogdanov, S.; Martin, P.; Lüllmann, C. Harmonised methods of the European Honey Commission. Apidologie 2009, 1–59. Available online: http://www.ihc-platform.net/ihcmethods2009.pdf (accessed on 10 February 2025).
- Kędzierska-Matysek, M.; Teter, A.; Stryjecka, M.; Skałecki, P.; Domaradzki, P.; Rudaś, M.; Florek, M. Relationships Linking the Colour and Elemental Concentrations of Blossom Honeys with Their Antioxidant Activity: A Chemometric Approach. Agriculture 2021, 11, 702. [Google Scholar] [CrossRef]
- White, J. Spectrophotometric method for hydroxymethylfurfural in honey. J. Assoc. Off. Anal. Chem. 1979, 62, 509–514. [Google Scholar] [CrossRef]
- Czernel, G.; Bloch, D.; Matwijczuk, A.; Cieśla, J.; Kędzierska-Matysek, M.; Florek, M.; Gagoś, M. Biodirected Synthesis of Silver Nanoparticles Using Aqueous Honey Solutions and Evaluation of Their Antifungal Activity against Pathogenic candida spp. Int. J. Mol. Sci. 2021, 22, 7715. [Google Scholar] [CrossRef]
- Vijayakumar, K.T.; Bhat, N.S.; Neethu, T.; Nayimabanu, T.; Nithin, H.L. Periodical changes in quality parameters of honey during storage and processing. Int. J. Chem. Stud. 2021, 9, 19–24. [Google Scholar] [CrossRef]
- Al-Diab, D.; Jarkas, B. Effect of storage and thermal treatment on the quality of some local brands of honey from Latakia markets. J. Entomol. Zool. Stud. 2015, 3, 328–334. [Google Scholar]
- Flanjak, I.; Kenjerić, D.; Strelec, I.; Rajs, B.B.; Primorac, L. Effect of processing and storage on sage (Salvia officinalis L.) honey quality. J. Microbiol. Biotechnol. Food Sci. 2022, 11, e3375. [Google Scholar] [CrossRef]
- Czipa, N.; Phillips, C.J.C.C.; Kovács, B. Composition of acacia honeys following processing, storage and adulteration. J. Food Sci. Technol. 2019, 56, 1245–1255. [Google Scholar] [CrossRef]
- Wesołowska, M.; Dżugan, M. Aktywność i stabilność termiczna diastazy występującej w podkarpackich miodach odmianowych. Zywn. Nauk. Technol. Ja. 2017, 24, 103–112. [Google Scholar] [CrossRef]
- Budianto, B.; Kusmardini, D.; Feri, Z.O.; Arifin, M.J.; Suparmi, A.; Kristiani, K. The effect of processing and storage on Klanceng honey (Tetragonula laeviceps). Agron. Mesoam. 2023, 34, 52131. [Google Scholar] [CrossRef]
- Seraglio, S.K.T.; Bergamo, G.; Molognoni, L.; Daguer, H.; Silva, B.; Gonzaga, L.V.; Fett, R.; Costa, A.C.O. Quality changes during long-term storage of a peculiar Brazilian honeydew honey: “Bracatinga”. J. Food Compos. Anal. 2021, 97, 103769. [Google Scholar] [CrossRef]
- Bhalchandra, W.; Joshi, M.A.; Jawalkar, N. Effect of storage on various honey quality parameters of Apis mellifera honey harvested from Kannad region, Aurangabad. J. Pharmacogn. Phytochem. 2022, 11, 239–246. [Google Scholar] [CrossRef]
- Popek, S. A procedure to identify a honey type. Food Chem. 2002, 79, 401–406. [Google Scholar] [CrossRef]
- Ghoniemy, H.A.; Esmail, A.H.M.; Mahmoud, A.A.E.T. Evaluation of vitamin C, proline, enzymes and hydroxymethylfurfural levels in clover honey at different storage conditions. Egypt. J. Chem. 2022, 65, 427–434. [Google Scholar] [CrossRef]
- Raweh, H.S.A.; Badjah-Hadj-Ahmed, A.Y.; Iqbal, J.; Alqarni, A.S. Impact of Different Storage Regimes on the Levels of Physicochemical Characteristics, Especially Free Acidity in Talh (Acacia gerrardii Benth.) Honey. Molecules 2022, 27, 5959. [Google Scholar] [CrossRef]
- Sancho, M.T.; Muniategui, S.; Huidobro, J.F.; Lozano, J.S. Aging of honey. J. Agric. Food Chem. 1992, 1002, 134–138. [Google Scholar] [CrossRef]
- Halagarda, M.; Groth, S.; Popek, S.; Rohn, S.; Pedan, V. Antioxidant activity and phenolic profile of selected organic and conventional honeys from Poland. Antioxidants 2020, 9, 44. [Google Scholar] [CrossRef]
- Kuś, P.M.; Congiu, F.; Teper, D.; Sroka, Z.; Jerković, I.; Tuberoso, C.I.G. Antioxidant activity, color characteristics, total phenol content and general HPLC fingerprints of six Polish unifloral honey types. LWT 2014, 55, 124–130. [Google Scholar] [CrossRef]
- Skrede, G.; Wrolstad, R.E.; Durst, R.W. Changes in anthocyanins and polyphenolics during juice processing of highbush blueberries (Vaccinium corymbosum L.). J. Food Sci. 2000, 65, 357–364. [Google Scholar] [CrossRef]
- Ihl, M.; Shene, C.; Scheuermann, E.; Bifani, V. Correlation for pigment content through colour determination using tristimulus values in a green leafy vegetable, swiss chard. J. Sci. Food Agric. 1994, 66, 527–531. [Google Scholar] [CrossRef]
- Meléndez-Martínez, A.J.; Vicario, I.M.; Heredia, F.J. Rapid Assessment of Vitamin A Activity through Objective Color Measurements for the Quality Control of Orange Juices with Diverse Carotenoid Profiles. J. Agric. Food Chem. 2007, 55, 2808–2815. [Google Scholar] [CrossRef] [PubMed]
- NHB (National Honey Board). Shelf Life and Stability of Honey. Available online: https://legacy.bjcp.org/mead/refguide.pdf (accessed on 13 February 2025).
- White, J.W., Jr. Honey. In Advances in Food Research; Chichester., C.O., Mrak, E.M., Stewart, G.F., Eds.; Academic Press: New York, NY, USA, 1978; Volume 24, pp. 288–374. [Google Scholar] [CrossRef]
- Sopade, P.A.; Halley, P.; Bhandari, B.; D’Arcy, B.; Doebler, C.; Caffin, N. Application of the Williams-Landel-Ferry model to the viscosity-temperature relationship of Australian honeys. J. Food Eng. 2002, 56, 67–75. [Google Scholar] [CrossRef]
- Bakier, S. Characteristics of water state in some chosen types of honey found in Poland. Acta Agrophys. 2006, 7, 7–15. [Google Scholar]
- Kędzierska-Matysek, M.; Wolanciuk, A.; Florek, M.; Skałecki, P.; Litwińczuk, A. Hydroxymethylfurfural content, diastase activity and colour of multifloral honeys in relation to origin and storage time. J. Cent. Eur. Agric. 2017, 18, 657–668. [Google Scholar] [CrossRef]
- Amariei, S.; Norocel, L.; Scripcă, L.A. An innovative method for preventing honey crystallization. Innov. Food Sci. Emerg. Technol. 2020, 66, 102481. [Google Scholar] [CrossRef]
- Brewer, M.S.; Klein, B.P.; Rastogi, B.K.; Perry, A.K. Microwave blanching effects on chemical, sensory and color characteristics of frozen green beans. J. Food Qual. 1994, 17, 245–259. [Google Scholar] [CrossRef]
- Devillers, J.; Morlot, M.; Pham-Delegue, M.H.; Dore, J.C. Classification on monofloral honeys based on their quality control data. Food Chem. 2004, 86, 305–312. [Google Scholar] [CrossRef]
- Živkov Baloš, M.; Popov, N.; Jakšić, S.; Mihaljev, Ž.; Pelić, M.; Ratajac, R.; Ljubojević Pelić, D. Sunflower Honey—Evaluation of Quality and Stability during Storage. Foods 2023, 12, 2585. [Google Scholar] [CrossRef]
- Tosi, E.A.; Ré, E.; Lucero, H.; Bulacio, L. Effect of honey high temperature short time heating on parameters related to quality, crystallization phenomena and fungal inhibition. LWT 2004, 37, 669–678. [Google Scholar] [CrossRef]
- Francis, F.J.; Clydesdale, F.M. Food Colorimetry: Theory and Applications; Avi Publishing Co Inc.: Westport, CT, USA, 1975. [Google Scholar]
- Melgosa, M.; Hita, E.; Poza, A.J.; Alman, D.H.; Berns, R.S. Suprathreshold color-difference ellipsoids for surface colors. Color Res. Appl. 1997, 22, 148–155. [Google Scholar] [CrossRef]
- Hunter, M.; Kellett, J.; Toohey, K.; Naumovski, N. Sensory and Compositional Properties Affecting the Likeability of Commercially Available Australian Honeys. Foods 2021, 10, 1842. [Google Scholar] [CrossRef] [PubMed]


| Properties | Buckwheat | Linden | Rapeseed | Honeydew | Multifloral |
|---|---|---|---|---|---|
| Water, % | 18.5 ± 1.0 | 17.4 ± 1.4 | 17.6 ± 0.8 | 17.3 ± 1.2 | 16.9 ± 1.7 |
| Brix, % | 79.8 ± 1.0 | 80.8 ± 1.5 | 80.7 ± 0.8 | 81.0 ± 1.2 | 81.3 ± 1.6 |
| Free acids, mval kg−1 | 45.5 ± 2.8 b | 42.7 ± 3.5 b | 21.8 ± 4.5 a | 32.7 ± 14.2 ab | 30.0 ± 7.7 ab |
| Electrical conductivity, mS cm−1 | 0.51 ± 0.06 A | 0.51 ± 0.23 A | 0.19 ± 0.02 A | 1.10 ± 0.18 B | 0.40 ± 0.11 A |
| pH | 3.65 ± 0.19 | 3.65 ± 0.21 | 3.75 ± 0.06 | 4.06 ± 0.39 | 3.87 ± 0.12 |
| Water activity | 0.581 ± 0.010 | 0.538 ± 0.036 | 0.564 ± 0.009 | 0.571 ± 0.020 | 0.532 ± 0.015 |
Disclaimer/Publisher’s Note: The statements, opinions and data contained in all publications are solely those of the individual author(s) and contributor(s) and not of MDPI and/or the editor(s). MDPI and/or the editor(s) disclaim responsibility for any injury to people or property resulting from any ideas, methods, instructions or products referred to in the content. |
© 2025 by the authors. Licensee MDPI, Basel, Switzerland. This article is an open access article distributed under the terms and conditions of the Creative Commons Attribution (CC BY) license (https://creativecommons.org/licenses/by/4.0/).
Share and Cite
Kędzierska-Matysek, M.; Teter, A.; Daszkiewicz, T.; Topyła, B.; Skałecki, P.; Domaradzki, P.; Florek, M. Effect of Temperature of Two-Year Storage of Varietal Honeys on 5-Hydroxymethylfurfural Content, Diastase Number, and CIE Color Coordinates. Agriculture 2025, 15, 652. https://doi.org/10.3390/agriculture15060652
Kędzierska-Matysek M, Teter A, Daszkiewicz T, Topyła B, Skałecki P, Domaradzki P, Florek M. Effect of Temperature of Two-Year Storage of Varietal Honeys on 5-Hydroxymethylfurfural Content, Diastase Number, and CIE Color Coordinates. Agriculture. 2025; 15(6):652. https://doi.org/10.3390/agriculture15060652
Chicago/Turabian StyleKędzierska-Matysek, Monika, Anna Teter, Tomasz Daszkiewicz, Barbara Topyła, Piotr Skałecki, Piotr Domaradzki, and Mariusz Florek. 2025. "Effect of Temperature of Two-Year Storage of Varietal Honeys on 5-Hydroxymethylfurfural Content, Diastase Number, and CIE Color Coordinates" Agriculture 15, no. 6: 652. https://doi.org/10.3390/agriculture15060652
APA StyleKędzierska-Matysek, M., Teter, A., Daszkiewicz, T., Topyła, B., Skałecki, P., Domaradzki, P., & Florek, M. (2025). Effect of Temperature of Two-Year Storage of Varietal Honeys on 5-Hydroxymethylfurfural Content, Diastase Number, and CIE Color Coordinates. Agriculture, 15(6), 652. https://doi.org/10.3390/agriculture15060652