Article

Transcriptomics Uncovers Pathways Mediating Low-Nitrogen Stress Tolerance in Two Foxtail Millet Varieties

1
Rural Research Institute, Shanxi Agricultural University, Jinzhong 030810, China
2
Agricultural College, Shanxi Agricultural University, Jinzhong 030810, China
*
Author to whom correspondence should be addressed.
These authors contributed equally to this work.
Agriculture 2025, 15(6), 628; https://doi.org/10.3390/agriculture15060628
Submission received: 10 February 2025 / Revised: 6 March 2025 / Accepted: 14 March 2025 / Published: 16 March 2025
(This article belongs to the Section Crop Genetics, Genomics and Breeding)

Abstract

:
Nitrogen crucially impacts foxtail millet (Setaria italica) growth and development. Uncovering low nitrogen (LN) tolerance genes and mechanisms is vital for breeding high nitrogen use efficiency varieties. In this study, the LN tolerance of 50 foxtail millet genotypes was assessed through field trials and seedling hydroponic experiments. Subsequently, transcriptome analysis was performed on one highly sensitive genotype, named Maotigu, and on one highly tolerant genotype, named Dahuanggu, under LN (0.1 mmol/L) and control (5 mmol/L) conditions in seedling hydroponic experiments. Compared to the control treatment, 823 differentially expressed genes (DEGs) (350 upregulated, 473 downregulated) were identified in the roots of Dahuanggu, while 2427 DEGs (1703 upregulated, 724 downregulated) were detected in Maotigu under LN treatment. Kyoto Encyclopedia of Genes and Genomes (KEGG) enrichment analysis revealed that a total of 3134 DEGs were associated with pathways including plant–pathogen interaction, amino sugar and nucleotide sugar metabolism, nitrogen metabolism, and others. A total of 116 DEGs were commonly identified between Dahuanggu and Maotigu, involving pathways like plant–pathogen interaction, galactose metabolism, and flavone and flavonol biosynthesis. The 28 of 116 DEGs showed opposite expression patterns between Dahuanggu and Maotigu; the expression of 18 genes was further validated using qRT-PCR. These offer valuable insights into the molecular mechanisms underlying LN stress responses in foxtail millet.

1. Introduction

Nitrogen (N) plays a crucial role in crop growth and development, significantly contributing to crop yield. However, excessive use of nitrogen fertilizers leads to severe environmental pollution, necessitating further research into the genetic basis of nitrogen use efficiency (NUE) [1,2]. NUE comprises two main components: nitrogen uptake efficiency (NUpE), the plant’s ability to absorb nitrogen from the soil, and nitrogen utilization efficiency (NUtE), the plant’s capacity to utilize nitrogen for grain yield production [3]. NUE is a multifaceted trait governed by processes such as nitrogen absorption, transportation, assimilation, and re-mobilization or re-utilization [4]. While numerous NUE-related genes have been identified in Arabidopsis and rice over the past three decades [5], research on the regulatory networks governing NUE in foxtail millet remains limited.
Improving NUE poses a challenge due to the intricate mechanisms plants employ in responding to nitrogen availability. One avenue for enhancing NUE is through the study of nitrate signaling. Enzymes involved in nitrogen assimilation and the nitrogen transporter 1/peptide transporter family (NPF), which play a key role in nitrate absorption and transport, have undergone extensive characterization [6]. In 2022, time series transcriptomic analysis further revealed the response of 92 SiNPF genes to short- and long-term LN stress [7]. Apart from the genes and enzymes, the functional characterization of more than 40 transcription factors (TFs) has been reported across various plants [6,8]. The families emerge as key TF families to regulate NUE [9,10]. Further elucidation of TF functions holds promise for uncovering the mechanisms governing NUE.
Over the past three decades, extensive research has focused on the intricate crosstalk between nitrogen and phytohormones. Nitrogen signaling pathways regulate the biosynthesis, transport, and signaling of phytohormones [11], exerting regulatory control various phytohormones, including auxin [12], cytokinins (CTKs) [13], abscisic acid (ABA) [14], ethylene (ETH) [2], gibberellins (GAs) [15], brassinosteroids (BRs) [16], jasmonates (JAs) [17], salicylic acid (SA) [18], and strigolactones (SL) [19]. This regulation primarily occurs through the modulation of corresponding biosynthesis and transport genes, with a predominant focus on the transcriptional regulatory cascade network [20,21,22,23]. Conversely, phytohormone signaling pathways reciprocally regulate nitrogen signaling and influence root system architecture [24]. Auxin, CTKs, ABA, ETH, GAs, BRs, and JAs have been identified as regulators by modulating the transcript levels or transport activities of NPF, nitrogen transporter 2 (NRT2), and ammonium transporter (AMT) families across diverse plant species [11,25].
Here, in order to elucidate the molecular mechanisms governing millet’s response to LN stress, we screened two foxtail millet varieties that demonstrated stable performance and ease of germination in the experiments, identifying them as either tolerant or sensitive to LN through seedling and field nitrogen treatment experiments. The DEGs of two foxtail millet varieties through seedling hydroponic experiments under LN stress were identified. We revealed three pathways potentially crucial in the response to LN stress in foxtail millet: plant–pathogen-s interaction, galactose metabolism, and flavonoid biosynthesis pathways. The mechanism underlying LN tolerance in foxtail millet varieties under LN stress was clarified by transcriptome sequencing. The 28 DEGs showed opposite expression patterns between Dahuanggu and Maotigu, providing useful information for future research on the molecular breeding of high NUE foxtail millet.

2. Materials and Methods

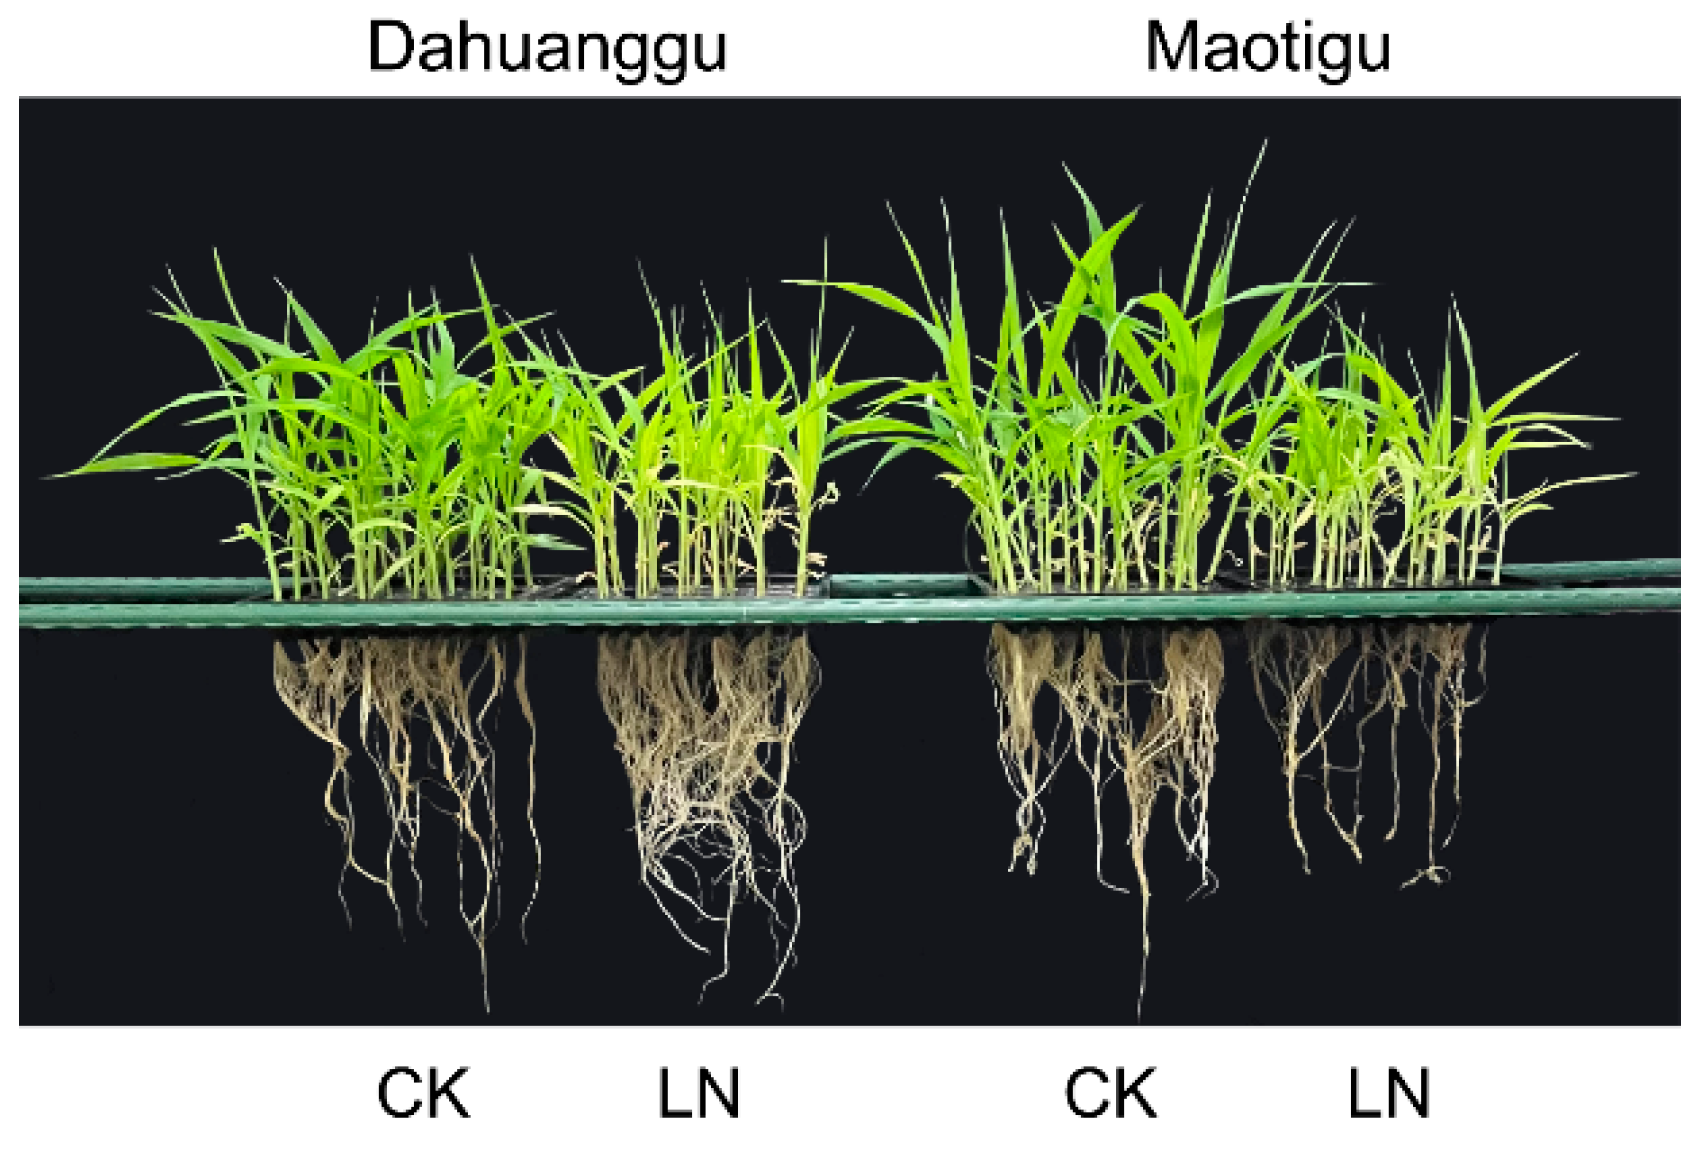
2.1. Experimental Materials

The experimental materials consisted of 50 foxtail millet varieties provided by the Crop Research Institute of the Chinese Academy of Agricultural Sciences (Beijing, China), numbered from 1 to 50, with specific variety names listed in Table S1.

2.2. Experimental Design

2.2.1. Field Experiment

The experimental site was located at the Shenfeng Experimental Base of Shanxi Agricultural University in Taigu District, Jinzhong City, Shanxi Province (latitude 37°25′ N, longitude 112°25′ E) in 2020 and 2021, with foxtail millet as the preceding crop. A randomized block design was implemented with two nitrogen application levels: control (270 kg/hm2) and LN (0 kg/hm2), with three replicates each. The seeds were sown in rows, with two rows per plot, a row length of 2 m, a plant spacing of 10 cm, and a row spacing of 0.4 m. Sowing took place on 12 May 2020 and 15 May 2021, with thinning to the two-leaf stage in mid-June and top-dressing with urea at the jointing and booting stages, with each application being half of the total amount. Seven yield traits were investigated at maturity: plant height (PH), spike length (SL), length of spike neck (LSN), heading date (HD), spike weight (SW), grass weight (GW), and grain weight (GRW) (Table S2). PH, SL, LSN, and HD were measured from randomly selected plants within each row for every genotype in each replication, while the remaining three traits were assessed after harvesting. All measured data are presented in Table S3.

2.2.2. Seedling Hydroponic Experiment

For the hydroponic culture trial, 20 seedling traits were examined (Table S2), including 7 morphological traits (soil and plant analyzer development value (SPAD), root length (RL), roots number (RN), seeding height (SH), the leaf length (TLL), the leaf width (TLW), and the leaf number (TLN)), 4 biomass traits (root dry weight (RDW), shoot dry weight (SDW), plant dry weight (PDW) and root-shoot ratio of dry weight (RRD)), 6 NUpE traits (shoot nitrogen content (SNC), root nitrogen content (RNC), plant nitrogen content (PNC), shoot nitrogen accumulation (SNA), root nitrogen accumulation (RNAC), and plant nitrogen accumulation (PNA)) and 3 NUtE traits (shoot nitrogen physiology efficiency (SNPE), root nitrogen physiology efficiency (RNPE), and plant nitrogen physiology efficiency (PNPE)). All traits were assessed using pooled samples from the same N treatment.
The seedling hydroponic experiment followed a modified version of the Hoagland nutrient solution formula. Two nitrogen treatments were set up: control (5 mmol/L) and LN (0.1 mmol/L). The nitrogen sources were (NH4)2SO4–H2O and Ca(NO3)2–4H2O. One hundred uniform plump seeds were selected for each variety, disinfected with 1% NaClO for 20 min, rinsed three times with distilled water, and sown in autoclaved perlite troughs, then placed in plastic boxes (27 cm × 21 cm × 8 cm) filled with distilled water. The boxes were placed in a growth chamber under controlled conditions, including a 16-h light period at 28 °C and an 8-h dark period at 22 °C, with a light intensity of 25,000 lux, and a relative humidity of 75%. When the seedlings reached the two-leaf stage, thinning was performed to leave five plants per hole, with 15 plants per replicate and 3 replicates in total. Afterward, the seedlings were allowed to recover in the normal nutrient solution for 2 days before being subjected to LN treatment. The nutrient solution was changed every 3 days.
After 21 days of LN treatment, seven plants were randomly selected from each treatment (LN and control) to measure RL, SH, RN, TLL, TLW, and TLN. The SPAD value of the leaves was determined using a Nippon Chlorophyll Meter SPAD-502 (Konica-Minolta, Tokyo, Japan). The plants were then killed by heating in a 105 °C oven for 30 min and dried at 70 °C. The RDW, SDW, and PDW were measured. The SNC, RNC, PNC, SNA, and RNAC were determined by the micro Kjeldahl method [26], and the RRD, SNPE, RNPE, PNPE, and PNA were calculated. All measured data are presented in Table S4.
The relevant formulas for calculation are as follows:
Nitrogen accumulation = Nitrogen content × Dry weight
Nitrogen physiological efficiency = Dry weight/Nitrogen accumulation
RRD = Dry weight of below-ground parts/Dry weight of above-ground parts
Individual   nitrogen   content   =   ( above-ground   nitrogen   accumulation   + below-ground   nitrogen   accumulation ) / individual   dry   weight

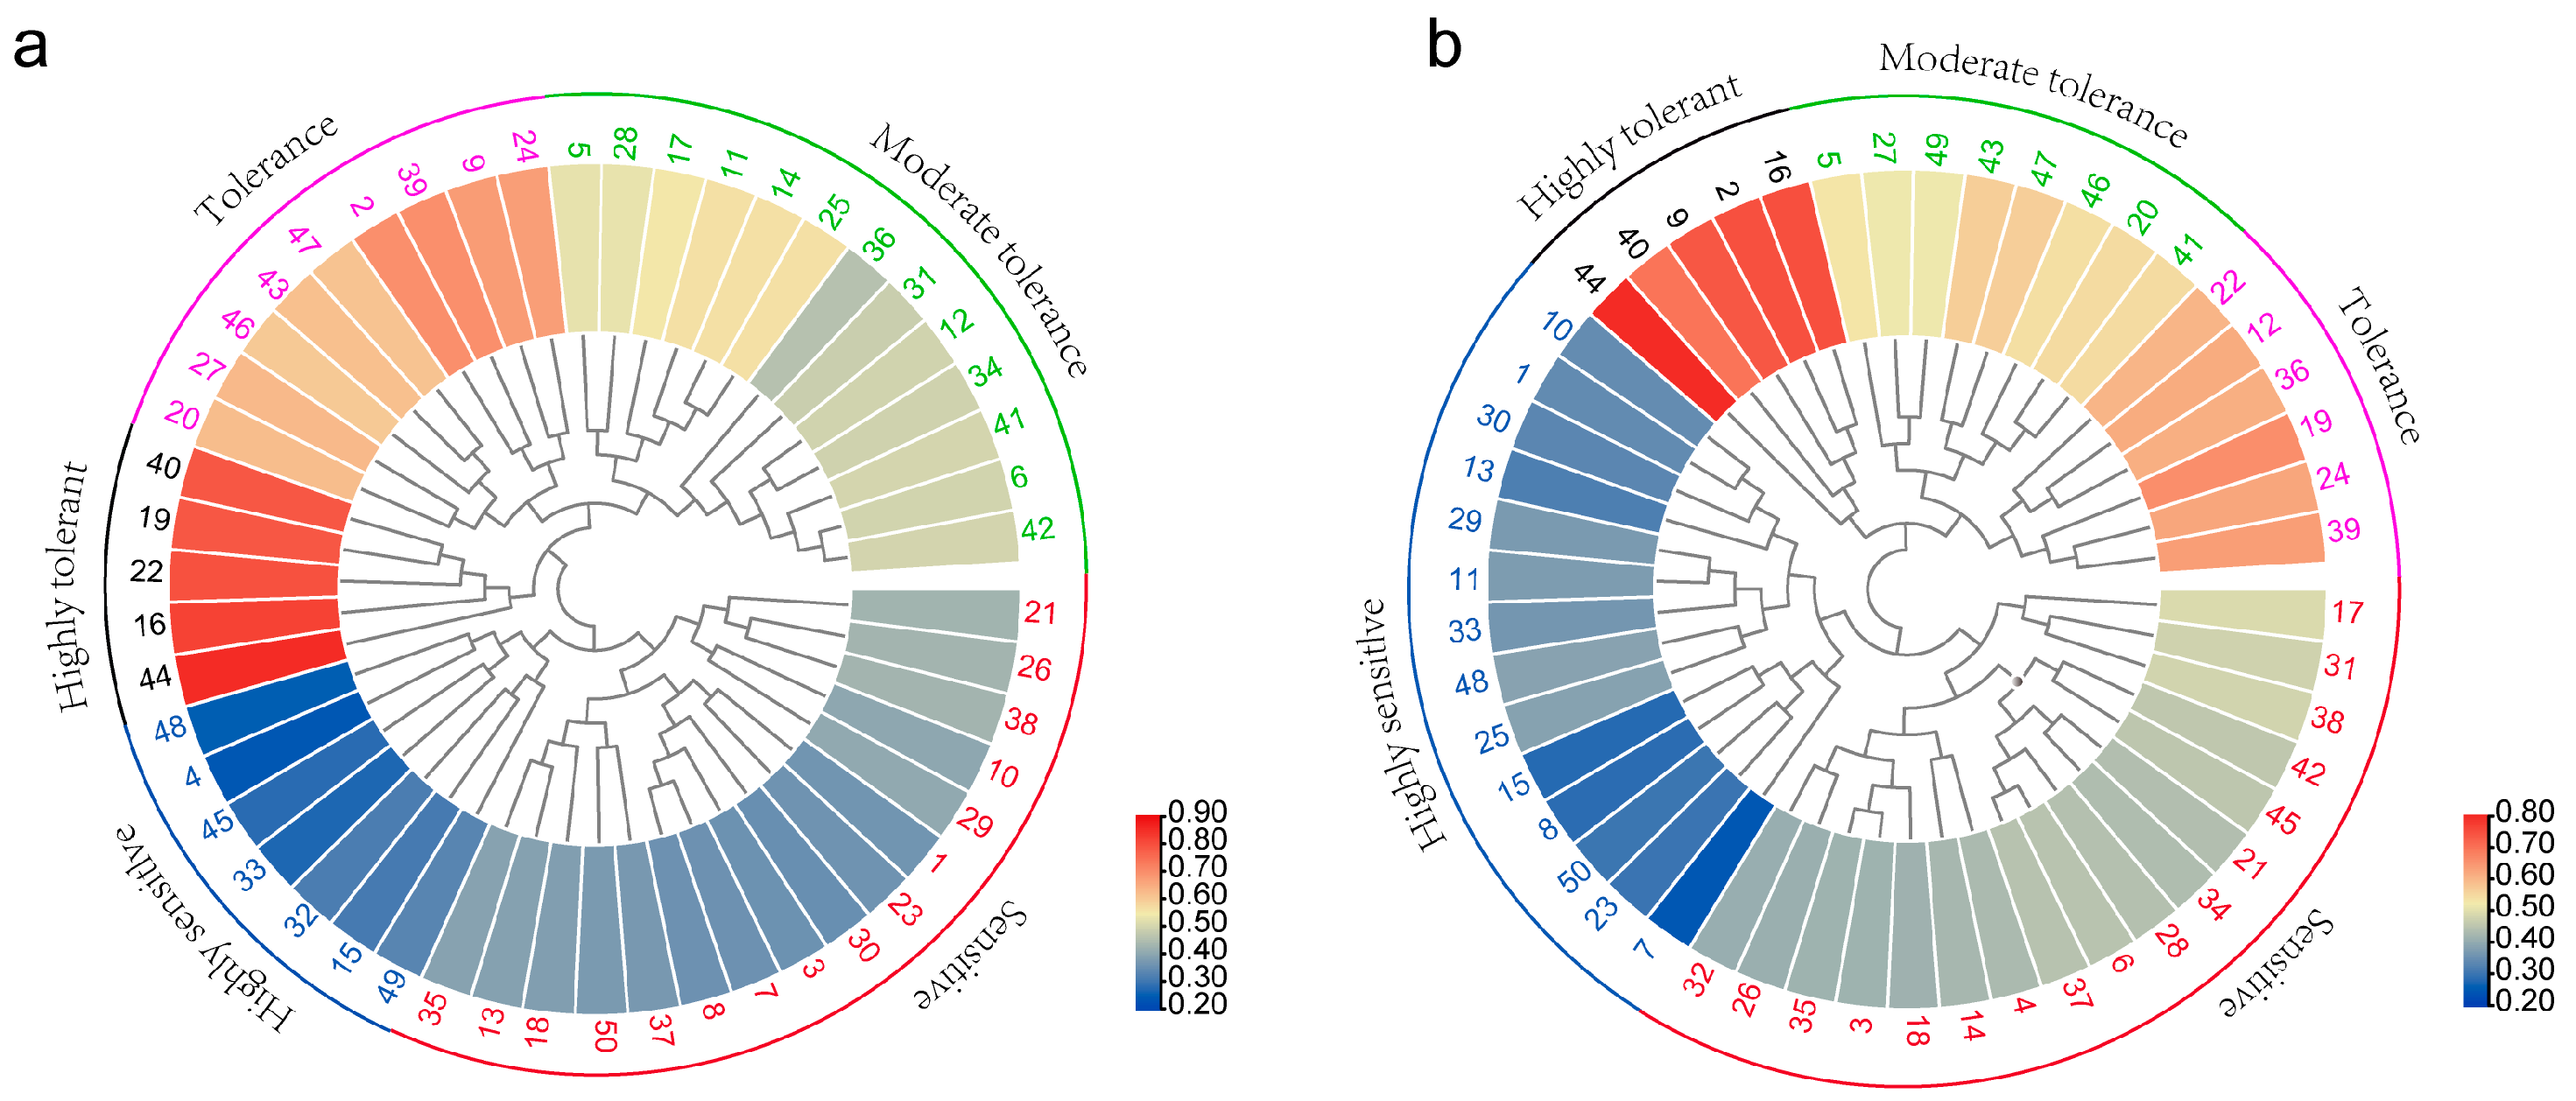
2.2.3. Evaluation of Foxtail Millet Variety Tolerance to Low Nitrogen

The tolerance of foxtail millet varieties to LN was comprehensively evaluated based on the LN tolerance coefficient, with the specific calculation formula as follows:
LN   tolerance   coefficient   Rx   =   ( Measured   value   under   LN   treatment ) / ( Measured   value   under   control   treatment )   ×   100 %
Membership function value U(Xi) = (Xi − Xmin)/(Xmax − Xmin)
In the formula, Xi represents the comprehensive index value; Xmin and Xmax are the minimum and maximum values of a certain comprehensive index among the tested varieties. U(xi) represents the membership function value of the i-th comprehensive index.
Weight Wi = Pi/∑Pi
In the formula, Wi represents the weight of the i-th comprehensive index, and Pi denotes the variance contribution rate of the i-th comprehensive index.
Comprehensive evaluation value D = ∑[U(xi) × Wi]
where D represents the comprehensive evaluation value of a material’s tolerance to LN.

2.2.4. Transcriptome Sequencing

The varieties Dahuanggu and Maotigu were used as the material for the seedling hydroponic experiment, with the method same as in Section 2.2.2. After being cultured in the nutrient solution for 21 days, all the roots of each plant were taken, with three biological replicates. Roots were quickly frozen in liquid nitrogen and then stored in a −80 °C refrigerator for later use.
A total of 12 samples (2 varieties × 2 treatments (LN and control) × 3 biological replicates) were used for subsequent RNA-Seq analysis. A PCA plot illustrating the relationship among the replicate RNA-seq samples confirms that the inclusion and combination of replicates were appropriate (Figure S1). RNA isolation, cDNA library construction, and Illumina sequencing were carried out with the assistance of Genedonovo Biotechnology (Guangzhou, China). Clean reads were obtained by removing adapter-containing N-containing units greater than 10%; all those A-base as well as the filtered Reads were aligned to the reference genome (https://phytozome-next.jgi.doe.gov/ (accessed on 20 February 2024)) using the HISAT2 v2.2.1 software (http://ccb.jhu.edu/software/hisat2/index.shtml (accessed on 15 March 2024)). Gene expression levels were calculated using HTSeq and represented by FPKM values. Differential gene expression was analyzed using the DESeq v2.10 software with parameters set as expression difference fold change |log2 Fold Change| ≥ 1 and significance p-adjust ≤ 0.05. DEGs were subjected to KEGG enrichment analysis and Gene Ontology (GO) analysis. Predicted gene interactions were obtained from the STRING website (https://string-db.org/ (accessed on 22 March 2024)).

2.2.5. Validation of DEGs Using qRT-PCR

The varieties Dahuanggu and Maotigu were used as materials, with the planting method the same as in Section 2.2.2. Samples were taken at the start of LN treatment and control treatment (0 day) and then every 7 days (7, 14, and 21 days), with three biological replicates. The total RNA from the sample roots was extracted using the KKFast Plant RNApure Kit (ZP405K-2, Zoman Biotech, Beijing, China). The extracted RNA was used as a template for reverse transcription. Using a TransScript One-Step gDNA Removal and cDNA Synthesis SuperMix kit (AT311-03, Transgen Biotech, Beijing, China), genomic DNA was first removed, followed by reverse transcription to obtain cDNA, which was then stored at −20 °C. qRT-PCR was performed on a 96-well fluorescence quantitative PCR instrument CFX96 (BIO-RAD, Hercules, CA, USA) according to the instructions of the TB Green® Premix Ex Taq™ II (Tli RNaseH Plus) (RR820) fluorescence quantitative PCR kit (TaKaRa, Dalian). The qRT-PCR experiment was set up with 3 biological replicates, each with 3 technical replicates. Gene expression levels were calculated using the 2−ΔΔCT method [27]. The relative expression levels were normalized to the expression of siActin. Primers are listed in Table S5.

2.3. Statistical Analysis

Descriptive statistics of data are completed using EXCEL, while statistical analysis was performed using one-way analysis of variance (ANOVA) with Tukey’s honestly significant difference (HSD) post-hoc test for multiple comparisons in SPSS (www.spss.com). The principal component analysis was also conducted using the same software. Additionally, Spearman’s correlation coefficients, cluster diagram, and quantitative heatmaps were generated using R 4.3.3.

3. Results

3.1. Analysis of Foxtail Millet Tolerance to Low Nitrogen at the Field and Seeding Hydroponic Stage

In the field LN tolerance experiment, all seven yield-related traits of 50 foxtail millet varieties, including PH, SL, LSN, HD, SW, GW, and GRW, were significantly reduced under LN treatment compared to control within two years (Table 1). The variation coefficients of the LN tolerance for traits such as SW, GW, and GRW were notably high over the two years, indicating substantial variability among the tested varieties for these traits.
In the hydroponic experiment, the 20 indicators of 50 foxtail millet varieties varied considerably under the two nitrogen levels, with 16/20 most coefficients of variation (CV%) exceeding 10% (Table 1). Under LN stress, all 20 indicators of foxtail millet seedlings changed, primarily manifested as a decrease in most morphological traits (SH, TLL, TLW, TLN, and SPAD). For the root traits, although RL increased, RN decreased, resulting in a decrease in RDW. Other indicators calculated from morphological traits and nitrogen content also changed accordingly, such as an increase in RRD, an increase in NUtE traits (SNPE, RNPE, and PNPE), and a decrease in NUpE traits (SNC, RNC, PNC, SNA, RNAC, and PNA).
The principal component analysis (PCA) was performed using SPSS Statistics 25.0 software (www.spss.com (accessed on 25 March 2024)). The PCA of LN tolerance coefficients of all seven yield-related traits over two years showed that the cumulative contribution rate of the first four principal components exceeded 85%. The variance contribution rate of the first principal component was 46.46%, with the main traits including PH, SL, LSN, SW, and GRW, which together contribute more than half, the second principal component contributed 15.55%, with the main traits including PH, SL, GW, HD, the third principal component contributed 12.82%, with the main traits including GW and HD, and the fourth principal component contributed 11.06%, with the main traits including SW, GW, and GRW (Table 2).
Similarly, principal component analysis of LN tolerance coefficients for all 20 seedling traits indicated a cumulative contribution rate of the first five principal components exceeding 85%. The variance contribution rate of the first principal component was 42.43%, and the main traits included SH, RN, TLW, SNC, RNAC, RDW, and SNPE, the second principal component contributed 21.8%, with the main traits including SDW, RNC, PNC, SNA, RNPE, PNPE, and RRD, the third principal component contributed 9.24%, with the main traits including SPAD and TLL, and the fourth principal component contributed 7.25%, with the main traits including RL, PDW, and PNA, and the fifth principal component contributed 4.33%, and the main trait was TLN (Table 2).
The tolerance of foxtail millet varieties to low-nitrogen stress was comprehensively evaluated based on the low-nitrogen tolerance coefficients of seven yield-related traits in the field experiments. The principal component was computed by the software SPSS (www.spss.com), and then the weights of each factor were calculated according to their respective contribution rates. The factor scores were computed using the factor values of various comprehensive indicators and combined with the weights to calculate the membership function values of all factors for each variety. Finally, the comprehensive evaluation value D for low-nitrogen tolerance was obtained (Table S6). According to the D-value, using the class average method for systematic clustering of the test millet varieties; at the field condition, the 50 millet varieties were divided into 5 categories: highly sensitive (7), sensitive (16), moderate tolerance (13), tolerance (9), and highly tolerant (5) (Figure 1).
Based on the traits of foxtail millet, the comprehensive evaluation values (D) for LN tolerance of each variety were calculated at the seedling stage (Table S6). Cluster analysis was conducted on 50 foxtail millet varieties using the class average method (Figure 1), and the varieties were divided into 5 types, including highly sensitive (14), sensitive (17), moderate tolerance (8), tolerance (6), and highly tolerant (5) (Figure 1).
Notably, some of the varieties fall into different categories when comparing field and seedling results (Figure 1). It can be seen that under both field and seedling hydroponic conditions, there are 3 highly sensitive varieties (15 (SSR48), 33 (Bawangbian), and 48 (Maotigu)), 7 sensitive varieties (3 (Xiaomaogu), 18 (Baiyousha), 21 (Yumaohuangguzi), 26 (SSR30), 31 (Daobaqi), 37 (Zhuyeqing), and 38 (Dabaigu)), 2 moderate tolerant varieties (5 (Lianggu) and 41 (Laohonggu)), 2 tolerance varieties (24 (SSR24) and 39 (Yibajie)), and 3 highly tolerant varieties (varieties 16 (Dahuanggu), 40 (Huangyusihao), and 44 (Zhuyeqing 2)).

3.2. Correlation Analysis Between Investigated Traits

The Spearman’s correlation coefficients (r) among the 20 seedling traits were almost all significant for morphological traits and biomass traits (Table S7). However, RL, SH, RN, TLN, SDW, RDW, RRD, and PDW were not significantly correlated with some of the NUtE traits (SNC, RNC, and PNC). RL, SH, RN, TLN, SDW, and RDW were not significantly correlated with any of the NUtE traits. Among the seven maturity traits, there was a significant correlation with five yield-related traits. However, GW was only significantly correlated with SW and GRW and had no significant correlation with other traits. There was no significant correlation between HD and the other six traits. For the correlations between the 7 maturity traits and the 20 seedling traits, the r values were mostly significant between the 12 seedling traits and all 7 maturity traits. TLN was significant with SW and GW and RNC was significant with LSN and GRW. However, the r values were mostly not significant between the other six seedling traits (SPAD, RRD, SNC, PNC, SNPE, and PNPE) and all seven maturity traits (Table S7).

3.3. Transcriptome Analysis of Foxtail Millet Under Control and Low Nitrogen Conditions

Under LN and control conditions, two foxtail millet varieties with different nitrogen sensitivities ((highly sensitive variety Maotigu (variety 48) and highly tolerant variety Dahuanggu (variety 16)) were cultured in nutrient solution for 14 days (Figure 2); the high-throughput RNA-Seq analyses on poly (A)-enriched RNAs of the seedling roots from the control and LN libraries were performed using the Illu-mina HiSeq platform. An LN stress resistance analysis was conducted on these two varieties. The hydroponic experiment of seedlings showed that compared to control conditions, the measured traits of both varieties generally decreased, with notable exceptions being a significant increase in SNPE, RNPE, PNPE, and RRD under LN treatment (Table S8). Analysis further revealed that, under LN treatment, Dahuanggu exhibited higher relative values than Maotigu in most traits, with the exception of TLN, SNPE, RNPE, and PNPE, indicating that Dahuanggu is more resistant to LN stress than Maotigu (Table S8). The number of clean reads for each sample varied from 49.93 million to 65.70 million, with a mean of 52.83 million. The content of Q30 for each sample varied from 93.11% to 95.65%, with a mean of 94.14%. The 96.28% and 95.36% of the reads of the samples under control and LN conditions were uniquely mapped. Based on these quality control data, the transcriptome data were deemed suitable for subsequent analyses. According to the p-adjust ≤ 0.05 and |log2FC ≥ 1 criteria, a total of 823 DEGs were identified in Dahuanggu under LN conditions compared with the control, comprising 350 upregulated and 473 downregulated genes. Similarly, 2427 DEGs were identified in Maotigu following LN treatment compared with control, including 1703 upregulated and 724 downregulated genes. A Venn diagram analysis showed that 116 DEGs were commonly identified between Dahuanggu and Maotigu, (these 116 DEGs were listed in Table S9), with an additional 707 DEGs specific to Dahuanggu and 2311 specific to Maotigu (Figure 3a,b).

3.4. GO and KEGG Enrichment Analyses of DEGs

A GO enrichment analysis was performed on the DEGs of both Dahuanggu (823 DEGs) and Maotigu (2427 DEGs), as well as a total of 3134 DEGs across both varieties. The DEGs were classified into three categories: biological process (BP), molecular function (MF), and cellular component (CC). In both varieties, BP terms such as biological, cellular, and metabolic processes were significantly enriched. For MF, enriched GO terms included molecular function, binding, and catalytic activity, while in CC, significant terms encompassed cellular component, cellular anatomical entity, and intracellular anatomical structure (Figures S2a and S3a).
For the comprehensive set of 3134 DEGs, significantly enriched BP terms included metabolic processes, fatty acid biosynthetic processes, and response to stimulus. In MF, enriched GO terms were binding, transport activity, and phosphatidylinositol phosphate kinase activity, while in CC, significant terms included nucleosome, apoplast, and cell wall (Figure 3c).
KEGG pathway analysis revealed that DEGs in both varieties were significantly enriched in metabolic pathways and the biosynthesis of secondary metabolites. Dahuanggu showed enrichment in ribosome-related pathways (Figure S2b), while Maotigu exhibited significant enrichment in plant hormone signal transduction pathways (Figure S3b). Additionally, KEGG pathway mapping of the 3134 DEGs revealed significant enrichment in the plant–pathogen interaction, amino sugar and nucleotide sugar metabolism, nitrogen metabolism, and metabolic pathways. Other enriched pathways included phenylpropanoid biosynthesis, biosynthesis of secondary metabolites, and flavonoid biosynthesis (Figure 3d).

3.5. Transcription Factors Among DEGs

A total of 135 TFs belonging to 38 TF families were identified among the 3134 DEGs (Tables S10 and S11). Among these, 9 DEGs (Seita.2G156200, Seita.2G286400, Seita.3G029000, Seita.3G130800, Seita.3G164900, Seita.4G266400, Seita.5G358900, Seita.6G032700, and Seita.9G155700) were co-expressed in Dahuanggu and Maotigu, while the remaining 126 DEGs were specifically expressed in either Dahuanggu or Maotigu. These TFs encompassed various families, including 7 BHLH, 8 HOX, 9 bZIP, 9 AP2, 22 MYB, 11 NAC, and 18 WRKY, whereas 60 belong to other families of transcription factors. Under LN stress, the expression of 30 TFs was up-regulated in Dahuanggu, while 62 TFs were upregulated in Maotigu. Conversely, the expression of 34 TFs was downregulated in Dahuanggu, while 18 TFs were down-regulated in Maotigu.

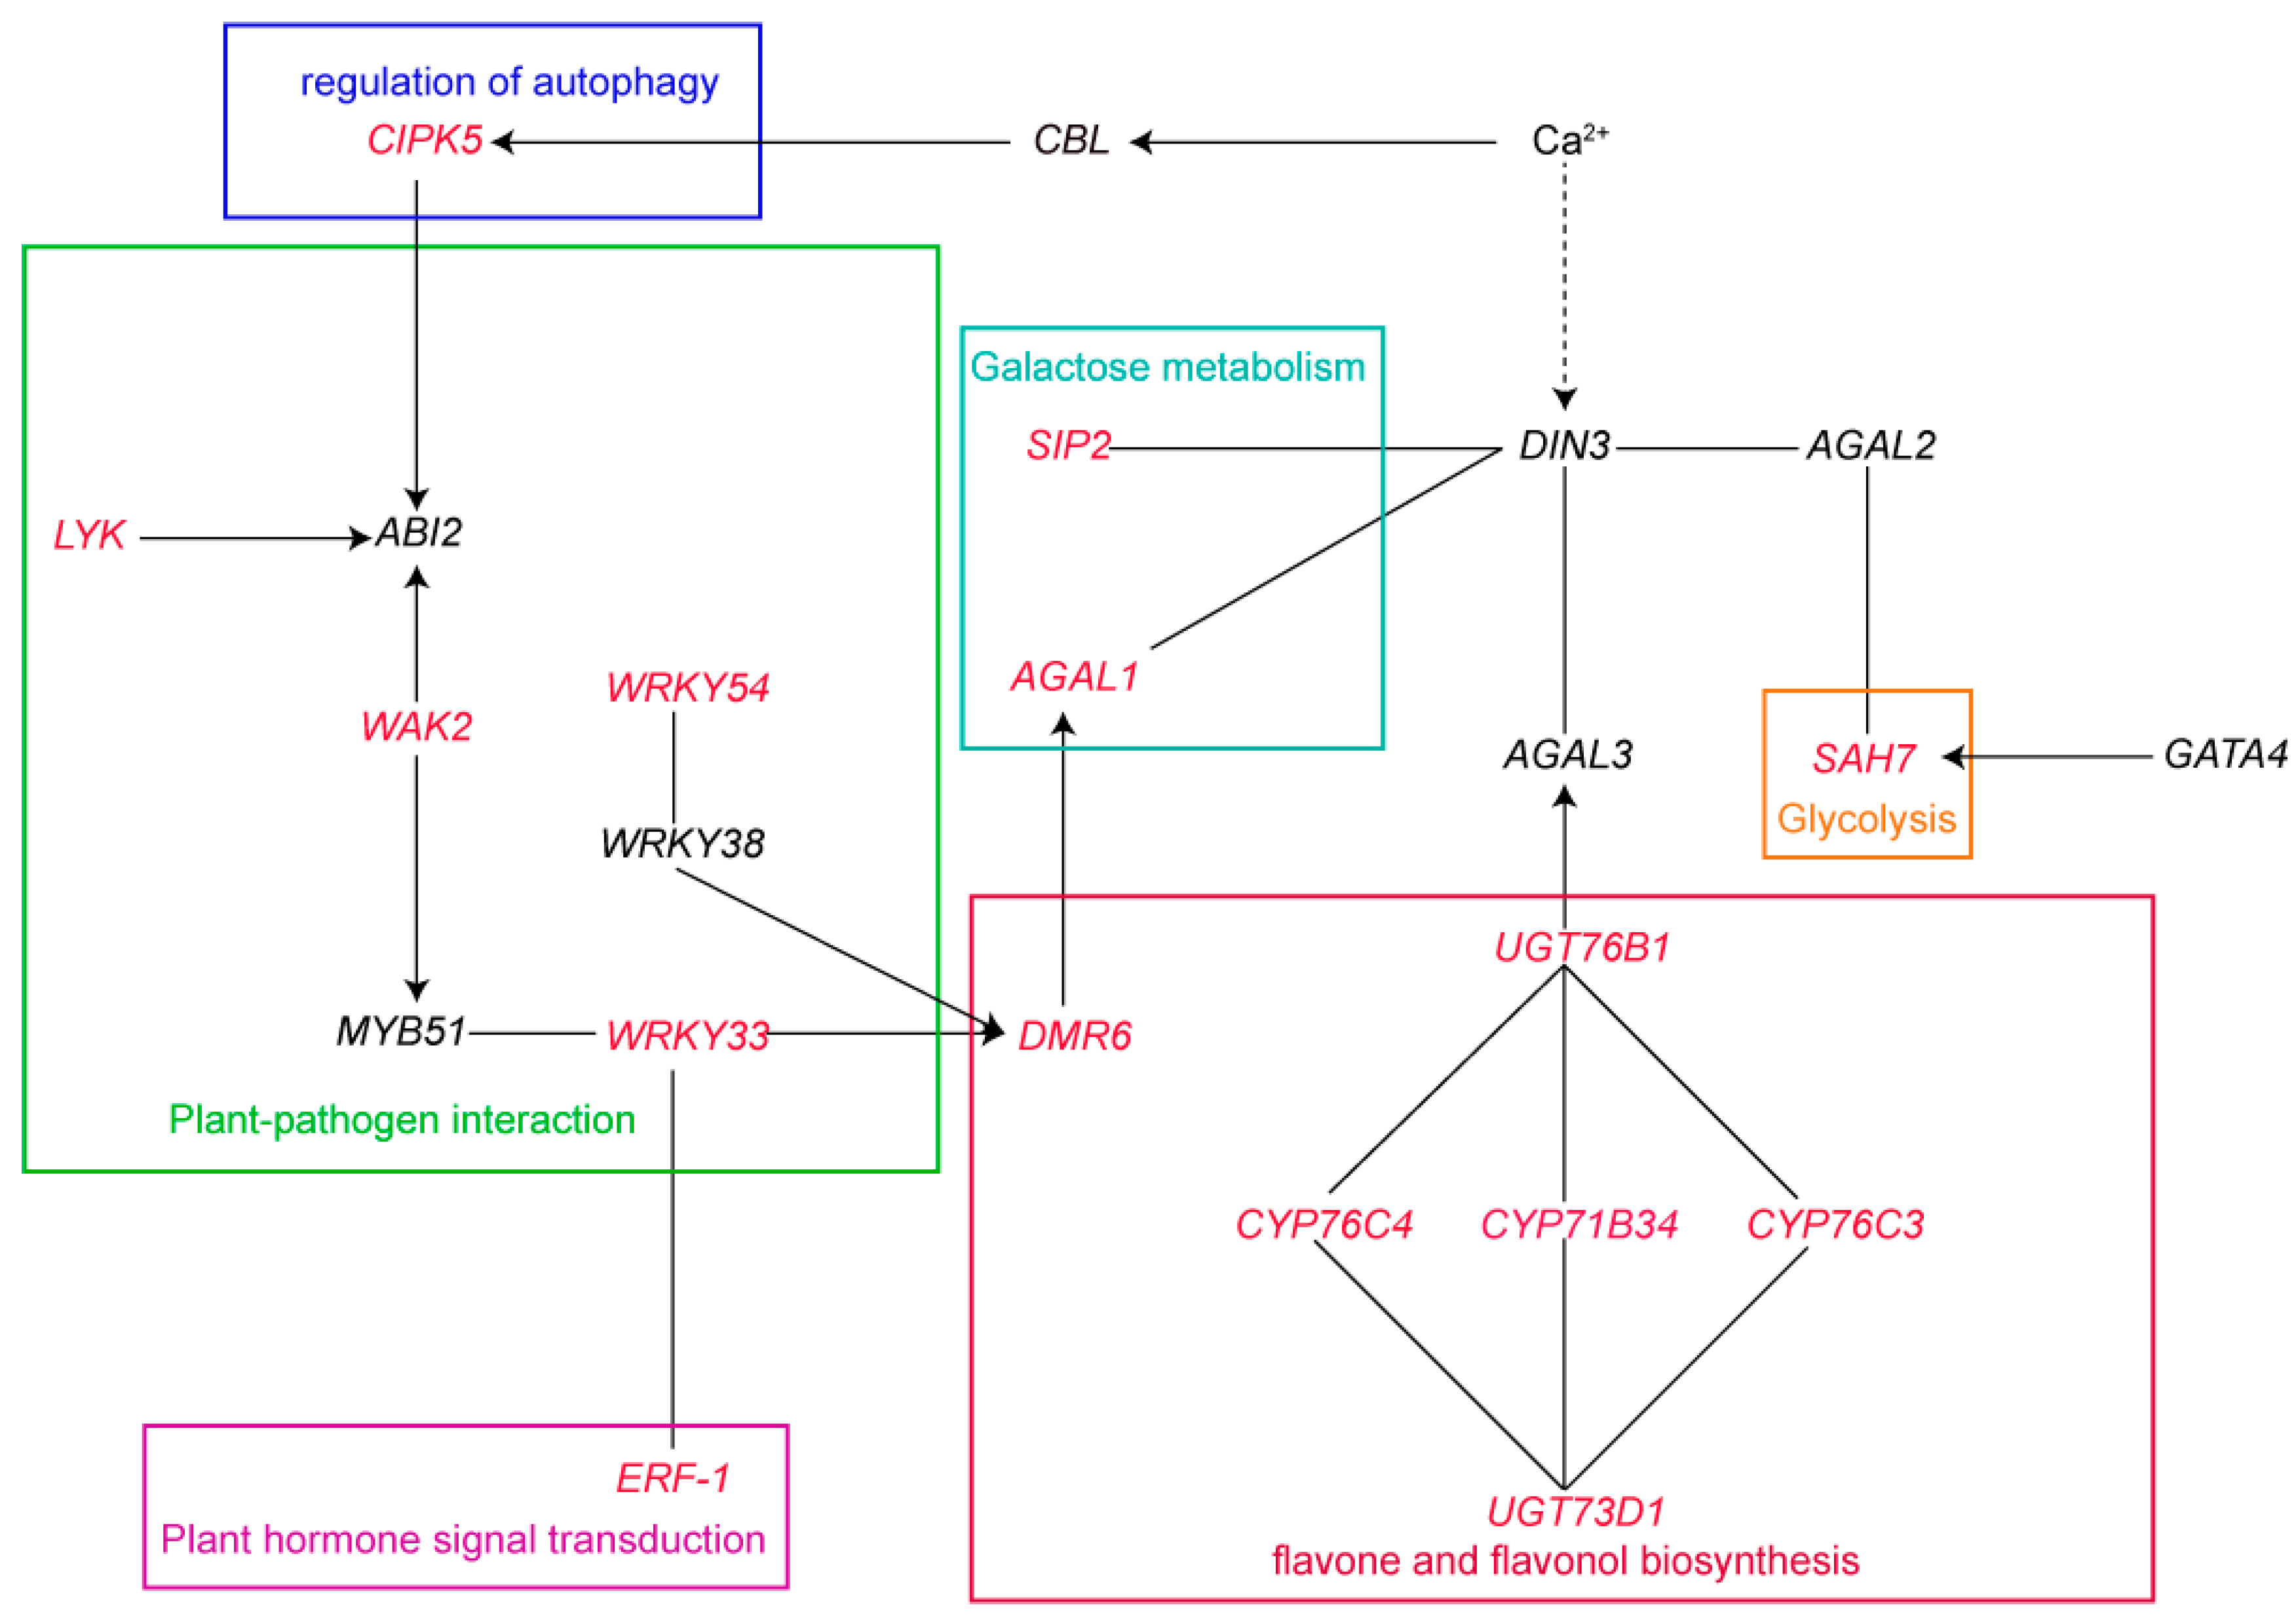
3.6. DEGs Are Involved in Important Pathways

We found that the expression profiles of 28 of the 116 DEGs showed opposite expression patterns in Maotigu and Dahuanggu; they are involved in some important pathways, including plant–pathogen interaction, plant hormone signal transduction, regulation of autophagy, flavone and flavonol biosynthesis, galactose metabolism, and glycolysis (Figure 4). This suggests that these genes may play a role in the distinct tolerances to LN stress exhibited by the two foxtail millet varieties.
For instance, genes such as CIPK5, belonging to the regulation of autophagy pathway, were downregulated in Dahuanggu but upregulated in Maotigu (Figure 4 and Figure 5). LYK4 and WRKY33 were upregulated in Dahuanggu and downregulated in Maotigu, while WAK2 and WRKY54 showed the opposite expression pattern (Figure 4 and Figure 5). Furthermore, in the flavone and flavonol biosynthesis pathway, genes such as UGT76B1, CYP76C4, CYP71B34, and CYP76C3 were downregulated in Dahuanggu but upregulated in Maotigu and UGT73D1 upregulated in Dahuanggu but downregulated in Maotigu. Specifically, only UGT73D1 was upregulated in Maotigu but downregulated in Dahuanggu, while the other four genes showed the opposite trend. Additionally, SIP2 and AGAL1 were involved in galactose metabolism and were found to be downregulated in Dahuanggu but upregulated in Maotigu (Figure 4 and Figure 5).

3.7. Validation of Some Important DEGs Using qRT-PCR

To gain deeper insights into the response of key genes to LN, we validated the expression of 18 out of 28 DEGs using qRT-PCR (Figure 5). Among them, five TFs (PAP28, WRKY33, WRKY54, ERF-1, and HAT14) exhibited differential expression in two foxtail millet varieties. Additionally, 13 other key genes associated with LN tolerance were also validated. The qRT-PCR results closely aligned with the RNA-Seq analysis, further confirming the accuracy and reliability of the transcriptomic data.

4. Discussion

4.1. Morphological Trait Indexes for the Evaluation of NUE

Nitrogen supply levels significantly influence the yield and NUE traits of crops. Previous research on LN in foxtail millet mainly focused on soluble protein concentration, free amino acid concentration, and nitrate-nitrogen concentration [28] or nitrogen-related yield traits during maturity [29]. This research combined the physiological characteristics during the seedling stage with the yield traits at the maturity. The yield traits (PH, SL, LSN, HD, SW, GW, and GRW) and the NUpE traits (SNC, RNC, PNC, SNA, RNAC, and PNA), the most morphological traits except RL and most biomass traits except RRD, were significantly decreased with low N input. Meanwhile, the NUtE traits (SNPE, RNPE, and PNPE) and root traits RL and RRD were increased with low N input in the majority of the tested varieties (Table 1).
The NUE, which is difficult to identify for large-scale genotypes, is often measured indirectly. Thus, it is necessary to seek some morphological traits to reflect the NUE. At the seedling stage, we found that coefficient (r) values between biomass traits (RDW, SDW, PDW, and RRD) and NUpE traits (SNC, RNC, PNC, SNA, RNAC, and PNA) were all significant (Table S7), indicating that the biomass traits could serve as key criteria for evaluating NUE. Seven yield traits were all most significantly correlated with NUpE traits, indicating that these yield traits also serve as indicators of NUE. Meanwhile, four morphological trait (RL, RN, SH, and TLW), three biomass traits (RDW, SDW and PDW), and 2 NUpE traits (SNA and PNA) at the seedling stage were significantly correlated with almost all maturity traits (Table S7), indicating that certain seedling traits could partially reflect maturity traits. In this study, the highly tolerant variety Dahuanggu and the highly sensitive variety Maotigu were screened (Figure 2). A previous study revealed that the LN tolerant foxtail millet variety demonstrates superior biomass accumulation, nitrogen content, and NUE [28]. Here, Dahuanggu exhibited better performance in most morphological traits, biomass traits, and NUpE traits. This suggests that the enhancement in NUE is primarily attributed to the improvement in NUpE. In summary, combining field and seedling experiments can better screen for millet varieties tolerant to LN conditions.

4.2. Multiple Pathways Contribute to Regulating the Low Nitrogen Stress Response in Maotigu and Dahuanggu

Foxtail millet (Setaria italica) is recognized for its robust resistance to various stresses, positioning it as an ideal candidate for investigating the physiological mechanisms underlying abiotic stress tolerance in plants. Recent studies have identified new candidate genes associated with NUE in pathways related to nitrogen uptake, assimilation, amino acid biosynthesis, carbon/nitrogen storage and metabolism, and others [30,31,32]. The identified nitrogen pathways encompass multiple routes, including starch and sucrose metabolism, phenylpropanoid biosynthesis, and amino acid biosynthesis, plant–pathogen interactions, MAPK signaling pathways, hormone metabolism, and others [29,31]. In this study, it was observed that genes associated with the plant–pathogen interaction pathway, such as LYK4, WAK2, WRKY54, and WRKY33, displayed opposite expression patterns, being upregulated in Dahuanggu but downregulated in Maotigu (Figure 5). This suggests an enhancement of the plant–pathogen interaction pathway in resistant foxtail millet varieties under LN stress. Notably, these genes are interconnected through ABI2, MYB51, and WRKY38 (Figure 6). AtWRKY54 has been shown to exhibit significant changes in transcript abundance in response to alterations in nitrogen nutrition [33]. Additionally, ABI2, a phosphatase deactivated by the ABA, has been implicated in enhancing nitrate sensing and uptake [34] and plays a pivotal role in mediating the regulatory effects of nitrate on root branching [20]. MYB51 and WRKY38 serve as core factors in the transcriptional regulation of nitrogen metabolism and growth [35]. The involvement of plant–pathogen interaction pathway-related genes, including LYK4, WAK2, WRKY54, WRKY33, ABI2, MYB51, and WRKY38, suggests potential crosstalk between nitrogen and ABA signaling pathways.
CIPK5, which belongs to the regulation of autophagy pathway shows different expression in Dahuanggu and Maotigu (Figure 5). Autophagy has been reported to play a role in efficient nitrogen remobilization from senescent leaves as it facilitates the degradation of genes to recycle nitrogen in these organs [36,37]. Furthermore, the CBL1/CBL9-CIPK23 complexes appear to act as “nutritional sensors” that regulate nitrate uptake in plant growth and development [34]. Interestingly, the heterologous expression of SiATG8a (autophagy-associated gene) in rice has been shown to improve nitrogen starvation tolerance [38]. These findings highlight the intricate crosstalk between autophagy, nitrogen metabolism, and stress responses.
The flavone and flavonol biosynthesis pathway-related genes UGT76B1, CYP76C4, CYP71B34, CYP76C3, and UGT73D1, all of which belong to the cytochrome P450 family, exhibited differential expression between Dahuanggu and Maotigu (Figure 5). Nutritional and tissue-specific regulation of cytochrome P450 TaMAX1a2 has been observed under nitrogen limitation, with substantial upregulation occurring in response to nitrogen limitation [19]. Notably, UGT76B1, CYP76C4, CYP71B34, CYP76C3, and UGT73D1 may interact with each other to participate in nitrogen metabolism.
Nitrogen affects various phytohormones biosynthesis and transport [25]. ERF-1, a member of the plant hormone signal transduction pathway, exhibited opposite expression in Dahuanggu and Maotigu (Figure 5). Previous research has shown that the AP2/ERF transcription factor MdDREB2A regulates nitrogen utilization and sucrose transport under drought stress [39,40]. We hypothesized that ERF-1 may be involved in nitrogen and drought crosstalk.
SAH7, which was upregulated in Dahuanggu but downregulated in Maotigu, is regulated by GATA4. The chimeric repressor of the GATA4 transcription factor, 35S:GATA4-SRDX, has been reported to improve tolerance to nitrogen deficiency in Arabidopsis [41]. We speculate that GATA4 participates in nitrogen metabolism by regulating SAH7.
Overall, DMR6 seems to play an important role in regulating the LN stress response, which serves as a hub in the regulatory network of the flavone and flavonol biosynthesis, the plant–pathogen interaction pathway, and galactose metabolism and forms a regulatory module in the intellectual landscape of N and phytohormones crosstalk networks. A graphical summary of the interactions between the differentially expressed genes identified in this study and the pathways in which they participate is shown in Figure 6. This study provides a valuable untapped pool of genomic regions for NUE and will facilitate the discovery and utilization of NUE-related genes in foxtail millet.

5. Conclusions

In this study, two foxtail millet varieties with differing low nitrogen tolerances were identified through integrated seedling-stage hydroponic screening and field trials integrated seedling-stage hydroponic screening and field trials and subsequently subjected to transcriptome-wide characterization of DEGs under LN stress. We believe that pathways such as plant–pathogen interaction, galactose metabolism, and flavonoid biosynthesis may play crucial roles in the foxtail millet’s response to low nitrogen stress. These findings hold promise for enhancing the NUE of foxtail millet varieties.

Supplementary Materials

The following supporting information can be downloaded at https://www.mdpi.com/article/10.3390/agriculture15060628/s1: Table S1. The 50 foxtail millet varieties and numbers of foxtail millet materials; Table S2. Summary of investigated plant traits under the hydroponic culture and field trials; Table S3. The seven traits of 50 foxtail millet varieties were tested in the field under control and low nitrogen conditions during the 2020 and 2021 growing seasons; Table S4. Evaluation of 20 traits in 50 foxtail millet varieties after 21 days of hydroponic cultivation under normal and low nitrogen conditions during the seedling stage; Table S5. The primers used for qRT-PCR analysis; Table S6. The values of component scores C(x), subordinative function U(x), and comprehensive evaluation D with different types of millet in the field and seedling stage; Table S7. Spearman correlation coefficients (r) between investigated traits of 50 foxtail millet varieties; Table S8. Growth performances of two millet varieties Dahuanggu and Maotigu at 14 days after low N treatment under seedling hydroponic conditions; Table S9. A total of 116 common DEGs between Dahuanggu and Maotigu; Table S10. Differentially expressed transcription factor in Dahuanggu; Table S11. Differentially expressed transcription factor in Maotigu; Figure S1. Principal Component Analysis (PCA) of RNA-seq Samples. This PCA plot visualizes the distribution of RNA-seq samples derived from the roots of two millet varieties, Dahuanggu and Maotigu. Samples were collected after 14 days of hydroponic cultivation under two nitrogen conditions: low nitrogen (LN, 0.1 mM N) and control (CK, 5 mM N); Figure S2. Gene Ontology (GO) and Kyoto Encyclopedia of Genes and Genomes (KEGG) Enrichment Analysis of Differentially Expressed Genes (DEGs) in Dahuanggu. (a) GO enrichment analysis of DEGs, categorized into three functional groups: biological processes (BP), molecular functions (MF), and cellular components (CC). (b) KEGG enrichment analysis of DEGs; Figure S3. Gene Ontology (GO) and Kyoto Encyclopedia of Genes and Genomes (KEGG) Enrichment Analysis of Differentially Expressed Genes (DEGs) in Maotigu. (a) GO enrichment analysis of DEGs, categorized into three functional groups: biological processes (BP), molecular functions (MF), and cellular components (CC). (b) KEGG enrichment analysis of DEGs.

Author Contributions

Conceptualization, J.W. and L.C.; methodology, J.W. and L.C.; software, Z.Y. and L.C.; validation, Z.Y. and L.C.; formal analysis, J.W. and L.C.; investigation, J.L.; resources, J.W. and H.S.; data curation, J.W. and L.C.; writing—original draft preparation, J.W. and L.C.; writing—review and editing, J.W. and J.Y.; funding acquisition, N.L. All authors have read and agreed to the published version of the manuscript.

Funding

This research was funded by the Fundamental Research Program of Shanxi Province (No. 20210302124148), the Shanxi Provincial Doctoral Graduates and Postdoctoral Researchers Working in Shanxi Reward Fund Research Project (SXBYKY2024102), and the Talent Introduction and Research Launch Project of Shanxi Agricultural University (No. 2024BQ18).

Institutional Review Board Statement

Not applicable.

Data Availability Statement

The data that support the findings of this study are available from the corresponding author upon reasonable request.

Acknowledgments

We are grateful to Xianmin Diao (Institute of Crop Science, Chinese Academy of Agricultural Sciences) for providing foxtail millet seeds and comments on the revision of the experimental design.

Conflicts of Interest

The authors declare no conflicts of interest.

References

  1. Xu, G.; Fan, X.; Miller, A.J. Plant nitrogen assimilation and use efficiency. Annu. Rev. Plant Biol. 2012, 63, 153–182. [Google Scholar] [CrossRef] [PubMed]
  2. Ma, B.; Ma, T.; Xian, W.; Hu, B.; Chu, C. Interplay between ethylene and nitrogen nutrition: How ethylene orchestrates nitrogen responses in plants. J. Integr. Plant Biol. 2023, 65, 399–407. [Google Scholar] [CrossRef]
  3. Frels, K.; Guttieri, M.; Joyce, B.; Leavitt, B.; Baenziger, P.S. Evaluating canopy spectral reflectance vegetation indices to estimate nitrogen use traits in hard winter wheat. Field Crops Res. 2018, 217, 82–92. [Google Scholar] [CrossRef]
  4. Lam, H.M.; Coschigano, K.T.; Oliveira, I.C.; Melo-Oliveira, R.; Coruzzi, G.M. The molecular-genetics of nitrogen assimilation into amino acids in higher plants. Annu. Rev. Plant Biol. 1996, 47, 569–593. [Google Scholar] [CrossRef]
  5. Islam, S.; Zhang, J.; Zhao, Y.; She, M.; Ma, W. Genetic regulation of the traits contributing to wheat nitrogen use efficiency. Plant Sci. Int. J. Exp. Plant Biol. 2021, 303, 110759. [Google Scholar] [CrossRef]
  6. Vidal, E.A.; Alvarez, J.M.; Araus, V.; Riveras, E.; Brooks, M.D.; Krouk, G.; Ruffel, S.; Lejay, L.; Crawford, N.M.; Coruzzi, G.M. Nitrate in 2020: Thirty Years from Transport to Signaling Networks. Plant Cell 2020, 32, 2094–2119. [Google Scholar] [CrossRef] [PubMed]
  7. Cheng, J.; Tan, H.; Shan, M.; Duan, M.; Ye, L.; Yang, Y.; He, L.; Shen, H.; Yang, Z.; Wang, X. Genome-wide identification and characterization of the NPF genes provide new insight into low nitrogen tolerance in Setaria. Front. Plant Sci. 2022, 13, 1043832. [Google Scholar] [CrossRef]
  8. Yanagisawa, S. Transcription factors involved in controlling the expression of nitrate reductase genes in higher plants. Plant Sci. 2014, 229, 167–171. [Google Scholar] [CrossRef]
  9. Uauy, C.; Distelfeld, A.; Fahima, T.; Blechl, A.; Dubcovsky, J. A NAC Gene Regulating Senescence Improves Grain Protein, Zinc, and Iron Content in Wheat. Science 2006, 314, 1298–1301. [Google Scholar] [CrossRef]
  10. Jiading, Y.; Eric, W.; Torres-Jerez, I.; Randall, M.; Mingyi, W.; Chunxiang, F.; Zeng-Yu, W.; Yuhong, T.; Michael, U. PvNAC1 and PvNAC2 are associated with leaf senescence and nitrogen use efficiency in switchgrass. BioEnergy Res. 2014, 8, 868–880. [Google Scholar] [CrossRef]
  11. Ristova, D.; Carré, C.; Pervent, M.; Medici, A.; Kim, G.J.; Scalia, D.; Ruffel, S.; Birnbaum, K.D.; Lacombe, B.; Busch, W.; et al. Combinatorial interaction network of transcriptomic and phenotypic responses to nitrogen and hormones in the Arabidopsis thaliana root. Sci. Signal. 2016, 9, rs13. [Google Scholar] [CrossRef] [PubMed]
  12. Hou, M.; Wu, D.; Li, Y.; Tao, W.; Chao, L.; Zhang, Y. The role of auxin in nitrogen-modulated shoot branching. Plant Signal. Behav. 2021, 16, 1885888. [Google Scholar] [CrossRef] [PubMed]
  13. Sakakibara, H. Cytokinin biosynthesis and transport for systemic nitrogen signaling. Plant J. Cell Mol. Biol. 2021, 105, 421–430. [Google Scholar] [CrossRef]
  14. Smoczynska, A.; Pacak, A.; Grabowska, A.; Bielewicz, D.; Zadworny, M.; Singh, K.; Dolata, J.; Bajczyk, M.; Nuc, P.; Kesy, J.; et al. Excess nitrogen responsive HvMADS27 transcription factor controls barley root architecture by regulating abscisic acid level. Front. Plant Sci. 2022, 13, 950796. [Google Scholar] [CrossRef] [PubMed]
  15. Wu, K.; Wang, S.; Song, W.; Zhang, J.; Wang, Y.; Liu, Q.; Yu, J.; Ye, Y.; Li, S.; Chen, J.; et al. Enhanced sustainable green revolution yield via nitrogen-responsive chromatin modulation in rice. Science 2020, 367, 6478. [Google Scholar] [CrossRef]
  16. Souza, L.C.; Monteiro, G.; Marinho, R.K.M.; Souza, E.F.L.; Oliveira, S.C.F.; Ferreira, A.C.S.; Oliveira Neto, C.F.; Okumura, R.S.; Souza, L.C. Nitrogen metabolism in maize plants submitted to drought, brassinosteroids and azospirillum. Braz. J. Biol. 2023, 83, e276264. [Google Scholar] [CrossRef]
  17. Wu, X.; Ding, C.; Baerson, S.R.; Lian, F.; Lin, X.; Zhang, L.; Wu, C.; Hwang, S.Y.; Zeng, R.; Song, Y. The roles of jasmonate signalling in nitrogen uptake and allocation in rice (Oryza sativa L.). Plant Cell Environ. 2019, 42, 659–672. [Google Scholar] [CrossRef]
  18. Conesa, C.M.; Saez, A.; Navarro-Neila, S.; de Lorenzo, L.; Hunt, A.G.; Sepúlveda, E.B.; Baigorri, R.; Garcia-Mina, J.M.; Zamarreño, A.M.; Sacristán, S.; et al. Alternative Polyadenylation and Salicylic Acid Modulate Root Responses to Low Nitrogen Availability. Plants 2020, 9, 251. [Google Scholar] [CrossRef]
  19. Sigalas, P.P.; Buchner, P.; Thomas, S.G.; Jamois, F.; Arkoun, M.; Yvin, J.-C.; Bennett, M.J.; Hawkesford, M.J. Nutritional and tissue-specific regulation of cytochrome P450 CYP711A MAX1 homologues and strigolactone biosynthesis in wheat. J. Exp. Bot. 2023, 74, 1890–1910. [Google Scholar] [CrossRef]
  20. Signora, L.; De Smet, I.; Foyer, C.H.; Zhang, H. ABA plays a central role in mediating the regulatory effects of nitrate on root branching in Arabidopsis. Plant J. 2001, 28, 655–662. [Google Scholar] [CrossRef]
  21. Gou, J.; Strauss, S.H.; Tsai, C.J.; Fang, K.; Chen, Y.; Jiang, X.; Busov, V.B. Gibberellins regulate lateral root formation in Populus through interactions with auxin and other hormones. Plant Cell 2010, 22, 623–639. [Google Scholar] [CrossRef] [PubMed]
  22. Zhao, L.; Liu, F.; Crawford, N.M.; Wang, Y. Molecular Regulation of Nitrate Responses in Plants. Int. J. Mol. Sci. 2018, 19, 2039. [Google Scholar] [CrossRef]
  23. Mauriat, M.; Petterle, A.; Bellini, C.; Moritz, T. Gibberellins inhibit adventitious rooting in hybrid aspen and Arabidopsis by affecting auxin transport. Plant J. 2014, 78, 372–384. [Google Scholar] [CrossRef] [PubMed]
  24. Nacry, P.; Bouguyon, E.; Gojon, A. Nitrogen acquisition by roots: Physiological and developmental mechanisms ensuring plant adaptation to a fluctuating resource. Plant Soil 2013, 370, 1–29. [Google Scholar] [CrossRef]
  25. Xing, J.; Cao, X.; Zhang, M.; Wei, X.; Zhang, J.; Wan, X. Plant nitrogen availability and crosstalk with phytohormones signallings and their biotechnology breeding application in crops. Plant Biotechnol. J. 2023, 21, 1320–1342. [Google Scholar] [CrossRef]
  26. Kjeldahl, J. Neue Methode zur Bestimmung des Stickstoffs in organischen Körpern. Zeitschrift für Analytische Chemie 1883, 22, 366–382. [Google Scholar] [CrossRef]
  27. Livak, K.J.; Schmittgen, T.D. Analysis of relative gene expression data using real-time quantitative PCR and the 2(-Delta Delta C(T)) Method. Methods 2001, 25, 402–408. [Google Scholar] [CrossRef] [PubMed]
  28. Chen, E.; Qin, L.; Li, F.; Yang, Y.; Liu, Z.; Wang, R.; Yu, X.; Niu, J.; Zhang, H.; Wang, H.; et al. Physiological and Transcriptomic Analysis Provides Insights into Low Nitrogen Stress in Foxtail Millet (Setaria italica L.). Int. J. Mol. Sci. 2023, 24, 16321. [Google Scholar] [CrossRef]
  29. Bandyopadhyay, T.; Maurya, J.; Bentley, A.R.; Griffiths, H.; Swarbreck, S.M.; Prasad, M. Identification of the mechanistic basis of nitrogen responsiveness in two contrasting Setaria italica accessions. J. Exp. Bot. 2024, 75, 5008–5020. [Google Scholar] [CrossRef]
  30. Brasier, K.; Ward, B.; Smith, J.; Seago, J.; Oakes, J.; Balota, M.; Davis, P.; Fountain, M.; Brown-Guedira, G.; Sneller, C.; et al. Identification of quantitative trait loci associated with nitrogen use efficiency in winter wheat. PLoS ONE 2020, 15, e0228775. [Google Scholar] [CrossRef]
  31. Yan, H.; Shi, H.; Hu, C.; Luo, M.; Xu, C.; Wang, S.; Li, N.; Tang, W.; Zhou, Y.; Wang, C.; et al. Transcriptome Differences in Response Mechanisms to Low-Nitrogen Stress in Two Wheat Varieties. Int. J. Mol. Sci. 2021, 22, 12278. [Google Scholar] [CrossRef] [PubMed]
  32. Guo, K.; Yang, J.; Yu, N.; Luo, L.; Wang, E. Biological nitrogen fixation in cereal crops: Progress, strategies, and perspectives. Plant Commun. 2023, 4, 100499. [Google Scholar] [CrossRef]
  33. Scheible, W.R.; Morcuende, R.; Czechowski, T.; Fritz, C.; Osuna, D.; Palacios-Rojas, N.; Schindelasch, D.; Thimm, O.; Udvardi, M.K.; Stitt, M. Genome-wide reprogramming of primary and secondary metabolism, protein synthesis, cellular growth processes, and the regulatory infrastructure of Arabidopsis in response to nitrogen. Plant Physiol. 2004, 136, 2483–2499. [Google Scholar] [CrossRef]
  34. Léran, S.; Edel, K.H.; Pervent, M.; Hashimoto, K.; Corratgé-Faillie, C.; Offenborn, J.N.; Tillard, P.; Gojon, A.; Kudla, J.; Lacombe, B. Nitrate sensing and uptake in Arabidopsis are enhanced by ABI2, a phosphatase inactivated by the stress hormone abscisic acid. Sci. Signal. 2015, 8, ra43. [Google Scholar] [CrossRef] [PubMed]
  35. Gaudinier, A.; Rodriguez-Medina, J.; Zhang, L.; Olson, A.; Liseron-Monfils, C.; Bågman, A.-M.; Foret, J.; Abbitt, S.; Tang, M.; Li, B.; et al. Transcriptional regulation of nitrogen-associated metabolism and growth. Nature 2018, 563, 259–264. [Google Scholar] [CrossRef] [PubMed]
  36. Wada, S.; Hayashida, Y.; Izumi, M.; Kurusu, T.; Hanamata, S.; Kanno, K.; Kojima, S.; Yamaya, T.; Kuchitsu, K.; Makino, A.; et al. Autophagy supports biomass production and nitrogen use efficiency at the vegetative stage in rice. Plant Physiol. 2015, 168, 60–73. [Google Scholar] [CrossRef]
  37. Di Berardino, J.; Marmagne, A.; Berger, A.; Yoshimoto, K.; Cueff, G.; Chardon, F.; Masclaux-Daubresse, C.; Reisdorf-Cren, M. Autophagy controls resource allocation and protein storage accumulation in Arabidopsis seeds. J. Exp. Bot. 2018, 69, 1403–1414. [Google Scholar] [CrossRef]
  38. Li, W.; Chen, M.; Wang, E.; Hu, L.; Hawkesford, M.J.; Zhong, L.; Chen, Z.; Xu, Z.; Li, L.; Zhou, Y.; et al. Genome-wide analysis of autophagy-associated genes in foxtail millet (Setaria italica L.) and characterization of the function of SiATG8a in conferring tolerance to nitrogen starvation in rice. BMC Genom. 2016, 17, 797. [Google Scholar] [CrossRef]
  39. Zhang, T.T.; Lin, Y.J.; Liu, H.F.; Liu, Y.Q.; Zeng, Z.F.; Lu, X.Y.; Li, X.W.; Zhang, Z.L.; Zhang, S.; You, C.X.; et al. The AP2/ERF transcription factor MdDREB2A regulates nitrogen utilisation and sucrose transport under drought stress. Plant Cell Environ. 2024, 47, 1668–1684. [Google Scholar] [CrossRef]
  40. Lian, X.; Zhao, X.; Zhao, Q.; Wang, G.; Li, Y.; Hao, Y. MdDREB2A in apple is involved in the regulation of multiple abiotic stress responses. Hortic. Plant J. 2021, 7, 197–208. [Google Scholar] [CrossRef]
  41. Shin, J.M.; Chung, K.; Sakamoto, S.; Kojima, S.; Yeh, C.M.; Ikeda, M.; Mitsuda, N.; Ohme-Takagi, M. The chimeric repressor for the GATA4 transcription factor improves tolerance to nitrogen deficiency in Arabidopsis. Plant Biotechnol. 2017, 34, 151–158. [Google Scholar] [CrossRef] [PubMed]
Figure 1. The 50 foxtail millet varieties were clustered based on the class average method according to the D-value of field (a) and seedling stage (b). 1: Hongpigu, 2: Cheerhuang, 3: Xiaomaogu, 4: Hongxiaogu, 5: Lianggu, 6: Qinghuanggu, 7: SSR5, 8: Sanbianse, 9: Jiuganqi, 10: Niumaogu, 11: SSR34, 12: SSR44, 13: SSR50, 14: SSR46, 15: SSR48, 16: Dahuanggu, 17: Liushitianhuancang, 18: Baiyousha, 19: Shiliugu, 20: Baizhangu, 21: Yumaohuangguzi, 22: Zhibozi, 23: SSR22, 24: SSR24, 25: SSR26, 26: SSR30, 27: SSR32, 28: SSR38, 29: Milahuang, 30: Laolaibian, 31: Daobaqi, 32: Zhushigu, 33: Bawangbian, 34: Zaoerbaigu, 35: Jiuguzi, 36: Maolianggu, 37: Zhuyeqing, 38: Dabaigu, 39: Yibajie, 40: Huangyusihao, 41: Laohonggu, 42: Hongjiaoshi, 43: Huangbagu, 44: Zhuyeqing 2, 45: Huangshashi, 46: Jiangu, 47: Sugu, 48: Maotigu, 49: Hongwuzhualong, 50: Mizhihuang. Different colors represent different levels of tolerance.
Agriculture 15 00628 g001
Figure 2. The phenotype of Dahuanggu and Maotigu after control (5 mM N) and low nitrogen (0.1 mM N) treatments for 21 days in a hydroponic environment.3.4. GO and KEGG Enrichment Analyses of DEGs.
Agriculture 15 00628 g002
Figure 3. The differentially expressed genes (DEGs) in the seedlings of two millet varieties after 14 days of hydroponic cultivation under low nitrogen (LN) conditions (0.1 mM N) compared to the control conditions (5 mM N) and Gene Ontology (GO) and Kyoto Encyclopedia of Genes and Genomes (KEGG) enrichment analysis of DEGs. (a) Histogram showing the number of DEGs of Dahuanggu and Maotigu. Red and blue represent upregulated and downregulated genes, respectively. (b) Venn diagrams of DEGs of Dahuanggu and Maotigu. (c) GO enrichment analysis of DEGs. BP represents biological processes. MF represents molecular functions. CC represents cellular components. (d) KEGG enrichment analysis of DEGs. Genes Ratio: The ratio of the number of target genes enriched to target pathway genes to the total number of target genes. Qvalue: corrected p-value. GeneNumber: the size of the black dot indicates the number of DEGs.
Agriculture 15 00628 g003
Figure 4. Heatmap of the expression of differentially expressed genes (DEGs) according to the RNA-seq involved in different pathways. The pathway information is derived from KEGG analysis. The color scale indicates gene expression levels, and the number represents log2 (fold change) values. Red represents up regulation; blue indicates down regulation.
Agriculture 15 00628 g004
Figure 5. Some important differentially expressed genes were verified using qRT-PCR. Seedlings (0, 7, 14, and 21 days) of Dahuanggu (blue) and Maotigu (red) were grown hydroponically in a nutrient solution under control (5 mM N) or low-nitrogen (LN, 0.1 mM N) treatments. Lowercase letters indicate those that are statistically different (p ≥ 0.05). Error bars indicate ± SD (n = 3). The relative expression was compared between the LN treatment and the control treatment; relative expression levels were normalized to the expression of siActin.
Agriculture 15 00628 g005
Figure 6. Expression patterns of differentially expressed genes (DEGs) in multiple NUE-related pathways. Red represents the common DEG between Dahuanggu and Maotigu. Boxes of different colors represent different pathways.
Agriculture 15 00628 g006
Table 1. Relative traits values and coefficients of low nitrogen tolerance of 50 foxtail millet varieties at the seedling and maturity stages under two nitrogen conditions.
TraitControl Nitrogen TreatmentLow Nitrogen TreatmentLow Nitrogen Tolerance Coefficient
Mean±SDCV (%)Mean±SDCV (%)Mean±SDCV (%)
Seeding trait
RL13.10 B2.0615.7014.57 A2.7318.761.130.2219.18
SH35.40 A4.9013.8322.95 B5.2622.930.650.1217.89
RN12.55 A1.9815.838.83 B1.3315.030.710.0912.43
TLL21.66 A3.0614.1411.71 B2.7623.550.540.1119.51
TLW0.94 A0.1414.340.63 B0.1219.310.670.1014.55
TLN5.82 A0.427.224.60 B0.5611.990.790.0810.05
RDW0.13 A0.0426.250.06 B0.0339.250.470.1736.11
SDW0.03 A0.0134.440.02 B0.0136.530.600.2033.03
RRD0.20 B0.0420.780.25 A0.0623.061.340.3828.16
PDW0.16 A0.0426.580.08 B0.2937.580.490.1733.99
SNC7.23 A1.4219.673.56 B0.8724.360.490.1223.42
RNC5.10 A1.0119.853.19 B0.6319.790.640.1422.35
PNC6.91 A1.3219.143.48 B0.7421.280.510.1121.64
SNA1.00 A0.3433.940.23 B0.1357.870.240.1248.21
RNAC0.14 A0.0532.660.05 B0.0237.850.380.1438.14
PNA1.14 A0.3731.160.28 B0.1552.970.260.1144.34
SNPE142.24 B29.7320.48290.98 A69.3323.22.100.4822.88
RNPE206.18 B42.7220.72317.97 A59.0818.581.580.3320.85
PNPE151.17 B29.8619.76301.63 A61.0720.252.040.4321.22
SPAD30.19 A3.0910.2518.07 B3.0616.920.600.0915.59
Field trait
PH-2019138.41A28.6320.69122.33 B24.6320.140.890.044.97
SL-201927.64 A5.3419.3023.79 B4.4018.500.870.078.30
LSN-201929.63 A4.9816.8225.71 B4.8318.790.870.0910.53
SW-2019113.08 A29.0225.6691.32 B24.6727.050.810.0911.22
GW-2019118.36 A52.5944.4389.96 B37.9242.150.770.1114.57
GRW-201992.32 A25.0627.1470.41 B20.1528.610.760.0911.44
HD-201962.88 A6.7510.7360.27 B6.7511.200.960.033.08
PH-2020128.73 A25.4519.37118.02 B23.9320.270.900.044.70
SL-202026.75 A4.3116.1121.78 B4.4620.480.810.089.49
LSN-202026.49 A7.2427.3322.59 B6.5128.820.850.089.23
SW-2020109.58 A35.5730.9485.43 B31.9735.190.790.0911.33
GW-2020104.40 A24.8023.7584.97 B22.2626.190.810.0810.36
GRW-202086.62 A22.5726.0666.76 B16.8025.160.780.079.04
HD-202061.74 A6.9611.2758.96 B6.73311.420.960.033.13
RL: root length, SH: seeding height, RN: roots number, TLL: the leaf length, TLW: the leaf width, TLN: the leaf number, RDW: root dry weight, SDW: shoot dry weight, RRD: root-shoot ratio of dry weight, PDW: plant dry weight, SNC: shoot nitrogen content, RNC: root nitrogen content, PNC: plant nitrogen content, SNA: shoot nitrogen accumulation, RNAC: root nitrogen accumulation, PNA: plant nitrogen accumulation, SNPE: shoot nitrogen physiology efficiency, RNPE: root nitrogen physiology efficiency, PNPE: plant nitrogen physiology efficiency, SPAD: soil and plant analyzer development value, PH: plant height, SL: spike length, LSN: length of spike neck, SW: spike weight, GW: grass weight, GRW: grain weight, HD: heading date. Most traits exhibited significant decreases under LN treatment, with only RL, RDW, SNPE, RNPE, and PNPE showing significant increases. In the table, values followed by different letters within the same row are significantly different at p = 0.01 level. SD: standard deviation, CV: coefficient of variation.
Table 2. Principal component analysis (PCA) of 20 traits in the seedling stage and 7 yield-related traits in the maturity stage of 50 foxtail millet varieties.
TraitPC1PC2PC3PC4PC5
Seeding trait
SPAD0.15−0.190.340.210.05
RL0.130.180.260.450.26
SH0.270.170.06−0.09−0.26
RN0.240.14−0.050.090.15
TLL0.230.110.28−0.04−0.50
TLW0.300.070.010.090.10
TLN0.180.06−0.28−0.170.66
RDW0.290.22−0.07−0.11−0.03
SDW0.190.23−0.080.000.02
PDW−0.150.060.200.590.13
SNC0.280.25−0.05−0.02−0.05
RNC0.19−0.360.19−0.050.10
PNC0.09−0.23−0.510.24−0.28
SNA0.20−0.370.08−0.02−0.01
RNAC0.32−0.010.03−0.150.08
PNA0.230.12−0.260.45−0.15
SNPE0.330.01−0.01−0.080.04
RNPE−0.190.36−0.190.02−0.07
PNPE−0.060.310.44−0.200.03
RRD−0.210.37−0.07−0.020.02
Eigenvalue8.494.361.851.450.87
Contribution rate (%)42.4321.809.247.254.33
Accumulated contribution (%)42.4364.2373.4680.7185.04
Field trait
PH0.41−0.410.040.32
SL0.44−0.390.160.16
LSN0.43−0.15−0.040.09
SW0.460.20−0.08−0.41
GW0.210.54−0.520.61
GRW0.420.28−0.14−0.53
HD0.160.500.820.21
Eigenvalue3.251.090.900.77
Contribution rate (%)46.4615.5512.8211.06
Accumulated contribution (%)46.4662.0174.8385.89
Note: PC: Principal Component.
Disclaimer/Publisher’s Note: The statements, opinions and data contained in all publications are solely those of the individual author(s) and contributor(s) and not of MDPI and/or the editor(s). MDPI and/or the editor(s) disclaim responsibility for any injury to people or property resulting from any ideas, methods, instructions or products referred to in the content.

