Article

Spatial–Temporal and Decoupling Effect of Agricultural Carbon Pollution Synergy in Ecologically Fragile Areas

1
School of Platform Economy, Shanxi University of Finance and Economics, Taiyuan 030006, China
2
School of International Trade, Shanxi University of Finance and Economics, Taiyuan 030006, China
*
Author to whom correspondence should be addressed.
Agriculture 2025, 15(6), 592; https://doi.org/10.3390/agriculture15060592
Submission received: 9 February 2025 / Revised: 1 March 2025 / Accepted: 6 March 2025 / Published: 11 March 2025
(This article belongs to the Section Agricultural Economics, Policies and Rural Management)

Abstract

:
As an important industry in ecologically fragile areas, the synergy of agricultural pollution control and carbon reduction is vital for the balanced development of industries and regional synergy. This paper aims to explore the synergistic result of agricultural pollution control and carbon reduction in ecologically fragile areas so as to clarify the weak links and solve carbon pollution in ecologically fragile areas. Leveraging the 2006–2021 municipal data of ecologically fragile areas, this paper calculates the coupling coordination degree (CCD) of agricultural non-point source pollution and agricultural carbon emission in ecologically fragile areas; calculates the decoupling relationship between agricultural carbon emissions, pollutants, and gross agricultural output based on the Tapio decoupling index; and quantitatively depicts the synergy of agricultural pollution control and carbon reduction in ecologically fragile areas. From 2006 to 2021, agricultural carbon emissions in ecologically fragile areas depicted a fluctuating and increasing trend. Agricultural non-point source pollution depicted an “inverted U-shaped” growth trend. The emission trends of agricultural carbon emissions and agricultural pollutants depict that although agricultural pollutants and carbon emissions are homologous, there is heterogeneity in the trend and change in emissions. The synergistic results of agricultural pollution control and carbon reduction show a fluctuating upward trend in ecologically fragile areas, and the coordination degree of ecologically fragile areas increased from 0.32 to 0.89, indicating that the level of coordinated development between agricultural pollution control and carbon reduction increased significantly. Taking into account the decoupling effect, the decoupling state of agricultural carbon pollution synergistic economic growth in ecologically fragile areas has changed from negative decoupling to strong decoupling to weak decoupling, mainly in the state of strong decoupling, negative decoupling of expansion, and weak decoupling; in addition, the synergistic capacity of agricultural pollution control and carbon reduction needs to be further optimized. Based on the research results, there is some room for improvement in agricultural carbon pollution synergy in ecologically fragile areas, and regions should strengthen regional cooperation.

1. Introduction

The synergy of agricultural pollution control and carbon reduction is the core content of the development of new quality productivity in agriculture and rural areas, and it is also an indispensable part of helping to achieve the construction of a beautiful China and the “dual carbon” goal [1]. In January 2022, the State Council issued the “14th Five-Year Plan for Energy Conservation and Emission Reduction”, which clearly pointed out that the “14th Five-Year Plan” is a critical period to achieve synergy in energy conservation, pollution control, and carbon reduction and continuous change in the quality of the ecological environment for the better. In June 2022, the Ministry of Ecology and Environment issued the “Implementation Plan for Synergy in Pollution Reduction and Carbon Reduction”, emphasizing the need to achieve the synergy of agricultural pollution control and carbon reduction as the general approach to promoting the green transformation of economic and social [2], and proposing to achieve a work pattern for the synergy by 2025, and significantly improve the synergy capacity of pollution and carbon reduction by 2030 to help achieve the goal of carbon peaking. Central Document No. 1 of 2024 states that in order to strengthen the construction of rural ecological civilization, it is necessary to focus on continuing to fight the tough battle of agricultural and rural pollution control [3]. Therefore, the task of building a Green Eco-China is still arduous, and it is necessary to focus on the synergy of agricultural pollution control and carbon reduction, such as strengthening system governance in areas with prominent agricultural non-point source pollution [4]. China is the world’s largest developing country, yet it also faces serious ecological problems, and the problem of inadequacy and imbalance in the development process is very prominent, and the construction of a modern system in China requires comprehensive consideration of multiple major issues such as carbon and pollution synergy, economic development, and social transformation [5]. Boosting the synergy of agricultural pollution control and carbon reduction can improve resource allocation capacity and improve quality and efficiency. The synergy of agricultural pollution control and carbon reduction needs to apply multi-dimensional economic and management theories and methods to achieve the whole life cycle, the whole process, and the whole system collaborative management and control [6] and better meet the people’s aspirations for a better life under the concept of big food system, and the management mode of agricultural pollution control and carbon reduction synergy to ensure national food security needs are explored urgently [7]. Therefore, it matters a lot to comprehensively evaluate the relationship between pollution control and carbon reduction and to study and design scientific and reasonable pollution control and carbon reduction measures.
Promoting synergies between pollution control and carbon reduction is a topic that has been extensively researched within the domain of environmental economics [8]. Broadly speaking, the current scholarly works appraise the effectiveness of pollution control and carbon reduction through two primary lenses. Researchers assess the effectiveness of pollution control and carbon reduction by developing an extensive set of metrics. Regarding environmental pollution issues, prior researchers have designed various environmental quality index frameworks to capture the multifaceted nature of pollution. Latif (2022) analyzed the overall state of the environment in Asian nations between 1996 and 2020, incorporating six dimensions such as environmental governance and vulnerability [9]. Liu (2022) established an ecological quality indicator framework to evaluate the environmental conditions of 41 cities in China’s Yangtze River Delta between 2005 and 2017 [10]. Numerous researchers have utilized the ecological footprint as a metric to measure the sustainability of natural resource utilization at a regional level [11,12,13]. Considering carbon emissions, a number of recent studies have assessed the effectiveness of carbon reduction in a carbon-neutral context. Wen (2023) constructed an indicator system and assessed China’s progress in striving for carbon neutrality using regional panel data spanning 2007 to 2018 [14].
Certain research has assessed the effectiveness of pollution control and carbon reduction through the lens of efficiency. Studies in this area are mainly rooted in the DEA analytical structure, which measures green total factor productivity or carbon emissions performance by considering pollution of the environment or carbon emissions as an unintended output [15,16,17,18,19]. Overall, there is extensive literature in this field that comprehensively investigates the characteristics and influencing factors of pollution control and carbon reduction performance.
With the increasing recognition of the link between pollution control and carbon reduction and the practical need to achieve the goal of carbon neutrality, a number of recent studies have begun to focus on how to enhance pollution control and carbon reduction. These studies mainly focus on the factors and effects of pollution control and carbon reduction. Wang et al. (2025a) believe that the impact of China’s new urbanization on integrated management of pollution control and carbon reduction remains uncertain [20]. Chen (2022b) evaluates the impact of China’s carbon emissions trading system on carbon neutrality and carbon neutrality, and the results show that the policy reduces the total amount of carbon emissions and air pollution, realizing the co-interest of carbon neutrality and carbon neutrality [21]. Zhang et al. (2025a) used a variety of models to study cities in 82 priority air pollution control zones from 2014 to 2020 and identified their structural characteristics and drivers [22]. Wang and Zhang (2021b) found through their investigation that narrowing the gap favored pollution control, but there was regional heterogeneity in the effect on carbon reduction [23]. Xu et al. (2025) assessed the synergistic effects of energy conservation and emission reduction fiscal policy in pollution and carbon reduction using the difference–difference method for 257 Chinese cities from 2003 to 2019 and concluded that the policy is conducive to synergistic effects [24].
On the basis of previous studies, this paper focuses on ecologically fragile areas, uses the CCD to assess the synergy of agricultural pollution control and carbon reduction in ecologically fragile areas from 2006 to 2021, and uses the Tapio decoupling index to measure the relationship between agricultural carbon emissions, agricultural non-point source pollution, and gross agricultural output in ecologically fragile areas, revealing the spatial–temporal pattern and decoupling effect of the synergy of agricultural pollution control and carbon reduction. The marginal contribution of this paper is reflected in both methodology and application. Based on the synergy of agricultural pollution control and carbon reduction, this study uses the coupling coordination model and the Tapio model to incorporate economic and environmental factors into the analysis composition of agricultural carbon pollution synergy so as to avoid the shortcomings caused by simply using agricultural carbon emissions and non-point source pollution to construct indicators. In terms of application, the distribution characteristics and evolution trend of agricultural carbon pollution synergy were comprehensively evaluated in 248 cities in 21 provinces in ecologically fragile areas from 2006 to 2021 by using the constructed assessment method for the synergy of agricultural pollution control and carbon reduction, which provided a scientific basis for revealing the synergistic management of agricultural pollution control and carbon reduction in ecologically fragile areas.
Ecologically fragile areas usually refer to areas with relatively fragile ecosystem structures and functions, sensitive to environmental changes, and with a weak capacity for recovery. These areas are often faced with problems such as the over-utilization of resources and degradation of the ecological environment, and require special attention and protection. China’s ecologically fragile areas are widely distributed, ranging from arid and semi-arid regions in the north to highland mountains in the southwest, with a variety of ecosystem types and different manifestations of fragility. These regions are areas of outstanding ecological problems, and agricultural activities often rely on high-intensity chemical inputs such as fertilizers and pesticides, leading to outstanding problems of agricultural surface source pollution and carbon emissions. Therefore, the balance between environmental protection and economic development in ecologically fragile areas is particularly important. By analyzing the spatial and temporal patterns of the synergy of agricultural pollution control and carbon reduction and their decoupling from economic growth, this study reveals the potentials and challenges of ecologically fragile zones in reducing pollution and carbon emissions, and the results provide a reference for the formulation of pollution and carbon reduction policies tailored to the local conditions of each region while supporting the realization of regional ecosystem stability and sustainable economic and social development.

2. Materials and Methods

2.1. Methods

2.1.1. Measurement of Agricultural Carbon Emissions

Following the existing research results of Wang et al., (2022b), there are six direct or indirect carbon sources in the process of planting, like diesel, fertilizer, pesticide, agricultural film, irrigation, and tillage, and the carbon emission coefficients of various carbon sources are used to calculate the carbon emissions from planting industry [25]. The main sources of carbon emissions and carbon emission coefficients of the plantation sector are shown in Table 1.

2.1.2. Measurement of Agricultural Non-Point Source Pollution

This study identified three agricultural non-point source pollution accounting units: fertilizer, pesticide, and farmland solid waste. Among them, agricultural fertilizer pollution includes the pollution caused by the application, and the loss coefficient of nitrogen fertilizer and phosphate fertilizer is determined according to the First National Survey of Pollution Sources—Handbook of Fertilizer Loss Coefficients of Agricultural Pollution Sources and the related literature. Pesticide pollution includes the pollution caused by pesticide application, and the calculation base is the pesticide application rate, and the pesticide loss coefficient is determined according to the relevant literature. The solid waste pollution of farmland includes the pollution caused by the waste part left after the edible part of crops and vegetables is harvested, and the calculation base is the yield of crops, and the proportion of waste part of different agricultural products in food, the pollution content of waste part of agricultural products, and the loss rate of waste part of agricultural products are determined with the help of the relevant literature. The accounting unit of agricultural non-point source pollution is shown in Table 2.

2.1.3. Coupling Coordination Model

The coupling coordination model is an analytical tool to analyze the CCD achieved by the interactions and influences between various subsystems within the coupled system [31]. Agricultural pollution control and carbon reduction belong to the same system, and the two are interrelated and interactive. In this paper, the coordination degree measured by this model is used to characterize the CCD of agricultural pollution control and carbon reduction. The specific formula is as follows:
D = 2 V 1 V 2 V 1 + V 2 = [ 1 V 2 V 1 V 1 V 2
T = a V 1 + b V 2
E = D × T
Among them, V1 and V2 are two subsystems of agricultural carbon emissions and non-point source pollution which are standardized by the range method, respectively; D represents the coupling degree of the two subsystems. E represents the coordination of pollution control and carbon reduction for agriculture. Drawing on relevant research, the value range is set as follows: when the E value approaches 1, it means that the synergy between the two subsystems of agricultural pollution control and carbon reduction has reached the optimal level. On the contrary, when E is close to 0, it indicates that the synergy between the two subsystems is weak and the synergy effect is not good.

2.1.4. Tapio Decoupling Model

The Tapio model is a model used to analyze the relationship between environmental impact and economic growth [32]. In accordance with the decoupling theory, this paper constructs a decoupling elasticity model of the CCD of agricultural pollution control and carbon reduction and economic growth, which is calculated as follows:
T = E t E t 1 / E t 1 G t G t 1 / G t 1 = Δ E / E t 1 Δ G / G t 1
Among them, T is the decoupling elastic value, E represents CCD of agricultural pollution control and carbon reduction, the G is total agricultural output value, and ∆E and ∆G are the respective added values.
Specific classifications for agricultural carbon reduction and pollution reduction (Table 3). Among the different categories of decoupling, weak decoupling, dilated negative decoupling, and dilated connection are considered to be relatively desirable states; strong-negative decoupling, weak negative decoupling, strong decoupling, recession decoupling, and declining connection are considered less desirable.

2.2. Data

China is distinguished by its large distribution area, diverse vulnerable ecological types, and pronounced ecological vulnerability across the globe. China’s ecologically fragile areas are currently areas with prominent ecological threats and a less developed economy [33]. Simultaneously, it is also a weak area of environmental supervision in China. In this study, 248 cities in 21 provinces (municipalities and autonomous regions), including Heilongjiang, Jilin, Shaanxi, Hebei, Shanxi, Liaoning, Qinghai, Ningxia, Gansu, Xizang, Sichuan, Yunnan, Guizhou, Chongqing, Hubei, Hunan, Jiangxi, Anhui, Guangxi, Xinjiang, and Inner Mongolia were selected as the study samples (Figure 1), and the sample study period was 2006–2021. The data collection sources of this study include the China Statistical Yearbook 2007–2022, the China Rural Statistical Yearbook 2007–2022, and the statistical yearbooks of each province from 2007 to 2022.

3. Results

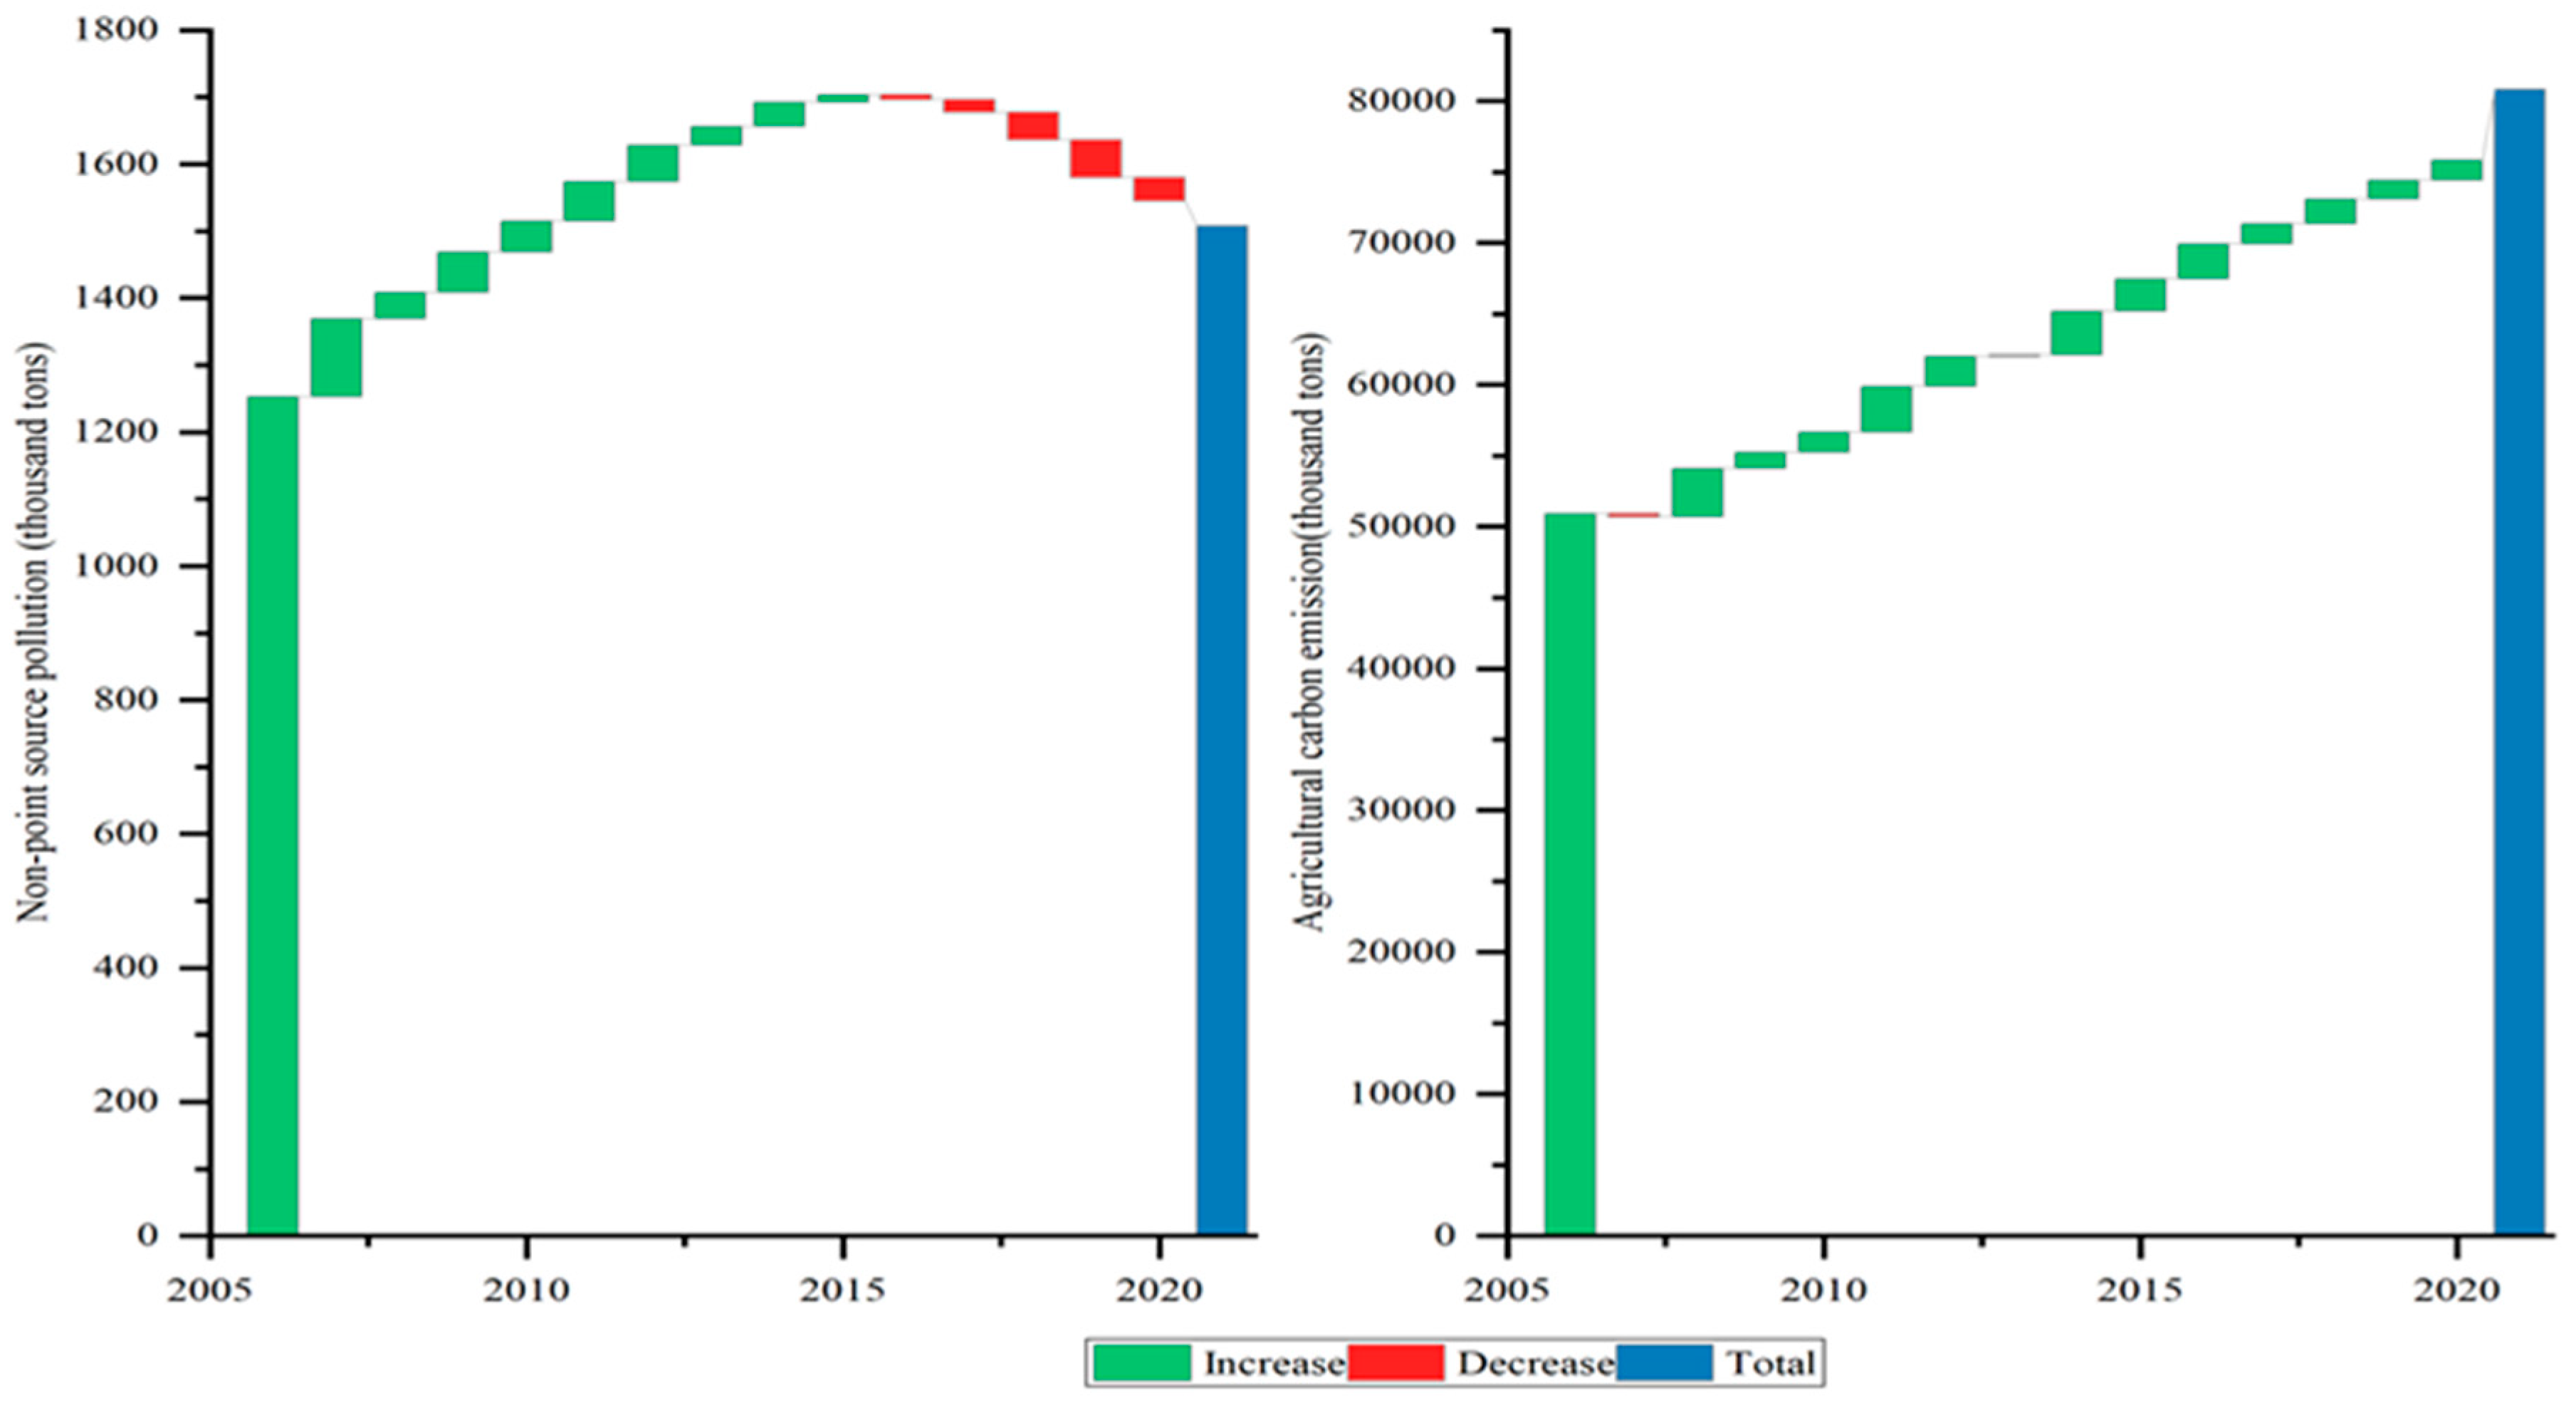
3.1. Synergistic of Agricultural Carbon Pollution in Ecologically Fragile Areas

The carbon emissions, non-point source pollution, coupling degree, and CCD of the planting industry in 21 provinces in ecologically fragile areas from 2006 to 2021 were calculated, respectively, and the average values of each year were calculated to obtain the synergistic changes in agricultural pollution control and carbon reduction in ecologically fragile areas. From the data in the figure, the synergistic effect of agricultural pollution control and carbon reduction in ecologically fragile areas from 2006 to 2021 has the following characteristics:
From 2006 to 2021, the average value of agricultural carbon emissions in ecologically fragile areas showed an increasing trend (Figure 2). From the data in Figure 1, agricultural carbon emissions increased from 2,261,400 tons in 2006 to 3,592,900 tons in 2021, an increase of 58.88%, with an average annual growth rate of 3.15%. China’s plantation industry occupies a key position in the agricultural system. With the strengthening of agricultural mechanization and agricultural chemistry, the scale of agricultural production in China has expanded, and the economic output has increased significantly, but at the same time, the carbon emissions caused by the production process of the planting industry have also become an important factor in the increase in China’s total carbon emissions. The average value of agricultural non-point source pollution in ecologically fragile areas showed an “inverted U-shaped” growth trend. It can be roughly segmented into the following two stages: the first is from 2006 to 2015, and the second is from 2016 to 2021. In the first stage, the amount of agricultural non-point source pollution showed an increasing trend, with the lowest at 51,800 tons in 2006 and the peak at 70,200 tons in 2015, an increase of 35.61%. In the second stage, agricultural non-point source pollution showed a decreasing trend, decreasing year by year from 2015 to 62,400 tons in 2021, with an average annual decrease of 1.94%. The possible reason for this is that China’s agricultural economic growth in the past was overly dependent on chemical fertilizers and pesticides, resulting in the excessive loss of nitrogen and phosphorus in chemical fertilizers and excessive pesticide residues. Since 2015, China’s Ministry of Agriculture has issued the Action Plan for Zero Growth in the Use of Chemical Fertilizers and Pesticides, and this is beginning to change.
From 2006 to 2021, the coupling degree of ecologically fragile areas showed an upward trend. The average coupling degree of agricultural pollution control and carbon reduction synergy level in ecologically fragile areas was 0.95, which was always at the stage of high coupling level, indicating that there was a significant interaction between the subsystems and elements of agricultural pollution control and carbon reduction synergy level. The CCD of agricultural pollution control and carbon reduction in ecologically fragile areas showed a fluctuating upward trend. The coordination degree of ecologically fragile areas increased from 0.32 to 0.89, an overall increase of 0.57, and with the introduction of relevant policies in 2015, the level of harmonization between pollution control and carbon reduction has significantly increased.

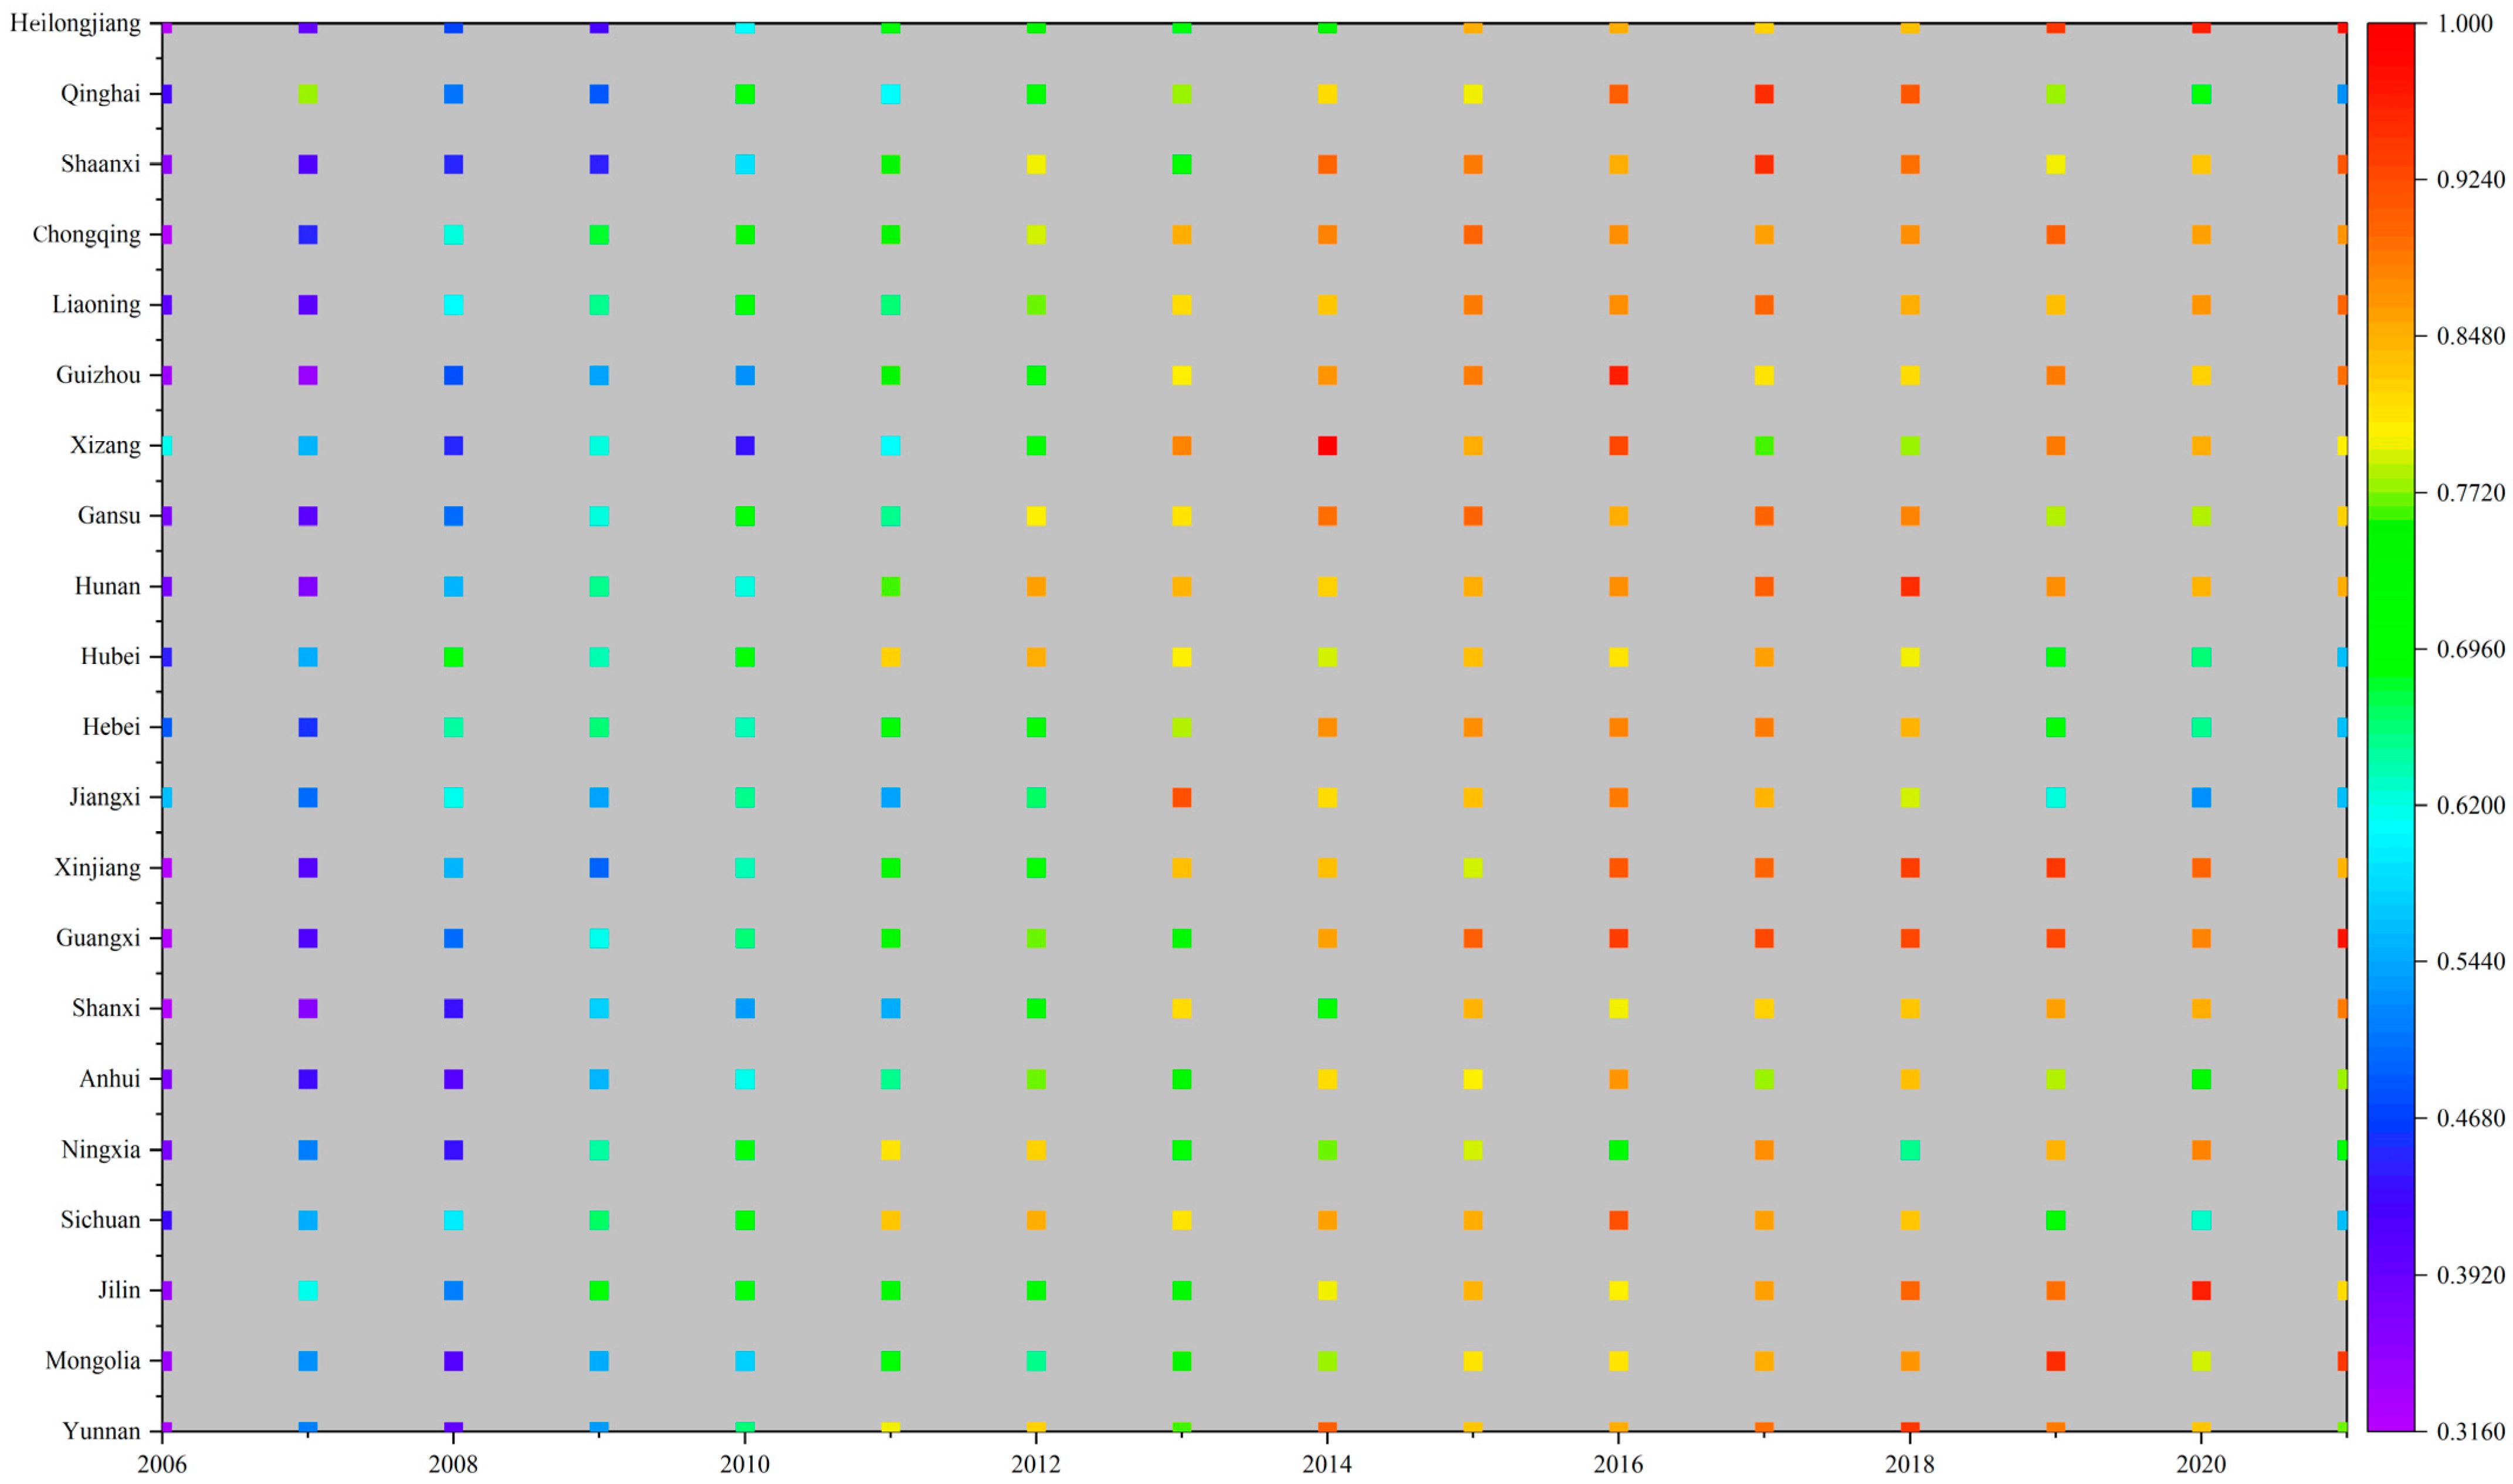
3.2. Spatial and Temporal Characteristics in Different Provinces

The agricultural carbon emissions of provinces in ecologically fragile areas were on the rise. According to the increase rate of agricultural carbon emissions, it is divided into slow-growth areas (no more than 50% increase) and fast-growth areas (more than 50% increase). The slow-growth areas were concentrated in Qinghai (35%), Jiangxi (49%), Guizhou (50%), Heilongjiang (50%), Ningxia (26%), and Xizang (50%). The rapid growth was concentrated in Anhui (58%), Shanxi (62%), Yunnan (56%), Jilin (60%), Sichuan (68%), Hebei (66%), Hubei (64%), Hunan (55%), Gansu (55%), Liaoning (58%), Shaanxi (65%), Chongqing (61%), Inner Mongolia (58%), Guangxi (67%), and Xinjiang (65%). The reason for this may be that the use of chemical fertilizers and pesticides is an important source of agricultural carbon emissions, and the use of chemical fertilizers and pesticides is deeply affected by the complex area and planting structure of crops and then shows significant regional differences in geographical space.
Further analysis shows that Hami, Xinjiang, has the lowest average agricultural carbon emissions (846,500 tons). This may be due to the fact that in 2021, the crop planting area in Xinjiang was 2433.90 thousand hectares, with an average of 173.85 thousand hectares in 14 prefectural-level cities, while the crop sowing area in Hami was only 58.18 thousand hectares. These crops may have lower demand for fertilizers and pesticides than other crops, and the cultivation of cantaloupe-based specialty agricultural products in Hami has been organically cultivated, reducing the use of fertilizers and pesticides, thereby reducing carbon emissions.
In the ecologically fragile areas, except for Heilongjiang, the non-point source pollution emissions of the remaining 20 provinces showed a tendency to increase and then decrease, and reached a peak around 2015. The possible reason is that from 2006 to 2014, the government continued to increase subsidies for the purchase of agricultural materials such as fertilizers, pesticides, and agricultural machinery, and the application of agrochemicals increased rapidly, resulting in an increasing amount of non-point source pollution in the planting industry. Yet the different levels of agricultural mechanization, the input structure of production factors, and the prevention and control technology of pollution among different provinces have significantly aggravated the regional differences in the planting industry.
Further analysis shows that from 2006 to 2021, Changchun, Jilin, had the highest average multi-year average non-point source pollution (352,100 tons). As a major agricultural province, Changchun had a grain planting area of 1.578 million hectares in 2021, mainly rice, corn, sorghum, and soybeans, and the excessive and irrational application of chemical fertilizers and pesticides, especially the amount of nitrogen which far exceeds the absorption of crops, resulting in the accumulation of a large amount of nitrogen and phosphorus in the soil profile of farmland, and entering surface water and groundwater with surface runoff and leaching. From 2006 to 2021, the average value in Huangnan in Qinghai was the lowest (3300 tons). The reason for this may be that Huangnan of Qinghai is located in the northeast of the Qinghai–Tibet Plateau, which has the regional characteristics of low temperature, low and concentrated rainfall, and long sunshine. These natural conditions limit the use of chemical fertilizers and pesticides in Huangnan, thereby reducing pollution. Secondly, the total sown area of crops in Huangnan in 2021 was only 261,500 mu; the crop planting structure was dominated by wheat, barley, oil crops, vegetable crops, and special crops; and the use of chemical fertilizers and pesticides was small, which reduces the emission of the agricultural pollution.
The synergistic degree of pollution control and carbon reduction in each province in the ecologically fragile area has different growth trends (Figure 3). From the data in Figure 2, the synergy degree of the 11 provinces of Sichuan, Jiangxi, Hebei, Hubei, Yunnan, Anhui, Hunan, Guizhou, Gansu, Qinghai, and Xizang first increased and then decreased. The coordination degree of the 10 provinces of Shaanxi, Heilongjiang, Shanxi, Jilin, Liaoning, Chongqing, Ningxia, Inner Mongolia, Guangxi, and Xinjiang showed a fluctuating upward trend. Further analysis shows that by 2021, Hulunbuir and Alxa League in Inner Mongolia, Xinzhou in Shanxi, Benxi in Liaoning, Yangling Demonstration Zone in Shaanxi, Mudanjiang and Heihe in Heilongjiang, Anshan in Liaoning, and Qiannan Buyi and Miao Autonomous Prefecture in Guizhou will achieve synergy of one, indicating that the synergistic effect of agricultural pollution control and carbon reduction in these nine cities will be optimal. Hami of Xinjiang (0.41), Xining of Qinghai (0.42), Tangshan (0.43) and Cangzhou of Hebei (0.44), Dali Bai Autonomous Prefecture of Yunnan (0.45), Enshi Tujia and Miao Autonomous Prefecture of Hubei (0.46) and Shiyan (0.47), Yinchuan of Ningxia (0.48), Lu’an of Anhui (0.48), Suining of Sichuan (0.42), Nanchong (0.43) and Deyang (0.46) and Meishan (0.48) did not reach 0.5, and the level of coordination was low and needed to be further improved. The city with a synergy degree of one was 2.44 times higher than that of Hami with the lowest synergy degree, indicating that the coordinated development of carbon pollution among provinces was unbalanced.
According to the measurements of agricultural carbon emission measurement in ecologically fragile areas, the cross-sectional data of 2006, 2015, and 2021 were selected by the natural fracture point method for visualization, and the average agricultural carbon emissions of each province in ecologically fragile areas from 2006 to 2021 were divided into five levels, from large to small, which were high-value areas, second-high-value areas, median areas, sub-median areas, and low-value areas, so as to show their spatial distribution. In 2006, the provinces located in the high-value areas and sub-high-value areas (more than 2 million tons) included Liaoning, Hunan, Heilongjiang, Hebei, Shaanxi, Guizhou, Gansu, Hubei, Guangxi, and Chongqing. In 2015, five new provinces were added to Anhui, Jiangxi, Sichuan, Jilin and Shanxi. In 2021, except for Yunnan, Qinghai, Ningxia, Xinjiang, Inner Mongolia, and Xizang, all of them entered the high-value area and the second-highest-value area. China spans a large latitude and longitude, and there are great differences in the natural climate and environment, cultivated land resource endowment, agricultural production structure and mode, and agricultural economic level in different provinces, which leads to great differences in the level of cultivated land intensification and utilization methods, and then causes the differences in the carbon source structure of planting industry in different regions. Generally speaking, the traditional agricultural provinces are the main sources of carbon emissions in the planting industry, with a high degree of intensive cultivated land resources, and more investment in high-carbon agricultural materials such as fertilizers, agricultural films, and pesticides, resulting in a high total carbon emissions from planting.
Under the measurement results of non-point source pollution in ecologically fragile areas, the cross-sectional data of 2006, 2015, and 2021 were selected by the natural fracture point method for visualization. In 2015, the pollution in Chongqing and Songyuan in Jilin was relatively high, with Changchun in Jilin having the highest non-point source pollution of 391,100 tons, and from 2015 to 2021, there was a significant easing of the pollution, and only Chongqing had a higher the pollution of 337,800 tons in 2021. This may be due to the different climatic conditions, soil characteristics, and crop planting types in different provinces, as well as the production and operation management methods, resource factor utilization structure, and implementation of policies and measures. At the same time, the 2015 Ministry of Agriculture promulgated the “Zero Growth Action Plan for Chemical Fertilizer Use by 2020” policy to promote the reduction and efficiency of chemical fertilizers to a certain extent to reduce the emission of agricultural pollution, and the “13th Five-Year” period to vigorously develop circular agriculture; in the long run, these measures to promote the use of chemical fertilizers, pesticides, and other factors to improve efficiency optimize the agricultural planting structure.
The CCD of agricultural carbon pollution in ecologically fragile areas is spatially high in the east and low in the west, high in the south, and low in the north. According to the results of the synergistic effect of agricultural pollution control and carbon reduction in ecologically fragile areas, the cross-sectional data of 2006, 2015, and 2021 were selected by the natural fracture point method to visualize the agricultural reduction in each province in ecologically fragile areas from 2006 to 2021. The average degree of CCD of agricultural pollution control and carbon reduction is divided into four stages of coordinated development, the first stage is the stage of imbalance (0–0.3), the second is the antagonistic barrier stage (0.3–0.5), the third is the barely coordinated stage (0.5–0.7), and the fourth stage is the stage of high coordination (0.7–1.0). In 2006, among the 21 provinces in ecologically fragile areas, only Jiangxi and Xizang were barely coordinated. By 2021, 21 provinces in ecologically fragile areas have achieved poor coordination, with Heilongjiang (0.97) being the highest and Qinghai being the lowest (0.52), indicating that the level of coordinated agricultural development in ecologically fragile areas has been greatly improved.

3.3. Synergistic Decoupling of Agricultural Carbon Pollution

The decoupling of the synergistic result of agricultural pollution control and carbon reduction and gross agricultural output in ecologically fragile areas is mainly dominated by expansion negative decoupling (12.5%), expansion connection (12.5%), weak decoupling (50%), strong decoupling (18.75%), and strong negative decoupling (6.25%), indicating that the economic growth of ecologically fragile areas is accompanied by an increase in pollution control and carbon reduction capacity. The decoupling between the synergistic effect of carbon pollution in the planting industry and the gross agricultural output value showed a trend of optimization–degradation–re-optimization. From 2006 to 2015, the pollution and carbon reduction capacity of the planting industry in ecologically fragile areas and its economic growth maintained a positive growth trend, but the growth rate of pollution and carbon reduction capacity in the same period was smaller than the growth rate of economic growth. At this stage, the characteristics of carbon emission decoupling are mainly weakly decoupled. From 2016 to 2019, the agricultural pollution and carbon reduction capacity in ecologically fragile areas maintained a downward trend, while the agricultural output value showed an overall increase. From 2020 to 2021, the ability of the planting industry to reduce pollution and carbon emissions in ecologically fragile areas was enhanced, and the agricultural output value continued to grow.
Since 2006, the implementation of a series of projects such as returning farmland to forest has improved and optimized the land use structure, which has not only improved the multiple cropping index of land, but also increased the yield of grain crops per unit area, and vigorously promoted the growth of the economic benefits of the planting industry. In addition, modern agriculture emphasizes green and sustainable development, and the vigorous promotion and implementation of policies such as soil testing, formula fertilization, and pesticide reduction and application have controlled agricultural pollution to a certain extent and gradually optimized the decoupling relationship.
From the provincial data, the number of provinces with weak decoupling of agricultural pollution control and carbon reduction in ecologically fragile areas has increased rapidly, but the types and degrees of decoupling tend to be different (Figure 4). From the data in Figure 3, only Jiangxi showed a negative decoupling of expansion in 2006, indicating that Jiangxi Province’s ability to reduce pollution was enhanced, and the economy was also growing, and the former was faster than the latter. The remaining 20 provinces either have a negative growth rate of synergy in pollution control and carbon reduction, or a negative growth rate of gross agricultural output value, or even both, and the state is less than ideal. In 2015, Yunnan, Jiangxi, Hunan, and Guizhou showed weak decoupling, indicating economic growth and increased capacity to reduce pollution, and that the growth rate of the latter was lower than that of the former. Sichuan, Anhui, Hebei, Qinghai, Xizang, and Xinjiang showed a negative decoupling of expansion, indicating that the ability to reduce pollution was enhanced, the economic growth was greater, and the former was faster than the latter, and the state was ideal. The remaining 11 provinces have not yet reached the ideal state. In 2021, except for Jilin, which is in a state of expansion and connectivity, the remaining 20 provinces are all weakly decoupled, indicating that while not only the economic growth of these 20 provinces is increasing, but also is the ability to reduce pollution, the growth rate of the latter is lower than the that of the former. As of 2021, all 21 provinces in ecologically fragile areas have reached a relatively ideal state.
From Figure 4, it can be clearly observed that the decoupling indexes of Xinjiang in 2017 and Hebei in 2013 show a more extreme trend, and the reason behind this phenomenon is worth exploring in depth.
In 2017, the growth rate of Xinjiang’s synergy of agricultural pollution control and carbon reduction significantly outpaced its economic growth rate, resulting in a large contrast in its decoupling index for the year. The reason for this may be related to the release of the Notice on the Issuance of the Implementation Opinions on Energy Conservation and Emission Reduction Work in the 13th Five-Year Plan of the Xinjiang Uygur Autonomous Region. In order to ensure the realization of the mandatory goals of energy conservation and emission reduction during the 13th Five-Year Plan period, Xinjiang issued the Notice on the Issuance of the Implementation Opinions on Energy Conservation and Emission Reduction Work in the 13th Five-Year Plan in Xinjiang Uygur Autonomous Region in that year, which explicitly called for the implementation of the Regulations on the Management of Agricultural Mulch in Xinjiang to address the issue of agricultural mulch. Regulations on the Management of Agricultural Mulch in the Xinjiang Uygur Autonomous Region were issued that year, explicitly requiring the implementation of the “Regulations on the Management of Agricultural Mulch in the Xinjiang Uygur Autonomous Region” in order to solve the problem of pollution caused by used mulch in agricultural fields, as well as advocating the reduction in chemical fertilizer and pesticide use and the active promotion of green and efficient alternatives to chemical fertilizers and pesticides in order to reduce carbon emissions in agriculture. However, as Xinjiang promotes the transition of agriculture to a green development model, it has gradually reduced its reliance on the traditional high-pollution, high-carbon emission agricultural model and shifted to a more sustainable agricultural production model. This transition strategy has also indirectly led to a slowdown in economic growth in the short term, and measures such as film recycling and the promotion of organic fertilizers have increased the cost of agricultural production, with some degree of short-term negative impact on agricultural output.
The opposite was the case in Hebei in 2013, where a small economic recession occurred alongside an increase in the synergy of agricultural pollution control and carbon reduction. This may be due to the fact that Hebei released the “12th Five-Year Plan for Energy Conservation and Emission Reduction in Hebei Province” in 2012, which requires a reduction in the use of chemical fertilizers and pesticides, which may lead to a decrease in crop yields in the short term, thus affecting farmers’ income and the development of the agricultural economy. Moreover, at the initial stage of the implementation of the policy, it may be necessary to purchase environmentally friendly equipment, learn new technologies, etc. The increase in these costs may have a certain negative impact on the agricultural economy in the short term. In addition, the implementation of the policy requires a certain amount of time for adaptation and adjustment, and it may take time for the market and farmers to adapt to the new production methods and market demand, which may lead to small fluctuations in the agricultural economy in the short term.
The poor decoupling state of the ecologically fragile area in the early stage may be due to the relative fragility of the ecosystem in the region, coupled with the limitations of multiple factors such as climate, topography, and soil quality, which makes the improvement of agricultural output value in the region rely too much on the excessive input of agricultural chemicals, which in turn leads to a large loss of nitrogen and phosphorus and aggravates agricultural pollution. However, with the country’s emphasis on sustainable agricultural development, the continuous application of regional land quality improvement, agricultural clean production technology, and other measures, the pollution caused by planting has been effectively controlled, which has promoted the dual improvement of planting production efficiency and quality, and gradually reduced the loss rate of nutrients such as nitrogen and phosphorus, and the overall decoupling trend has shown an obvious improvement trend.

4. Discussion

The paper is consistent with existing literature findings [21,24], which point out the effectiveness of policy interventions (e.g., carbon trading systems) on carbon emission reduction. This study similarly finds that policies such as the Zero Growth Action Plan for Fertilizer and Pesticide Use by 2020 have a significant positive impact on the synergy of agricultural pollution control and carbon reduction. Similarly, Huang (2024) explored the relationship between fiscal policy, green finance, and China’s low-carbon transition, emphasizing the importance of policy support in achieving synergies [2]. Our study further reinforces this point by demonstrating a significant increase in the coordination of agricultural pollution control and carbon emission reduction in ecologically fragile areas, which can be attributed to the implementation of relevant policy measures. Unlike Liu’s (2022) analysis of the Yangtze River Delta [10], this study reveals the special challenges of balancing agricultural production and environmental protection in ecologically fragile areas.
To achieve sustainable agricultural development, it is imperative to achieve synergies in agricultural pollution control and carbon reduction, which is not only an urgent need to address global climate change and environmental protection, but also a critical path to promote the modernization and transformation of agriculture and enhance the comprehensive competitiveness of agriculture.
First of all, the development of a path for the coordinated decoupling of carbon pollution in ecologically fragile areas should focus on improving quality and efficiency. In the process of agricultural environmental pollution control, we should pay attention to the use of fertilizers and pesticides, and vigorously promote and apply environmental protection alternative technologies such as organic fertilizer, soil testing and formula fertilization, and biological pesticides; accurately match the needs of crops; and reduce unnecessary use so as to reduce pollution emissions in the process of agricultural production. This measure not only achieves the goal of reducing pollution and carbon emissions in agriculture, but also improves the quality of agricultural products and ensures food security.
Secondly, the development of a path for the coordinated decoupling of carbon pollution in ecologically fragile areas should focus on adapting measures to local conditions and time conditions and highlighting key points. There are great differences in cultivated land resources, agricultural planting structure, agricultural output efficiency, and agricultural output level among provinces in the ecologically fragile area, resulting in obvious differences in the decoupling index values of each city from 2006–2021.
Finally, the development of a path for the coordinated decoupling of carbon pollution in ecologically fragile areas should adhere to scientific and technological innovation and structural optimization. Practical experience proves that the advancements in agricultural science and technology are striking supports for the realization of carbon pollution synergy, and the government should strengthen the policy support for agricultural science and technology innovation; use big data and cloud computing technology; integrate the resources of the government, enterprises, scientific research institutions, and other aspects; build a comprehensive ecological environment collaborative governance system; and realize information sharing and collaborative governance [34].

5. Conclusions

Grounded in the city-level data of 21 provinces in ecologically fragile areas from 2006 to 2021, this paper used the coupling coordination model to determine the coupling synergy degree of the two subsystems. The decoupling relationship and synergistic result between agricultural pollutants and gross agricultural output reveal the spatial–temporal pattern of agricultural pollution control and carbon reduction synergy in ecologically fragile areas and estimate the dynamic linkage state of the two.
Agricultural carbon emissions in ecologically fragile areas exhibited a trend of fluctuating increase. Agricultural non-point source pollution exhibited an “inverted U-shaped” growth trend. From the carbon emissions and the overall emission of pollutants, although agricultural pollutants and carbon emissions are homologous, there is heterogeneity in the trend and change in emissions. From the perspective of the synergistic result of agricultural pollution control and carbon reduction, the synergy degree in ecologically fragile areas depicted a fluctuating increasing trend, and the coordination degree of ecologically fragile areas increased from 0.32 to 0.89 from 2006 to 2021, indicating that the coordinated development level between pollution control and carbon reduction was significantly improved, suggesting that the synergies between agricultural pollution control and carbon reduction and efficiency improvement are being realized and exploited. In terms of the decoupling effect, the decoupling state of the synergy of agricultural pollution control and carbon reduction and gross agricultural output in ecologically fragile areas has changed from negative decoupling to strong decoupling and then to weak decoupling, which is mainly predominated by strong decoupling, negative decoupling, and weak decoupling, and the synergistic capacity of pollution control and carbon reduction needs to be further optimized.
The following limitations exist in this paper and suggestions for modification as well as directions for future research are presented:
The current study is based on municipal data from 2006 to 2021, but with the continuous changes in policies and technological advances as well as the continuous updating of data, the future study will consider setting up a dynamic database of agricultural carbon emissions and surface pollution and updating the data on a regular basis so as to conduct a more systematic analysis in order to reflect the latest changes in the dynamics of agricultural carbon emissions and surface pollution. There is a relative lack of research on ecologically fragile zones at the national scale, and the relevant state departments have not released a clear map of the distribution of ecologically fragile zones across the country, so the study area is relatively broad. This study mainly focuses on carbon emissions and pollution in the plantation industry, such as fertilizer use, pesticide application, and irrigation. However, because agriculture, forestry, animal husbandry, and fisheries have different focuses among the provinces in the ecologically fragile zones, they are not fully taken into account. This narrow scope may underestimate the overall environmental impacts of agriculture in ecologically vulnerable areas. In the future, consideration will be given to expanding the scope of pollution accounting to include animal husbandry (e.g., livestock and poultry manure discharge and feed processing), fisheries (e.g., aquaculture tailwater discharge and use of fishery medicines), and forestry (e.g., deforestation and forest land reclamation) in the analytical framework. These industries play an important role in agricultural production in ecologically fragile zones, and their environmental impacts cannot be ignored.

Author Contributions

Conceptualization, G.W. and M.G.; methodology, M.G.; software, M.G.; validation, Y.T. and G.W.; formal analysis, Y.T.; investigation, M.G.; resources, M.G.; data curation, M.G.; writing—original draft preparation, M.G. and B.Z.; writing—review and editing, G.W.; visualization, G.W.; supervision, G.W.; project administration, G.W.; funding acquisition, G.W. All authors have read and agreed to the published version of the manuscript.

Funding

This research was funded by the Ministry of Education of Humanities and Social Science project (24YJA630084; 20YJC790006) and the National Natural Science Foundation of China (72003111).

Data Availability Statement

The data presented in this study are available upon request from the corresponding author. The data are not publicly available due to privacy.

Acknowledgments

We thank the anonymous reviewers for their efforts to improve this paper.

Conflicts of Interest

The authors declare no conflicts of interest.

References

  1. Hou, M.; Cui, X.; Xie, Y.; Lu, W.; Xi, Z. Synergistic emission reduction effect of pollution and carbon in China’s agricultural sector: Regional differences, dominant factors, and their spatial-temporal heterogeneity. Environ. Impact Assess. Rev. 2024, 106, 107543. [Google Scholar] [CrossRef]
  2. Huang, X.; Fahad, S.; Yang, F.; Nie, F. Fiscal policy, green finance, and low carbon transformation nexus: A novel study unleashing the synergistic effects of carbon reduction and pollution in China. Environ. Sci. Pollut. Res. 2023, 31, 4256–4268. [Google Scholar] [CrossRef]
  3. Yan, X.; Sun, Q. How to Evaluate Ecological Civilization Construction and Its Regional Differences: Evidence from China. Sustainability 2023, 15, 12543. [Google Scholar] [CrossRef]
  4. Tang, J.; Li, S. Research on multiple co-governance of agricultural non-point source pollution in China on the perspective of ENGOs and public participation. PLoS ONE 2023, 18, e0280360. [Google Scholar] [CrossRef] [PubMed]
  5. Zhou, Y. Editorial: China’s economic growth in a global context: Challenges and opportunities and future research. J. Chin. Econ. Foreign Trade Stud. 2024, 17, 1–3. [Google Scholar] [CrossRef]
  6. Li, X.; He, Y.; Fu, Y.; Wang, Y. Analysis of the carbon effect of high-standard basic farmland based on the whole life cycle. Sci. Rep. 2024, 14, 3361. [Google Scholar] [CrossRef] [PubMed]
  7. Yang, Y.; Xu, H.; Yang, X.; Zhang, Y.; Liu, T. Exploring synergistic efficiency of air pollution and carbon reduction and its influencing factors: Insights from China. Resour. Conserv. Recycl. 2024, 212, 107973. [Google Scholar] [CrossRef]
  8. Nie, C.; Lee, C.C. Synergy of pollution control and carbon reduction in China: Spatial–temporal characteristics, regional differences, and convergence. Environ. Impact Assess. Rev. 2023, 101, 107110. [Google Scholar] [CrossRef]
  9. Nazia, L. Comprehensive environmental performance index (CEPI): An intuitive indicator to evaluate the environmental quality over time. Environ. Res. Commun. 2022, 4, 075016. [Google Scholar] [CrossRef]
  10. Liu, C.; Sun, W.; Li, P. Characteristics of spatiotemporal variations in coupling coordination between integrated carbon emission and sequestration index: A case study of the Yangtze River Delta. China Ecol. Indic. 2022, 135, 108520. [Google Scholar] [CrossRef]
  11. Ullah, S.; Lin, B.; Zhu, R. Developing a new sustainable policy perspective for Pakistan: An intricate nexus between green innovation, financial structure and ecological footprint. Energy 2025, 316, 134496. [Google Scholar] [CrossRef]
  12. Pan, X.; Guo, S. Dynamic decomposition and regional differences of urban emergy ecological footprint in the Yangtze River Delta. J. Environ. Manag. 2023, 326, 116698. [Google Scholar] [CrossRef]
  13. Ehigiamusoe, K.U.; Chen, D.; Dogan, E.; Binsaeed, R.H. Unravelling the moderating roles of environmental regulations on the impact of foreign direct investment on environmental sustainability. J. Environ. Manag. 2025, 375, 124175. [Google Scholar] [CrossRef] [PubMed]
  14. Wen, H.; Liang, W.; Lee, C.C. China’s progress toward sustainable development in pursuit of carbon neutrality: Regional differences and dynamic evolution. Environ. Impact Assess. Rev. 2023, 98, 106959. [Google Scholar] [CrossRef]
  15. Chen, F.; Zhao, T.; Wang, D. Research on China cities’ total factor productivity of carbon emission: Based on decoupling effect. Int. J. Environ. Res. Public Health 2022, 19, 2007. [Google Scholar] [CrossRef]
  16. Haiyan, S.; Shangmiao, S. Impact of green innovation on carbon reduction in China. Sci. Rep. 2024, 14, 14032. [Google Scholar]
  17. Dong, J.; Qiao, D.; Yuan, B.; Xu, T. Total factor productivity of China’s marine economy: A meta-analysis. Front. Mar. Sci. 2022, 9, 1014112. [Google Scholar] [CrossRef]
  18. He, Y.; Zhang, X.; Xie, Q. Environmental regulation and carbon emission efficiency: Evidence from pollution levy standards adjustment in China. PLoS ONE 2024, 19, e0296642. [Google Scholar] [CrossRef] [PubMed]
  19. Yan, Y.; Chen, Y.; Han, M.; Zhen, H. Research on energy efficiency evaluation of provinces along the belt and road under carbon emission constraints: Based on super-efficient SBM and Malmquist index Model. Sustainability 2022, 14, 8453. [Google Scholar] [CrossRef]
  20. Wang, K.; Fang, C. Revealing the synergy between carbon reduction and pollution control in the process of new-type urbanization: Evidence from China’s five major urban agglomerations. Sustain. Cities Soc. 2025, 120, 106154. [Google Scholar] [CrossRef]
  21. Chen, L.; Wang, D.; Shi, R. Can China’s carbon emissions trading system achieve the synergistic effect of carbon reduction and pollution control? Int. J. Environ. Res. Public Health 2022, 19, 8932. [Google Scholar] [CrossRef]
  22. Zhang, X.; Wei, Y.; Wang, T.; Shen, J.; Zhao, T.; Dong, L. Spatial correlation network on synergy between carbon reduction and pollution control in key areas for air pollution prevent and control. J. Clean. Prod. 2025, 491, 144777. [Google Scholar] [CrossRef]
  23. Lujing, W.; Ming, Z. Exploring the impact of narrowing urban-rural income gap on carbon emission reduction and pollution control. PLoS ONE 2021, 16, e0259390. [Google Scholar]
  24. Xu, L.; Peng, S.; Wang, L. The Synergy of Pollution and Carbon Reduction by Green Fiscal Policy: A Quasi-Natural Experiment Utilizing a Pilot Program from China’s Comprehensive Demonstration Cities of Energy Conservation and Emission Reduction Fiscal Policy. Sustainability 2025, 17, 667. [Google Scholar] [CrossRef]
  25. Wang, G.; Liu, P.; Hu, J.; Zhang, F. Spatiotemporal Patterns and Influencing Factors of Agriculture Methane Emissions in China. Agriculture 2022, 12, 1573. [Google Scholar] [CrossRef]
  26. Climate Change 2013: The Physicle Science Basis Technical Summary; IPCC: Geneva, Switzerland, 2013.
  27. Ma, T. Assessment of the current status of agricultural carbon sources and analysis of the potential for increasing carbon sinks in Shanghai. Sustain. Dev. 2011, 28, 38–41. [Google Scholar]
  28. Wang, B.; Zhang, W. Study on the Measurement of Agroecological Efficiency and Spatial and Temporal Differences in China. China Popul.-Resour. Environ. 2016, 26, 11–19. [Google Scholar]
  29. Duan, H.P.; Zhang, Y.; Zhao, J.B.; Bian, X. Carbon footprint analysis of farmland ecosystems in China. J. Soil Water Conserv. 2011, 25, 203–208. [Google Scholar]
  30. Li, B.; Zhang, J. Study on decoupling agricultural carbon emissions and economic development in China based on input perspective. Econ. Econ. 2012, 27–31. [Google Scholar]
  31. Wang, R.; Chen, J.; Li, M. Coupling and Coordinating Relationship between Agricultural Eco-Efficiency and Food Security System in China. Int. J. Environ. Res. Public Health 2023, 20, 431. [Google Scholar] [CrossRef] [PubMed]
  32. Yuan, R.; Xu, C.; Kong, F. Decoupling agriculture pollution and carbon reduction from economic growth in the Yangtze River Delta, China. PLoS ONE 2023, 18, e0280268. [Google Scholar] [CrossRef]
  33. Li, J.; Jiang, Q. Rural Inclusive Finance and Agricultural Carbon Reduction: Evidence from China. J. Knowl. Econ. 2024, 1–24. [Google Scholar] [CrossRef]
  34. Zhao, Y.; Wang, J.; Ma, X.; Yao, K. Distribution dynamics, spatial differences, and convergence of synergistic pollution and carbon reduction in China. Environ. Sci. Pollut. Res. Int. 2024, 31, 66911–66937. [Google Scholar] [CrossRef]
Figure 1. Ecologically fragile areas. Note: Drawing based on the standard map (Review No. GS(2023)2767) from the Standard Map Service website of the Map Technical Review Center of the Ministry of Natural Resources, with no modifications to the map boundaries.
Agriculture 15 00592 g001
Figure 2. Structure of agricultural surface pollution and carbon emissions in ecologically vulnerable areas.
Agriculture 15 00592 g002
Figure 3. Ecologically vulnerable area carbon pollution synergy time trends by province.
Agriculture 15 00592 g003
Figure 4. Decoupling effects of carbon and pollution synergies and economic growth in provinces of ecologically fragile zones.
Agriculture 15 00592 g004
Table 1. Carbon emission coefficients in agricultural production.
Carbon SourceCarbon Emission CoefficientReference Sources
Diesel fuel0.59 kg/kgIPCC 2013 [26]
Chemical fertilizer0.89 kg/kgOak Ridge National Laboratory, Oak Ridge, TN, USA [27]
Pesticide4.93 kg/kgOak Ridge National Laboratory, Oak Ridge, TN, USA [27]
Plastic sheeting5.18 kg/kgInstitute of Agricultural Resources and Ecological Environment, Nanjing Agricultural University [28]
Irrigation266.48 kg/hm2[29]
Plowing312.60 kg/km2[30]
Table 2. Accounting unit for agricultural non-point source pollution.
Pollution SourcesContaminated UnitsMeasurement Method
Fertilizer application in farmlandNitrogen fertilizer, phosphate fertilizer, and compound fertilizerTotal nitrogen emissions = (net amount of nitrogen fertilizer + net amount of compound fertilizer × 15%) × nitrogen loss coefficient
Total phosphorus emissions = (net amount of phosphate fertilizer + net amount of compound fertilizer × 15%) × 43.66% × phosphorus loss coefficient
PesticidepesticidePesticide application rate× average loss coefficient (runoff + leaching)
Solid waste from farmlandRice, wheat, vegetables, beans, oilseeds, potatoes, corn, etc.Crop/vegetable yield× proportion of waste part to grain part × pollution content of waste part × loss rate of waste part
Table 3. Classification of synergistic decoupling relationships for agricultural pollution control and carbon reduction.
Type of DecouplingDecoupling RelationshipSynergy of Pollution Control and Carbon ReductionChange in Gross Agricultural OutputDecoupling Elasticity IndexSignificance
DecouplingWeak decoupling>0>00 ≤ e < 0.8Economic growth, pollution, and carbon reduction capacity have been enhanced, and the growth rate of the latter is lower than the growth rate of the former.
Strong decoupling<0>0e < 0The ability to reduce pollution and carbon emissions has declined, and economic growth has increased.
Recession decoupling<0<0e > 1.2The ability to reduce pollution and carbon emissions is weakened, and the economy is in recession, and the former is faster than the latter.
Negative decouplingExpansion negative decoupling>0>0e > 1.2The ability to reduce pollution and carbon emissions has been enhanced, and the economic growth rate of the former is greater than that of the latter.
Strong negative decoupling>0<0e < 0The ability to reduce pollution and carbon emissions has been enhanced, and the economy has declined.
Weak negative decoupling<0<00 ≤ e < 0.8The ability to reduce pollution and carbon emissions is weakened, and the economy is declining, and the former is slower than the latter.
connectExpand the connection>0>00.8 ≤ e ≤ 1.2Economic growth, increased capacity to reduce pollution and carbon emissions, and the two are at the same rate.
Decay connection<0<00.8 ≤ e ≤ 1.2The economy is decreasing, and the ability to reduce pollution and carbon emissions is decreasing, and the speed of the two is comparable.
Disclaimer/Publisher’s Note: The statements, opinions and data contained in all publications are solely those of the individual author(s) and contributor(s) and not of MDPI and/or the editor(s). MDPI and/or the editor(s) disclaim responsibility for any injury to people or property resulting from any ideas, methods, instructions or products referred to in the content.

