Article

Leaf to Root Morphological and Anatomical Indicators of Drought Resistance in Coffea canephora After Two Stress Cycles

by
Guilherme A. R. de Souza
1,
Danilo F. Baroni
1,
Wallace de P. Bernado
1,
Anne R. Santos
1,
Larissa C. de S. Barcellos
1,
Letícia F. T. Barcelos
1,
Laísa Z. Correia
1,
Claudio M. de Almeida
1,
Abraão C. Verdin Filho
2,
Weverton P. Rodrigues
3,
José C. Ramalho
4,5,*,
Miroslava Rakočević
1,* and
Eliemar Campostrini
1
1
Setor de Fisiologia Vegetal, Laboratório de Melhoramento Genético Vegetal, Centro de Ciências e Tecnologias Agropecuárias, Universidade Estadual do Norte Fluminense, Avenida Alberto Lamego 2000, Parque Califórnia, Campos dos Goytacazes 28013-602, RJ, Brazil
2
Instituto Capixaba de Pesquisa, Assistência Técnica e Extensão Rural, Vitória 9052-010, ES, Brazil
3
Centro de Ciências Agrárias, Universidade Estadual da Região Tocantina do Maranhão, Avenida Agrária 100, Imperatriz 65900-001, MA, Brazil
4
Laboratório Interações Planta–Ambiente & Biodiversidade (PlantStress&Biodiversity), Centro de Estudos Florestais (CEF), Laboratório Associado TERRA, Instituto Superior de Agronomia (ISA), Universidade de Lisboa (ULisboa), Av. República, 2784-505 Oeiras, Portugal
5
Unidade de Geobiociências, Geoengenharias e Geotecnologias (GeoBioTec), Faculdade de Ciências Tecnologia, Universidade NOVA de Lisboa, 2829-516 Caparica, Portugal
*
Authors to whom correspondence should be addressed.
Agriculture 2025, 15(6), 574; https://doi.org/10.3390/agriculture15060574
Submission received: 30 January 2025 / Revised: 25 February 2025 / Accepted: 28 February 2025 / Published: 7 March 2025
(This article belongs to the Section Crop Production)

Abstract

:
Coffea canephora genotypes adopt distinct strategies to cope with drought and rehydration. We hypothesized that the greater drought tolerance of genotype ‘3V’ compared to ‘A1’, previously reflected in physiological and anatomical leaf traits after two water-stress (WS) cycles, could also be observed in P–V curve responses, root and branch anatomy, leaf midrib elongation (CVL), and root distribution. The ‘3V’ and ‘A1’ plants were grown under well-watered (WW) conditions and two cycles of water stress (WS). The ‘3V’ was more sensitive to WS, with reduced branch xylem vessel density (BXVD), while ‘A1’ demonstrated increased BXVD. Root xylem vessel area (RXVA) decreased to a greater extent in ‘3V’ than in ‘A1’, and both genotypes showed increased bulk elastic modulus. Regardless of water conditions, ‘A1’ maintained a higher relative leaf water content at the turgor loss point (RWCTLP). Morphological acclimation did not occur in the second WS cycle. The ‘3V’ plants developed greater root mass in deeper soil layers than ‘A1’ under the WS condition. These findings suggest that ‘A1’ follows a conservative drought-avoidance strategy with lower physio-morphological plasticity, while ‘3V’ exhibits greater drought tolerance. Such responses highlighted coordinated physiological, morphological, and anatomical adaptations of the above- and below-ground organs for resource acquisition and conservation under WS.

1. Introduction

Drought is one of the most complex climatic hazards, affecting the world in meteorological, agricultural, hydrological, and socioeconomic dimensions [1]. Ecological drought is defined as episodic deficit in water availability that drives ecosystems beyond thresholds of vulnerability, impacts ecosystem services, and triggers feedbacks in natural and/or human systems [2]. In the climate change context, the frequency and severity of ecological drought events are intensifying, leading to an increased dependence on supplementary irrigation to meet crop demands [3]. This is particularly relevant for the species of interest in this study, Coffea canephora Pierre ex A. Froehner (commonly known as Robusta coffee), which faces numerous challenges spanning socio-economic and agricultural aspects.
The state of Espírito Santo, in Southeast Brazil, contributes to approximately 15% of the world’s C. canephora production [4]. This region is characterized by a dry winter period [5], with water resources that are not consistently available. Constructing sustainable irrigation systems in such areas can be complex and expensive, similar to challenges faced in many other semiarid regions worldwide [6]. Under these conditions, during long-term drought ‘spells’, drought tolerant coffee cultivars can maintain a better water status compared to sensitive ones. This resilience is attributed to a combination of traits, including deep rooting systems and effective stomatal regulation of transpiration [7].
At both leaf and plant scales, coffee species exhibit diverse stress response mechanisms, namely to drought, operating simultaneously at molecular, biochemical, physiological, morphological [8] and architectural levels [9]. Significant impacts can be observed even during the earliest stages of drought in coffee plants, namely with impairments at growth and photosynthesis levels, attributed to reduced cell turgor and stomatal closure, respectively [10]. Gene expression profiles and the content of diverse molecules are greatly and differentially modified among coffee species, namely those associated with protective mechanisms against drought and other stress conditions, and these are even more complex when plants are exposed to multiple stressors [11]. It has been reported that the homeobox gene CaHB12 [12] enhances survival rates and regulates drought tolerance by modulating stomatal conductance and antioxidant activity. The genes CcNCED3, CcPYL7, and CcPP2C-1 are involved in ABA biosynthesis, perception, and signal transduction [13]. Additionally, the accumulation of metabolites such as carbohydrates (maltose, glucose, galactose, and lactose) and amino acids (tryptophan, L-cysteine, methionine, lysine, leucine, etc.) may contribute to increased tolerance to water-stress conditions in coffee plants [14].
Drought resistance may involve a large number of mechanisms that, although not strictly organized, are generally (and somewhat artificially) classified as promoting plant avoidance, escape, and tolerance. Responses are species/genotype dependent, but their extent is also associated with the intensification/duration of stress and the developmental stage of the plant [15,16]. Among these mechanisms, (i) drought escape is frequently associated with plants showing early maturity and completing their life cycle rapidly, reproducing before drought conditions become severe [17]; (ii) drought avoidance is often associated with greater minimization of water loss through strategies such as rapid stomatal closure, leaf rolling, and increasing wax accumulation on the leaf surface [18], but can also include maintaining water uptake due to deep root systems [16]; (iii) drought tolerance is usually associated with plants that withstand dry conditions through osmotic adjustment (accumulation of solutes), cell elasticity, stomata regulation, number and activity of aquaporins, calcium and phytohormone signaling, antioxidant defenses, photosynthetic adjustments and root system shape—steep, cheap and deep [18,19]; (iv) mechanisms associated with drought recovery, referring to the plant’s capacity to recover after a disturbance [20]. It is common for plants to exhibit a mixture of these mechanisms and responses, highlighting the complexity of drought resistance strategies [21,22].
In response to environmental challenges, two key approaches to plant morphology and function can be identified, (i) the coordination of above- and below-ground traits along a single axis of resource acquisition and conservation, where environmental conditions influencing leaf traits are expected to similarly impact root traits, and (ii) the orthogonal relationships between root and leaf trait responses to stress within species, where root traits play a crucial role in nutrient and water capture, independent of leaf function [23].
Various experiments on coffee genotype responses to drought evaluated indicators based on a single mild to severe stress event [8,24]. Most of the studies focused on above-ground plant parts due to their easier accessibility compared to below-ground measurements, which are more challenging to evaluate [25]. Only a few avoidance and/or tolerance responses are identified and a complementary analysis of above- and below-ground physiological and morphological traits reveal that drought-tolerant C. canephora clones exhibit greater rooting depth, hydraulic conductance and stomatal control of water use, but lack osmotic and elastic adjustments [5,25]. Clones that can survive drought episodes through a more conservative use of water may be of greater value than clones selected for intensive coffee production, particularly under low-input conditions [26], which are typical of many drought-prone regions across the world. Young C. canephora clonal plants present reduced height, stem diameter and leaf number that is linearly associated with water-stress severity [27]. However, clones with enhanced drought tolerance show leaf anatomical adaptations expressed in higher stomatal density, thicker leaf wax layers and thicker palisade cell tissue [28]. Additionally, root surface area, root density, and root volume are examples of global root metrics that can be evaluated in response to drought [29]. In the case of root anatomy, a variation in root cortical aerenchyma has been suggested as a potentially important trait under limited resource availability, because it may lower the carbon cost for active root maintenance, in a concept of ‘cheaper’ roots, together with morphological root strength and depth [19].
The capacity of coffee plants to express acclimation when previously exposed to a stress agent has been observed, namely by enhancing their defense responses enabling them to be better prepared to face subsequent exposure to different [30,31] or similar stressors [32,33,34,35]. The repair of drought-induced damage and the resumption of growth involve a complex rearrangement of many metabolic pathways, a phenomenon often described as ‘plant memory’ [36]. The metabolic and transcriptional changes in response to environmental stimuli are typically transient or exhibit short-term effects as part of the acclimation process [37]. Unveiling the epigenetic and transcriptional memory of plants is promising for the development of crops better adapted to challenging environments [38]. On the other hand, repetitive drought stress effects can be cumulative, with negative trends along time, as found for the resilience index in some tree species [39].
Greater drought tolerance of the ‘3V’ C. canephora genotype when compared to the ‘A1’ genotype is manifested in certain leaf physiological and anatomical indexes [33]. Based on the concept that leaves and roots coordinate along single axes of resource acquisition and conservation, we hypothesized that, after two cycles of water stress: (i) the drought-tolerant ‘3V’ genotype would exhibit greater resistance than the drought-sensitive genotype ‘A1’ in parameters of the P–V curve and anatomical traits of roots and branches; (ii) ‘3V’ would show lower variations in height, stem diameter and leaf number under drought conditions over time than ‘A1’; and (iii) ‘3V’ would allocate a higher proportion of biomass to roots, with a more pronounced root distribution across soil depth than ‘A1’. To test these hypotheses, we monitored the morphological dynamics of both genotypes during two consecutive drought cycles. At the end of the second cycle, we evaluated P–V curve parameters, anatomy and biomass allocation in the ‘3V’ and ‘A1’clones.

2. Results

2.1. Pressure–Volume Curve Parameters After Two Sequential Water-Stress Cycles

Among the parameters obtained from the pressure–volume (P–V) curve (Figure 1), the water availability significantly affected the relative capacitance at zero turgor—C*FT (Figure 1a), bulk hydraulic capacitance (at full turgor, a proxy for bulk-leaf capacitance)—CFT (Figure 1c), and bulk modulus of elasticity (Ɛ, a measure of leaf tissue flexibility and compression resistance, which helps in maintaining the leaf’s water balance and is linked to photosynthetic capacity; Figure 1e). Under water-stress (WS) conditions, both ‘A1’ and ‘3V’ plants showed reductions of ~32% and 22% in C*FT and CFT, respectively, when compared to WW conditions. A significant effect of both genotype and water availability was also observed for relative leaf water content at the turgor loss point (RWCTLP, indicator of plant’s ability to maintain water in its cells during dehydration; Figure 1f). RWCTLP increased by ca. 4% under WS compared to WW conditions for both genotypes, although genotype ‘A1’ had an overall average approximately 2% higher than that of ‘3V’. Ɛ increased by ca. 42% under WS in both genotypes, when compared to WW conditions (Figure 1e). In contrast, parameters such as leaf capacitance at the turgor loss point (CTLP; Figure 1b), saturated water content (SWC; Figure 1d), osmotic potential (Ψo; Figure 1g), and leaf potential of the turgor loss point (ΨTLP, a proxy for leaf wilting point and stomatal closure; Figure 1h), did not change under WS in either genotype.

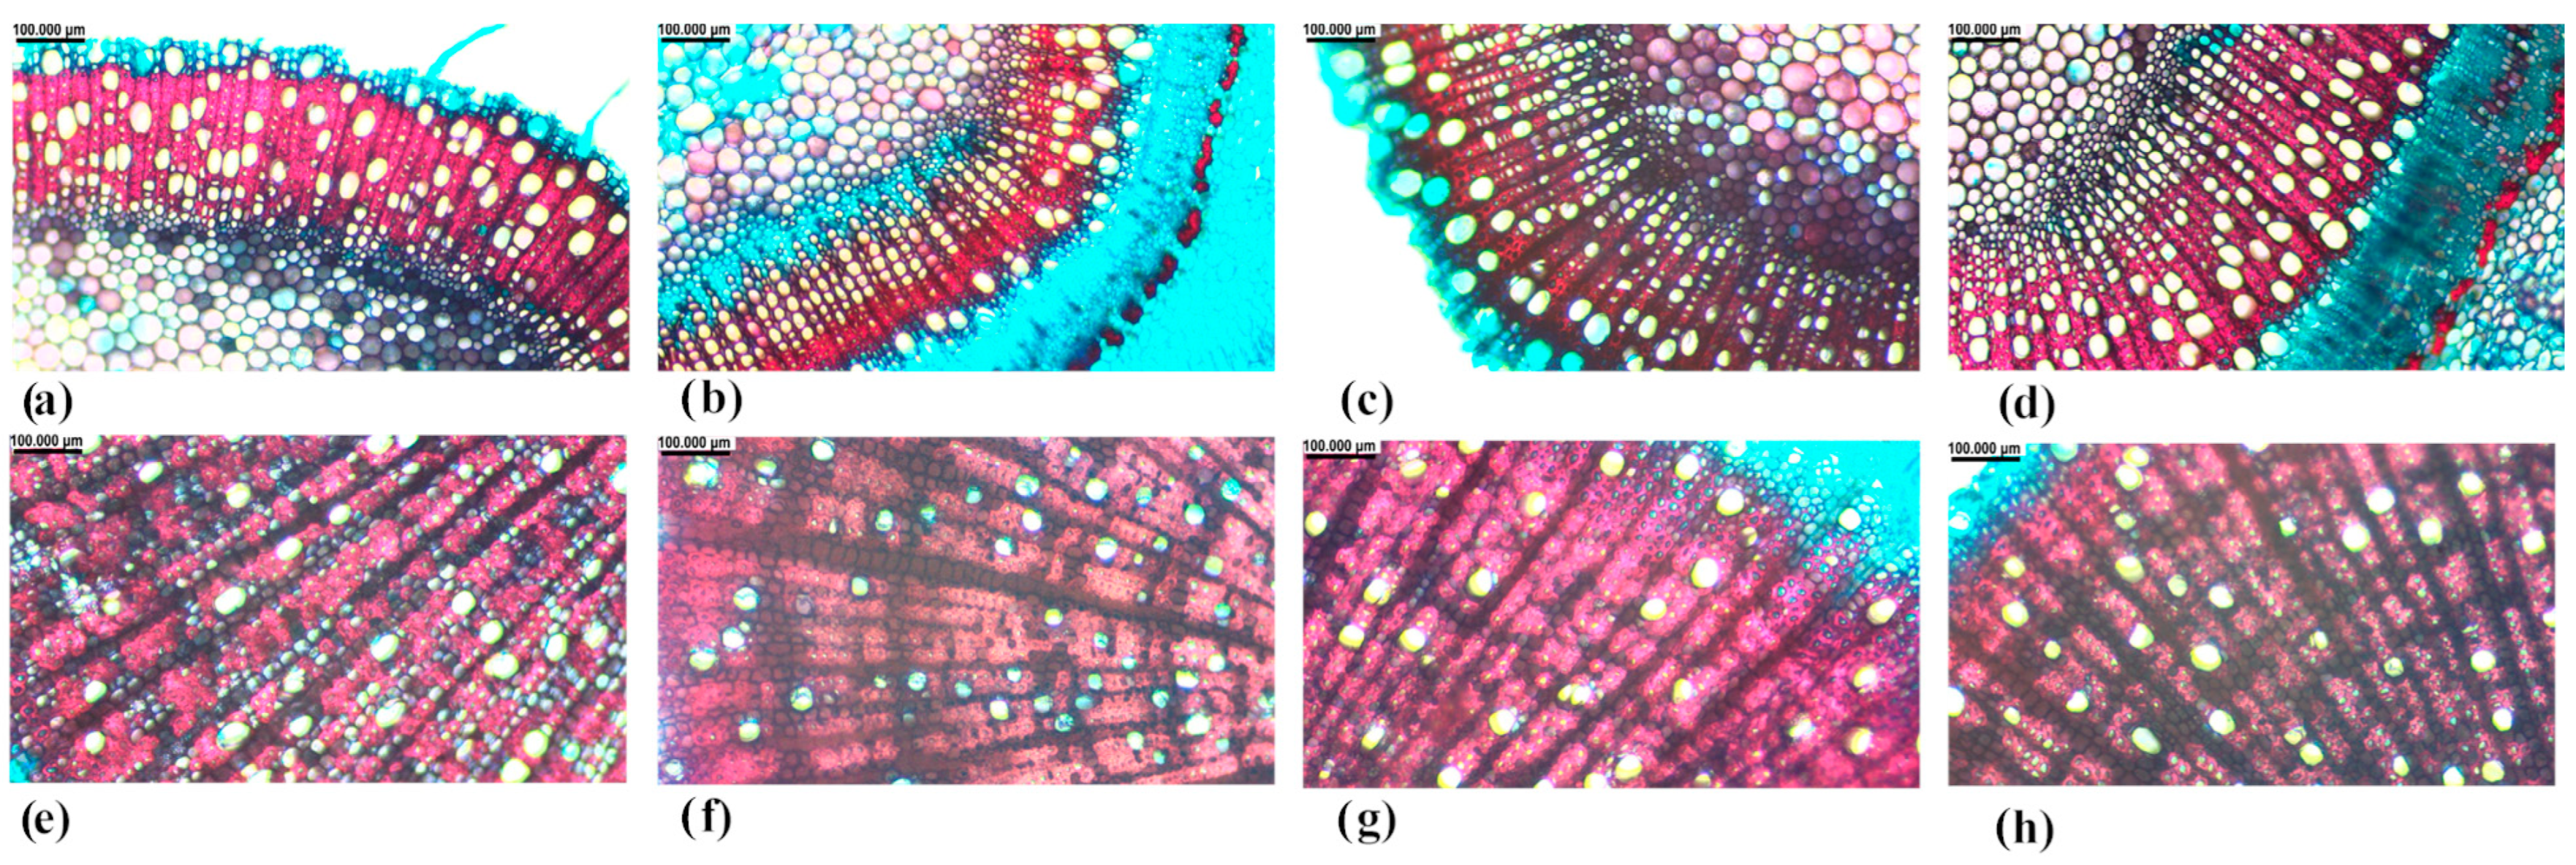
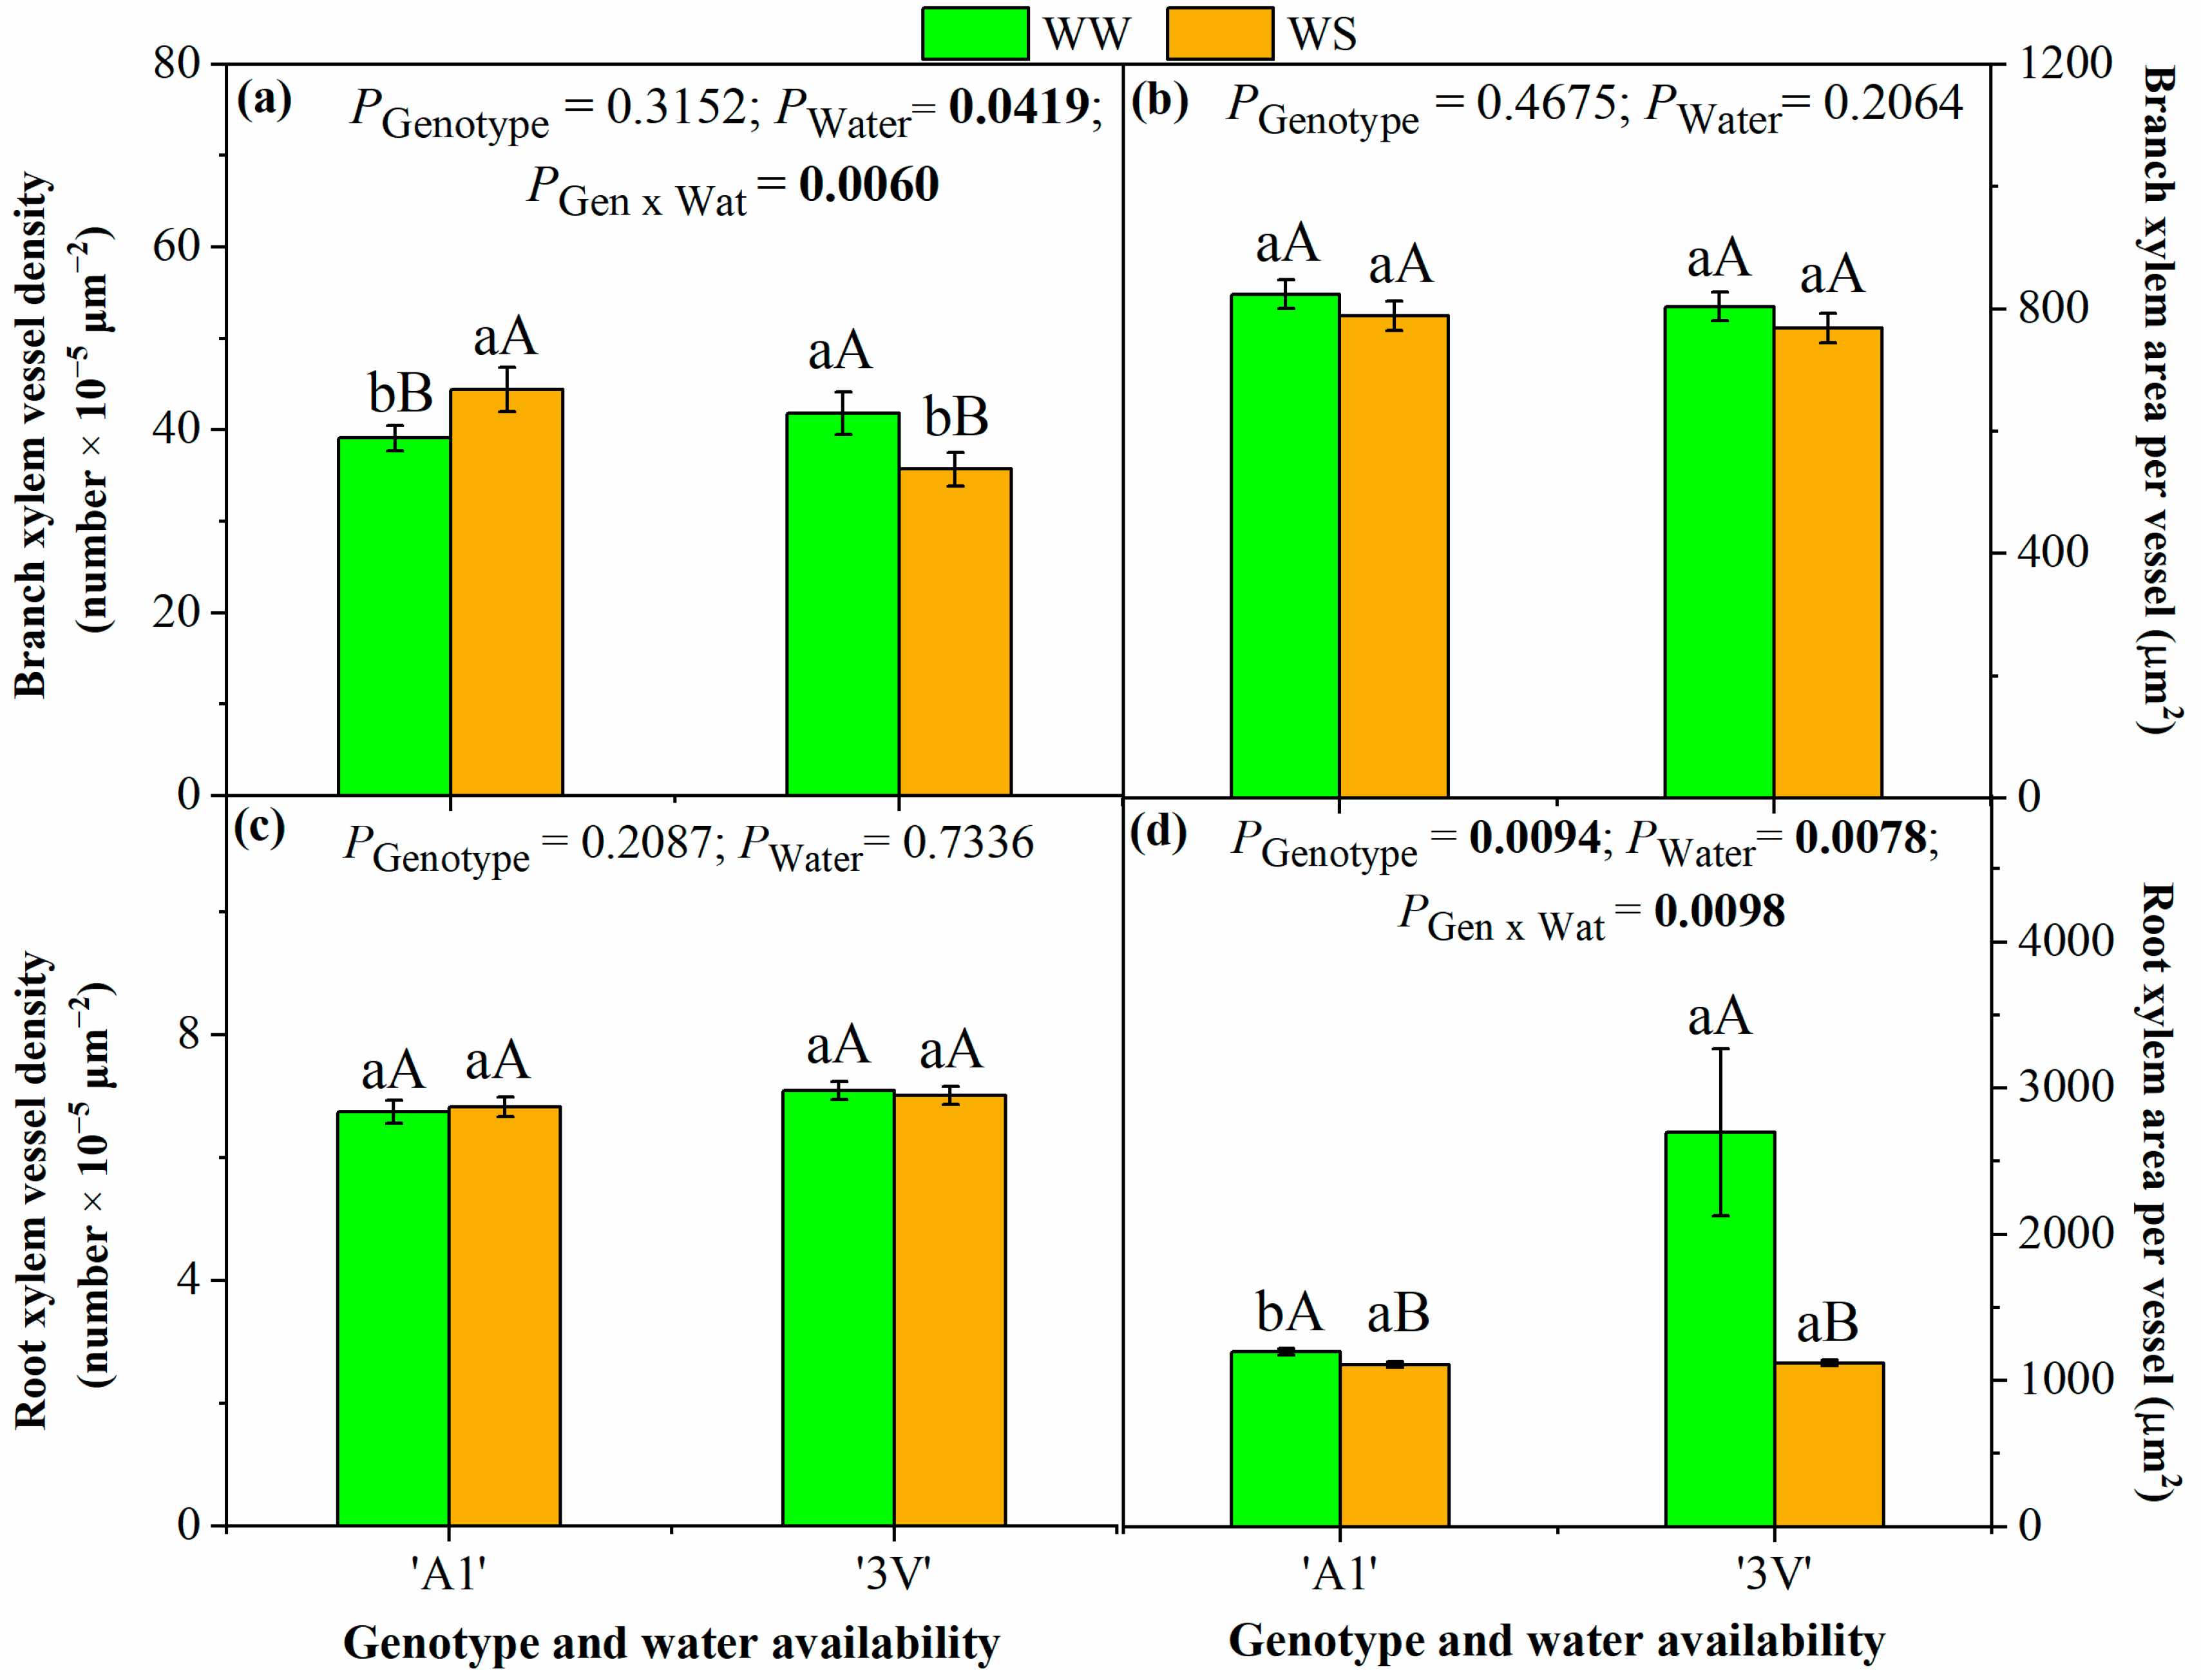
2.2. Root and Branch Xylem Anatomy Traits After Two Water-Stress Cycles

Among the studied plagiotropic branch and root xylem anatomy traits (Figure 2 and Figure 3), after two sequential water-stress cycles, only the branch xylem vessel density, BXVD (Figure 2 and Figure 3a), and the root xylem vessel area, RXVA (Figure 2 and Figure 3d), were modified among the genotypes due to reduced water availability. Under the WS conditions, the ‘A1’ plants showed an increase of 14% in their branch xylem vessel density (BXVD), while a reduction of 15% was observed in ‘3V’ plants, when compared to WW conditions (Figure 3a). This points to a certain morpho-anatomical acclimation strategy in the ‘A1’ genotype to drought conditions and on the other hand, a greater sensitivity of ‘3V’, although the branch xylem area remained similar regardless of water availability or genotype (Figure 3b).
The RXVD was not modified by genotype or by water effects (Figure 3c). However, the mean RXVA of ‘3V’ was 2.5-fold greater than that of the ‘A1’genotype under WW (Figure 3d), suggesting that under the same RXVD (Figure 3c), ‘3V’ plants had greater water flux in roots under non-limited water conditions. The situation was different under WS conditions, where ‘A1’ and ‘3V’ plants showed reduced RXVA by 7% and 60%, respectively, when compared to their respective WW conditions (Figure 3d), resulting in similar anatomical structures (Figure 2f and Figure 2h, respectively).

2.3. Growth Dynamics Along the Water-Stress Cycles

The evolution of central vein length (CVL) elongation was observed in the two water-stress cycles (Figure 4). The interactions between the time and treatments were observed during both drought stress events. In the first cycle (WS–1, Figure 4a), CVL was greatly affected under WS conditions, since its values increased only under WW conditions in both genotypes, with daily growth rates of approximately 0.36 (‘A1’) and 0.45 (‘3V’) cm day−1. At the end of WS–1, the CVL differed both between genotypes in each water availability condition (always greater for ‘3V’) and between water availability conditions within each genotype (always greater for WW), with values of 11.0 (‘3V’–WW), 8.6 (‘A1’–WW), 4.3 (‘3V’–WS) and 2.1 (A1’–WS) cm.
Notably, during the second water-stress cycle (WS–2, Figure 4b), an increase in CVL was observed in the WW plants of both genotypes, as well as in ‘3V’–WW plants, although with growth rates of ca. 0.14 cm, somewhat below those of WW plants (ca. 0.35–0.36 cm day−1 in both genotypes). At the end of WS–2, no differences in CVL were found between genotypes ‘A1’ and ‘3V’ for each water treatment, but larger vein lengths were found in WW plants, with values of 8.7 (‘3V’–WW), 7.9 (A1’–WW), 4.5 (‘A1’–WS) and 3.7 (‘3V’–WS) cm.
The plant height (PH) evolution, reflecting the growth of the orthotropic axis, showed greater values in ‘A1’ plants than in ‘3V’ ones, irrespective of water condition (Figure 5a). For each genotype, the difference between the two water conditions gradually rose. The increase in PH from the second to the fifth week of WS-1 was 14% and 3% for ‘A1’ for WW and WS, respectively; and 12% and 1% for ‘3V’, for WW and WS, respectively. During WS–2 (from the 8th to 11th week), the increase in PH was 8% and 3% for ‘A1’, in WW and WS, respectively; and 9% and 4% for ‘3V’, in WW and WS, respectively. The increases in PH maintained a similar pattern and variation intensity during both drought cycles in WW plants in both genotypes. With regard to the WS conditions, the increase in PH in the plants of both genotypes virtually stopped during the stress imposition of both WS-1 and WS-2 cycles, but the plants resumed their growth in the period between stress cycles.
Stem diameter (SD) was greater in ‘A1’ than in the ‘3V’ genotype under non-limited water conditions, starting from the third week (Figure 5b, interaction genotype × water and water × time), and followed a similar pattern of variation as PH. Under the WS conditions, SD genotype difference was observed in WS–1, but not in WS–2 (interaction genotype × water and water × time), with the genotypes showing similar values within each water condition by the end of the experiment. The SD increase from the second to fifth week of WS-1 was 11% and 4% for ‘A1’, and 8% and 2% for ‘3V’, under WW and WS conditions, respectively. From the 8th to 11th week of WS–2, the SD increase was 10% and 3% in ‘A1’ under WW and WS, respectively, and 12% and 6% in ‘3V’, always under WW and WS, respectively. The recovery was more successful at the end of the WS-2 than at the end of the WS-1 event in WS plants of both genotypes.
The ‘A1’ plants consistently showed greater leaf number per plant (LN) than the ‘3V’ ones throughout the experimental period, under both WW and WS conditions (Figure 5c). However, under WS, the LN was reduced compared to WW conditions in both genotypes. During the WS–1 cycle, the LN increased by 26% in ‘A1’ from the second to fifth week under WW, but decreased by 2% under WS, whereas there was an increase of 26% and 6% for ‘3V’ under WW and WS, respectively. Throughout WS–2 (from the 8th to 11th week), LN increased by 8% in both genotypes, while this was reduced by 8% and 3% under the WS conditions in ‘A1’ and ‘3V’, respectively. Such a high decline in LN under WS conditions during WS–2, especially for the genotype ‘3V’, suggested that no LN recovery and acclimation had occurred.

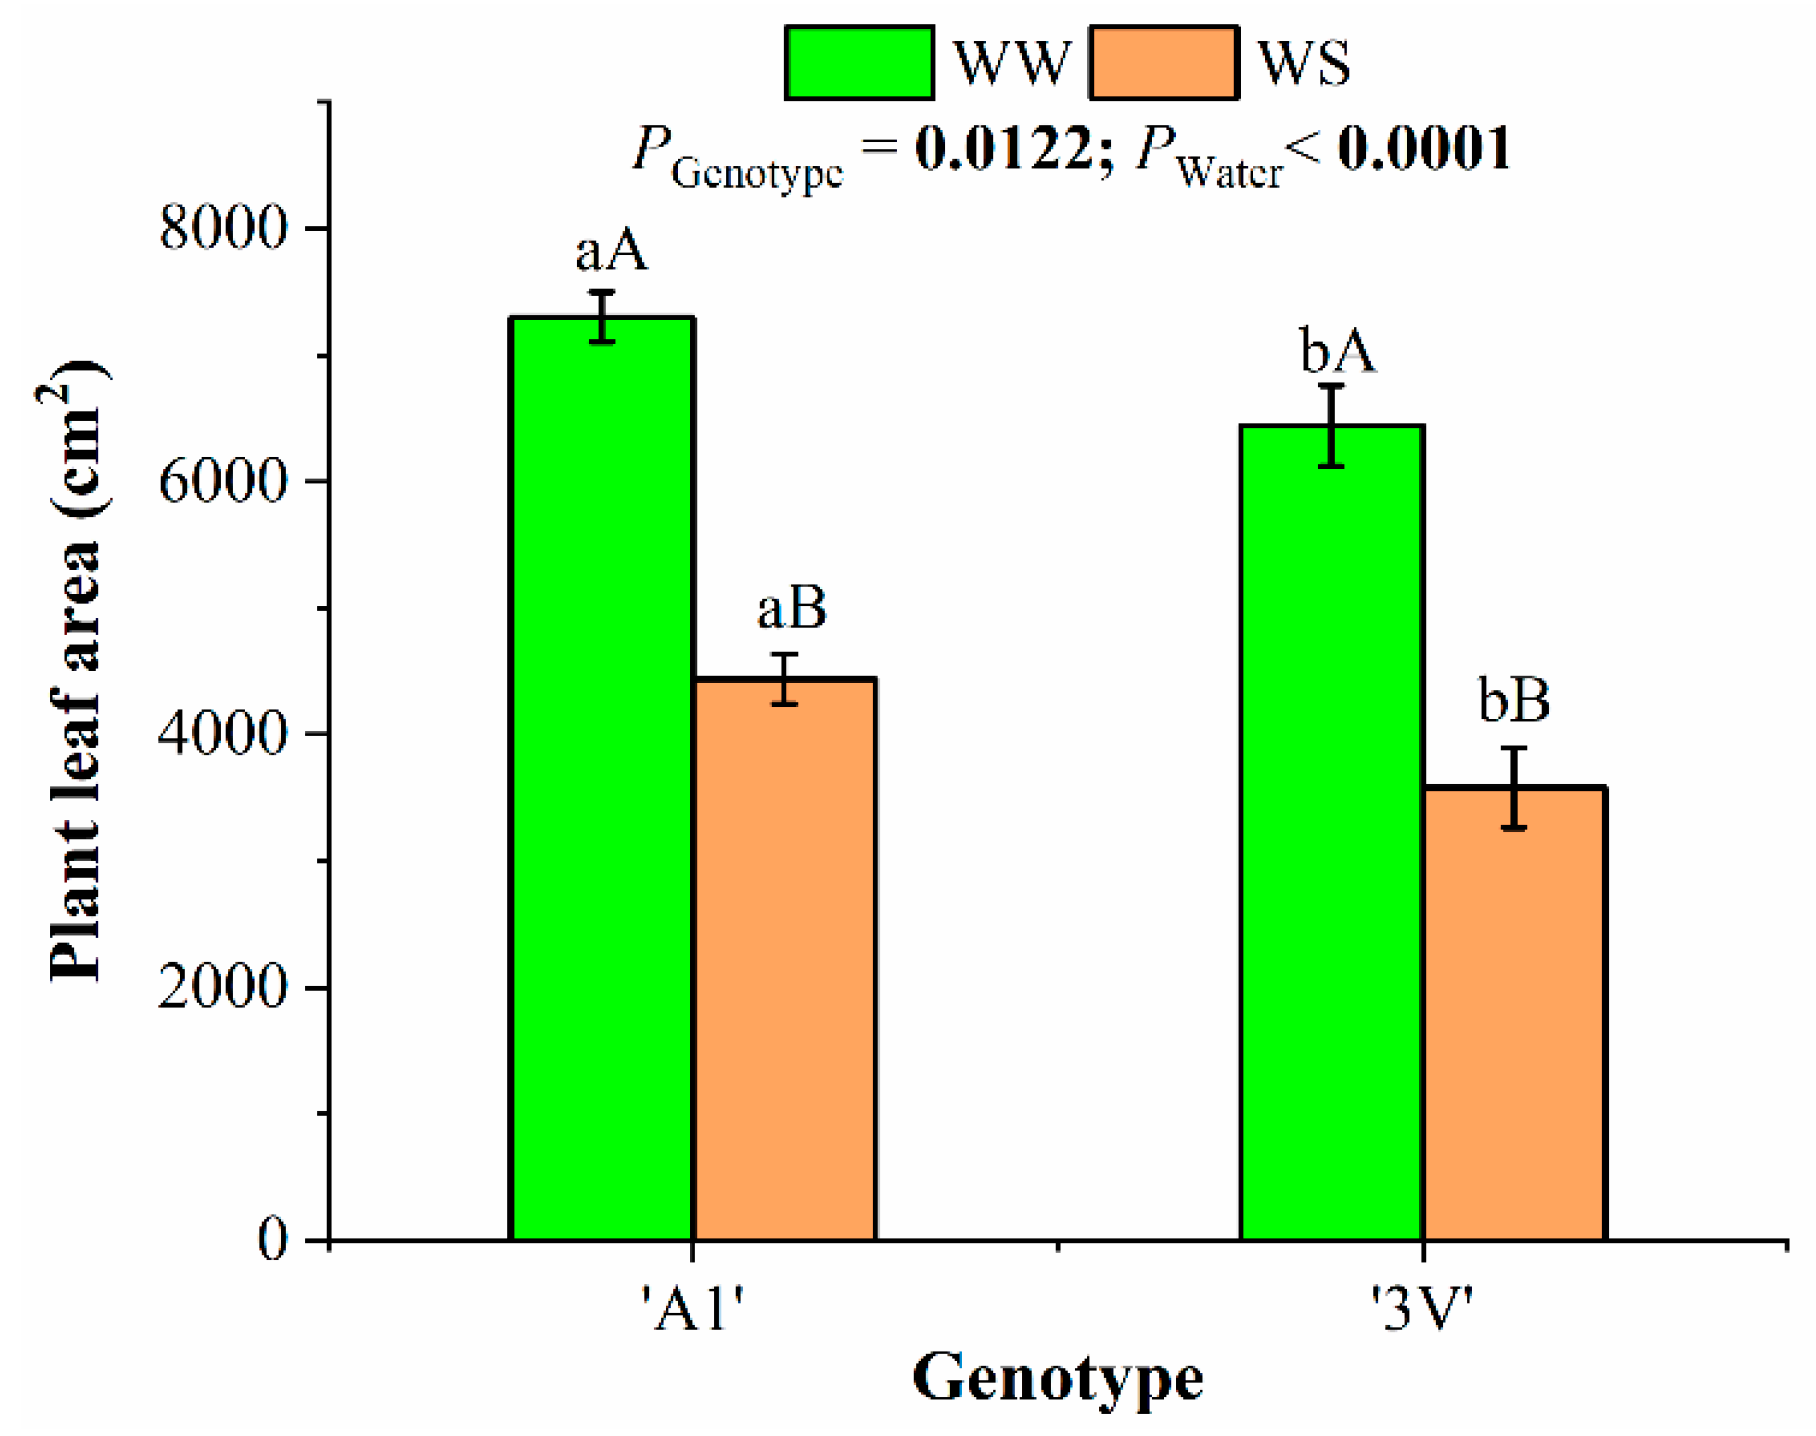
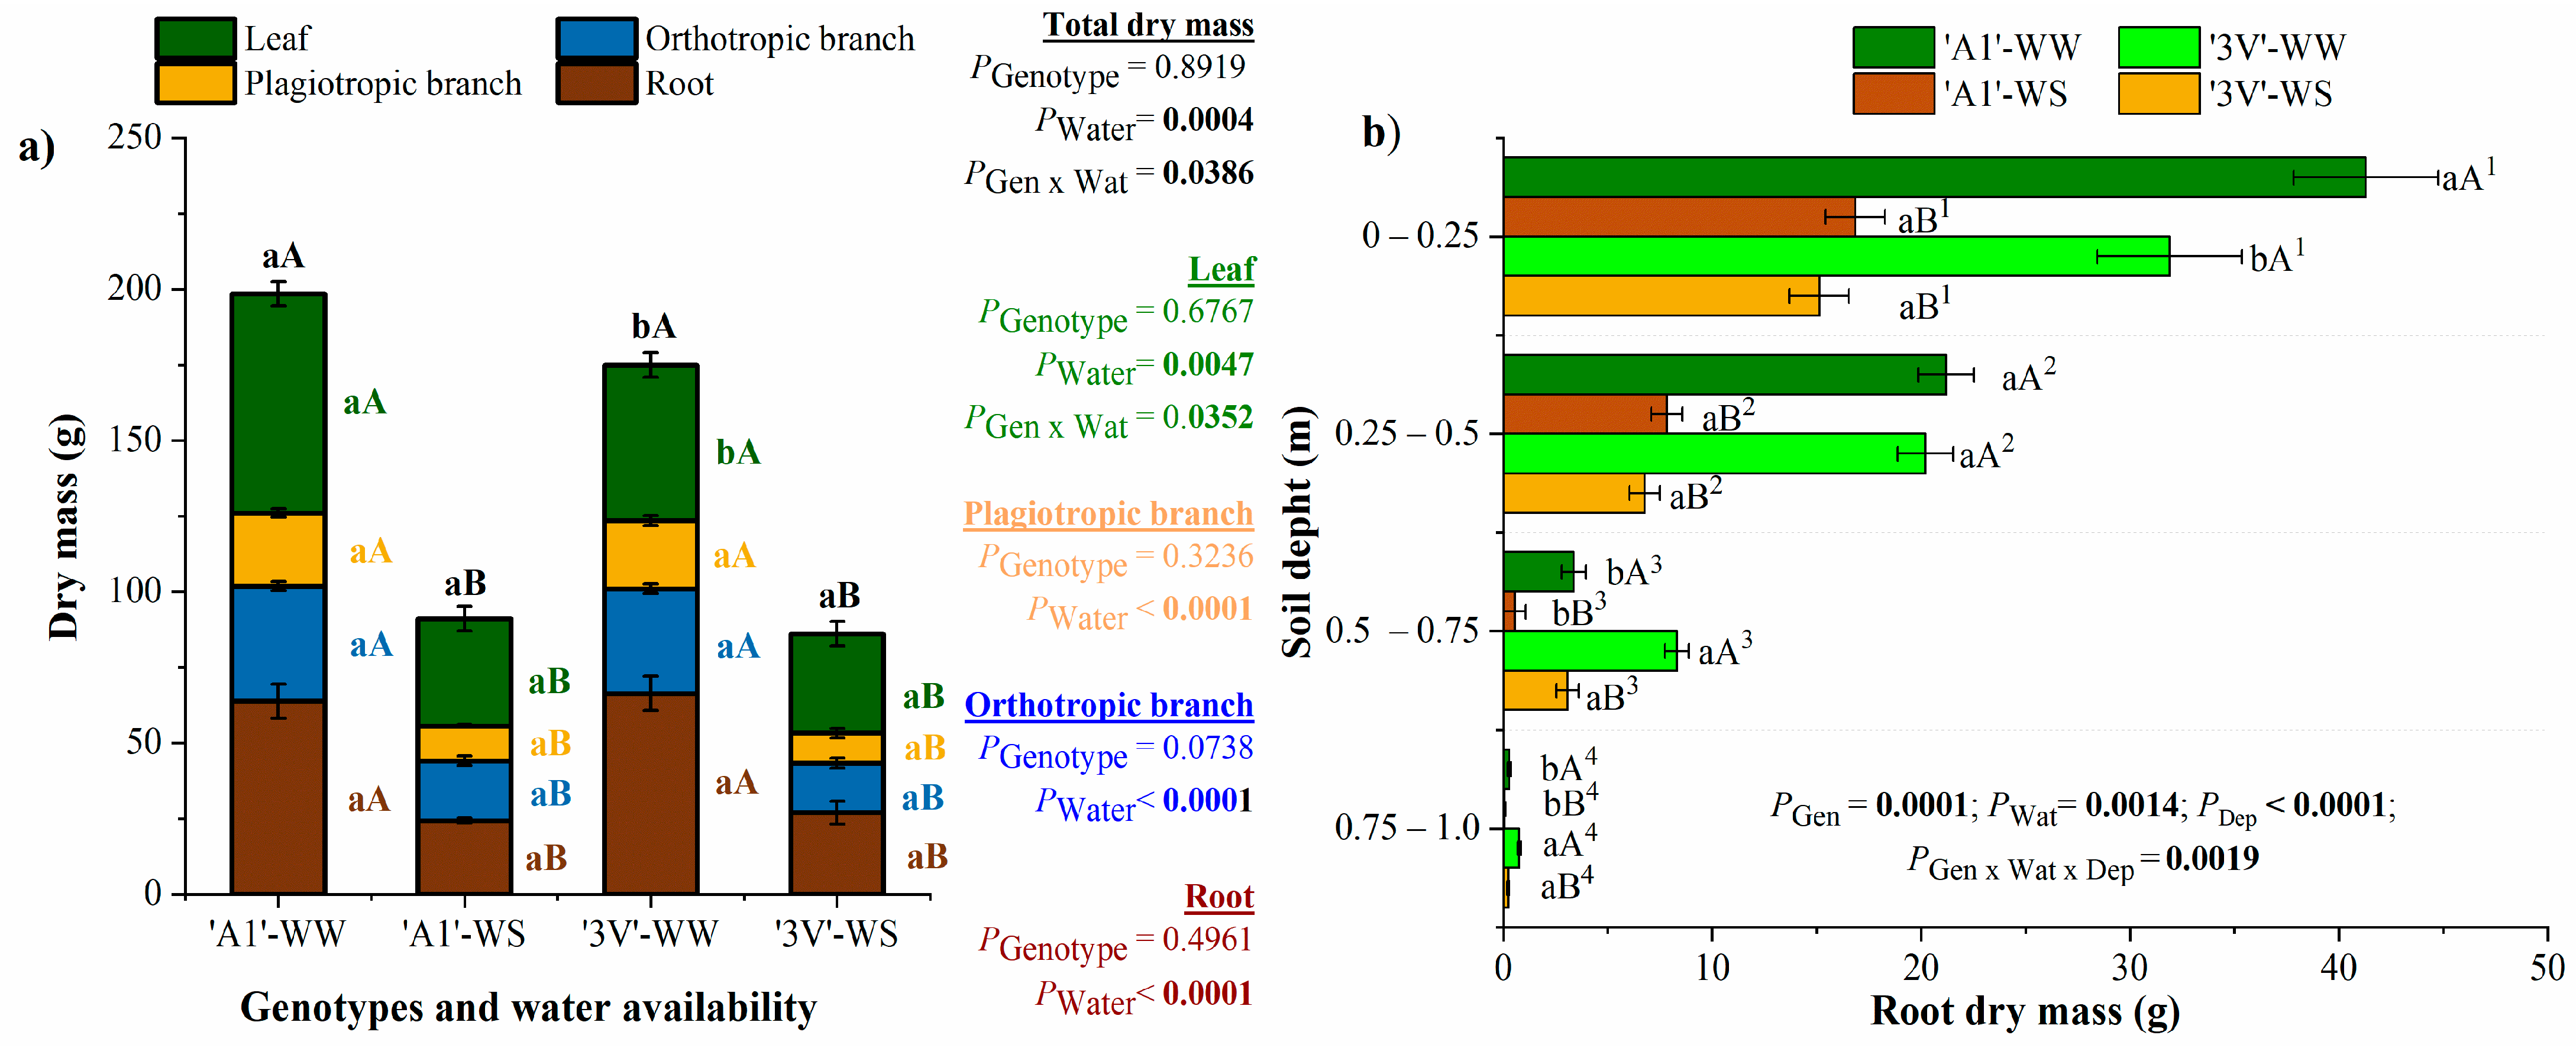
2.4. Plant Leaf Area, Plant Biomass Accumulation and Allocation in Plant Organs After Two Water-Stress Cycles

The plant leaf area (LA) by the end of the experiment was higher in the ‘A1’ than in the ‘3V’ genotype, but a greater difference (ca. 40% lower) was seen in WS plants of both genotypes when compared to their respective WW counterparts (Figure 6). This decline under WS conditions was associated with the lower total number of leaves (Figure 5c).
Both genotype and water availability factors affected the total dry mass (TDM) accumulation (Figure 7a). Under WW conditions, the ‘3V’ plants accumulated 21% less TDM than the ‘A1’ ones, but no significant difference was observed between the two genotypes under WS conditions. However, under WS conditions, TDM decreased by 44% and 57% in ‘3V’ and ‘A1’, respectively, compared to the corresponding WW plants, indicating that TDM in the ‘3V’ genotype was relatively less affected by drought.
The biomass allocation in leaves (leaf dry mass, LDM) was higher in the ‘A1’ than in the ‘3V’ genotype under WW conditions, but no significant difference was found between the two genotypes under WS conditions after the two drought cycles (Figure 7a), despite the greater LA of ‘A1’ compared to ‘3V’ (Figure 6). Under WS conditions, the LDM decreased by 51% in the ‘A1’ genotype and by 36% in the ‘3V’ genotype when compared to WW conditions (Figure 7a), being responsible for changes in TDM. In fact, the biomass allocation in plagiotropic branches (PBDM), orthotropic branches (OBDM), and roots (RDM) was only modified by the water availability, but at a similar level in both genotypes, showing reductions of ca. 54% (PBDM), 50% (OBDM), and 61% (RDM) when compared to WW plants.
The root dry mass distribution over the vertical soil profile was significantly impacted by water availability in both clones by the end of the experiment at all depths evaluated here (Figure 7b). Under adequate water supply (WW), ‘A1’ had higher root dry biomass than ‘3V’ up to a depth of 0.50 m, being inverted thereafter (from 0.50 to 1.0 m deep), although these two deeper layers represented only 6% (‘A1’) and 15% (‘3V’) of the total root biomass. Under WS conditions, no difference between the two genotypes was observed in the two upper layers, while 3V’ showed a greater root biomass when compared to ‘A1’ at the third and fourth layers (from 0.5 to 1.0 m deep). In those two layers, roots represented 2% (‘A1’) and 13% (‘3V’) of the total root biomass. The ‘3V’ genotype was less affected at any of the depths than ‘A1’. Although most of the roots were superficial in both genotypes, the deeper ones were proportionally more preserved in ‘3V’ than in ‘A1’.

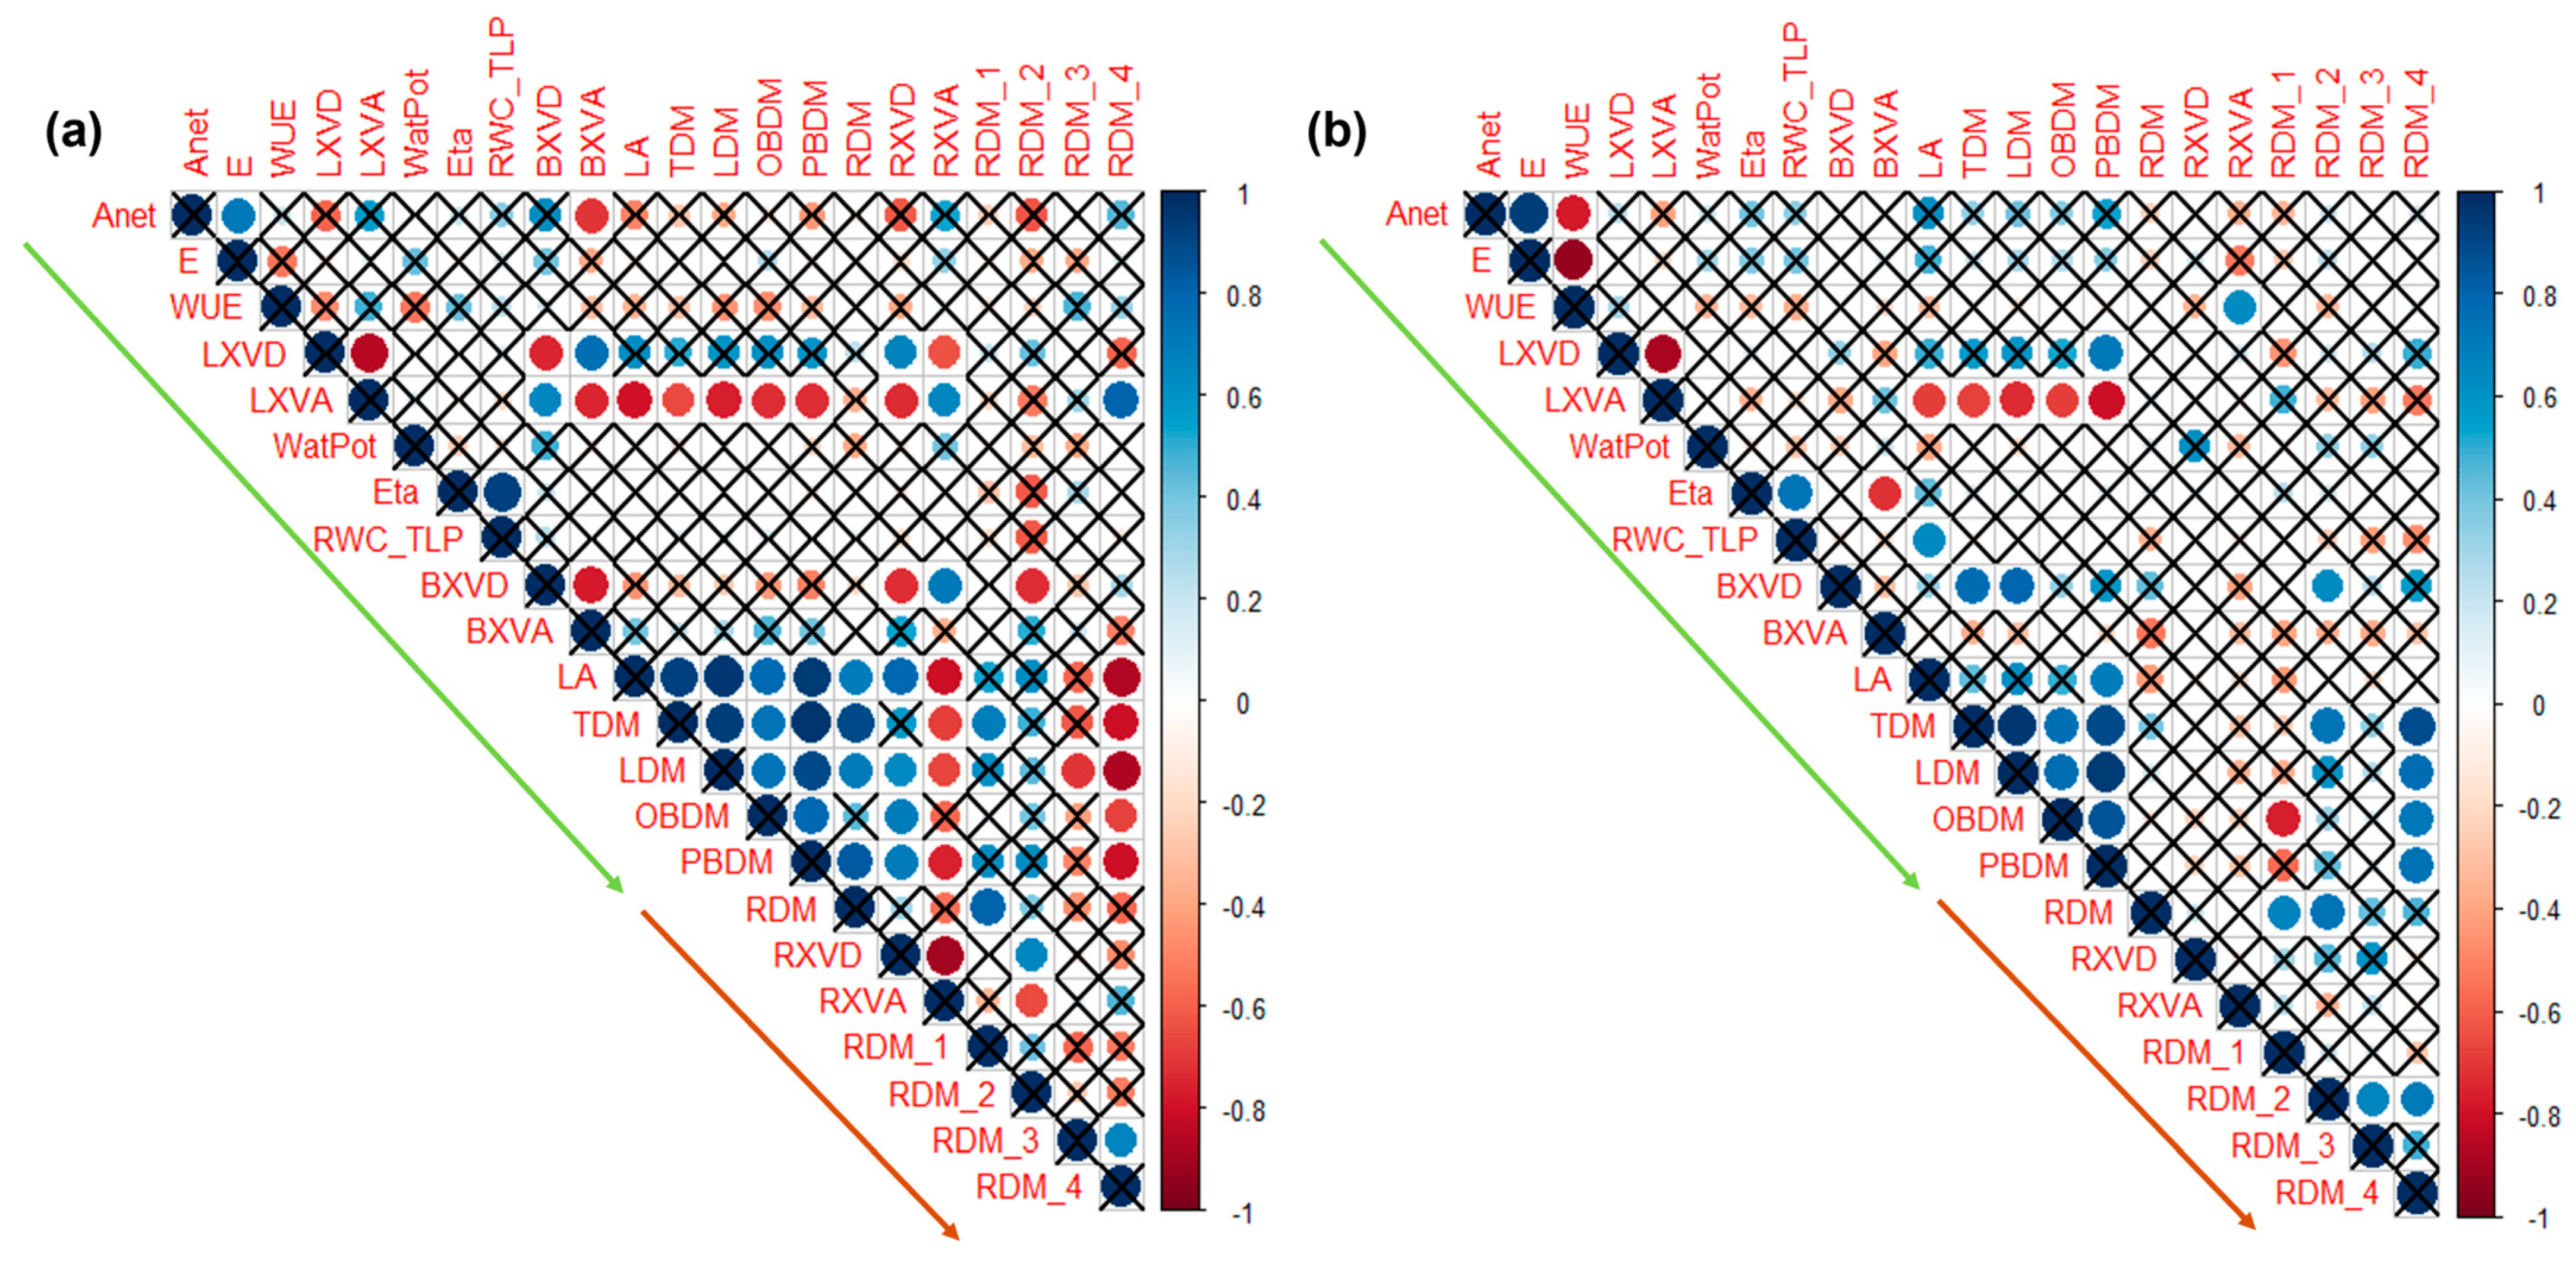
2.5. Correlations Among the Above-Ground and Below-Ground Traits After Two Water-Stress Cycles

For the leaf gas exchanges, leaf net assimilation rate (Anet) was negatively correlated with BXVA under WW (Figure 8a). Also, water use efficiency (WUE) was positively correlated with RXVA under WS (Figure 8b). Positive correlations were observed between the leaf xylem vessel density (LXVD) with RXVD or leaf xylem vessel area (LXVA) with RXVA under WW (Figure 8a), but not under WS (Figure 8b). Under WW, LA, TDM, LDM and PBDM were positively correlated with RDM or RDM_1 (where there was the greatest root mass investment), while being negatively correlated with the deepest layer RDM_4 (Figure 8a). Under WS, TDM, LDM and OBDM were positively correlated with the deepest layer RDM_4 (Figure 8b), suggesting that the above- and below-ground traits are coordinated along single axes of resource acquisition/conservation.

3. Discussion

Our study related the interconnected physio-morphological and anatomical responses from leaf to branch and root organs analyzed in two genotypes of Coffea canephora, allowing us to unveil drought resistance strategies to two successive drought events. Non-stomatal parameters, such as maximum quantum yield (ΦP0), photosynthetic performance index (PIABS), and density of reaction centers capable of QA reduction (RC/CS0) were associated with acclimation to drought in C. canephora during the WS-2 event to a greater extent, and was interpreted as a ‘memory effect’ [33]. Such an effect was not observed in the dynamics of leaf and branch morphological characteristics analyzed in the current experiment (Figure 4 and Figure 5).
Previous findings regarding various physiological and anatomical responses at the leaf scale indicated that ‘3V’ plants are more drought tolerant than ’A1’ ones [33]. A lower impact of WS in ‘3V’ than in ‘A1’ plants during the WS-1 event was observed in Anet, effective quantum yield in PSII photochemistry (ΦPSII), photochemical quenching (qP), linear electron transport (ETR), and photochemical reflectance index (PRI), although such an advantage in ‘3V’ plants seems to disappear during the WS-2 event [30]. The actual analyses of the ‘3V’ genotype also showed higher CVL gains during the WS–1 (Figure 4a), but not during WS–2, resulting in similar CVL gains as seen in the ‘A1’ genotype during WS–2 under both water conditions (Figure 4b). This maintenance of CVL in ‘A1’ during the two drought cycles could indicate that the ‘3V’ genotype was more sensitive than the ‘A1’ genotype.
LXVA decreased under WS in ‘3V’, whereas ’A1’ plants were unresponsive to water shortage in this anatomical trait, being one of its strategies to cope with drought [33]. Anatomical plasticity influences hydraulic properties, which vary among the organs; stems may increase xylem vessel diameter to increase hydraulic conductivity ability but may also increase the occurrence of xylem embolism [40]. In this sense, BXVA was similar between the WS and WW plants of both genotypes (Figure 3a), but the density of vessels decreased under WS in ‘3V’ and increased in ’A1’ under WS (Figure 3a), indicating an increased water transport efficiency and a lower embolism occurrence probability in ‘A1’ than in ‘3V’ stems. In the roots, both genotypes maintained the RXVD under drought conditions (Figure 3c) and diminished the mean vessel area (Figure 3d) to ensure security of water transport with prolonged drought [40,41]. The decrease in soil water content is usually accompanied by a decrease in the root xylem vessels area (RXVA), as observed in wheat roots [42]. Judging from our results, the RXVA reduction can be considered as a common morpho-anatomical acclimation of C. canephora to drought, segregating the genotype responses by significant reduction in ‘3V’ plants and its higher sensitivity to drought stress when compared to ‘A1’ in this trait (Figure 3d). Additionally, our data support the finding that roots are more sensitive than stems to prolonged drought in anatomical hydraulic traits [40].
When considering the leaf hydraulic parameters, drought-exposed clones show higher Ɛ values, reflecting greater tissue rigidity, which results in increased RWC values in Coffea sp. [27,43]. Here, the plants of both genotypes showed similar Ɛ increases under drought conditions (Figure 1e), but in ‘A1’, a higher RWCTLP value was found than in ‘3V’, regardless of water conditions (Figure 1f). This indicated that the loss of turgor in WS plants was followed by a higher RWCTLP value, while Ψo and ΨTLP did not change (Figure 1g,h). In other cases, RWCTLP does not change even if there is osmotic adjustment [44], and here the variation in leaf water potential did not correspond to such variation (no correlation between the water potential and RWCTLP, Figure 8). Changes in relative symplast volume (RWCTLP) under stress conditions have been associated with stomatal aperture [45], with gs greatly reduced in WS plants, and no modification in stomatal density in both ‘A1’ and ‘3V’ [33]. Such responses could suggest a greater drought avoidance than dehydration tolerance in both of the C. canephora genotypes, as previously observed in some genotypes of this species [43].
In field trials examining the root distribution and volume, it was found that under adequate water supply, most C. canephora genotypes had their roots concentrated in the topsoil layers up to 20 cm [46] or 30 cm [43] deep. However, under severe drought conditions, deeper root systems in C. canephora drought-tolerant clones permit them to have greater access to water at the bottom of the soil profile to maintain more favorable internal water status than drought-sensitive clones with shallower root systems [25]. Our RDM distribution findings over the soil profile support such observations. Under WW conditions, ‘A1’ had the greatest part of the root system in the topsoil layer 1, more than ‘3V’ (Figure 7b). As previously reported [47], and under drought conditions, no difference between the two genotypes was observed up to a depth of 0.5 m. However, ‘3V’ showed a higher root biomass than ‘A1’ at a depth of 0.5–1.0 m, thus highlighting the ability to explore deeper soil layers for water, increasing the drought tolerance potential of ‘3V’ plants.
Under WW conditions, a lower total biomass (TDM) was accumulated in ‘3V’ than in ‘A1’ plants, although without any differences observed under drought conditions (Figure 7a). These two genotypes showed similar allocation in LDM after the two cycles of drought stress, despite the greater LA of ‘A1’ when compared to ‘3V’ (Figure 6). For similar gs values, a greater leaf (transpiration) area, could support higher water consumption [48], which is under stomatal regulation. Therefore, leaf number (Figure 5c), and LA reductions (Figure 6) are frequently observed in coffee plants, being considered as a response to drought [34]. Both genotypes had reduced LA by ~40% under WS conditions when compared to WW, with no significant difference between them for this trait.
The maintenance of the physiological status of ‘3V’ between WS-1 and WS-2 [33] did not result in similar trends in morphological responses, especially in the aerial parts of the plant, therefore without a clear ‘stress memory’ of the last type of response. It is possible that the energy investments of ‘3V’ in forming deeper roots under drought conditions is a strategy for assimilating carbon with reduced investment in the aerial parts, indicating a conservative plant drought resistance strategy. On the other hand, despite its physiological sensitivity [33], ‘A1’ seems to use the preceding stress cycle to modify the carbon distribution balance strategies that may be more efficient in accumulating above-ground biomass (Figure 8), and consequently greater carbon fixation per leaf area [33], permitting better maintenance of future fruit formation.
Our results suggest that combining useful morphological and physiological traits allows a successful assessment of coffee clone performance in response to drought, but drought avoidance and tolerance were not linearly connected in all the observed traits (Figure 8), similarly as observed in [48]. Additionally, the above- and below-ground physiological, morphological and anatomical traits seemed to be coordinated along single axes of resource acquisition/conservation under environmental pressures (Figure 8b), meaning that managing the environmental conditions that are known to influence leaf traits, would also be expected to influence root traits. Leaf, stem and root economics and plant hydraulic traits are interrelated but vary independently, as also seen in some other tree species under drought conditions [49]. However, we believe that under field conditions, these responses may be significantly influenced by resource competition between above-ground and below-ground plant components [50]. Additionally, the severity of water stress and the frequency of drought events can be modulated by the physical soil characteristics [51] and soil cover dynamics [52]. These factors may lead to varied stress responses, highlighting the complexity of plant adaptation in natural environments.

4. Conclusions

The ‘3V’ genotype, which has been considered drought-tolerant, based on leaf physiological responses, demonstrated lower sensitivity than the ‘A1’ genotype in parameters of the P–V curve, or in root and branch anatomy under drought conditions. Opposite to our hypothesis, ‘3V’ was shown to be more sensitive to drought in BXVD and RXVA than ‘A1’, with both genotypes having increased Ɛ under WS (indicator of genotypes of low drought tolerance), while ‘A1’ showed higher RWCTLP values than ‘3V’, independent of water conditions. Such responses are better indicators of drought avoidance than tolerance. Considering the dynamics in morphological parameters, drought acclimation of the two genotypes was not expressed. CVL rate was maintained in ‘A1’ and reduced in ‘3V in the WS–2 cycle, indicating again that the 3V genotype was more sensitive and plastic in its morphological responses. This suggested that the ‘A1’ can be considered more conservative, and with lower morphological plasticity under drought conditions than the ‘3V’. Under WS conditions, no difference between the two genotypes was observed in the two upper layers, while ‘3V’ showed a higher root mass when compared to ‘A1’ at the deepest layers of 0.50–1.0 m. Such root biomass distribution over the soil profile indicated greater potential drought tolerance by ‘3V’ than by ‘A1’. Each genotype adopted one specific strategy to cope with drought, one being more conservative, with lower plasticity and inclination to drought avoidance (‘A1’), while the second was shown to be more drought tolerant (‘3V’). Our data showed that Coffea canephora’s above- and below-ground physiological, morphological and anatomical traits are coordinated along single axes of resource acquisition/conservation under water stress.

5. Material and Methods

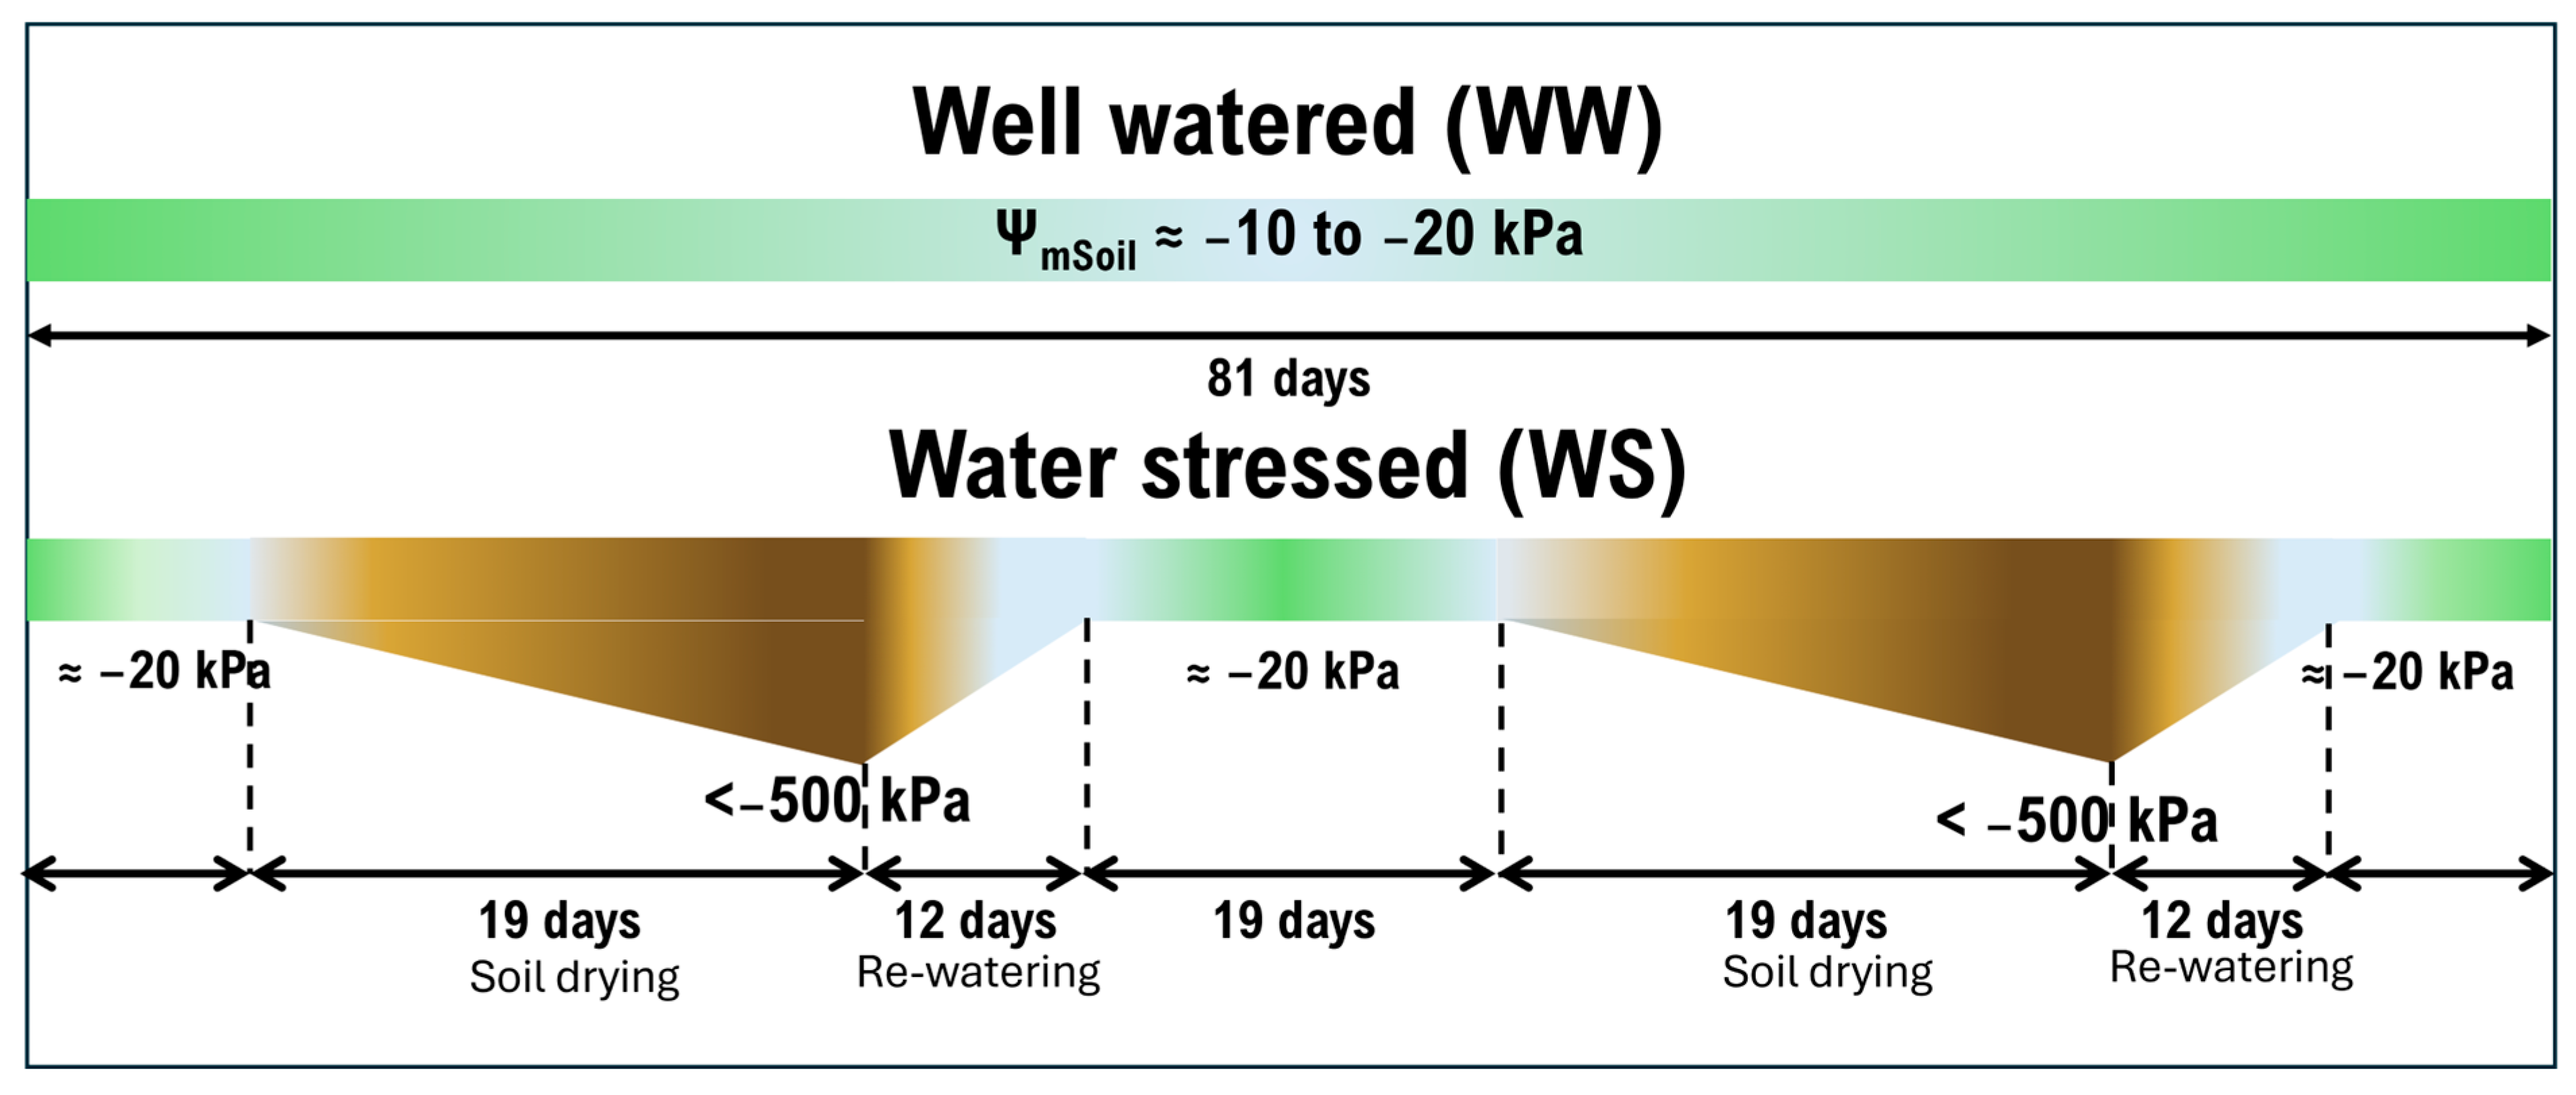
5.1. Plant Material, Experimental Conditions and Experimental Design

The experiment was conducted in a greenhouse in Campos dos Goytacazes (21°44′47″ S and 41°18′24″ W, at 10 m altitude), Rio de Janeiro, Brazil, using two contrasting C. canephora Pierre ex. Froehner, var. Robusta root-growth clones ‘3V’ and ‘A1’, previously characterized by deep and shallow root growth, respectively, in plants grown under non-limited water conditions [47]. In November 2020, five-month-old seedlings (14 per clone, totaling twenty-eight seedlings) produced from cuttings were transplanted into PVC tubes (1.0 m height × 0.2 m diameter). The tubes were filled with a substrate composed of red–yellow latosol and sand at a 4:1 ratio. A soil chemical analysis was performed to assess fertility and ensure adequate fertilization according to crop requirements [53]. Briefly, the soil pH was 5.6, hydrogen + aluminum was 1.1 cmolc dm−3, organic matter 1%, sum of bases at 4.0 cmolc dm−3, CEC at 5.1 cmolc dm−3, effective CEC at 4.0 cmolc dm−3, base saturation at 78.3%. More nutritional details are shown in [33].
During the first 60 days after transplanting, all plants were watered daily to maintain sufficient water availability. After this initial period, seven plants of each clone were subjected to soil water stress (WS), while the remaining seven were kept in well-watered (WW) conditions as controls. The WS treatment involved fully withholding water until the soil water potential (ΨmSoil) attained values of <−500 kPa (−0.5 MPa) in two water restriction cycles of 19 days, that was followed by a rewatering period of 12 days (Figure 9). Both genotypes attained the same values for ΨmSoil. Between the two WS cycles, a period of an additional 19 days was established, when all plants were maintained well-watered. The irrigation system (flow rate ≈ 0.05 L min−1 plant−1) was automatically activated for 30 min twice a day (06:00 h and 18:00 h). ΨmSoil was recorded at 100 cm, with a 30 min interval until the end of the experiment (20 April 2021), using a TEROS 21 (Meter Group, Pullman WA, USA) ΨmSoil sensor together with a data logger. The ΨmSoil during WW conditions was −10 to −20 kPa. The attained leaf predawn water potential was similar between the two genotypes after soil drying of WS-1 in WS plants, but was more negative in ‘3V’ (−2.97 MPa) than in ‘A1’ (−2.60 MPa) plants after soil drying during WS-2 [33].

5.2. Pressure–Volume (P–V) Curve Measurements After Two Water-Stress Cycles

The dynamics of leaf turgor and tissue water relations were assessed through pressure–volume (P–V) curve analysis [54,55] using a Schölander-type [56] pressure chamber (model 3005; Soil Moisture Equipment Corporation, Santa Barbara, CA, USA) following a free transpiration method [57,58], because it was simpler and allowed the simultaneous analysis of a greater number of samples [59]. P–V curves were determined only at the end of the 2nd soil drying and recovery cycle (Figure 9). Measurements were performed on four plants per day over a seven–day period. Ten hours before the measurements, 2nd order plagiotropic branches with 5–8 leaf pairs were cut and submerged in distilled water until fully rehydrated. Those leafy axes were kept covered with a dark plastic bag in the laboratory for approximately ten hours to ensure stomatal closure and complete rehydration. Fully expanded leaves (developed during the two water-stress cycles) were collected from the rehydrated branches and gradually dehydrated on the bench over a period of eight to ten hours. During the dehydration process, leaf fresh mass and water potential (Ψw) were measured at increasing intervals until Ψw reached approximately −3.0 MPa. Each leaf area was measured using a leaf area meter LI–3100 (Li–Cor, Lincoln NE, USA), and the dry mass of each leaf was determined after drying in a forced-air oven model 320/5 (Eletrolab, São Paulo SP, Brazil) at 65 °C for 72 h.
To obtain the P–V curve parameters, we followed a protocol defined in [58]. The leaf potential at the turgor loss point (ΨTLP) was estimated as the transition point between the curvilinear and linear sections of the graph by plotting the inverse of Ψw against relative leaf water content (RWC). Osmotic potential (Ψo) was estimated by extrapolating the linear section to 100% RWC. The bulk modulus of elasticity (Ɛ, a measure of how much the cell turgor changes relative to the change in cell volume) was estimated from the slope of the pressure potential between the full turgor and turgor loss point (TLP). The leaf capacitance (CTLP) was determined from the slopes of the pressure–volume relationship between full turgor and TLP. Relative capacitance at full turgor (CFT) was calculated as the change in total or symplastic RWC over the change in Ψw between full hydration and ΨTLP. Relative capacitance at zero turgor (C*FT) was calculated as the change in total or symplastic RWC over the change in Ψw after reaching ΨTLP. Symplastic RWC at turgor loss point (RWCTLP), was visually estimated from ΨTLP. The saturated water content (SWC) was calculated as the leaf water mass at saturation divided by the dry mass.

5.3. Measurmenents of Root and Branch Xylem Anatomy Traits After Two Water-Stress Cycles

To measure xylem vessel density and vessel area, samples of roots and plagiotropic branches were collected at the end of the 2nd drought and recovery cycle. Transverse cuts were made on sampled material by hand, using razor blades. The thin cuts were clarified with a 50% sodium hypochlorite solution until completely translucent and rinsed three times in distilled water. Sections were then stained with Safrablau, a combination of 1% aqueous Astra Blue and 1% alcoholic Safranin solution at a 9:1 ratio [60]. Observations and image captures were performed using a Nikon Eclipse E200 optical microscope (Nikon Corp., Tokyo, Japan) with a 10× objective lens, assisted by Capture 2.2.1 software (Meiji Techno, Saitama, Japan). For each plant (n = 7), the averages were taken for branch and root cuts, from six and eleven fields of view, respectively. Due to the resistance of the material and the quality of the sections, fewer fields of view were obtained from the branches.

5.4. Measurements of Growth Dynamics and Final Plant Leaf Area

Growth dynamics were monitored through weekly measurements of plant height (PH), stem diameter (SD), and leaf number (LN), from the 16th week to the end of the experiment (27th week) at 12 time-points. After initiating soil water-stress cycles (WS–1 and WS–2), young leaves (CVL ≥ 1 cm) were selected to monitor the leaf expansion rate based on measurements of central vein length (CVL) taken at six-day intervals at four time-points for each of the two stress cycles. PH and CVL were measured (mm) with a graduated ruler, while SD was measured using with digital vernier calipers (JOMARCA, Guarulhos SP, Brazil).
The leaf area per plant (LA) was measured after two sequential water-stress cycles with a leaf area meter (LI–3100, Li–Cor, Lincoln, NE, USA).

5.5. Measurements of Biomass Allocation Traits After Two Water-Stress Cycles

Separate plant parts (orthotropic and plagiotropic branches, leaves, and roots) were dried in a forced-air oven model 320/5 (Eletrolab., São Paulo SP, Brazil) at 65 °C for 72 h to determine the dry mass allocation in leaves (LDM), plagiotropic branches (PBDM), orthotropic branches (OBDM), and roots (RDM). Branches and leaves were separated using pruning shears. To divide the root layers, the pots were cut laterally and each soil layer with its root portion was cut and washed separately.
Roots were evaluated considering four different layers of soil depth (0–0.25 m; 0.25–0.50 m; 0.50–0.75 m; and 0.75–1.0 m) to assess root distribution along the soil vertical profile. Root separation was carefully performed, preserving the maximum number of roots on a fine metal sieve. Total dry mass (TDM) was calculated as the sum of all partial dry masses. All dry mass evaluations were performed using a precision balance with four decimal places (Shimadzu AY220, Shimadzu Corporation, Kyoto, Japan).

5.6. Statistical Analysis

All statistical analyses were performed using ‘R’ [61]. A significance level of 0.05 was used for all analyses. A completely random factorial experimental design was used, including two factors: two genotypes (‘A1’ and ‘3V’), and two water conditions (WW and WS) for P–V curve parameters, anatomy traits, LA and biomass allocation. Three-way ANOVAs were processed for dynamics in morphological traits (including the 12 time-points with a one-week interval as a third factor) and root distribution (including the four root-depth levels as a third factor). For ANOVAs, mixed linear modeling was used (lme function and maximum likelihood from the ‘nlme’ package), considering genotypes, water availability, and timepoints as fixed factor effects, while plant number (repetition) was considered as a random effect. The Bartlett homogeneity test and the Shapiro normality test were performed for each variable and their values helped in model choice. If no significant interaction (starting from the most complex where three or two factors were interacting) was found, a reduction model was applied (and fitted using the lme function, considering again all factors as fixed or random, as mentioned above). For comparing average values estimated by ANOVAs, we used the Tukey HSD and ‘lsmeans’ and ‘multcompView’ packages. The estimated means and standard errors (SE) are shown in the figures.
For the central vein elongation dynamics, four time-points (measurements performed at a six-day frequency) separately for each of the two drought cycles were analyzed, performing a double factorial scheme (fat2.crd) and using the ‘ExpDes’ package [62], after testing the hypothesis of variance homogeneity. Linear regression models were fitted, considering four treatments (two genotypes × two water regimes) and four time-points. A multiple comparison ‘Tukey’ test was used to compare treatment effects within each time-point, and the time effects inside of each treatment.
The Pearson method was applied to correlate traits related above- to below-ground traits of each plant, using the ‘corrplot’ package, while the ‘Hmisc’ package was used for p-value inclusions. For correlations, additional above-ground data for each analyzed plant related to leaf net assimilation rate (Anet, μmol m−2 s−1), leaf transpiration rate (E, mmol m−2 s−1), water use efficiency (WUE, mmol CO2 mol−1 H2O), leaf water potential (MPa) leaf xylem vessel density (LXVD), area of leaf xylem vessel (LXVA) were obtained under the same conditions as the results shown in this experiment, with the values registered at the end of the 2nd WS cycle, as described in [33].

Author Contributions

Conceptualization, E.C. and D.F.B.; methodology, E.C., D.F.B. and G.A.R.d.S.; validation, all authors; formal analysis, G.A.R.d.S., J.C.R. and M.R.; investigation, G.A.R.d.S., D.F.B., W.d.P.B., A.R.S., L.C.d.S.B., L.F.T.B., L.Z.C., C.M.d.A. and A.C.V.F.; resources, E.C.; data curation, G.A.R.d.S., D.F.B. and M.R.; writing—original draft preparation, G.A.R.d.S., D.F.B. and M.R.; writing—review and editing, M.R., W.P.R. and J.C.R.; visualization, all authors; supervision, E.C. and M.R.; project administration, E.C.; funding acquisition, E.C. All authors have read and agreed to the published version of the manuscript.

Funding

This research was funded by Fundação Carlos Chagas Filho de Amparo à Pesquisa do Estado do Rio de Janeiro (FAPERJ, Brazil) granted to E.C. (200.957/2022), together with fellowships awarded to M.R., D.F.B., and W.P.B. (204.636/2024, E–26/200.327/2020, and E–26/200.172/2021). The research was additionally funded by Coordenação de Aperfeiçoamento de Pessoal de Nível Superior (CAPES, Brazil) with fellowships granted to G.A.R.d.S., C.M.A., A.R.S., L.C.S.B., L.F.T.B. and L.C.Z. (88887.968322/2024–00, 88887.903335/2023–00, 88887.993832/2024-00, 88887.991771/2024-00, 88887.822657/2023–00, and 88887.991759/2024-00), and National Council for Scientific and Technological Development (CNPq, Brazil) by fellowship awarded to E.C. (304470/2023–6). The research was additionally funded by Fundação para a Ciência e a Tecnologia, I.P. (FCT), Portugal, through the projects UIDB/00239: Centro de Estudos Florestais (https://doi.org/10.54499/UIDB/00239/2020), and UIDP/04035/2020: Unidade de Geobiociências, Geoengenharias e Geotecnologias (https://doi.org/10.54499/UIDB/04035/2020), as well as through the Associate Laboratory TERRA (LA/P/0092/2020, https://doi.org/10.54499/LA/P/0092/2020) granted to J.C.R.

Institutional Review Board Statement

Not applicable.

Data Availability Statement

The authors can provide experimental data to all interested researchers.

Conflicts of Interest

The authors declare no conflicts of interest.

Abbreviations

BXVA: branch xylem vessel area; BXVD: branch xylem vessel density; C*FT: relative capacitance at zero turgor; CFT: bulk hydraulic capacitance at full turgor; CTLP: leaf capacitance at the turgor loss point; CVL: central leaf vein length; Ɛ: bulk modulus of elasticity; LA: plant leaf area; LDM: leaf dry mass; LN: leaf number; OBDM: orthotropic branch dry mass; PBDM: plagiotropic branch dry mass; PH: plant height; P–V curve: pressure–volume curve; RDM: root dry mass; RWC: relative water content; RWCTLP: relative leaf water content at the turgor loss point; RXVA: root xylem vessels area; RXVD: root xylem vessel density; SD: stem diameter; SWC: saturated water content; TDM: total dry mass; TLP: turgor loss point; WS: water-stress conditions; WS–1: water-stress event 1; WS–2: water-stress event 2; WW: well-watered conditions; ΨmSoil: soil matrix water potential; Ψo: osmotic potential; ΨTLP: leaf potential of the turgor loss point; Ψw: leaf water potential.

References

  1. Vicente-Serrano, S.M.; Quiring, S.M.; Peña-Gallardo, M.; Yuan, S.; Domínguez-Castro, F. A review of environmental droughts: Increased risk under global warming? Earth-Sci. Rev. 2020, 201, 102953. [Google Scholar] [CrossRef]
  2. Crausbay, S.D.; Ramirez, A.R.; Carter, S.L.; Cross, M.S.; Hall, K.R.; Bathke, D.J.; Betancourt, J.L.; Colt, S.; Cravens, A.E.; Dalton, M.S.; et al. Defining ecological drought for the twenty-first century. B. Am. Meteor. Soc. 2017, 98, 2543–2550. [Google Scholar] [CrossRef]
  3. IPCC (The Intergovernmental Panel on Climate Change). 2022. Available online: https://www.ipcc.ch/report/ar6/wg2/chapter/chapter-4/ (accessed on 4 December 2024).
  4. Venancio, L.P.; Filgueiras, R.; Mantovani, E.C.; Amaral, C.H.D.; da Cunha, F.F.; dos Santos Silva, F.C.; Althoff, D.; Santos, R.A.; Cavatte, P.C. Impact of drought associated with high temperatures on Coffea canephora plantations: A case study in Espírito Santo State, Brazil. Sci. Rep. 2020, 10, 1–21. [Google Scholar] [CrossRef]
  5. Machado Filho, J.A.; Rodrigues, W.P.; Baroni, D.F.; Pireda, S.; Campbell, G.; de Souza, G.A.R.; Verdin Filho, A.C.; Arantes, S.D.; Arantes, L.O.; Cunha, M.; et al. Linking root and stem hydraulic traits to leaf physiological parameters in Coffea canephora clones with contrasting drought tolerance. J. Plant Physiol. 2021, 258, 153355. [Google Scholar] [CrossRef]
  6. Nikolaou, G.; Neocleous, D.; Christou, A.; Kitta, E.; Katsoulas, N. Implementing sustainable irrigation in water-scarce regions under the impact of climate change. Agronomy 2020, 10, 1120. [Google Scholar] [CrossRef]
  7. DaMatta, F.M.; Avila, R.T.; Cardoso, A.A.; Martins, S.C.V.; Ramalho, J.C. Physiological and agronomic performance of the coffee crop in the context of climate change and global warming: A review. J. Agric. Food Chem. 2018, 66, 5264–5274. [Google Scholar] [CrossRef]
  8. Rodrigues, A.P.; Pais, I.P.; Leitão, A.E.; Dubberstein, D.; Lidon, F.C.; Marques, I.; Semedo, J.N.; Rakočević, M.; Scotti-Campos, P.; Campostrini, E.; et al. Uncovering the wide protective responses in Coffea spp. leaves to single and superimposed exposure of warming and severe water deficit. Front. Plant Sci. 2024, 14, 1320552. [Google Scholar] [CrossRef]
  9. Rakočević, M. Coffee plant architecture. In ‘Coffee—A Glimpse into the Future’, ed. 114; DaMatta, F.M., Ramalho, J.C., Eds.; Elsevier: Amsterdam, The Netherlands, 2024. [Google Scholar]
  10. Martins, S.C.; Sanglard, M.L.; Morais, L.E.; Menezes-Silva, P.E.; Mauri, R.; Avila, R.T.; Vital, C.E.; Cardoso, A.A.; DaMatta, F.M. How do coffee trees deal with severe natural droughts? An analysis of hydraulic, diffusive and biochemical components at the leaf level. Trees 2019, 33, 1679–1693. [Google Scholar] [CrossRef]
  11. Marques, I.; Fernandes, I.; Paulo, O.S.; Batista, D.; Lidon, F.C.; Rodrigues, A.P.; Partelli, F.L.; DaMatta, F.M.; Ribeiro-Barros, A.I.; Ramalho, J.C. Transcriptomic analyses reveal that Coffea arabica and Coffea canephora have more complex responses under combined heat and drought than under individual stressors. Int. J. Mol. Sci. 2024, 25, 7995. [Google Scholar] [CrossRef] [PubMed]
  12. Cruz, F.P.; Loh, R.K.; Arcuri, M.L.; Dezar, C.; Arge, L.W.; Falcão, T.; Romanel, E.; Morgante, C.V.; Cerqueira, J.V.A.; Ribeiro, T.P.; et al. Heterologous expression of coffee HB12 confers tolerance to water deficit in transgenic plants through an ABA-independent route. Environ. Exp. Bot. 2024, 228, 105983. [Google Scholar] [CrossRef]
  13. Costa, T.; Melo, J.; Carneiro, F.; Vieira, N.; Rêgo, E.; Lima, E.; Cotta, M.G.; Marraccini, P.; Andrade, A. Expression of candidates genes for drought tolerance related to ABA signaling in roots of C. canephora. In Congresso Brasileiro de Biotecnologia, 6. Brasília. [Resumos]; Sociedade Brasileira de Biotecnologia: Brasília, Brazil, 2015. [Google Scholar]
  14. Chekol, H.; Warkineh, B.; Shimber, T.; Mierek-Adamska, A.; Dąbrowska, G.B.; Degu, A. Drought Stress Responses in Arabica Coffee Genotypes: Physiological and Metabolic Insights. Plants. 2024, 13, 828. [Google Scholar] [CrossRef]
  15. Fang, Y.; Xiong, L. General mechanisms of drought response and their application in drought resistance improvement in plants. Cell. Mol. L. Sci. 2014, 72, 673–689. [Google Scholar] [CrossRef]
  16. Bodner, G.; Nakhforoosh, A.; Kaul, H.-P. Management of crop water under drought: A review. Agron. Sustain. Dev. 2015, 35, 401–442. [Google Scholar] [CrossRef]
  17. Shavrukov, Y.; Kurishbayev, A.; Jatayev, S.; Shvidchenko, V.; Zotova, L.; Koekemoer, F.; de Groot, S.; Soole, K.; Langridge, P. Early Flowering as a drought escape mechanism in plants: How can it aid wheat production? Front. Plant Sci. 2017, 8, 1950. [Google Scholar] [CrossRef]
  18. Kooyers, N.J. The evolution of drought escape and avoidance in natural herbaceous populations. Plant Sci. 2015, 234, 155–162. [Google Scholar] [CrossRef]
  19. Lynch, J.P. Steep, cheap and deep: An ideotype to optimize water and N acquisition by maize root systems. Ann. Bot. 2013, 112, 347–357. [Google Scholar] [CrossRef]
  20. Ma, Y.; Dias, M.C.; Freitas, H. Drought and salinity stress responses and microbe-induced tolerance in plants. Front. Plant Sci. 2020, 11, 591911. [Google Scholar] [CrossRef]
  21. Shao, X.; Zhang, Y.; Ma, N.; Zhang, X.; Tian, J.; Xu, Z.; Liu, Z. Drought-induced ecosystem resistance and recovery observed at 118 flux tower stations across the globe. Agric. For. Meteorol. 2024, 356, 110170. [Google Scholar] [CrossRef]
  22. Ramalho, J.; Chaves, M.M. Drought effects on plant water relations and carbon gain in two lines of Lupinus albus L. Eur. J. Agron. 1992, 1, 271–280. [Google Scholar] [CrossRef]
  23. Haddoudi, L.; Hdira, S.; Hanana, M.; Romero, I.; Haddoudi, I.; Mahjoub, A.; Jouira, H.B.; Djébali, N.; Ludidi, N.; Sanchez-Ballesta, M.T.; et al. Evaluation of the morpho-physiological, biochemical and molecular responses of contrasting Medicago truncatula Lines under water deficit stress. Plants 2021, 10, 2114. [Google Scholar] [CrossRef]
  24. Meister, R.; Rajani, M.S.; Ruzicka, D.; Schachtman, D.P. Challenges of modifying root traits in crops for agriculture. Trends Plant Sci. 2014, 19, 779–788. [Google Scholar] [CrossRef]
  25. Pinheiro, H.P.; DaMatta, F.M.; Chaves, A.R.M.; Loureiro, M.E.; Ducatti, C. Drought tolerance is associated with rooting depth and stomatal control of water use in clones of Coffea canephora. Ann. Bot. 2005, 96, 101–108. [Google Scholar] [CrossRef]
  26. Isaac, M.E.; Martin, A.R.; de Filho, E.M.V.; Rapidel, B.; Roupsard, O.; van den Meersche, K. Intraspecific trait variation and coordination: Root and leaf economics spectra in coffee across environmental gradients. Front. Plant Sci. 2017, 8, 1196. [Google Scholar] [CrossRef]
  27. DaMatta, F.M. Exploring drought tolerance in coffee: A physiological approach with some insights for plant breeding. Braz. J. Plant Physiol. 2004, 16, 1–6. [Google Scholar] [CrossRef]
  28. Erdiansyah, N.P.; Wachjar, A.; Sulistyono, E.; Supijatno, S. Growth response of seedlings of four robusta coffee (Coffea canephora Pierre. Ex. A. Froehner) clones to drought stress. Pelita Perkeb. 2019, 35, 1–11. [Google Scholar] [CrossRef]
  29. Hu, X.; Li, X.Y.; Guo, L.L.; Liu, Y.; Wang, P.; Zhao, Y.D.; Cheng, Y.Q.; Lyu, Y.L.; Liu, L.Y. Influence of shrub roots on soil macropores using X-ray computed tomography in a shrub-encroached grassland in Northern China. J. Soils Sedim. 2019, 19, 1970–1980. [Google Scholar] [CrossRef]
  30. Ramalho, J.C.; Rodrigues, A.P.; Lidon, F.C.; Marques, L.M.C.; Leitão, A.E.; Fortunato, A.S.; Pais, I.P.; Silva, M.J.; Scotti-Campos, P.; Lopes, A.; et al. Stress cross-response of the antioxidative system promoted by superimposed drought and cold conditions in Coffea spp. PLoS ONE 2018, 13, e0198694. [Google Scholar] [CrossRef]
  31. Dubberstein, D.; Lidon, F.C.; Rodrigues, A.P.; Semedo, J.N.; Marques, I.; Rodrigues, W.P.; Gouveia, D.; Armengaud, J.; Semedo, M.C.; Martins, S.; et al. Resilient and Sensitive Key Points of the Photosynthetic Machinery of Coffea spp. to the Single and Superimposed Exposure to Severe Drought and Heat Stresses. Front. Plant Sci. 2020, 11, 1049. [Google Scholar]
  32. Menezes-Silva, P.E.; Sanglard, L.M.; Ávila, R.T.; Morais, L.E.; Martins, S.C.; Nobres, P.; Patreze, C.M.; Ferreira, M.A.; Araújo, W.L.; Fernie, A.R.; et al. Photosynthetic and metabolic acclimation to repeated drought events play key roles in drought tolerance in coffee. J. Exp. Bot. 2017, 68, 4309–4322. [Google Scholar] [CrossRef]
  33. Baroni, D.F.; de Souza, G.A.R.; Bernado, W.d.P.; Santos, A.R.; Barcellos, L.C.d.S.; Barcelos, L.F.T.; Correia, L.Z.; de Almeida, C.M.; Verdin Filho, A.C.; Rodrigues, W.P.; et al. Stomatal and non-stomatal leaf responses during two sequential water stress cycles in young Coffea canephora plants. Stresses 2024, 4, 575–597. [Google Scholar] [CrossRef]
  34. Rakočević, M.; Matsunaga, F.T.; Pazianotto, R.A.A.; Ramalho, J.C.; Costes, E.; Ribeiro, R.V. Drought responses in Coffea arabica as affected by genotype and phenophase. I—Leaf distribution and branching. Exp. Agric. 2024, 60, e7. [Google Scholar] [CrossRef]
  35. Rakočević, M.; Costes, E.; Campostrini, E.; Ramalho, J.C.; Ribeiro, R.V. Drought responses in Coffea arabica as affected by genotype and phenophase. II—Photosynthesis at leaf and plant scales. Exp. Agric. 2024, 60, e22. [Google Scholar] [CrossRef]
  36. Chen, D.; Wang, S.; Cao, B.; Cao, D.; Leng, G.; Li, H.; Yin, L.; Shan, L.; Deng, X. Genotypic variation in growth and physiological response to drought stress and re-watering reveals the critical role of recovery in drought adaptation in maize seedlings. Front. Plant Sci. 2016, 6, 1241. [Google Scholar] [CrossRef]
  37. Lämke, J.; Bäurle, I. Epigenetic and chromatin-based mechanisms in environmental stress adaptation and stress memory in plants. Genome Biol. 2017, 18, 124. [Google Scholar] [CrossRef]
  38. Lagiotis, G.; Madesis, P.; Stavridou, E. Echoes of a stressful past: Abiotic stress memory in crop plants towards enhanced adaptation. Agriculture 2023, 13, 2009. [Google Scholar] [CrossRef]
  39. Navarro-Cerrillo, R.; Rodriguez-Vallejo, C.; Silveiro, E.; Hortal, A.; Palacios-Rodríguez, G.; Duque-Lazo, J.; Camarero, J. Cumulative drought stress leads to a loss of growth resilience and explains higher mortality in planted than in naturally regenerated Pinus pinaster stands. Forests 2018, 9, 358. [Google Scholar] [CrossRef]
  40. Li, S.; Huang, X.; Zheng, R.; Zhang, M.; Zou, Z.; Heal, K.V.; Zhou, L. Xylem plasticity of root, stem, and branch in Cunninghamia lanceolata under drought stress: Implications for whole-plant hydraulic integrity. Front. Plant Sci. 2024, 15, 1308360. [Google Scholar] [CrossRef]
  41. Zhang, H.; McDowell, N.G.; Adams, H.D.; Wang, A.; Wu, J.; Jin, C.; Tian, J.; Zhu, K.; Li, W.; Zhang, Y.; et al. Divergences in hydraulic conductance and anatomical traits of stems and leaves in three temperate tree species coping with drought, N addition and their interactions. Tree Physiol. 2020, 40, 230–244. [Google Scholar] [CrossRef]
  42. Felouah, O.C.; Ammad, F.; Adda, A.; Bouzid, A.; Gharnaout, M.L.; Evon, P.; Merah, O. Morpho-anatomical modulation of seminal roots in response to water deficit in durum wheat (Triticum turgidum var. durum). Plants 2024, 13, 487. [Google Scholar] [CrossRef]
  43. DaMatta, F.M.; Chaves, A.R.M.; Pinheiro, H.A.; Ducatti, C.; Loureiro, M.E. Drought tolerance of two field-grown clones of Coffea canephora. Plant Sci. 2003, 64, 111–117. [Google Scholar] [CrossRef]
  44. DaMatta, F.M.; Maestri, M.; Barros, R.S.; Regazzi, A.J. Water relations of coffee leaves (Coffea arabica and C. canephora) in response to drought. J. Hortic. Sci. 1993, 68, 741–746. [Google Scholar] [CrossRef]
  45. Nishiyama, R.; Watanabe, Y.; Fujita, Y.; Tien Le, D.; Kojima, M.; Werner, T.; Vankova, R.; Yamaguchi-Shinozaki, K.; Shinozaki, K.; Kakimoto, T.; et al. Analysis of cytokinin mutants and regulation of cytokinin metabolic genes reveals important regulatory roles of cytokinins in drought, salt and abscisic acid responses, and abscisic acid biosynthesis. Plant Cell 2011, 23, 2169–2183. [Google Scholar] [CrossRef]
  46. Silva, L.O.E.; Schmidt, R.; Valani, G.P.; Ferreira, A.; Ribeiro-Barros, A.I.; Partelli, F.L. Root trait variability in Coffea canephora genotypes and its relation to plant height and crop yield. Agronomy 2020, 10, 1394. [Google Scholar] [CrossRef]
  47. Rakočević, M.; Baroni, D.F.; de Souza, G.A.R.; Bernado, W.P.; Almeida, C.M.; Matsunaga, F.T.; Rodrigues, W.P.; Ramalho, J.C.; Campostrini, E. Correlating Coffea canephora 3D architecture to plant photosynthesis at a daily scale and vegetative biomass allocation. Tree Physiol. 2023, 43, 556–574. [Google Scholar] [CrossRef]
  48. Silva, V.A.; Abrahão, J.C.d.R.; Reis, A.M.; Santos, M.d.O.; Pereira, A.A.; Botelho, C.E.; Carvalho, G.R.; de Castro, E.M.; Barbosa, J.P.R.A.D.; Botega, G.P.; et al. Strategy for selection of drought-tolerant arabica coffee genotypes in Brazil. Agronomy 2022, 12, 2167. [Google Scholar] [CrossRef]
  49. López, R.; Cano, F.J.; Martin-StPaul, N.K.; Cochard, H.; Choat, B. Coordination of stem and leaf traits define different strategies to regulate water loss and tolerance ranges to aridity. New Phytol. 2021, 230, 497–509. [Google Scholar] [CrossRef]
  50. Hecht, V.L.; Temperton, V.M.; Nagel, K.A.; Rascher, U.; Postma, J.A. Sowing density: A neglected factor fundamentally affecting root distribution and biomass allocation of field grown spring barley (Hordeum vulgare L.). Front. Plant Sci. 2016, 7, 944. [Google Scholar] [CrossRef]
  51. Park, S. Influences of Physical Soil Properties on Drought Severity in the Central Great Plains Based on Satellite Data and a Digital Soil Database. J. Geo. Soc. Korea. 2003, 38, 935–948. [Google Scholar]
  52. Fathi-Taperasht, A.; Shafizadeh-Moghadam, H.; Minaei, M.; Xu, T. Influence of drought duration and severity on drought recovery period for different land cover types: Evaluation using MODIS-based indices. Ecol. Indic. 2022, 141, 109146. [Google Scholar] [CrossRef]
  53. Sousa, J.S.; Neves, J.C.L.; Martinez, H.E.P.; Alvarez, V.H.V. Relationship between coffee leaf analysis and soil chemical analysis. Rev. Bras. Cienc. Solo 2018, 42, e0170109. [Google Scholar] [CrossRef]
  54. Tyree, M.T.; Hammel, H.T. Measurement of turgor pressure and water relations of plants by pressure bomb technique. J. Exp Bot. 1972, 23, 267–282. [Google Scholar] [CrossRef]
  55. Sack, L.; Cowan, P.D.; Jaikumar, N.; Holbrook, N.M. The ‘hydrology’ of leaves: Co-ordination of structure and function in temperate woody species. Plant Cell Environ. 2003, 26, 1343–1356. [Google Scholar] [CrossRef]
  56. Schölander, P.F.; Hammel, H.T.; Bradstreet, E.D.; Hemmingsen, E.A. SAP pressure in vascular plants. Science 1965, 148, 339–346. [Google Scholar] [CrossRef]
  57. Dreyer, E.; Bousquet, F.; Ducrey, M. Use of pressure volume curves in water relation analysis on woody shoots: Influence of rehydration and comparison of four European oak species. Ann. For. Sci. 1990, 47, 285–297. [Google Scholar] [CrossRef]
  58. Ritchie, G.A.; Roden, J.R. Comparison between two methods of generating pressure-volume curves. Plant Cell Environ. 1985, 8, 49–53. [Google Scholar]
  59. Sack, L.; Pasquet-Kok, J. Leaf Pressure-Volume Curve Parameters. Prometheus Wiki. Available online: https://prometheusprotocols.net/ (accessed on 20 May 2024).
  60. Neto, B.C.; Silva, F.; Ferreira, T.; Crasque, J.; Arantes, L.; Filho, J.M.; de Souza, T.; Falqueto, A.; Dousseau-Arantes, S. Responses of wild piper species to drought and rehydration cycles considering stomatal closure as a marker of the alarm phase. Photosynthetica 2023, 61, 363–376. [Google Scholar] [CrossRef] [PubMed]
  61. R Core Team. Available online: https://www.r-project.org// (accessed on 12 December 2024).
  62. Ferreira, E.B.; Cavalcanti, P.P.; Nogueira, D.A. ExpDes: An R package for ANOVA and experimental designs. Appl. M. 2014, 5, 2952–2958. [Google Scholar] [CrossRef]
Figure 1. Pressure–volume (P–V) curve parameters in plants from C. canephora var. Robusta (‘3V’ and ‘A1’ clones) grown under two water availability conditions [well-watered (WW) and water stress (WS)], estimated at the end of the second drought cycle: (a) relative capacitance at zero turgor—C*FT, (b) leaf capacitance at the turgor loss point—CTLP, (c) relative capacitance at full turgor—CFT, (d) saturated water content at saturation—SWC, (e) bulk modulus of elasticity (Ɛ), (f) relative leaf water content at the turgor loss point—RWCTLP, (g) osmotic potential—Ψo, and (h) leaf water potential at the turgor loss point—ΨTLP. Estimated mean ± SE (n = 7) and ANOVA p-values for effects of genotype, water availability, and their interactions are shown (significant when marked in bold). Inside the figures, the different lowercase letters indicate significant differences between the two genotypes for each water regime, while the different uppercase letters indicate significant differences between the two water regimes for each genotype.
Agriculture 15 00574 g001
Figure 2. Representative branch and root xylem vessels measured in plants from C. canephora var. Robusta (‘A1’ and ‘3V’ clones) under well-watered (WW) and water-stress (WS) conditions evaluated at the end of second drought cycle. Branch xylem vessels in (a) ‘A1’-WW, (b) ‘A1’-WS, (c) ‘3V’-WW, and (d) ‘3V’-WS. Root xylem vessels in (e) A1’-WW, (f) ‘A1’-WS, (g) ‘3V’-WW, and (h) ‘3V’-WS. Scale bars of 100 µm are shown.
Agriculture 15 00574 g002
Figure 3. Root and plagiotropic branch xylem anatomy traits of plants from C. canephora var. Robusta (‘3V’ and ‘A1’ clones) grown under two water availability conditions [well-watered (WW) and water stress (WS)], estimated at the end of second drought cycle: (a) plagiotropic branch xylem vessel density, (b) mean xylem area per vessel in a plagiotropic branch, (c) root xylem vessel density, and (d) mean xylem area per vessel in roots. Estimated mean ± SE (n = 7) and ANOVA p-values for effects of genotype, water availability, and their interactions are shown (significant when marked in bold). Inside the figures, different lowercase letters indicate significant differences between the two genotypes for each water regime, while different uppercase letters indicate significant differences between the two water regimes for each genotype.
Agriculture 15 00574 g003
Figure 4. Linear regressions for the dynamics of central leaf vein length elongation in two genotypes of C. canephora var. Robusta (‘3V’ and ‘A1’) grown under two water availability conditions [well-watered (WW) and water stress (WS)], estimated at a frequency of six days during the two subsequent water-stress events: (a) WS–1 event, (b) WS-2 event. Estimated mean ± SE (n = 7) and ANOVA p-values (marked in bold when significant) for effects of time, treatments (two genotypes in the two water regimes) and their interactions are shown. Inside the figures, different lowercase letters indicate significant differences among the four treatments (two genotypes in the two water regimes) for each time-point, while the upper-case letters indicate the time-point difference for each treatment.
Agriculture 15 00574 g004
Figure 5. Changes in the morphological traits (a) plant height, (b) stem diameter, and (c) leaf number of two genotypes of C. canephora var. Robusta (‘3V’ and ‘A1’) grown under two water availability conditions [well-watered (WW) and water stress (WS)], estimated during two subsequent water-stress events [water-stress event 1 (WS–1) and water-stress event 2 (WS–2) indicated by red arrows at the beginning of the event and by blues arrows when rewatering started], over 12 time-points. Estimated mean ± SE (n = 7) and ANOVA p-values for effects of genotype, water conditions, time and their interactions are shown (significant when marked in bold). Inside the figures, different lowercase letters indicate significant differences between the two genotypes within each water regime at each time-point, whereas different uppercase letters indicate significant differences between the two water regimes within each genotype at each time-point. Additionally, the different superscript letters indicate significant differences among the time-points within each genotype and water regime (blue for WW and red for WS).
Agriculture 15 00574 g005
Figure 6. Final plant leaf area of two C. canephora var. Robusta genotypes (‘3V’ and ‘A1’) grown under two water availability conditions [well-watered (WW) and water stress (WS)], estimated at the end of the second drought cycle. Estimated mean ± SE and ANOVA p-values for effects of water availability, genotype (significant when marked in bold) are shown (n = 7). The different lowercase letters indicate significant differences between the two genotypes for each water regime, while the different uppercase letters indicate the significant differences between the two water regimes for each genotype.
Agriculture 15 00574 g006
Figure 7. Biomass responses after the two subsequent water-stress events: (a) biomass allocation in leaves, plagiotropic branches, orthotropic branches and roots; (b) root biomass distribution over the vertical soil profile of two C. canephora var. Robusta genotypes (‘3V’ and ‘A1’) grown under two water availability conditions [well-watered (WW) and water stress (WS)], estimated at the end of second drought cycle. Estimated mean ± SE (n = 7) and ANOVA p-values for effects of genotype, water availability, and their interactions (significant when marked in bold) are shown. Inside the figures, the different lowercase letters indicate the significant difference between the two genotypes for each water regime and for each depth. Different uppercase letters indicate significant differences between the two water regimes for each genotype and for each depth, while the overwritten numbers indicate differences between the four depth layers for each genotype and for each water regime.
Agriculture 15 00574 g007
Figure 8. Graphical presentation of coefficients (values corresponding to circles and color intensities) and p-values (significant at <0.05, not crossed circles, n = 14) for correlations among some of above-ground plant parameters: leaf net assimilation rate (Anet, μmol m−2 s−1), leaf transpiration rate (E, mmol m−2 s−1), water use efficiency (WUE, mmol CO2 mol−1 H2O), leaf xylem vessel density (LXVD), leaf xylem vessel area (LXVA), leaf water potential (WatPot, MPa), Eta—bulk modulus of elasticity (Ɛ), relative leaf water content at the turgor loss point (RWCTLP), branch xylem vessel density (BXVD), branch xylem vessel area (BXVA), plant leaf area (LA), total, leaf, orthotropic branch and plagiotropic branch dry mass (TDM, LDM, OBDM and PBDM), respectively. Correlations to below-ground plant parameters include root dry mass (RDM), root xylem vessel density (RXVD), root xylem vessel area (RXVA), and root dry mass over the four soil layers (RDM_1 to RDM_4)]. All parameters obtained from C. canephora var. Robusta (clones ‘3V’ and ‘A1’) plants grown under two water availability conditions: (a) well-watered (WW) and (b) water stress (WS), estimated at the end of second drought cycle. Green flashes indicate above- and brown flashes indicate below-ground parameters. Note that Anet, E, WUE, WatPot, LXVD, LXVA values used here for correlations, were obtained in [30] under the same conditions as the results shown in this experiment by the end of the second WS cycle.
Agriculture 15 00574 g008
Figure 9. Diagram of the two drought cycles. Transplant followed by the first water restriction event lasted for 19 days (until <−500 kPa of ΨmSoil was reached), followed by a 31-day period for complete plant recovery (including a 12-day period for the first recovery event). The second water restriction cycle was then applied, similar to the 1st one, by withholding irrigation until <−500 kPa of ΨmSoil was reached, followed by another 12 days for the second recovery event.
Agriculture 15 00574 g009
Disclaimer/Publisher’s Note: The statements, opinions and data contained in all publications are solely those of the individual author(s) and contributor(s) and not of MDPI and/or the editor(s). MDPI and/or the editor(s) disclaim responsibility for any injury to people or property resulting from any ideas, methods, instructions or products referred to in the content.

