1. Introduction
Wheat is an important grain crop in our country, and it is now commonly sown by mechanical seeding and strip sowing methods, which have problems such as high seed usage and rough sowing methods, thus affecting the quality of sowing operations and yield [
1,
2]. Therefore, the adoption of a precise seeding method is of great significance for wheat sowing operations. The selection of operation parameters during the seeding process has a significant impact on the operation quality of the precise seeding device. To meet the requirements of high-speed precise operations, currently, mechanical and pneumatic acceleration seeding methods are mostly adopted to achieve the high-speed and precise placement of wheat seeds. The operation parameters of the acceleration seeding device have great significance for improving the operation quality and efficiency of wheat sowing. The research on wheat accelerated seeding technology mainly focuses on seeding angle, seeding device structure design, and seeding height. There are few studies on the selection of seed parameters, seeding velocity parameters, and seeding soil parameters.
In recent years, relevant research has been conducted on domestic and international wheat seeding technology. Wang Yingbo [
3,
4] and others used mechanical shot seeding and analyzed the seed movement inside the seed dispenser, as well as conducted bench tests, and finally optimized the parameters of the mechanical shot seeding dispenser for wheat through TRIZ theory. The Chrono high-speed seeder developed by Maschio in Italy utilizes airflow seed delivery technology, which uses high-speed airflow to deliver seeds to ensure plant spacing uniformity [
5]. However, there are fewer studies on the interaction relationship between wheat seed, soil, and seed impact damage under high-speed seed-casting modes. This study will clarify the interaction and damage relationship between wheat seeds and soil during their burial process and determine the influence of operational parameters on the depth of sowing, the germination rate of sown seeds, and the yield and quality of sowing operations. In terms of particle impact and seed-casting motion, EDEM is mostly used to study the impact crushing process and seed motion. EDEM software (2018) can conduct clear calculations and simulations for the forces acting on the seed particle model during the process of impact into the soil, and can also clearly display the sowing process and effect. Gabriel K.P. Barrios [
6] et al. used EDEM software (2018) to simulate the process of iron ore pellet bed fragmentation under impact and conducted simulation analysis on the normal and tangential loading impact loads in the system. Mehrdad Pasha [
7] et al. used the discrete element method (DEM) to simulate the influence of particle shape on the motion and mixing in seed coating machines, demonstrating that for a fast-shearing system with short collision contacts, a small number of aggregated spheres are sufficient to provide reasonable consistency with experimental results. Ma Chengcheng [
8] et al. used EDEM software (2018) to build a model of corn seeds, a non-spherical particle, to simulate the motion process and stress analysis of seeds in a belt high-speed corn sowing device. Zhou Long [
9] et al. used simulation analysis to study the bouncing displacement of seeds in the seeding process to optimize the structure and working parameters of related mechanical components. The above studies provide a theoretical basis for the accelerated seed-casting technology of wheat and confirm that the discrete element method has a reference value for the analysis of particle impact.
Therefore, this study is based on EDEM simulations of the impact of different operational parameters on wheat seed impact into the soil, facilitating further experimental research. A single-factor, orthogonal test to study the influence factors of seed impact depth and maximum impact force in accelerated seeding technology, and bench test was used to verify the simulation results. This fills in the gap in the literature of technical research content in relation to wheat rapid seeding technology in terms of the technical parameters of wheat rapid seeding, wheat seed particle parameters, and soil parameters, providing a theoretical basis for the parameter selection and application of wheat rapid seeding technology.
2. Materials and Methods
2.1. Wheat Seed Particle Modeling
In this paper, the accelerated seeding technology of winter wheat in North China was studied, so Nongda 215 grain wheat was selected. The wheat grain shape is a sphere or oval [
10]. In order to simplify the analysis, wheat seed is regarded as an equivalent spherical seed for this study [
11,
12,
13]; that is, the single ball model is selected as the wheat seed model in EDEM for the analysis of wheat impact into soil.
Seed equivalent diameter
X1 is the basis of the theoretical analysis and numerical calculation of wheat seed acceleration characteristics, so the water volume method was used to measure the equivalent diameter of wheat seeds and electronic balance was used to weigh out 10 portions of wheat seeds, each weighing 300 g, and then count the number
ai of wheat grains. Then, 200 mL of water was measured with a measuring cylinder (measuring range of 500 mL and accuracy of ±5 mL). Pour one portion of wheat seed at a time into the measuring cylinder; then, read and record the mixture volume
.
In the formula, is the mixture volume;
ai is the number of wheat grains;
The equivalent diameter X1 of the seed is 3~5 mm.
According to the measurement of the physical parameters of wheat and the literature analysis, the discrete element simulation characteristic parameters of wheat are shown in
Table 1 [
4].
2.2. Soil Particle Model
In North China, the sowing soil after rotational tillage in the annual two-cropping area is typical loam soil, and the soil particle structure mainly includes granular particles and clump particles [
14,
15]. The simplified treatment of the soil model can make the simulation and calculation reasonable and adequate. Therefore, the single-sphere model with uniform size is used as the soil particle model in EDEM. According to the physical characteristics of sandy loam and the literature analysis [
4,
16], the parameters of the soil particle discrete element model are set, as shown in
Table 2.
2.3. Soil Contact Modeling
Selecting an appropriate soil contact model is the foundation for ensuring the accuracy of simulation operations. The existing EDEM software (2018) includes contact models such as Hertz–Mindlin, Hertz–Mindlin with JKR, and Hysteretic Spring. For studying the influence of soil moisture content and compactness on the impact penetration of wheat seeds into the soil, the Hertz–Mindlin with JKR contact model is more suitable. This model emphasizes the role of surface energy in soil and introduces the concept of cohesion, enhancing the simulation capability for strongly adhesive particle systems mainly composed of dry powder or wet materials. It ensures the consistency of calculations and the accuracy of physical behavior in calculating tangential force, tangential damping force, and normal damping force. The normal force calculation considers the influence of van der Waals forces within the contact area, enabling a more realistic simulation and reflection of possible adhesion phenomena between particles. It can better demonstrate the interaction and motion state of soil and seed particles. According to the characteristics of the sandy loam soil selected in this study, which is incompressible and has a relatively large cohesion, the Hertz–Mindlin with JKR contact model is chosen as the soil model [
17].
2.4. Simulation Parameter Determination
To simulate the impact process, as shown in
Figure 1, a cylindrical soil tank model with a diameter of Φ20 mm and length of 50 mm was set up to load soil particles through EDEM’s built-in geometry generation function. Set the formation of soil particles from the particle factory in the upper part of the soil tank and generate 100,000 soil particles at the generation rate of 200,000 per second. Set the initial velocity of soil particles at 1 m/s, which is the same direction as gravity, and the soil particles will accumulate under the action of initial velocity and gravity to produce a certain thickness of the soil layer. This results in the Wheat Grain Factory.
Other parameters of wheat seed impact in the soil model were set through the pretreatment module, and the specific parameters of the model were determined according to the literature [
4], as shown in
Table 3.
After the completion of soil accumulation, the wheat seed model was generated from the particle factory above the soil tank, and the accelerated seeding simulation test was carried out according to the set initial speed. A fixed time step of 1.21 × 10⁻⁵ s (20% of Rayleigh time step) was set to ensure the continuity of the simulation. The total time spent in the simulation was 0.52 s. The 0.75 mm grid cell size was set, and the data storage interval was 1 × 10⁻⁵ s to obtain accurate data.
3. Single-Factor Test and Analysis
3.1. Experimental Factors and Evaluation Indexes
According to the references, the main factors affecting the accelerated seeding technology are seeding speed, wheat seed equivalent diameter, and soil water content [
18]. This study investigates the influence of a single factor on the experimental results by controlling the consistency of other variables and uniformly assigns values to the single variable under investigation. According to the references, the adopted soil moisture content ranges from 15 to 22%, and the soil compactness ranges from 25.2 to 33.6 kPa [
4]. In the Hertz–Mindlin with JKR simulation model, surface energy is mostly used to represent the changes in soil conditions caused by changes in soil moisture content. According to the references [
4] and the GEMM database of EDEM software (2018), a soil surface energy of 0.5~6.5 J/m
2 was selected [
4,
19]. According to the actual wheat accelerated seeding operation parameters, the seeding speed was selected to be 25~65 m/s. The single-factor experimental data are shown in
Table 4.
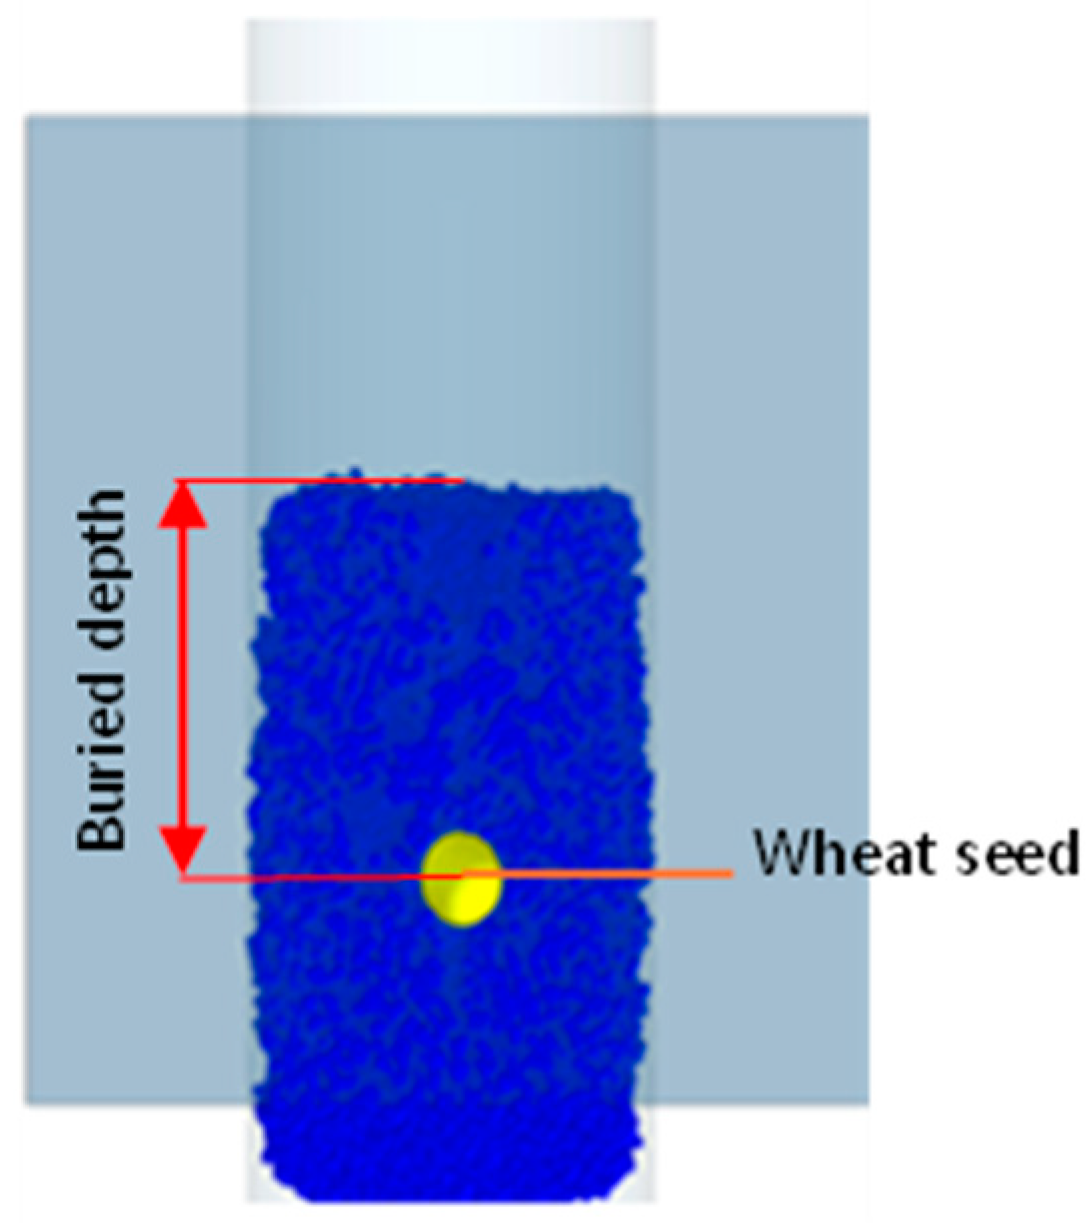
Soil depth is an important index to measure the reasonability of accelerated seeding technology and can also reflect the working effect of seeding devices under different soil conditions [
20,
21,
22]. As shown in
Figure 2, the distance between the wheat seed center and the soil surface was taken as the incident depth in this study.
The maximum impact on small and medium wheat seeds during the process of wheat seed implantation by accelerated seeding technology is an important index to test whether the parameters of the seeding device are reasonable [
23,
24,
25]. Using the post-processing function of EDEM, the impact force is taken as the vertical axis during the impact process. The simulation time is taken as the horizontal axis to obtain the relationship between the impact force and time. The impact force change of the particles during the wheat embedding process is derived from analyzing the maximum impact force.
3.2. Equivalent Diameter X1
3.2.1. Seed Depth Analysis
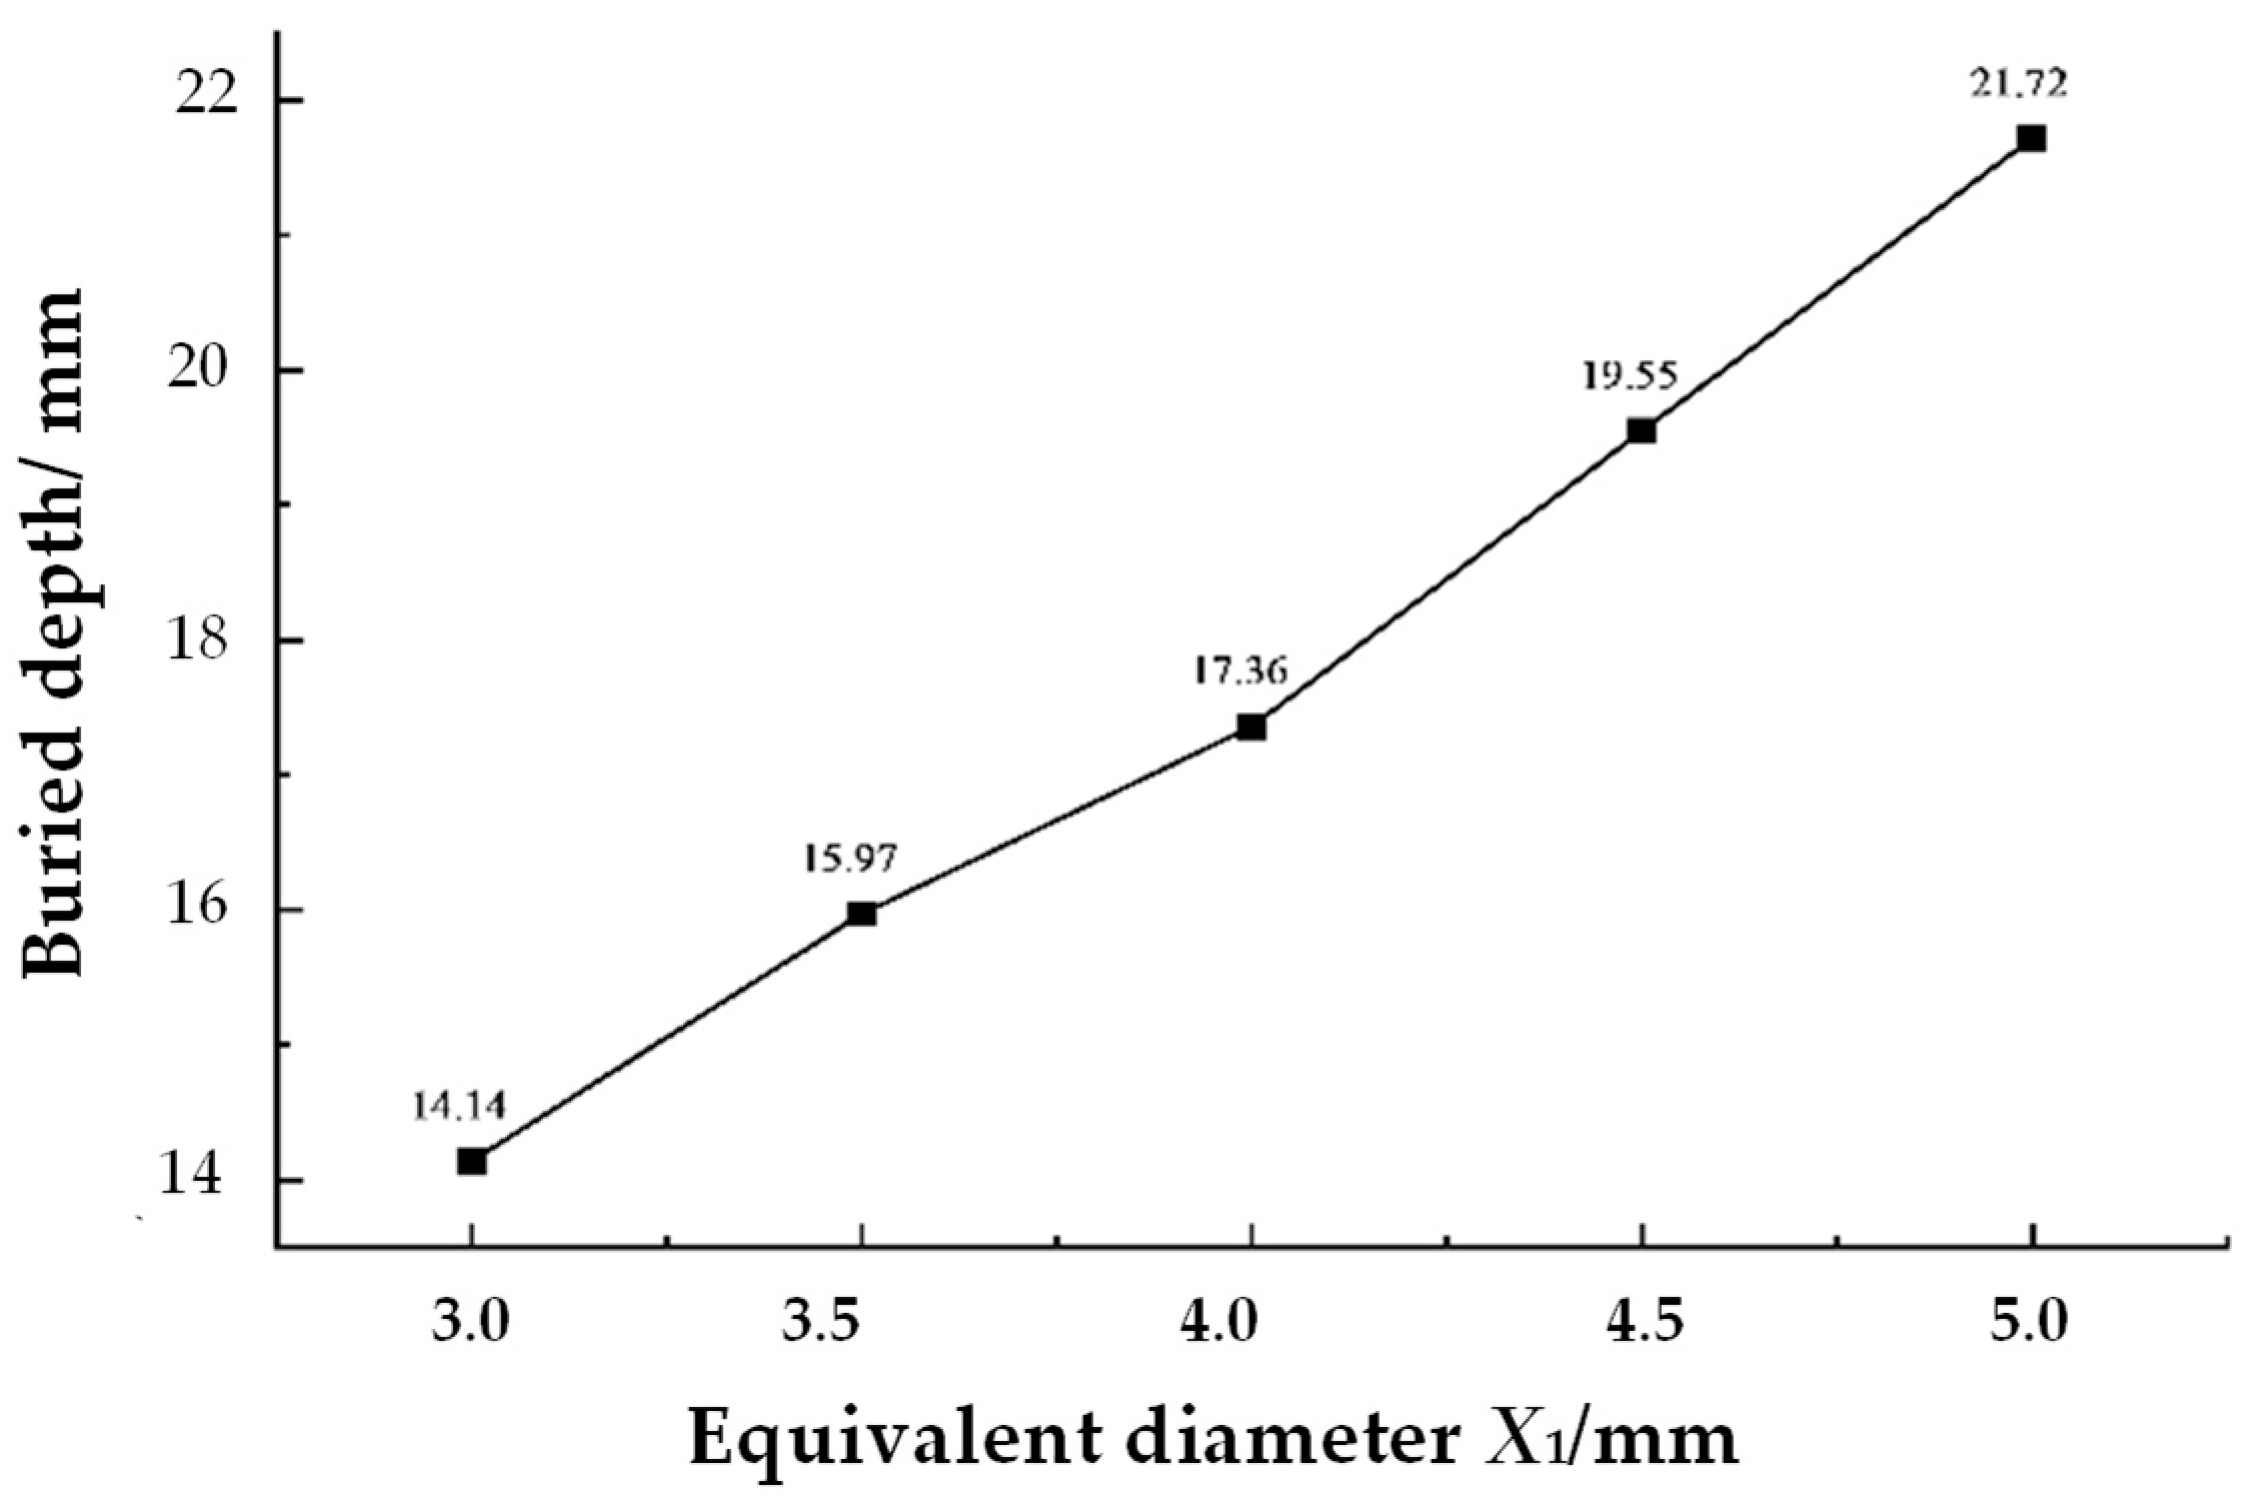
To verify the influence of different equivalent diameters
X1 on the soil depth of the wheat seeds with accelerated seeding technology, maintaining consistency in factors such as the speed of sowing operation, soil surface conditions, etc., a single-factor test was conducted on five kinds of seeds with different equivalent diameters, and the simulation results of soil depth are shown in
Figure 3.
As shown in
Figure 3, within the range of the equivalent diameter of wheat seeds from 3.00 to 5.00 mm, the penetration depth increases with the increase in the equivalent diameter of wheat seeds, and the increase rate is relatively uniform. When the equivalent diameter of wheat seeds is 3.00 mm, the minimum penetration depth is 14.14 mm, and when the equivalent diameter of wheat seeds is 5.00 mm, the maximum penetration depth is 21.72 mm. This is because under the same sowing speed and soil surface energy conditions, the larger the equivalent diameter of wheat seeds, the greater the mass of the wheat seeds. Greater mass means greater kinetic energy when contacting the soil, and thus a greater penetration depth.
3.2.2. Analysis of Maximum Impact Force
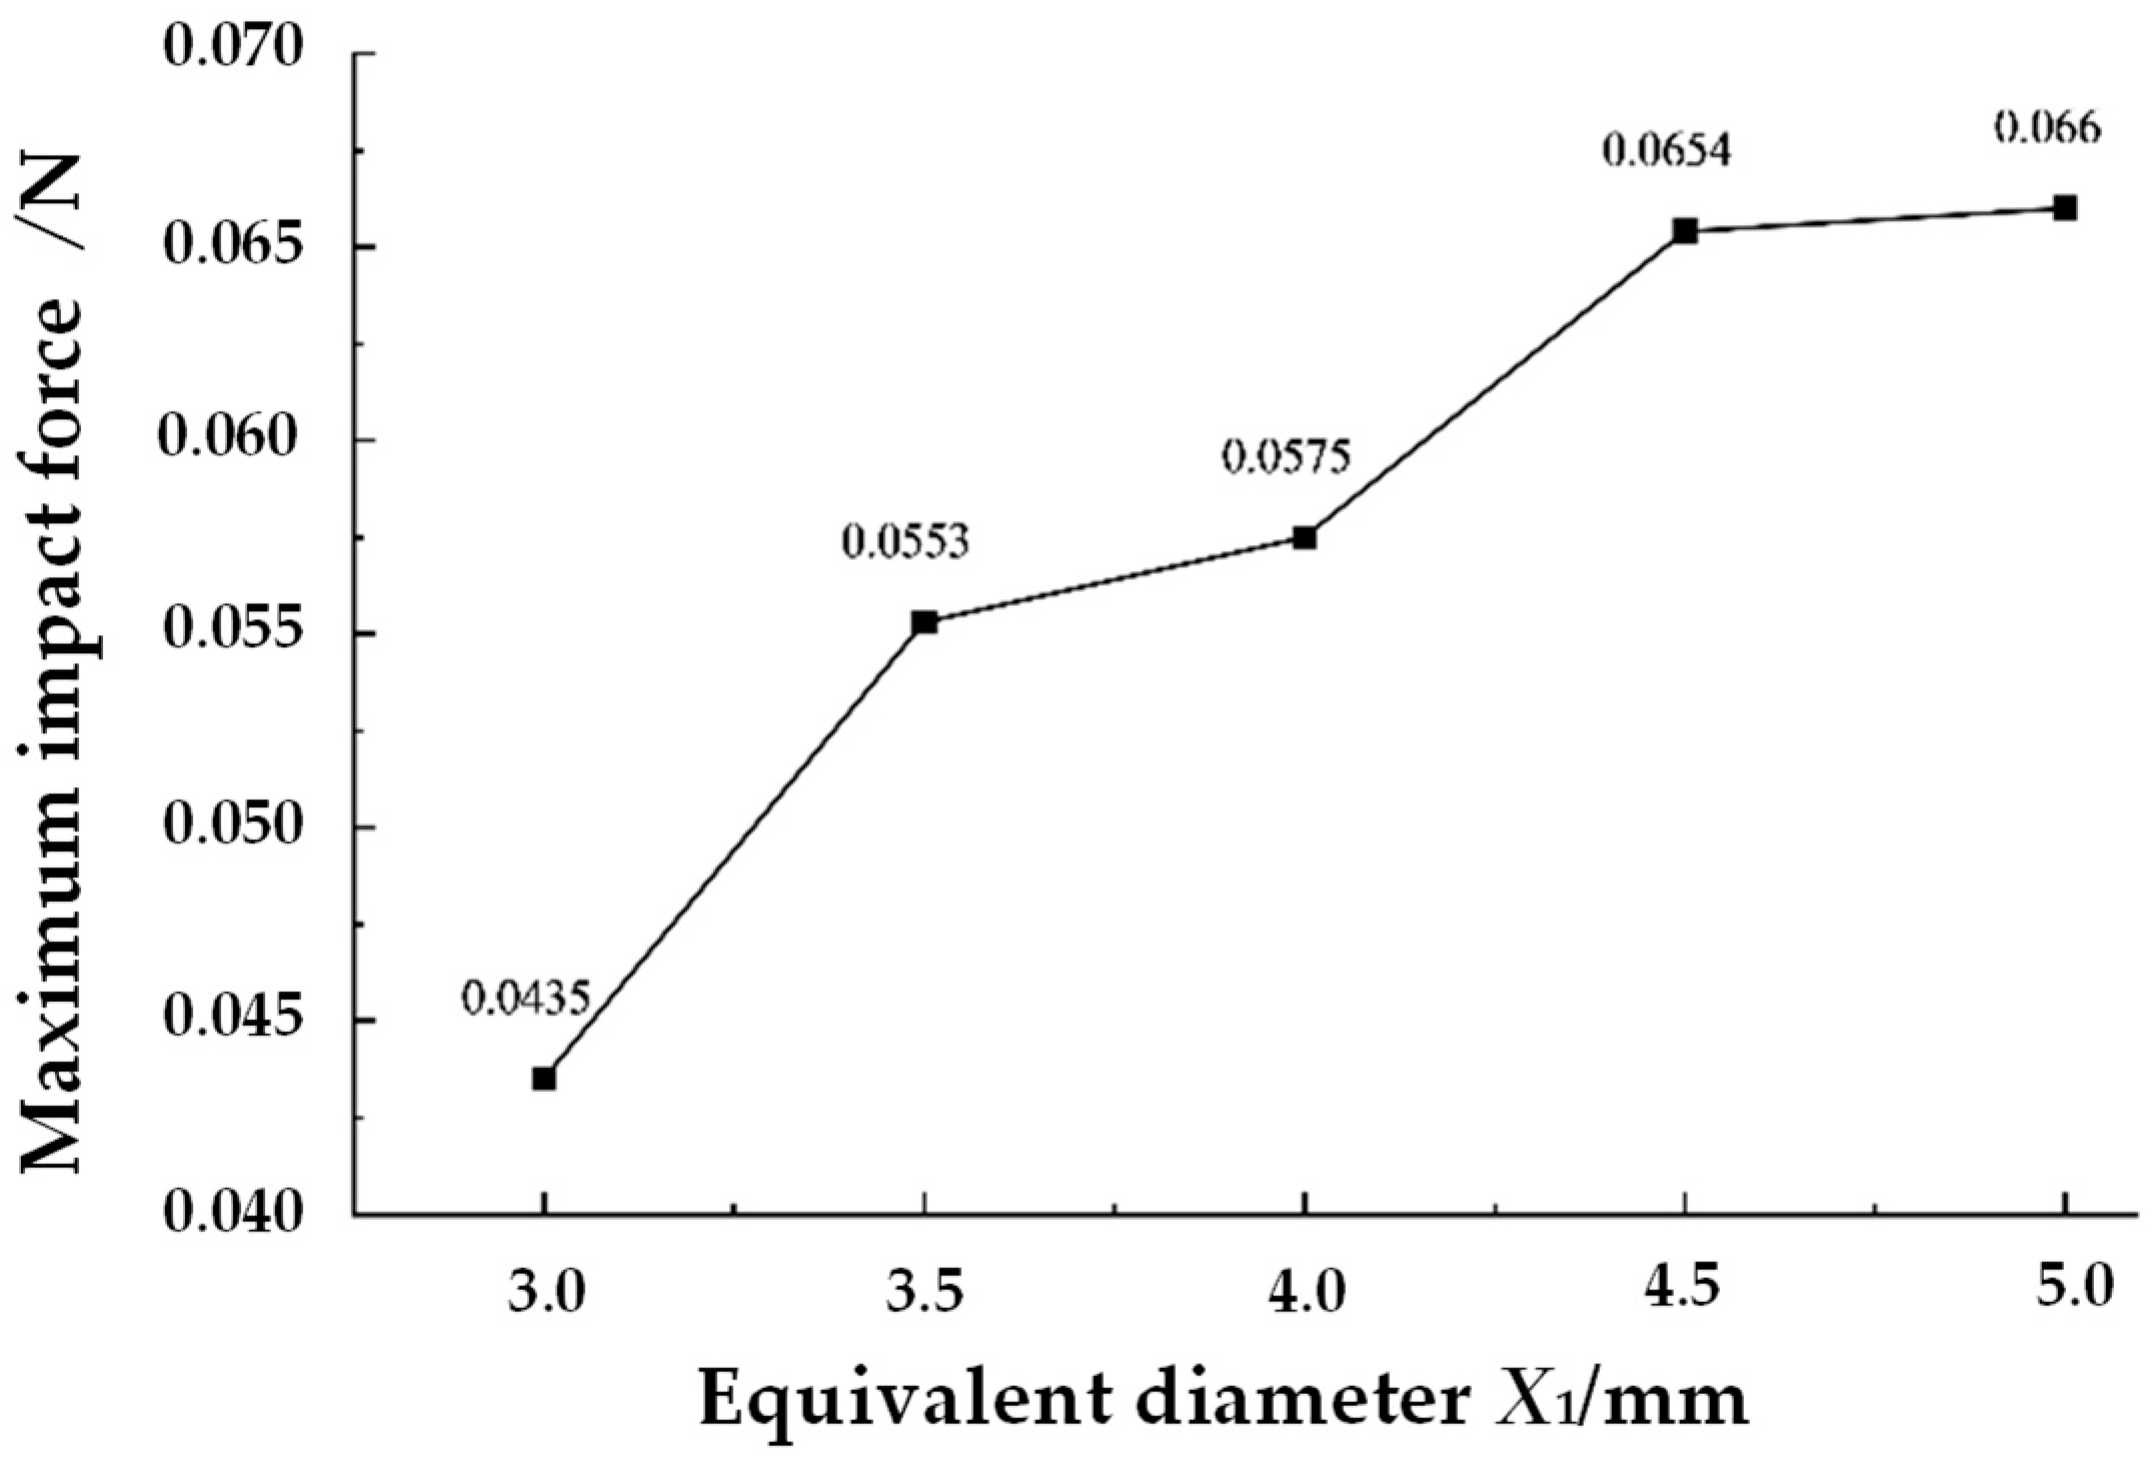
To maintain consistency in factors such as the speed of sowing operation, soil surface conditions, etc., a single-factor experiment was conducted with five levels of equivalent diameters to verify the influence of different equivalent diameters
X1 on the maximum impact force during the process of entering the soil. The simulation results of the maximum impact force are shown in
Figure 4.
From
Figure 4, it can be seen that within the range of equivalent diameters of 3.00 mm to 5.00 mm, the maximum impact force of wheat seeds entering the soil through the accelerated seeding technology generally increases with the increase in the equivalent diameter of the wheat seeds, but the growth rate is not uniform. The maximum impact force has a minimum value of 0.0435 N in the equivalent-diameter single-factor experiment when the equivalent diameter of the wheat seeds is 3.00 mm. The maximum impact force has a maximum value of 0.0660 N in the equivalent-diameter single-factor experiment when the equivalent diameter of the wheat seeds is 5.00 mm. This is because, under the condition where the moisture content of the wheat seeds, soil texture, sowing speed, and other factors are all the same, when the equivalent diameter of the wheat seeds increases, the wheat seeds will have greater kinetic energy and momentum when they impact the soil, thereby generating a larger impact force.
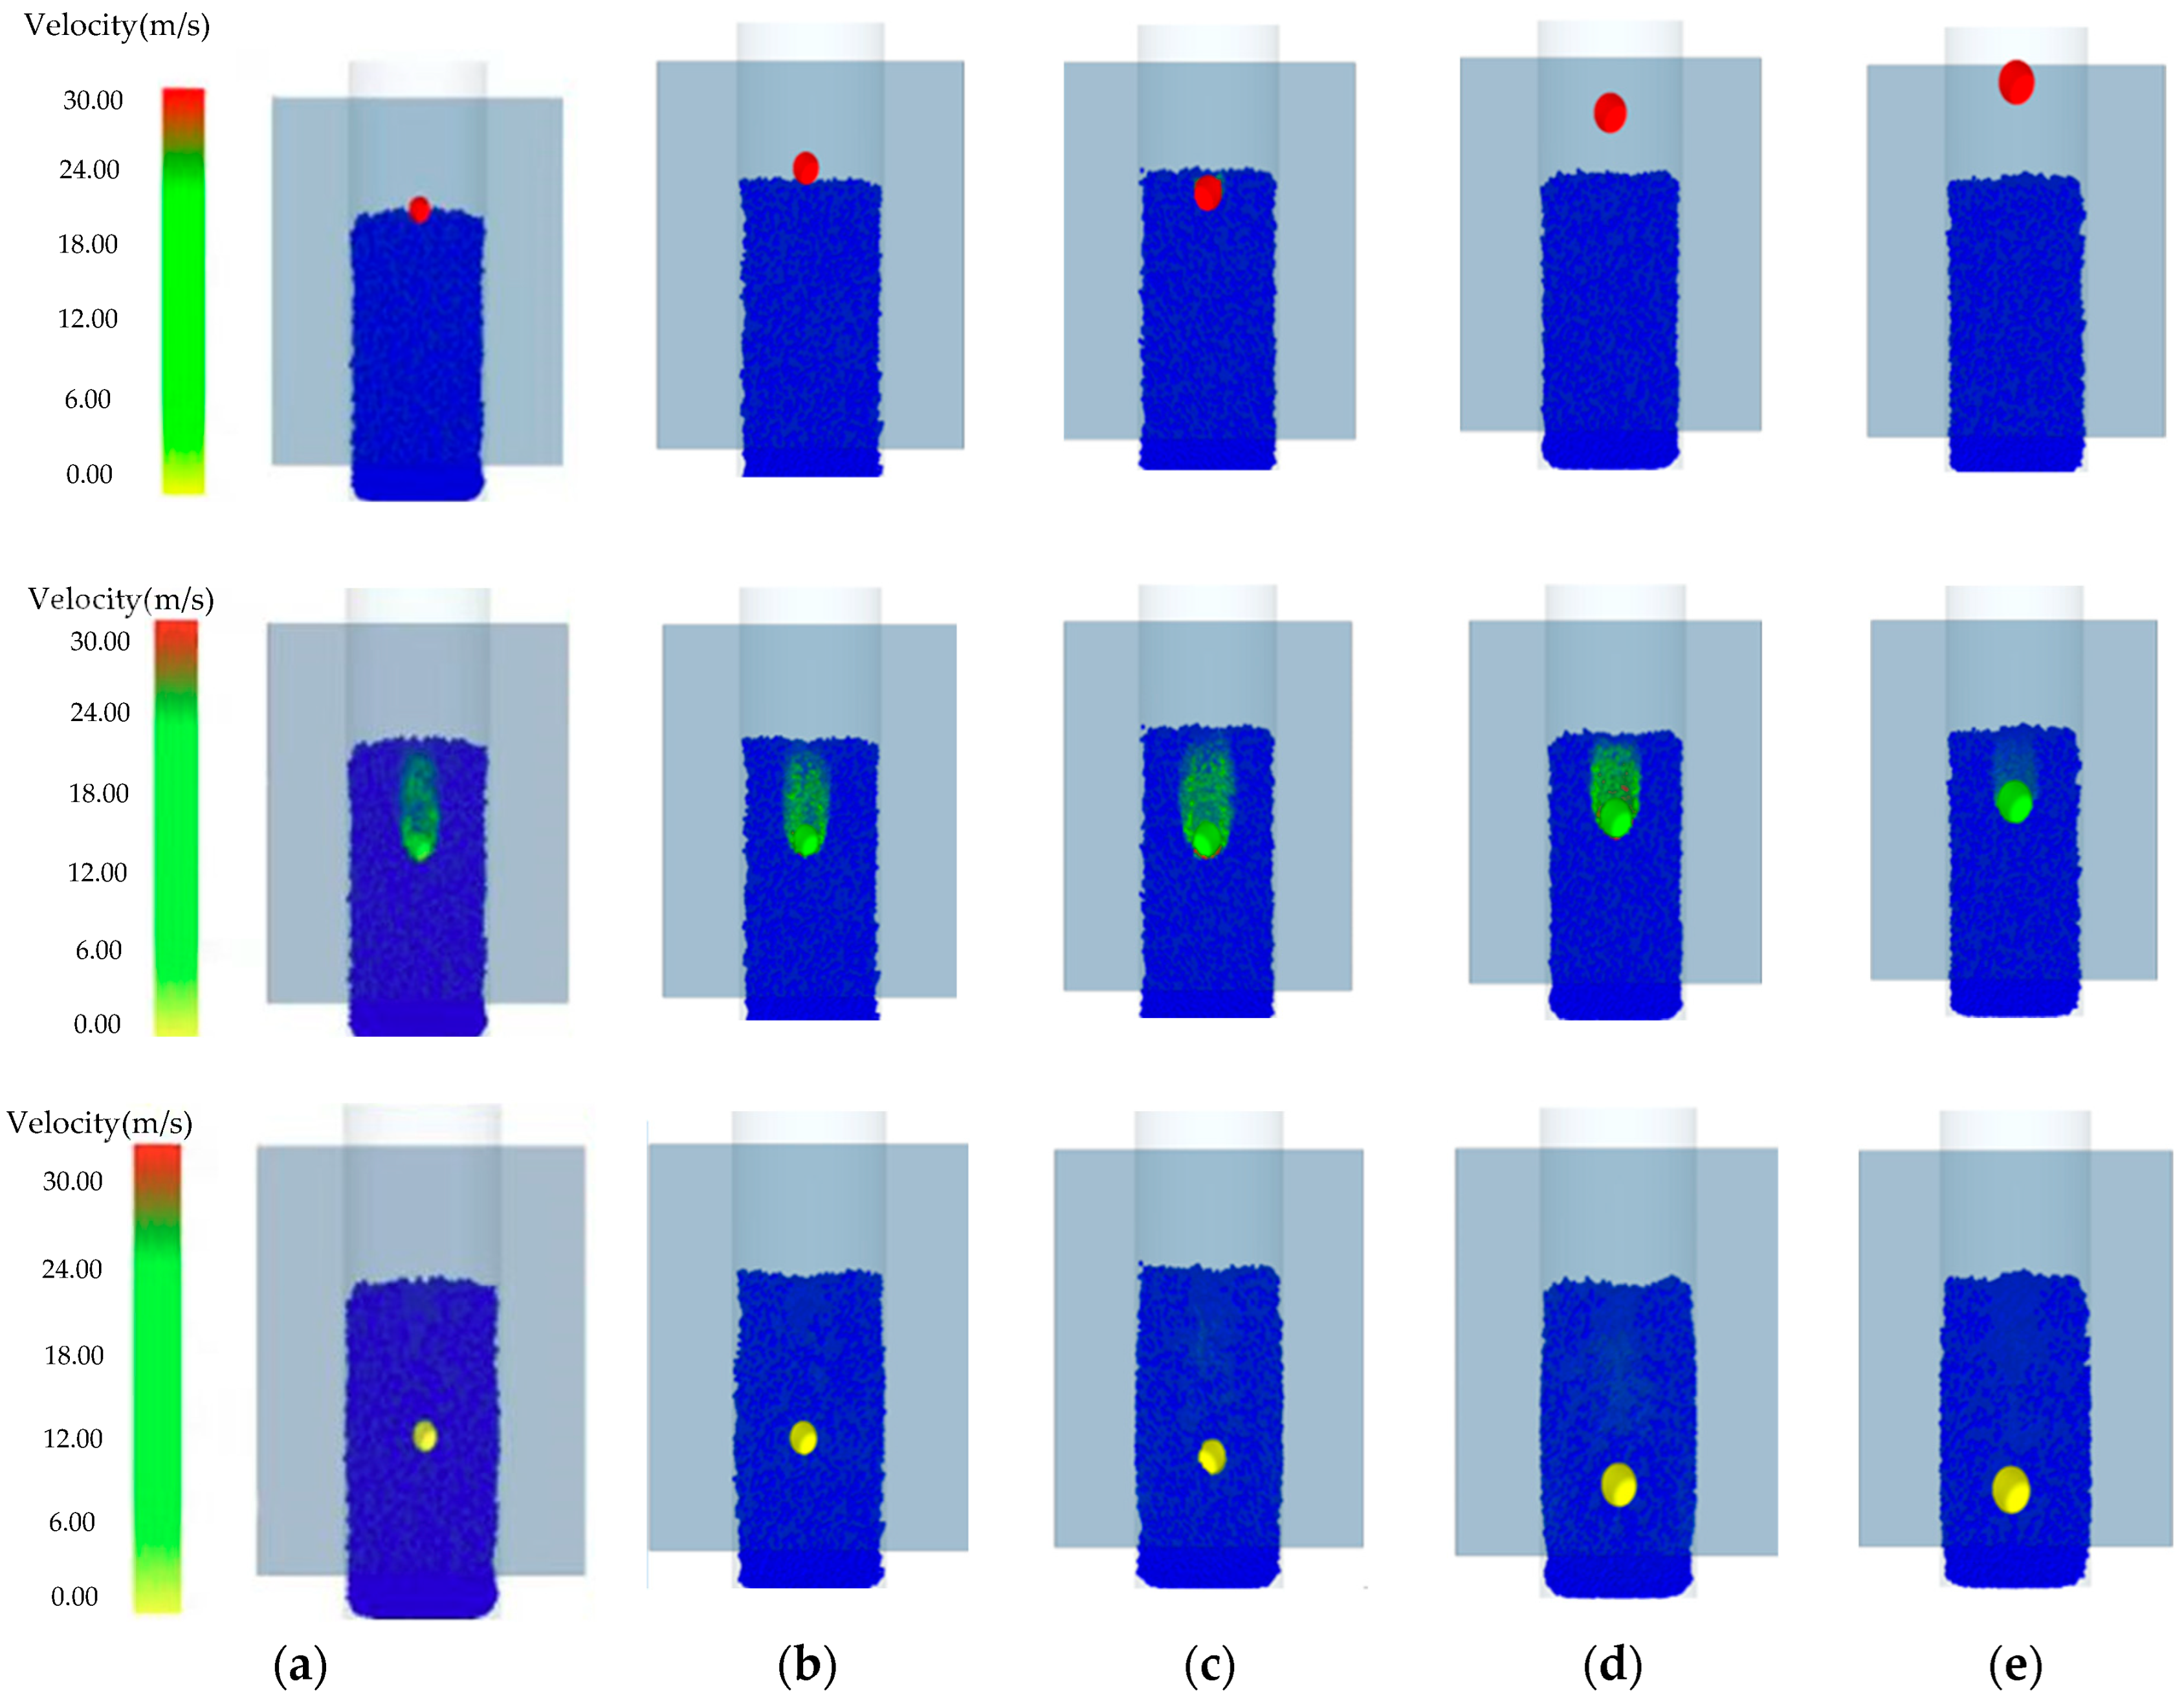
From the experimental results shown in
Figure 5, it can be further observed that the equivalent diameter of the seeds and the sowing depth show a positive correlation trend.
3.3. Seeding Speed X2
3.3.1. Seed Depth Analysis
We controlled factors such as the equivalent diameter of control volume and soil surface energy to be consistent. Five levels of seeding speed were set for the single-factor test to verify the influence of different seeding speeds
X2 on the penetration depth. The simulation results of penetration depth are shown in
Figure 6.
As shown in
Figure 6, when the wheat seeding speed is within the range of 25 m/s to 55 m/s, the soil penetration depth increases significantly with the increase in the seeding speed, and the increase rate is relatively uniform and linear. When the seeding speed increases from 55 m/s to 65 m/s, the rise in soil penetration depth is particularly significant. At a wheat seeding speed of 25 m/s, the minimum soil penetration depth is 11.38 mm, and at a wheat seeding speed of 65 m/s, the maximum soil penetration depth is 25.08 mm. This is because as the seeding speed increases, the wheat seeds’ initial velocity and kinetic energy when they contact the soil increase, thus achieving a deeper soil penetration depth.
3.3.2. Analysis of Maximum Impact Force
We controlled factors such as the equivalent diameter of control volume and soil surface energy to be consistent. Five levels of seeding speed were set for the single-factor test to verify the influence of different seeding speeds
X2 on the maximum impact force. The simulation results of the maximum impact force are shown in
Figure 7.
As shown in
Figure 7, within the range of wheat seeding speed from 25 m/s to 65 m/s, the maximum impact force upon entering the soil increases significantly with the increase in the equivalent diameter of the wheat seeds, but the growth rate is not uniform. This is because the seeding speed increases the wheat seeds’ initial velocity and kinetic energy when they come into contact with the soil. The growth rate is relatively fast within the range of 25 m/s to 45 m/s, but slows down within the range of 45 m/s to 65 m/s. When the seeding speed is 25 m/s, the maximum impact force that the wheat experiences during the process of being impacted into the soil has a minimum value of 0.0316 N in the single-factor experiment of seeding speed. When the seeding speed is 65 m/s, the maximum impact force that the wheat experiences during the process of being impacted into the soil has a maximum value of 0.0704 N in the single-factor experiment of seeding speed.
From the experimental results shown in
Figure 8, it can be further observed that the planting speed and the planting depth are positively correlated.
3.4. Soil Surface Energy X3
3.4.1. Seed Depth Analysis
To verify the influence of different soil surface energy
X3 on soil penetration depth, we controlled factors such as the equivalent diameter of the control and the sowing speed to be consistent. Soil surface energy was set at five levels to conduct a single-factor test. The simulation results are shown in
Figure 9.
As shown in
Figure 9, within the range of soil surface energy from 0.5 to 6.5 J/m
2, the penetration depth decreases as the soil surface energy increases. The decrease in penetration depth is relatively slow when the soil surface energy rises from 2.0 J/m
2 to 3.5 J/m
2, but it drops rapidly from 3.5 J/m
2. The minimum penetration depth of 14.73 mm occurs at a soil surface energy of 6.5 J/m
2, while the maximum penetration depth of 19.36 mm is observed at a soil surface energy of 0.5 J/m
2. This is because the soil surface energy is mainly related to factors such as soil compactness and soil moisture content. Therefore, when the soil surface energy increases, the cohesion and resistance between the soil layers also increase, resulting in a decrease in the depth at which seeds are impacted into the soil.
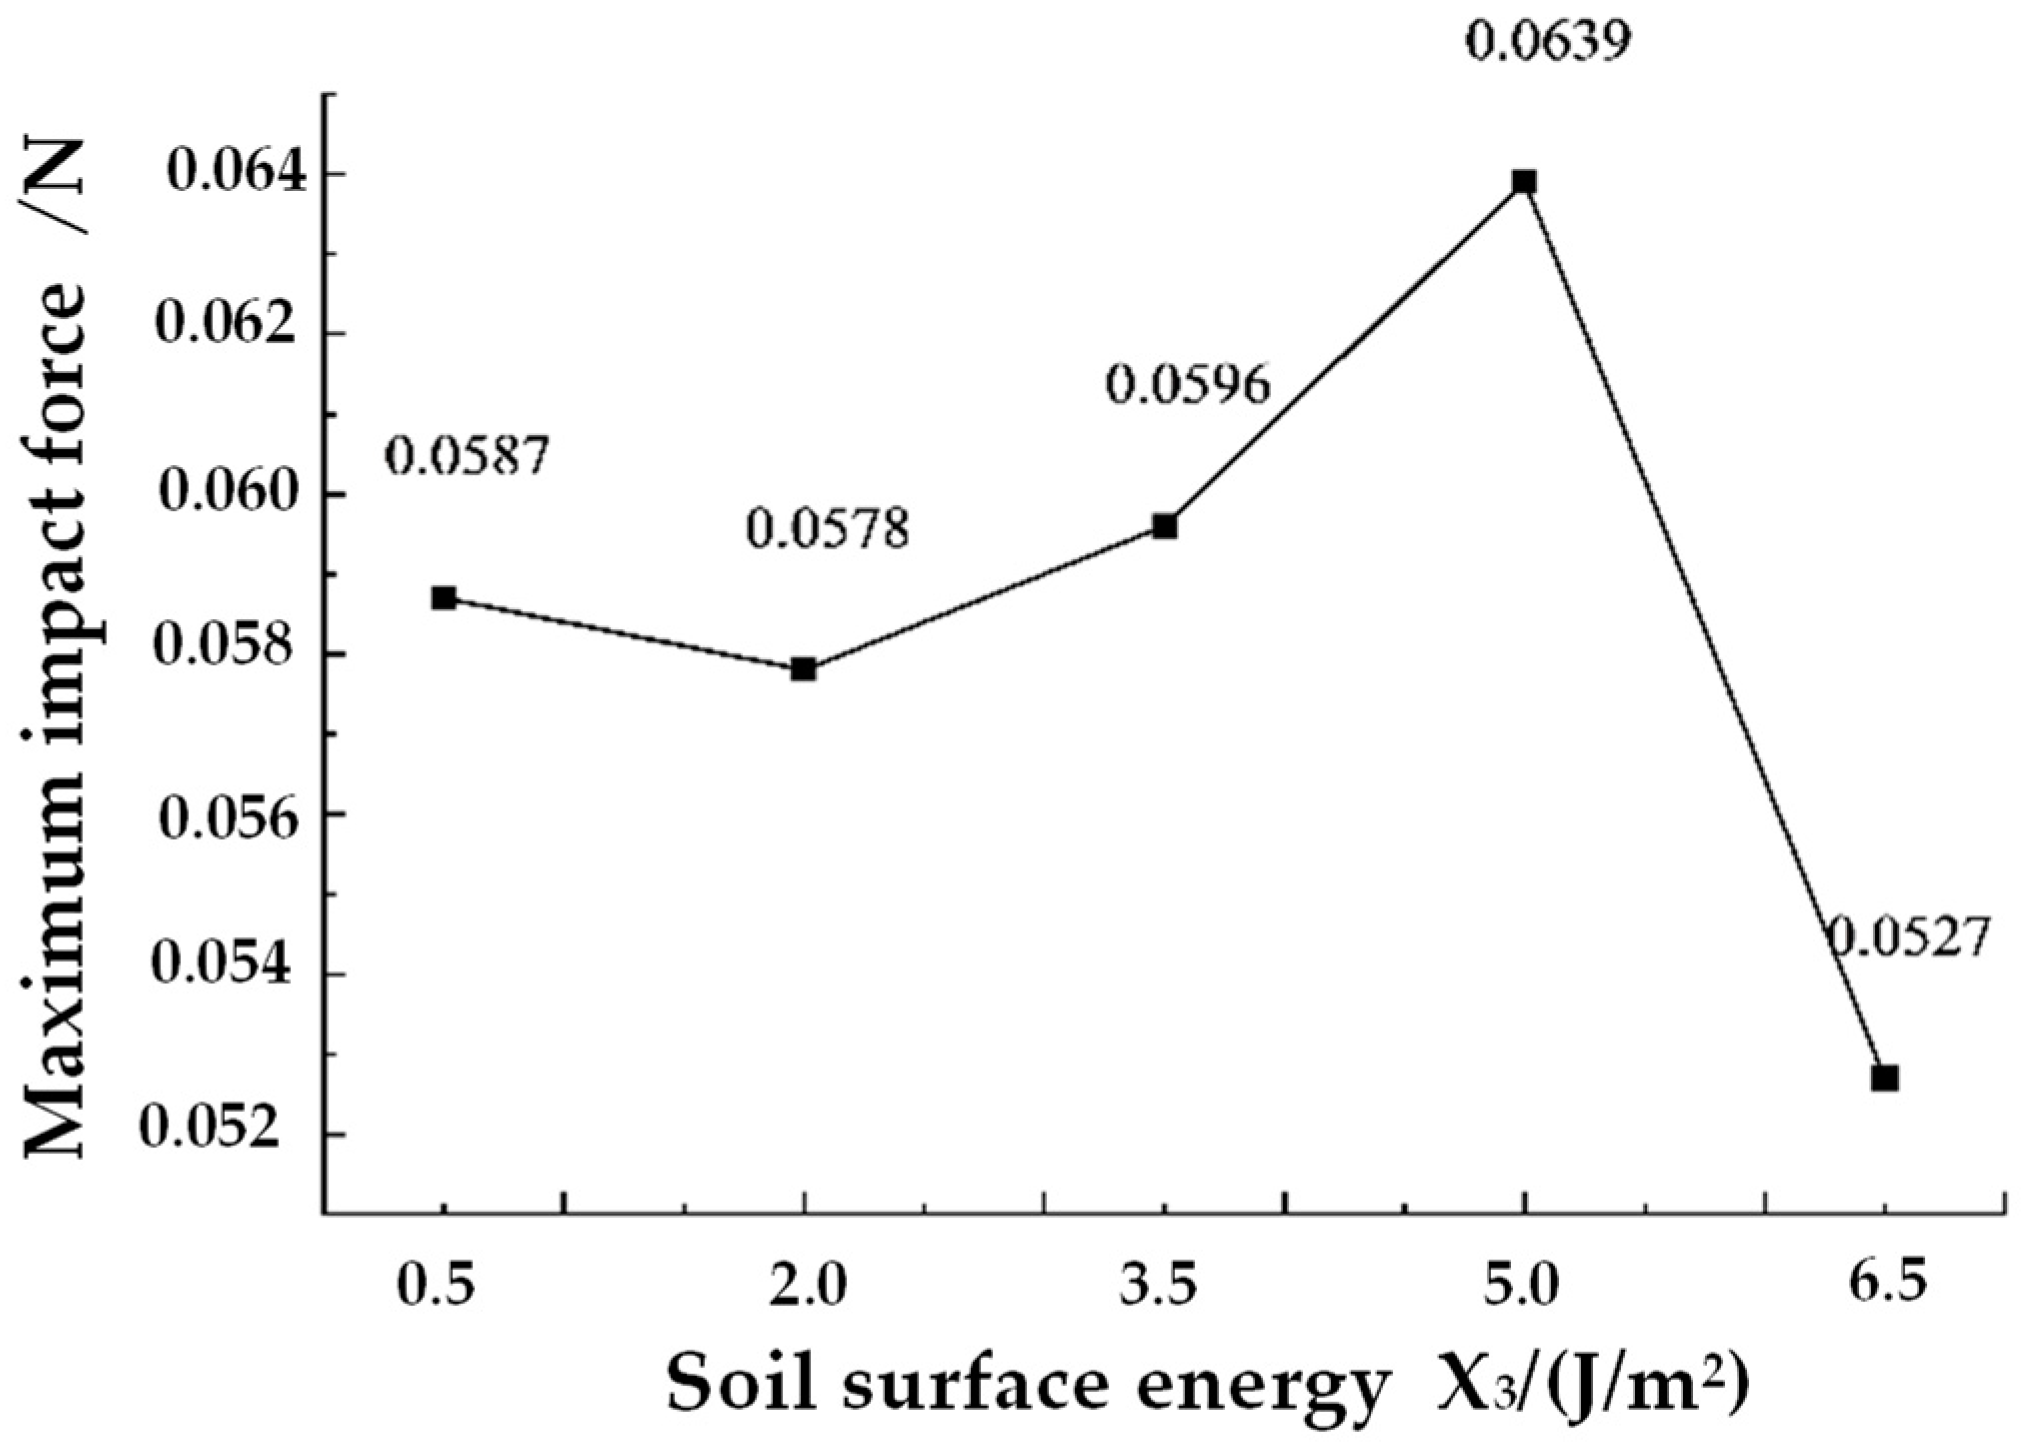
3.4.2. Analysis of Maximum Impact Force
To verify the influence of different soil surface energy
X3 on the maximum impact force, we controlled factors such as the equivalent diameter of the control and the sowing speed to be consistent. Soil surface energy was set at five levels to conduct a single-factor test. The simulation results are shown in
Figure 10.
As can be seen from the simulation results in
Figure 10, within the range of soil surface energy from 0.5 to 6.5 J/m
2, the variation trend of the maximum impact force with soil surface energy
X3 is parabolic. Within the range of 0.5 to 6.5 J/m
2, excluding the influence of random factors, the maximum impact force increases with the increase in soil surface energy. However, within the 5.0 to 6.5 J/m
2 range, the maximum impact force rapidly decreases with the rise in soil surface energy. This is because soil surface energy
X3 reflects soil moisture content. When the soil moisture content is too low, the cohesion between soil particles is relatively low. As the soil moisture content increases, the cohesion between soil particles rises, increasing the maximum impact force during the soil penetration process. When the soil moisture content is too high, the distance between soil particles increases, reducing the cohesion [
26,
27,
28], and thus the maximum impact force decreases.
From the experimental results shown in
Figure 11, it can be further observed that there is a negative correlation trend between the soil surface energy and the sowing depth.
4. Orthogonal Experiment and Analysis
4.1. Experimental Factor Level
According to the results of the single-factor experiment, to further analyze the significant effects of wheat seed equivalent diameter, seeding velocity, and soil surface energy on soil depth and maximum impact force, a three-factor and three-level orthogonal test was carried out with wheat seed equivalent diameter (A), seeding velocity (B), and soil surface energy (C) as test factors. Orthogonal experiments can comprehensively examine the combined influence of seed equivalent diameter, sowing speed, and soil surface energy on the depth of seed penetration and the maximum impact force. They can be used to conduct intuitive analysis and variance analysis of the experimental results, which can not only determine the primary and secondary positions of each factor and the optimal levels, but can also identify the optimal combination of factor levels. This provides a more comprehensive and reliable basis for optimizing the experimental scheme and solving practical problems.
The orthogonal factor levels are shown in
Table 5, and the orthogonal test table generated by SPSS (v27) data analysis software is shown in
Table 6. Nine groups of factor-level combinations are determined.
The variance analyses of the test results are shown in
Table 7 and
Table 8, respectively.
4.2. Test Parameter Setting
The simulation model used in the orthogonal experiment was the same as that used in the single-factor experiment. Regarding parameter setting, the EDEM pretreatment module was used to modify wheat particle diameter corresponding to wheat seed equivalent diameter, wheat particle initial velocity corresponding to seeding speed, and contact model parameter value corresponding to soil surface energy.
4.3. Orthogonal Test Results and Analysis
4.3.1. Orthogonal Test Results
The orthogonal test results of the simulation study of wheat seed impact into the soil are shown in
Table 6. The results of each discrete element simulation showed that wheat seed equivalent diameter, seeding velocity, and soil surface energy had significant effects on the test results.
4.3.2. Significance of the Test Results
To determine the effects of wheat seed equivalent diameter, seeding speed, and soil surface energy on the test indexes, variance analysis and range analysis were carried out on the orthogonal test results by SPSS (v27) software [
29,
30].
The following conclusions can be obtained by F-test analysis of the buried depth: The significance p value of the equivalent diameter A is 0.022, which is significantly lower than the statistical significance threshold of 0.05, indicating that the equivalent diameter A has a significant main effect on the buried depth. Changes in equivalent diameter A will significantly affect the depth of the soil and are a key factor affecting the depth of the soil. The significance p value of seeding velocity B is 0.006, much lower than 0.05, confirming that implantation velocity B has a significant main effect on implantation depth. This result emphasizes the importance of the rate of penetration in determining the depth of penetration, and its change will significantly affect the depth of penetration. The significance p value of soil surface energy C was 0.061, which was slightly higher than the statistical significance threshold of 0.05, so it could not be considered that soil surface energy C had a significant main effect on the depth of soil insertion.
The F-test analysis of the maximum impact force brought about the following conclusions: The significance p-value of the equivalent diameter A is 0.056, which exceeds the threshold of statistical significance of 0.05, and it cannot be considered that the equivalent diameter A has a significant impact on the maximum impact force. The change in surface equivalent diameter A in the above analysis does not substantially affect the maximum impact force; that is, it has no prominent effect on the maximum impact force. The significance p-value of seeding velocity B was 0.016, much lower than 0.05, indicating a significant effect. This shows that velocity B significantly affects the maximum impact force; that is, the variation in velocity B will substantially affect the result of the maximum impact force. The significance p-value of soil surface energy C is 0.111, which also exceeds 0.05, so it is considered that soil surface energy C has no significant effect on the maximum impact force. This indicates that the influence of soil surface energy C on the maximum impact force is not statistically significant under the conditions investigated; that is, there is no main effect.
According to the model significance level (0.000, 0.001) in the analysis of variance, the significance level of this ANOVA model is high [
31], and the results are more accurate and reliable.
The range analyses of the experimental results are shown in
Table 9 and
Table 10.
Through range analysis, it can be concluded that the parameter combination is A3B3C1; that is, the equivalent diameter of wheat seed is 5.00 mm, the seeding speed is 65 m/s, and the soil surface energy is 0.5 J/m2.
To obtain a smaller maximum impact force, the optimal parameter combination used is A1B1C3; the equivalent diameter of wheat seed is 3.00 mm, the seeding speed is 25 m/s, and the soil surface energy is 6.5 J/m2.
5. Bench Test
5.1. Test Equipment and Materials
In the simulation experiment, conditions that affect sowing, such as machine performance and environment, were not covered. In order to verify the accuracy and reliability of the simulation experiment on wheat seed impact into the soil based on EDEM, real bench performance tests were conducted to obtain real performance data. For the problems, the structure and parameters could be improved.
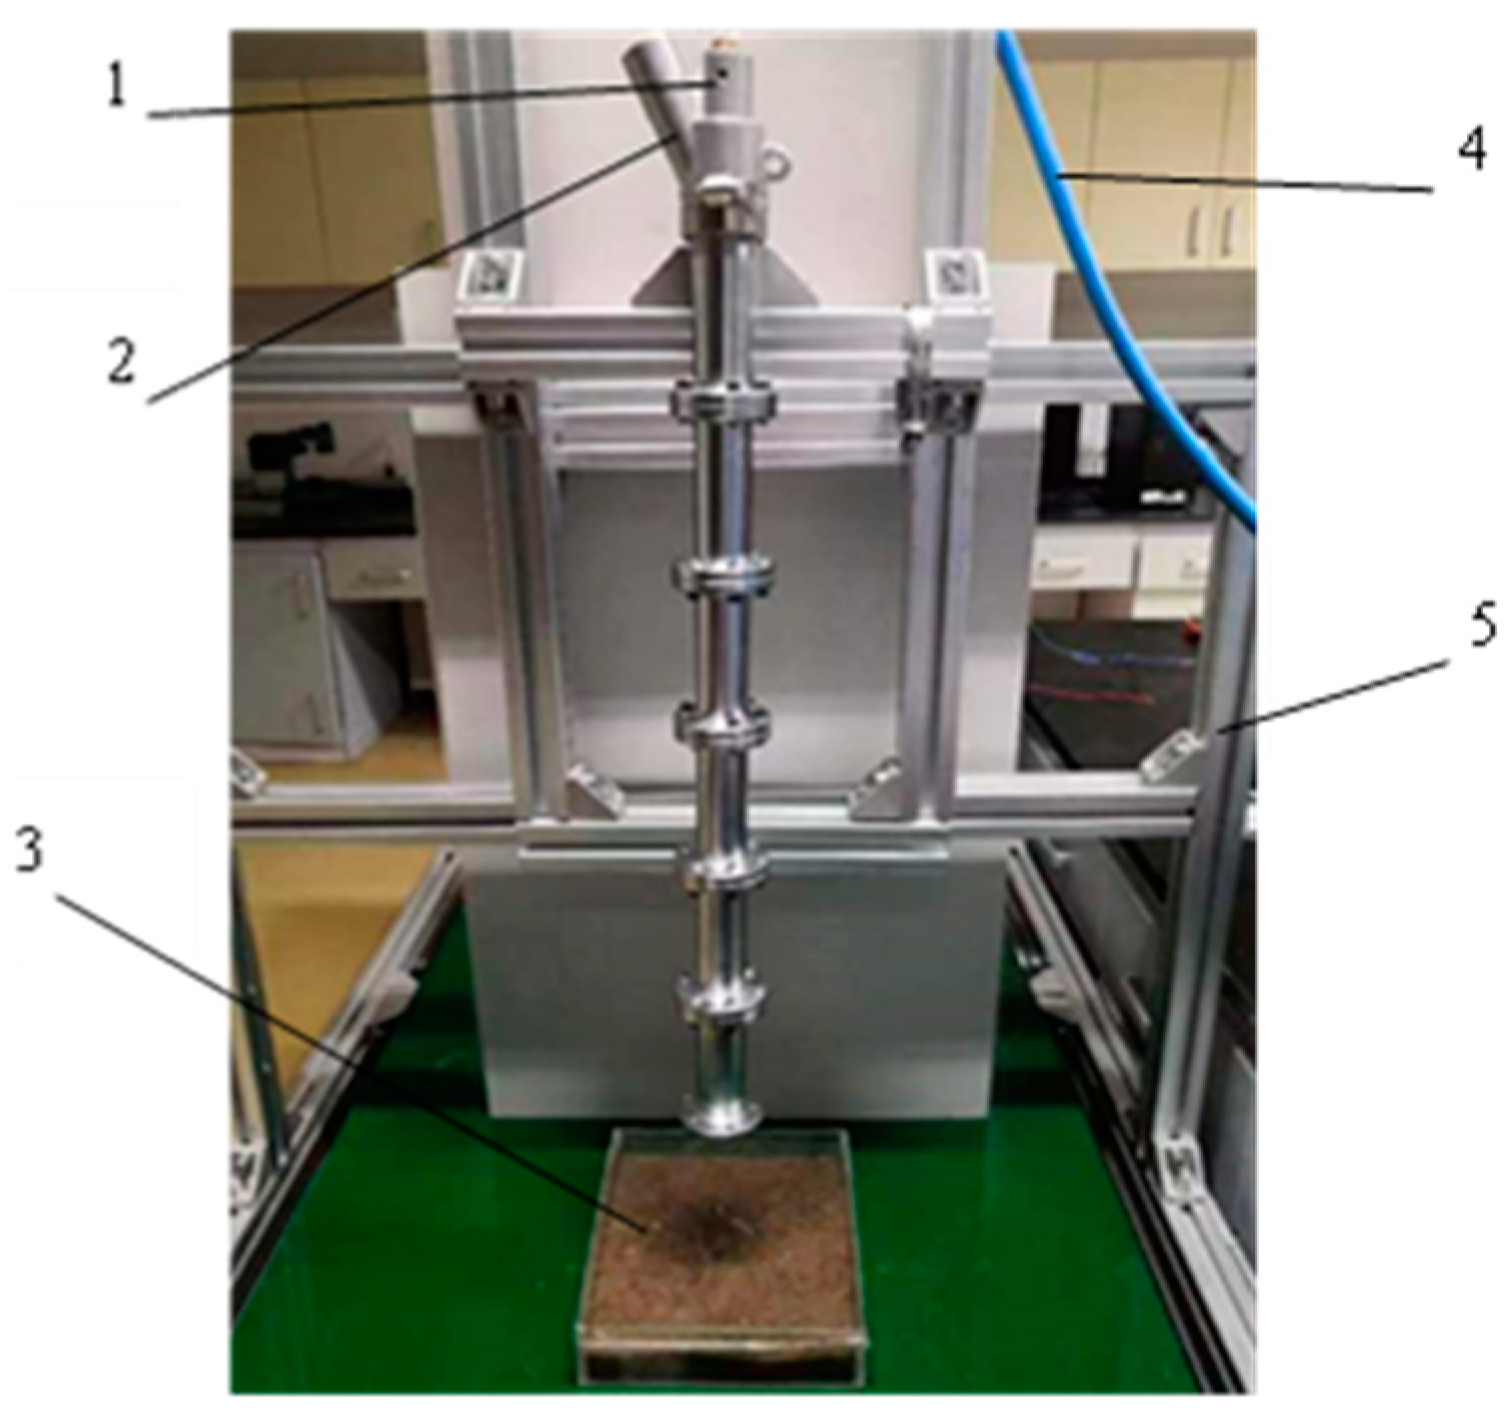
To verify the accuracy and reliability of the simulation test of wheat seed impact into the soil based on EDEM, a self-made test bench consisting of a rack, an air compressor, a pressure-regulating device, and a wheat seeding device was built at the Research Institute of Conservation Tillage, College of Engineering, China Agricultural University, as shown in
Figure 12. In the experiment, the same experimental factors were set up as in the simulation experiment, namely, the seeding speed, the equivalent diameter of wheat seed, and soil surface energy. The pressure was adjusted to achieve a specific seeding rate, and the soil surface could reach 0.5 J/m
2 and 6.5 J/m
2, meeting the experimental requirements; the actual soil water content was 15% and 25%, respectively. The equivalent diameter of the wheat was 3 mm and 5 mm. During the test, the air compressor was turned on to provide high-pressure airflow to the wheat seeding device. The high-pressure airflow entered the wheat seeding device through the pressure-resistant pneumatic hose, the negative pressure at the inlet was approximately 16,000 Pa, and the wheat was sprayed one grain at a time to complete the opening and closing of the high-pressure airflow.
The soil preparation process is as follows: According to the “Soil Test Regulations” (SL 237-1999), a soil sample of 0~5 cm of the tilling layer is randomly collected at the soil collection site, and the soil sample is removed from the soil, rolled, and screened at 2 mm after air-drying in the room. According to the design, the moisture content values required for the soil sample are 15% and 25%, respectively. The dry density of the soil was set to about 1.20 g/cm3 to approximate the parameters used in the simulation. The soil samples after screening were evenly mixed with water, and the soil (tested with different soil moisture contents) was filled into a self-made square soil tank (200 mm × 200 mm × 50 mm) and sealed with plastic wrap for testing. Since it is difficult to control the moisture content of the test soil to reach the soil moisture content required by the design, the test soil moisture content was measured several times after the preparation of the test soil to be close to the level of the design moisture content.
5.2. Test Method
Two representative groups of simulation tests in the EDEM simulation orthogonal test were selected to carry out the wheat high-speed air seeding test. Each group was tested 20 times, and with pneumatic seeding, one wheat seed was sown each time. In total, 40 wheat seeding tests were completed. The selected test indexes were soil depth and seed damage rate. The experimental data were compared with the EDEM simulation results to verify the validity of the simulation model to ensure that the simulation results truly reflect the process of wheat seed seeding.
5.2.1. Bench Test Shot Depth
After the experiment, the average value of wheat seed depth was taken to reduce the random error and the real value of seed depth was obtained. That is, the projection depth has the following formula:
In the formula, di is the depth of shot seeding for group i experimental conditions, mm;
dij is the broadcasting depth of the j test in Group i, mm.
5.2.2. Germination Rate of Wheat Seed After Inoculation
To verify whether wheat accelerated seeding technology will damage wheat seeds and decrease germination rate and sowing efficiency, the control test method was used to calculate wheat germination rate to reflect the degree of wheat damage. After the experiment was completed, the seeds were removed from the soil, and the same amount of wheat seeds were cultured in a culture dish at room temperature for 7 days, and the germination of wheat seeds was observed. The wheat germination test was conducted according to GB 5520-1985 “Seed Germination Test for Grain and Oil Inspection”. The following formula can be used to calculate the germination rate of wheat:
In the formula, δ is Germination rate, %;
M is the number of germinated grains of wheat;
N is the total number of wheat seeds in the group.
5.3. Bench Test Results
The bench test results are shown in
Table 11.
As shown in
Table 11, the results of the incident depth obtained from the simulation experiment and the bench test are relatively close, indicating that the simulation results are representative. The germination rates of the seeds planted after the bench test and the seeds without accelerated sowing are both 95%, which shows that the experimental conditions have a low impact on the seeds and further verifies the consistency between the simulation experiment and the bench test.
In summary, the bench test results show that the error between the simulation test and the bench test is less than 5%, and the simulation test analysis is reasonable, meaning that it can be used for subsequent wheat seed impact test research.
6. Conclusions
The equivalent diameter of the wheat seeds was measured by the water volume method, and soil parameters under accelerated seeding conditions were analyzed. A discrete element simulation model of wheat seed impact into the soil was established based on the characteristics of the wheat grain and soil particles measured and analyzed under the above conditions.
The effects of wheat seed equivalent diameter, seeding velocity, and soil surface on seeding depth and maximum impact were analyzed by the single-factor simulation test, which provided a basis for further orthogonal experimental design. The wheat seeds’ depth and maximum impact force under different parameters were simulated and analyzed through the orthogonal experiment with three factors and three levels. The parameter combination A2B3C1 has a maximum depth of 26.37 mm and a maximum impact force of 0.0704 N. Then, SPSS software (v27) was used for variance analysis and range analysis. The results show that the seeding rate and equivalent diameter of the wheat seed significantly affect soil depth, but the influence of soil surface energy is insignificant. The seeding velocity significantly influences the maximum impact force, but the equivalent diameter and soil surface energy have no significant influence.
The accuracy of the simulation model was verified through bench tests, and representative parameter combinations were selected according to the EDEM simulation results for the bench tests. The consistency of the simulation and actual test results was compared by measuring the position of the wheat seeds in the soil and calculating the average value. The error between the simulation test and the actual test is less than 5%, and the simulation model can predict the accelerated seed impact process of wheat seed, which verifies the validity of the simulation model. By cultivating the seeds from actual broadcast experiments and those from non-broadcast experiments under the same conditions, as well as comparing the germination rates of the two groups of seeds, it was verified that the accelerated sowing technology has a low wheat crushing rate under this parameter and can be used for the high-speed and precise sowing of wheat. The factors influencing seed depth and the impact damage of wheat accelerated seeding technology were analyzed and verified, providing a theoretical basis for wheat accelerated seeding technology.
In this paper, EDEM was used to simulate the accelerated impact of wheat seed on soil. Compared with traditional experiments, the interaction force between the soil and the wheat during the impact of wheat seed on soil was analyzed, and then the rationality of the accelerated seeding device was accurately analyzed. Compared with the simulation of other related accelerated seeding technologies, this experimental study mainly studied and analyzed three key parameters, providing a theoretical basis and reference for research into more parameters of accelerated seeding technology, as well as a method reference and theoretical basis for research into the accelerated seeding technology of other types of seeds.
However, this experimental study did not conduct orthogonal experiments on factors such as the incident angle, vibration, etc. There are still some differences from the actual working conditions. However, through the comparison of the test rig experiments, the role of this experimental study can still be reflected. This study investigated the effects of equivalent diameter, seeding speed, and soil surface energy on acceleration seeding technology through single-factor and orthogonal experiments and obtained the optimal factor-level parameters. It provides a theoretical basis and experimental methods for future research on acceleration seeding devices, performance testing, and parameter selection.
Author Contributions
Conceptualization, F.M., L.W. and C.W.; software, F.M. and L.W. validation, C.W. and Q.W.; formal analysis, F.M. and L.W.; investigation, F.M., L.W. and C.W.; resources, C.W. and Q.W.; data curation, L.W. and C.L.; writing—original draft preparation, F.M.; writing—review and editing, F.M., C.W. and L.W.; visualization, F.M., C.L. and C.W.; supervision, L.W. and Q.W.; project administration, Q.W.; funding acquisition, Q.W. and C.W. All authors have read and agreed to the published version of the manuscript.
Funding
This research was funded by the Young Scientists Fund of the National Natural Science Foundation of China (Grant No. 32201674).
Institutional Review Board Statement
Not applicable.
Data Availability Statement
The data presented in this study are available within the article.
Acknowledgments
Gratitude should be expressed to all members of the Conservation Tillage Research Centre.
Conflicts of Interest
The authors declare no conflicts of interest.
References
- Li, C.; Tang, Y.; Wu, C.; Huang, G. Effects of sowing mode on growth and development and yield establishment of rice stubble wheat. J. Agric. Eng. 2012, 28, 36–43. [Google Scholar]
- Fang, Z.; Zhang, J.; Chen, J.; Pan, F.; Wang, B.; Ji, C. Design and Experimental Analysis of an Air-Suction Wheat Precision Hill-Seed Metering Device. Agriculture 2024, 14, 1931. [Google Scholar] [CrossRef]
- Wang, Y.; Li, H.; He, J.; Wang, Q.; Lu, C.; Liu, P.; Yang, Q. Optimisation and testing of mechanical wheat shot seeder parameters. J. Agric. Eng. 2020, 36, 1–10. [Google Scholar]
- Wang, Y.; Li, H.; Wang, Q.; He, J.; Lu, C.; Liu, K. Design and Experiment of Wheat Mechanical Shooting Seed-metering Device. Trans. Chin. Soc. Agric. Mach. 2020, 51, 73–84. [Google Scholar]
- Italian Maschio Company Product Introduction [EB/OL]. [2020-02-07].[4]. Available online: https://www.maschiogaspardo.com/en/web/international/precision-planters (accessed on 10 January 2025).
- Barrios, G.K.P.; Jiménez-Herrera, N.; Tavares, L.M. Simulation of particle bed breakage by slow compression and impact using a DEM particle replacement model. Adv. Powder Technol. 2020, 31, 2749–2758. [Google Scholar] [CrossRef]
- Pasha, M.; Hare, C.; Ghadiri, M.; Gunadi, A.; Piccione, P.M. Effect of particle shape on flow in discrete element method simulation of a rotary batch seed coater. Powder Technol. 2016, 296, 29–36. [Google Scholar] [CrossRef]
- Ma, C.; Yi, S.; Tao, G.; Li, Y.; Wang, S.; Wang, G.; Gao, F. Research on Receiving Seeds Performance of Belt-Type High-Speed Corn Seed Guiding Device Based on Discrete Element Method. Agriculture 2023, 13, 1085. [Google Scholar] [CrossRef]
- Zhou, L. Simulation Analysis and Experimental Research on Modeling of Corn Seed and Sowing Process Based on Discrete Element Method. Ph.D. Thesis, Jilin University, Changchun, China, 2021. [Google Scholar]
- Zhang, F.; Han, Y.; Guan, L.; Dong, J.; Gao, F. Analysis of agronomic traits and high and stable yield and adaptability of 16 new wheat varieties (lines). China Seed Ind. 2024, 52–58. [Google Scholar] [CrossRef]
- Yin, J. Research on Multi-Field Coupling Model and Dew Prediction of Wheat Grain Pile. Ph.D. Thesis, Jilin University, Changchun, China, 2015. [Google Scholar]
- Wang, Z. Numerical Simulation and Experimental Research on the Process of Moisture Heat Transfer in Storage Grain Pile. Ph.D. Thesis, China Agricultural University, Beijing, China, 2014. [Google Scholar]
- Du, C. Numerical Simulation and Experimental Study of Transverse and Longitudinal Ventilation of Different Grain Particles. Master’s Thesis, Shandong University of Architecture, Jinan, China, 2019. [Google Scholar]
- Wang, J.; Li, X.; Gao, P.; Na, M.; Wang, Q.; Zhou, W. Design and test of high-efficiency drag-reducing loosening shovel for carrot combine harvester. J. Agric. Mach. 2020, 51, 93–103. [Google Scholar]
- Yan, D.; Yu, J.; Wang, Y.; Zhou, L.; Tian, Y.; Zhang, N. Soil Particle Modeling and Parameter Calibration Based on Discrete Element Method. Agriculture 2022, 12, 1421. [Google Scholar] [CrossRef]
- Xu, T.; Gou, Y.; Huang, D.; Yu, J.; Li, C.; Wang, J. Modeling and Parameter Selection of the Corn Straw–Soil Composite Model Based on the DEM. Agriculture 2024, 14, 2075. [Google Scholar] [CrossRef]
- Mindlin, R.D.; Deresiewicz, H. Elastic Spheres in Contact Under Varying Oblique Forces. J. Appl. Mech. 2021, 20, 327–344. [Google Scholar] [CrossRef]
- Su, C. Effects of Rotating Different Green Manures with Wheat on Soil Water and Fertiliser Environment and Wheat Growth. Master’s Thesis, Northwest Agriculture and Forestry University, Xianyang, China, 2014. [Google Scholar]
- Wang, D.; Lu, T.; Zhao, Z.; Shang, S.; Zheng, S.; Liu, J. Calibration of Discrete Element Simulation Parameters for Cultivated Soil Layer in Coastal Saline Alkali Soil. Chin. Soc. Agric. Mach. 2024, 55, 240–249. [Google Scholar]
- Zhou, J.; Wang, J.; Meng, F.; Tong, G.; Mei, L.; Liu, G.; Wang, Y.; Luo, J.; Xie, C. Effects of tillage practices on sowing quality, yield and efficiency of wheat. J. Crops 2022, 199–204. [Google Scholar] [CrossRef]
- Wang, S.; Yi, S.; Zhao, B.; Li, Y.; Tao, G.; Mao, X. High-speed No-till Seeder Seeding Depth Monitoring System Based on IWHO-EKF. Trans. Chin. Soc. Agric. Mach. 2024, 55, 75–84. [Google Scholar]
- Chen, J.; Li, Y.; Qin, C.; Liu, C. Design and test of capacitive method detection system for wheat seeding quantity. J. Agric. Eng. 2018, 34, 51–58. [Google Scholar]
- Yi, F.; Qian, S.; Xu, Z.; Wan, B.; Li, J. Research on the effects of different sowing depths on wheat growth and its yield. Shanghai Agric. Sci. Technol. 2019, 55–57. [Google Scholar]
- Yan, J.; Feng, L.; Li, Y.; Chen, X.; Yu, W. Effects of Sowing Date and Sowing Depth on Winter Wheat Growth before Overwintering. Trans. Chin. Soc. Agric. Mach. 2022, 53, 327–335. [Google Scholar]
- Li, X.; Liao, Q.; Du, W.; Liu, Z.; Wang, X.; Liao, Y.; Yuan, J. High-speed air-fed collector rice seed damage law and germination test. J. Agric. Eng. 2024, 40, 46–55. [Google Scholar]
- Jiang, H.; Dong, X.; Wang, H. Effect of slope soil water content on soil shear strength of different vegetation. For. Eng. 2009, 25, 77–80. [Google Scholar]
- Hou, F.; Ni, Z.; Wang, S.; Sun, H.; Zhao, F.; Zhong, W.; Zhang, Y. Study on Soil and Water Loss on Slope Surface and Slope Stability Under Rainfall Conditions. Water 2024, 16, 3643. [Google Scholar] [CrossRef]
- Qiang, X.; Sun, J.; Ning, H. Impact of Subsoiling on Cultivated Horizon Construction and Grain Yield of Winter Wheat in the North China Plain. Agriculture 2022, 12, 236. [Google Scholar] [CrossRef]
- Zhang, L. Principles and statistical applications of one-way and two-way ANOVA and tests. Math. Learn. Res. 2010, 7, 92–94. [Google Scholar]
- Yue, H.; Gauch, H.G.; Wei, J.; Xie, J.; Chen, S.; Peng, H.; Bu, J.; Jiang, X. Genotype by Environment Interaction Analysis for Grain Yield and Yield Components of Summer Maize Hybrids across the Huanghuaihai Region in China. Agriculture 2022, 12, 602. [Google Scholar] [CrossRef]
- Xu, T.; Fu, H.; Yu, J.; Li, C.; Wang, J.; Zhang, R. Determination of Ellipsoidal Seed–Soil Interaction Parameters for DEM Simulation. Agriculture 2024, 14, 376. [Google Scholar] [CrossRef]
Figure 1.
Soil troughs and pellet plants.
Figure 1.
Soil troughs and pellet plants.
Figure 2.
Depth of incidence.
Figure 2.
Depth of incidence.
Figure 3.
Depth of injection into the soil at different equivalent diameters.
Figure 3.
Depth of injection into the soil at different equivalent diameters.
Figure 4.
Maximum impact force of injection into the soil at different equivalent diameters.
Figure 4.
Maximum impact force of injection into the soil at different equivalent diameters.
Figure 5.
Simulation test charts for shot seeding of different equivalent diameters: (a) 3.00 mm; (b) 3.50 mm; (c) 4.00 m; (d) 4.50 mm; (e) 5.00 mm.
Figure 5.
Simulation test charts for shot seeding of different equivalent diameters: (a) 3.00 mm; (b) 3.50 mm; (c) 4.00 m; (d) 4.50 mm; (e) 5.00 mm.
Figure 6.
Depth of penetration into the soil at different injection speeds.
Figure 6.
Depth of penetration into the soil at different injection speeds.
Figure 7.
Maximum impact force into the soil at different injection speeds.
Figure 7.
Maximum impact force into the soil at different injection speeds.
Figure 8.
Simulation test charts for different shot seeding speeds: (a) 25 m/s; (b) 35 m/s; (c) 45 m/s; (d) 55 m/s; (e) 65 m/s.
Figure 8.
Simulation test charts for different shot seeding speeds: (a) 25 m/s; (b) 35 m/s; (c) 45 m/s; (d) 55 m/s; (e) 65 m/s.
Figure 9.
Depth of soil penetration under different soil surface energies.
Figure 9.
Depth of soil penetration under different soil surface energies.
Figure 10.
Maximum impact force that can be lowered into the soil with different soil surface energies.
Figure 10.
Maximum impact force that can be lowered into the soil with different soil surface energies.
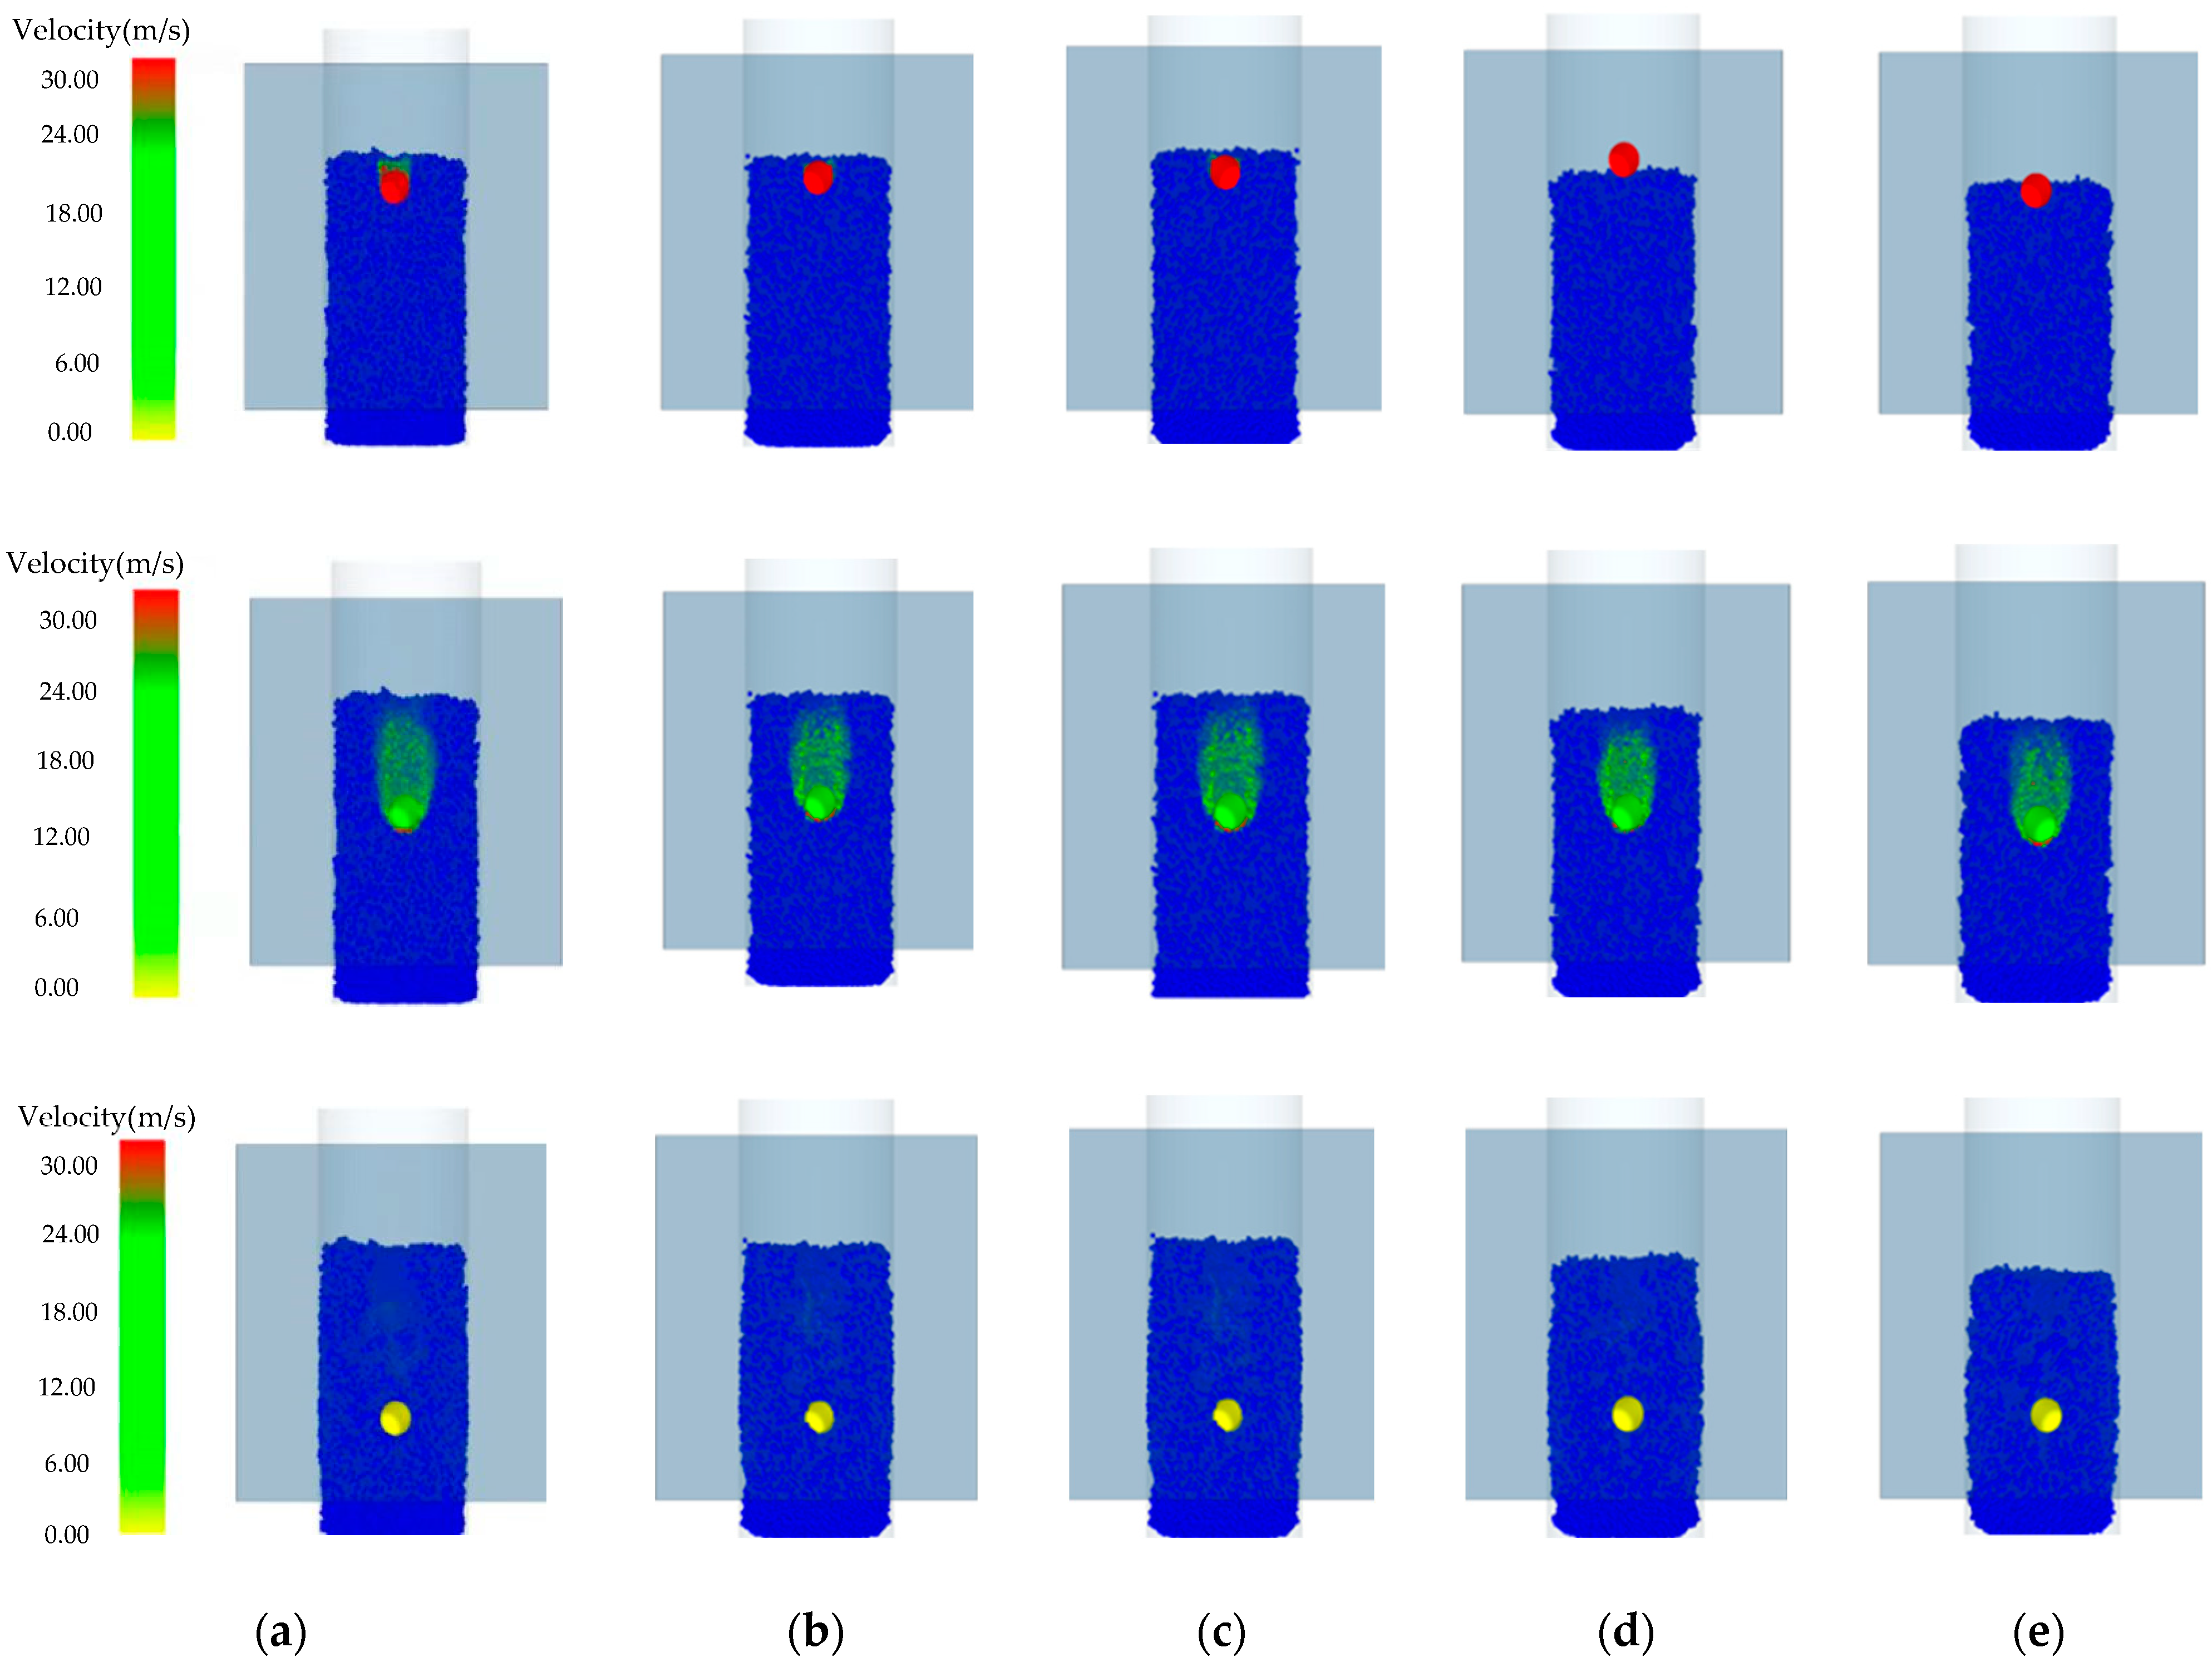
Figure 11.
Simulation test chart of the surface energy of different soils: (a) 0.5 J/m2; (b) 2.0 J/m2; (c) 3.5 J/m2; (d) 5.0 J/m2; (e) 6.5 J/m2.
Figure 11.
Simulation test chart of the surface energy of different soils: (a) 0.5 J/m2; (b) 2.0 J/m2; (c) 3.5 J/m2; (d) 5.0 J/m2; (e) 6.5 J/m2.
Figure 12.
Wheat seeding test bench: 1—air inlet chamber; 2—seed inlet; 3—soil sample; 4—high-pressure air pipe; 5—fixed frame.
Figure 12.
Wheat seeding test bench: 1—air inlet chamber; 2—seed inlet; 3—soil sample; 4—high-pressure air pipe; 5—fixed frame.
Table 1.
Parameters of simulation characteristics of wheat.
Table 1.
Parameters of simulation characteristics of wheat.
| Parameter | Numerical Value |
|---|
| Poisson’s ratio | 0.25 |
| Density (kg/m3) | 1400 |
| Shear modulus (Pa) | 2 × 10⁸ |
Table 2.
Parameters of soil particle simulation properties.
Table 2.
Parameters of soil particle simulation properties.
| Parameter | Numerical Value |
|---|
| Poisson’s ratio | 0.25 |
| Density (kg/m3) | 1200 |
| Shear modulus (Pa) | 1 × 10⁷ |
Table 3.
Basic parameters of the discrete element simulation model.
Table 3.
Basic parameters of the discrete element simulation model.
| Parameter | Numerical Value |
|---|
| Soil–soil recovery coefficient e1 | 0.4 |
| Soil–soil static friction factor e2 | 0.55 |
| Soil–soil dynamic friction factor e3 | 0.55 |
| Soil–tank recovery coefficient f1 | 0.5 |
| Soil–tank static friction factor f2 | 0.5 |
| Dynamic friction factor f3 of soil–soil tank f3 | 0.01 |
| Soil–wheat recovery coefficient b1 | 0.05 |
| Soil–wheat static friction factor b2 | 0.1 |
| Soil–wheat dynamic friction factor b3 | 0.05 |
Table 4.
Univariate test parameters.
Table 4.
Univariate test parameters.
| Level | Equivalent Diameter X1/mm | Seeding Speed
X2/(m/s) | Soil Surface Energy
X3/(J/m2) |
|---|
| 1 | 3.0 | 25 | 0.5 |
| 2 | 3.5 | 35 | 2.0 |
| 3 | 4.0 | 45 | 3.5 |
| 4 | 4.5 | 55 | 5.0 |
| 5 | 5.0 | 65 | 6.5 |
Table 5.
Orthogonal factor levels.
Table 5.
Orthogonal factor levels.
| Level | Factor |
|---|
Equivalent Diameter
A/mm | Seeding Speed
B/(m/s) | Soil Surface Energy
C/(J/m2) |
|---|
| 1 | 3.0 | 25 | 0.5 |
| 2 | 4.0 | 45 | 3.5 |
| 3 | 5.0 | 65 | 6.5 |
Table 6.
Orthogonal test tables and simulation results.
Table 6.
Orthogonal test tables and simulation results.
| Numbering | Factor | Depth of Seed Burial/mm | Maximum Impact Force/N |
|---|
Equivalent Diameter of Wheat Seeds
A/mm | Wheat Seeding Speed
B/(m/s) | Soil Surface Energy
C/(J/m2) |
|---|
| 1 | 3.00 | 25.00 | 0.50 | 8.74 | 0.0302 |
| 2 | 3.00 | 45.00 | 6.50 | 12.72 | 0.0395 |
| 3 | 3.00 | 65.00 | 3.50 | 20.99 | 0.0465 |
| 4 | 4.00 | 25.00 | 6.50 | 9.21 | 0.0329 |
| 5 | 4.00 | 45.00 | 3.50 | 17.30 | 0.0517 |
| 6 | 4.00 | 65.00 | 0.50 | 26.37 | 0.0749 |
| 7 | 5.00 | 25.00 | 3.50 | 13.96 | 0.0320 |
| 8 | 5.00 | 45.00 | 0.50 | 24.11 | 0.0594 |
| 9 | 5.00 | 65.00 | 6.50 | 25.19 | 0.0691 |
Table 7.
Analysis of variance table of seeding depth.
Table 7.
Analysis of variance table of seeding depth.
| Sum of Squares | Degree of
Freedom | Mean Square | F | P | R2 | Adjusted R2 | Sum of Squares |
|---|
| Model | 2794.532 | 1 | 2794.532 | 3496.467 | 0.000 | 0.996 | 0.983 |
| Equivalent diameter A | 72.176 | 2 | 36.088 | 45.153 | 0.022 |
| Seeding speed B | 276.07 | 2 | 138.035 | 172.707 | 0.006 |
Soil surface energy
C | 24.59 | 2 | 12.295 | 15.383 | 0.061 |
| Deviation | 1.598 | 2 | 0.799 | | |
Table 8.
Variance analysis table of maximum impact force.
Table 8.
Variance analysis table of maximum impact force.
| | Sum of Squares | Degree of
Freedom | Mean Square | F | P | R2 | Adjusted R2 |
|---|
| Model | 0.021141 | 1 | 0.021141 | 1670.797682 | 0.001 | 0.988423 | 0.95369 |
| Equivalent diameter A | 0.000426 | 2 | 0.000213 | 16.85274 | 0.056 |
| Seeding speed B | 0.00153 | 2 | 0.000765 | 60.473393 | 0.016 |
Soil surface energy
C | 0.000204 | 2 | 0.000102 | 8.048736 | 0.111 |
| Deviation | 0.000025 | 2 | 0.000013 | | |
Table 9.
Range analysis table of seeding depth.
Table 9.
Range analysis table of seeding depth.
| Level | Equivalent Diameter A | Seeding Speed
B | Soil Surface Energy
C |
|---|
| K1 | 42.45 | 31.91 | 59.22 |
| K2 | 52.88 | 54.13 | 47.12 |
| K3 | 63.26 | 72.55 | 52.25 |
| K1 | 14.15 | 10.637 | 19.74 |
| K2 | 5.0 | 65 | 6.5 |
| K3 | 17.627 | 18.043 | 15.707 |
| R | 21.087 | 24.183 | 17.417 |
| Optimum level | 6.937 | 13.547 | 4.033 |
Table 10.
Extreme variance analysis of maximum impact force.
Table 10.
Extreme variance analysis of maximum impact force.
| Level | Equivalent Diameter A | Seeding Speed
B | Soil Surface Energy
C |
|---|
| K1 | 0.1162 | 0.0951 | 0.1645 |
| K2 | 0.1595 | 0.1506 | 0.1415 |
| K3 | 0.1605 | 0.1905 | 0.1302 |
| K1 | 0.038733 | 0.0317 | 0.054833 |
| K2 | 0.053167 | 0.0502 | 0.047167 |
| K3 | 0.0535 | 0.0635 | 0.0434 |
| R | 0.014767 | 0.0318 | 0.011433 |
| Optimum level | A1 | B1 | C3 |
Table 11.
Bench test results.
Table 11.
Bench test results.
| Numbering | Equivalent Diameter of Wheat Seeds
A/mm | Wheat Seeding Speed
B/(m/s) | Soil Surface Energy
C/(J/m2) | Average Broadcast Depth/mm | Germination Rate in Group/% | The Germination Rate of the Experimental Group/% |
|---|
| Bench test group 1 | 3.00 | 25.0 | 0.5 | 8.22 | 95 | |
| Simulation test group 1 | 3.00 | 25.00 | 0.5 | 8.74 | / | / |
| Bench test group 2 | 5.00 | 65.00 | 6.5 | 24.93 | 95 | 95 |
| Simulation test group 2 | 5.00 | 65.00 | 6.5 | 25.19 | / | / |
| Disclaimer/Publisher’s Note: The statements, opinions and data contained in all publications are solely those of the individual author(s) and contributor(s) and not of MDPI and/or the editor(s). MDPI and/or the editor(s) disclaim responsibility for any injury to people or property resulting from any ideas, methods, instructions or products referred to in the content. |
© 2025 by the authors. Licensee MDPI, Basel, Switzerland. This article is an open access article distributed under the terms and conditions of the Creative Commons Attribution (CC BY) license (https://creativecommons.org/licenses/by/4.0/).


