Article

Research on the Prediction Model and Formation Law of Drying Cracks of Paddy Based on Multi-Physical Field Coupling

1
College of Engineering, Heilongjiang Bayi Agricultural University, Daqing 163319, China
2
Key Laboratory of Intelligent Agricultural Machinery Equipment in Heilongjiang Province, Heilongjiang Bayi Agricultural University, Daqing 163319, China
3
College of Information and Electrical Engineering, Heilongjiang Bayi Agricultural University, Daqing 163319, China
*
Author to whom correspondence should be addressed.
Agriculture 2025, 15(4), 383; https://doi.org/10.3390/agriculture15040383
Submission received: 8 January 2025 / Revised: 5 February 2025 / Accepted: 7 February 2025 / Published: 11 February 2025
(This article belongs to the Section Agricultural Technology)

Abstract

:
Cracking in paddy during processing and storage can significantly degrade its quality and economic value. This study elucidates the crack formation law in paddy across various drying stages through experiments and simulations that integrate multiple physical fields. A predictive model for crack occurrence, based on the relationship between the probability of cracking and drying time, is developed by introducing a critical moisture evaporation coefficient to delineate safe regio for cracking. The findings indicate a sharp increase in the percentage of drying cracks during the initial rapid drying phase, with continued escalation through the slower drying phase. The predictive model’s coefficient of determination exceeded 0.85, demonstrating its efficacy in forecasting crack progression. The primary driver for crack initiation and growth was identified as the cumulative effect of the moisture gradient, with the yield stress proving inadequate to counteract the stresses induced by this gradient, leading to cracking in paddy grains. These results furnish valuable insights for accurately predicting and managing crack development in paddy.

1. Introduction

As a principal agricultural staple, the production and storage of paddy are pivotal to food security and market stability [1,2,3]. Post harvest, paddy is prone to microbial spoilage and mold growth due to its high moisture content, compromising its quality and storability. For safe storage, paddy requires a moisture content below 17% on a dry basis [4,5]. Consequently, drying is essential to preserve the quality and extend the storage life of paddy. Various drying methods, such as hot air, fluidized bed, and microwave drying, are prevalent, offering high efficiency and control [6,7,8]. Currently, hot-air drying is predominantly utilized due to its scalability. Nonetheless, the uneven moisture migration during drying often results in rapid surface moisture evaporation while internal moisture lags, creating significant moisture gradients [9,10]. This disparity in moisture distribution generates internal and external tensile stresses, potentially leading to crack formation. Therefore, unraveling the mechanisms of crack generation while maintaining drying efficiency presents a significant challenge in the paddy drying process [11,12,13].
Most studies on drying cracks in paddy focus on various drying parameters. Wang et al. examined the crack formation patterns under different conditions and determined that the crack behavior was significantly influenced by temperature gradients and particle structure [14,15]. Conversely, Liu et al. investigated the cracking characteristics under various drying modes, noting differences in crack patterns among rice varieties even within the same drying mode. These variations stem from the complexity of paddy’s physical properties, such as surface structure and internal water content distribution [16]. Consequently, the link between drying parameters and crack behaviors merits further exploration to not only optimize drying processes but also to provide a crucial theoretical foundation for understanding crack formation mechanisms during paddy drying. Additionally, capturing dynamic changes on the paddy surface during hot air drying experiments poses challenges, impeding detailed crack formation analysis. In the realm of paddy drying research, further investigation into the key factors influencing cracking through the lens of crack occurrence probability and characteristics is warranted. Ghasemi et al. observed that paddy displayed various crack numbers post-drying, which they characterized using the stress crack index to quantify these numbers [17]. Chayjan et al. correlated the percentage of drying cracks with drying temperature in brown rice under rubbery and glassy states, finding a direct proportionality between crack development and temperature [18]. While many studies concentrate on the characteristics of cracks post-complete hot-air drying, the specific behavior during different drying stages remains unclear. Typically, the hot-air drying rate for paddy spikes initially, then decreases as moisture levels out [19]. However, the development of cracks through these stages and the critical conditions for rapid expansion require in-depth investigation. Crack formation and expansion significantly degrade paddy quality, with excessive cracking potentially leading to grain breakage and subsequent production of broken rice. Therefore, identifying critical conditions for crack initiation is paramount for enhancing the reliability of drying processes and quality control. Wang et al. examined the critical rupture stress at various temperatures, creating a distribution function from the data to estimate crack occurrence probabilities [20]. Chen et al. modeled the compressive fracture force in corn and wheat under varying impact loads, integrating empirical data with fitted models to construct a probabilistic cracking occurrence model for these grains [21]. Future research should aim to develop a probability model for paddy cracking under diverse drying conditions and particle characteristics, thus laying the groundwork for advancements in drying technology and quality enhancement.
In studying the formation of drying cracks in paddy, some scholars have examined the internal microstructure of paddy to uncover the causes of grain rupture. For example, Dong et al. identified that the primary cause of cracks in drying rice grains was the non-uniform internal moisture distribution. This study demonstrated that an imbalance in the moisture gradient creates varying rates of water evaporation from different parts of the grain, leading to stress concentrations within the grain that ultimately trigger cracking [22]. Pruengam et al. argued that this non-uniform moisture distribution causes differential shrinkage between the exterior and interior of the grain, generating internal stresses that are critical in crack development [23]. In addition, some researchers have noted that higher drying rates not only intensify this uneven moisture distribution but also prompt rapid contraction of the endosperm region, further inducing crack formation in the paddy [24]. Conversely, Wu et al. noted that although temperature differences between the internal and external parts of the paddy during early drying stages induce thermal stresses, these effects are transient and minor compared to those caused by moisture gradients [25]. Based on the aforementioned research, the hypothesis is proposed that cracks occur when the stress generated by the moisture gradient inside the paddy exceeds the yield stress. Therefore, understanding the distribution characteristics of internal moisture in paddy is essential to elucidate the crack formation mechanism.
The aim of this study is to delineate the law of crack formation in paddy under varying initial moisture conditions and drying temperatures, integrating multi-physics simulations and experimental approaches. This research analyzes the incidence and number of cracks during the drying process, develops a predictive model for crack formation, and suggests a safety threshold for crack development. Moreover, a detailed quantitative analysis of the internal moisture gradient and stress within paddy during different drying stages was conducted based on a multi-physics coupling simulation model. Finally, the interplay between the moisture gradient and the yield strength of the rice grains was employed to clarify the crack formation mechanism. The results of this study offer insights into the mechanisms of crack formation during the drying process.

2. Materials and Methods

2.1. Experimental Material

Paddy grain (Sui-Rice No. 3) for this experiment was obtained from Daqing, Heilongjiang Province, China. After harvesting at Zhaoyuan Farm in September 2024, the paddy was sealed, packaged, and transported to the drying laboratory, where it was stored at 2~4 °C for further experimentation. Given the relationship between physical properties and crack formation, four distinct initial moisture contents on a dry basis were selected for the drying experiments: 32 ± 0.3%; 29 ± 0.3%; 25 ± 0.4%; and 22 ± 0.3%. The paddy was maintained in a consistent storage environment to ensure uniform experimental conditions.

2.2. Experimental Devices and Processes

These experiments were conducted using a two-way alternating hot air drying experimental bench, independently designed and manufactured for this study (Figure 1) [14]. This system enables precise control of temperature and air velocity, with an online data acquisition system for monitoring the material’s drying status. Temperature and humidity sensors recorded the air medium temperature in the pipeline, and the control system adjusted parameters according to experimental settings. In each experiment, 0.2 kg of fresh paddy was evenly distributed in the drying chamber, with air velocity fixed at 0.1 m/s. Experiments commenced once the collected signal stabilized. Paddy samples with different moisture contents were continuously dried at temperatures of 30, 40, 50, and 60 °C, based on methodologies referenced from Cnossen et al. [24] and Dong et al. [22]. A load cell monitored the change in paddy mass, indicating water loss during drying. Drying was halted once the paddy reached a safe moisture content.

2.3. Drying Parameters

The moisture content of paddy was calculated by the following Equation (1) [26]:
M = W t W d W d
where M is the dry basis moisture content, kg/kg; Wt is the mass of paddy at any given time, kg; Wd is the mass of dry matter of paddy, kg.
The moisture ratio (MR) was computed using Equation (2) [27].
M R = M t M e M 0 M e
where Mt is the dry basis moisture content of paddy at time t, kg/kg; M0 is the initial dry basis moisture content of the paddy, kg/kg; Me is the equilibrium moisture content on a dry basis, kg/kg.
Given the relatively small value of Me compared to Mt and M0, the moisture ratio calculation was simplified, as shown in Equation (3) [27].
M R = M t M 0
The drying rate (DR) was calculated using Equation (4) [28].
D R = M t 1 M t 2 t 2 t 1
where t1 and t2 are the drying times, min; Mt1 and Mt2 are the moisture contents on a dry basis at t1 and t2, respectively, kg/kg.

2.4. Three-Point Bending Test

The initial dry basis moisture content of the paddy used in the experiment was 32.2%. The paddy was placed in an electric oven with temperature settings of 30, 40, 50, and 60 °C. Paddy samples with varying dry basis moisture contents (31.7%, 28.2%, 25%, 20.5%, 16.2%) were randomly selected, and 20 grains were taken from each group. These grains were required to be free of cracks and similar in shape and size. The paddy samples were stored in sealed bags for mechanical compression testing. A universal material testing machine (CTM2050, Shanghai Xieqiang Instrument Manufacturing Co., Ltd., Shanghai, China) was used for the compression tests. The compression rate was set at 0.1 mm/s, and the parameters were calibrated accordingly. One grain of paddy was tested at a time by placing it at the center of the testing platform, and each set of tests was repeated five times. The bending strength (σ0) was calculated using the following Equation [23]:
σ 0 = M f y I z = 8 F l π w 3
where Mf is the bending moment, N·m; y is half of the particle thickness, m; Iz is the moment of inertia, m4; F is the maximum force, N; w is the diameter of the paddy cross-section, m; l is the distance between the two support points, m.

2.5. Cracking Statistics

Paddy samples were collected at different drying stages during each drying experiment. Crack detection was performed immediately after sampling and after 48 h of storage to more accurately determine the number of drying cracks in the paddy. Prior to detection, the paddy was dehulled and placed on a glass plate. A light source was positioned beneath the glass plate, and a binocular microscope was used to observe the presence of cracks [17,19]. The percentage of drying cracks in the paddy was calculated using Equation (6) [18].
P = n f n
where P is the percentage of drying cracks, %; nf is the number of cracked paddy grains; n is the total number of observed paddy grains.

2.6. Numerical Simulation of Drying

2.6.1. Geometric Modeling of Paddy

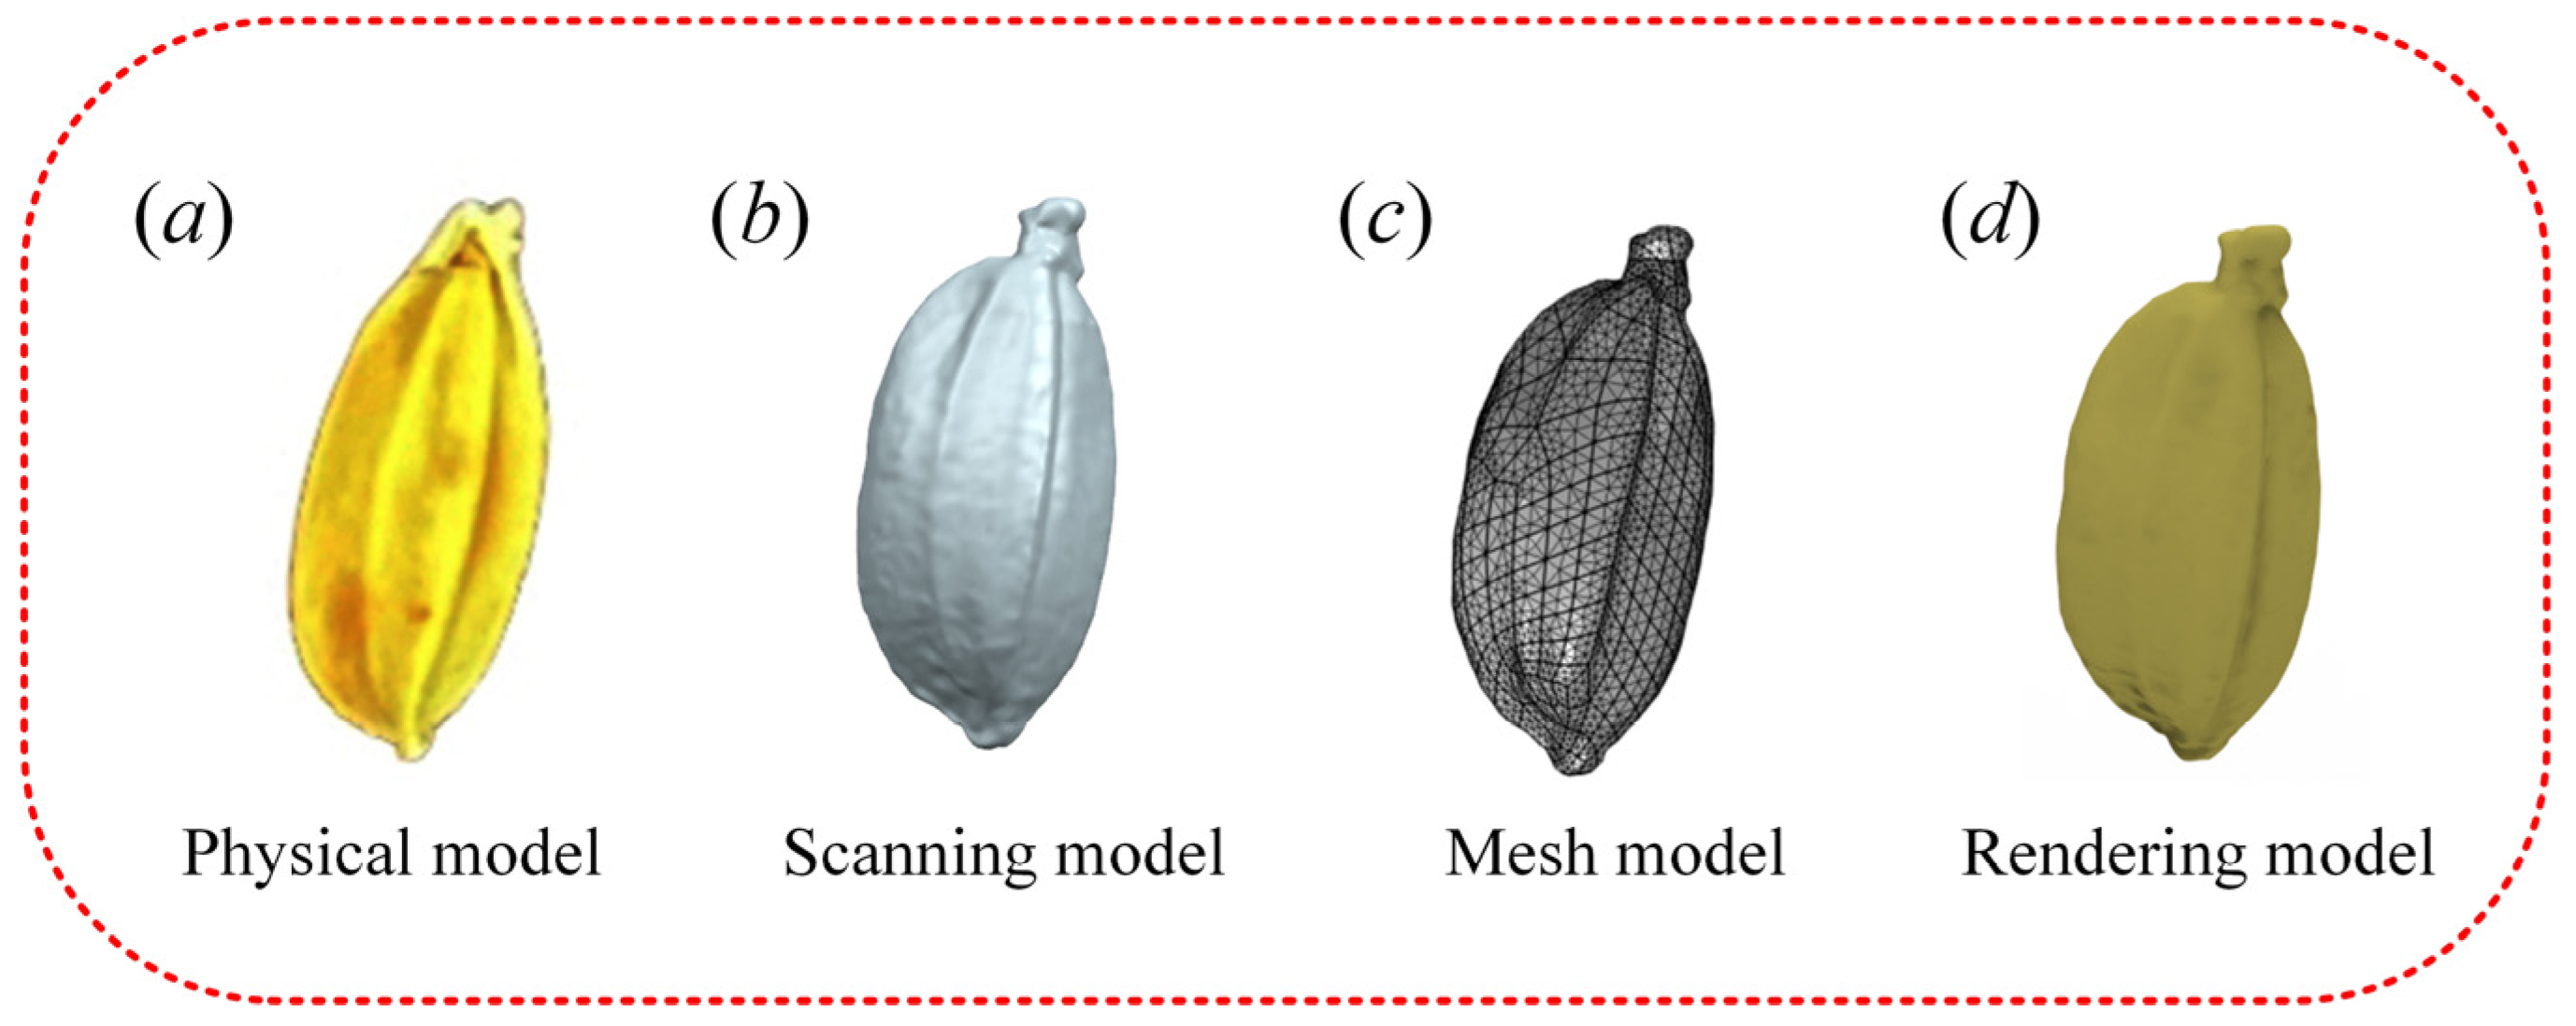
To obtain an accurate three-dimensional geometric model of paddy grains, an optical 3D scanner (OKIO-5M, Beijing Tianyuan 3D Technology Co., Ltd., Beijing, China) was used to extract the geometric parameters of the paddy seeds (Figure 2). The streak images captured by the photoreceptor were processed by a computer, and the spatial coordinates of each point on the object surface were calculated using phase and trigonometric methods to generate 3D point cloud data.

2.6.2. Assumptions of the Model

The simulation experiment focuses on a single grain of paddy as the research subject. The multi-physics coupled model integrates the heat transfer, mass transfer, and stress models to perform a synergistic simulation. To improve accuracy, several assumptions are made: (1) The paddy is assumed to be an isotropic homogeneous body, meaning that the temperature, moisture, and stress are uniform in the initial state; (2) The moisture inside the paddy primarily diffuses in liquid form, and the environmental conditions remain unchanged, unaffected by external factors [29].

2.6.3. Heat Transfer Equation

Based on the scanned 3D paddy model, the heat transfer process can be described by Equation (7).
ρ C p T t = λ 2 T x 2 + 2 T y 2 + 2 T z 2 + h g ρ M t
The initial and boundary conditions are defined in Equation (8).
t = 0 , T = T 0 λ T t = h t T T a
where ρ is the density, kg/m3; T is the temperature of paddy, °C; x, y, and z represent the spatial coordinates of the paddy kernel (m), respectively; T0 is the initial temperature of paddy, °C; Ta is the temperature of hot air, °C; hg is the latent heat of vaporization, J/kg; t is the drying time, min; Cp is the specific heat capacity of the paddy, J/(kg·K), λ is the coefficient of thermal conductivity of the paddy, W/(m·K); ht is the convective heat transfer coefficient, W/(m2·K).
The convective heat transfer coefficient (ht) for hot-air drying of paddy is typically estimated using the Nussel number (Nu) [16].
h t = 2 λ L 0.3387 Pr 1 / 3 Re 1 / 2 1 + 0.0468 / Pr 2 / 3 1 / 4 ,   Re 5 × 10 5   2 λ L Pr 1 / 3 0.037 Re 4 / 5 871 ,       Re > 5 × 10 5 Re = v a ρ a d μ a Pr = μ a C a λ a
where d is the equivalent diameter of paddy, m; λa is the thermal conductivity of hot air, W/(m·K); Re is the Reynolds number; Pr is the Prandtl number; L is the characteristic length of grain, m; va is the velocity of hot air, m/s; ρa is the density of hot air, kg/m3; μa is the dynamic viscosity of hot air, Pa.s; Ca is the specific heat capacity of hot air, J/(kg·K).

2.6.4. Mass Transfer Equation

Based on the 3D paddy model, the mass transfer process is described by Equation (10) [30].
M t = D e f f 2 M x 2 + 2 M y 2 + 2 M z 2
The initial and boundary conditions are defined in Equation (11) [31].
t = 0 , M = M 0 λ M t = h m M M e
where Deff is the effective diffusion coefficient of water, m2/s; hm is the convective mass transfer coefficient, m/s; Me is the equilibrium moisture content of, kg/kg.
The convective mass transfer coefficient (hm) of paddy is estimated using the Sherwood number (Sh) [31].
S h = h m d D a = 2 + 0.552 Re 0 . 53 S c 1 3 S c = μ a ρ a D a
where Da is the diffusion coefficient of moisture in hot air, m2/s; Sc is the Schmidt number.

2.6.5. Stress Modeling

Elastic strain (εe) occurs when paddy particles shrink or expand during the drying process. Temperature differences across the paddy during drying create thermal strain (εT). In addition, the uneven evaporation of water causes moisture strain (εM) within the grain. The total strain (εt) of the paddy can be regarded as the result of the superposition of three strains, which is specifically expressed as the sum of εe, εT, and εM [25].
ε t = ε e + ε T + ε M
The thermal and moisture strains in the paddy are expressed by Equation (14) [32,33].
ε T = α T T 0 ε M = β ( M M 0 )
where α is the thermal expansion coefficient; β is the hygroscopic shrinkage coefficient; T0 is the initial temperature of the paddy, °C; M0 is the initial moisture content of the paddy, kg/kg.
Using generalized Hooke’s law, the elastic stress relationship of paddy during drying is described by Equation (15) [24].
σ e = D ε e
The elasticity matrix (D) is defined in Equation (16).
D = E 1 + μ 1 2 μ 1 μ     μ     μ       0       0       0 μ 1 μ     μ       0       0       0 μ       μ 1 μ       0       0       0 0       0           0 1 2 μ 2         0         0 0       0           0           0 1 2 μ 2         0 0       0           0           0             0 1 2 μ 2
where σe is the elastic stress, MPa; E is the elastic modulus, MPa; μ is the Poisson’s ratio;
During drying, the surface of the paddy contracts toward the center. The simulation assumes a fixed constraint at the center point (0, 0, 0) of the paddy grain. The surface exhibits both contraction and expansion. The initial and boundary conditions are given in Equation (17).
t = 0 ,   σ e = 0 ,   σ T = 0 ,   σ M = 0 t 0 ,   u ( 0 , 0 , 0 ) = 0 0 0 T
where σT is the thermal stress, MPa; σM is the moisture stress, MPa.
The Von Mises stress (σvon) accounts for the principal stresses in different directions within the paddy and characterizes the yield state of the material using equivalent stresses. σvon represents the combined effect of principal stresses, providing a unifying criterion for analyzing cracks, deformations, or yield during the drying process [16].
σ v o n = σ x σ y 2 + σ y σ z 2 + σ z σ x 2 2
If the drying rate is too fast or the moisture distribution is uneven, stress inside the paddy changes with moisture evaporation and temperature fluctuations. When stress exceeds the yield limit of the paddy, it leads to stress concentration and crack formation.
σ v o n Y
where Y is the yield stress of paddy, MPa; σx, σy, and σz denote the stresses on the paddy grain in the three main directions, respectively.

2.6.6. Model Solving

Simulations were conducted using COMSOL Multiphysics 6.0 on a computer workstation (ThinkStation, Lenovo Group Limited, Beijing, China). The structural mechanics, heat transfer, and diffusion modules were used to solve the coupled multi-physics fields of temperature, moisture, and stress within the paddy. A direct linear solver (MUMPS) was used with relative and absolute errors set to 0.01 and 0.001, respectively, and a time step of 1 min.

3. Results and Discussion

3.1. Drying Characteristics of Paddy Under Drying Conditions at 30, 40, 50 and 60 °C

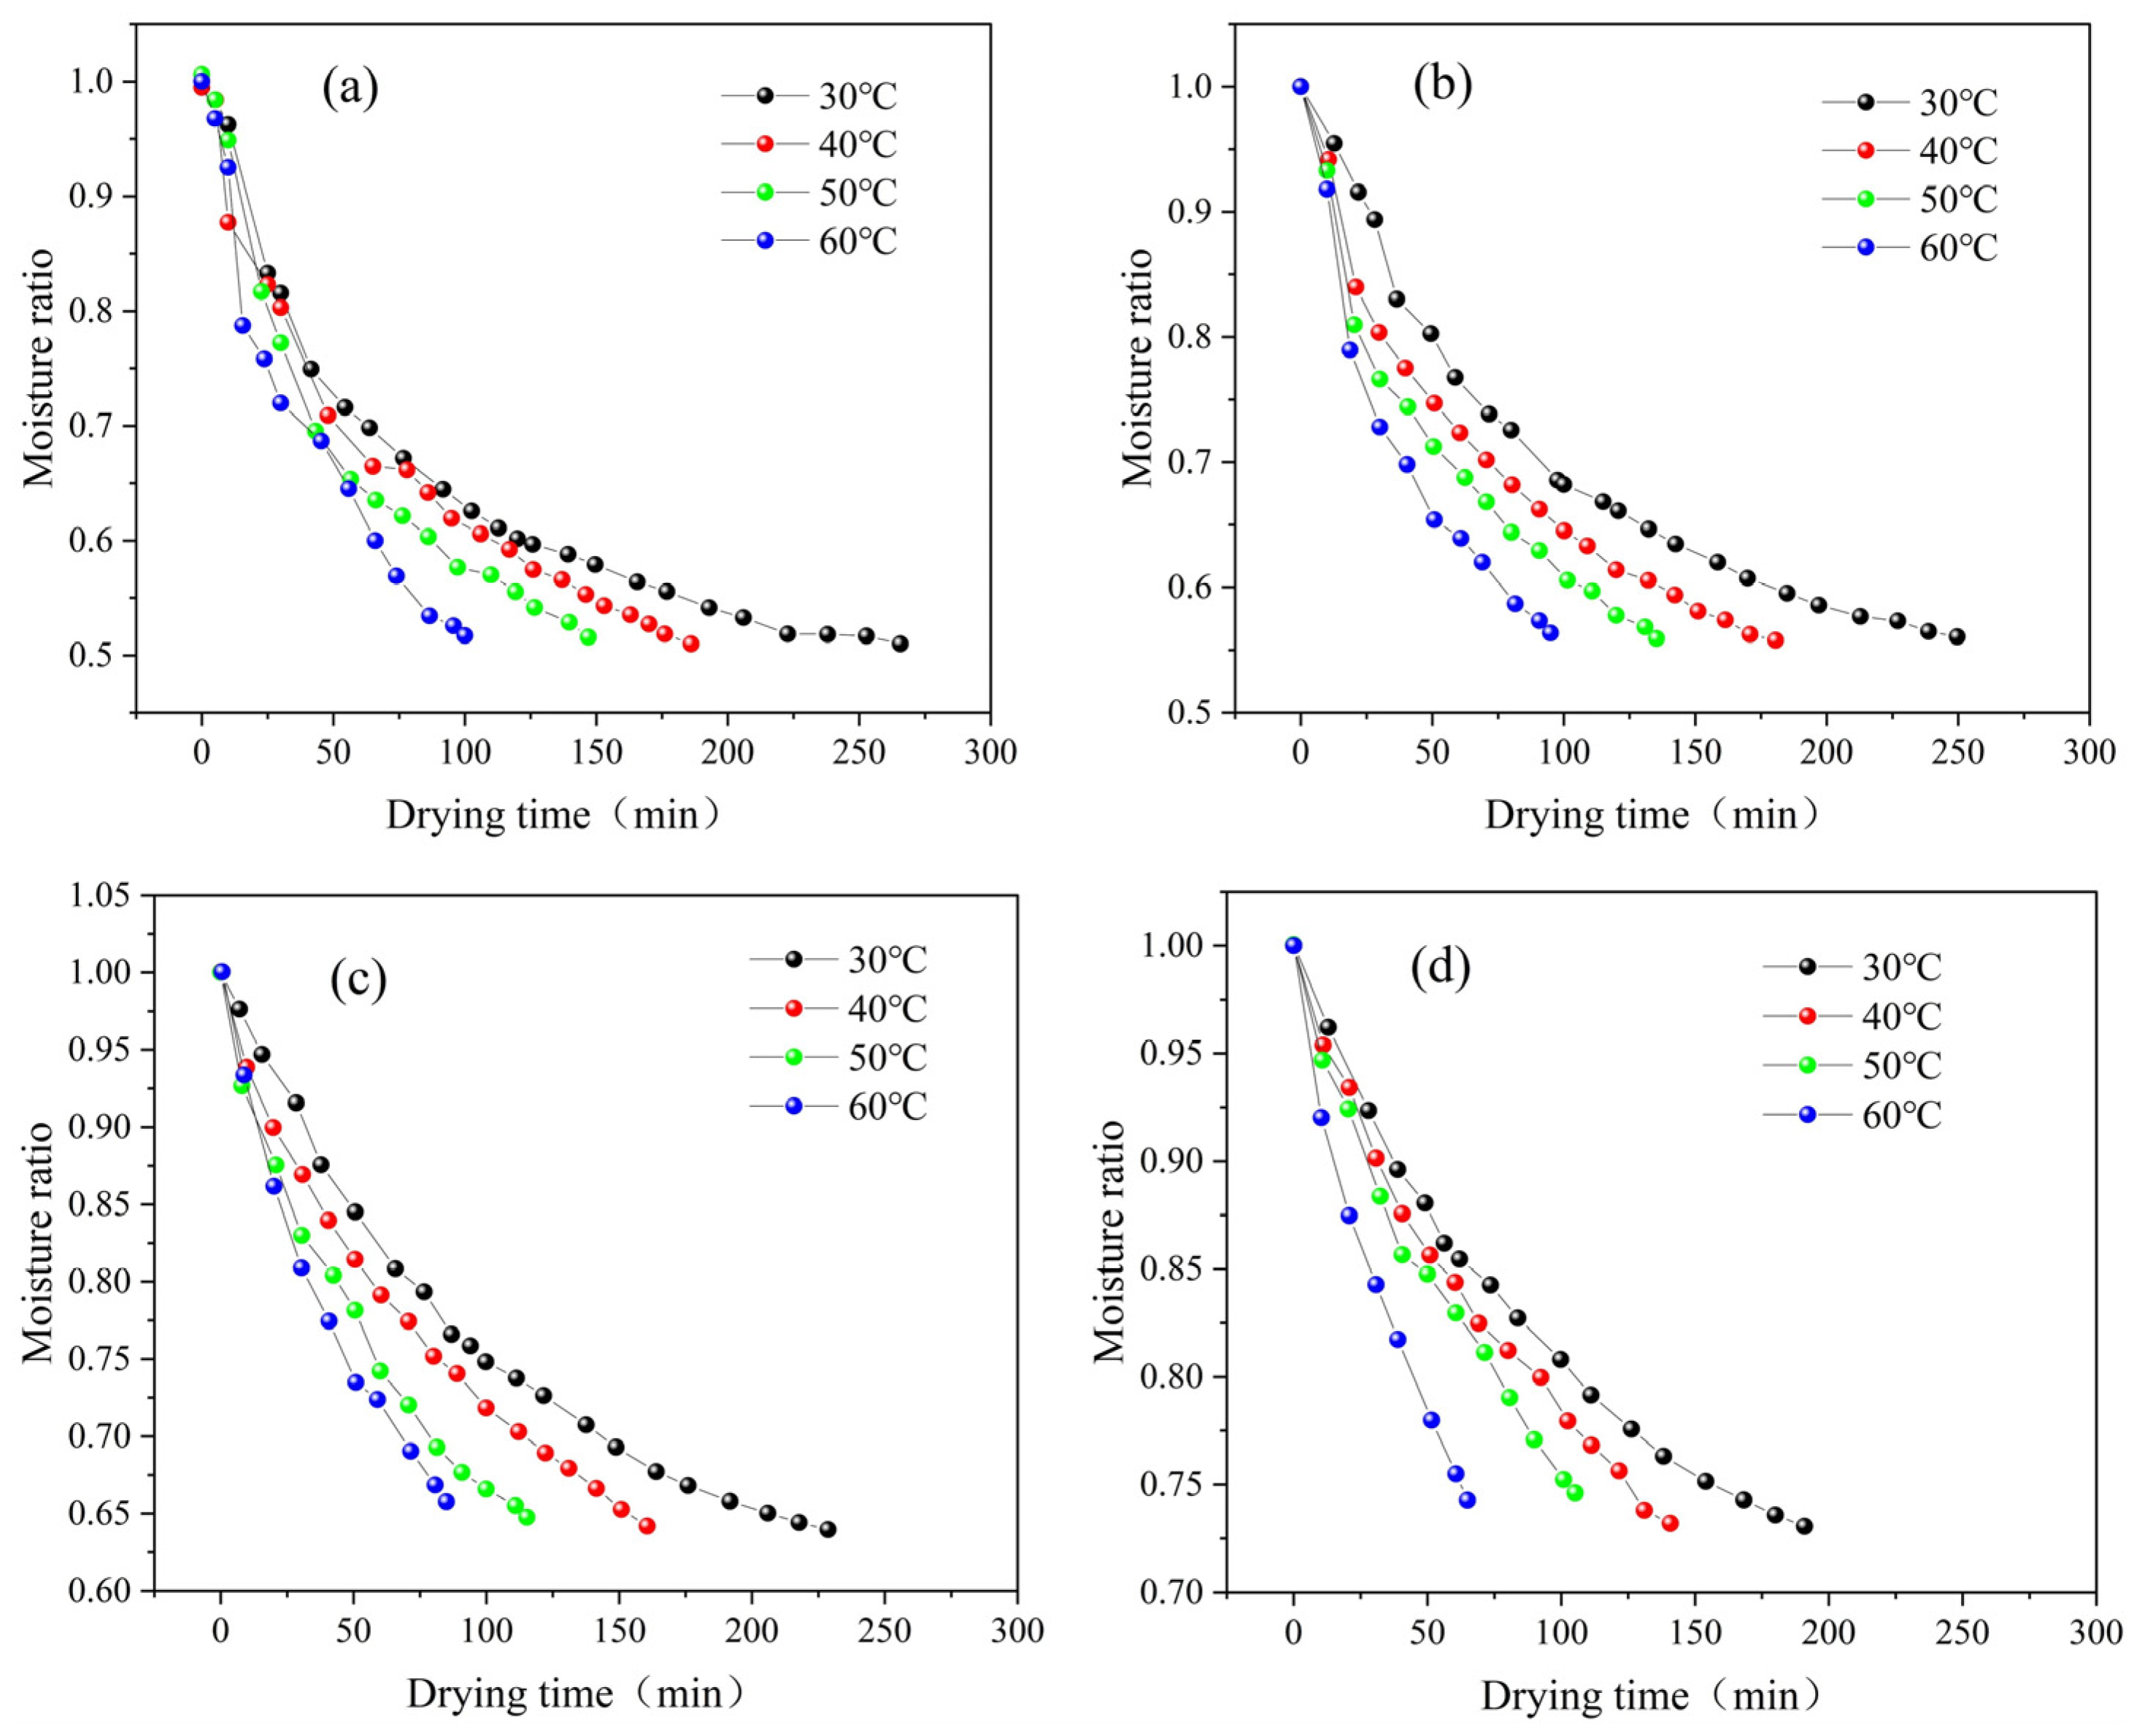
Figure 3 presents the variation patterns of the moisture ratio of paddy with different initial moisture contents (M0) under drying conditions at 30, 40, 50, and 60 °C. The initial moisture content (M0) significantly affected the drying characteristics of paddy. As shown in Figure 3a, the drying time of paddy was significantly longer compared to Figure 3b–d. This phenomenon occurs because paddy with higher moisture content evaporates free water more rapidly during the initial drying phase, resulting in a faster drying rate. As drying progresses, the remaining bound water requires more heat and time to evaporate, causing a slowdown in the moisture migration rate and ultimately extending the overall drying time [26]. In contrast, paddy with a lower initial moisture content requires less drying time and is more efficient [16]. In addition, the drying curves of paddy with different M0 values showed a decreasing trend across all temperature conditions. The moisture decrease was most pronounced during the early drying stages, primarily due to the rapid evaporation of free water. As the drying process continued, the drying rate decreased, which is attributed to the presence of bound water and the internal diffusion characteristics [34].
Figure 4 illustrates the drying rate (DR) of paddy over time at different drying temperatures for four different M0 values. Overall, the drying rate increases significantly with higher drying temperatures. The DR curves were obtained under different drying temperatures, but the same M0 exhibited similar patterns. Initially, the drying rate rapidly increased to a peak, followed by a gradual decline during the later stages. This phenomenon is attributed to the increase in the water diffusion coefficient and the acceleration of latent heat release at higher temperatures [35]. Under different M0 conditions, the drying rate of paddy displayed a similar change pattern. Higher M0 values resulted in a faster drying rate during the early stages of drying, as free water evaporates more readily. Both rising and falling stages were observed in the DR curves. The rising stage is mainly driven by the effect of the high vapor pressure difference, which is critical for achieving rapid drying [36,37]. The falling stage, which occupies the majority of the drying process, plays a crucial role in determining the drying uniformity and quality [35].

3.2. Statistical Analysis of the Percentage of Drying Cracks During Paddy Drying

Paddy undergoes both a rising and falling stage in the drying rate. The relationship between paddy cracking during these two stages is not well understood. To address this, a systematic statistical analysis of the percentage of drying cracks was conducted based on the relationship between M0, drying rate, and drying time. The trend of the percentage of drying cracks for different M0 values and temperatures is shown in Figure 5. Under all four M0 conditions, the percentage of drying cracks increased significantly with increasing drying temperature. At drying temperatures of 30 °C and 40 °C, the percentage of drying cracks was lower, and the increase was more gradual. In contrast, under the high-temperature conditions of 50 °C and 60 °C, the percentage of drying cracks increased significantly. This phenomenon can be attributed to the acceleration of internal moisture evaporation at higher temperatures, which leads to greater internal moisture gradients and stresses, ultimately triggering the formation of cracks [18].
A comparative analysis of Figure 4 and Figure 5 reveals that the rapid increase and subsequent decrease in drying rate create a significant moisture gradient between the interior and exterior of the paddy, which serves as the primary driving force for crack formation [38]. After the drying rate reaches its peak and declines rapidly, crack formation continues to increase during the decline phase. This suggests that crack formation exhibits a delayed effect, potentially being directly related to the rapid evaporation and high internal moisture stress accumulation during the early drying phase rather than solely depending on the instantaneous drying rate [6]. Under high-temperature conditions, a higher initial moisture content results in a greater occurrence of cracks in the paddy. This indicates that the combination of high initial moisture content and high drying temperature significantly amplifies the risk of crack formation. Consequently, in practical production, paddy with high initial moisture content should be prevented from entering the high-temperature rapid drying phase directly.
The percentage of drying cracks in paddy exhibits a significant nonlinear pattern over time, and this dynamic change in crack probability is difficult to describe using a linear model. An exponential model, however, more accurately captures this trend, showing slow growth at the beginning and faster growth toward the end. The percentage of drying cracks (P) is calculated as shown in Equation (20).
P = a · e b t + c + d t
where a, b, c, and d are the fitted parameters of the model; t is the drying time, min.
Table 1 shows the model fitting parameters for different M0 and drying temperatures. The coefficient of determination (R2) is greater than 0.85, indicating that the crack prediction model fits the data well. The mean relative percentage error (MRPE) ranges from 4.7% to 11.42%, demonstrating that the prediction model exhibits high prediction accuracy. Overall, drying temperatures of 50 °C and 60 °C result in higher R2 values and lower MRPE values, suggesting that under high-temperature conditions, the crack growth trend more closely aligns with the exponential-linear model characteristics. In contrast, at drying temperatures of 30 °C and 40 °C, the model performance is slightly lower, which may be related to the crack formation mechanism and the applicability of this model.

3.3. Regional Division of Drying Crack Formation in Paddy

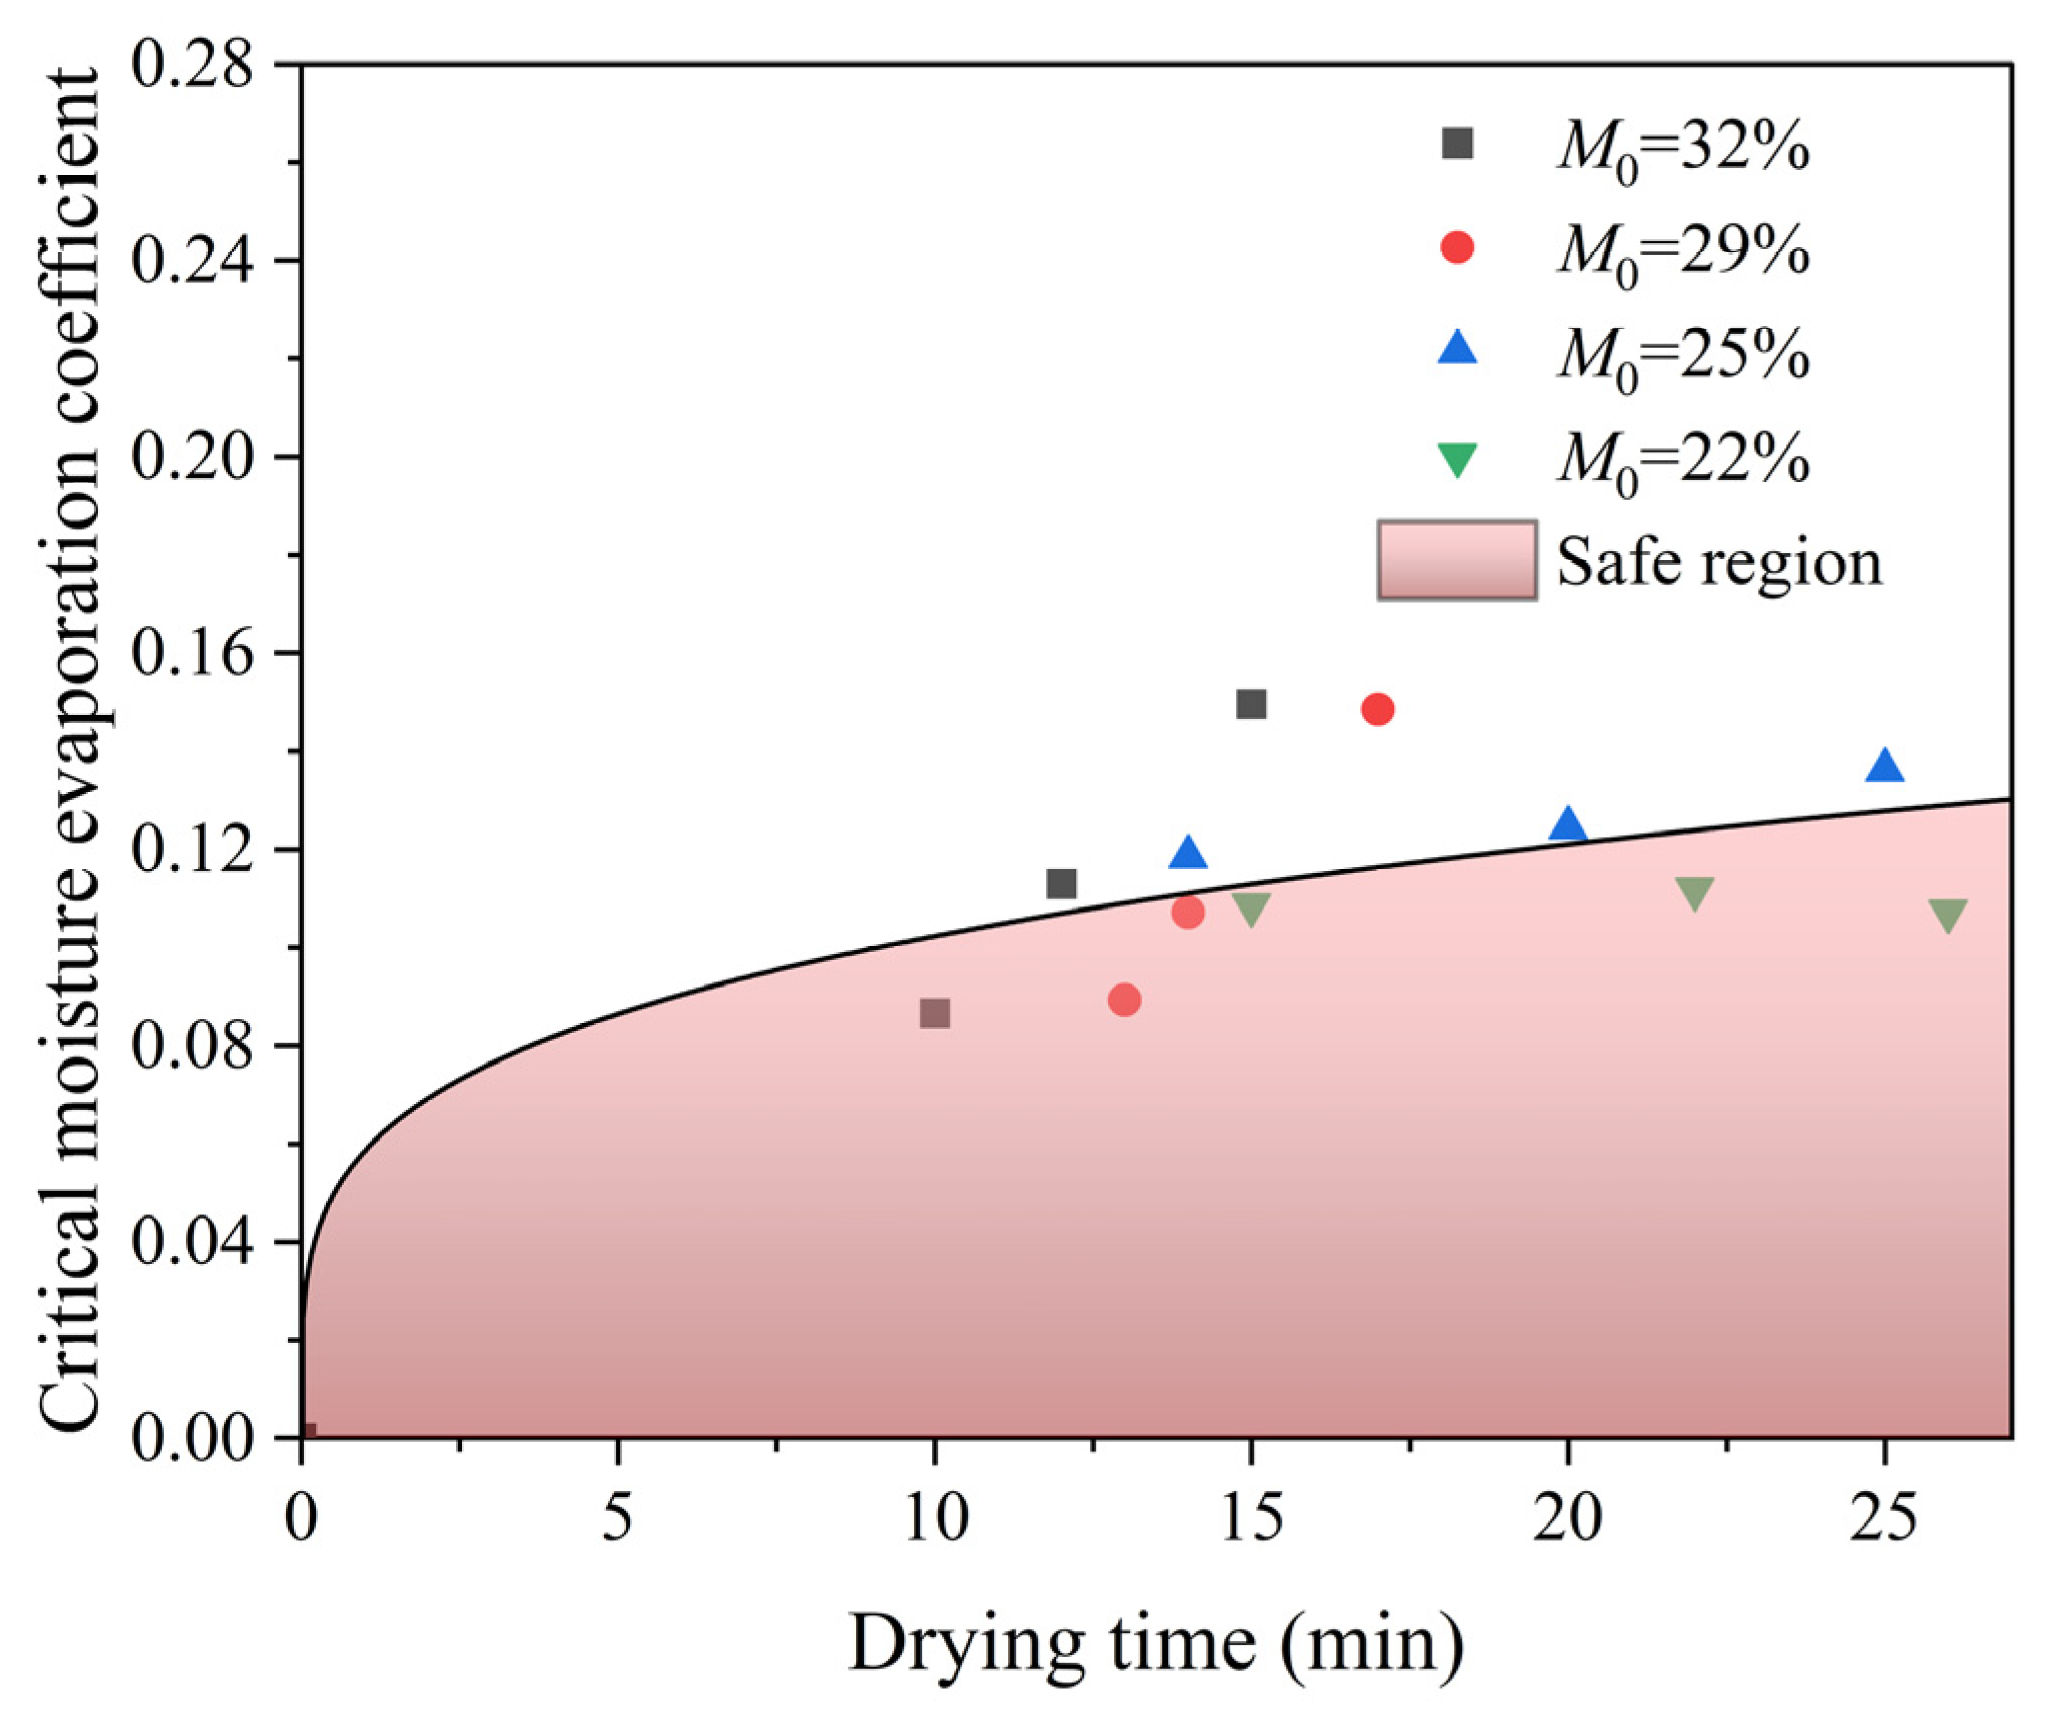
Figure 6 illustrates the relationship between the critical moisture evaporation coefficient and drying time under different M0 conditions. The critical moisture evaporation coefficient (Cw) represents a threshold value in the moisture evaporation process; cracks form in the paddy once this value is exceeded. Cw serves as a critical point that determines the formation of cracks, quantifying the transition between water evaporation and particle cracking, as shown in Equation (21) [16].
C w = 1 M z M 0
where Mz is the moisture content at the threshold state, kg/kg. In this study, a crack formation probability of 4% was established as the critical threshold [39]. To ensure the reliability and generalizability of the results, further drying experiments were conducted under temperature conditions of 35 °C, 45 °C, and 55 °C, in addition to the available experimental data. This study revealed that the critical threshold was only reached when the drying temperature was 50 °C, 55 °C, or 60 °C for paddy grains under different M0 conditions.
As shown in Figure 6, Cw demonstrates a nonlinear relationship with drying time. There is a specific threshold value for Cw in relation to paddy crack formation, which is closely linked to the M0. When Cw exceeds the critical threshold, the number of cracks formed in the paddy grains increases significantly. Conversely, when Cw is below the critical threshold, the drying process remains within a safe region, and fewer cracks are formed. The formation of cracks in paddy results from the combined effects of the moisture gradient and internal stress. By controlling M0 and drying temperature, the critical moisture evaporation coefficient can be effectively regulated to delay crack formation. There is a correlation between the dynamic evolution of the moisture gradient within the paddy and crack formation [22]. However, due to the complex microstructure of paddy, changes in moisture distribution and gradient within the grains are challenging to directly observe and quantify using traditional experimental methods. To address this challenge, this study employed numerical simulation to systematically analyze moisture migration and stress distribution during convective drying, providing a theoretical explanation for the stage-by-stage changes in paddy cracking characteristics [40].

3.4. Analysis of Crack Formation Mechanism

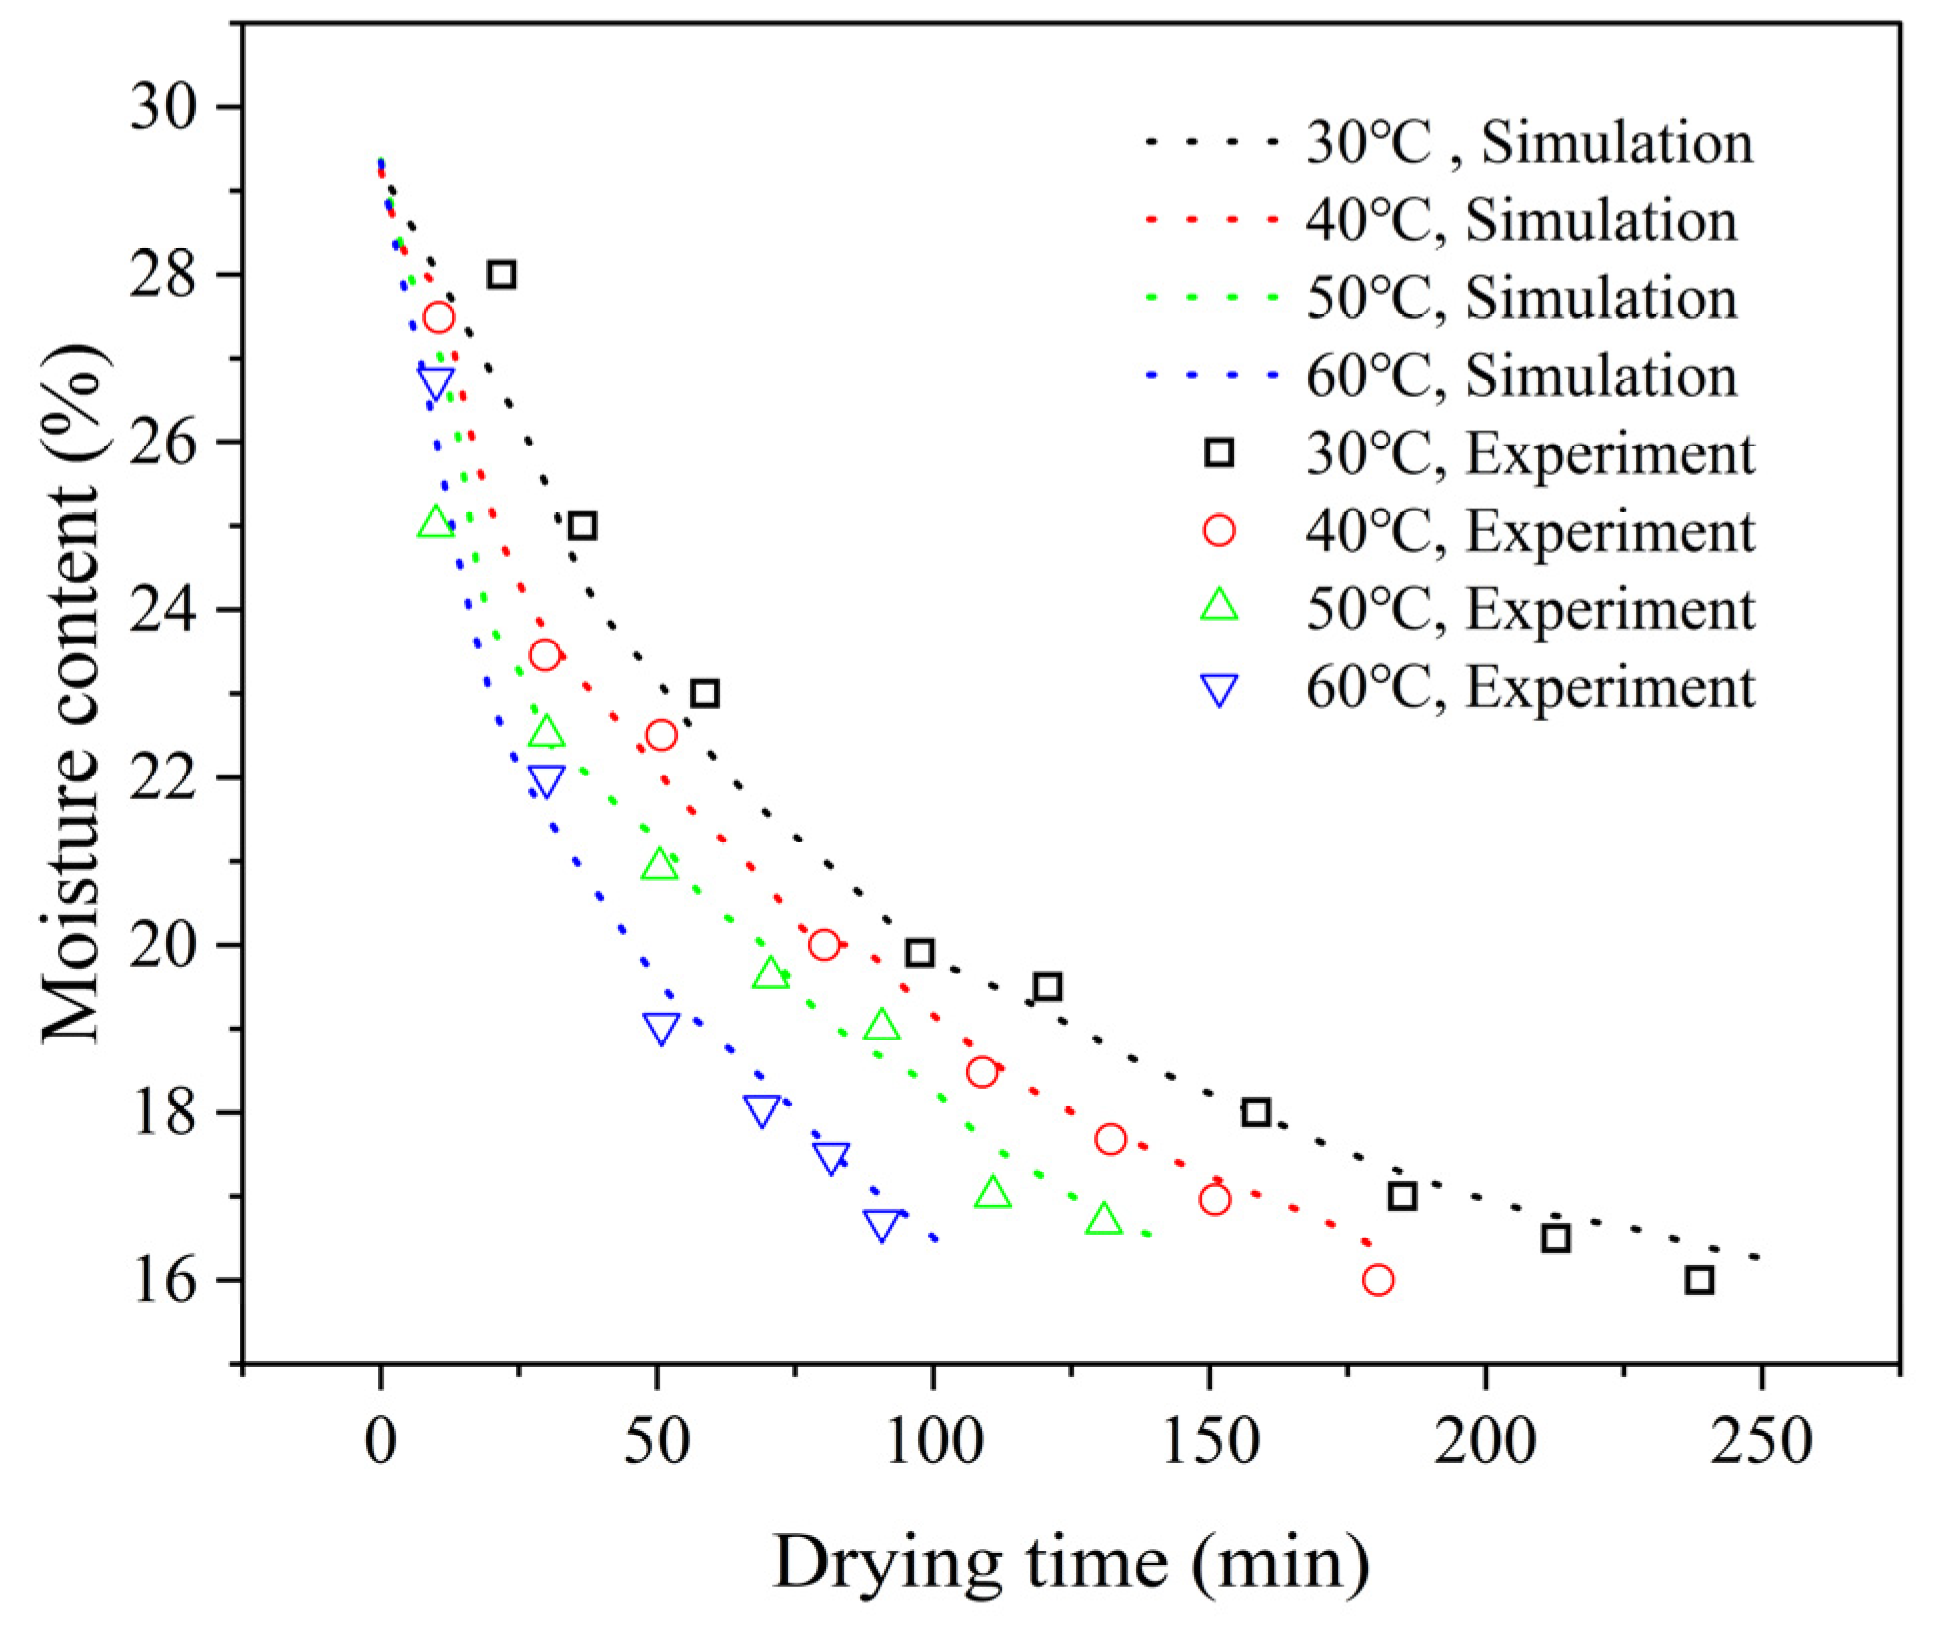
Figure 7 compares the experimental and numerically calculated drying curves at different drying temperatures with an M0 of 29%. The numerical simulation curves closely match the experimental data under drying conditions of 30 and 40 °C, indicating that the model accurately describes the moisture migration pattern over a longer time scale. However, under 50 and 60 °C drying conditions, some deviation between the numerical simulation results and experimental data was observed. This deviation may be due to the excessively rapid evaporation of moisture from the surface of the paddy under high-temperature conditions, which leads to discrepancies between the simulated and experimental moisture content values. Overall, the simulation results based on the three-dimensional scanned geometric model of paddy showed good agreement with the experimental data across various drying temperatures. The maximum numerical deviation of this model during the simulation process was 8.48%. A numerical deviation of less than 15% was considered acceptable in previous simulation studies of drying [31].
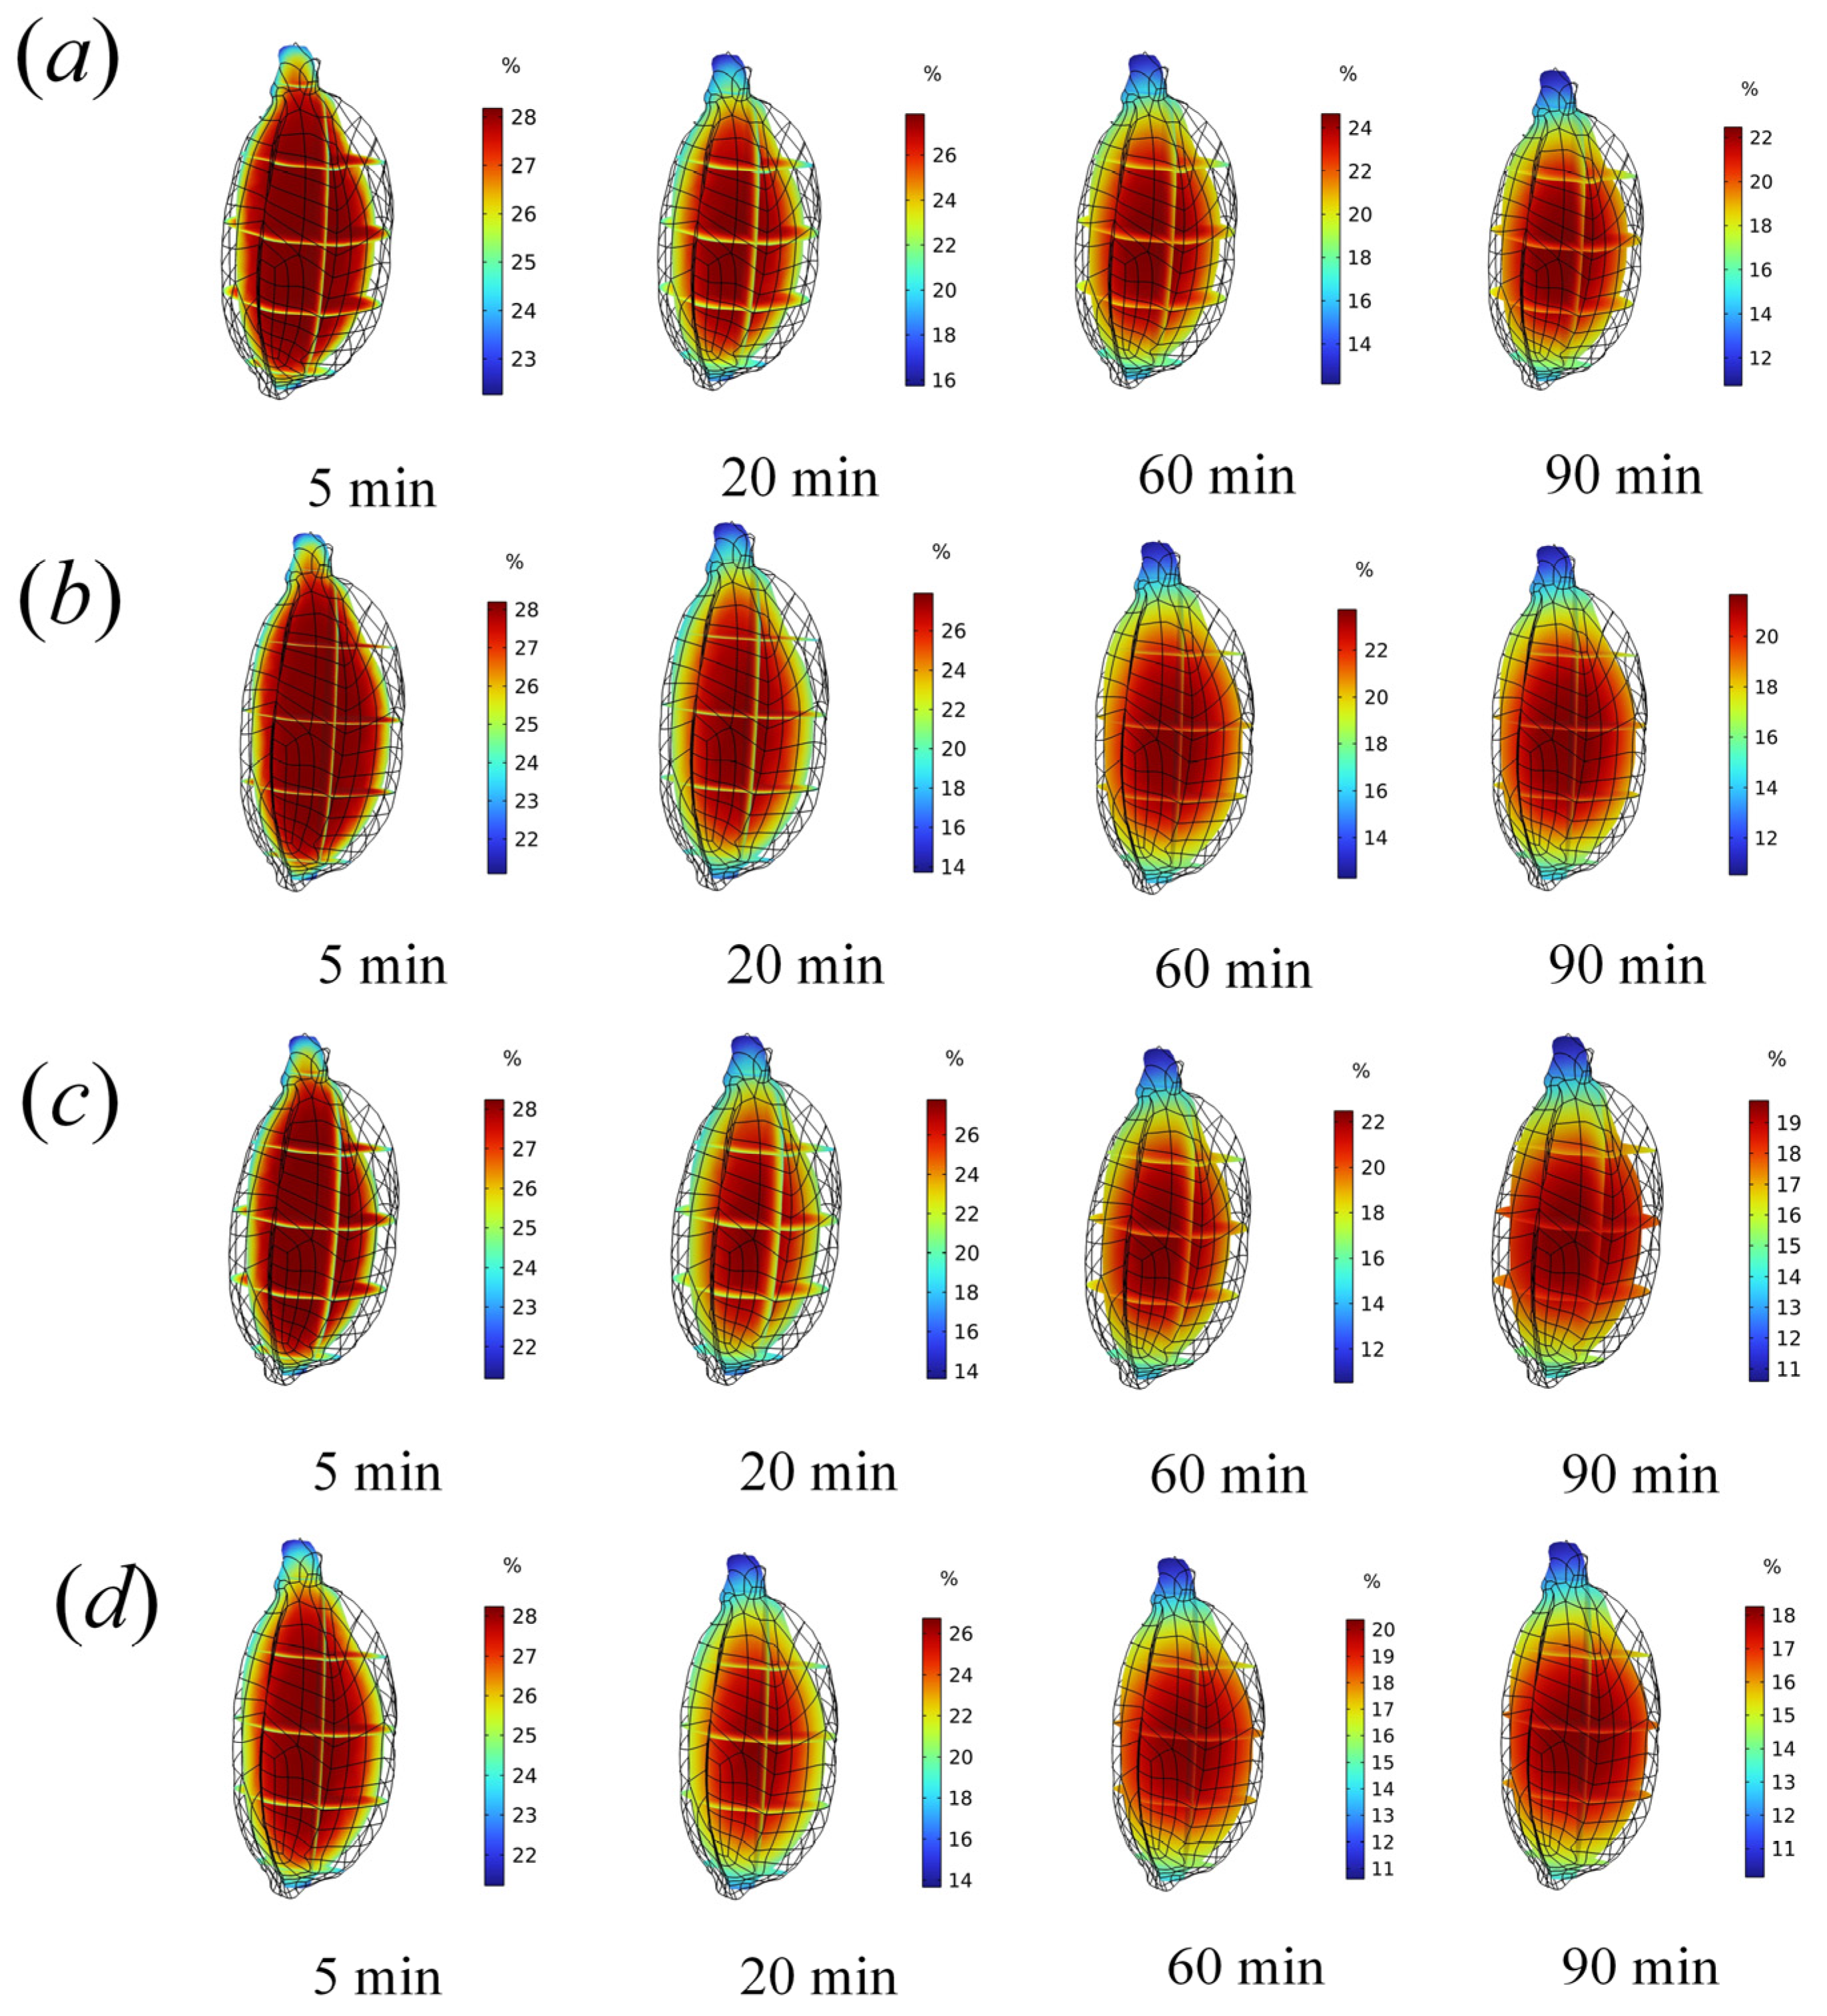
Figure 8 shows the moisture distribution pattern within the paddy particles under different drying temperature conditions. After 5 min of drying, the moisture distribution at all temperature conditions exhibited lower moisture in the outer layer and higher moisture in the inner layer. This pattern was linked to the rate of moisture migration. At 20 min of drying, a noticeable difference in moisture content between the center and surface of the paddy remained. The moisture migration rate was fastest under the 60 °C drying condition, while it was slower under the 30 °C drying condition compared to the other temperatures. After 60 min of drying, the highest moisture content inside the paddy at 30 °C was 24.6%, which remained concentrated in the central region. Under the 40 °C, 50 °C, and 60 °C drying conditions, the highest internal moisture contents were 23.5%, 22%, and 20%, respectively. The lowest internal moisture content was observed under the 60 °C drying condition, indicating higher drying efficiency. At 90 min of drying, the internal moisture distribution pattern in the paddy remained similar to that observed at 60 min. Despite numerical differences in internal moisture distribution at various drying stages, the overall pattern of moisture distribution remained consistent. Further quantitative analysis of the internal moisture gradient and stress changes is required to investigate the causes of crack formation during drying.
To more accurately quantify the moisture changes within the rice grain, the concept of moisture gradient (MG) was employed for analysis. The moisture gradient is defined as the ratio of the difference in moisture content between the center and a specific internal location of the paddy to the distance between the two points, as shown in Equation (22).
M G = M oc M i d i
where Mi is the moisture content at position i, kg/kg; Moc is the moisture content at the center position of the paddy kernel, kg/kg; di is the distance from position i to the center of the paddy kernel, m.
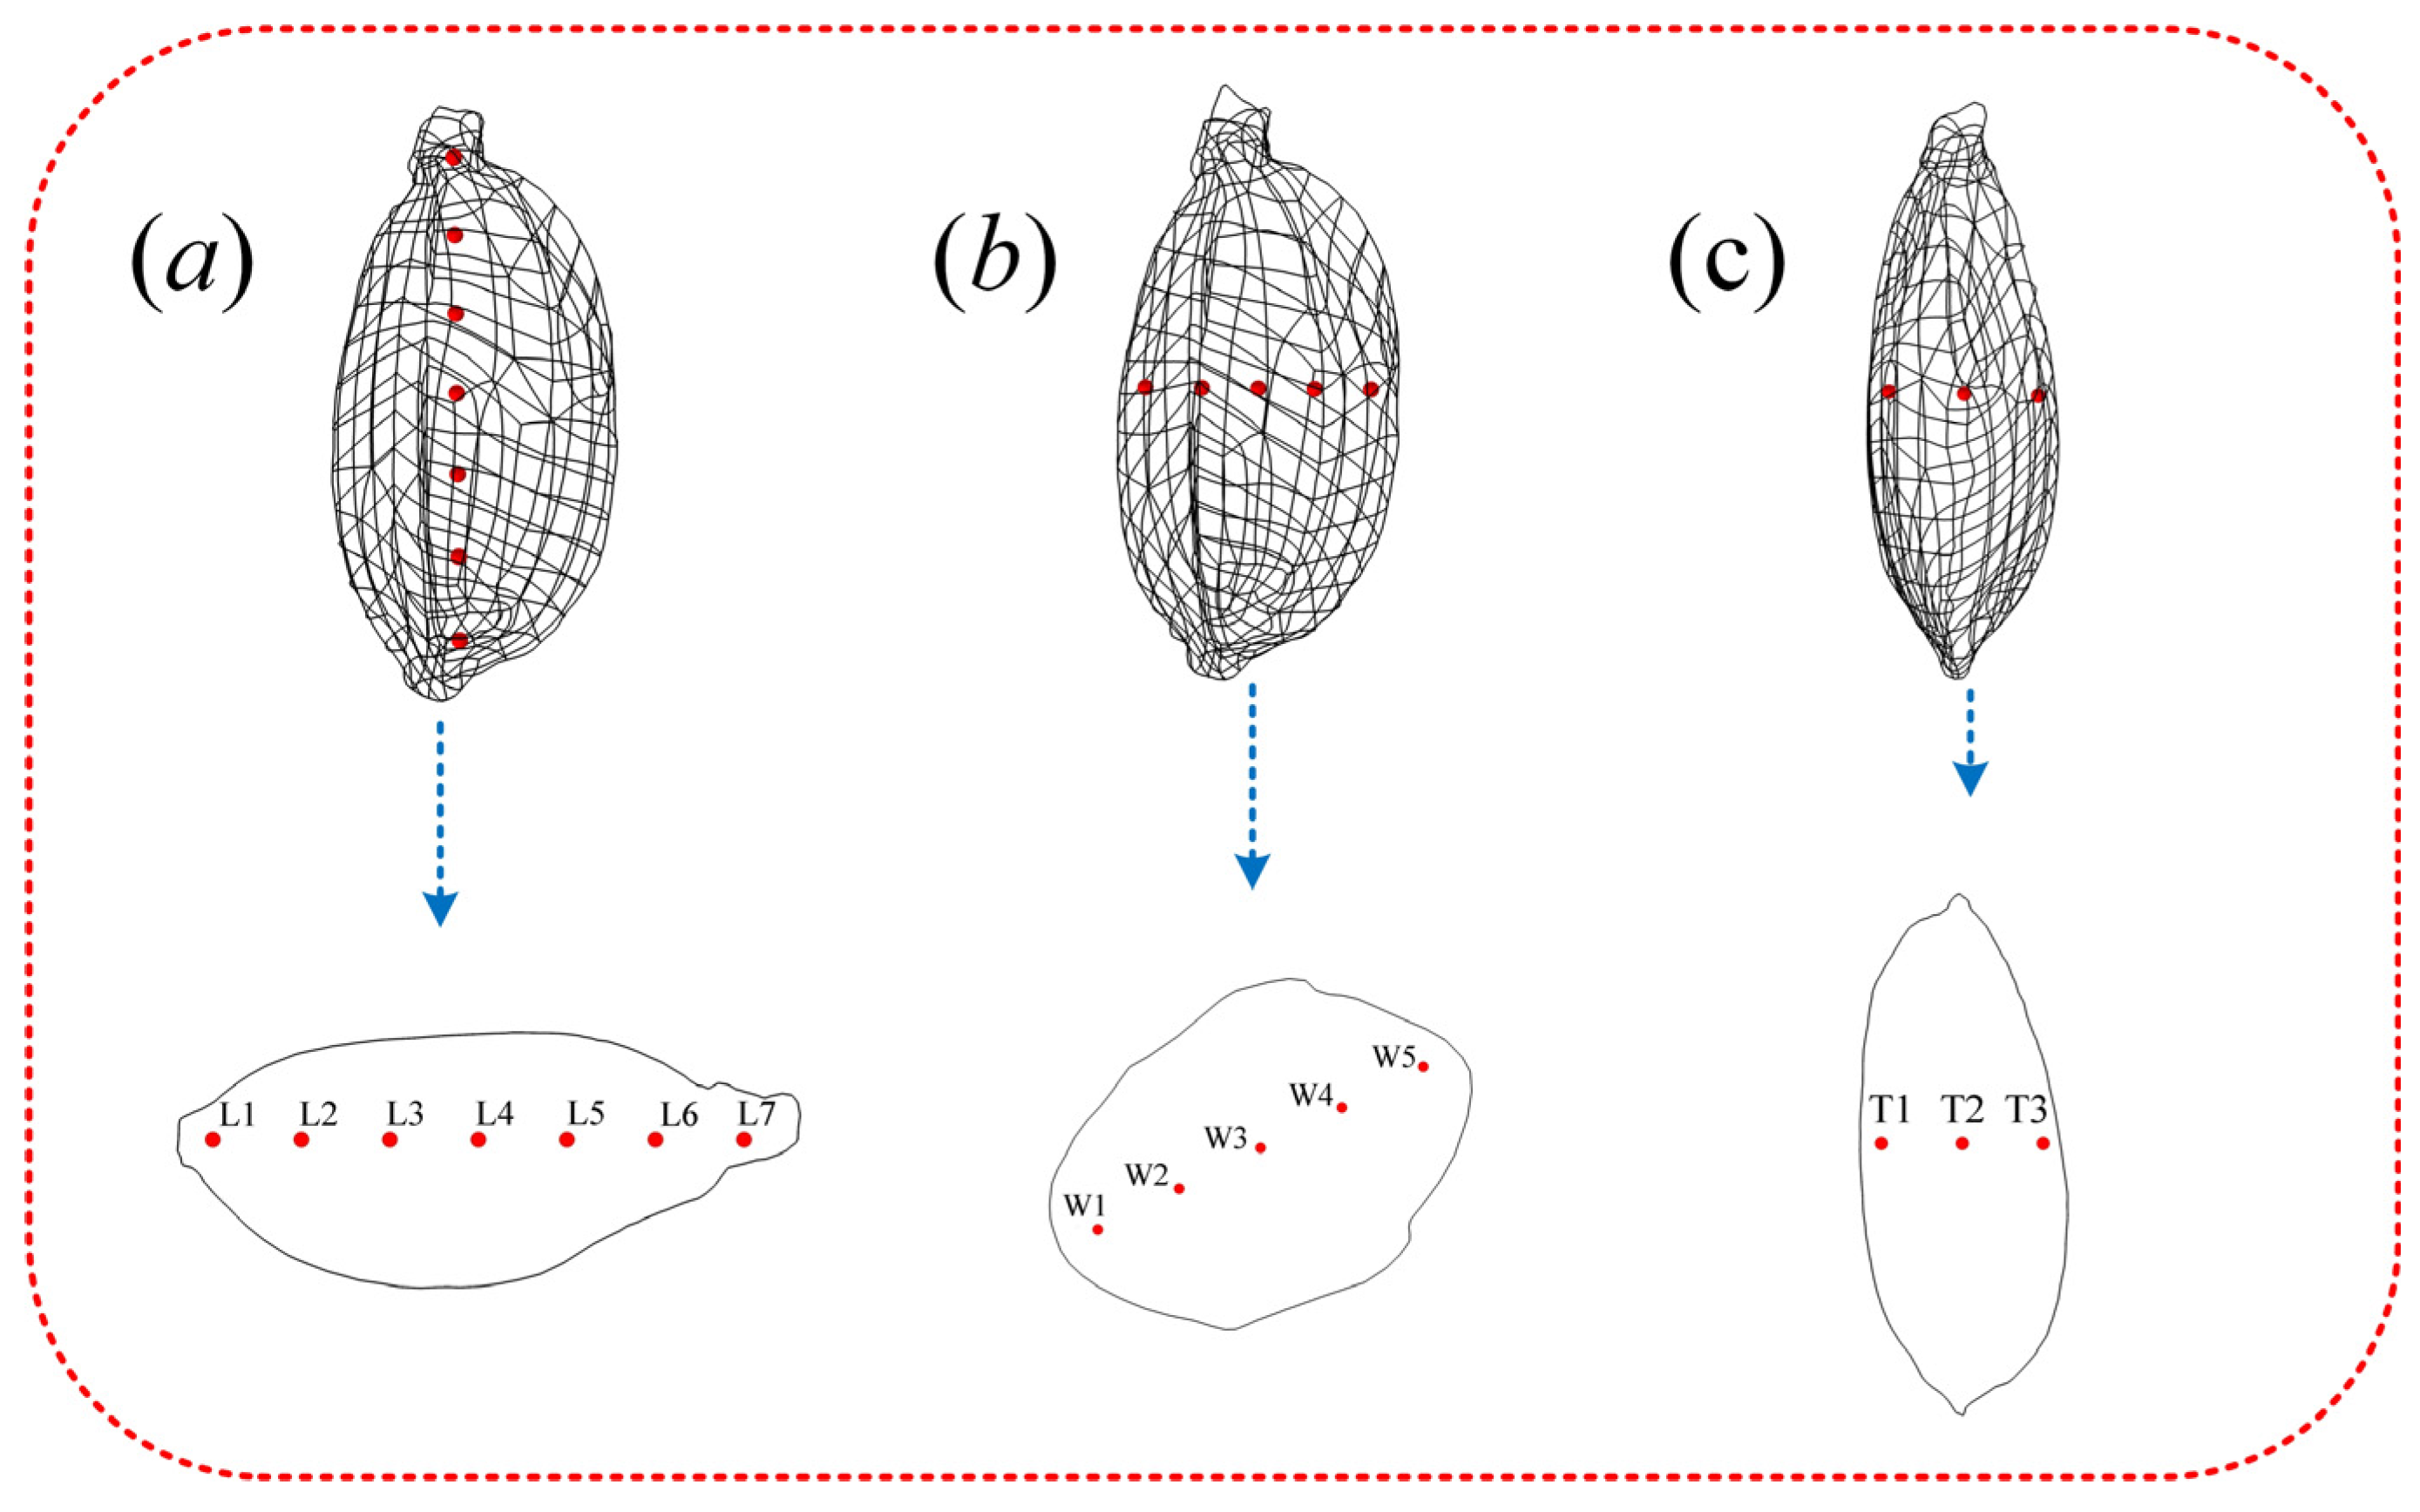
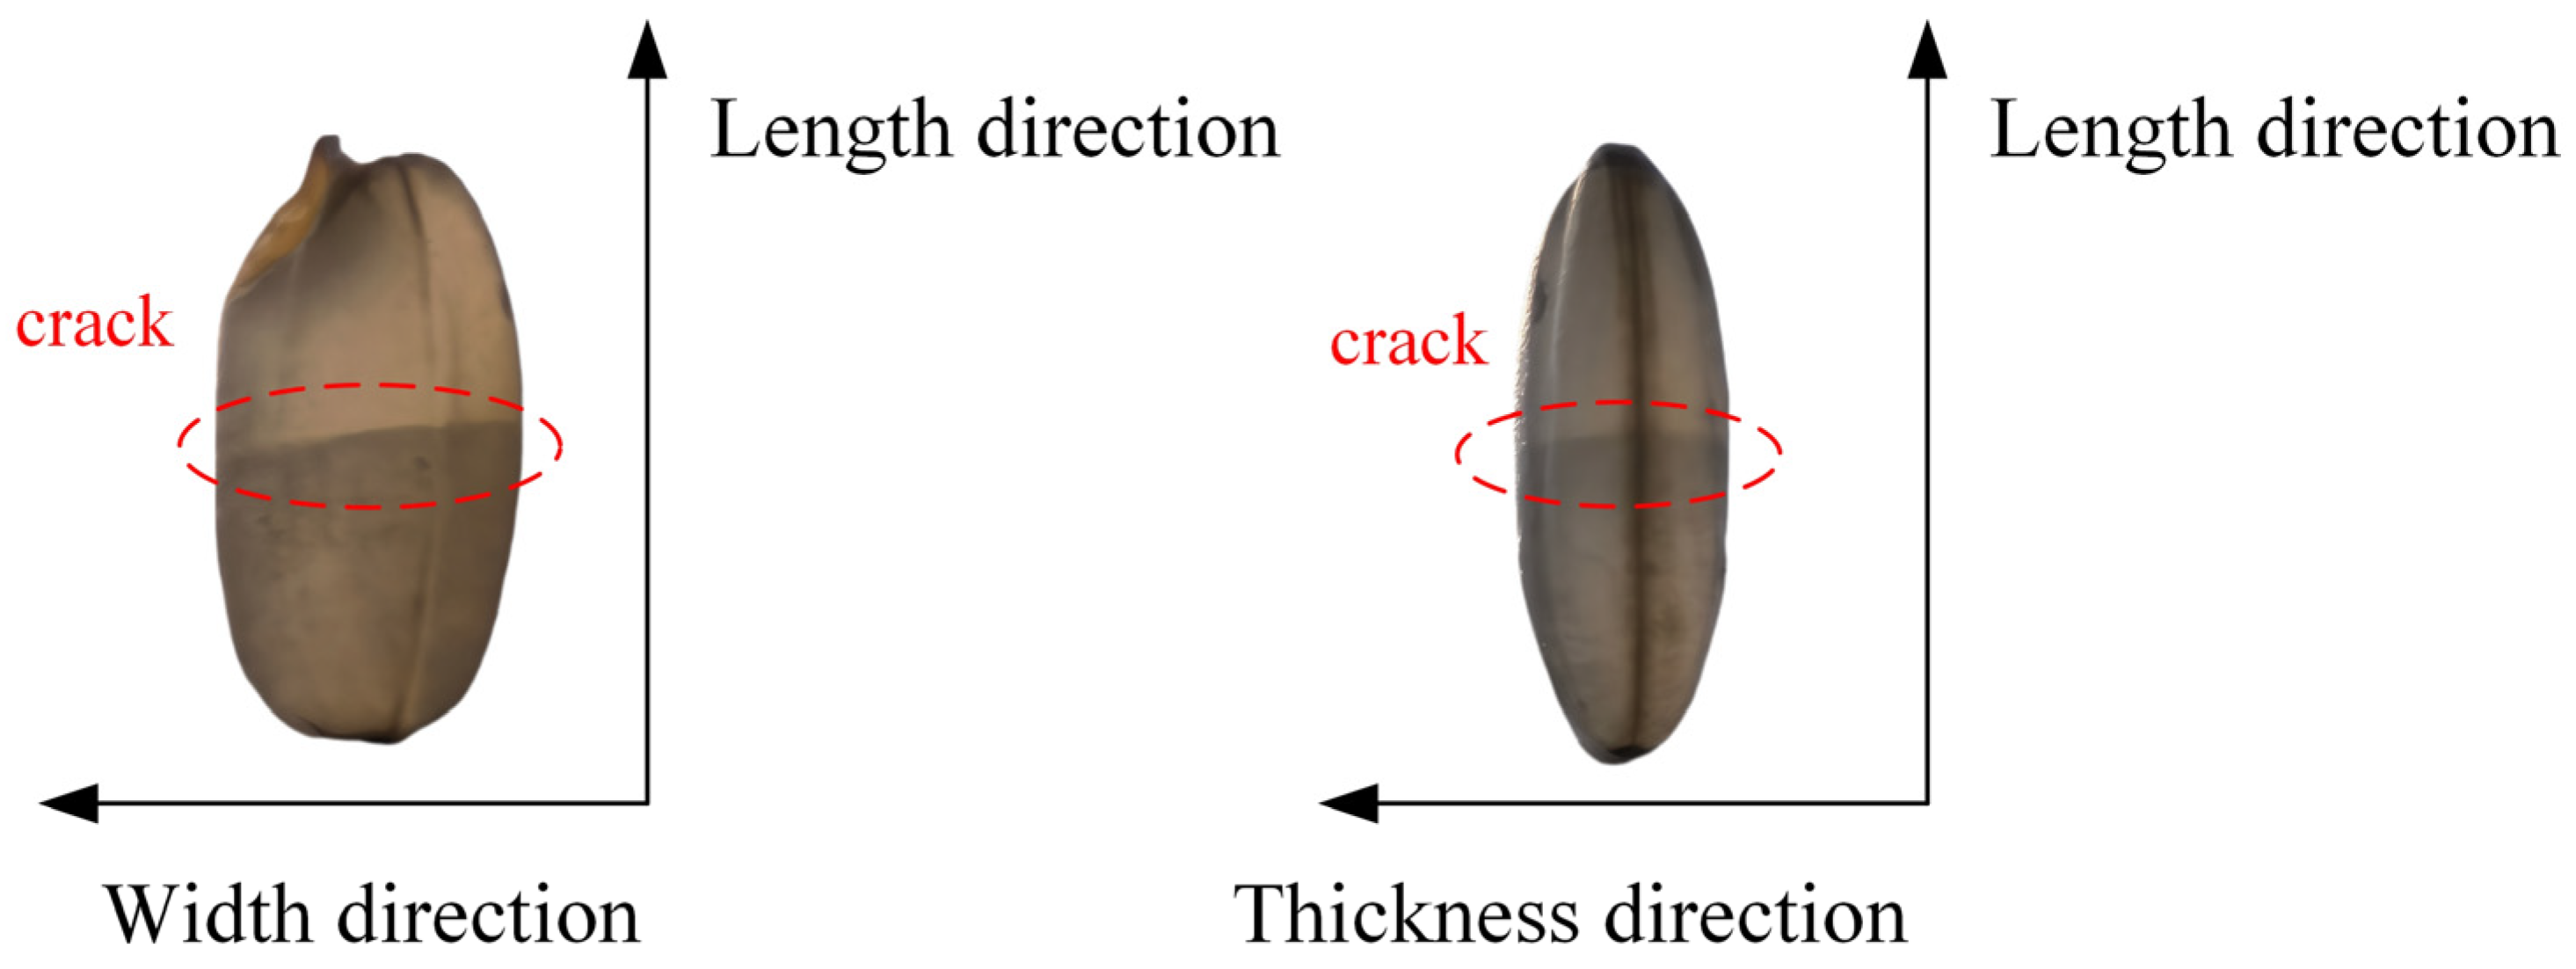
Since the paddy particle is a three-dimensional solid model, the shape of the center layer cross-section is asymmetric and irregular. This study focuses primarily on the variation in the moisture gradient at different locations within the center layer cross-section. Based on the optical scanning three-dimensional model of the paddy particle, multiple monitoring points were selected along the length, width, and thickness directions. The number of monitoring points in the length, width, and thickness directions were 7, 5, and 3, respectively (Figure 9).
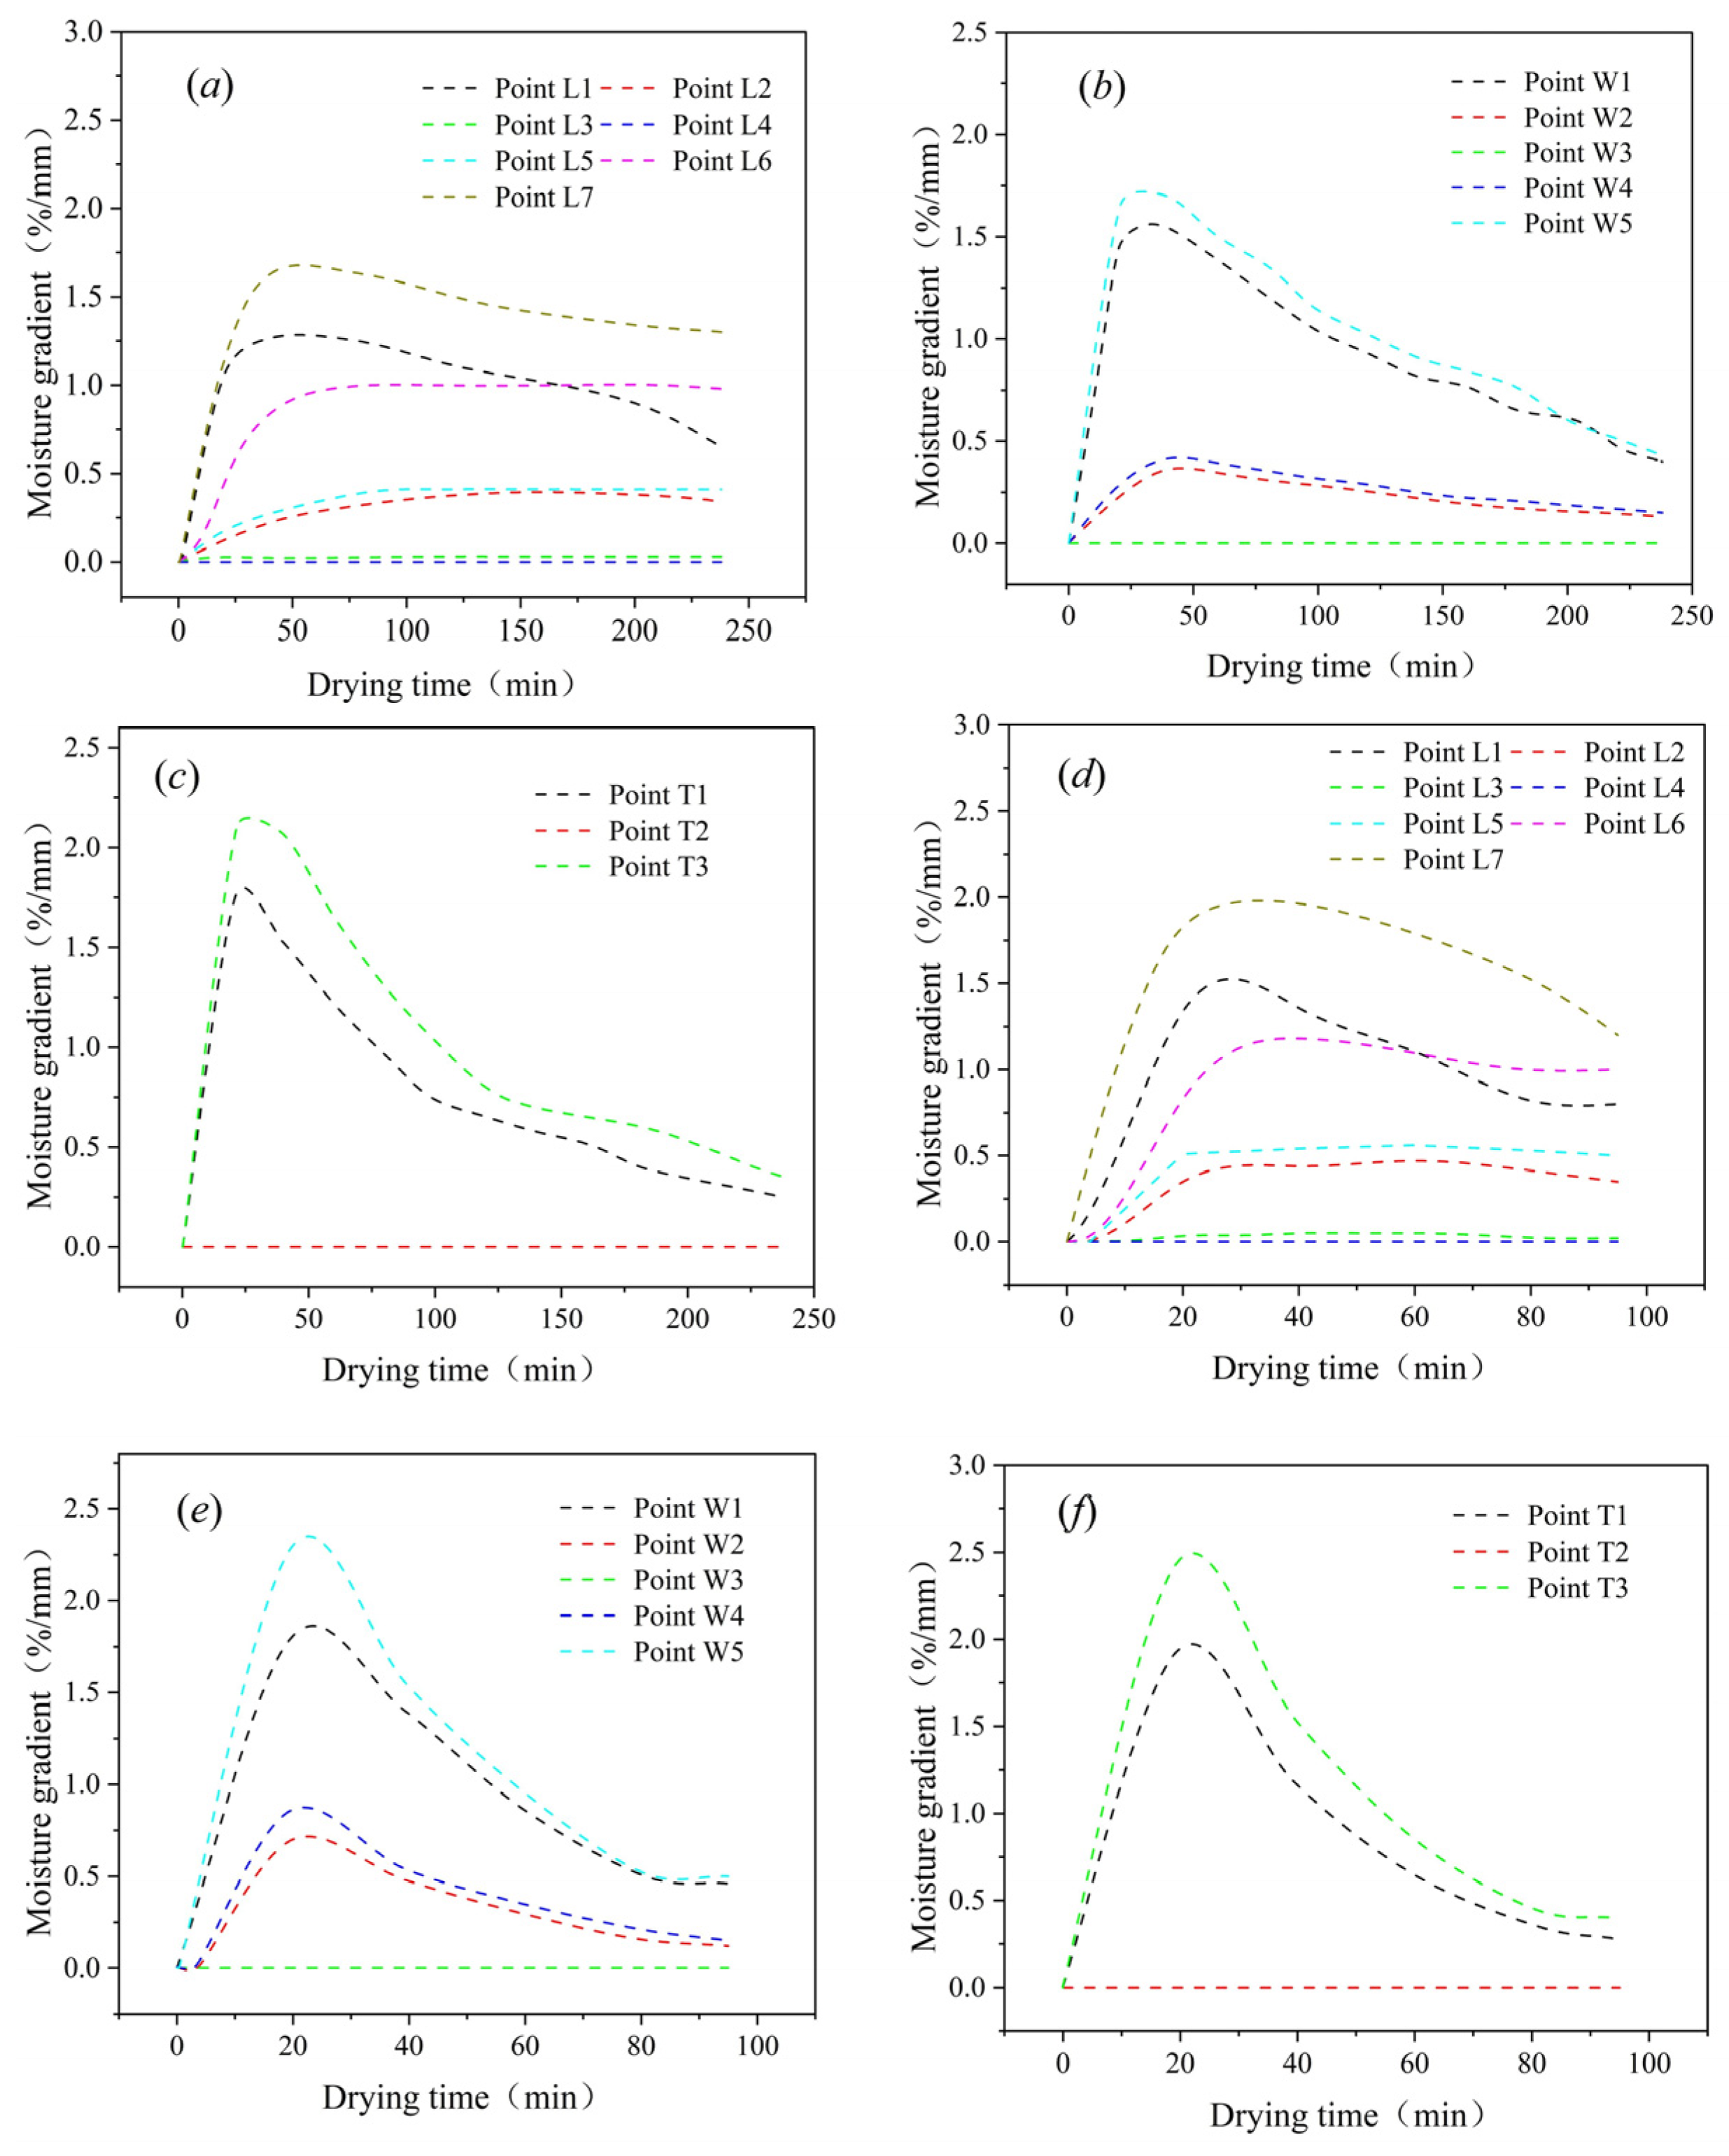
The moisture gradients at the monitoring points along the length, width, and thickness directions all exhibit a trend of initially increasing and then decreasing, with varying magnitudes of change. As shown in Figure 10a,d, under 60 °C drying conditions, the moisture gradient at monitoring point L7 reaches a maximum of 2%/mm, after which it decreases and stabilizes. This indicates that the moisture migration rate at the ends of the paddy in the length direction is relatively fast. The moisture gradients at other monitoring points are lower than those at the two end regions of the paddy. Under the 30 °C drying temperature, the maximum gradient at monitoring point L7 is approximately 1.65%/mm, showing a slower moisture migration process compared to the 60 °C drying temperature. Comparing Figure 10b,e, the trend of the moisture gradient in the width direction is similar to that in the length direction. Under 30 °C and 60 °C drying conditions, the maximum gradients at monitoring point W5 are 1.7%/mm and 2.3%/mm, respectively. The moisture migration process in the width direction is slower at 30 °C, which helps to reduce drying stress [40]. Figure 10c,f reveals that under both 30 °C and 60 °C drying conditions, the maximum gradients at monitoring point T3 are 2.1%/mm and 2.5%/mm, respectively. The moisture gradient in the thickness direction is highest, indicating a significant influence of drying temperature on moisture migration along the shorter diffusion path. Under both 60 °C and 30 °C drying conditions, the maximum moisture gradient observed in various orientations within the paddy reveals that the gradient in the thickness direction exceeds those in the width and length directions, respectively. In summary, the moisture gradient in the length direction is smaller, and the moisture distribution is more uniform. This occurs because the shorter diffusion path in the thickness direction leads to predominantly thickness-oriented moisture migration, resulting in a steeper gradient. Although high-temperature drying facilitates rapid moisture removal, it is important to monitor potential stress caused by excessive moisture gradients in the thickness direction [25].
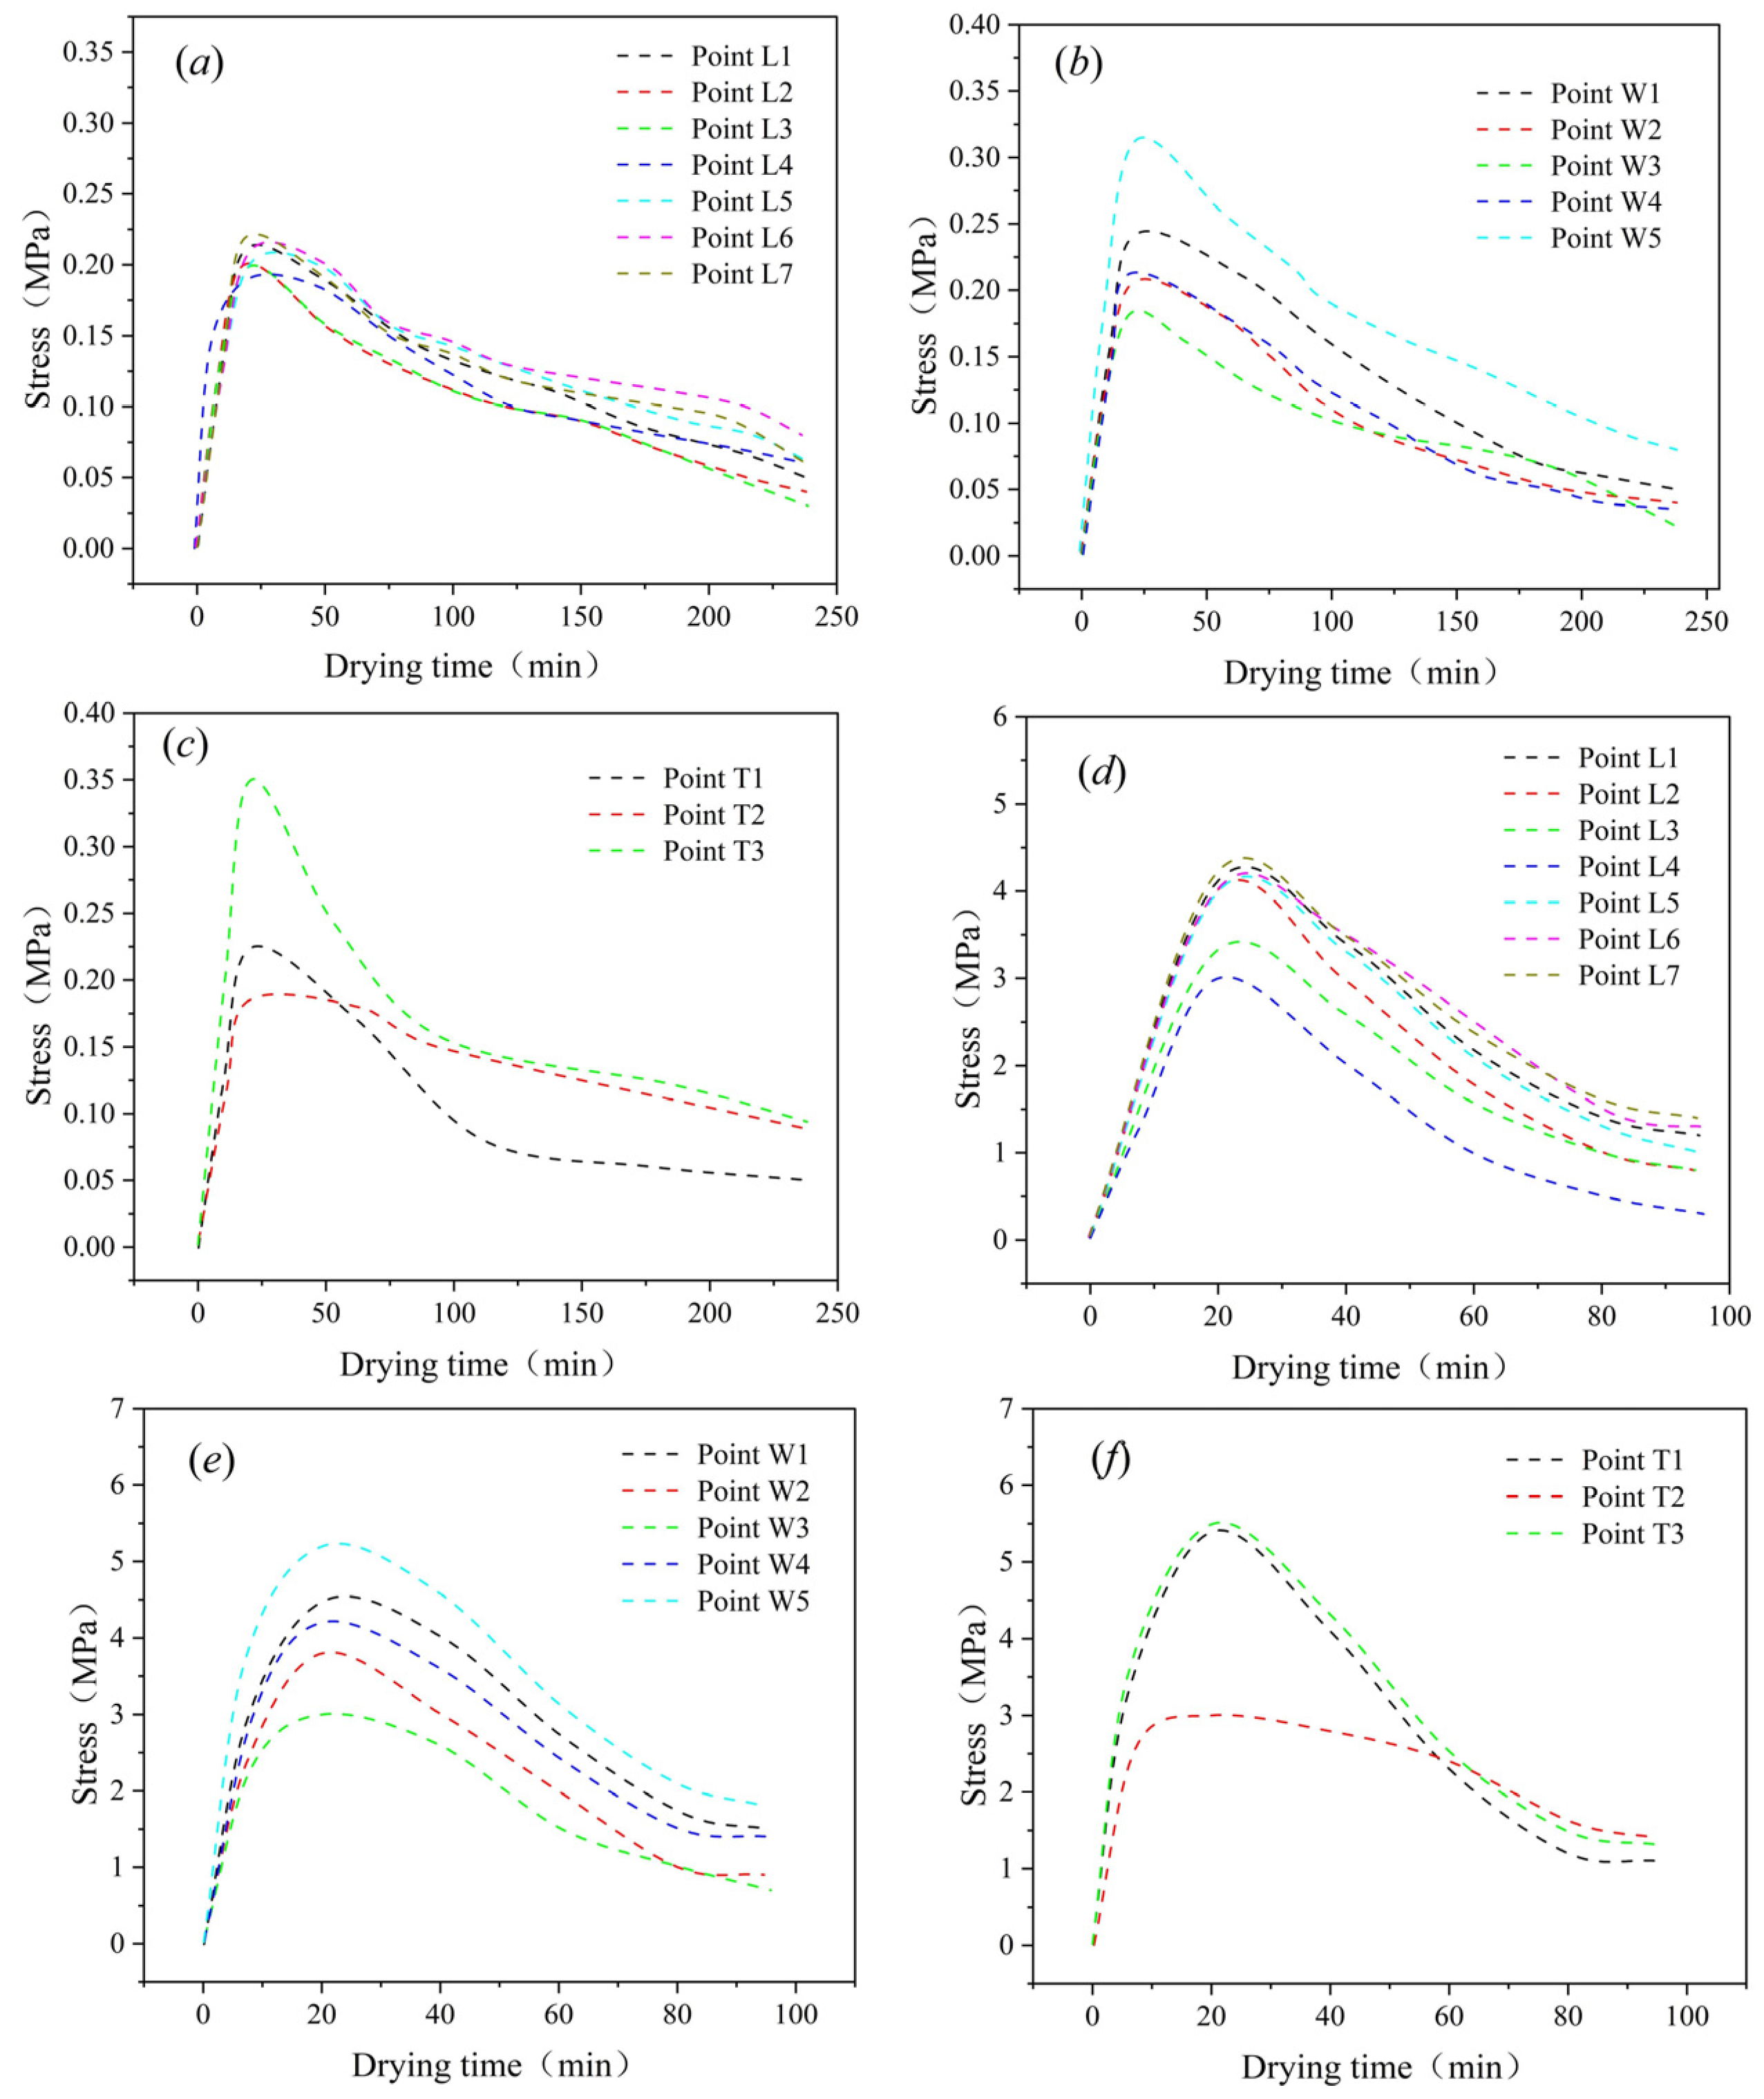
Figure 11 illustrates the effects of drying temperatures of 30 °C and 60 °C on the internal stresses of paddy. The stress along the length, width, and thickness of the paddy increased initially, peaking before a gradual decline. Figure 11a,d demonstrates that at 60 °C, the stress at monitoring point L7 along the paddy’s length direction reached a maximum of 4.2 MPa, primarily due to rapid moisture migration and evaporation at L7, causing an instantaneous rise in the moisture gradient and significant drying stress. As drying continued, this gradient at L7 diminished, reducing the stress. At 30 °C, the maximum stress at L7 was 0.22 MPa, indicating slower moisture migration and lower stress, thus decreasing the likelihood of crack development [17]. Figure 11b,e shows that the peak stress at W5 under 30 °C and 60 °C drying conditions was 0.32 MPa and 5.2 MPa, respectively. According to Figure 11c,f, the peak stresses at T3 under 30 °C and 60 °C were 0.35 MPa and 5.5 MPa, respectively. Overall, stress variations at different monitoring points corresponded with changes in the moisture gradient, with stress values in the thickness and width directions remaining relatively high and similar under both temperature conditions. Consequently, the most significant stress peaks in paddy were predominantly along the short-axis direction.
The main locations of crack formation in paddy, as shown in Figure 12, occur along the short axis of the kernel, driven by the combined effects of moisture gradients and stress in the thickness and width directions. This observation aligns closely with the numerical simulations of moisture gradient and stress distribution [41]. The results suggest that the cumulative impact of the moisture gradient is the primary cause of crack formation, where a higher gradient induces greater stress during drying, leading to cracks concentrated primarily along the short-axis direction of the paddy.
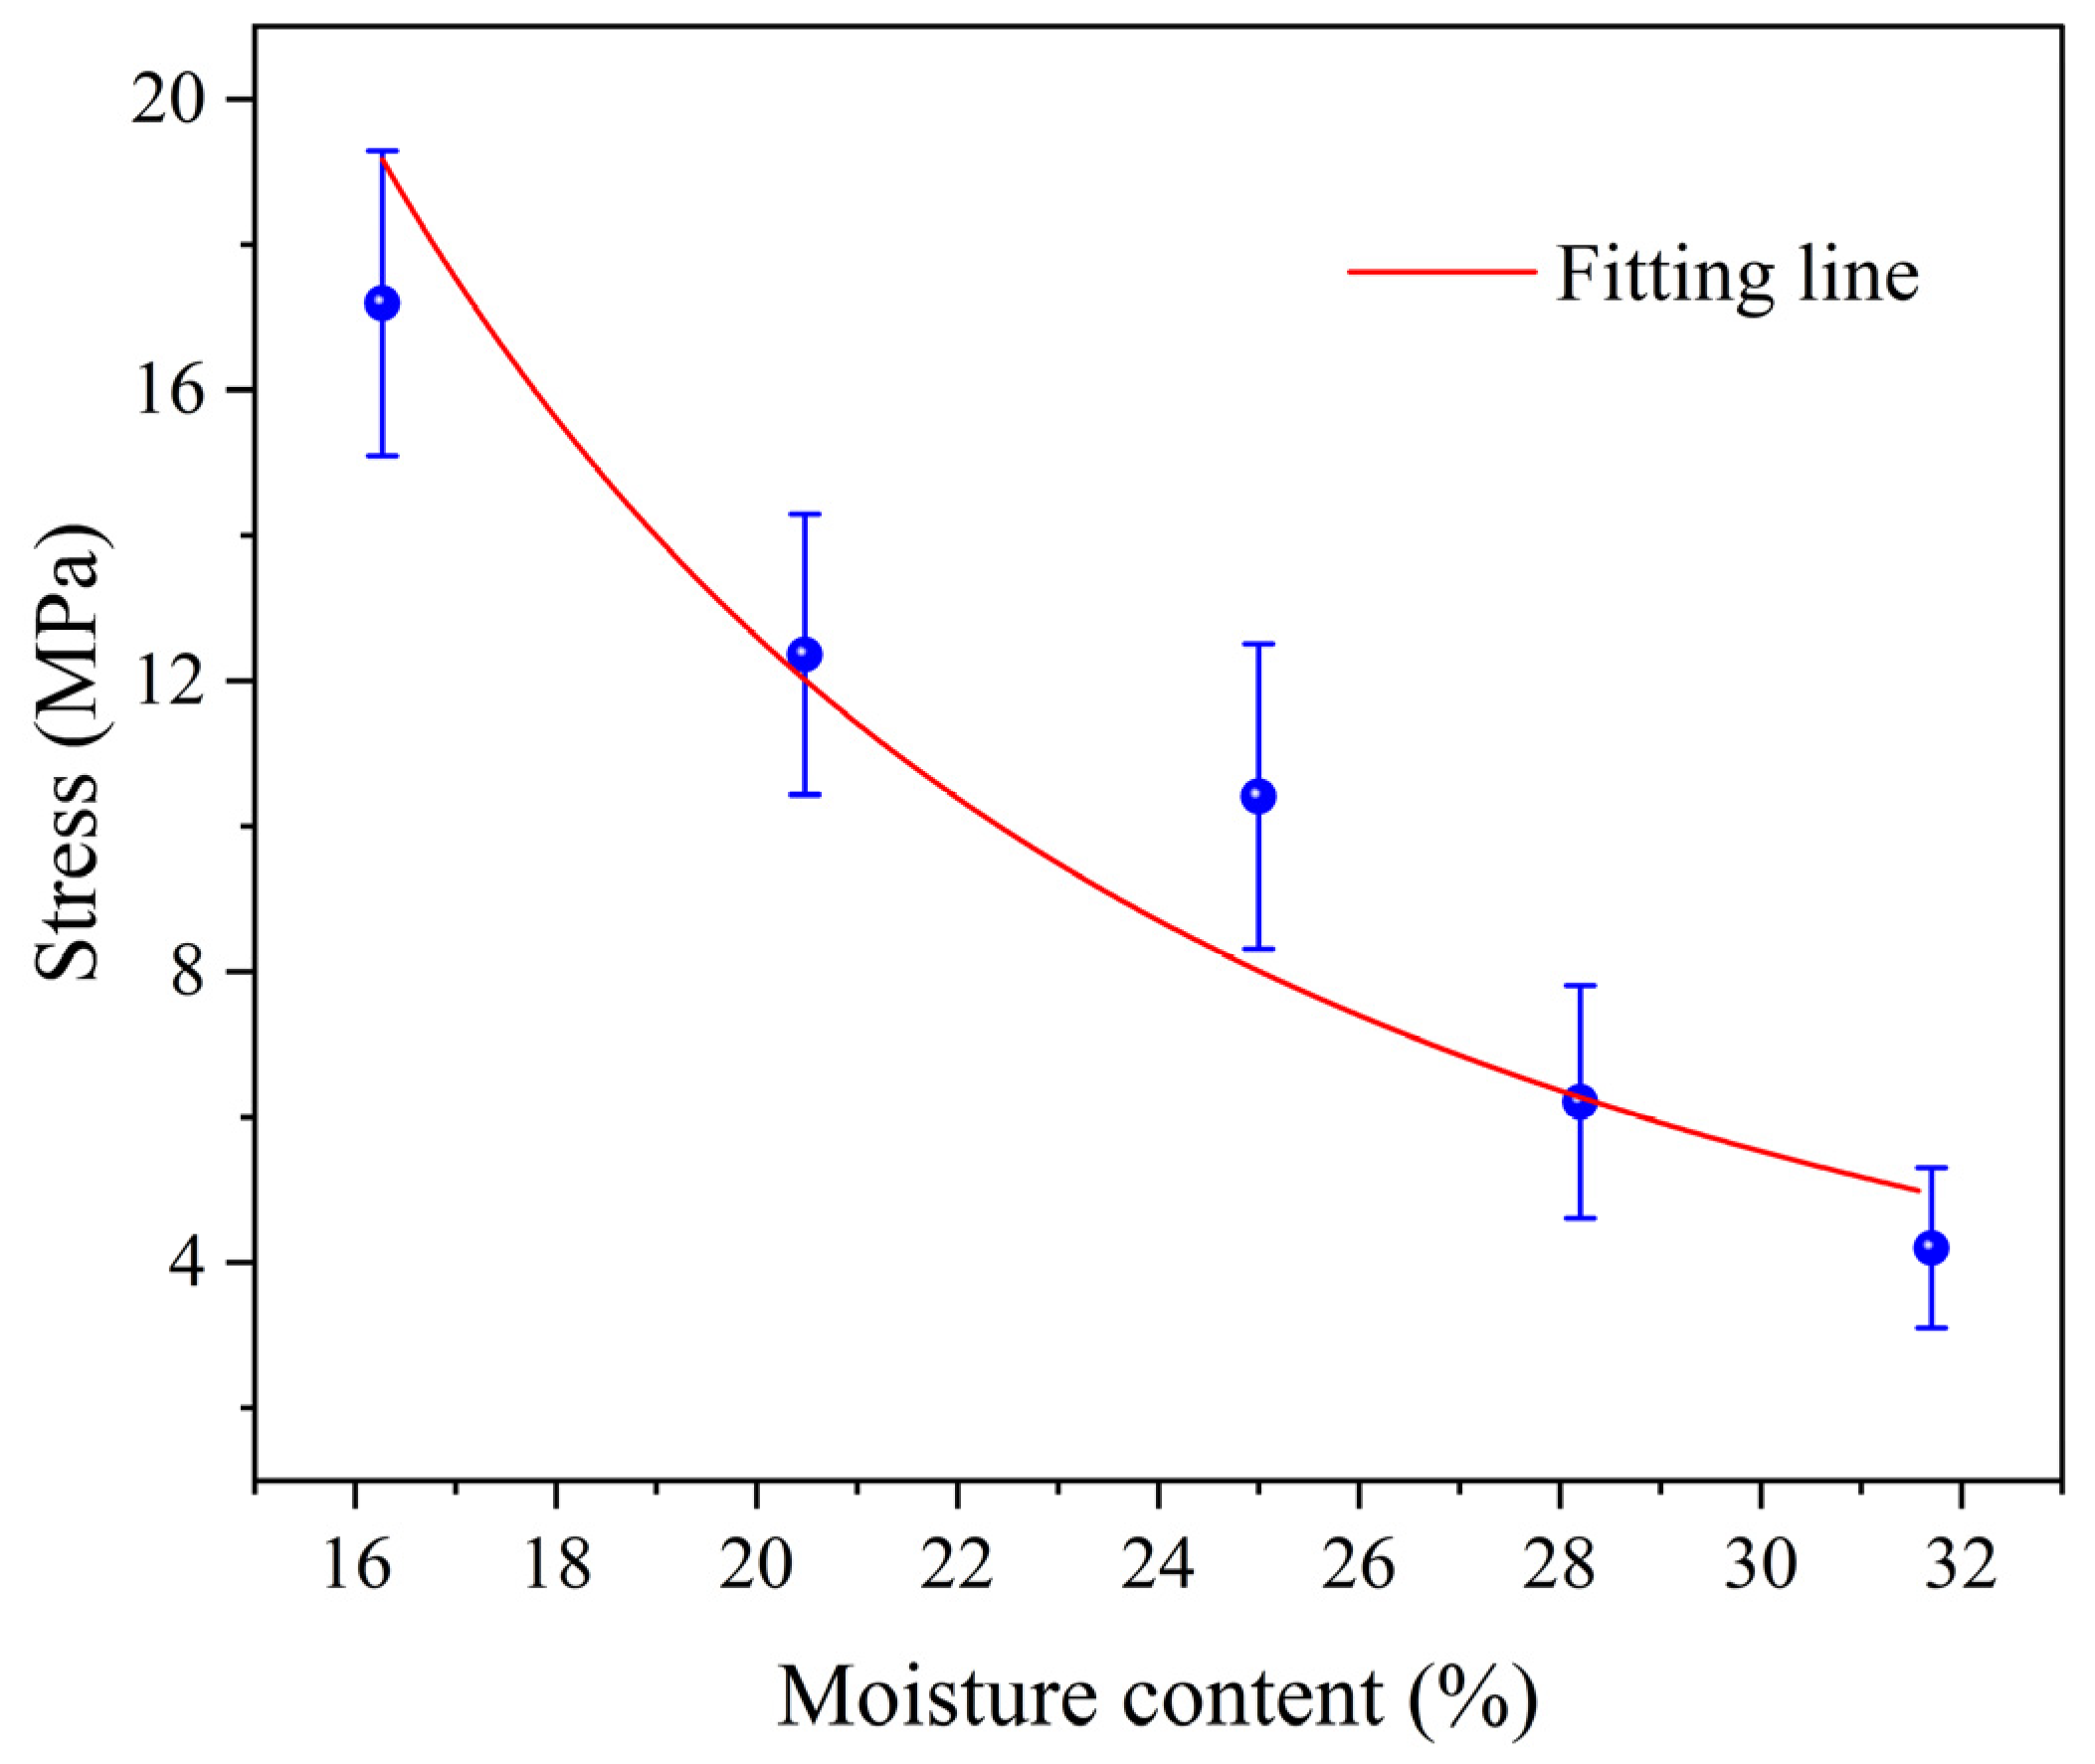
Figure 13 displays the fitted curves of dry basis moisture content and yield stress of paddy under hot air drying conditions ranging from 30 °C to 60 °C. As the dry basis moisture content varies from 16% to 32%, yield stress ranges from 4.2 MPa to 17.19 MPa. The yield stress demonstrates a nonlinear negative correlation with moisture content. During the rising-rate drying stage, a rapid increase in the moisture gradient leads to an accumulation of internal stress, peaking while the yield stress remains relatively low. If the yield stress is insufficient to counteract the stress induced by the moisture gradient, stress cracks occur [25]. In the falling-rate drying stage, although a moisture gradient persists, the yield stress of the particles significantly increases, allowing microcracks to propagate under continued stress. At 30 °C, during this stage, the internal moisture gradient is lower, bringing the paddy closer to equilibrium. Here, the generated stress is below the yield stress, effectively reducing the formation and propagation of cracks [15]. Conversely, at 60 °C, despite lower stress relative to the yield stress during the falling-rate stage, the cumulative effect of moisture gradient and stress can lead to the development of microscopic cracks into macroscopic ones. In conclusion, during the drying process, from 32% to 16% moisture content, crack formation is intricately linked to moisture gradient, stress distribution, and dynamic changes in yield stress. Thus, by adjusting drying conditions and optimizing the tempering process, the formation and propagation of cracks can be minimized [42]. Additionally, employing dynamic temperature-varying drying strategies in conjunction with tempering can further enhance the balance between drying efficiency and kernel quality [43].

4. Conclusions

In this study, hot air drying experiments and numerical simulations were conducted on paddy with varying M0 under different temperature conditions. The relationships among M0, drying rate, and drying time were examined, leading to the development of a predictive model for crack formation at various drying stages and the categorization of the drying crack formation regions in paddy. The main findings are as follows:
(1) An increase in drying temperature significantly enhances the drying rate and the percentage of drying cracks. Particularly under conditions of 50 °C and 60 °C, a higher M0 correlates with an increased percentage of drying cracks, which diminishes as M0 decreases. The predictive model’s coefficient of determination exceeded 0.85, indicating its efficacy in forecasting the progression of crack formation;
(2) The percentage of drying cracks escalates rapidly during the peak drying rate stage and continues to rise during the declining rate phase. The emergence of crack changes in the drying rate is influenced by rapid evaporation and the accumulation of internal stress during the initial drying period. Modifying the critical moisture evaporation coefficient, based on its relationship with drying time, can mitigate crack formation;
(3) A comparison between numerical simulations and experimental results shows a maximum deviation of 8.48%, demonstrating the model’s capability to accurately describe the moisture migration patterns in paddy. Cracks predominantly occur along the short axis of the grain, aligning with the observed moisture gradients and stress levels. The primary mechanism for crack initiation and propagation is the cumulative effect of the internal moisture gradient within the paddy.
This study supports the accurate prediction of crack formation in paddy and elucidates the underlying mechanisms. Future research should focus on optimizing the drying process at high temperatures and exploring the crack formation mechanism in conjunction with variable temperature and tempering treatments.

Author Contributions

Conceptualization, H.W. and Z.W.; methodology, H.W.; software, Z.C.; validation, Z.C.; formal analysis, L.W.; investigation, G.C.; writing—original draft preparation, H.W.; writing—review and editing, Z.W.; visualization, L.W.; supervision, G.C.; funding acquisition, H.W. All authors have read and agreed to the published version of the manuscript.

Funding

This research was funded by the China Postdoctoral Science Foundation, grant number 2024MD763975; the Heilongjiang Provincial Postdoctoral General Funding Project, grant number LBH-Z24250; the School Orientation Training Research Initiation Fund Program, grant number XYB202307; the National Key Research and Development Program, grant number 2021YFD2100901.

Institutional Review Board Statement

Not applicable.

Data Availability Statement

The original contributions presented in this study are included in the article; further inquiries can be directed to the corresponding author.

Conflicts of Interest

The authors declare no conflicts of interest.

References

  1. Mahmood, N.; Liu, Y.; Zheng, X.; Munir, Z.; Pandiselvam, R.; Zhang, Y.; Ali Saleemi, M.; Yves, H.; Sufyan, M.; Lei, D. Influences of emerging drying technologies on rice quality. Food Res. Int. 2024, 184, 114264. [Google Scholar] [CrossRef] [PubMed]
  2. Wang, H.; Che, G.; Wan, L.; Wang, X.; Tang, H. Combination of LF-NMR and BP-ANN to monitor the moisture content of rice during hot-air drying. J. Food Process Eng. 2022, 45, e14102. [Google Scholar] [CrossRef]
  3. Wang, C.; Pei, Y.; Mu, Z.; Fan, L.; Kong, J.; Tian, G.; Miao, S.; Meng, X.; Qiu, H. Simulation analysis of 3-D airflow and temperature uniformity of paddy in a laboratory drying oven. Foods 2024, 13, 3466. [Google Scholar] [CrossRef] [PubMed]
  4. Zhang, Y.; Fang, Z.; Li, C.; Li, C. Deep-learning-based model predictive control of an industrial-Scale multistate counter-flow paddy drying process. Foods 2023, 13, 43. [Google Scholar] [CrossRef]
  5. Qiu, Z.; Wu, F.; Hu, H.; Guo, J.; Wu, C.; Wang, P.; Ling, J.; Cui, Y.; Ye, J.; Fang, G.; et al. Deciphering the microbiological mechanisms underlying the impact of different storage conditions on rice grain quality. Foods 2024, 13, 266. [Google Scholar] [CrossRef]
  6. Shen, L.; Zhu, Y.; Wang, L.; Liu, C.; Liu, C.; Zheng, X. Improvement of cooking quality of germinated brown rice attributed to the fissures caused by microwave drying. J. Food Sci. Technol. 2019, 56, 2737–2749. [Google Scholar] [CrossRef]
  7. Chokphoemphun, S.; Hongkong, S.; Chokphoemphun, S. Artificial neural network for drying behavior prediction of paddy in developed chamber fluidized–bed dryer. Comput. Electron. Agric. 2024, 220, 108888. [Google Scholar] [CrossRef]
  8. Wang, H.; Che, G.; Wan, L.; Tang, H. Effects of drying approaches combined with variable temperature and tempering on the physicochemical quality of rice. Dry. Technol. 2022, 41, 1199–1213. [Google Scholar] [CrossRef]
  9. Mahmood, N.; Liu, Y.; Munir, Z.; Zhang, Y.; Niazi, B. Effects of hot air assisted radio frequency drying on heating uniformity, drying characteristics and quality of paddy. LWT-Food Sci. Technol. 2022, 158, 113131. [Google Scholar] [CrossRef]
  10. Chitsuthipakorn, K.; Thanapornpoonpong, S. Effect of large-Sscale paddy rice drying process using hot air combined with radio frequency heating on milling and cooking qualities of milled rice. Foods 2022, 11, 519. [Google Scholar] [CrossRef]
  11. Ying, T.; Spang, E. Paddy drying technologies: A review of existing literature on energy consumption. Processes 2024, 12, 532. [Google Scholar] [CrossRef]
  12. Zhang, P.; Li, B.; Hu, Z.; Zhang, Q.; Zhu, Y.; Hao, W. Effects of ultrasonic and microwave treatment on color, quality and drying characteristics of rice. J. Cereal Sci. 2024, 116, 103856. [Google Scholar] [CrossRef]
  13. Mondal, M.H.T.; Sarker, M.S.H. Comprehensive energy analysis and environmental sustainability of industrial grain drying. Renew. Sustain. Energy Rev. 2024, 199, 114442. [Google Scholar] [CrossRef]
  14. Wang, H.; Che, G.; Wan, L.; Chen, Z.; Sun, W.; Tang, H. Effect of variable temperature levels on drying characteristics and quality indices of rice in continuous drying and multi-stage intermittent drying. J. Food Process Eng. 2023, 46, e14356. [Google Scholar] [CrossRef]
  15. Wang, H.; Che, G.; Wan, L. Analysis of the diffusion characteristics and activation energy of rice drying using low-field nuclear magnetic resonance. J. Food Process Eng. 2021, 44, e13870. [Google Scholar] [CrossRef]
  16. Liu, H.; He, Y.; Tang, T.; Zhai, M. Cracking prediction of germinated brown rice based on intragranular drying kinetics. Powder Technol. 2022, 406, 117587. [Google Scholar] [CrossRef]
  17. Ghasemi, A.; Sadeghi, M.; Mireei, S.A. Multi-stage intermittent drying of rough rice in terms of tempering and stress cracking indices and moisture gradients interpretation. Dry. Technol. 2017, 36, 109–117. [Google Scholar] [CrossRef]
  18. Chayjan, R.A.; Ghasemi, A.; Sadeghi, M. Stress fissuring and process duration during rough rice convective drying affected by continuous and stepwise changes in air temperature. Dry. Technol. 2018, 37, 198–207. [Google Scholar] [CrossRef]
  19. Chungcharoen, T.; Prachayawarakorn, S.; Soponronnarit, S.; Tungtrakul, P. Effect of drying temperature on drying characteristics and quality of germinated rices prepared from paddy and brown rice. Dry. Technol. 2012, 30, 1844–1853. [Google Scholar] [CrossRef]
  20. Wang, Q.; Wang, Y.; Zhang, Y.; Chen, H.; Sun, J.; He, L. A stochastic analysis of glass crack initiation under thermal loading. Appl. Therm. Eng. 2014, 67, 447–457. [Google Scholar] [CrossRef]
  21. Chen, Z.; Wassgren, C.; Ambrose, R. Measured damage resistance of corn and wheat kernels to compression, friction, and repeated impacts. Powder Technol. 2021, 380, 638–648. [Google Scholar] [CrossRef]
  22. Dong, R.; Lu, Z.; Liu, Z.; Nishiyama, Y.; Cao, W. Moisture distribution in a rice kernel during tempering drying. J. Food Eng. 2009, 91, 126–132. [Google Scholar] [CrossRef]
  23. Pruengam, P.; Soponronnarit, S.; Prachayawarakorn, S.; Devahastin, S. Evolution of mechanical properties of parboiled brown rice kernels during impinging stream drying. Dry. Technol. 2016, 34, 1843–1853. [Google Scholar] [CrossRef]
  24. Cnossen, A.G.; Jiménez, M.J.; Siebenmorgen, T.J. Rice fissuring response to high drying and tempering temperatures. J. Food Eng. 2003, 59, 61–69. [Google Scholar] [CrossRef]
  25. Wu, J.; Zhang, H.; Li, F. A study on drying models and internal stresses of the rice kernel during infrared drying. Dry. Technol. 2017, 35, 680–688. [Google Scholar] [CrossRef]
  26. Wang, H.; Che, G.; Wan, L.; Liu, M.; Sun, W. Experimental study on drying characteristics of rice by low-field nuclear magnetic resonance. J. Food Process Eng. 2021, 44, e13705. [Google Scholar] [CrossRef]
  27. Shen, L.; Gao, M.; Zhu, Y.; Liu, C.; Wang, L.; Kamruzzaman, M.; Liu, C.; Zheng, X. Microwave drying of germinated brown rice: Correlation of drying characteristics with the final quality. Innov. Food Sci. Emerg. Technol. 2021, 70, 102673. [Google Scholar] [CrossRef]
  28. Xiao, H.; Pang, C.; Wang, L.; Bai, J.; Yang, W.; Gao, Z. Drying kinetics and quality of Monukka seedless grapes dried in an air-impingement jet dryer. Biosyst. Eng. 2010, 105, 233–240. [Google Scholar] [CrossRef]
  29. Li, X.; Yang, K.; Wang, Y.; Du, X. Study on heat and moisture transfer of nonspherical rice during hot-air drying in thin-layer grain pile. J. Food Process Eng. 2024, 47, e14597. [Google Scholar] [CrossRef]
  30. Rattanamechaiskul, C.; Junka, N.; Prachayawarakorn, S.; Soponronnarit, S. Modeling the improved textural properties of purple waxy rice dried through fluidization. Dry. Technol. 2017, 36, 1061–1075. [Google Scholar] [CrossRef]
  31. Zhao, L.; Yang, J.; Wang, S.; Wu, Z. Investigation of glass transition behavior in a rice kernel drying process by mathematical modeling. Dry. Technol. 2019, 38, 1092–1105. [Google Scholar] [CrossRef]
  32. Law, M.C.; Chang, J.S.L.; Chan, Y.S.; Pui, D.Y.; You, K.Y. Experimental characterization and modeling of microwave heating of oil palm kernels, mesocarps, and empty fruit bunches. Dry. Technol. 2018, 37, 69–91. [Google Scholar] [CrossRef]
  33. Srisang, N.; Soponronnarit, S.; Thuwapanichayanan, R.; Prachayawarakorn, S. Modeling heat and mass transfer–induced stresses in germinated brown rice kernels during fluidized bed drying. Dry. Technol. 2015, 34, 619–634. [Google Scholar] [CrossRef]
  34. Le, K.H.; Tran, T.T.H.; Kharaghani, A.; Tsotsas, E. Experimental benchmarking of diffusion and reduced models for convective drying of single rice grains. Dry. Technol. 2019, 38, 200–210. [Google Scholar] [CrossRef]
  35. Kumar, C.; Karim, M.; Joardder, M. Intermittent drying of food products: A critical review. J. Food Eng. 2014, 121, 48–57. [Google Scholar] [CrossRef]
  36. Li, M.; Chen, Y.; Wang, X.; Cheng, S.; Liu, F.; Huang, L. Determination of drying kinetics and quality changes of Panax quinquefolium L. dried in hot-blast air. LWT-Food Sci. Technol. 2019, 116, 108563. [Google Scholar] [CrossRef]
  37. Li, L.; Zhang, M.; Yang, P. Suitability of LF-NMR to analysis water state and predict dielectric properties of Chinese yam during microwave vacuum drying. LWT-Food Sci. Technol. 2019, 105, 257–264. [Google Scholar] [CrossRef]
  38. Dalbhagat, C.G.; Mishra, H.N. Effect of the drying process on the color change, fissure development, and morphology of fortified rice kernels. J. Food Process Eng. 2021, 44, e13719. [Google Scholar] [CrossRef]
  39. GB/T 21015-2023; Drying Technical Specifications for Paddy. Standards of China: Beijing, China, 2023.
  40. Nosrati, M.; Zare, D.; Nassiri, S.M.; Chen, G.; Jafari, A. Experimental and numerical study of intermittent drying of rough rice in a combined FIR-dryer. Dry. Technol. 2021, 40, 1967–1979. [Google Scholar] [CrossRef]
  41. Nasrnia, E.; Sadeghi, M.; Raeisi Isa-Abadi, A.; Mireei, S.A. A novel simulation model to analyze rice intermittent drying considering glass transition concept. J. Food Eng. 2024, 364, 111819. [Google Scholar] [CrossRef]
  42. Odek, Z.R.; Siebenmorgen, T.J.; Saxena, A. Fissuring kinetics of rough rice during the drying process. Appl. Eng. Agric. 2020, 36, 639–645. [Google Scholar] [CrossRef]
  43. Apinyavisit, K.; Nathakaranakule, A.; Mittal, G.S.; Soponronnarit, S. Heat and mass transfer properties of longan shrinking from a spherical to an irregular shape during drying. Biosyst. Eng. 2018, 169, 11–21. [Google Scholar] [CrossRef]
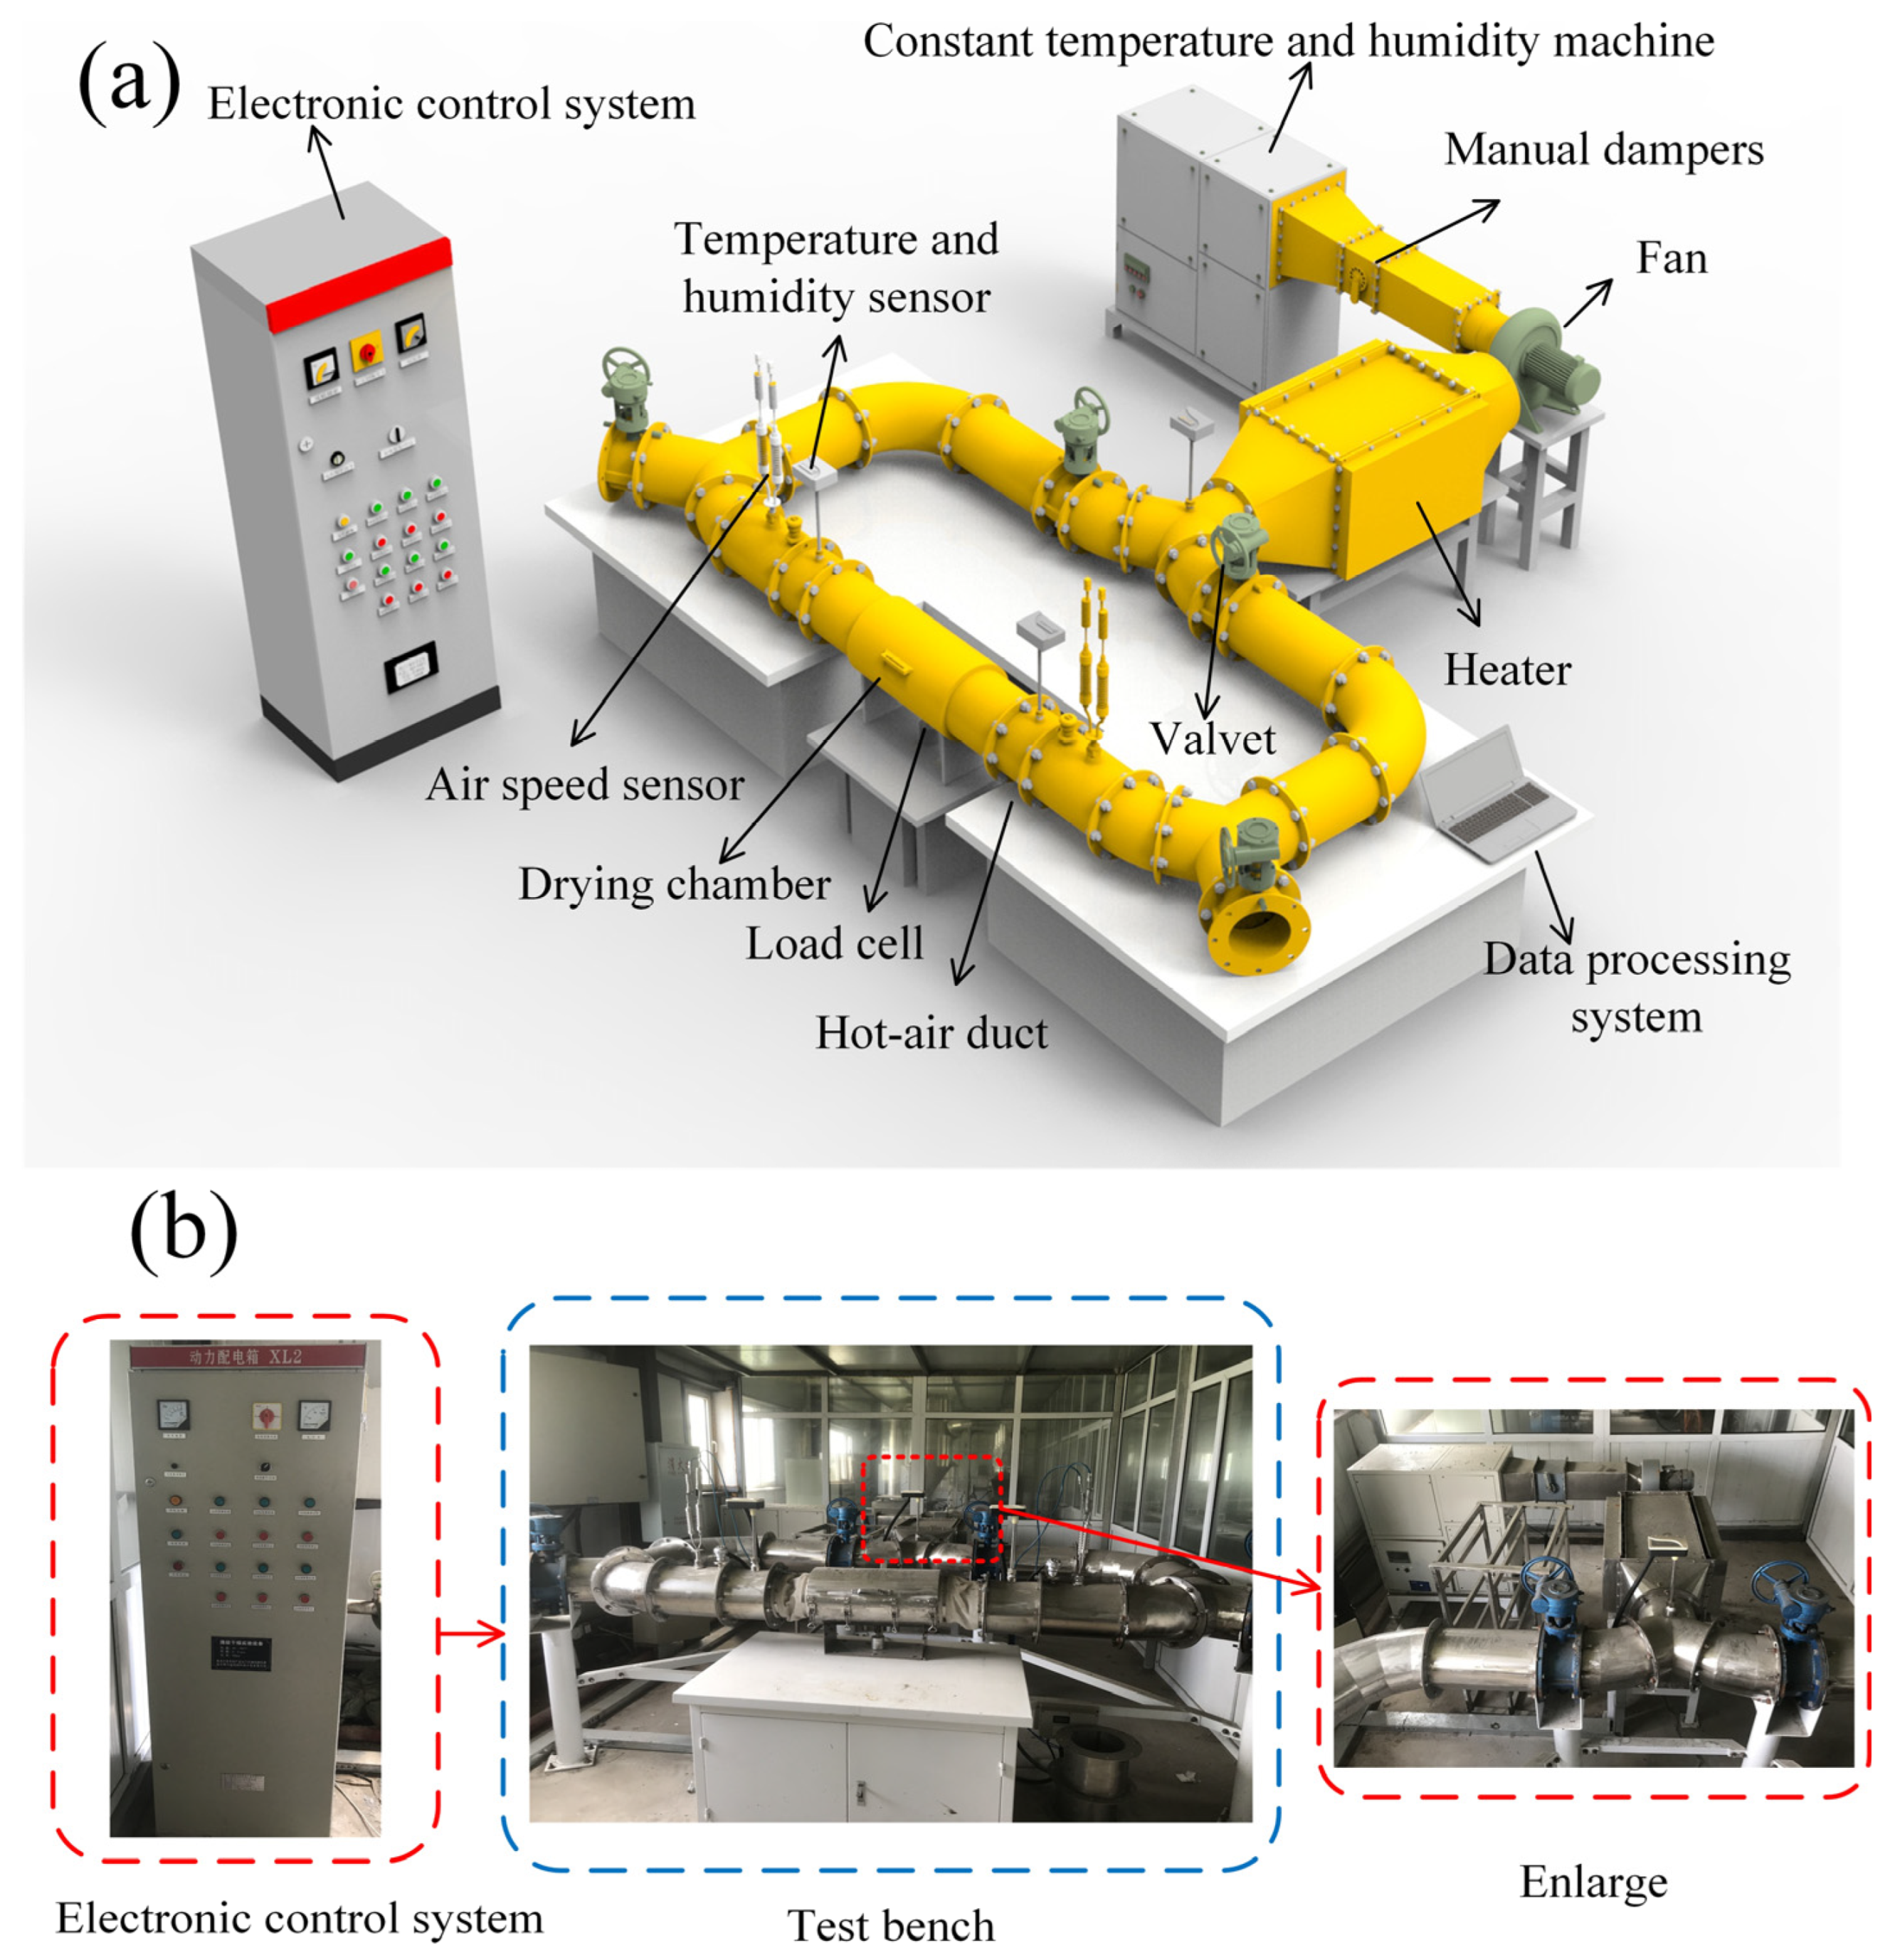
Figure 1. Two-way alternating hot air drying experimental bench. (a) Three-dimensional figure; (b) Physical devices.
Agriculture 15 00383 g001
Figure 2. Geometric modeling of paddy.
Agriculture 15 00383 g002
Figure 3. Variation patterns of moisture ratio of paddy with different M0 under drying conditions at 30, 40, 50, and 60 °C. (a) M0 = 32%; (b) M0 = 29%; (c) M0 = 25%; (d) M0 = 22%.
Agriculture 15 00383 g003
Figure 4. Drying rate trends of paddy with time at different drying temperatures. (a) M0 = 32%; (b) M0 = 29%; (c) M0 = 25%; (d) M0 = 22%.
Agriculture 15 00383 g004
Figure 5. Trend of the percentage of drying cracks for different M0 values and temperatures. (a) M0 = 32%; (b) M0 = 29%; (c) M0 = 25%; (d) M0 = 22%.
Agriculture 15 00383 g005
Figure 6. Variation in the critical moisture evaporation coefficient with drying time under different M0 conditions.
Agriculture 15 00383 g006
Figure 7. Comparison of experimental and numerically calculated drying curves at different drying temperatures with an M0 of 29%.
Agriculture 15 00383 g007
Figure 8. Moisture distribution pattern within the paddy particles under different drying temperature conditions. (a) 30 °C; (b) 40 °C; (c) 50 °C; (d) 60 °C.
Agriculture 15 00383 g008
Figure 9. Monitoring points of the three-dimensional model of paddy. (a) Length direction; (b) Width direction; (c) Thickness direction.
Agriculture 15 00383 g009
Figure 10. Effect of drying temperature on the internal moisture gradient of paddy. (a) Length direction, 30 °C; (b) Width direction, 30 °C; (c) Thickness direction, 30 °C; (d) Length direction, 60 °C; (e) Width direction, 60 °C; (f) Thickness direction, 60 °C.
Agriculture 15 00383 g010
Figure 11. Effect of drying temperatures on the internal stresses of paddy. (a) Length direction, 30 °C; (b) Width direction, 30 °C; (c) Thickness direction, 30 °C; (d) Length direction, 60 °C; (e) Width direction, 60 °C; (f) Thickness direction, 60 °C.
Agriculture 15 00383 g011
Figure 12. Locations of crack formation in paddy.
Agriculture 15 00383 g012
Figure 13. The fitted curves of dry basis moisture content and yield stress of paddy under drying conditions with hot air temperature of 30~60 °C.
Agriculture 15 00383 g013
Table 1. Model fitting parameters for different M0 and drying temperatures.
M0 (%)Drying Temperature (°C)abcdCoefficient of DeterminationMean Relative Percentage Error (%)
3230−26.980.00127.680.0320.8610.68
40−5.690.0026.510.0330.928.53
500.0070.041.440.1060.947.86
600.0010.140.820.280.975.44
2930−0.0010.0380.220.0060.9210.24
40−69.650.00170.310.110.8711.42
50−8.960.0039.890.160.977.54
60−0.180.04030.550.350.994.7
2530−9.860.0019.910.0170.9310.25
40−53.360.001754.130.1150.8611.16
50338.460.0016−337.81−0.460.968.7
60−14.630.00815.590.450.959.73
2230−8.990.00189.020.0250.8710.32
40−113.20.001113.80.170.859.7
50−1.990.0112.550.150.987.04
60−32.120.00832.840.690.985.7
Disclaimer/Publisher’s Note: The statements, opinions and data contained in all publications are solely those of the individual author(s) and contributor(s) and not of MDPI and/or the editor(s). MDPI and/or the editor(s) disclaim responsibility for any injury to people or property resulting from any ideas, methods, instructions or products referred to in the content.