Article

Economic Feasibility and Decarbonization Incentives of Sugarcane Biogas Production Pathways

by
Flavio Eduardo Fava
1,
Lucílio Rogério Aparecido Alves
2 and
Thiago Libório Romanelli
3,*
1
Graduate Program on Agricultural Systems Engineering, “Luiz de Queiroz” College of Agriculture, University of Sao Paulo, Av. Padua Dias, 11, Postal Box 9, Piracicaba CEP 13418-900, SP, Brazil
2
Department of Economics, Administration and Sociology, “Luiz de Queiroz” College of Agriculture, University of Sao Paulo, Av. Padua Dias, 11, Postal Box 9, Piracicaba CEP 13418-900, SP, Brazil
3
Department of Biosystems Engineering, “Luiz de Queiroz” College of Agriculture, University of Sao Paulo, Av. Pádua Dias, 11, Postal Box 9, Piracicaba CEP 13418-900, SP, Brazil
*
Author to whom correspondence should be addressed.
Agriculture 2025, 15(4), 380; https://doi.org/10.3390/agriculture15040380
Submission received: 15 January 2025 / Revised: 9 February 2025 / Accepted: 9 February 2025 / Published: 11 February 2025
(This article belongs to the Special Issue Sustainability and Energy Economics in Agriculture—2nd Edition)

Abstract

:
Challenges in investment decisions for new fuels remain due to uncertain scenarios regarding profitability. There is also a challenge to improve production efficiency and waste utilization, either for biomass or by-products. This study evaluates the economic potential of biomethane production within sugarcane biorefineries through the principles of the circular economy and economic feasibility. To obtain price data for CBios, Brent crude oil, and natural gas, stochastic models based on GBM and Monte Carlo simulations were applied to project prices and assess revenue potential over a 10-year horizon. Price data were incorporated to assess market correlations and revenue scenarios. Key findings reveal that biomethane’s price stability, driven by its strong correlation with oil markets, supports its viability as a renewable energy source, while CBio presents a weak correlation and limited price predictability with present challenges for long-term planning. Economic modeling indicates high investment returns, with IRR values surpassing 35% in conservative scenarios and payback periods from 2 to 6 years. These results highlight biomethane’s potential for energy efficiency, carbon emission reduction, and the creation of new revenue through waste use. We conclude that targeted investments in biomethane infrastructure, coupled with policy and market support, are essential for achieving global sustainability goals.

1. Introduction

Innovative industrial processes and novel by-products from the bioeconomy drive new markets, which have presented significant opportunities for advancing technologies in biorefineries and, consequently, biofuels, which are becoming increasingly critical as additional inputs for efforts to reduce the carbon footprint, which is a goal further supported by decarbonization credits [1]. A substantial increase in renewable energy sources is anticipated in the coming years due to factors such as (i) climate change—driving demand for carbon-neutral fuels; (ii) fluctuations in oil prices—encouraging research into alternative fuels; and (iii) the need for energy independence amidst the unstable policies of major oil producers [2].
The sugarcane sector has been among the most innovative-driven sectors within bioenergy over the past decades. A historical perspective on this sector reveals distinct phases of transformation that have reshaped its market relationships, strategies, and assessment methodologies. These changes have enabled sugarcane to be a source not only in food production but also in biofuel and electricity cogeneration—allowing sugarcane biomass to account for 18% of the domestic energy supply in Brazil [3]. This sector has also analyzed innovations such as 2-G ethanol, hydrogen production, and biogas [4]. For instance, biogas can be obtained from vinasse—a by-product of ethanol distillation—which can be a source of biomethane from organic waste in the sugar-energy sector. There are estimates that the Brazilian sugarcane sector could potentially produce around 12 billion m3 of biogas annually [5].
Biogas is characterized by its suitability for decentralized energy production in combined heat and power (CHP) systems [6]. On the other hand, biomethane can be used as a substitute for diesel in agricultural equipment, natural gas in vehicles, or injected into the natural gas grid. For both cases, fluctuations in gas quality can lead to suboptimal equipment performance in industrial applications, causing inefficiencies, instabilities, and unsafe combustion operations [7].
As a replacement opportunity for biogas, diesel oil consumption accounts for an average of 63% of the energy consumption and 31% of the total greenhouse gas emissions from the sugarcane ethanol production chain in Brazil, even after considering the credit from surplus electricity generated during the production process [8]. According to Brazil’s National Energy Balance [3], diesel oil consumption in the transport and heavy-duty sectors accounts for 43.4% of the transportation sector.
The adoption of technologies capable of mitigating greenhouse gas (GHG) emissions, industrial waste, and costs emerges as a promising alternative for the sector. These advancements not only improve outcomes but also optimize sustainability indicators, thereby enhancing the viability of new processes involving biogas as an energy alternative [9].
Locally and regionally produced biofuels provide several advantages, particularly when produced near the point of consumption [10]. These benefits include reduced costs associated with commercialization, transportation, and storage. Additionally, the environmental advantages of biofuels compared to diesel are noteworthy, such as lower emissions of gasses, soot, and smoke. Biomethane production from waste and residues demonstrates a strong environmental and energy benefit, reducing the environmental impact by replacing fossil fuels with biofuels.
The combination of first-generation (1G) ethanol production with the anaerobic digestion of waste and the substitution of diesel at the plant can classify biofuels as zero-emission fuels. This is primarily due to their ability to reduce their carbon footprint, cutting the total GHG emissions of sugarcane ethanol by 95%, according to data from the Brazilian Association of Energy Cogeneration Industries [11].
Since 2016, Brazil has had a structured policy encompassing a wide range of biofuels, emphasizing their significant role in the national energy matrix. Known as RenovaBio, this program was established as the principal mechanism for meeting commitments under the Paris Agreement of 2015 [12]. It promotes decarbonization through financial incentives for biofuels via the sale of credit tied to the amount of carbon emissions avoided, offering a solution for the low-carbon economy, which is increasingly demanded worldwide. Bioenergy systems alone are already significant carbon intensity reducers, and their impact can be further amplified when combined with Bioenergy Carbon Capture and Storage (BECCS).
The circular economy can be defined as a model that prioritizes the closure of economic and ecological loops. This model is based on three main principles: preserving natural resources by maintaining material use within the production cycle; regenerative design, which involves creating products and systems focused on reuse and recyclability; and minimizing environmental impacts by reducing emissions and pollution [13].
Some examples of circular economy applications across sectors, highlighting the sugarcane sector as a primary application within the bioenergy field, are as follows: agricultural practices that include the reuse of organic waste as fertilizers and soil regeneration, making degraded lands arable [14], and the management of organic waste for the production of biogas and fertilizers, which is an expanding application in the sugar-energy sector, particularly in Brazil [15].
For a predictive approach to the circular economy, stochastic models are fundamental to the support of price formation and provide predictability regarding price movements. The random nature of price changes is explained by the Efficient Market Hypothesis (EMH), which identifies these fluctuations as a hallmark of informational efficiency, where all relevant information currently available for evaluating an asset is already incorporated into its market price [16]. There is a universality in price behavior applicable to any market, regardless of its location, time, or structure [17]. This behavior generates a nonlinear version of the observed scenario in continuous time, culminating in a closed orbit with constant amplitude. However, depending on the parameter values, the market may exhibit chaotic fluctuations, often contradicting traditional price formation rules. In such cases, stochastic models are tasked with capturing the random shifts between bearish and bullish markets.
There is a lack of studies focusing on the sector that considers price volatility, whether in biomethane or decarbonization credits. This volatility can significantly impact the financial outcomes of companies relying on this production. Most existing studies assess the economic feasibility of biomethane using average or static values, as observed in [18,19,20], often attributing the same price as natural gas to biomethane and incorporating these constant prices into deterministic models without integrating them into stochastic processes.
The economics of biofuels and associated biorefineries are shaped by many of the same forces that have influenced the development of hydrocarbon economies and refineries over the past century [21]. Assessing the economic feasibility of biofuel pathways and their renewable sources becomes crucial, given the challenge of allocating biomass with both technical and economic efficiency.
The economic viability of renewable fuels and the challenge of long-term sustainability involve dividing the total financial cost of fuel production and consumption for society into direct and indirect costs [22]. Direct costs pertain to production, encompassing investment/productivity costs and resource costs per unit of the product. Indirect costs include environmental impacts and their consequences for human health.
Considering projections through 2034, this study enables the long-term analysis of decarbonization policies, which remain a challenge, as pointed out by [23,24]. In this context, the study addresses a gap in research by integrating future policy incentive scenarios—such as biomethane pricing and the evolution of the decarbonization credit market—with the economic impact of biomethane production and the potential interest of new investments.
The energy transition through new technologies and biofuels within sugarcane biorefineries—guided by the principles of the circular economy—examines the exogenous factors influencing this adoption and decision-making within the existing production chain. This transition’s potential benefits to the sugar-energy sector over time, through economic evaluation and return on investment, constitute one of the study’s primary pillars. Based on the authors of [25], who approached the technical aspects of biogas production added to traditional sugar and/or ethanol productions, this study aims to approach these routes from the perspective of economic feasibility. It focuses on revenues generated within biorefineries using CH4 derived from vinasse, assessing not only the cash flow generation capacity but also the direct influence of carbon credit price variations. Furthermore, it examines how oil prices can directly affect the final prices of biomethane and the related economic viability of investments.

2. Materials and Methods

2.1. Variables for the Stochastic Model

The methodology builds upon that presented by [25], maintaining the same daily grinding capacity of the biorefinery at 5 gigagrams (Gg) or tons in a harvest year. It includes an analysis of the behavior of carbon credit prices in the Brazilian market, known as CBios, which are regulated and traded on the stock exchange [26]. These credits represent an important revenue source in the commercialization of biofuels, whether in the form of ethanol or biomethane, which directly substitutes natural gas. Additionally, the methodology involves a review of Brent crude oil prices [27] over the years, natural gas prices at retail outlets [28], and inflation variation using the Broad Consumer Price Index (IPCA) [29].
Based on the values extracted from each reference, a stochastic model was established using a random price projection method, known as Monte Carlo analysis, from 2024 to 2034. This allowed the estimation of 1000 price scenarios for decarbonization credits and biomethane, with inflation effects already discounted in the final values to properly forecast revenues from this new biofuel and the remuneration of productive investments over time.

2.2. Stochastic Analysis

Monte Carlo analysis is a simulation technique widely used in finance, economics, and natural sciences to estimate the behavior of complex systems subject to uncertainties. One of its most popular applications is asset price modeling, where Geometric Brownian Motion (GBM) is often adopted as the underlying model to represent the price dynamics [7].
GBM is a continuous stochastic process that captures the fundamental characteristics of asset price movements: trend (drift) and volatility. It is an extension of the standard Brownian motion (Wiener) to represent variables that grow exponentially, such as stock prices and commodities [30] and can be defined as shown in Equation (1). The effects of inflation (IPCA) will be discounted to express prices in real values.
d P t = μ P t d t + σ P t d W t
where
Pt—the price of CBios and biomethane at time t;
μ—the average growth rate (drift) adjusted for external factors such as oil and gas prices;
σ—the volatility observed in the history of CBios and biomethane;
Wt—Standard Brownian Motion (Wiener)
Logarithmic returns are a way of measuring the percentage growth of an asset between two consecutive time periods. For the model and statistical analysis of the data, the logarithmic returns of each time series must be calculated according to Equation (2) (Rt).
R t = ln P t P t 1
where Pt is the price of CBios and biomethane at time t.
The correlation of returns from CBios with Brent oil, natural gas converted into biomethane, and the IPCA is analyzed to determine the impact of each on the variables of interest. To estimate GBM parameters, the average rate of return (µ) and volatility (σ) are calculated based on historical returns of the carbon credits.
For a realistic economic analysis, it is essential to adjust projected prices for inflation, ensuring that projected values represent constant purchasing power over time. Inflation reduces the time value of money. Thus, nominal prices (affected by inflation) are converted into real (adjusted) prices.
To account for inflation, the IPCA index used is projected via stochastic analysis in accordance with the historical series of the indicator [29], and the projected future prices are adjusted to real values using Equation (3).
P r e a l , t = P t 1 + i t
where i is the IPCA rate projected by the GBM model.
Lastly, to use the Monte Carlo simulation, the GBM adjusted with N paths for the price of carbon credits should be considered (Equation (4)).
P t + t = P t exp μ σ 2 2 t + σ   Z t
where
Pt—the price of CBios and biomethane at time t;
Δt—the price time range;
μ—the average growth rate of logarithmic returns;
σ—the volatility of logarithmic returns;
Zt—the standard normal random variable N (0,1).
To include the impact of Brent oil and natural gas: Each path has the drift (μ) values adjusted according to the correlations calculated. Inflation effects should be discounted over time in each generated path.
The Monte Carlo solution is widely used in finance to model the evolution of asset prices [31]. It is a basic tool for derivative pricing and calculating probabilities associated with future prices.

2.3. Investment Viability and Structure Attached to the Biorefinery

The necessary investments outlined in the inventory survey will be divided into pre-production, production, and post-production stages of the biofuel, defining the capital costs and the volume of investments needed for each route. After this definition, the parameters for investment analysis and the system’s payback period are used. The payback period consists of the ratio of the initial investment to the cash inflows of a specific period, as well as its internal rate of return (IRR) and net present value (NPV), represented by Equations (5) and (6), respectively.
I R R = n = 0 N C F n 1 + i * n = 0
N P V = n = 1 N C F n 1 + i * n
where
CF—the present value of cash inflows;
N—the number of periods covered in the flow;
n—the discount time for each cash flow entry;
i*—the discount rate or cost of capital of the company.
To determine the project’s discounted flow, a hurdle rate of 14.75% a year is considered, which is equivalent to the Selic rate projected by the Brazilian Central Bank for 2025 [32]. Within this context, the impact of oil price behavior in recent years and the current levels provide the foundation for formulating a model capable of evaluating the viability of biogas production and utilization, as well as its decarbonization potential through CO2 capture via BECCS (Bioenergy with Carbon Capture and Storage). This will also help assess the profitability after the payback period Equation (7).
P B = I C F y
where
PB—the year to the recovery of biomethane initial investment;
I—the initial investment or total Capex of biomethane;
CFy—the annual cash flow from biomethane + CBios route revenues.
In the payback calculation, the gains during the period are not restricted only to the revenues generated by the investment but also to the savings generated in relation to processes or practices prior to the investment. This creates an inverse relationship with the payback period: the greater the gains in this period, the shorter the payback indicator.
For the biomethane production process, a system annexed to a first-generation ethanol distillery (1G) will be considered. The capital expenditure (CAPEX) for this system includes the additional costs of a standard ethanol production process, with the utilization of all biogases in the form of biomethane. This disregards the use of filter cake and any route of gas for bioelectricity, which reduces the need for investment and maintenance systems such as silos, vertical biodigesters, gensets, and substations (Table 1).

3. Results

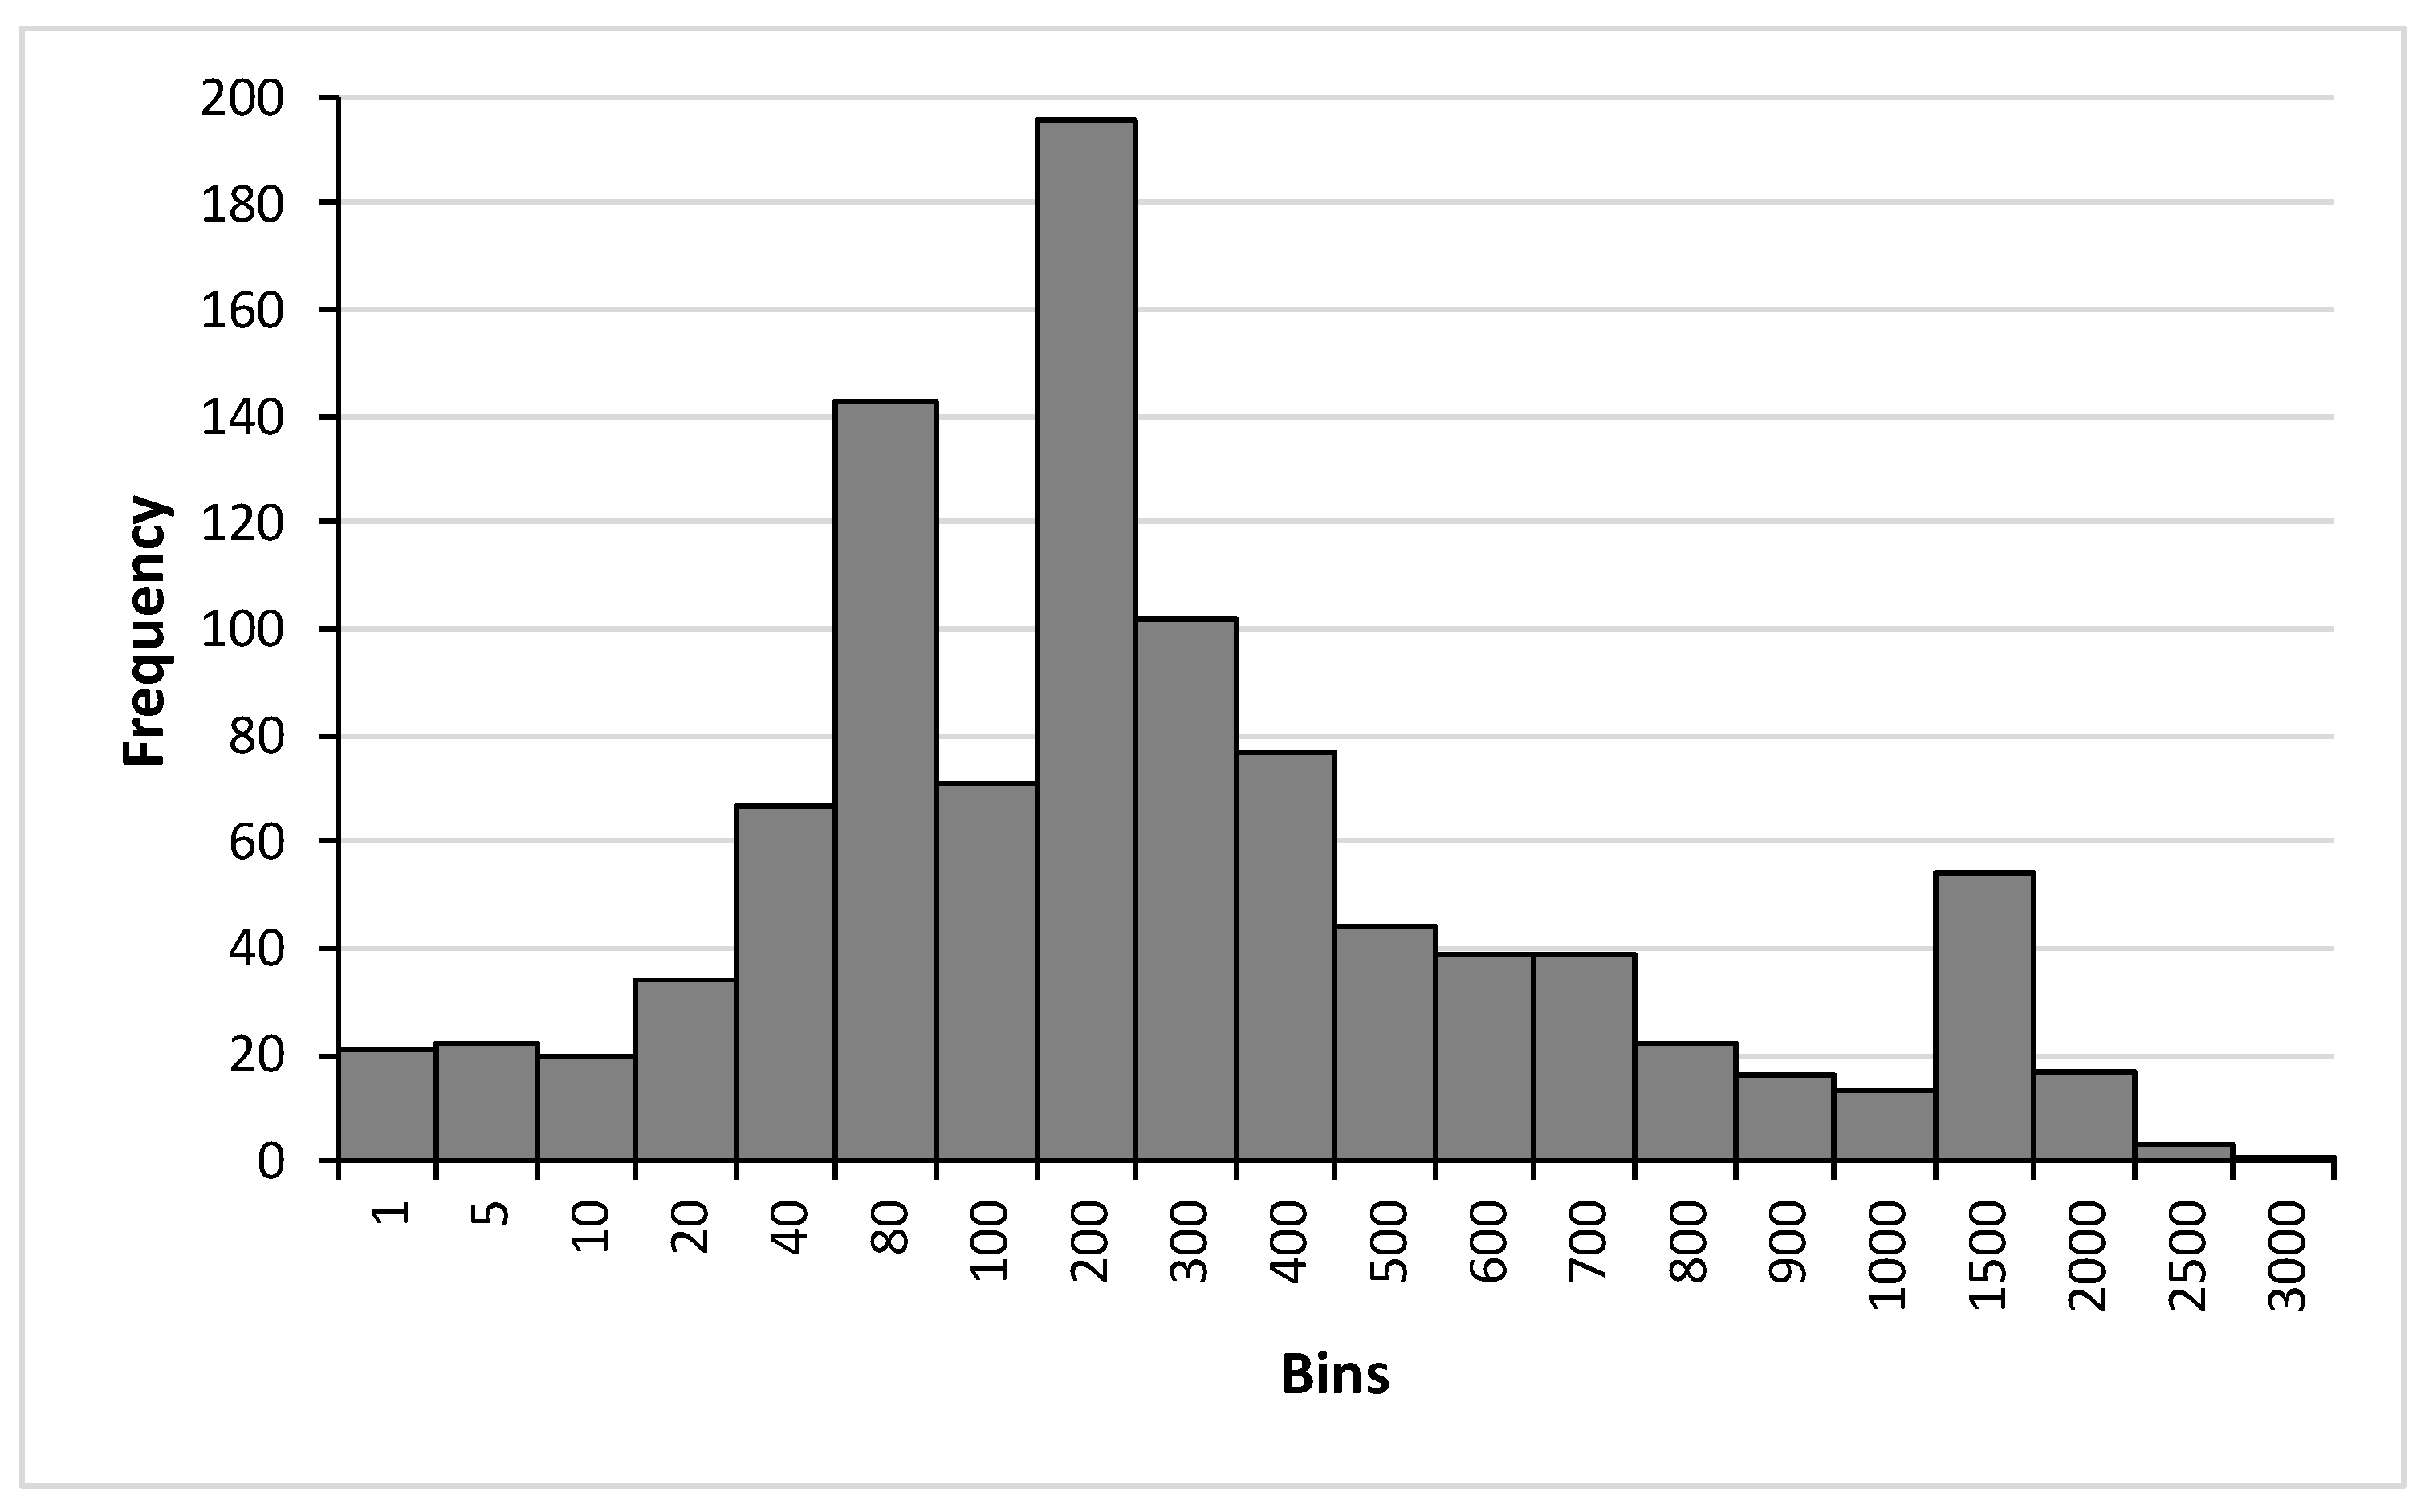
3.1. Data Surveyed for the Stochastic Model

The behavior of Brent crude oil prices has been recorded by the Energy Information Administration (EIA) since 1987 [27]. These prices serve as a global reference for fossil fuels, which can be compared to renewable equivalents, thus providing an important benchmark for the attractiveness of substitution between products or, in the case of this research, for equivalent fuel (Figure 1).
To determine the quantity of biomethane and decarbonization credits in the system, an average of 58% of the historical sugarcane mix destined for ethanol production is considered [34]. Given that all biomethane production is derived from vinasse, a byproduct of ethanol, the production parameters from Table 2 could be adopted.
It is important to note that since biomethane is inherently linked to the ethanol production process, the decarbonization credits associated with ethanol also contribute to the revenue analysis for the biomethane plant investment.
In Figure 2, based on the price marketed to resellers in the Brazilian natural gas market, the price of biomethane is generated. The price projections until 2034 are already accounted for both by volume (m3) and by energy (J), contributing to the pricing of an energy reference.
Since 2020, biorefineries have had an additional revenue source in their cash flow generation: decarbonization credits, known as CBios. These credits are closely tied to Brazil’s decarbonization policy, and their price behavior is related to the supply of credits relative to the demand for their acquisition by fossil fuel distributors. According to Figure 3, the credits exceeded USD 20 at the end of 2023, double the standard price of carbon credits in the global market.
Finally, Brazilian inflation, which, according to IBGE records [29], was over 20% in 1995—coinciding with the creation of the current Brazilian currency—dropped to its lowest level in 1998, with only brief periods of double-digit inflation in 2002 and 2015. The indicator shown in Figure 4 is a variable that will be used in the projection model and aims to mitigate the effects of inflation on the final prices that contribute to the revenue-generating the biomethane project.
With the historical price data of the variables, it is possible not only to project prices through simulations using stochastic analysis but also to assess the correlation between biomethane and carbon credit prices in relation to oil. The relationship between oil price, CBio price, and biomethane can be assessed based on the coefficient of determination, R2, which indicates the proportion of price variability explained by the model.

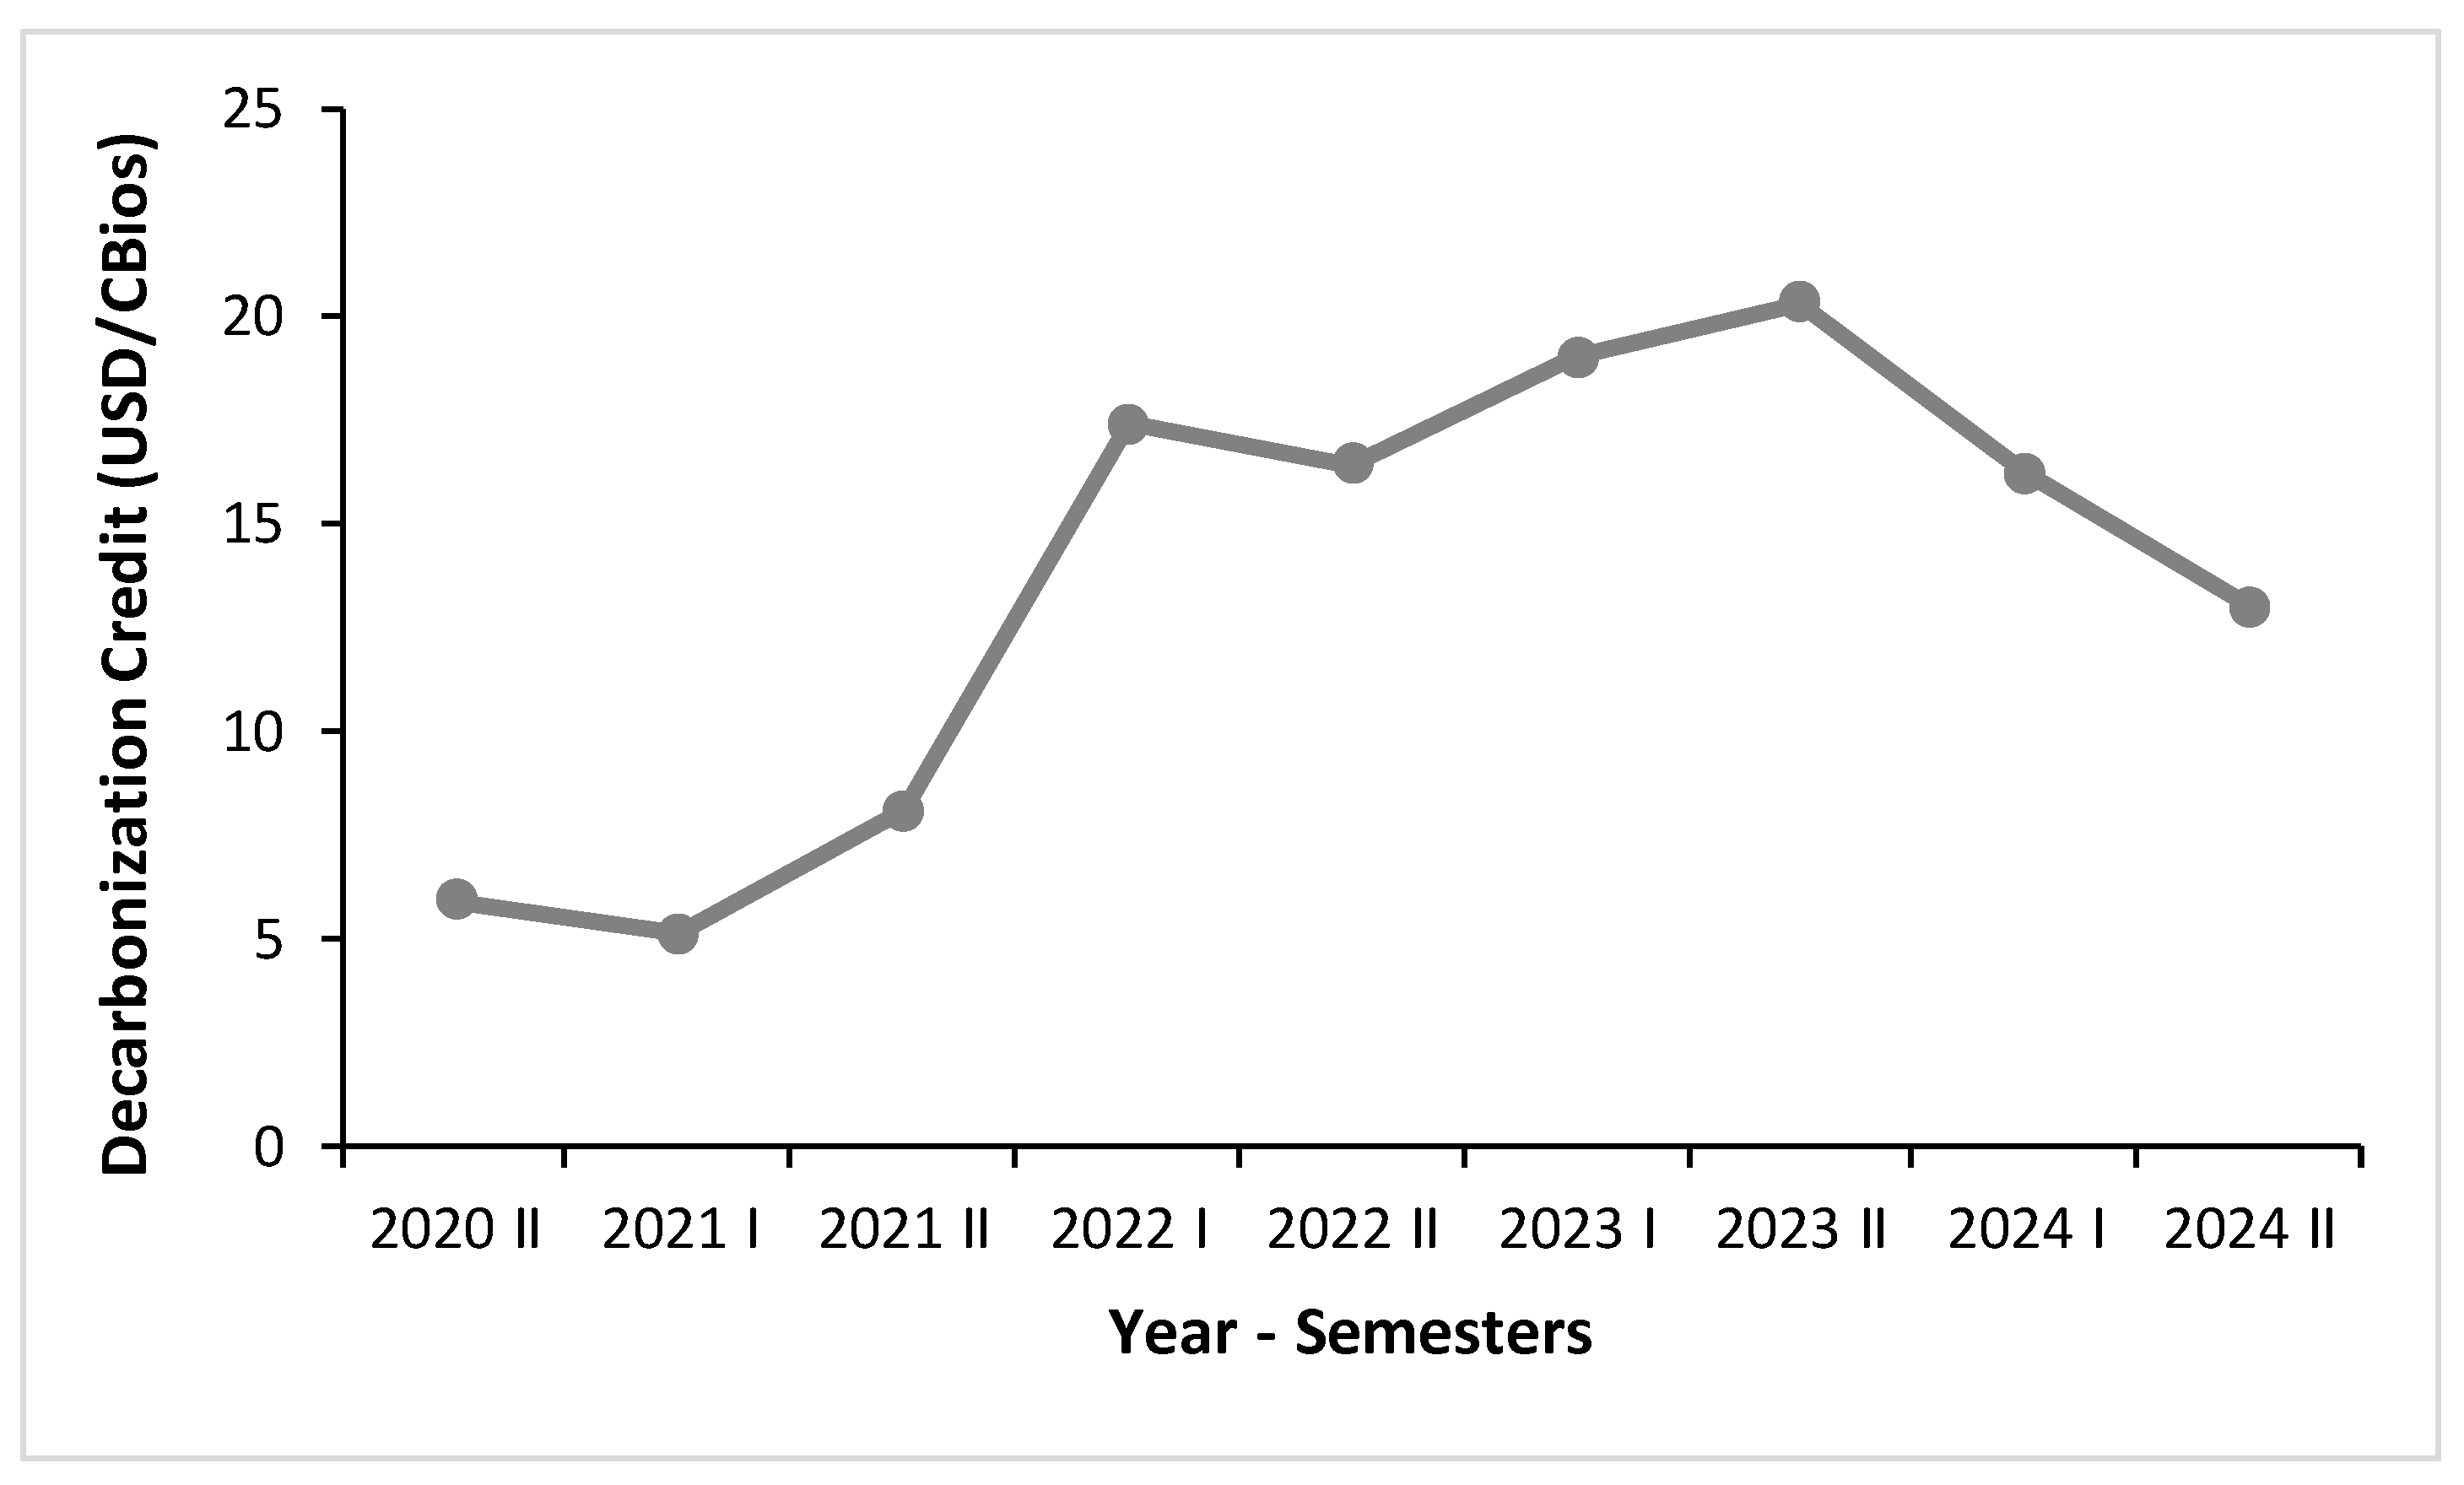
3.2. Decarbonization Credits Price Projection

When projecting the prices of decarbonization credits up to 2034, a significant level of price uncertainty is evident from the beginning of the series. According to Figure 5, both the lower and upper limits start far from the mean. There is a point where higher prices lose momentum but soon resume their upward trajectory. Even considering the average, which remains between USD 50 and USD 100 throughout the sample, these are highly significant values. This range has been tested several times in historical series, particularly when influenced by factors related to changes in public policies [26].
Since the series of historical prices of decarbonization credits in Brazil started to be recorded in 2020, they can directly affect projection for a longer time period. However, in most scenarios, the prices are increasing and sustained, which is a characteristic of the strength of this asset, which has good demand prospects [16].
The CBio market operates as a hybrid mechanism between regulated (cap-and-trade) and voluntary carbon markets by requiring fuel distributors to purchase decarbonization credits generated by biofuels; however, its reliance on the fuel sector constrains its scalability.
The voluntary market [35] provides flexibility for companies outside regulatory frameworks to offset emissions, while the cap-and-trade system [36] could expand sectoral coverage and establish a more robust carbon pricing mechanism in Brazil, aligning with global climate mitigation trends; this mechanism, as defined by [37], incentivizes companies to reduce their emissions, as those that achieve lower emissions can sell credits to others that need to offset excess emissions. This scenario promotes the adoption of renewable fuels, such as biomethane, which have a significantly lower emission factor compared to fossil natural gas.
Regarding the frequency with which these prices will be practiced in future projections, more than 50% of the simulated scenarios have a price that varies up to USD 70 (Figure 6), followed by another peak at the level of USD 90, and further, the frequency of these prices is distributed more diversely.

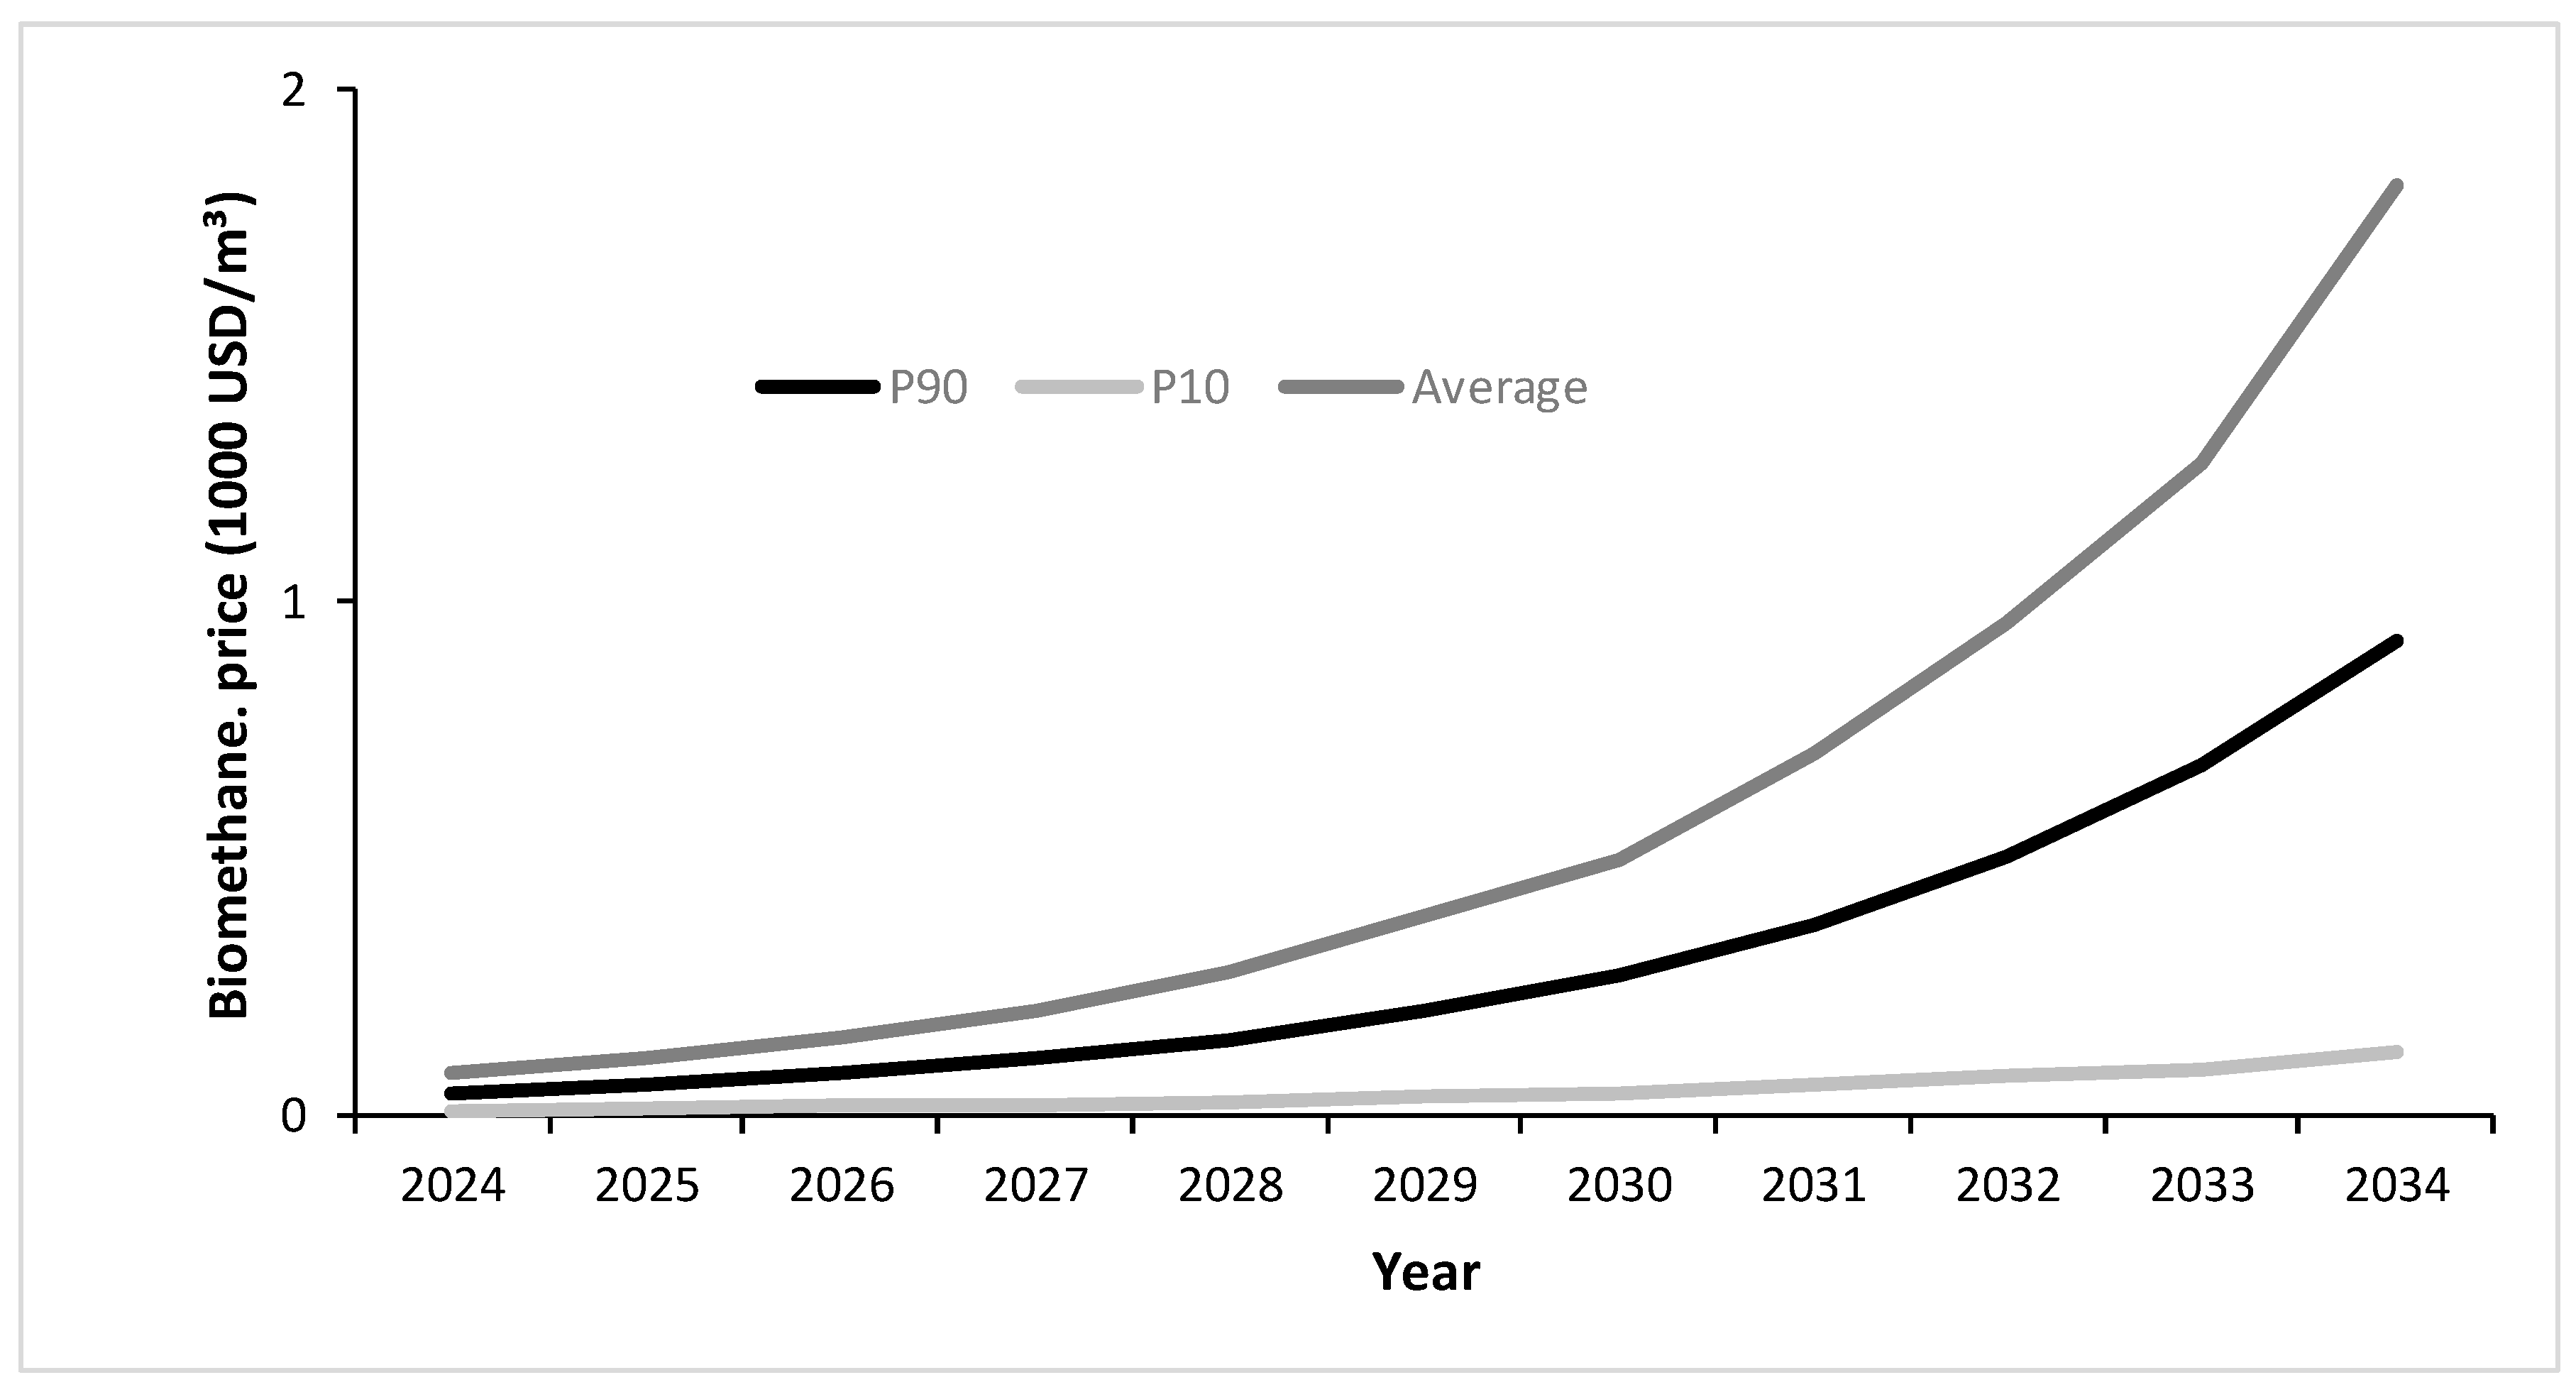
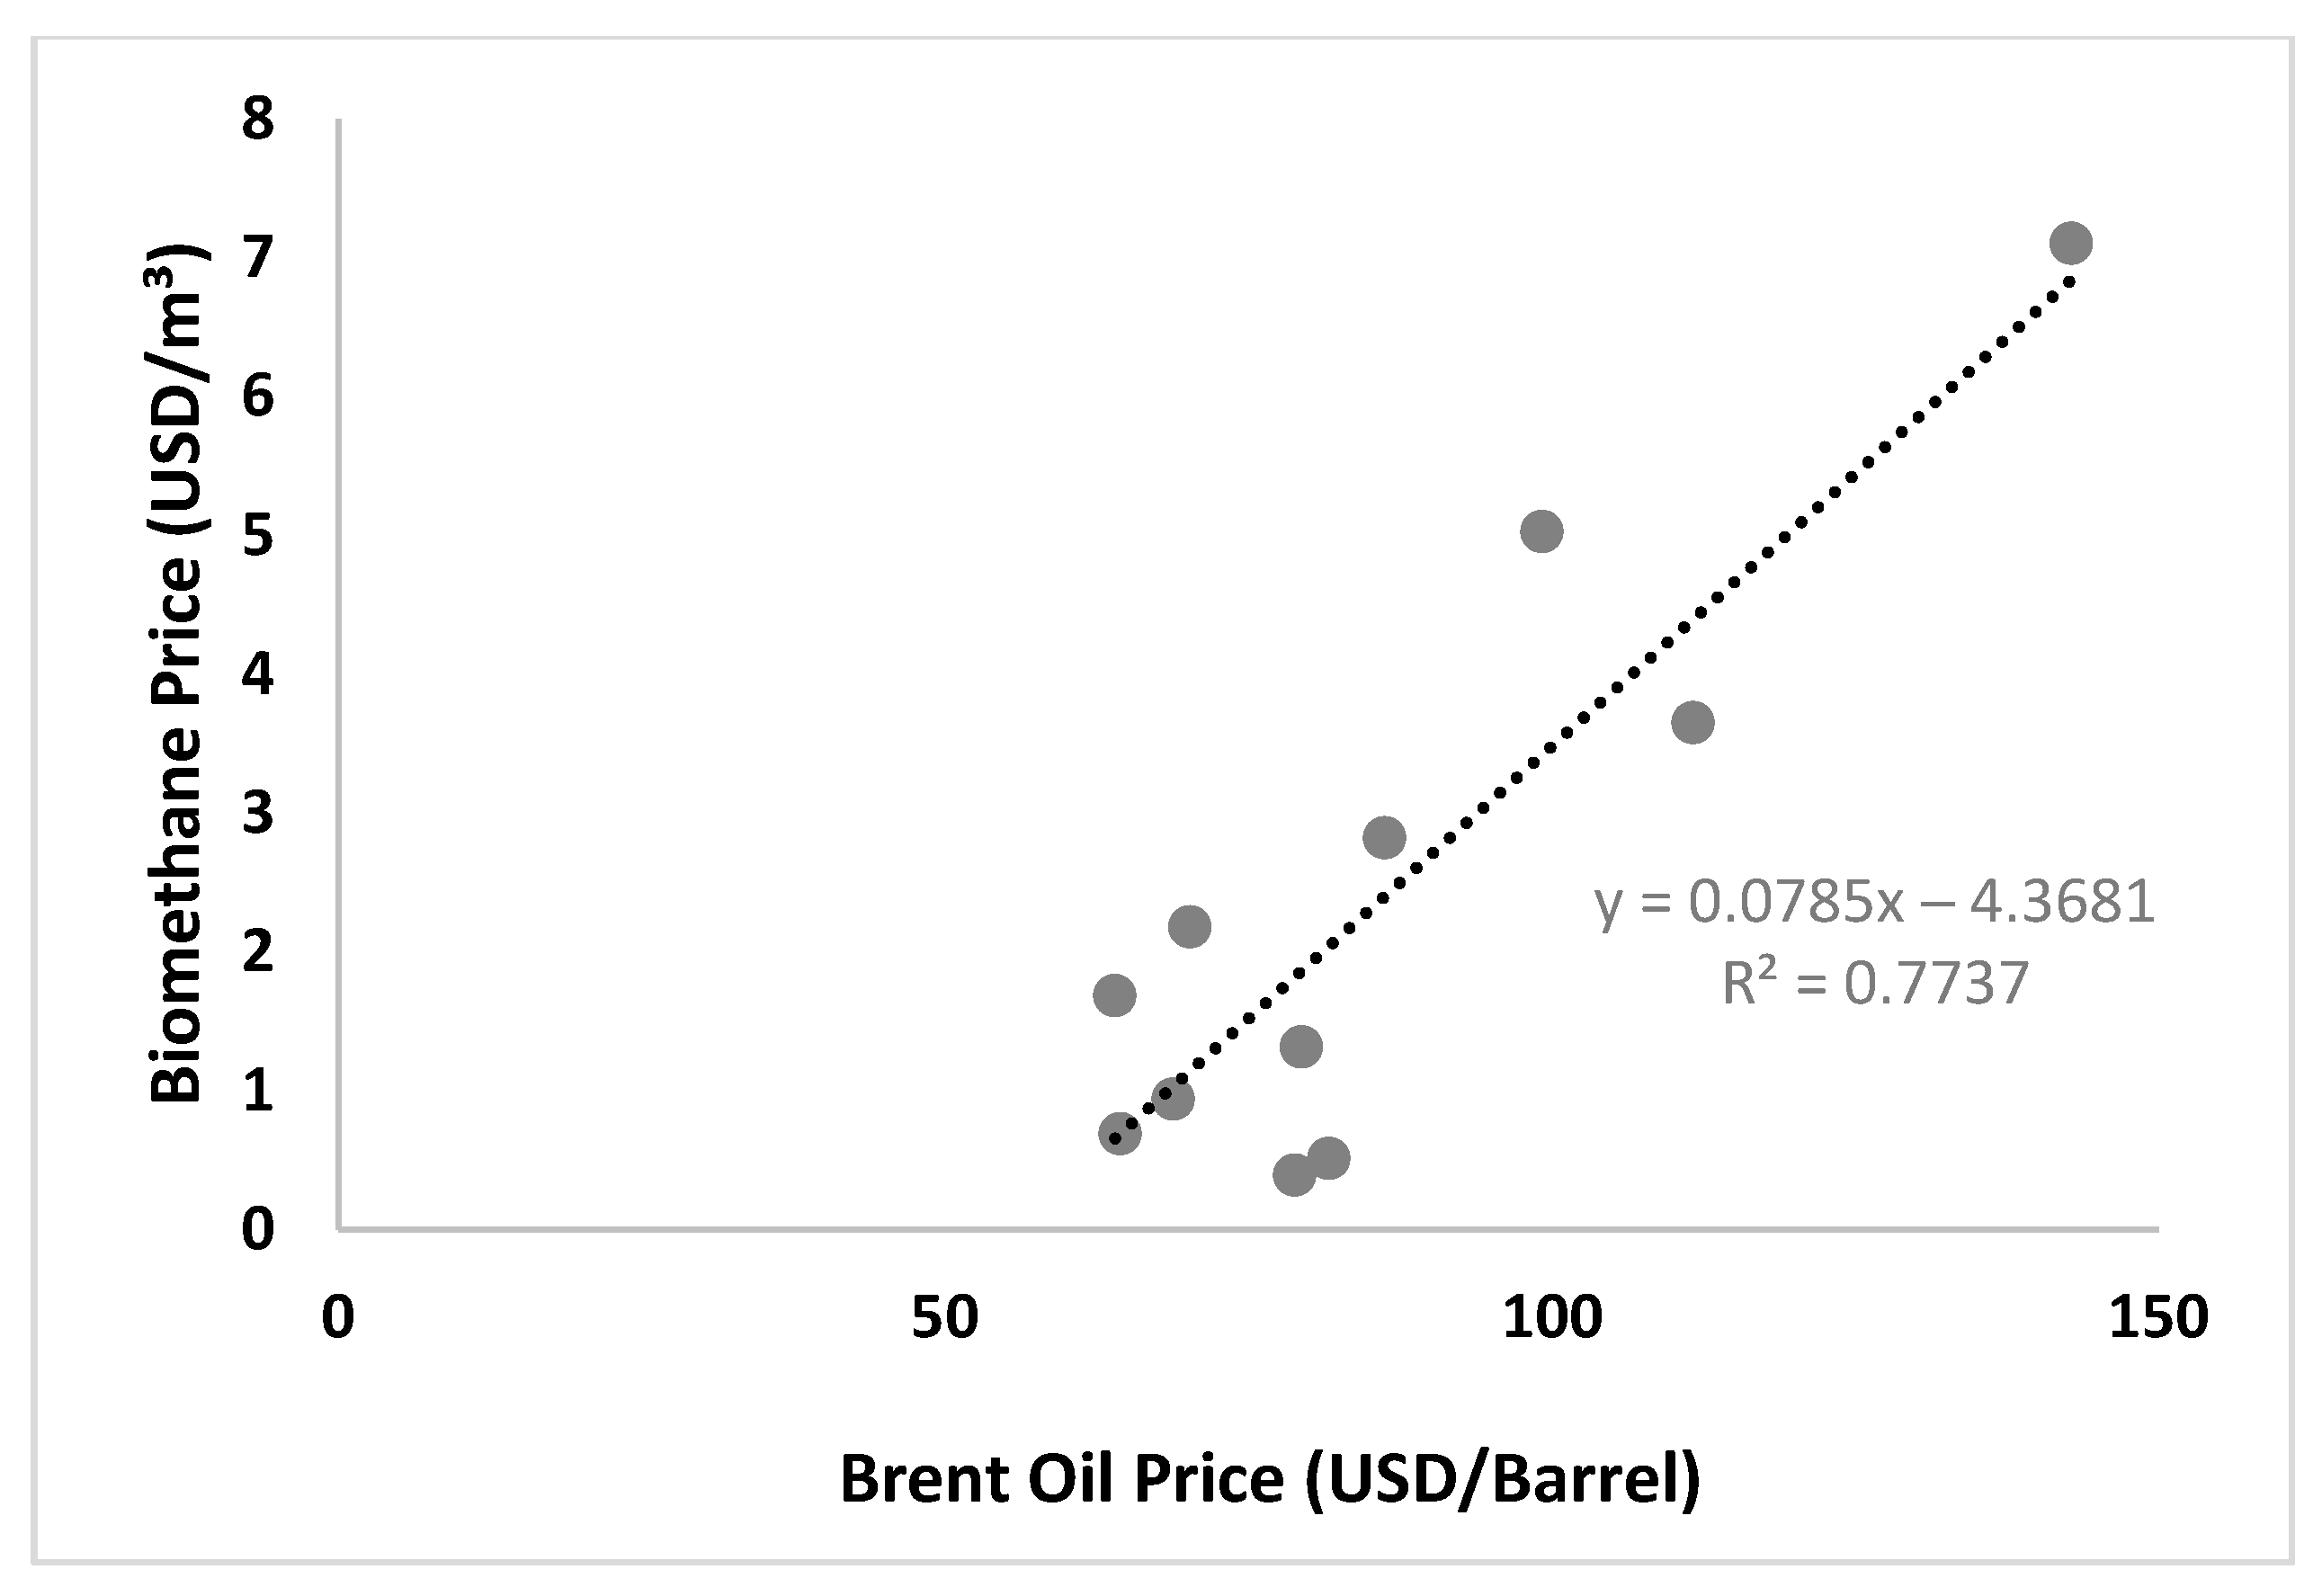
3.3. Biomethane Price Projection

The behavior of biomethane within the series remains more predictable compared to decarbonization credits. Both optimistic and conservative limits may stay close to the average until the year 2030, gradually diverging in subsequent years. The conservative limit deviates more significantly than the optimistic scenario, indicating a higher level of uncertainty regarding lower price levels (Figure 7). However, an overall increasing range of uncertainty is evident over time.
The USD 200 frequency class appears most often throughout the price projections, with nearly 200 occurrences (Figure 8). This indicates a stronger tendency for biomethane prices to reach this level, which is significantly higher than current recorded prices. It is important to note that these values are expressed per m3 and not in joules, as presented in the historical series.
Indeed, as biomethane becomes increasingly allocated for use in new engines, machinery, and vehicles—providing comparative advantages over its fossil fuel counterparts, especially diesel, which is commonly used in agricultural operations—there is potential for a higher demand for biofuel. This could contribute to a price increase. This trend may lead to greater predictability in price behavior, potentially approaching a nonlinear pattern but with a constant amplitude [17].

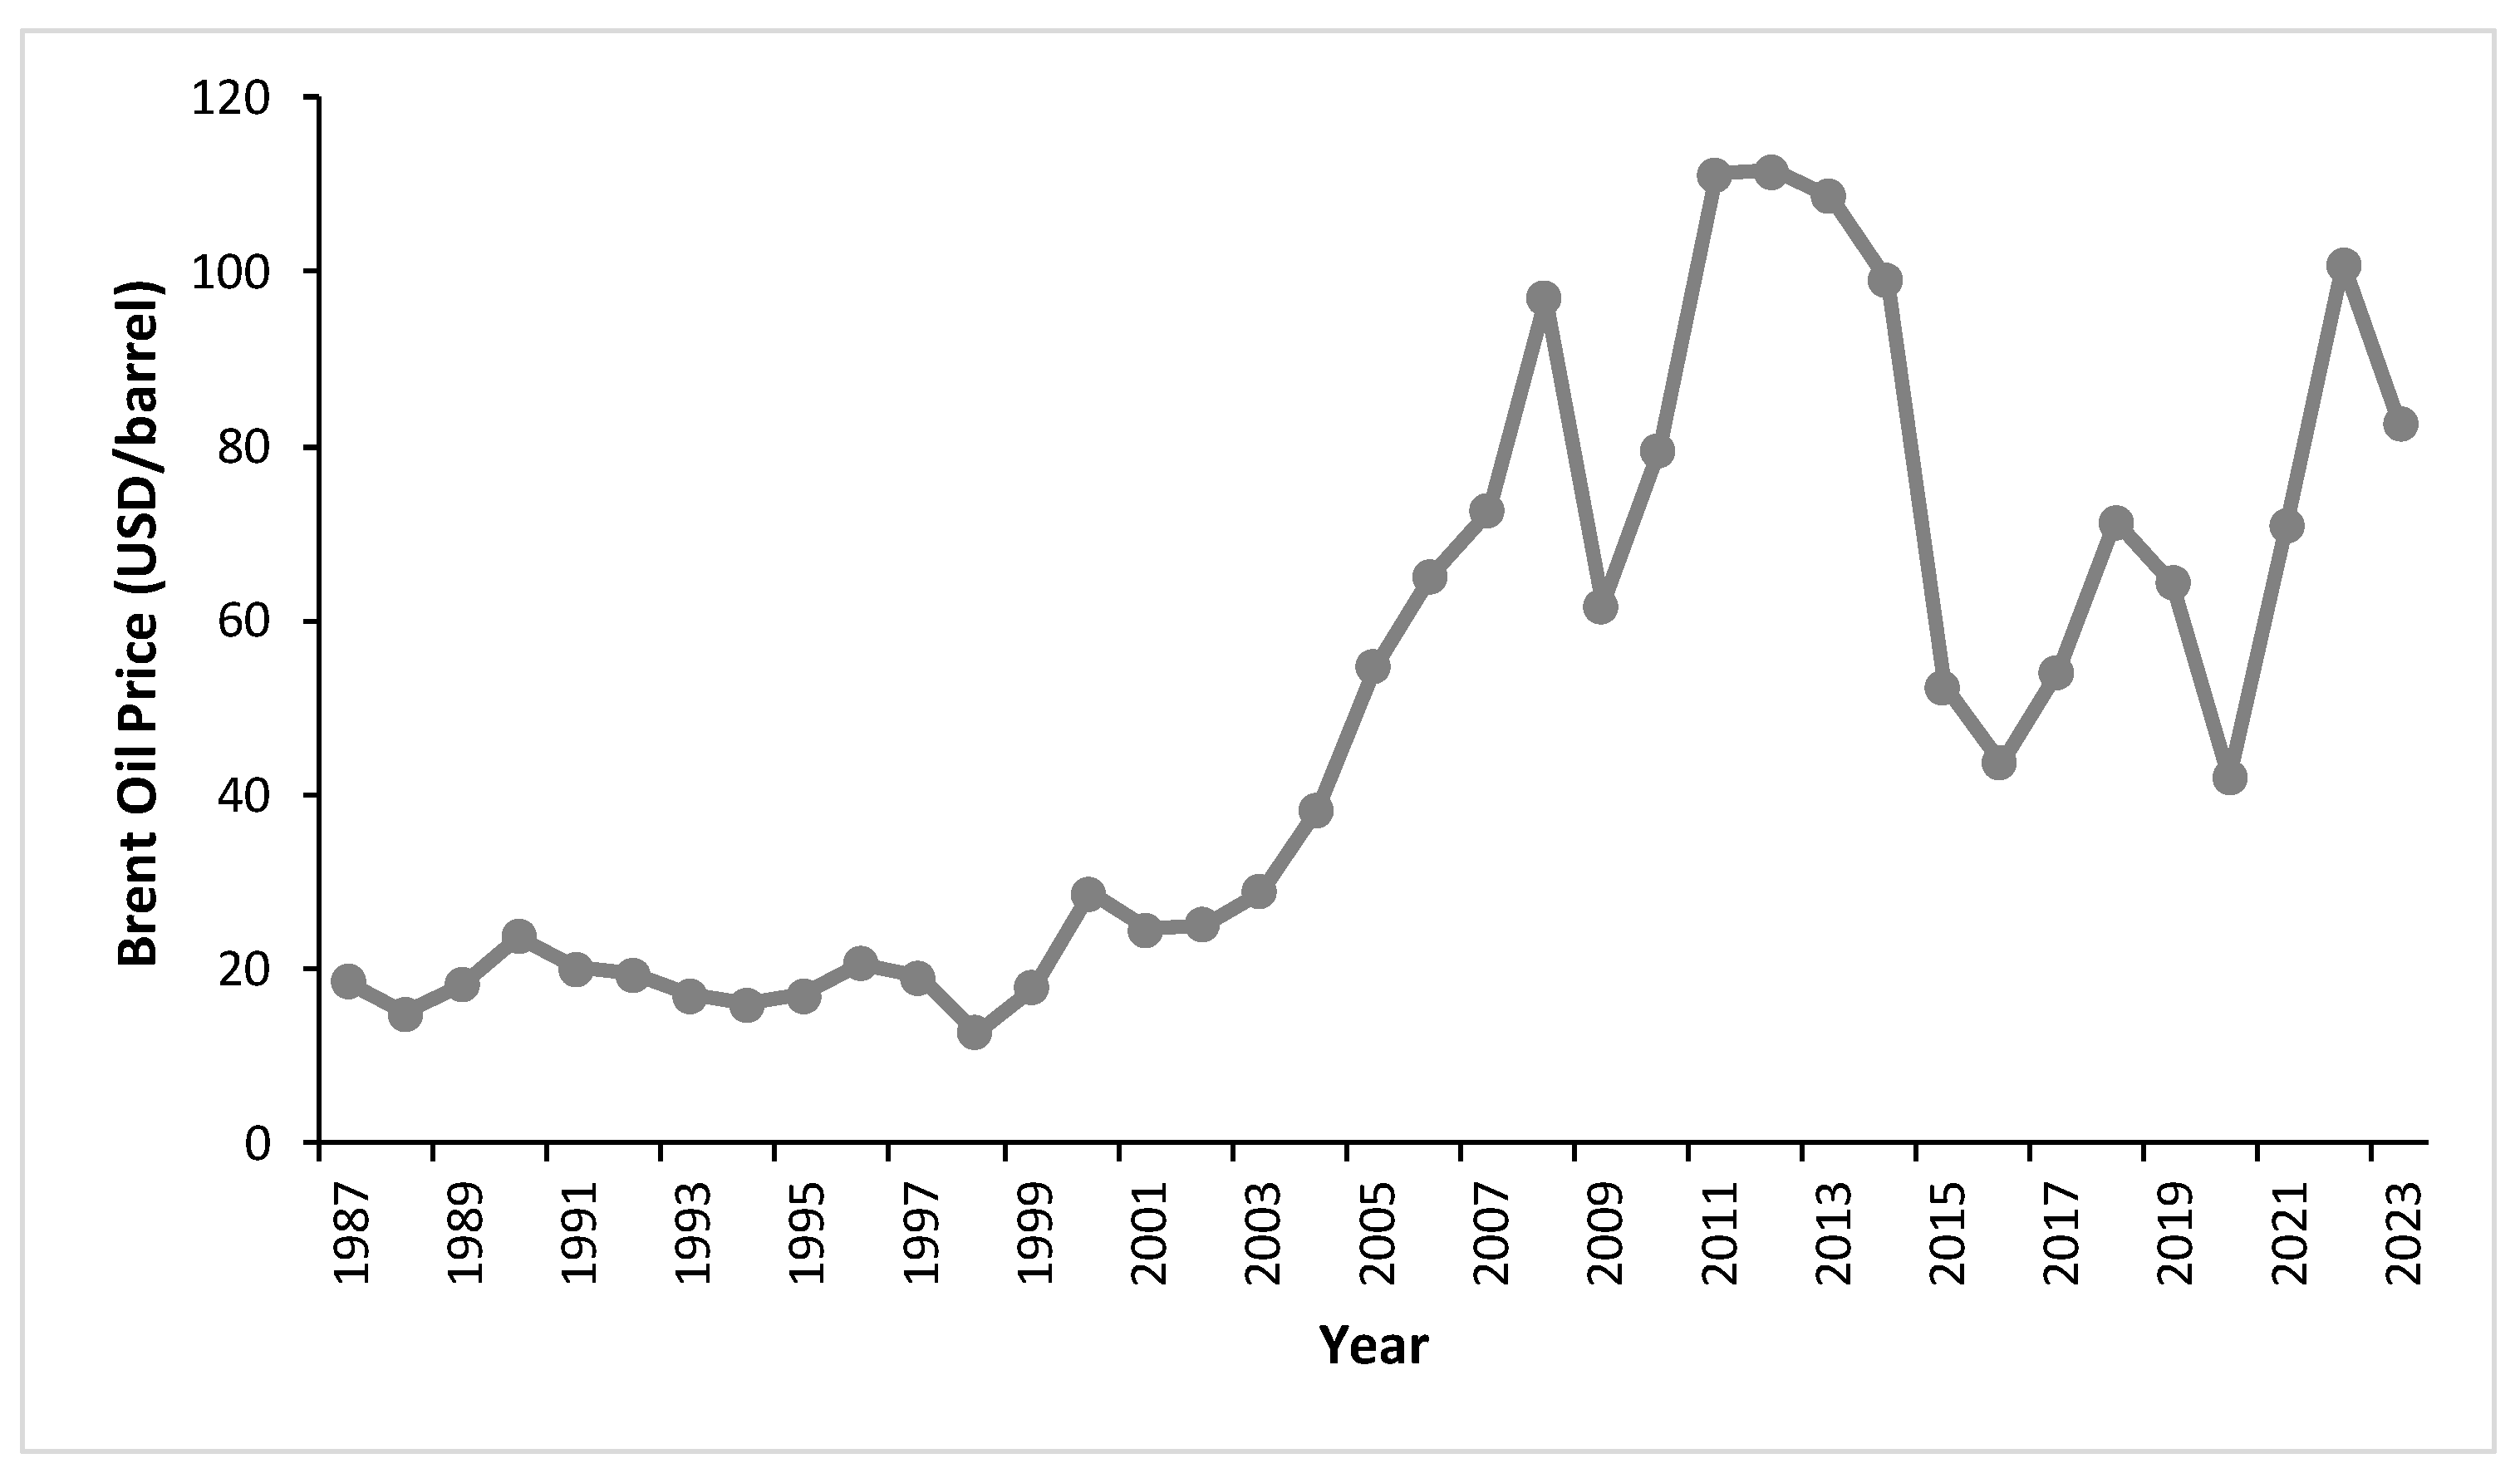
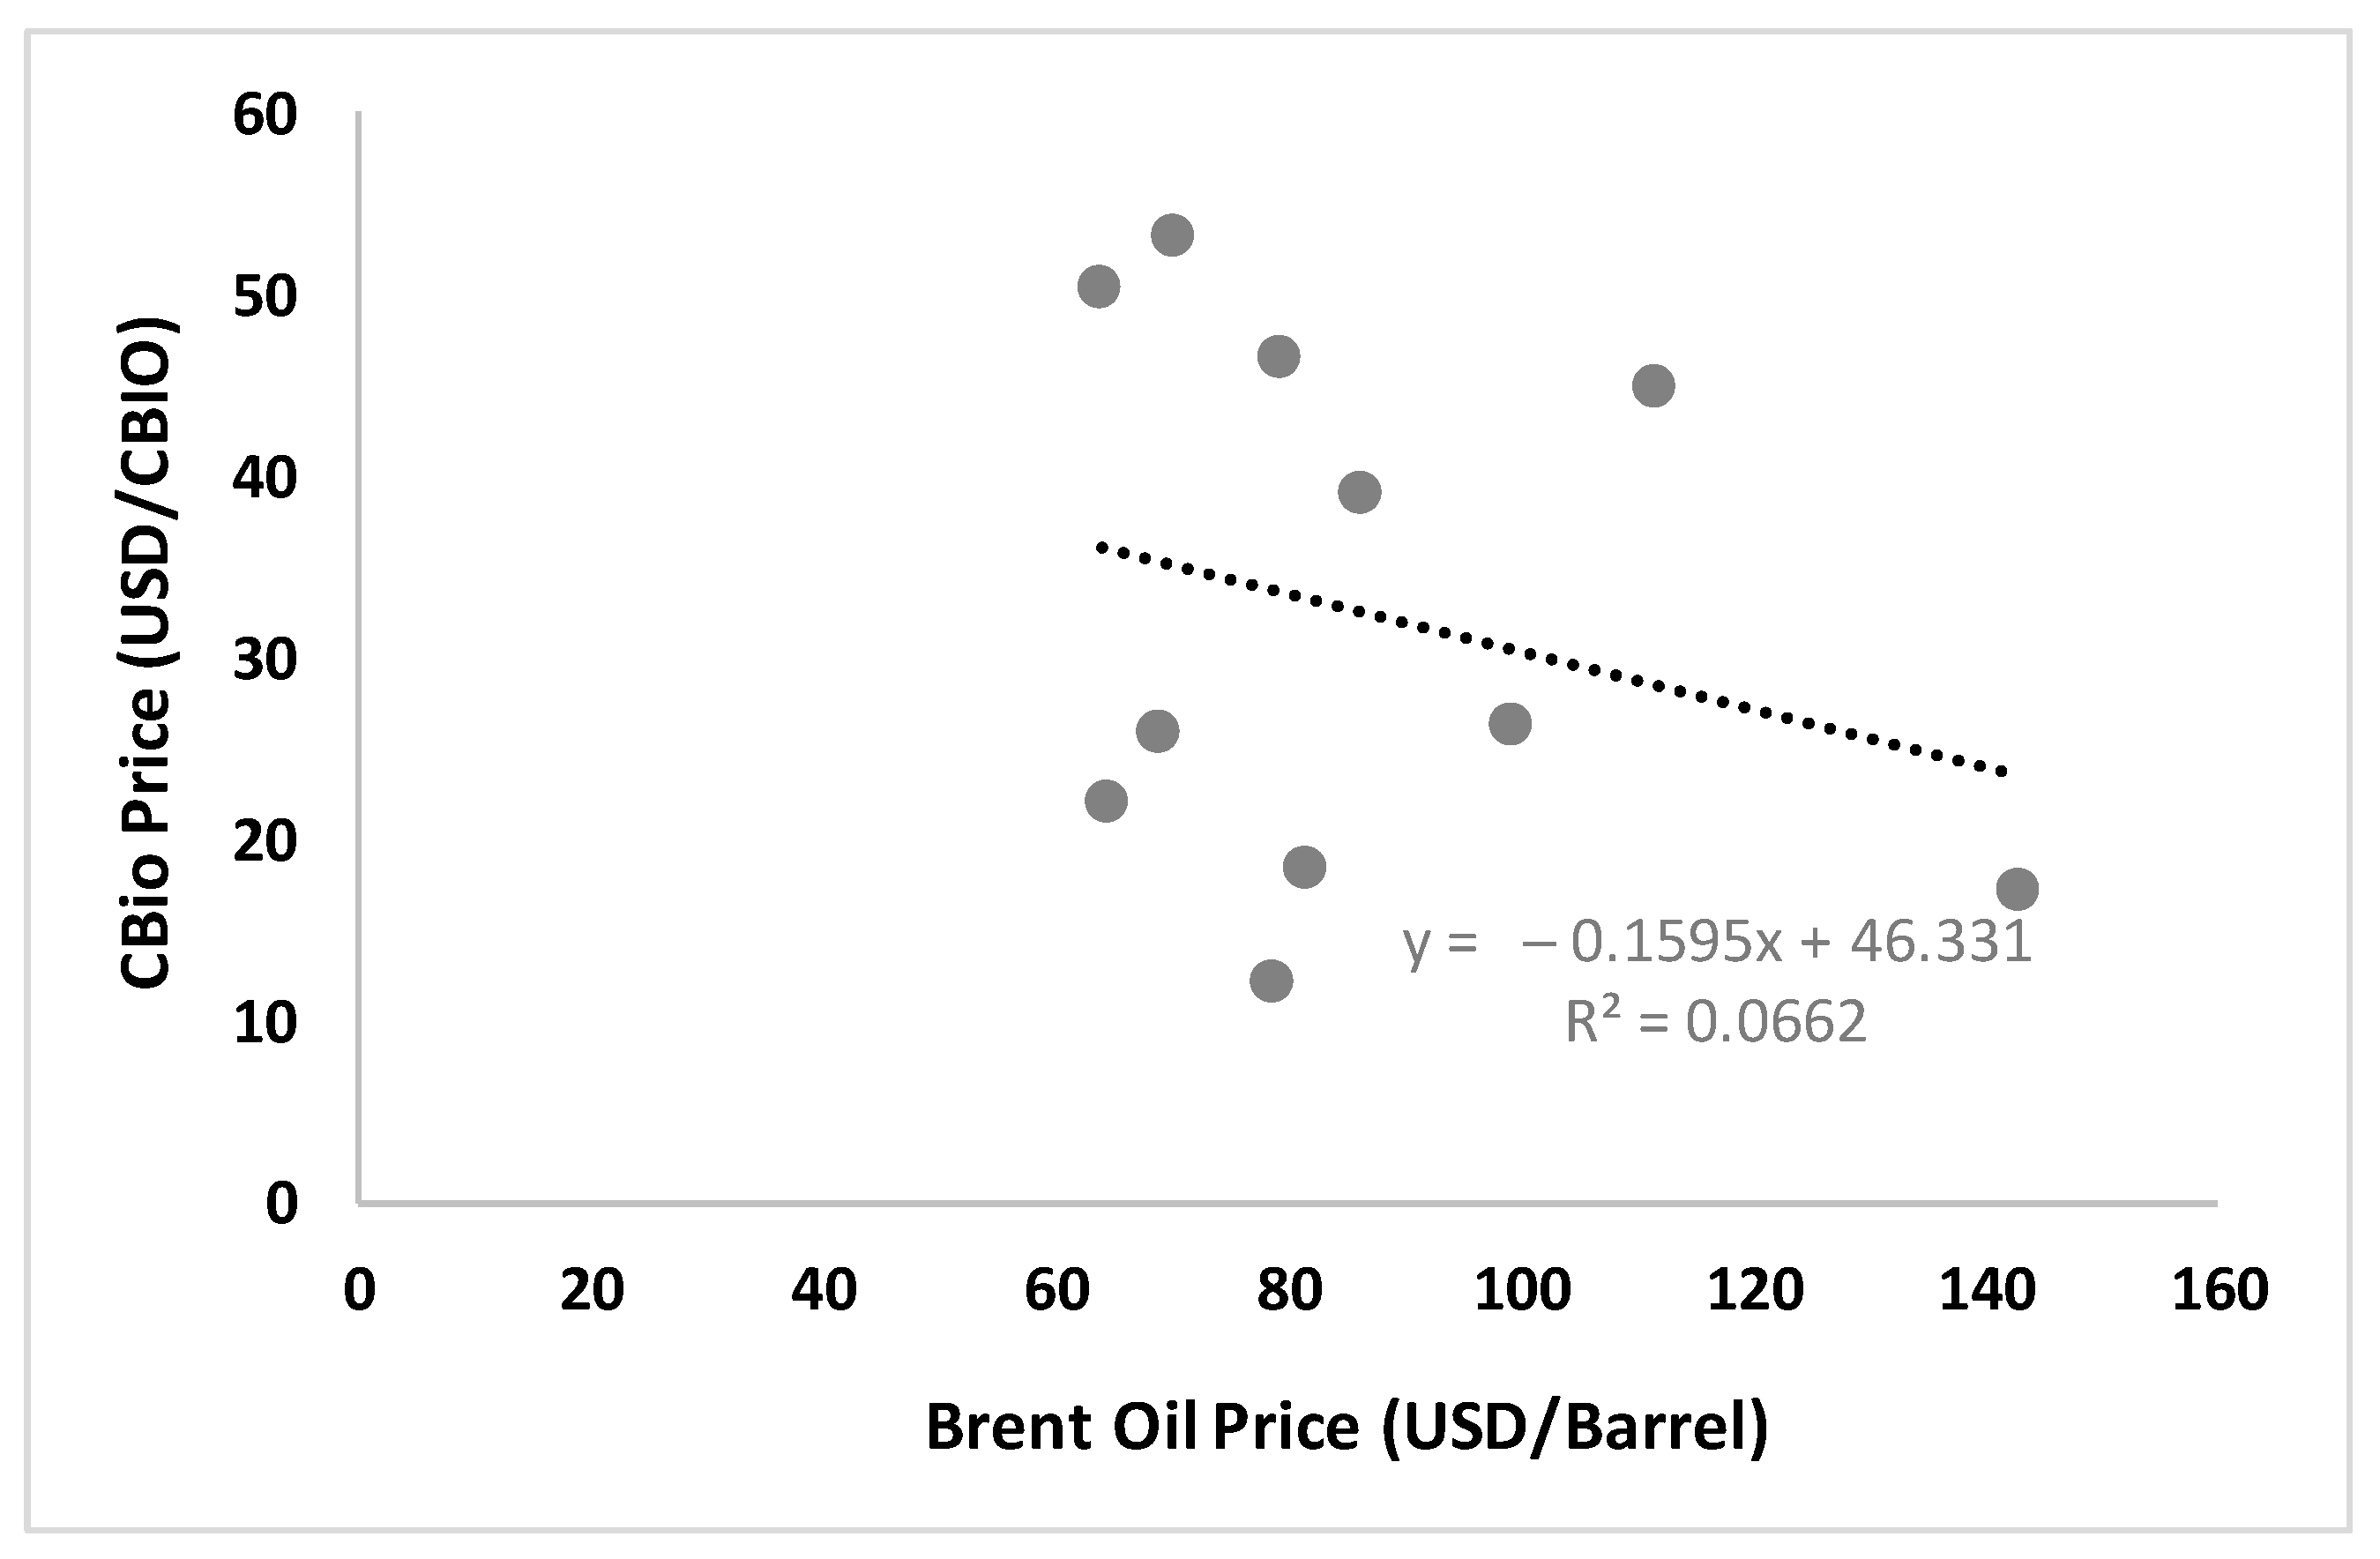
3.4. Price Correlation with Brent Crude Oil

After simulating prices using GBM and Monte Carlo, and with the generated data adjusted for inflation, the price correlation of the main revenue sources for the biomethane plant project was analyzed. This aimed to evaluate how movements in one of the key fossil fuel price indicators, Brent crude oil [27], influence the prices of decarbonization credits and biomethane, respectively.
The establishment of this correlation for decarbonization credits (Figure 9) shows a low degree of correlation with future price movements of crude oil. This is evident in the linear trend, with a low coefficient of determination R2, close to zero, indicating a minimal relationship between these prices. While CBios are gaining prominence as assets, the challenge of forecasting their price movements remains significant, making it difficult to rely exclusively on this asset for long-term investment remuneration.
Despite biomethane or CH4 being a recent entrant in the biofuel market, it has its fossil fuel equivalent—natural gas—the prices and regulations of which are well established both nationally and internationally. When adjusted for its LHV, biomethane requires a greater volume to match the energy output of natural gas.
By adopting the interchangeability approach proposed by [38] and applying biomethane pricing based on natural gas with LHV and inflation adjustments, a significant correlation emerges when compared to crude oil price movements.
According to Figure 10, the R2 coefficient indicates a strong correlation in projected prices, with a value of 0.77. The slope of the trend line suggests that an increase in crude oil prices can also drive an upward movement in biomethane prices.
As noted by [21], the drivers of the hydrocarbon economy in the past resemble the current pursuit of biofuels, whether through new productive investments, as demonstrated by [39], or through price dynamics. In this latter aspect, the correlation underscores the parallel between these two energy sources.

4. Discussion

According to [22], the economic feasibility of renewable fuel presents its challenges primarily in the long term. However, it was observed that it is precisely in the long term that both biomethane and decarbonization credits can gain value, which is reflected in their pricing. Additionally, as society increasingly recognizes the environmental contributions generated by these fuels, incentives may arise to reduce current production costs.
The implementation of biomethane production in the sugar-energy sector faces several barriers, particularly in terms of technological readiness and infrastructure challenges. Although the technology of biomethane production from agricultural residues is well established, its adaptation to specific contexts of the sugar-energy industry remains challenging. The optimization of anaerobic digestion processes and the development of large-scale production equipment tailored to this sector are still areas requiring further advancements [40]. Additionally, integrating biomethane production into existing biofuel plants demands significant modifications, workforce training, and new operational protocols, all of which contribute to higher initial investment costs [41].
Infrastructure challenges further hinder the large-scale adoption of biomethane in the sugar-energy sector. The effective distribution of biomethane depends on an extensive and well-integrated network for transportation, which is often underdeveloped in rural areas where most sugarcane-processing plants are located. The absence of dedicated gas pipelines or the need to retrofit existing infrastructure for biomethane transport significantly increases costs, limiting the economic feasibility of production [42]. Without adequate distribution networks, the commercialization of biomethane becomes constrained, thereby reducing its potential contribution to the renewable energy market.
In addition to structural challenges, several policy-related issues must still be addressed to stimulate biomethane adoption. Beyond the well-established carbon credits and the cap-and-trade market yet to be implemented, the introduction of eco-taxes, as suggested by [43], could also play a strategic role in the transition to a low-carbon economy; these eco-taxes are levies imposed on polluting activities, providing economic incentives for companies to adopt more sustainable technologies and processes. In the case of biomethane, a tax on fossil fuel use could reduce the competitiveness of natural gas, thereby increasing the economic attractiveness of biomethane; additionally, the revenue generated from these taxes could be allocated to subsidies for biomethane infrastructure, including new biogas purification plants and distribution networks. Considering the total initial investment in the infrastructure attached to the biorefinery for biomethane production, with an initial Capex of USD 23.3 million and an annual Opex of USD 800 thousand, and production parameters established according to [25], four cash flow scenarios were developed based on the projected prices through 1000 Monte Carlo simulation scenarios, as shown in Figure 11. Scenario (I) represents the prices obtained through the GBM model with a base scenario of up to 2034 (Figure 11a); Scenario (II) is based on P10 prices, reflecting the conservative price floor of the entire sample (Figure 11b); Scenario (III) demonstrates the cash flow at P90, representing the price ceiling of the entire sample (Figure 11c); and Scenario (IV) shows the average prices of all Monte Carlo simulations (Figure 11d).
All price scenarios account for inflation adjustments through 2034. Scenario (I) is the only one that does not include all Monte Carlo simulations and is the closest to the current levels that biorefineries experience, with an IRR of 15%, compared to the hurdle rate of 14.75%, and a payback period of around 6 years. Scenario (II), despite being the most conservative of the simulated sample, shows an IRR of 35%, which is well above the discount rate, and an NPV of over USD 140 million by the end of the period, with a payback period of just over 3 years. Scenario (III) represents the most optimistic outcome, reaching an IRR above 900%, which is understandable as it only considers the highest price increases in the sample. Finally, Scenario (IV), which presents an IRR of 113% with payback occurring in the second year, represents an average of the Monte Carlo simulations. Despite being an average, these price levels are still significant and optimistic when considering the current market situation.
Considering that the discount rate applied in this study represents the upper bound observed in investment analyses within the sector—ranging from 8% to 15%—its influence on financial outcomes was examined to assess the impact on the projected average price scenario.
When adopting an intermediate discount rate of 11% per year, the net present value (NPV) of the investment improves by over USD 5 million. If the discount rate is reduced to 8% per year, which aligns with the lower bound typically found in bioenergy project evaluations involving sugarcane and biomethane, the NPV increases by approximately USD 11 million within the projected average price scenario over the investment evaluation period, relative to the discount rate based on the Selic benchmark.
In all scenarios analyzed, the payback period remains between five and six years, with minimal deviation from the baseline scenario. However, the impact on NPV is substantial, underscoring the importance of minimizing financing costs in the decision-making process.
If we were to disregard the generation of decarbonization credits from ethanol production and consider only the credits derived from biomethane production, the only economically viable scenarios would be (III) and (IV). This highlights the continued dependence of this biofuel on other renewable energy sources to ensure its feasibility.

5. Conclusions

The analyses, which ranged from the historical movements of oil, natural gas, decarbonization credits, and inflation to projections that included random prices based on historical references and volatilities with the so-called drifts within Brownian models, followed by the Monte Carlo simulation, showed that both stochastic models clearly highlighted the importance and attention required for the projected prices of decarbonization credits and biomethane. Continuous studies of their behaviors and movements are essential to reduce uncertainties when composing any investment project.
The low correlation between CBios and Brent oil weakens projections for this asset, which has a recent historical series and is still subject to price movements not captured in these four years of pricing in the market. If this correlation were higher, it would greatly contribute to revenue projection analyses involving this asset.
On the other hand, the correlation between biomethane and oil, with a much more mature index since 1987, could further stimulate the growth of projects involving biofuel. Although still recent in the market, its price formation can be directly influenced by the price of a barrel of oil, thereby reducing the uncertainty faced by biorefineries regarding the metrics used to project future revenues and, thus, contributing to decarbonization policies.
Regarding investments per se, with revenue flows already accounting for inflation in the projections, the initial base scenario appears to be the closest to the reality currently experienced within biorefineries, with an IRR very close to the hurdle rate. This could influence decision-making, requiring a larger learning curve and reduced production costs to gain attractiveness in lower-price scenarios.

Author Contributions

Conceptualization, F.E.F., L.R.A.A. and T.L.R.; methodology, F.E.F. and L.R.A.A.; validation, F.E.F. and T.L.R.; formal analysis, F.E.F. and T.L.R.; investigation, F.E.F.; resources, F.E.F. and T.L.R.; writing—original draft preparation, F.E.F.; writing—review and editing, F.E.F., L.R.A.A. and T.L.R.; supervision, L.R.A.A. and T.L.R.; project administration, F.E.F. and T.L.R.; funding acquisition, T.L.R. All authors have read and agreed to the published version of the manuscript.

Funding

This research was funded by the National Council for Scientific and Technological Development (CNPq), grant number 306621/2022-3 and by CAPES, grant number 1180/2023—AUXPE/CAPES/PROEX.

Institutional Review Board Statement

Not applicable.

Data Availability Statement

The original contributions presented in this study are included in the article. Further inquiries can be directed to the corresponding author.

Conflicts of Interest

The authors declare no conflicts of interest.

References

  1. Klein, B.C.; Chagas, M.F.; Watanabe, M.D.B.; Bonomi, A.; Maciel Filho, R. Low carbon biofuels and the New Brazilian National Biofuel Policy (RenovaBio): A case study for sugarcane mills and integrated sugarcane-microalgae biorefineries. Renew. Sustain. Energy Rev. 2019, 115, 109365. [Google Scholar] [CrossRef]
  2. Milão, R.D.F.D.; Carminati, H.B.; Ofélia de Queiroz, F.A.; de Medeiros, J.L. Thermodynamic, financial and resource assessments of a large-scale sugarcane-biorefinery: Prelude of full bioenergy carbon capture and storage scenario. Renew. Sustain. Energy Rev. 2019, 113, 109251. [Google Scholar] [CrossRef]
  3. EPE, Empresa de Pesquisa Energética (Brasil). Balanço Energético Nacional 2024. Rio de Janeiro. 2024. Available online: https://www.epe.gov.br/pt/publicacoes-dados-abertos/publicacoes/balanco-energetico-nacional-2024 (accessed on 24 August 2024).
  4. Vandenberghe, L.P.S.; Valladares-Diestra, K.K.; Bittencourt, G.A.; Torres, L.Z.; Vieira, S.; Karp, S.G.; Sydney, E.B.; de Carvalho, J.C.; Soccol, V.T.; Soccol, C.R. Beyond sugar and ethanol: The future of sugarcane biorefineries in Brazil. Renew. Sustain. Energy Rev. 2022, 167, 112721. [Google Scholar] [CrossRef]
  5. CNI, Confederação Nacional das Industrias (Brasil). O Setor Sucroenergético em 2030 Dimensões, Investimentos e uma Agenda Estratégica. 2017. Available online: http://www.portaldaindustria.com.br/publicacoes/2017/8/o-setor-sucroenergetico-em-2030-dimensoes-investimentos-e-uma-agenda-estrategica/ (accessed on 10 December 2024).
  6. Coelho, S.T.; Garcilasso, V.P.; Ferraz, A.D.N., Jr.; Santos, M.M.; Joppert, C.L. Tecnologias de Produção e uso de Biogás e Biometano. Parte I: Biogás, Parte II: Biometano; IEE-USP: São Paulo, Brazil, 2018. [Google Scholar]
  7. Hull, S. Guidebook to Gas Interchangeability and Gas Quality; BP in Association with the IGU: Brussels, Belgium, 2011. [Google Scholar]
  8. Silva, C.A.B.V. Limpeza e Purificação de Biogás. 91f. Dissertação de Mestrado, Universidade de Trás-os-Montes e Alto Douro, Vila Real, Portugal, 2009. [Google Scholar]
  9. de Souza Moraes, B.; Palacios-Bereche, R.; Martins, G.; Nebra, S.A.; Fuess, L.T.; Silva, A.J.; da Silva Clementino, W.; Bajay, S.V.; Manduca, P.C.; Lamparelli, R.A.; et al. Biogas production: Technologies and applications. In Biofuels and Biorefining; Elsevier: Amsterdam, The Netherlands, 2022; pp. 215–282. [Google Scholar]
  10. Souza, J.D.; Lima, H.Q.D.; Schaeffer, L. Desenvolvimento de tecnologia para utilização de biogás e biodiesel em motor de ciclo diesel. In Proceedings of the 2013 9º Congresso sobre Geração Distribuída e Energia no Meio Rural, Itajubá, Brazil, 15–17 May 2013. [Google Scholar] [CrossRef]
  11. COGEN, Associação da Indústria de Cogeração de Energia (Brasil). Cogen—Geo Energética. 2015. Available online: http://www.cogen.com.br/content/upload/1/documentos/workshop/2015/Apresentacao_GEO_COGEN_12032015.pdf (accessed on 4 November 2024).
  12. MME, Ministério de Minas e Energia. Comitê Renovabio. 2017. Available online: http://antigo.mme.gov.br/documents/20182/1164584/RO4/2192be7f-195d-b291-4926-2116723d252b (accessed on 25 September 2024).
  13. Kirchherr, J.; Reike, D.; Hekkert, M. Conceptualizing the circular economy: An analysis of 114 definitions. Resour. Conserv. Recycl. 2017, 127, 221–232. [Google Scholar] [CrossRef]
  14. Pretty, J.; Benton, T.G.; Bharucha, Z.P.; Dicks, L.V.; Flora, C.B. Global assessment of agricultural system redesign for sustainable intensification. Nat. Sustain. 2018, 1, 441–446. [Google Scholar] [CrossRef]
  15. Milanez, A.Y.; Maia, G.B.D.S.; Guimarães, D.D. Biogás: Evolução Recente e Potencial de uma nova Fronteira de Energia Renovável para o Brasil; BNDES: Rio de Janeiro, Brazil, 2021. [Google Scholar]
  16. Lux, T. Stochastic behavioral asset-pricing models and the stylized facts. In Handbook of Financial Markets: Dynamics and Evolution; North-Holland: Amsterdam, The Netherlands, 2009; pp. 161–215. [Google Scholar]
  17. Gopikrishnan, P.; Meyer, M.; Amaral, L.N.; Stanley, H.E. Inverse cubic law for the distribution of stock price variations. Eur. Phys. J. B-Condens. Matter Complex Syst. 1998, 3, 139–140. [Google Scholar] [CrossRef]
  18. Nadaleti, W.C.; Lourenço, V.A. A mathematical, economic and energetic appraisal of biomethane and biohydrogen production from Brazilian ethanol plants’ waste: Towards a circular and renewable energy development. Int. J. Hydrogen Energy 2021, 46, 27268–27281. [Google Scholar] [CrossRef]
  19. de Araujo, G.J.F.; de Oliveira, S.V.W.B.; de Oliveira, M.M.B. Economic analysis of internal circulation biodigesters and vinasse concentrators for the generation of electricity, fertilizers, and carbon credits in various Brazilian economic scenarios. Bioenergy Res. 2019, 12, 1164–1186. [Google Scholar] [CrossRef]
  20. Brandão, C.M.; Stradiotto, N.R. Comparative Economic Analysis of the Utilization of Biogas from Sugarcane Vinasse in Electricity Generation, Transport Fuel and Natural Gas Substitution: A Brazilian case Study. Waste Biomass Valorization 2024, 1–24. [Google Scholar] [CrossRef]
  21. Demirbas, A. Biofuels sources, biofuel policy, biofuel economy and global biofuel projections. Energy Convers. Manag. 2008, 49, 2106–2116. [Google Scholar] [CrossRef]
  22. Perin, G.; Jones, P.R. Economic feasibility and long-term sustainability criteria on the path to enable a transition from fossil fuels to biofuels. Curr. Opin. Biotechnol. 2019, 57, 175–182. [Google Scholar] [CrossRef] [PubMed]
  23. Volpi, M.P.C.; Fuess, L.T.; Moraes, B.S. Economic performance of biogas production and use from residues co-digestion in integrated 1G2G sugarcane biorefineries: Better electricity or biomethane? Energy Convers. Manag. 2023, 277, 116673. [Google Scholar] [CrossRef]
  24. Nadaleti, W.C.; Lourenco, V.A.; Belli Filho, P.; dos Santos, G.B.; Przybyla, G. National potential production of methane and electrical energy from sugarcane vinasse in Brazil: A thermo-economic analysis. J. Environ. Chem. Eng. 2020, 8, 103422. [Google Scholar] [CrossRef]
  25. Fava, F.E.; Romanelli, T.L. Biogas and biomethane production routes in the sugar-energy sector: Economic efficiency and carbon footprint. Bioresour. Technol. Rep. 2023, 22, 101388. [Google Scholar] [CrossRef]
  26. B3. CBIO—Consultas. 2024. Available online: https://www.b3.com.br/pt_br/b3/sustentabilidade/produtos-e-servicos-esg/credito-de-descarbonizacao-cbio/cbio-consultas/ (accessed on 30 October 2024).
  27. EIA, U.S. Energy Information Administration. Europe Brent Spot Price FOB. 2024. Available online: https://www.eia.gov/dnav/pet/hist/LeafHandler.ashx?n=PET&s=RBRTE&f=A (accessed on 24 December 2024).
  28. MME, Ministério de Minas e Energia (Brasil). Boletim Mensal de Acompanhamento da Indústria de Gás Natural. 2024. Available online: https://www.gov.br/mme/pt-br/assuntos/secretarias/petroleo-gas-natural-e-biocombustiveis/publicacoes-1/boletim-mensal-de-acompanhamento-da-industria-de-gas-natural (accessed on 6 December 2024).
  29. IBGE, Instituto Brasileiro de Geografia e Estatística (Brasil). IPCA—Índice Nacional de Preços ao Consumidor Amplo, Séries Históricas. 2024. Available online: https://www.ibge.gov.br/estatisticas/economicas/precos-e-custos/9256-indice-nacional-de-precos-ao-consumidor-amplo.html?=&t=series-historicas (accessed on 29 November 2024).
  30. Glasserman, P. Monte Carlo Methods in Financial Engineering; Springer: Berlin/Heidelberg, Germany, 2004. [Google Scholar]
  31. Björk, T. Arbitrage Theory in Continuous Time; Oxford University Press: Oxford, UK, 2009. [Google Scholar]
  32. BCB, Banco Centro do Brasil. Boletim Focus. 2024. Available online: https://www.bcb.gov.br/content/focus/focus/R20241220.pdf (accessed on 21 December 2024).
  33. B3. Indicadores e Taxas de Câmbio. 2024. Available online: https://www.b3.com.br/pt_br/market-data-e-indices/servicos-de-dados/market-data/consultas/clearing-de-cambio/indicadores/taxas-de-cambio-praticadas/ (accessed on 1 December 2024).
  34. UNICA—União da Agroindústria Canavieira do Estado de São Paulo (Brasil). Observatório da Cana. Mix de Produção. 2024. Available online: https://observatoriodacana.com.br/ (accessed on 18 October 2024).
  35. Kreibich, N. Toward global net zero: The voluntary carbon market on its quest to find its place in the post-Paris climate regime. Wiley Interdiscip. Rev. Clim. Change 2024, 15, e892. [Google Scholar] [CrossRef]
  36. Stavins, R.N. The relative merits of carbon pricing instruments: Taxes versus trading. Rev. Environ. Econ. Policy 2022, 16, 62–82. [Google Scholar] [CrossRef]
  37. Dragicevic, A. Internalizing CO2-Equivalent Emissions Issued from Agricultural Activities. Front. Clim. 2021, 3, 714334. [Google Scholar] [CrossRef]
  38. Keogh, N.; Corr, D.; O’Shea, R.; Monaghan, R.F.D. The gas grid as a vector for regional decarbonisation-a techno economic case study for biomethane injection and natural gas heavy goods vehicles. Appl. Energy 2022, 323, 119590. [Google Scholar] [CrossRef]
  39. EPE, Empresa de Pesquisa Energética (Brasil). Investimentos e Custos Operacionais e de Manutenção no Setor de Biocombustíveis: 2020–2030. Rio de Janeiro. 2019. Available online: https://www.epe.gov.br/sites-pt/publicacoes-dados-abertos/publicacoes/PublicacoesArquivos/publicacao-343/topico-506/Investimentos_Custos_O_e_M_Bios_2020-2030.pdf (accessed on 4 November 2024).
  40. Mata-Alvarez, J.; Macé, S.; Llabrés, P. Anaerobic digestion of organic solid wastes. An overview of research achievements and perspectives. Bioresour. Technol. 2014, 74, 3–16. [Google Scholar] [CrossRef]
  41. Monforti, F.; Lugato, E.; Motola, V.; Bodis, K.; Scarlat, N.; Dallemand, J.F. Optimal energy use of agricultural crop 40residues preserving soil organic carbon stocks in Europe. Renew. Energy 2016, 96, 460–469. [Google Scholar]
  42. Persson, M.; Jönsson, O.; Wellinger, A. Biogas upgrading to vehicle fuel standards and grid injection. In IEA Bioenergy Task; IEA Bioenergy: Paris, France, 2006; Volume 37, pp. 1–34. [Google Scholar]
  43. Dragicevic, A.; Pereau, J.-C. Comparing Climate Pledges and EcoTaxation in a Networked Agricultural Supply Chain Organization. Eur. Rev. 2024, 51, 354–398. [Google Scholar]
Figure 1. Price of Brent oil in the global market since 1987.
Agriculture 15 00380 g001
Figure 2. Biomethane price by volume and energy content.
Agriculture 15 00380 g002
Figure 3. Price of decarbonization credits in Brazil.
Agriculture 15 00380 g003
Figure 4. Annual behavior of Brazilian inflation.
Agriculture 15 00380 g004
Figure 5. Evolution of CBios prices based on the Monte Carlo model.
Agriculture 15 00380 g005
Figure 6. Histogram of CBios with frequency of projected price.
Agriculture 15 00380 g006
Figure 7. Evolution of the price of biomethane from the Monte Carlo model.
Agriculture 15 00380 g007
Figure 8. Histogram of biomethane with frequency of projected prices.
Agriculture 15 00380 g008
Figure 9. Correlation of oil prices with decarbonization credits.
Agriculture 15 00380 g009
Figure 10. Correlation of oil prices with biomethane.
Agriculture 15 00380 g010
Figure 11. Biomethane investment cash flow for scenarios I (a), II (b), III (c), and IV (d).
Agriculture 15 00380 g011
Table 1. Investments in the structure for biomethane.
StructureQuantityInvestments—USD 1 Million
Initial CapexAnnual Opex
Buffer Lagoon20.50.1
Horizontal Digesters42.50.1
Desulfurization Plant15.80.2
Purification Plant16.70.1
Gasometer11.70.1
Flare10.30.1
Compression Station15.80.1
Buffer Lagoon20.50.1
1 USD 1 = BRL 6.00 on 29 November 2024 [33].
Table 2. Production parameters for revenue generation.
ParameterUnitValue
Sugarcane millGg5000
ETOH productionm3243,310
Vinassem32,919,720
Biomethanem3208,800
Biomethane CBio#620
Ethanol CBio#355,197
# indicates the amount (unitless) of CBIO from the source (biomethane or ethanol produced).
Disclaimer/Publisher’s Note: The statements, opinions and data contained in all publications are solely those of the individual author(s) and contributor(s) and not of MDPI and/or the editor(s). MDPI and/or the editor(s) disclaim responsibility for any injury to people or property resulting from any ideas, methods, instructions or products referred to in the content.

