Article

Arsenic Accumulation in Pakchoi Influenced by Acidification-Driven Changes in Soil Properties and Arsenic Transformation

1
College of Resources and Environment, Southwest University, Chongqing 400715, China
2
Chongqing Key Laboratory of Agricultural Resources and Environment, Chongqing 400715, China
*
Author to whom correspondence should be addressed.
Agriculture 2025, 15(4), 364; https://doi.org/10.3390/agriculture15040364
Submission received: 26 December 2024 / Revised: 4 February 2025 / Accepted: 6 February 2025 / Published: 8 February 2025
(This article belongs to the Section Agricultural Soils)

Abstract

:
Soil acidification activates most of the cationic heavy metals in soil and thus enhances their accumulation in crops, posing an accentuated threat to human health, while there is limited knowledge regarding the accumulation of metalloid arsenic (As) in crops, which is influenced by acidification due to its opposite behavior in soil. In this study, the acidification processes of neutral purple soil together with the accompanied changes in soil properties and As fractionation were examined through a column-leaching experiment. Subsequently, growth and As accumulation in pakchoi (Brassica campestris L.) were investigated under various combinations of soil pH and As pollution levels in a pot experiment. This allowed us to elucidate the mechanisms of As accumulation in pakchoi under the co-stresses of soil acidification and As pollution. The results indicated that soil acidification followed a two-phase process, initially rapid and later slow, with a turning point at a pH of 4.7–4.8. Below this critical pH, the leaching rates of base ions and As accelerated significantly and the decomposition of primary minerals began, primarily from chlorite to green/mesospheric minerals, resulting in a substantial increase in the content of amorphous iron oxide. Meantime, soil As was transformed from highly labile forms, such as non-specifically and specifically adsorbed forms, to less active ones like amorphous hydrous oxide-bound and residual forms, resulting in decreased As availability. In this context, As pollution remarkably delayed the growth of pakchoi, while the influence of acidification on growth only occurred when the soil was acidified to a pH lower than 6, as demonstrated by a substantial biomass reduction at higher As levels and a 41.8% biomass decrease at pH 4.6. Moreover, soil acidification exacerbated the inhibitory effect of As on pakchoi growth. The As contents in the edible parts of pakchoi dramatically increased with the increase in the soil As level, and soil acidification did not mitigate As accumulation in plants via the suppression of soil As availability but rather greatly increased it due to the bioconcentration effect caused by As toxicity. In conclusion, significant interactions existed between soil acidification and As pollution in terms of soil properties and As transformation, leading to comprehensive effects on growth and As accumulation in crops.

1. Introduction

Soil acidification and heavy metal pollution are the main soil environmental issues currently faced in China and abroad [1], posing a severe threat to farmland ecosystems and human health. Soil acidification is caused by industrialization processes, overuse of chemical fertilizers, and acidic precipitation [2,3,4], while heavy metal pollution mainly originates from human activities such as industrial wastewater discharge, irrational use of chemical fertilizers and pesticides, and mining [5,6]. Soil acidification causes significant impacts on agroecosystems and crop yield and quality [7]. Acidification decreases soil pH and accelerates the loss of base ions and nutrients in the soil. It also promotes the activation of toxic and harmful elements such as soil Al ions and cationic heavy metals such as cadmium (Cd) and lead (Pb), leading to crop growth restriction, yield decline, and quality reduction [8]. Southwest China is not only an area facing serious soil acidification but also characterized by geologically high heavy metal backgrounds [9]. As such, soil acidification combined with heavy metal pollution exacerbates threats to the regional agroecological environment and the safe production of crops. An in-depth understanding of the characteristics of regional soil acidification, its coupling process with heavy metal pollution, and the underlying mechanisms would be of great significance for the remediation of soil pollution and the safe production of agricultural products.
Purple soil is one of the main agricultural soils in the southwest of China [10,11,12]. Long-term monitoring found that significant soil acidification occurred in the southwestern purple hilly regions from 1981 to 2012, with a 0.3 unit decrease in soil pH [13,14], especially for neutral purple soils [15,16]. The acidification characteristics, processes, and mechanisms of this kind of soil are quite different from those of zonal soils such as yellow and red soils [17]. The cultivated soil in this region is mainly contaminated by cadmium (Cd), but there is also As and Cd-As combined pollution, and the pollution degree is mainly slight to mild pollution [18,19,20]. In practice, Cd exceedance in rice and other crops mainly occurs in areas with acidified purple soil. There are many reports on the process and mechanisms for the activation of soil Cd, Pb, and other cationic heavy metals by soil acidification: acidification-driven changes in soil composition and properties, the direct effect of pH on a series of physicochemical processes in soil, and changes in the morphology of Cd and Pb as a result of acidification have been regarded as the primary activation mechanisms [21,22,23,24]. As is an environmentally hazardous metalloid, often classified as a heavy metal in the field of environmental remediation. Long-term exposure to high As levels in soil and agricultural products can lead to a variety of health problems, including cancer, neurological damage, and immune system disorders [25,26,27]. As exists in the environment in the anionic form, and its environmental behaviors in the soil are opposite to those of cationic heavy metals such as Cd and Pb [28,29]. However, current research on the environmental behaviors of As driven by soil acidification is far less in-depth than that focused on cationic heavy metals [30]. It is well-established that the mobility and bioavailability of soil As decrease with the reduction in soil pH [31,32,33]. This suggests that the acidification of As-contaminated soils may potentially reduce As accumulation in crops. However, no definitive conclusions can be drawn due to the insufficient understanding of the coupled relationship between changes in soil properties, alterations in As species’ activity induced by soil acidification, and their subsequent impact on crop responses.
Therefore, by taking neutral purple soil, a widely distributed arable soil in Southwest China, as the research object, this paper aims to study the evolution characteristics of soil properties and composition during the acidification process and elucidate the coupling relations between changes in soil As states, bioavailability, and soil properties. As such, it aims to reveal the synergistic harm of soil acidification and As pollution to crops, as well as the effecting mechanisms. Indoor simulated acidification tests, pot experiments, and systematic soil–crop analyses were conducted for this study’s purposes. The results may supply theoretical bases for the concurrent remediation of regional soil acidification and metalloid pollution.

2. Materials and Methods

2.1. Sample Collection and Pretreatment

The test soil was a neutral purple soil, one of the main agricultural soils in Southwest China, collected from the National Purple Soil Fertility and Fertilizer Effectiveness Monitoring Base in Beibei District, Chongqing Municipality (106.4217205° E, 29.8138774° N), where the altitude is 223 m. The soil parent material was purple mudstone of the Jurassic Shaximiao Formation. Soil samples were collected from the cultivated layer (0–20 cm), dried naturally in the greenhouse, rid of impurities such as large stones and plant residuals, and then ground and sieved (2 mm) prior to use. The basic physical and chemical properties of the test soil were as follows: pH, 7.20; CaCO3, 3%; soil organic matter (SOM), 19.64 g·kg−1; cation exchange capacity (CEC), 28.903 cmol·kg−1; total nitrogen, 0.972 g·kg−1; alkali-hydrolyzale nitrogen, 95.18 mg·kg−1; total phosphorus, 0.612 g·kg−1; available phosphorus, 0.68 mg·kg−1; total potassium, 27.13 g·kg−1; available potassium, 220.44 mg·kg−1; and total As, 3.5 mg·kg−1.

2.2. Preparation of As-Contaminated Soil

Referring to the “Soil Environmental Quality-Agricultural Soil Pollution Risk Control Standard of China (GB15618-2018)” [34], exogenous As was added to adjust the soil As to different pollution levels. Based on the initial pH of the soil, the As concentration added to the soil was set to three levels—0 mg·kg−1 (CK; less than the risk screening value; <RSV), 75 mg·kg−1 (higher than the risk screening value, but lower than the risk control value; <RSV, <RIV), and 120 mg·kg−1 (greater than the risk control value; >RIV)—representing soil states of uncontaminated, moderate, and severely contaminated As pollution, respectively, denoted as L, M, and H. Exogenous As was added as sodium arsenite (NaAsO2) according to the designed concentration and mixed thoroughly with the soil, maintaining 20% water content. The mix was aged and cultivated in PVC pots for 90 days to reach equilibrium and allow the bioavailability of soil As to stabilize [35]. Then, the soil was air-dried and mixed through a 2 mm sieve again. The final concentrations of As in the tested soil samples were 3.5, 78.5, and 123.5 mg·kg−1, respectively.

2.3. Simulation of Acidification of Purple Soil

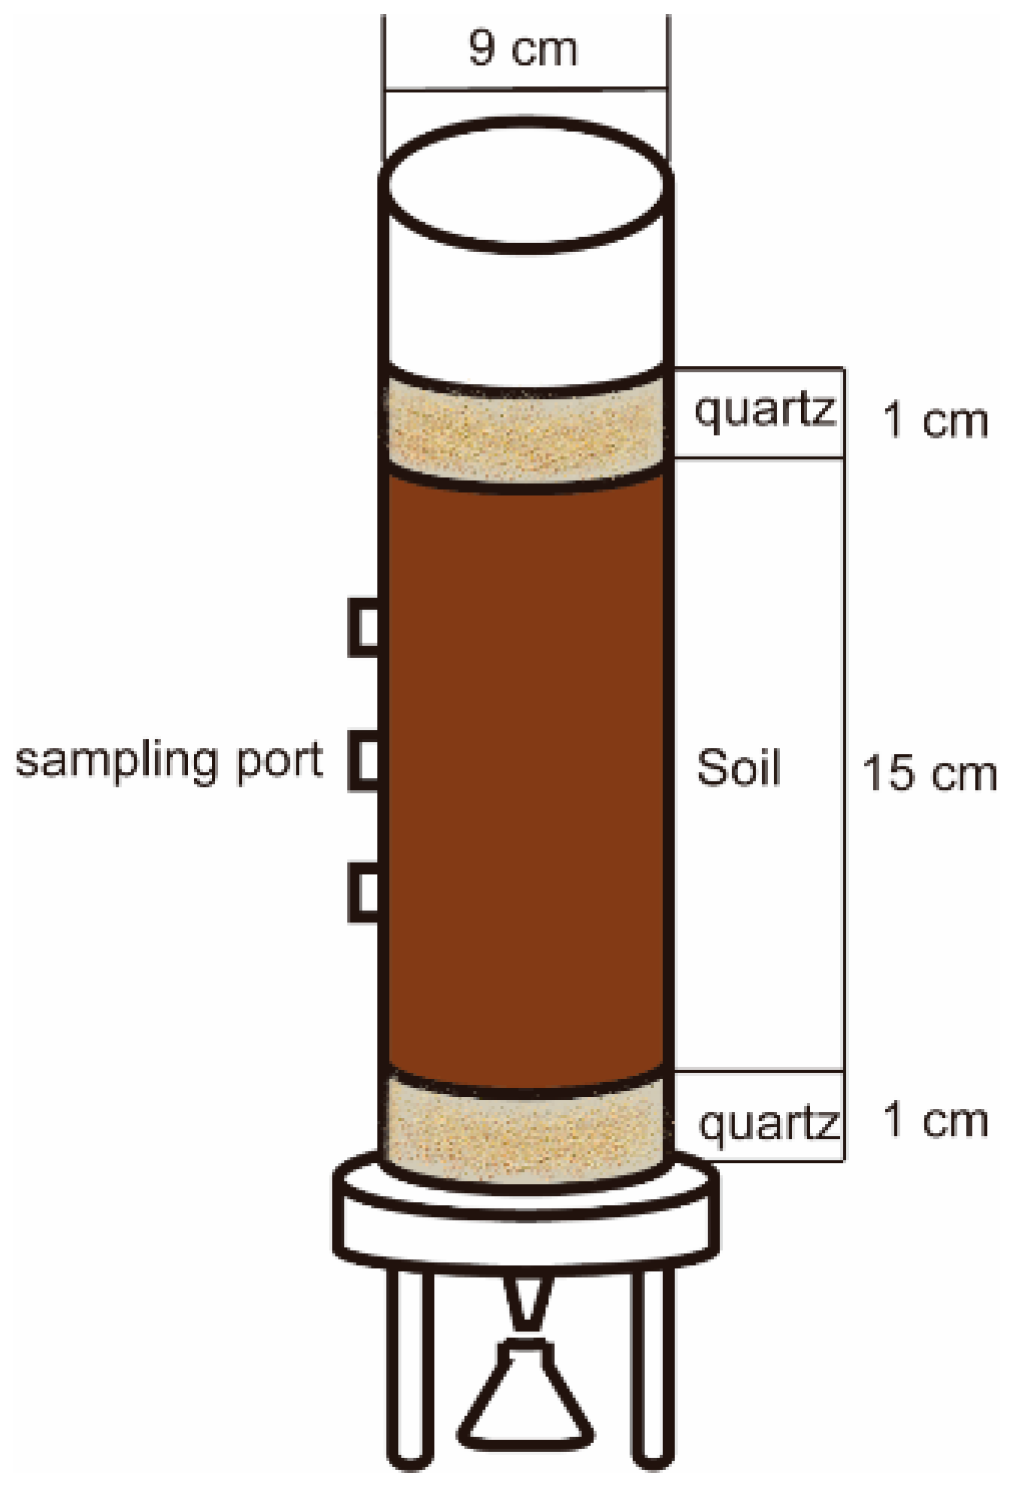
2.3.1. Simulation Test Method

The soil acidification process was simulated by the soil column-leaching method. The column was made of acrylic, with a length of 30 cm, an inner diameter of 9 cm, a collection port, and a valve at the bottom of the column, containing about 500 g of soil overall. The upper and lower ends of the soil layer were blocked by quartz sand and nylon mesh, and the internal structure of the column was, from bottom to top, as follows: movable water board, nylon mesh, quartz sand layer, nylon mesh, soil layer, nylon mesh, quartz sand layer, and movable water board. The thickness of the quartz sand layer was about 1 cm, the quartz sand had to be cleaned and processed by soaking in 0.1 mol·L−1 HCl and high-temperature steam, and the particle size of the quartz sand was 6–10 mesh. The gap size of the nylon mesh was 300 mesh to prevent the soil particles from being washed into the lower quartz sand layer. The diameter of the soil-sampling ports was 3 cm, and these were uniformly distributed along the lysimetric column (Figure 1).
The soil samples prepared as described above were uniformly poured into the columns with a soil bulk weight of 1.1 g·cm−3 and a final soil layer thickness of 15 cm. The soil was then subjected to acidification by drenching with 0.1 mol·L−1 HCl acid solution. Pre-experimentation was carried out to determine the amount of acid required to achieve pH values of approximately 6, 5.5, 5, 4.5, 4, and 3.5. Drenching with pure water was used as a blank control. Before starting the acid drenching, the soil was wetted with pure water until it was essentially saturated without leachate flow, and it was then equilibrated for 24 h. Then, according to the total amount of acid required for the set pH, the drenching rate was controlled at 10 mL·h−1 until the total set amount was drenched, then soil samples were taken from the soil columns, and leachate was collected after equilibrating for 24 h. The remaining columns continued to be acidified in accordance with the set endpoint acidity to obtain seven soil groups and corresponding leachates with different degrees of acidification. The soil samples were air-dried and mixed to pass through 2 mm, 0.25 mm, and 0.15 mm sieves for the analyses of their physicochemical properties, as well as As morphology and bioavailability.

2.3.2. Soil and Leachate Analyses and Measurements

Soil physical and chemical properties were determined according to the Chinese national standards. For instance, soil pH (NY/T 1377–2007) [36], exchangeable Na+, K+ (LY/T 1246–1999) [37], exchangeable Ca2+, Mg2+ (LY/T 1245–1999) [38], exchangeable H+, Al3+(NY/T 1246–1999) [39], CEC (LY/T 1243–1999) [40], SOM content (LY/T 1237–1999) [41], CaCO3 content (LYT 1250-1999) [42], and soil crystalline mineral compositions were characterized by X-ray diffraction (SY/T 5163-2018) [43]. The occurrence state of amorphous iron oxides in soil is determined by the ammonium oxalate extraction method [44].
Total soil As was measured referring to the national standards (GB/T 22105.2-2008) [45], while As fractionation was conducted using a five-step sequential extraction method proposed by Wenzel [46], which divided soil As into non-specifically bound (F1), specifically bound (F2), amorphous hydrous oxide-bound (F3), crystalline hydrous oxide-bound (F4) and residual (F5) fractions. The available As was extracted with 0.5 mol·L−1 NaHCO3 [47]. The determination of the As content in both extracts and digests was performed by hydride generation–atomic fluorescence spectrometry.
Regarding the determination of soil leachate, pH and conductivity were determined using an acidimeter and conductivity meter, while the composition and content of ions such as K, Na, Ca, Mg, and As were determined using inductively coupled plasma emission spectrometry (ICP-OES) after digestion with nitric acid and hydrogen peroxide.

2.4. Synergistic Responses of Crops to Acidification Combined with Arsenic Pollution

A pot experiment was conducted to explore the synergistic responses of crops to soil acidification combined with As pollution using pakchoi (Brassica campestris L.) as an indicator crop. Based on the results of the aforementioned simulated acidification test, the soil was adjusted to four levels of acidification with 0.1 mol·L−1 HCl, specifically neutral (pH = 6.92 ± 0.14, no acid added), slightly acidic (pH = 6.07 ± 0.31), acidic (pH = 5.40 ± 0.16), and strongly acidic (pH = 4.61 ± 0.07) levels, and quantities of 0, 75, and 120 mg·kg−1 of exogenous As were added to the soil at each level of acidity. The samples were then aged and incubated for 90 days. Each treatment was triplicated. There were 12 treatments and a total of 36 pots.
The experiment was conducted from April to July 2023 in a greenhouse at Southwest University. The test pakchoi variety was Maysnow, using 16 cm caliber and 12 cm high plastic pots as the potting containers, and each pot was filled with 1.5 kg of air-dried soil. The soil in each pot was supplemented with a base fertilizer (N, 150 mg·kg−1; P205, 120 mg·kg−1; and K2O, 180 mg·kg−1) and mixed thoroughly for 2 weeks. The seeds were sowed in a substrate made of grass charcoal, vermiculite, and perlite at a ratio of 1:1:1 by volume for 7 days until uniform germination, and then 3 seedlings were transplanted into each pot. After 4 weeks of crop growth, the Hoagland–Amon nutrient solution was added once a week as a supplementary fertilizer, and deionized water was added by the weighing method to maintain the soil water content at about 40% during the growth period.
Crop plants were harvested after about 70 days of growth and rinsed with pure water 3 times to remove the impurities, and then surface water was removed with absorbent paper. The fresh biomass of the plants, divided into aboveground and roots, was recorded by weighting. The fresh samples were green-killed in an oven at 105 °C for 0.5 h, then dried at 70 °C for 10 h to a constant weight, pulverized, and prepared for use. The As in the pakchoi samples was digested with HNO3: HClO4 (4:1, v/v), and the As content in the digest solution was determined by hydride generation–atomic fluorescence spectrometry. The translocation factor (TF) and biological concentration factor (BCF) were calculated according to the following formula [48,49]:
TF = content of heavy metals in the aboveground parts of the plants/content of this element in the roots
BCF = content of heavy metals in the aboveground parts of the plants/content of this element in the soil

2.5. Statistical Analysis

The data were expressed as the mean of three replicates accompanied by the standard error. Significantly divergent outcomes were ascertained through a univariate analysis of variance (ANOVA), and the mean values were juxtaposed via Duncan’s multiple-range tests at a significance level of p < 0.05. Pearson’s correlation analysis was effectuated through SPSS 26.0 at significance levels of p < 0.05 and p < 0.01. All graphical representations were crafted employing Origin 2023 and R 4.3.1 software.

3. Results and Discussion

3.1. Changes in Basic Soil Properties During Acidification

3.1.1. Changes in the Acid-Buffering Capacity

The acid-buffering curves of neutral purple soils with different As pollution levels are shown in Figure 2. It can be seen that the soil pH values decreased with the H+ addition, divided into the initial, fast-acidifying stage and then a slower stage, with the H+ addition of 40 mmol·kg−1 as the turning point, and the slope of the acid buffer curve below the turning point was significantly higher than after the turning point. This indicated that there was a critical point in the acidification process of the test soil, which corresponded to pH values between 4.7 and 4.8 depending on the soil’s As pollution extent. The linear fit parameters obtained by segmental fitting of the two curves are shown in Table 1. The determination coefficient (R2) of all the curves was above 90%, which indicated that the curves were well fitted. The slope of the curve k reflected the decrease in soil pH caused by unit acid addition, and its absolute reciprocal was the acid buffer capacity.
During the initial stage of acidification (stage A), the test soil was highly sensitive to acid, and its soil acid-buffering capacity was low, which caused rapid soil acidification (Figure 2). This observation is consistent with the fact that soil acidification in purple soil regions mainly occurs in neutral purple soils [13]. When the soil was acidified to a pH below the critical point (stage B), its ability to resist acidification increased significantly. In fact, the soil acid-buffering capacity increased by a factor of 3.6 compared to stage A. This means that this type of soil is better equipped to resist further acidification. The acidification process was governed by soil acid-buffering systems at different stages. In this test, the neutral purple soil had an initial pH of 7.2, but its calcium carbonate content was as low as 0.3%. As a result, calcium carbonate rapidly disappeared under strong acid drenching in the initial stage, and the silicate buffer system played a major role. The test soil contained a large number of primary minerals such as mica, micro plagioclase feldspar, and chlorite, and the weathering of these minerals during the acidification process released base ions, generally allowing the soil pH to be maintained at around 5.0 [50]. When the soil was further acidified to a pH below the critical point, the main buffer system changed to one featuring exchangeable cations. The pH level of the soil at this point generally remained between 4.2 and 5.0 [51]. At this stage, significant losses in the soil’s exchangeable cations occurred, in accordance with the considerable amount of base ions found in the leachate. At a pH below 4, the iron and aluminum buffer system in the soil was activated. By overlapping the double electric layer, the positive charge on the surface of the iron and aluminum oxides balanced the negative charge on the surface of the silica–aluminate minerals. This balance inhibited the production of exchange acids, which helped prevent further soil acidification. As a result, it became harder for the pH level to be further reduced [52].
It was also found that As contamination significantly increased the soil acid-buffering capacity (Table 1). In comparison to the control group without any added exogenous As (group L), the soil acid-buffering capacity in stages A and B was 17.18 mmol·kg−1 and 62.50 mmol·kg−1, respectively. The acid-buffering capacity of the soil in the moderately (M) and heavily (H) As-contaminated groups was increased by 56% and 43.4% in stage A and −1.8% and 24% in stage B. This increase in buffering capacity might have possibly been due to the acid-buffering properties of the arsenate system itself and its effect on the surface properties of soil colloids [53].

3.1.2. Changes in the Composition of Exchangeable Acids

Figure 3 shows the changes in exchangeable acid, exchangeable H+, exchangeable Al3+ content, salt base saturation, and CEC at different levels of As contamination (L, H, and M) during soil acidification. Exchangeable Al3+ was not found in neutral purple soil. Its presence was observed only when the pH of the soil was lowered to 5.6. When exogenous H+ was added, the contents of the soil exchange acid, exchange H+, and exchange Al3+ were affected. They decreased with the decrease in pH, and their contents varied between 0.175 and 4.65 cmol·kg−1, 0.175 and 1.55 cmol·kg−1, and 0 and 3.285 cmol·kg−1, respectively. The proportion of exchange Al3+ in exchange acid increased with the increase in acidification. Similarly, the proportion of exchanged H+ increased with the increase in acidification, but the exchangeable H+ ratio decreased.
As the extent of acidification in soil enhanced, the saturation of the soil bases gradually decreased. This phenomenon was especially the case at a soil pH exceeding the critical point. At this point, the rate of base ions leaching significantly accelerated [54]. When the soil samples were acidified to a pH below 4, the base saturation decreased from 100% to approximately 83.5%. In this study, it was found that soil acidification did not significantly affect soil CEC. The CEC range of different treatments remained stable at 27.45–28.71 cmol·kg−1.
The changes in soil exchange acid composition during the acidification process were found to be similar regardless of the As pollution extent (Figure 3). However, As pollution increased the soil exchange acid contents. At the final point of acidification, the exchange acid content was 4.0 cmol·kg−1 in the control (L) group, while the moderately (M) and heavily (H) As-contaminated soils increased by 6.3% and 16.3%, respectively, compared to the control. The base saturation decreased from 86.5% to 85% and 83.5%, respectively. This suggested that soil As contamination affected soil acidification performance, and there was an interaction between them. This interaction might have been due to the fact that arsenate was more likely to occupy soil colloidal adsorption sites, promoting a decrease in soil base saturation, leading to an increase in potential acidity [55].

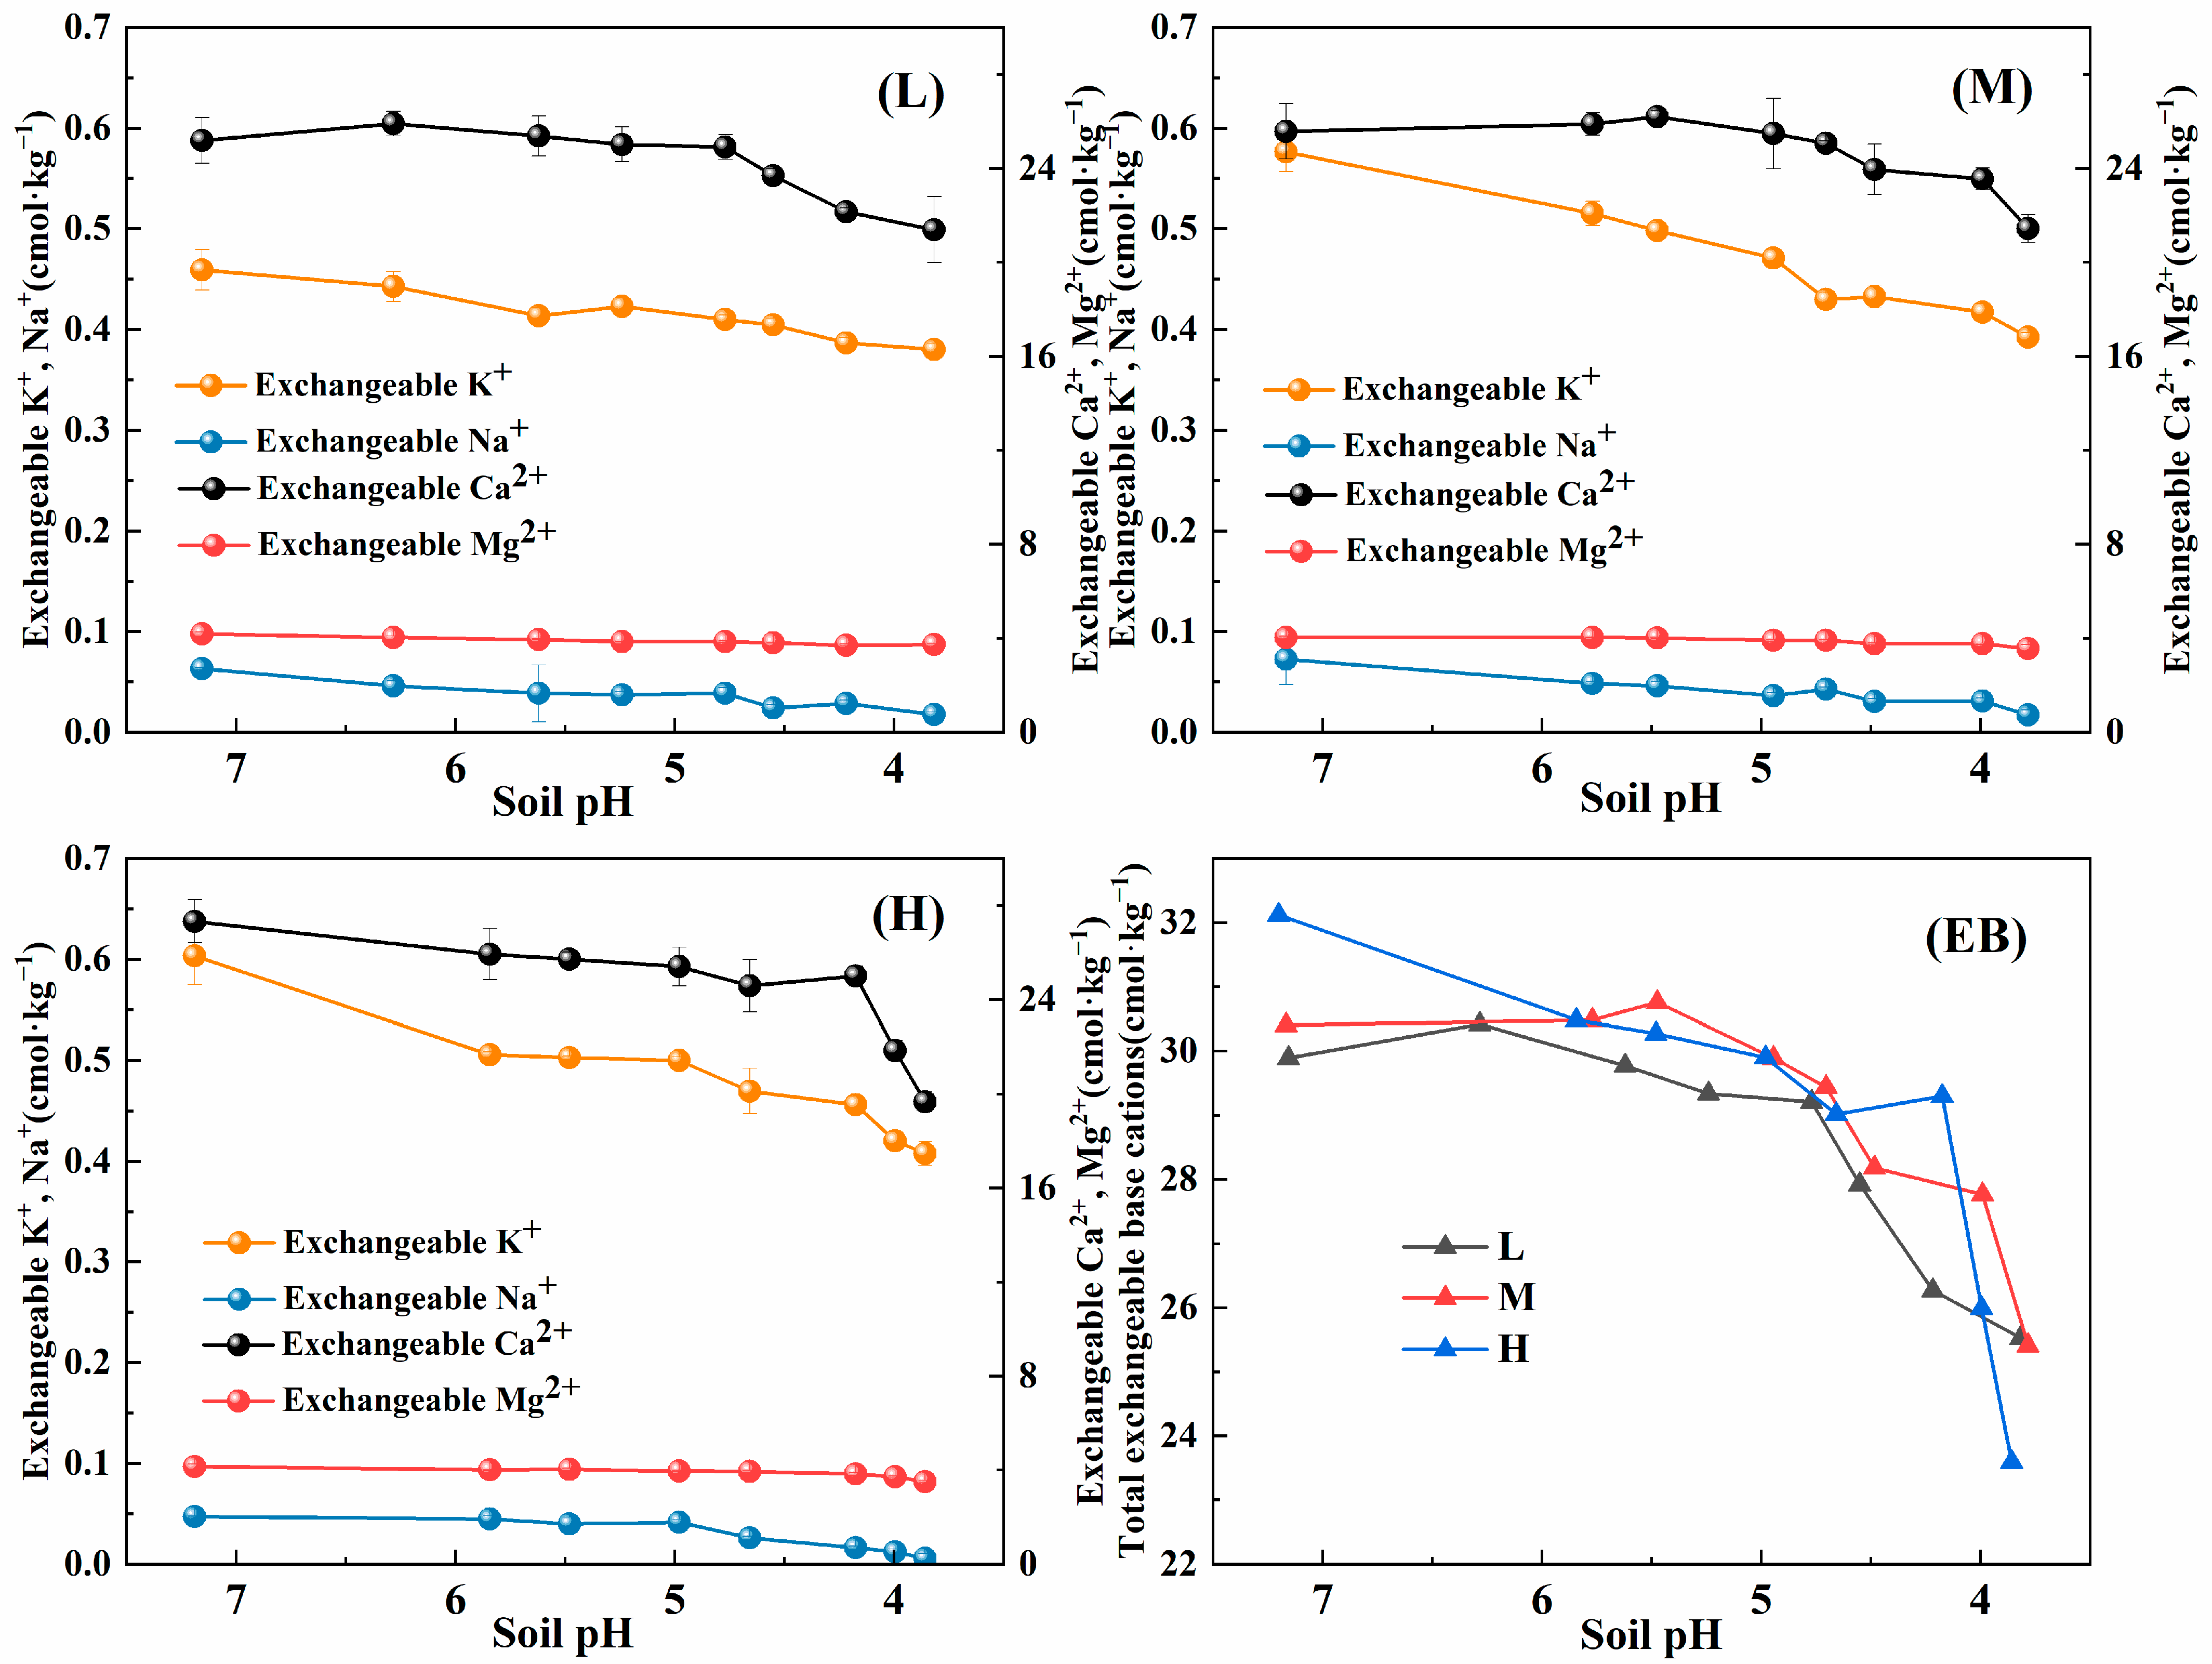
3.1.3. Changes in the Ionic Composition of Exchangeable Base Ions

Figure 4 shows the variation in exchangeable and total base ions (EBs) in soils with different levels of As contamination (L, H, and M). During acidification, the exchangeable base ions decreased gradually, and the rate of decline increased significantly when the soil was below the critical pH point (Figure 4(EB)). It was observed that the soils highly contaminated with As and subjected to acidification until the final stage (pH < 4) had lower total soil base ions than those of the low and moderately contaminated soils. This finding suggested that highly As-contaminated soils were more likely to experience the leaching of base ions during acidification.
Figure 5 shows the loss of exchangeable base ions and total base ions from the soils of groups L, M, and H. The base ion contents were greatly increased when the soil was acidified to a pH below the critical point.
It was also observed that groups M and H released 24 mg·kg−1 of Ca and 1.4 mg·kg−1 of Mg and 18.7 mg·kg−1 of Ca and 1.2 mg·kg−1 of Mg, respectively, at the initial stage, compared to the control group (L), which released 12.4 mg·kg−1 of Ca and 0.73 mg·kg−1 of Mg. With the addition of H+, the leaching of Ca and Mg from both moderately (M) and heavily (H) contaminated groups increased significantly, while the lower concentrations of Na and K resulted in less noticeable changes. This confirmed that acidified As-contaminated soil accelerated the leaching of base ions, especially Ca and Mg.

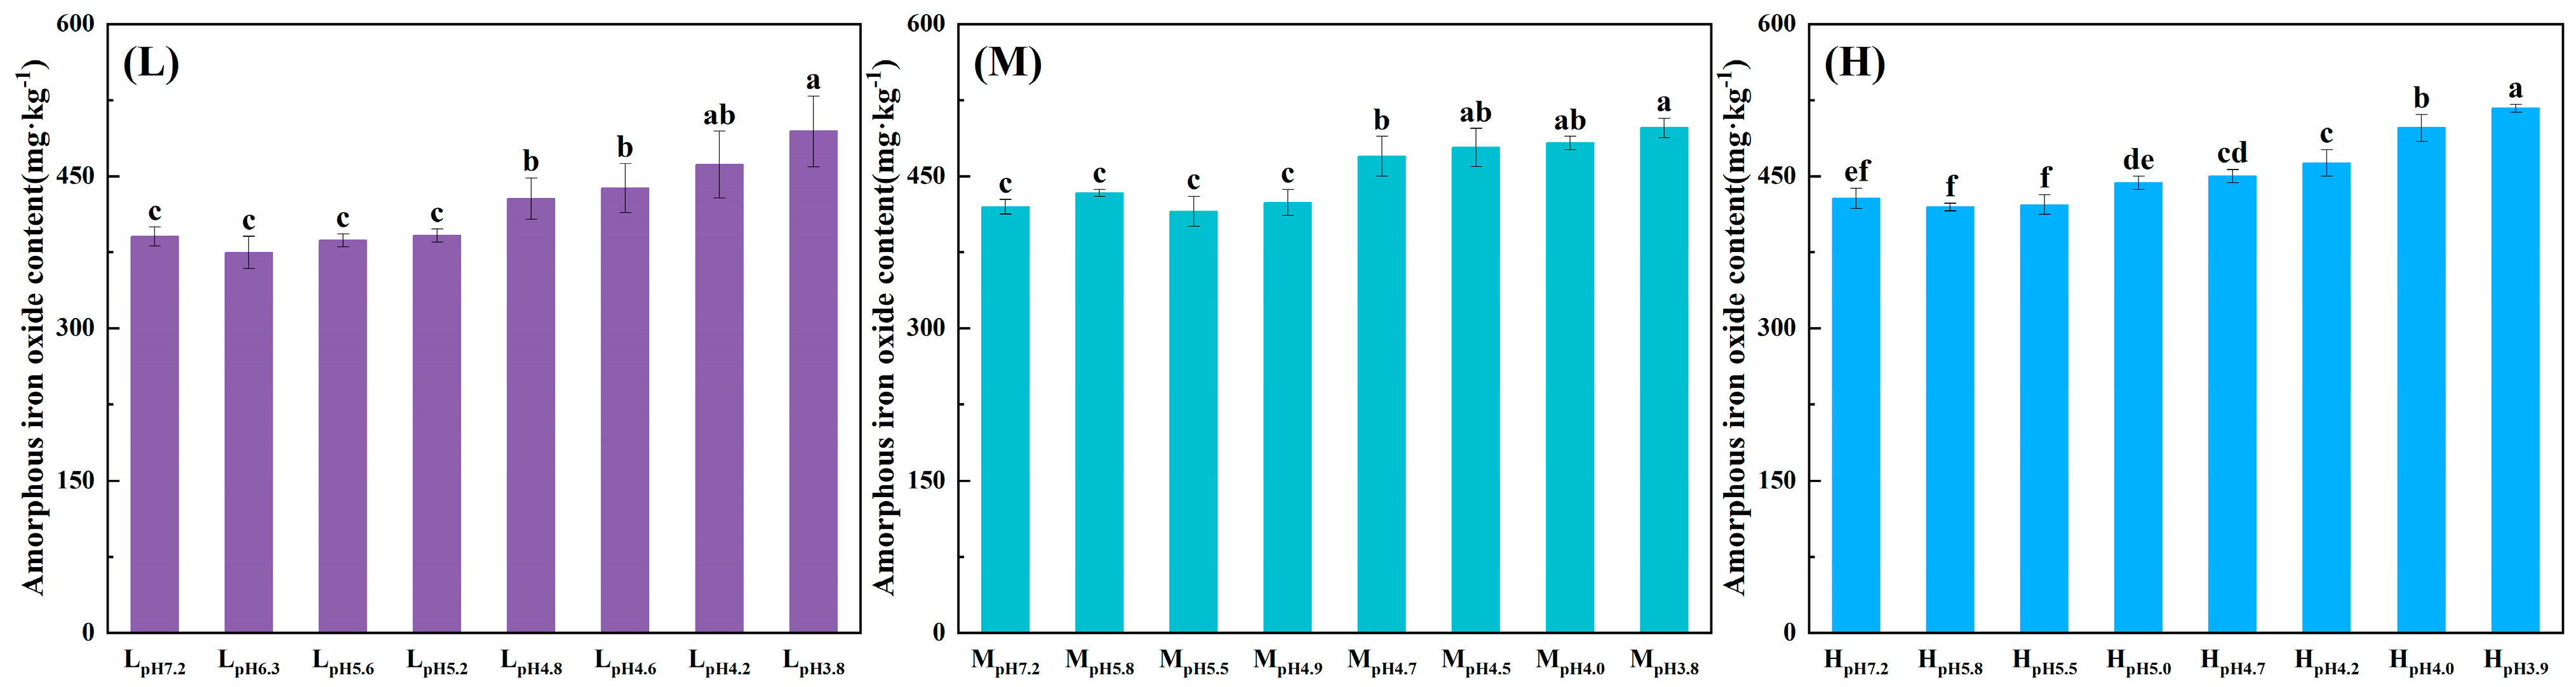
3.1.4. Changes in Soil Mineral Composition

Some representative soil samples from various treatments at different acidification stages were selected for the examination of their mineralogical composition by X-ray diffraction analysis (XRD); the results are presented in Table 2. The mineral composition of the tested soil mainly consists of two major groups of minerals: silicate minerals and oxide minerals. Primary minerals, including quartz (Qtz), plagioclase feldspar (PI), microcline feldspar (MC), chlorite (C), and hematite (Hem), made up more than 60% of the total amount. The secondary minerals, including illite (It), interlayer minerals of ilmenite/montmorillonite (I/S), and interlayer minerals of chlorite/montmorillonite (C/S), accounted for less than 40% of the total. Primary minerals accounted for a larger proportion of the total, and there were also transition minerals with a proportion of 20–30%. This finding indicated that the development of the tested soil was at a superficial level. By comparing the mineral composition of the soils at LpH7.2 and HpH3.9, it was found that the addition of exogenous As did not significantly alter the mineral composition of the test soil.
A bivariate Pearson test was conducted to analyze the correlation between soil pH and silicate minerals at different acidification levels (Table 3). The results showed that soil pH had a significant positive correlation with plagioclase and chlorite, with r-values of 0.856 and 0.866, respectively (p < 0.05). Additionally, soil pH exhibited a highly significant negative correlation with green/montmorillonite interlayer minerals (r = −0.937, p < 0.01). Further analysis revealed that the chlorite content was also significantly negatively correlated with green/montane interlayer minerals (r = −0.892, p < 0.05). These findings indicate that the content of primary minerals, including plagioclase and chlorite, decreased continuously as the soil pH was reduced during acidification, while the opposite was true for green/montmorillonite interlayer minerals. This meant that soil acidification accelerated the weathering of primary minerals and increased the content of secondary minerals, mainly chlorite transformed into green/montmorillonite interlayer minerals. The results are aligned with those reported by [56].
Figure 6 illustrates the changes in the content of amorphous iron oxide (Feo) in soils with varying levels of As during the soil acidification processes. The results show that the Feo contents of all three groups of soils significantly increased (p < 0.05) when the soils were acidified to a pH below the critical point (pH = 4.7–4.8). Compared to the unacidified soils LpH7.2, MpH7.2, and HpH7.2, the Feo contents increased from 390 mg·kg−1 to 419 mg·kg−1 and 428 mg·kg−1. The SOM content in soils with different As contents and varying acidification extents remained in the range of 17.4 to 19.6 g·kg−1, which was not significantly affected by acidification. The changes in soil mineral composition were not only a consequence of acidification but also influenced the acidification process, bound to have an important impact on the transformation and availability of metals such as As.

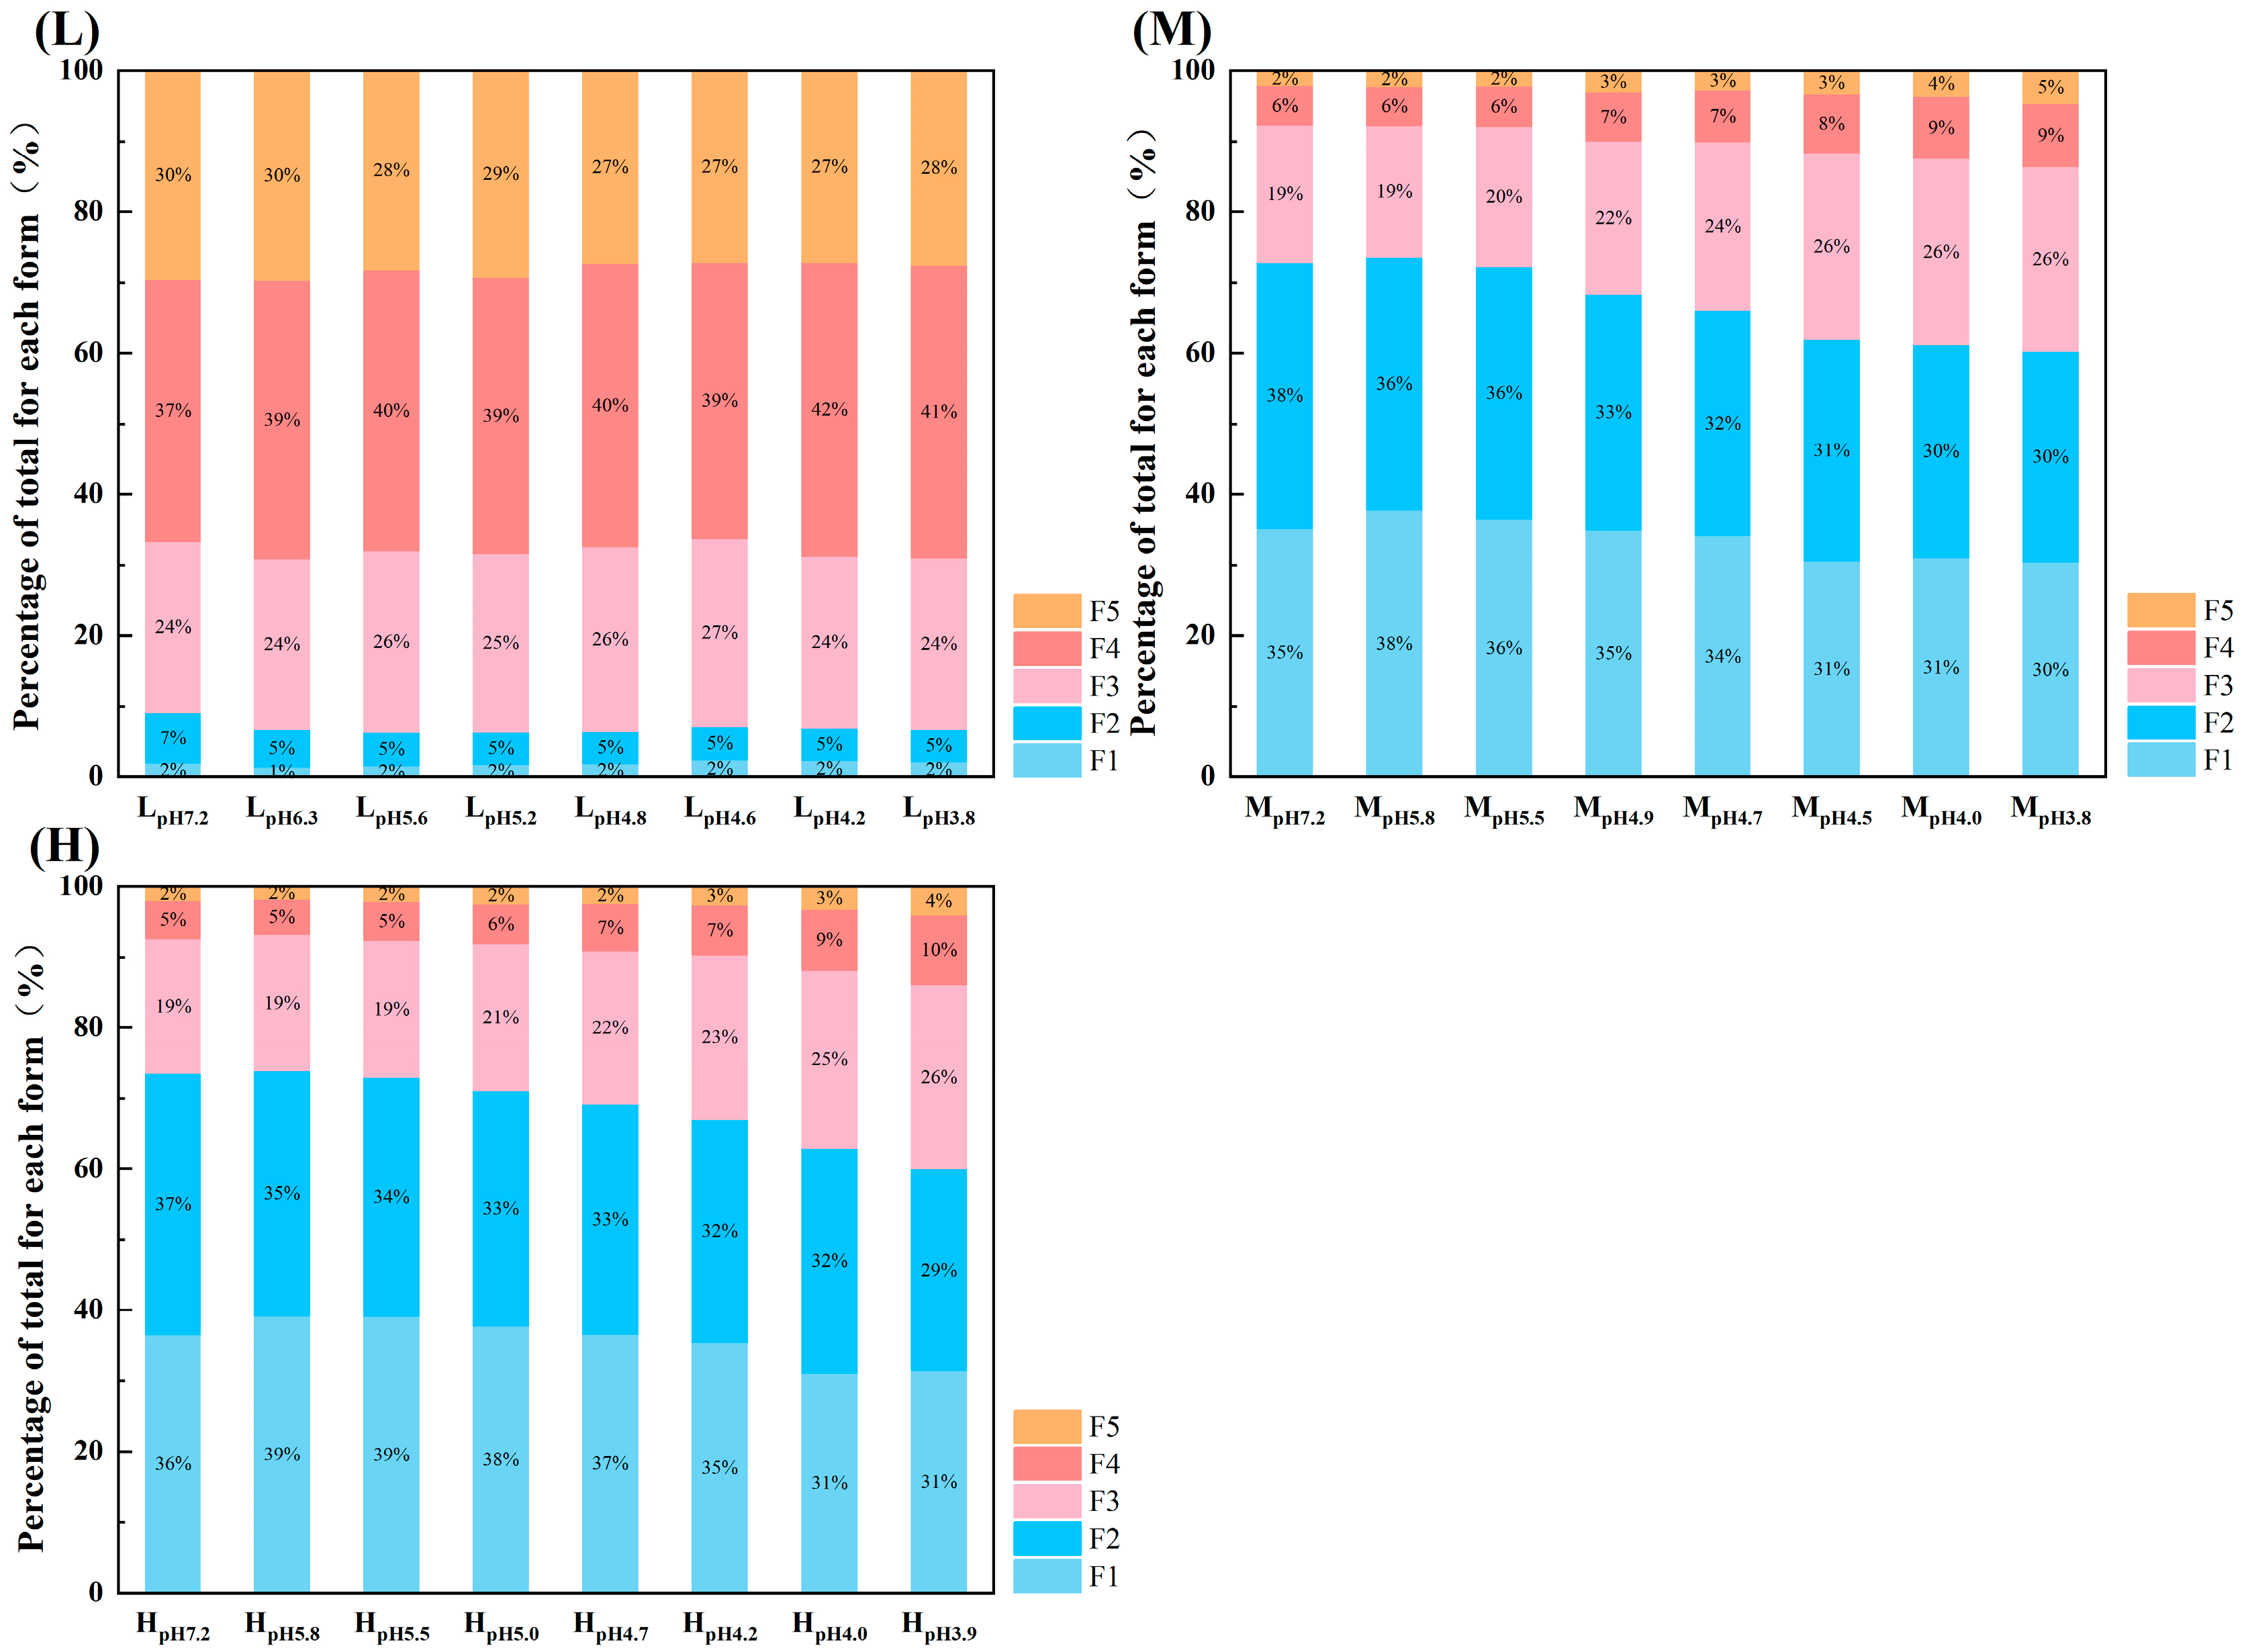
3.2. Changes in Arsenic Forms During Soil Acidification

3.2.1. Morphological Fractionation of Arsenic

The morphological changes in soil As during soil acidification processes are shown in Figure 7. It can be seen that, in the unacidified bulk soil, less labile forms of Fe-Al oxide-bound As (F3, F4) and residual As (F5) dominated, which accounted for 91% of the total As, while the available forms of As, including non-specifically adsorbed (F1) and specifically adsorbed (F2) fractions, only accounted for 2% and 7% of the total, respectively, indicating that As availability in the bulk soil was low.
After the addition of exogenous As, the contents of each form were significantly altered in the soil. In the unacidified soils LpH7.2, MpH7.2, and HpH7.2, the contents of the F1 fraction increased from 2% to 35% and 36%, and the contents of the F2 fraction increased from 7% to 38% and 37%, while the contents of the F3 fraction decreased from 24% to 19%, the F4 fraction decreased from 37% to 6% and 5%, and the F5 fraction decreased from 30% to 2%. That is, F1+F2 were the dominant forms in moderately (M) and heavily (H) contaminated soils with added exogenous As, together accounting for 73% of the total As, suggesting that exogenous As could maintain high availability in the soil.
The morphological changes in As in the control soil (group L) during acidification were small, but the morphological changes in groups M and H were more pronounced and followed a consistent pattern: the percentage of F1 and F2 decreased continuously with decreasing pH values, while the contents of F3, F4, and F5 increased. For example, after acidification from MpH7.2 to MpH3.8, F1 and F2 decreased from 36–38% to approximately 30%, while F3, F4, and F5 increased from 19%, 6%, and 2% to 26%, 9%, and 5%.
This indicated that soil acidification promoted the transformation of As from highly labile forms to less-available forms, which was opposite to the changes in most cationic heavy metals such as Cd and Pb [57,58], and similar findings have been found in related studies [59,60]. In our study, acidification appeared to promote the decomposition of primary minerals and the activation of Fe-Al oxides, thus increasing the soil’s ability to sequester As, which aligned with the findings of mineral composition analyses described previously.

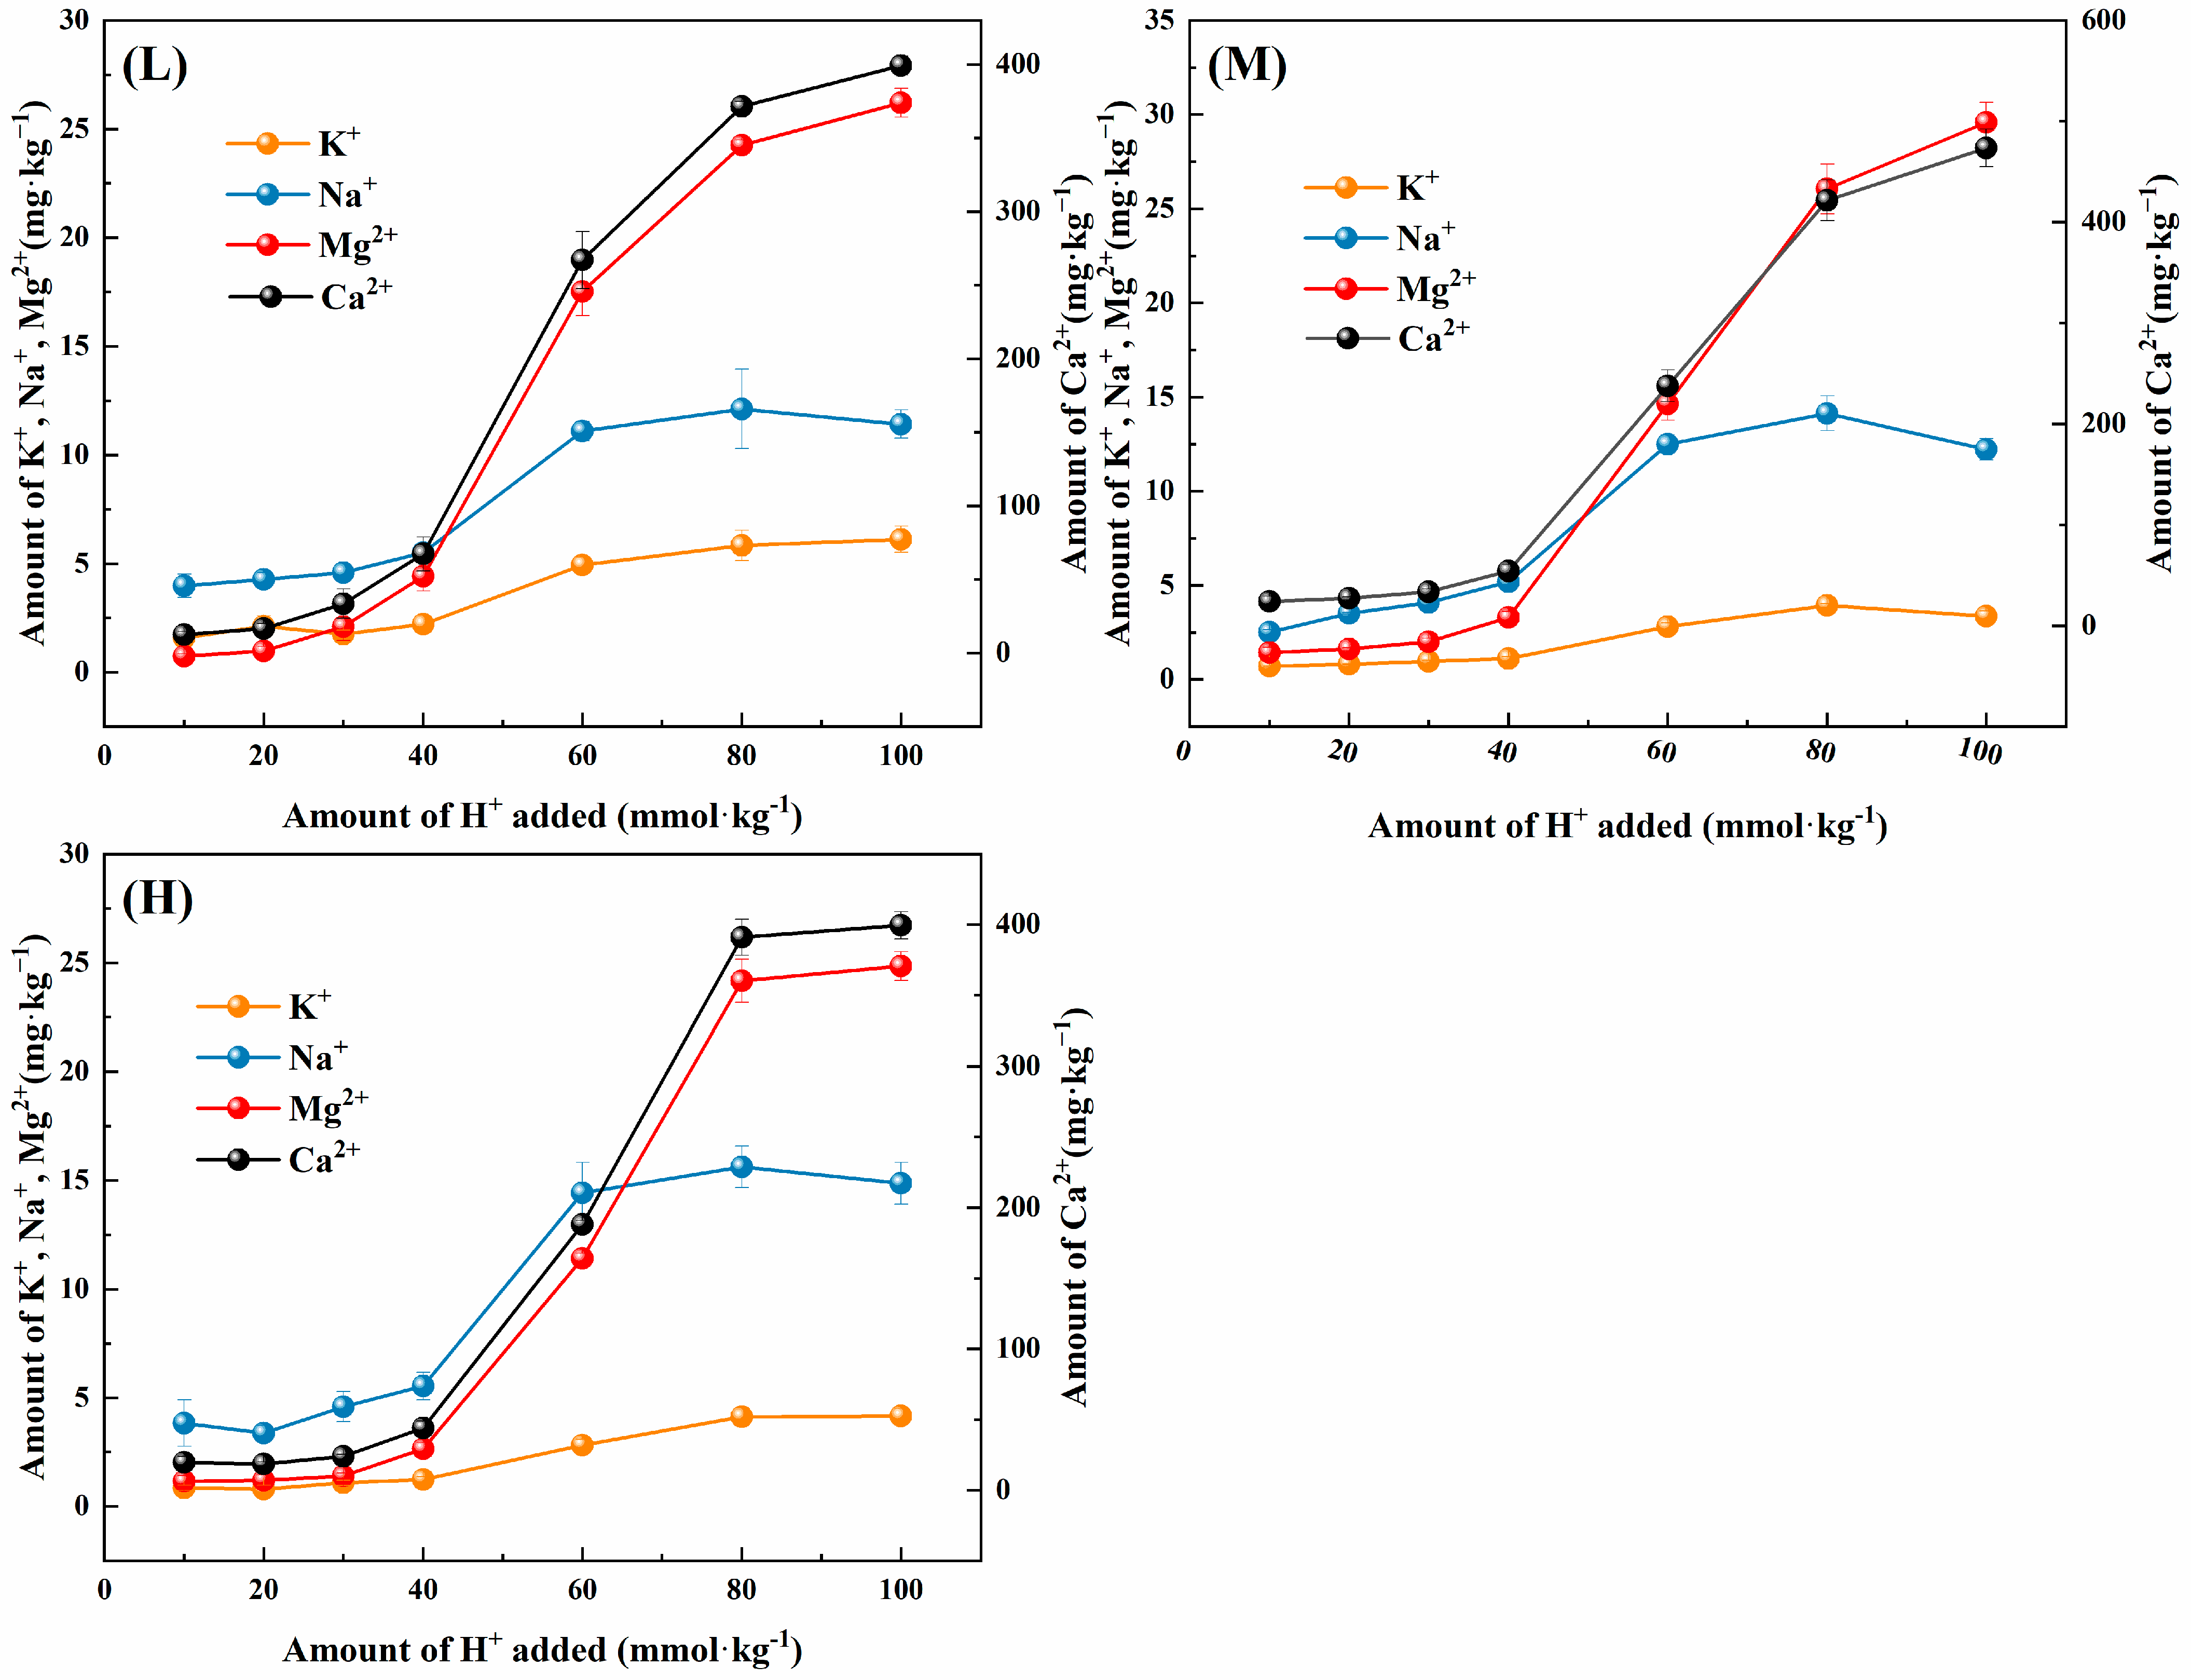
3.2.2. Changes in Migration Leaching and Availability of Arsenic

Figure 8 shows the variations in the amounts of total and available As in soils with different levels of As contamination (L, M, and H) and the corresponding As concentration in the leachates (L1, M1, and H1) as the soil acidification level changes. During acidification, the total As content in the bulk and moderately contaminated soil (L and M) remained stable at approximately 3.5 and 70 mg·kg−1, respectively. However, the total As content in heavily contaminated soil (H) decreased significantly as the acidification progressed. The total As content in the latter presented a 25.1% reduction when the soil was acidified to a pH of 4 or lower.
A comparison of the As concentrations in leachates (L1, M1, and H1) revealed that As was leached from soils with different levels of contamination. Moreover, As leaching during acidification significantly increased with increasing levels of As contamination. The M and H groups had As concentrations higher by more than one order of magnitude compared to the leachate of the control group L, with group H having the highest leaching concentration.
The capacity of soil to leach As was significantly affected by acidification, similar to the pattern of leaching for base ions that was discussed earlier (Figure 5). When the soil was acidified to a pH below the critical pH point, the quantity of As that leached increased significantly. The research results indicate that, while acidification promoted the transformation of soil As into less-available forms, it did not mitigate the environmental risk of As leaching. In fact, acidification actually exacerbated As leaching.
Taking the ratios of available As content to the total amount of As as an index for its activation, it was found that, in unacidified moderately and heavily contaminated soils, the activation ratios of As increased significantly from 4.37% to 46.40% and 52.14%, respectively, compared to the control soil (L). This indicated that exogenous As could maintain higher availability levels in soils over very long periods of time. However, during the acidification process of soils with different levels of contamination, the activation ratios of As decreased with decreasing pH values. The activation ratios of As in all three groups of soils decreased from 4.37%, 46.40%, and 52.14% before acidification to 2.63%, 38.2%, and 37.9%, respectively, at the end of the acidification period, when the pH was below 4.
The availability of As in the soil is closely associated with its morphological transformation, and they are both influenced by acidification. To elucidate the relationship between the various morphologies of endogenous and exogenous As in soil and their availability during acidification, correlation heatmaps were generated based on results from L and H treatments (Figure 9a).
In the bulk soil (Figure 9a), the soil-available As had a highly significant positive correlation with the pH (r = 0.94, p < 0.01) but not with the total As content in the soil. It also showed a significant positive correlation with the specifically bound As fraction (F2) (r = 0.81, p < 0.05) and a highly significant negative correlation with the crystalline hydrous oxide-bound fraction (F4) (r = −0.86, p < 0.01). This suggest that the availability of As in bulk soil is primarily regulated by acidity, indicating that acidification suppresses the availability of soil As.
Among the different forms examines, the specifically bound fraction (F2) was the main available form, while the non-specifically bound form (F1) contributed very little due to its extremely low content.
For the contaminated soil with exogenous As added (Figure 9b), a highly significant positive correlation (p < 0.01) was observed between the content of available As and the content of F1 and F2 (r = 0.92 and 0.92, respectively), as well as their sum (r = 0.95). This indicates that F1 and F2 are important components that make up the available As in the soil, which is consistent with the conclusions of previous studies [61].
Furthermore, a highly significant positive correlation (p < 0.01) was found between soil pH and F1 (r = 0.93) and F2 (r = 0.97), and a highly significant negative correlation (p < 0.01) was found with F3 (r = −0.96), F4 (r = −0.98), and F5 (r = −0.86). F1 and F2 were the fractions with high bioavailability, while F3, F4, and F5 had lower bioavailability [46,62], suggesting that soil acidification suppressed the availability of As.
Additionally, significant correlations were identified among various As fractions (Figure 9b): the sum of the contents of F1 and F2 was significantly negatively correlated (p < 0.05) with F3 (r = −0.87) and F5 (r = −0.78) and highly significantly negatively correlated (p < 0.01) with F4 (r = −0.90). This implied that the alteration of soil As availability was actually a process of re-distribution of different As fractions, driven by soil acidification.

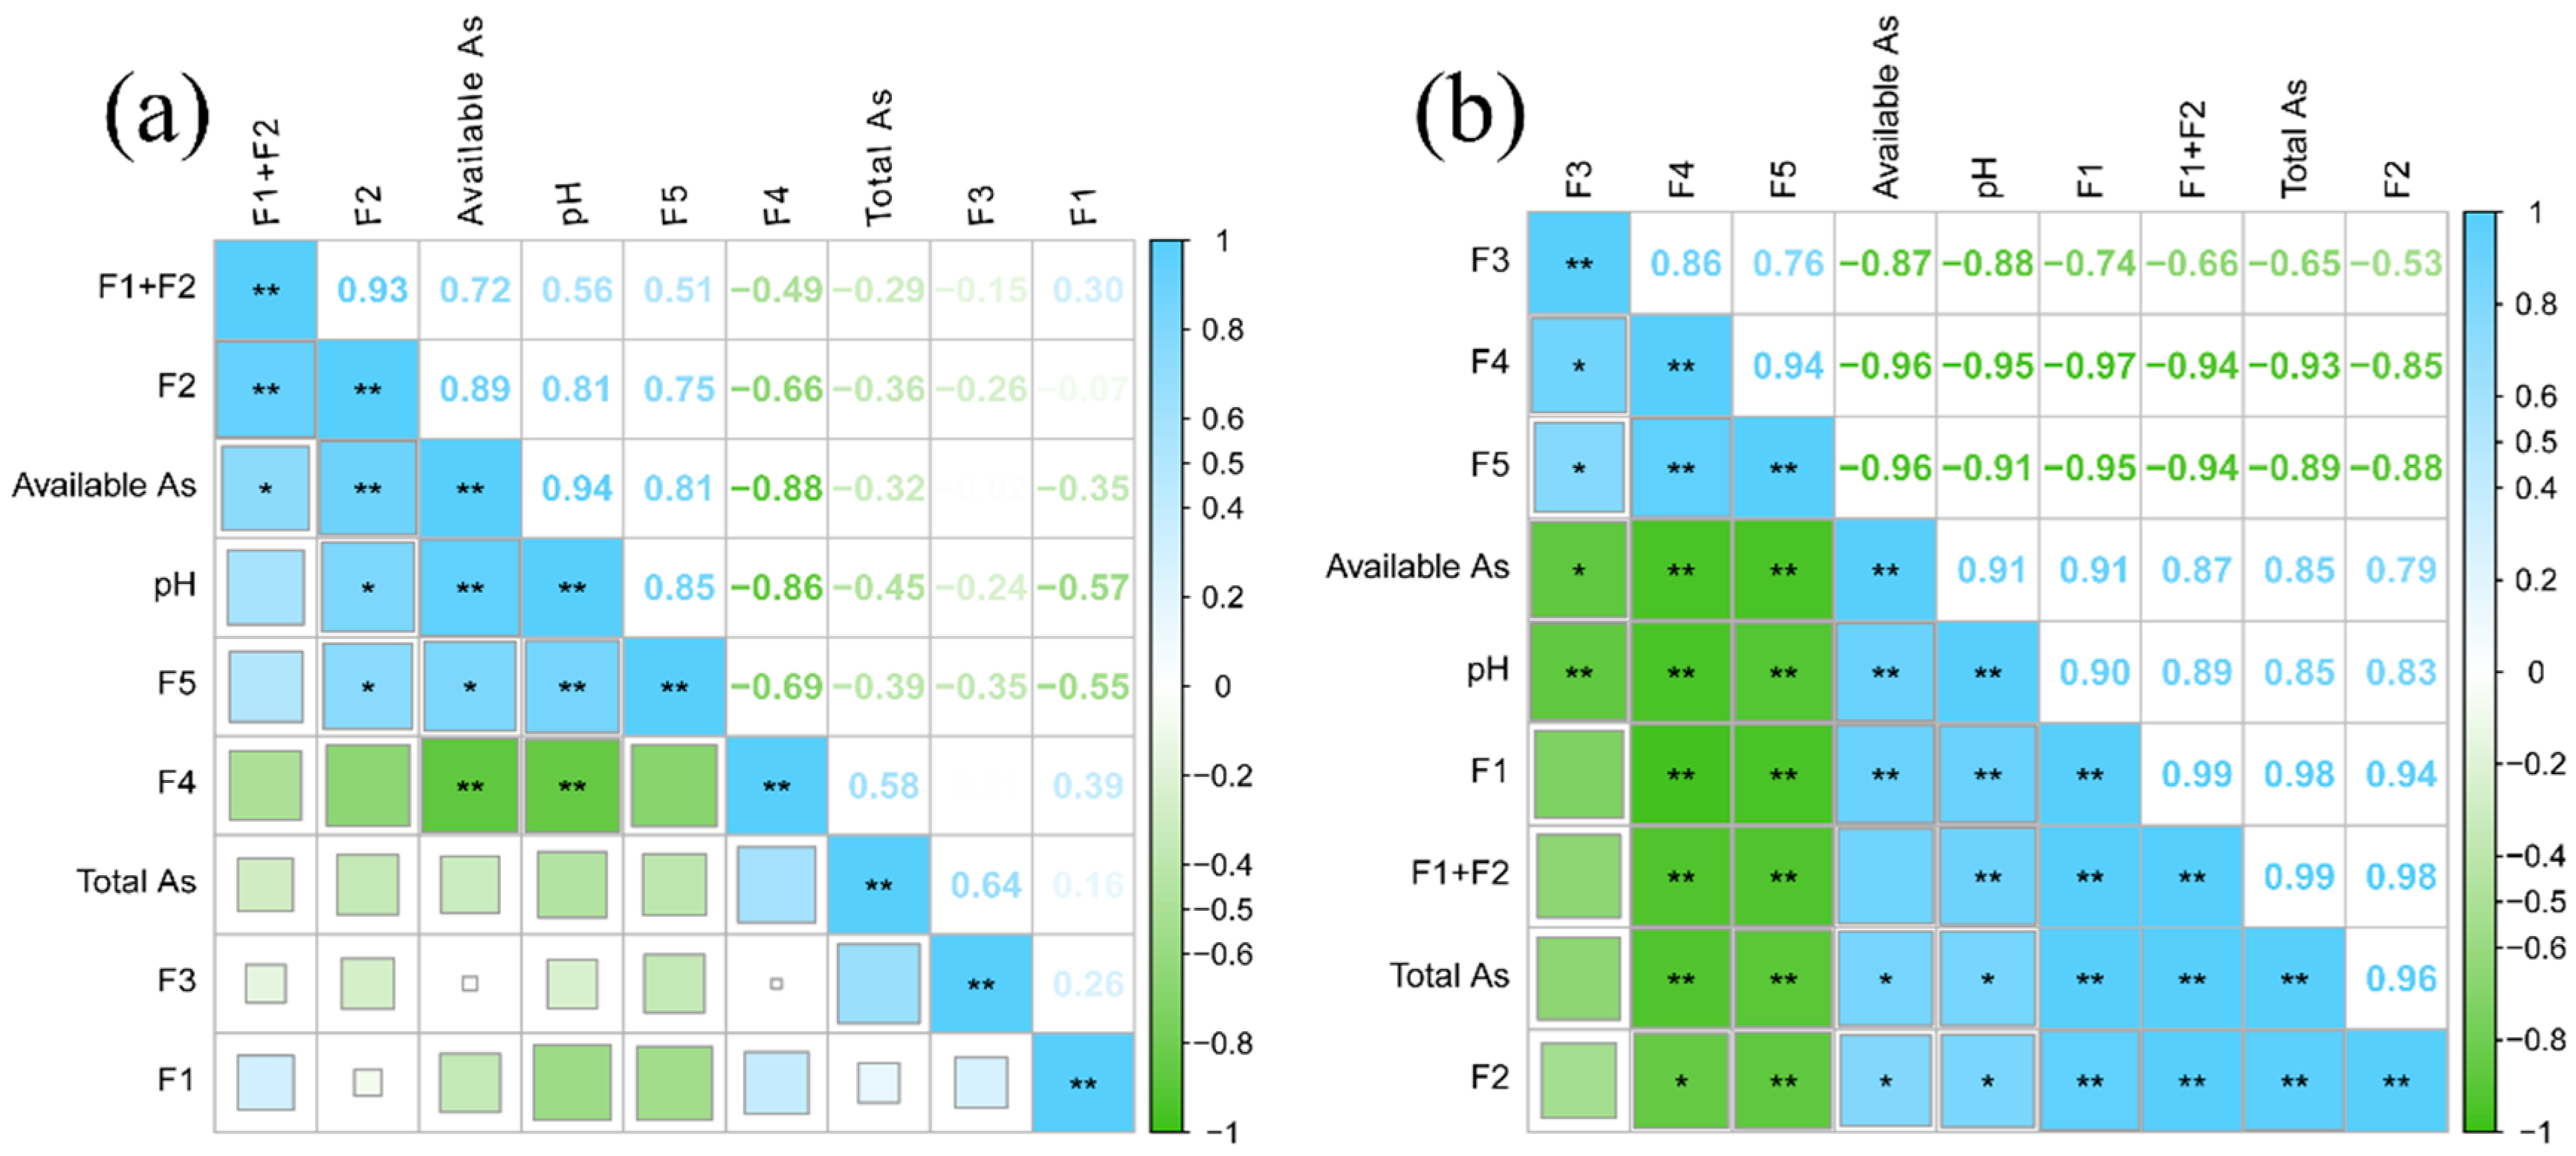
3.3. Arsenic Transformation in Relation to Soil Properties Driven by Acidification

Partial least squares path models (PLS-PMs) have been widely utilized to examine complex multivariate relationships between variables [63]. A PLS-PM model was established to depict the causal relationship between soil properties and As transformation (Figure 10). In the figure, each box represents a latent variable, which is indicated by the combination of related indicators: (1) the degree of leaching of base ions is represented by the combination of exchangeable base ions, and (2) F1 and F2 are combined to represent the migration and transformation potential of As, with the ratio of chlorite to green/interlayer minerals used to indicate the extent of mineral decomposition. The remaining variables are observed variables. The red and blue arrows indicate positive and negative correlations, respectively, and the arrows represent the path coefficients.
As shown in Figure 10, the goodness of fit (GoF) of the model was 0.81, indicating that the model had good predictive capability. The results of the PLS-PM analysis revealed that the soil pH value was positively correlated with soil mineral composition and exchange base ion content (path coefficients 0.9433 and 0.7609) under soil acidification. The soil pH was also negatively correlated with iron oxide (Feo) and As availability (−0.3122 and −0.3785), while SOM and As availability were significantly negatively correlated, with a path coefficient of −0.5401, and Feo was significantly negatively correlated (0.5656).
In Figure 7, it is observed that the path coefficient between mineral composition and base ions is relatively low (0.1504). This may be attributed to the use of the ratio of chlorite to green/montmorillonite minerals as a proxy for the degree of mineral decomposition. The supplementation of base ions is primarily linked to the weathering of montmorillonite and mica phyllosilicate minerals. Specifically, the addition of salt-based ions is associated with the weathering of montmorillonite and mica-like layered silicate minerals [64].
While the soil pH exhibited a negative correlation with As availability (−0.3785), this correlation was not statistically significant. The influence of soil pH on As activity was primarily mediated by base ion leaching and iron oxide activation, as indicated by the path coefficients of 0.7609 and 0.8406, respectively. This relationship can be summarized as follows: pH → base ion leaching → As availability.
The PLS-PM analyses revealed that, under soil acidification, the soil property factors were interrelated. Soil mineral decomposition, base ion leaching, iron (Fe) activation, and decreased As availability occurred simultaneously, and these processes may have collectively influenced crop growth and As accumulation.

3.4. Responses of Pakchoi to Soil Acidification Combined with Arsenic Contamination

The effects of soil acidification and As pollution on the growth and As accumulation of pakchoi were investigated in a pot experiment. The aboveground biomass (fresh weight), plant height, and other growth indices of pakchoi under different combinations of As pollution and acidification are presented in Table 4.
It can be seen that soil acidified to a pH of 6.1 did not affect the growth of pakchoi in the control treatment (Group L) without exogenous As; instead, the biomass and plant height rather increased by 30% and 26%, respectively, compared to the unacidified soil, and the difference reached a statistically significant level (p < 0.05). However, when the soil was further acidified to a pH value lower than 6, the growth of pakchoi was significantly inhibited, and the biomass and plant height both decreased substantially. When the soil pH reached a value of 4.6, the biomass and plant height were only 41% and 47% (p < 0.05) the values of the unacidified soil. Soil As pollution significantly inhibited the growth of pakchoi at the same pH values. In the moderate (group M) or heavy (group H) As pollution group treatments, pakchoi biomass and plant height were substantially reduced compared to the control group. Obversions found that the growth of pakchoi was slow, and the leaves were yellow after transplanting in the two As-contaminated treatments. When the soil pH reached 4.6, the pakchoi could not grow normally after transplanting, and all of them died after 30 days. As described before, Al3+ ions began to appear in the soil when the latter was acidified to a pH of 5.6, and their content and proportion to the total acidity increased with a further increase in acidification extent. Al3+ ions can hinder crop root growth, nutrient uptake, and water absorption. At the same time, the addition of exogenous As led to the inactivation or denaturation of a number of important enzymes and proteins of crops, which interfered with the normal metabolic processes of the plants, inhibiting their growth [65,66], and the superposition of acidification and As pollution exacerbated their toxicities to pakchoi, inhibiting crop growth and even leading to their death.
Table 5 shows the aboveground As content and As enrichment of pakchoi and translocation coefficients for various combination treatments of As pollution and acidification.
As shown in Table 5, the As content of the aboveground edible part of pakchoi ranged from 0.30 to 0.37 mg·kg−1 in the control (group L) treatment, which was lower than the national standard GB-2762-2017 (As < 0.5 mg·kg−1 for fresh vegetables). In contrast, the moderately and heavily contaminated soils (M and H) resulted in As concentrations in the aboveground biomass of pakchoi ranging from 14.98 to 18.81 mg·kg−1 and 24.87 to 27.58 mg·kg−1, respectively, far exceeding the national standard. Meanwhile, the bioconcentration factor (BCF) increased from 0.08–0.12 in the L group to 0.19–0.24 in the M group and 0.2–0.22 in the H group, respectively, whereas the transport factor (TF) decreased by several orders of magnitude. Despite the decrease in the relative proportion of absorbed As being transported to the aboveground biomass, the total aboveground accumulation of As in pakchoi increased dramatically, and the BCF also increased under higher levels of As contamination. This phenomenon is associated with the “bioconcentration effect” induced by the significant reduction in plant biomass due to As toxicity.
When comparing different acidification treatments at the same As level, no significant differences were observed in the aboveground As content and bioconcentration factor (BCF) of pakchoi. Only the control group exhibited a significant decrease in the TF with increasing acidity (p < 0.05). This indicates that, although acidification promoted the transformation of soil As into a less-labile form, resulting in a reduction in both the available As content and its proportion relative to the total As, no corresponding decrease in the aboveground As content of pakchoi was observed, particularly in the cases of moderate (M) and heavy (H) As pollution. This might have been due to the fact that the absolute content of soil-available As remained high in the M and H treatments, despite the relative decrease in its availability caused by acidification. Furthermore, the combined effects of acidification and As pollution aggravated the harm caused to crop growth. The “concentration effect” was more pronounced, leading to a significant accumulation of As in the aboveground edible parts of the test crop.
To further investigate the effects of soil acidification, As pollution, and their interaction on pakchoi growth and As accumulation, a two-way analysis of variance (ANOVA) was conducted (Table 6).
The results demonstrated that both soil acidification and As pollution highly significantly affected the biomass of pakchoi, the aboveground As content, and the TF, and As also highly significantly affected the BCF (p < 0.01). Furthermore, a highly significant interaction between acidification and As pollution was observed, influencing pakchoi growth, As uptake, and TF, which ultimately had a highly significant impact on the As content in the aboveground edible parts of pakchoi (p < 0.01).
In summary, the mechanisms underlying pakchoi’s response to soil acidification and As pollution include growth inhibition induced by H+ and the activation of Al3+, nutrient stress resulting from the loss of essential nutrients such as base ions, biotoxicity from As, and the “bioconcentration effect” due to growth inhibition caused by these factors. Additionally, there is a strong synergistic effect between soil acidification and As pollution. The significant growth inhibition of pakchoi at pH 5.4 aligns with the activation of Al3+, an increase in the amorphous Fe content, and a high loss of base ions at pH < 5.6, as observed in the simulated acidification experiment. The As enrichment capacity of pakchoi was primarily influenced by the extent of soil As contamination. Although acidification promoted the transformation of soil As into a less-labile form, reducing its availability, it also significantly intensified the growth-inhibitory effects of As contamination on pakchoi, substantially elevating the As content in the aboveground parts.

4. Conclusions

Taking neutral purple soil, a major agricultural soil widely distributed in Southwest China, as the subject, the present study investigated changes in soil properties during acidification. The alterations in soil As transformation and availability in relation to these changes were elucidated, and the synergistic responses of pakchoi to soil acidification combined with As pollution were analyzed. The underlying mechanisms affecting these responses were also revealed. It was found that soil pH values between 4.7 and 4.8 served as a critical turning point for changes in soil properties. Below this critical pH, the leaching of base ions and As ions, the activation of Al3+, the decomposition of primary soil minerals, and the appearance of amorphous Fe oxides were significantly accelerated. Soil acidification promoted the transformation of soil As from highly labile forms, such as non-specifically and specifically bound forms, to less-available forms, including Fe-Al oxide-bound and residual forms, resulting in a relative decrease in As availability. However, the available soil As content remained high with the addition of exogenous As. Soil As contamination influenced the acidification process by increasing the soil’s acid-buffering capacity while promoting the leaching of base ions. Soil acidification, As pollution, and their interaction significantly affected the growth of pakchoi and As accumulation in the aboveground parts of the plants. Specifically, acidification exacerbated the toxicity of As to pakchoi, leading to a marked reduction in biomass. Although the availability of As was suppressed, the As content in the edible parts did not decrease but rather significantly increased due to the bioconcentration effect. These results enhance our understanding of the coupled processes of acidification and As transformation in neutral purple soil, as well as their impact on crop responses, thus providing a foundation for collaborative remediation of soil co-contamination.

Author Contributions

J.C.: investigation, methodology, formal analysis, writing—original draft, and writing—reviewing and editing. Z.J.: supervision, conceptualization, and funding acquisition. S.W.: supervision, conceptualization, methodology, funding acquisition, and writing—reviewing and editing. All authors have read and agreed to the published version of the manuscript.

Funding

This research was funded by the National Natural Science Foundation of China (42177012) and the National Key R & D Program of China (2018YFD0800600).

Institutional Review Board Statement

Not applicable.

Data Availability Statement

The original contributions presented in this study are included in the article materials. Further inquiries can be directed to the corresponding author(s).

Conflicts of Interest

The authors declare that they have no known competing financial interests or personal relationships that could have appeared to influence the work reported in this paper.

References

  1. Guo, J.H.; Liu, X.J.; Zhang, Y.; Shen, J.L.; Han, W.X.; Zhang, W.F.; Christie, P.; Goulding, K.W.T.; Vitousek, P.M.; Zhang, F.S. Significant Acidification in Major Chinese Croplands. Science 2010, 327, 1008–1010. [Google Scholar] [CrossRef]
  2. Tian, D.S.; Niu, S.L. A global analysis of soil acidification caused by nitrogen addition. Environ. Res. Lett. 2015, 10, 024019. [Google Scholar] [CrossRef]
  3. Goulding, K.W.T. Soil acidification and the importance of liming agricultural soils with particular reference to the United Kingdom. Soil Use Manag. 2016, 32, 390–399. [Google Scholar] [CrossRef]
  4. Cai, J.P.; Luo, W.T.; Liu, H.Y.; Feng, X.; Zhang, Y.Y.; Wang, R.Z.; Xu, Z.W.; Zhang, Y.G.; Jiang, Y. Precipitation-mediated responses of soil acid buffering capacity to long-term nitrogen addition in a semi-arid grassland. Atmos. Environ. 2017, 170, 312–318. [Google Scholar] [CrossRef]
  5. Shi, Y.L.; Chen, W.Q.; Wu, S.L.; Zhu, Y.G. Anthropogenic Cycles of Arsenic in Mainland China: 1990–2010. Environ. Sci. Technol. 2017, 51, 1670–1678. [Google Scholar] [CrossRef]
  6. Yang, Y.P.; Zhang, H.M.; Yuan, H.Y.; Duan, G.L.; Jin, D.C.; Zhao, F.J.; Zhu, Y.G. Microbe mediated arsenic release from iron minerals and arsenic methylation in rhizosphere controls arsenic fate in soil-rice system after straw incorporation. Environ. Pollut. 2018, 236, 598–608. [Google Scholar] [CrossRef]
  7. Dai, Z.M.; Zhang, X.J.; Tang, C.; Muhammad, N.; Wu, J.J.; Brookes, P.C.; Xu, J.M. Potential role of biochars in decreasing soil acidification—A critical review. Sci. Total Environ. 2017, 581, 601–611. [Google Scholar] [CrossRef] [PubMed]
  8. Che, J.; Zhao, X.Q.; Shen, R.F. Molecular mechanisms of plant adaptation to acid soils: A review. Pedosphere 2023, 33, 14–22. [Google Scholar] [CrossRef]
  9. Ju, Y.W.; Luo, Z.W.; Bi, J.; Liu, C.Z.; Liu, X. Transfer of heavy metals from soil to tea and the potential human health risk in a regional high geochemical background area in southwest China. Sci. Total Environ. 2024, 908, 168122. [Google Scholar] [CrossRef]
  10. Li, Q.Q.; Luo, Y.L.; Wang, C.Q.; Li, B.; Zhang, X.; Yuan, D.G.; Gao, X.S.; Zhang, H. Spatiotemporal variations and factors affecting soil nitrogen in the purple hilly area of Southwest China during the 1980s and the 2010s. Sci. Total Environ. 2016, 547, 485–486. [Google Scholar] [CrossRef] [PubMed]
  11. Li, J.L.; Bao, Y.H.; Wei, J.; He, X.B.; Tang, Q.; Wu, S.J.; Huang, P.; Ma, M.H.; Zhou, P.; Wang, M.F. Scaling properties of particle-size distributions of purple soils in a small agricultural watershed: A multifractal analysis. Catena 2022, 215, 106326. [Google Scholar] [CrossRef]
  12. Zhong, S.Q.; Han, Z.; Duo, J.; Ci, E.; Ni, J.P.; Xie, D.T.; Wei, C.F. Relationships between the lithology of purple rocks and the pedogenesis of purple soils in the Sichuan Basin, China. Sci. Rep. 2019, 9, 13272. [Google Scholar] [CrossRef] [PubMed]
  13. Li, Z.Y.; Wang, P.S.; Liu, L.; Zheng, Y.Y.; Xie, D.T. High negative surface charge increases the acidification risk of purple soil in China. Catena 2021, 196, 104819. [Google Scholar] [CrossRef]
  14. Zhao, Y.; Zhang, J.B.; Müller, C.; Cai, Z.C. Temporal variations of crop residue effects on soil N transformation depend on soil properties as well as residue qualities. Biol. Fertil. Soils 2018, 54, 659–669. [Google Scholar] [CrossRef]
  15. Meng, H.Q.; Xu, M.G.; Lu, J.L.; He, X.H.; Li, J.W.; Shi, X.J.; Peng, C.; Wang, B.R.; Zhang, H.M. Soil pH Dynamics and Nitrogen Transformations Under Long-Term Chemical Fertilization in Four Typical Chinese Croplands. J. Integr. Agric. 2013, 12, 2092–2102. [Google Scholar] [CrossRef]
  16. Xie, J.; Wang, D.; Chen, Y.X.; Li, Z.Q.; Dai, W.C.; Huang, R.; Wang, Z.F.; Gao, M. Neutral purple soil acidification and mineralogical property changes due to long-term urea application in southwest China. Soil Tillage Res. 2024, 244, 106227. [Google Scholar] [CrossRef]
  17. Li, Q.Q.; Li, A.W.; Yu, X.L.; Dai, T.F.; Peng, Y.Y.; Yuan, D.; Zhao, B.; Tao, Q.; Wang, C.Q.; Li, B.; et al. Soil acidification of the soil profile across Chengdu Plain of China from the 1980s to 2010s. Sci. Total Environ. 2020, 698, 134320. [Google Scholar] [CrossRef]
  18. Li, X.; Liu, H.; Meng, W.; Liu, N.; Wu, P. Accumulation and source apportionment of heavy metal(loid)s in agricultural soils based on GIS, SOM and PMF: A case study in superposition areas of geochemical anomalies and zinc smelting, Southwest China. Process Saf. Environ. Prot. 2022, 159, 964–977. [Google Scholar] [CrossRef]
  19. Zhang, X.; Xu, H.; Tang, J.; Yang, J.; Guo, Z.; Xiao, Y.; Ge, Y.; Liu, T.; Hu, Q.; Ao, H.; et al. Cadmium absorption and translocation in rice plants are influenced by lower air temperatures during grain filling stage. Sci. Total Environ. 2024, 954, 176742. [Google Scholar] [CrossRef]
  20. Li, Y.; Tao, H.; Cao, H.; Wan, X.; Liao, X. Achieving synergistic benefits through integrated governance of cultivated cadmium contamination via multistakeholder collaboration. Nat. Commun. 2024, 15, 9817. [Google Scholar] [CrossRef]
  21. Zhao, K.L.; Liu, X.M.; Xu, J.M.; Selim, H.M. Heavy metal contaminations in a soil-rice system: Identification of spatial dependence in relation to soil properties of paddy fields. J. Hazard. Mater. 2010, 181, 778–787. [Google Scholar] [CrossRef]
  22. Mühlbachová, G.; Simon, T.; Pechová, M. The availability of Cd, Pb and Zn and their relationships with soil pH and microbial biomass in soils amended by natural clinoptilolite. Plant Soil Environ. 2005, 51, 26–33. [Google Scholar] [CrossRef]
  23. Lu, M.; Huang, L.K.; Wang, Q.; Cao, X.R.; Lin, Q.; He, Z.L.; Feng, Y.; Yang, X.E. Soil properties drive the bacterial community to cadmium contamination in the rhizosphere of two contrasting wheat (Triticum aestivum L.) genotypes. J. Environ. Sci. 2023, 128, 117–128. [Google Scholar] [CrossRef] [PubMed]
  24. Su, Y.Q.; Shi, Q.Y.; Li, Z.Y.; Deng, H.M.; Zhou, Q.; Li, L.H.; Zhao, L.Y.; Yuan, S.; Liu, Q.; Chen, Y.E. Rhodopseudomonas palustris shapes bacterial community, reduces Cd bioavailability in Cd contaminated flooding paddy soil, and improves rice performance. Sci. Total Environ. 2024, 926, 171824. [Google Scholar] [CrossRef] [PubMed]
  25. Smith, A.H.; Lopipero, P.A.; Bates, M.N.; Steinmaus, C.M. Public health—Arsenic epidemiology and drinking water standards. Science 2002, 296, 2145–2146. [Google Scholar] [CrossRef]
  26. Briffa, J.; Sinagra, E.; Blundell, R. Heavy metal pollution in the environment and their toxicological effects on humans. Heliyon 2020, 6, e04691. [Google Scholar] [CrossRef] [PubMed]
  27. Anyanwu, B.O.; Orisakwe, O.E. Current mechanistic perspectives on male reproductive toxicity induced by heavy metals. J. Environ. Sci. Health Part C-Toxicol. Carcinog. 2020, 38, 204–244. [Google Scholar] [CrossRef]
  28. Qiao, J.T.; Liu, T.X.; Wang, X.Q.; Li, F.B.; Lv, Y.H.; Cui, J.H.; Zeng, X.D.; Yuan, Y.Z.; Liu, C.P. Simultaneous alleviation of cadmium and arsenic accumulation in rice by applying zero-valent iron and biochar to contaminated paddy soils. Chemosphere 2018, 195, 260–271. [Google Scholar] [CrossRef]
  29. Zhao, F.J.; Wang, P. Arsenic and cadmium accumulation in rice and mitigation strategies. Plant Soil 2020, 446, 1–21. [Google Scholar] [CrossRef]
  30. Honma, T.; Ohba, H.; Kaneko-Kadokura, A.; Makino, T.; Nakamura, K.; Katou, H. Optimal Soil Eh, pH, and Water Management for Simultaneously Minimizing Arsenic and Cadmium Concentrations in Rice Grains. Environ. Sci. Technol. 2016, 50, 4178–4185. [Google Scholar] [CrossRef]
  31. Palansooriya, K.N.; Shaheen, S.M.; Chen, S.S.; Tsang, D.C.W.; Hashimoto, Y.; Hou, D.Y.; Bolan, N.S.; Rinklebe, J.; Ok, Y.S. Soil amendments for immobilization of potentially toxic elements in contaminated soils: A critical review. Environ. Int. 2020, 134, 105046. [Google Scholar] [CrossRef]
  32. Feng, R.W.; Wang, L.Z.; Yang, J.G.; Zhao, P.P.; Zhu, Y.M.; Li, Y.P.; Yu, Y.S.; Liu, H.; Rensing, C.; Wu, Z.Y.; et al. Underlying mechanisms responsible for restriction of uptake and translocation of heavy metals (metalloids) by selenium via root application in plants. J. Hazard. Mater. 2021, 402, 123570. [Google Scholar] [CrossRef] [PubMed]
  33. Shi, M.Q.; Min, X.B.; Ke, Y.; Lin, Z.; Yang, Z.H.; Wang, S.; Peng, N.; Yan, X.; Luo, S.; Wu, J.H.; et al. Recent progress in understanding the mechanism of heavy metals retention by iron (oxyhydr)oxides. Sci. Total Environ. 2021, 752, 141930. [Google Scholar] [CrossRef] [PubMed]
  34. Standardization Administration of the People’s Republic of China. GB 15618-2018; Soil Environment Quality Risk Control Standard for Soil Contamination of Agriculture Land. China Environment Publishing Group: Beijing, China, 2018.
  35. Yang, J.K.; Barnett, M.O.; Jardine, P.M.; Basta, N.T.; Casteel, S.W. Adsorption, sequestration, and bioaccessibility of As(V) in soils. Environ. Sci. Technol. 2002, 36, 4562–4569. [Google Scholar] [CrossRef]
  36. Ministry of Agriculture of the People’s Republic of China. NY/T 1377-2007; Determination of Total Nitrogen, Total Phosphorus and Total Potassium in Soil—Kjeldahl Method. China Agriculture Press: Beijing, China, 2007.
  37. State Forestry Administration of the People’s Republic of China. LY/T 1246-1999; Determination of Exchangeable Potassium and Sodium in Forest Soil. China Standards Press: Beijing, China, 1999.
  38. State Forestry Administration of the People’s Republic of China. LY/T 1245-1999; Determination of Exchangeable Calcium and Magnesium in Forest Soil. China Standards Press: Beijing, China, 1999.
  39. Bao, S.D. Soil Agricultural Chemical Analysis, 3rd ed.; China Agriculture Press: Beijing, China, 2000. [Google Scholar]
  40. National Forestry Bureau of the People’s Republic of China. LY/T 1243–1999; Determination of Cation Exchange Capacity of Forest Soils. China Forestry Publishing House: Beijing, China, 1999.
  41. National Forestry Bureau of the People’s Republic of China. LY/T 1237–1999; Determination of Organic Matter in Forest Soils and Calculation of Carbon-Nitrogen Ratio. China Forestry Publishing House: Beijing, China, 1999.
  42. National Forestry Bureau of the People’s Republic of China. LY/T 1250-1999; Determination of Calcium Carbonate in Forest Soils. China Forestry Publishing House: Beijing, China, 1999.
  43. National Energy Administration of the People’s Republic of China. SY/T 5163-2018; Method for X-Ray Diffraction Analysis of Clay Minerals and Common Non-Clay Minerals in Sedimentary Rocks. China Petroleum Indus-try Press: Beijing, China, 2018.
  44. Sparks, D.L.; Page, A.L.; Helmke, P.A.; Loeppert, R.H.; Soltanpour, P.N.; Tabatabai, M.A.; Johnston, C.T.; Sumner, M.E. (Eds.) Methods of Soil Analysis: Chemical Methods; SSSA Book Series; SSSA: Madison, WI, USA, 1996. [Google Scholar]
  45. Chinese Standardization Administration. GB/T 22105.2-2008[S]; Soil Quality—Determination of Total Mercury, Total Arsenic and Total Lead by Atomic Fluorescence Spectrometry—Part 2: Determination of Total Arsenic In Soil. China Standard Press: Beijing, China, 2008.
  46. Wenzel, W.W.; Kirchbaumer, N.; Prohaska, T.; Stingeder, G.; Lombi, E.; Adriano, D.C. Arsenic fractionation in soils using an improved sequential extraction procedure. Anal. Chim. Acta 2001, 436, 309–323. [Google Scholar] [CrossRef]
  47. Woolson, E.A.; Kearney, P.C.; Axley, J.H. The Chemistry and Phytotoxicity of Arsenic in Soils: I. Contaminated Field Soils. Soil Sci. Soc. Am. Proc. 1971, 35, 938–943. [Google Scholar] [CrossRef]
  48. Wang, H.X.; Li, X.M.; Chen, Y.; Li, Z.B.; Hedding, D.W.; Nel, W.; Ji, J.F.; Chen, J. Geochemical behavior and potential health risk of heavy metals in basalt-derived agricultural soil and crops: A case study from Xuyi County, eastern China. Sci. Total Environ. 2020, 729, 139058. [Google Scholar] [CrossRef] [PubMed]
  49. Jiang, Y.; Han, J.H.; Xue, W.X.; Wang, J.Y.; Wang, B.H.; Liu, L.J.; Zou, J.H. Overexpression of SmZIP plays important roles in Cd accumulation and translocation, subcellular distribution, and chemical forms in transgenic tobacco under Cd stress. Ecotoxicol. Environ. Saf. 2021, 214, 112097. [Google Scholar] [CrossRef]
  50. Kirkwood, D.E.; Nesbitt, H.W. Formation and evolution of soils from an acidified watershed: Plastic Lake, Ontario, Canada. Geochim. Cosmochim. Acta 1991, 55, 1295–1308. [Google Scholar] [CrossRef]
  51. Bartlett, R.J.; McIntosh, J.L. pH-Dependent Bonding of Potassium by a Spodosol. Soil Sci. Soc. Am. Proc. 1969, 33, 535–539. [Google Scholar] [CrossRef]
  52. Li, J.Y.; Xu, R.K. Inhibition of acidification of kaolinite and an Alfisol by aluminum oxides through electrical double-layer interaction and coating. Eur. J. Soil Sci. 2013, 64, 110–120. [Google Scholar] [CrossRef]
  53. Onireti, O.O.; Lin, C.X. Mobilization of soil-borne arsenic by three common organic acids: Dosage and time effects. Chemosphere 2016, 147, 352–360. [Google Scholar] [CrossRef] [PubMed]
  54. Wei, H.; Liu, Y.L.; Xiang, H.M.; Zhang, J.E.; Li, S.F.; Yang, J.Y. Soil pH Responses to Simulated Acid Rain Leaching in Three Agricultural Soils. Sustainability 2020, 12, 280. [Google Scholar] [CrossRef]
  55. Jiang, W.; Zhang, S.Z.; Shan, X.Q.; Feng, M.H.; Zhu, Y.G.; McLaren, R.G. Adsorption of arsenate on soils. Part 2: Modeling the relationship between adsorption capacity and soil physiochemical properties using 16 Chinese soils. Environ. Pollut. 2005, 138, 285–289. [Google Scholar] [CrossRef] [PubMed]
  56. Li, Z.Y.; Liu, Y.; Wang, D.J.; Wang, P.S.; Xu, R.K.; Xie, D.T. Characterizingsurface electrochemical properties of simulated bulk soil in situ by streaming potential measurements. Eur. J. Soil Sci. 2019, 70, 1063–1072. [Google Scholar] [CrossRef]
  57. Du, Y.; Tian, Z.; Zhao, Y.; Wang, X.; Ma, Z.; Yu, C. Exploring the accumulation capacity of dominant plants based on soil heavy metals forms and assessing heavy metals contamination characteristics near gold tailings ponds. J. Environ. Manag. 2023, 351, 119838. [Google Scholar] [CrossRef] [PubMed]
  58. Yang, Q.Q.; Li, Z.Y.; Lu, X.N.; Duan, Q.N.; Huang, L.; Bi, J. A review of soil heavy metal pollution from industrial and agricultural regions in China: Pollution and risk assessment. Sci. Total Environ. 2018, 642, 690–700. [Google Scholar] [CrossRef]
  59. Li, Y.; Li, H.G.; Liu, F.C. Pollution in the urban soils of Lianyungang, China, evaluated using a pollution index, mobility of heavy metals, and enzymatic activities. Environ. Monit. Assess. 2017, 189, 34. [Google Scholar] [CrossRef] [PubMed]
  60. Rahman, Z.; Singh, V.P. The relative impact of toxic heavy metals (THMs) (arsenic (As), cadmium (Cd), chromium (Cr)(VI), mercury (Hg), and lead (Pb)) on the total environment: An overview. Environ. Monit. Assess. 2019, 191, 419. [Google Scholar] [CrossRef] [PubMed]
  61. Wang, Y.A.; Zeng, X.B.; Lu, Y.H.; Bai, L.Y.; Su, S.M.; Wu, C.X. Dynamic arsenic aging processes and their mechanisms in nine types of Chinese soils. Chemosphere 2017, 187, 404–412. [Google Scholar] [CrossRef]
  62. Kim, E.J.; Yoo, J.C.; Baek, K. Arsenic speciation and bioaccessibility in arsenic-contaminated soils: Sequential extraction and mineralogical investigation. Environ. Pollut. 2014, 186, 29–35. [Google Scholar] [CrossRef]
  63. Shanmugapriya, S.; Subramanian, K. Developing a PLS path model to investigate the factors influencing safety performance improvement in construction organizations. KSCE J. Civ. Eng. 2016, 20, 1138–1150. [Google Scholar] [CrossRef]
  64. Tipper, E.T.; Stevenson, E.I.; Alcock, V.; Knight, A.C.G.; Baronas, J.J.; Hilton, R.G.; Bickle, M.J.; Larkin, C.S.; Feng, L.S.; Relph, K.E.; et al. Global silicate weathering flux overestimated because of sediment-water cation exchange. Proc. Natl. Acad. Sci. USA 2021, 118, e2016430118. [Google Scholar] [CrossRef] [PubMed]
  65. Garg, N.; Singla, P. Arsenic toxicity in crop plants: Physiological effects and tolerance mechanisms. Environ. Chem. Lett. 2011, 9, 303–321. [Google Scholar] [CrossRef]
  66. Jiang, J.; Wang, Y.P.; Yu, M.X.; Cao, N.N.; Yan, J.H. Soil organic matter is important for acid buffering and reducing aluminum leaching from acidic forest soils. Chem. Geol. 2018, 501, 86–94. [Google Scholar] [CrossRef]
Figure 1. Lysimetric column device diagram.
Agriculture 15 00364 g001
Figure 2. Buffering curves of purple soil acid at different As contamination levels. (L) Uncontaminated soil, with an As concentration of 3.5 mg·kg−1; (M) moderately contaminated soil, with an As concentration of 78.5 mg·kg−1; (H) heavily contaminated soil, with an As concentration of 123.5 mg·kg−1.
Agriculture 15 00364 g002
Figure 3. Exchangeable H+, Al3+, base saturation, and CEC in soils with different levels of As contamination. (L) Uncontaminated soil, with an As concentration of 3.5 mg·kg−1; (M) moderately contaminated soil, with an As concentration of 78.5 mg·kg−1; (H) heavily contaminated soil, with an As concentration of 123.5 mg·kg−1; and (CEC) in uncontaminated, moderately contaminated, and highly contaminated soils.
Agriculture 15 00364 g003
Figure 4. Base ions and total base ions in purple soil with different levels of contamination. (L) Uncontaminated soil, with an As concentration of 3.5 mg·kg−1; (M) moderately contaminated soil, with an As concentration of 78.5 mg·kg−1; (H) heavily contaminated soil, with an As concentration of 123.5 mg·kg−1; and (EB) total base ions content in uncontaminated, moderately contaminated, and highly contaminated soils.
Agriculture 15 00364 g004
Figure 5. Based ions in leachate corresponding to purple soil with different levels of contamination. (L) Uncontaminated soil, with an As concentration of 3.5 mg·kg−1; (M) moderately contaminated soil, with an As concentration of 78.5 mg·kg−1; and (H) heavily contaminated soil, with an As concentration of 123.5 mg·kg−1.
Agriculture 15 00364 g005
Figure 6. Amorphous iron oxide content of purple soil with different levels of contamination. (L) Uncontaminated soil, with an As concentration of 3.5 mg·kg−1; (M) moderately contaminated soil, with an As concentration of 78.5 mg·kg−1; and (H) heavily contaminated soil, with an As concentration of 123.5 mg·kg−1. The same lowercase letters indicate no significant differences among different soil treatments at the same arsenic level, while different lowercase letters indicate significant differences among the treatments (p < 0.05, n = 3).
Agriculture 15 00364 g006
Figure 7. Percentage of total As in five As forms after the acidification of soil with different levels of contamination: F1 is non-specifically bound, F2 is specifically bound, F3 is amorphous hydrous oxide-bound, F4 is crystalline hydrous oxide-bound, and F5 is residual. (L) Uncontaminated soil, with an As concentration of 3.5 mg·kg−1; (M) moderately contaminated soil, with an As concentration of 78.5 mg·kg−1; and (H) heavily contaminated soil, with an As concentration of 123.5 mg·kg−1.
Agriculture 15 00364 g007
Figure 8. Total As, As activation ratios, and corresponding As in leachate after acidification of soils with different levels of pollution. (L,L1) Uncontaminated soil, with an As concentration of 3.5 mg·kg−1; (M,M1) moderately contaminated soil, with an As concentration of 78.5 mg·kg−1; and (H,H1) heavily contaminated soil, with an As concentration of 123.5 mg·kg−1. The same lowercase letters indicate no significant differences among different soil treatments at the same arsenic level, while different lowercase letters indicate significant differences among the treatments (p < 0.05, n = 3).
Agriculture 15 00364 g008
Figure 9. Pearson’s correlation analysis of effective and total As with continuous extracted state As content in soils with different As contents at different acidification stages (n = 8): (a) uncontaminated soil, with an As concentration of 3.5 mg·kg−1; and (b) heavily contaminated soil, with an As concentration of 123.5 mg·kg−1. Note: * at the 0.05 level (two-tailed), the correlation is significant; ** at the 0.01 level (two-tailed), the correlation is significant.
Agriculture 15 00364 g009
Figure 10. Partial least squares path modeling of factors in purple soil at different acidification stages. The red and blue arrows indicate positive and negative correlations, respectively; * indicates a significant level of influence (p < 0.05), and ** indicates an extremely significant level of influence (p < 0.01).
Agriculture 15 00364 g010
Table 1. Soil acidification buffer curve-fitting equation and acid-buffering capacity.
Soil TreatmentFitted Equation (y = kx + b)Acid-Buffering Capacity (mmol·kg−1)
kbR2
LA−0.05826.97330.972217.18
B−0.01605.45600.984262.50
MA−0.03736.15500.979626.81
B−0.01635.37860.971261.35
HA−0.04066.25500.993624.63
B−0.01295.07300.908777.52
Note: A and B are fitted data at acid additions of 0 to 40 and 40 to 100 mmol·kg−1. Acid-buffering capacity pHBC = 1/|a|, where a is the slope of the fitted equation, and b is the intercept of the fitted equation. (L) Uncontaminated soil, with an As concentration of 3.5 mg·kg−1; (M) moderately contaminated soil, with an As concentration of 78.5 mg·kg−1; (H) heavily contaminated soil, with an As concentration of 123.5 mg·kg−1.
Table 2. Mineral composition and content of purple soil at different acidification levels (%).
TreatmentQtzPIMCItCI/SC/SHem
LpH7.235226568153
LpH5.634209756163
LpH4.636198636184
LpH3.838185647193
HpH7.237208677123
HpH3.939167649203
Note: Qtz, quartz; PI, plagioclase feldspar; MC, microcline feldspar; It, illite; C, chlorite; I/S, ilmenite/montmorillonite; C/S, chlorite/montmorillonite; and Hem, hematite.
Table 3. Correlation analysis of soil pH and silicate minerals under different acidification levels.
pHQtzPIMCItCI/SC/S
pH1
Qtz−0.5561
PI0.856 *−0.812 *1
MC0.247−0.4720.1221
It−0.327−0.169−0.310.6451
C0.886 *−0.2540.610.108−0.2151
I/S−0.0650.594−0.349−0.484−0.5410.1361
C/S−0.937 **0.472−0.754−0.3540.107−0.892 *0.2521
Note: Qtz, quartz; PI, plagioclase feldspar; MC, microcline feldspar; It, illite; C, chlorite; I/S, ilmenite/montmorillonite; C/S, chlorite/montmorillonite; and Hem, hematite. * at the 0.05 level (two-tailed), the correlation is significant; ** at the 0.01 level (two-tailed), the correlation is significant.
Table 4. Growth of pakchoi in different As-contaminated purple soils under different levels of acidification.
Soil TreatmentBiomass (g·pot−1, FW)Plant Height (cm)
LpH6.916.23 ± 2.30 b17.1 ± 2.1 b
LpH6.121.13 ± 3.89 a21.6 ± 3.0 a
LpH5.411.73 ± 0.81 c12.3 ± 0.6 c
LpH4.66.78 ± 1.52 d8.10 ± 1.4 d
MpH6.96.80 ± 2.58 a7.6 ± 2.2 a
MpH6.15.04 ± 0.67 ab6.2 ± 0.6 ab
MpH5.42.34 ± 1.51 bc3.9 ± 1.0 b
MpH4.60 ± 0 d-
HpH6.93.97 ± 1.73 a5.1 ± 0.7 a
HpH6.11.48 ± 0.68 b3.2 ± 0.3 b
HpH5.40.40 ± 0.26 b2.5 ± 0.3 b
HpH4.60 ± 0 b-
Note: Data are means ± standard error. The same lowercase letter for data in the same column indicates no significant difference between soil treatments at the same As level, and different lowercase letters indicate significant differences between treatments (p < 0.05, n = 3). L: uncontaminated soil, with an As concentration of 3.5 mg·kg−1; M: moderately contaminated soil, with an As concentration of 78.5 mg·kg−1; and H: heavily contaminated soil, with an As concentration of 123.5 mg·kg−1.
Table 5. Effects of different As-contaminated purple soils on As enrichment in pakchoi under different levels of acidification.
Soil TreatmentAboveground As Content (mg·kg−1)BCFTF
LpH6.90.37 ± 0.01 a0.11 ± 0.002 a0.367 ± 0.003 a
LpH6.10.32 ± 0.14 a0.09 ± 0.039 a0.193 ± 0.084 b
LpH5.40.30 ± 0.15 a0.08 ± 0.043 a0.139 ± 0.070 b
LpH4.60.33 ± 0.02 a0.12 ± 0.022 a0.223 ± 0.043 b
MpH6.914.98 ± 6.42 a0.19 ± 0.082 a0.008 ± 0.002 a
MpH6.118.81 ± 6.63 a0.24 ± 0.084 a0.007 ± 0.002 a
MpH5.418.27 ± 11.1 a0.23 ± 0.142 a0.011 ± 0.007 a
MpH4.6---
HpH6.925.91 ± 7.91 a0.21 ± 0.064 a0.009 ±0.003 ab
HpH6.124.87 ± 3.89 a0.20 ± 0.032 a0.007 ±0.001 b
HpH5.427.58 ± 0.29 a0.22 ± 0.002 a0.012 ±0.000 a
HpH4.6---
Note: Data are means ± standard error. The same lowercase letter for data in the same column indicates no significant difference between soil treatments at the same As level, and different lowercase letters indicate significant differences between treatments (p < 0.05, n = 3). L: uncontaminated soil, with an As concentration of 3.5 mg·kg−1; M: moderately contaminated soil, with an As concentration of 78.5 mg·kg−1; and H: heavily contaminated soil, with an As concentration of 123.5 mg·kg−1.
Table 6. Effects of soil acidification and As contamination on growth, enrichment capacity, and translocation capacity of pakchoi.
ParametersBiomassAboveground As Content BCFTF
Soil acidificationF178.5747.9680.1726.665
p-value0.00 **0.00 **0.9140.003 **
As contaminationF34.1019.87110.460108.10
p-value0.00 **0.00 **0.001 **0.000 **
Soil acidification × As contaminationF7.725.7010.30210.399
p-value0.00 **0.001 **0.8730.000 **
Note: ** indicates a highly significant difference (p < 0.01); BCF is the biological concentration factor; and TF is the translocation factor.
Disclaimer/Publisher’s Note: The statements, opinions and data contained in all publications are solely those of the individual author(s) and contributor(s) and not of MDPI and/or the editor(s). MDPI and/or the editor(s) disclaim responsibility for any injury to people or property resulting from any ideas, methods, instructions or products referred to in the content.

