Article

Analysis of Ecosystem Service Value Trends and Drivers in the Yellow River Delta, China

1
School of Civil Engineering and Geomatics, Shandong University of Technology, Zibo 255000, China
2
Jinan Gangcheng District Natural Resources Bureau, Jinan 271104, China
3
Guangzhou Marine Geological Survey, China Geological Survey, Guangzhou 511458, China
4
Southern Marine Science and Engineering Guangdong Laboratory (Guangzhou), Guangzhou 511458, China
*
Authors to whom correspondence should be addressed.
Agriculture 2025, 15(3), 346; https://doi.org/10.3390/agriculture15030346
Submission received: 2 January 2025 / Revised: 29 January 2025 / Accepted: 3 February 2025 / Published: 6 February 2025
(This article belongs to the Section Agricultural Economics, Policies and Rural Management)

Abstract

:
Ecosystem service value (ESV) reflects ecosystem functions and benefits; however, the factors influencing ESV and the mechanisms driving it in wetlands and non-wetlands are not yet fully understood. The Yellow River Delta (YRD) is distinguished by the presence of numerous wetland areas that are both Reserve and non-Reserve and thus it was selected as the designated study area. In this study, the spatiotemporal structures of ESV in the YRD between 2000 and 2020 were studied using land cover change analysis and the equivalent factor methodology. In addition, we analyzed the drivers behind the geographical variability in ESV by applying the Geographical Detector method. The results showed that the land structure of the YRD National Nature Reserve was relatively stable, whereas the non-Reserve area exhibited greater fluctuations; that is, wetlands in the YRD non-Reserve area decreased by 11.43% compared with the more stable land structure in Reserve areas, where wetland decreased by 4.93%. Furthermore, disparities in the distribution of land use types gave rise to a discernible spatial distribution of overall ESV, with the northeast exhibiting significantly higher ESV levels compared to the southwest. Additionally, in the past two decades, the center of gravity of the ESV in both regions has shifted towards urban centers, and wetlands have migrated towards the coastline. The Normalized Difference Vegetation Index was identified as the main driver of ESV heterogeneity. The findings of this study are highly relevant to regional ecological conservation and the promotion of economic and social development.

1. Introduction

Ecosystem service value (ESV) represents the economic value that ecosystems provide through their natural functions [1,2]. These services highlight the crucial role of ecosystems in preserving biodiversity, regulating climate, and purifying water. In light of the intensification of global environmental issues, particularly climate change, land use and cover change (LUCC) [3], and biodiversity loss, ESV is increasingly being recognized as a pivotal indicator of ecosystem health and sustainability. Wetlands constitute a key component of the global ecosystem, contributing over 23 percent of the world’s total ESV [4]. However, as human activities intensify, especially land development and urbanization, wetlands, especially estuarine wetlands, are facing degradation and loss, causing a marked decrease in their ecological functions and services. In contrast, non-wetland areas tend to suffer more severe ecological damage under the influence of LUCC, especially urbanization and industrialization, where ecosystem service (ES) functions are under greater threat [5,6]. Therefore, it is of great importance to investigate the factors and their driving mechanisms between wetland and non-wetland ESV to reveal the changes in the ecological service functions of both under different land cover classes [7]. The examination of the spatiotemporal progression of wetland and non-wetland ESV, and their dynamics, is instrumental in facilitating comprehension of the impact of LUCC on ES. This understanding provides the scientific basis for developing more targeted environmental conservation policies and land use planning, thereby supporting the environmentally viable growth of the region [8,9].
Currently, the methodologies for calculating ESV have reached a more advanced stage of development, particularly the Equivalence Factor Approach [10,11], which is widely employed in ES valuation due to its simplicity and robust applicability. By converting different types of ES into a uniform monetary value, the method allows for comparisons between different regions and time periods and provides policymakers with the means to make informed decisions regarding the allocation of resources. Nevertheless, despite the ongoing refinement of ESV calculation methodologies, comprehensive investigations into its spatial distribution characteristics and underlying driving forces remain scarce. In particular, with regard to spatial heterogeneity and dynamic changes in driving factors, the extant research is largely confined to a qualitative description of the distribution of ESV trends based on the ESV spatial distribution map. There is a paucity of systematic quantitative analysis, which is inadequate for fully elucidating the features of the geographical spread of ESV and its changing law. The standard deviation ellipse principle [12,13,14] allows for the quantification of the extension range and direction of ESV distribution, as well as the provision of morphological information regarding the spatial distribution of ESV. Geospatial autocorrelation analysis [15,16] enables the measurement of the similarity between neighboring regions, thereby exposing the geographical aggregation pattern of ESV and facilitating the identification and analysis of the spatial dependence between regions exhibiting high and low ESVs. The gravity center migration model [17,18] allows for the tracking of ESV at various time intervals through analysis of the alteration of the center of gravity of the ESV. This approach enables the tracking of spatial changes in ESV over different time periods, thereby providing a global perspective for the spatial analysis of ESV.
An all-encompassing understanding of the drivers of ESV and their underlying mechanisms is essential for elucidating the synergistic effects of ecosystems [19]. At present, the prevailing analytical techniques, including correlation analysis [1], principal component analysis [20,21,22], and geographical and temporally weighted regression [23,24], are primarily concerned with delineating regional disparities. However, these methods often offer a simplistic representation of the synergistic effects of ESV, failing to delve deeply into the underlying driving mechanisms. The factors that drive ESV are complex and varied, and multiple factors may act in concert. However, traditional regression analyses are unable to account for spatial heterogeneity among factors. Geographical detector [25,26], an advanced spatial analysis tool, can quantitatively analyze the interactions between single and multiple factors, overcoming the limitations of traditional methods and becoming an important means to analyze the driving mechanism of ESV.
The Yellow River Delta (YRD) [27,28] represents among the most expansive and representative wetland ecosystems in China, encompassing a diverse array of water ecological types, including wetlands, mudflats, rivers, and lakes [29]. It is an important site for the global migration of waterbirds and is also a member of a number of international ecological protection networks, such as the East Asia–Australia Bird Migration Network and the Northeast Asia Crane Reserve Network [30], etc., which affords it an important international ecological protection status. From an economic perspective, as one of the key drivers of economic development in China, it is rich in energy resources, including wind energy, geothermal energy, oil, and gas resources, etc. The area’s distinctive natural landscape and rich cultural heritage play an integral role in the region’s cultural identity, folklore, and tourism industry. The region’s ES function is facing significant challenges due to its sensitivity to the repercussions of worldwide climate change [5,31] and sea level rise. Nevertheless, the majority of extant studies have concentrated on the evaluation of ESV in the wetland nature reserve of the YRD [32], particularly the Natural Nature Reserve [11,33]. However, given the region’s growing business community and the increasing intensity of activities undertaken by human beings, it is essential to take into account the ecological changes and alterations in ESV in the non-Reserve area.
Thus, this study focuses on the YRD as the study area, estimates its ESV using the equivalence factor method, and validates the results through the sensitivity index (SI). Thereafter, the results are combined with spatial autocorrelation and center-of-gravity transfer method to analyze the spacetime evolution of ESV over the YRD region. ESV driver interplay mechanisms in Reserve and non-Reserve areas were evaluated using the geographical detector. The study aimed to (1) determine the spatiotemporal changes in LULC in Reserve and non-Reserve areas in the YRD region in the last 20 years; (2) examine the connection between the geospatial dynamism of ESV in the two regions and the corresponding land use changes during the last two decades; and (3) examine the role of key drivers in shaping ESV across different geographical areas.

2. Materials and Methods
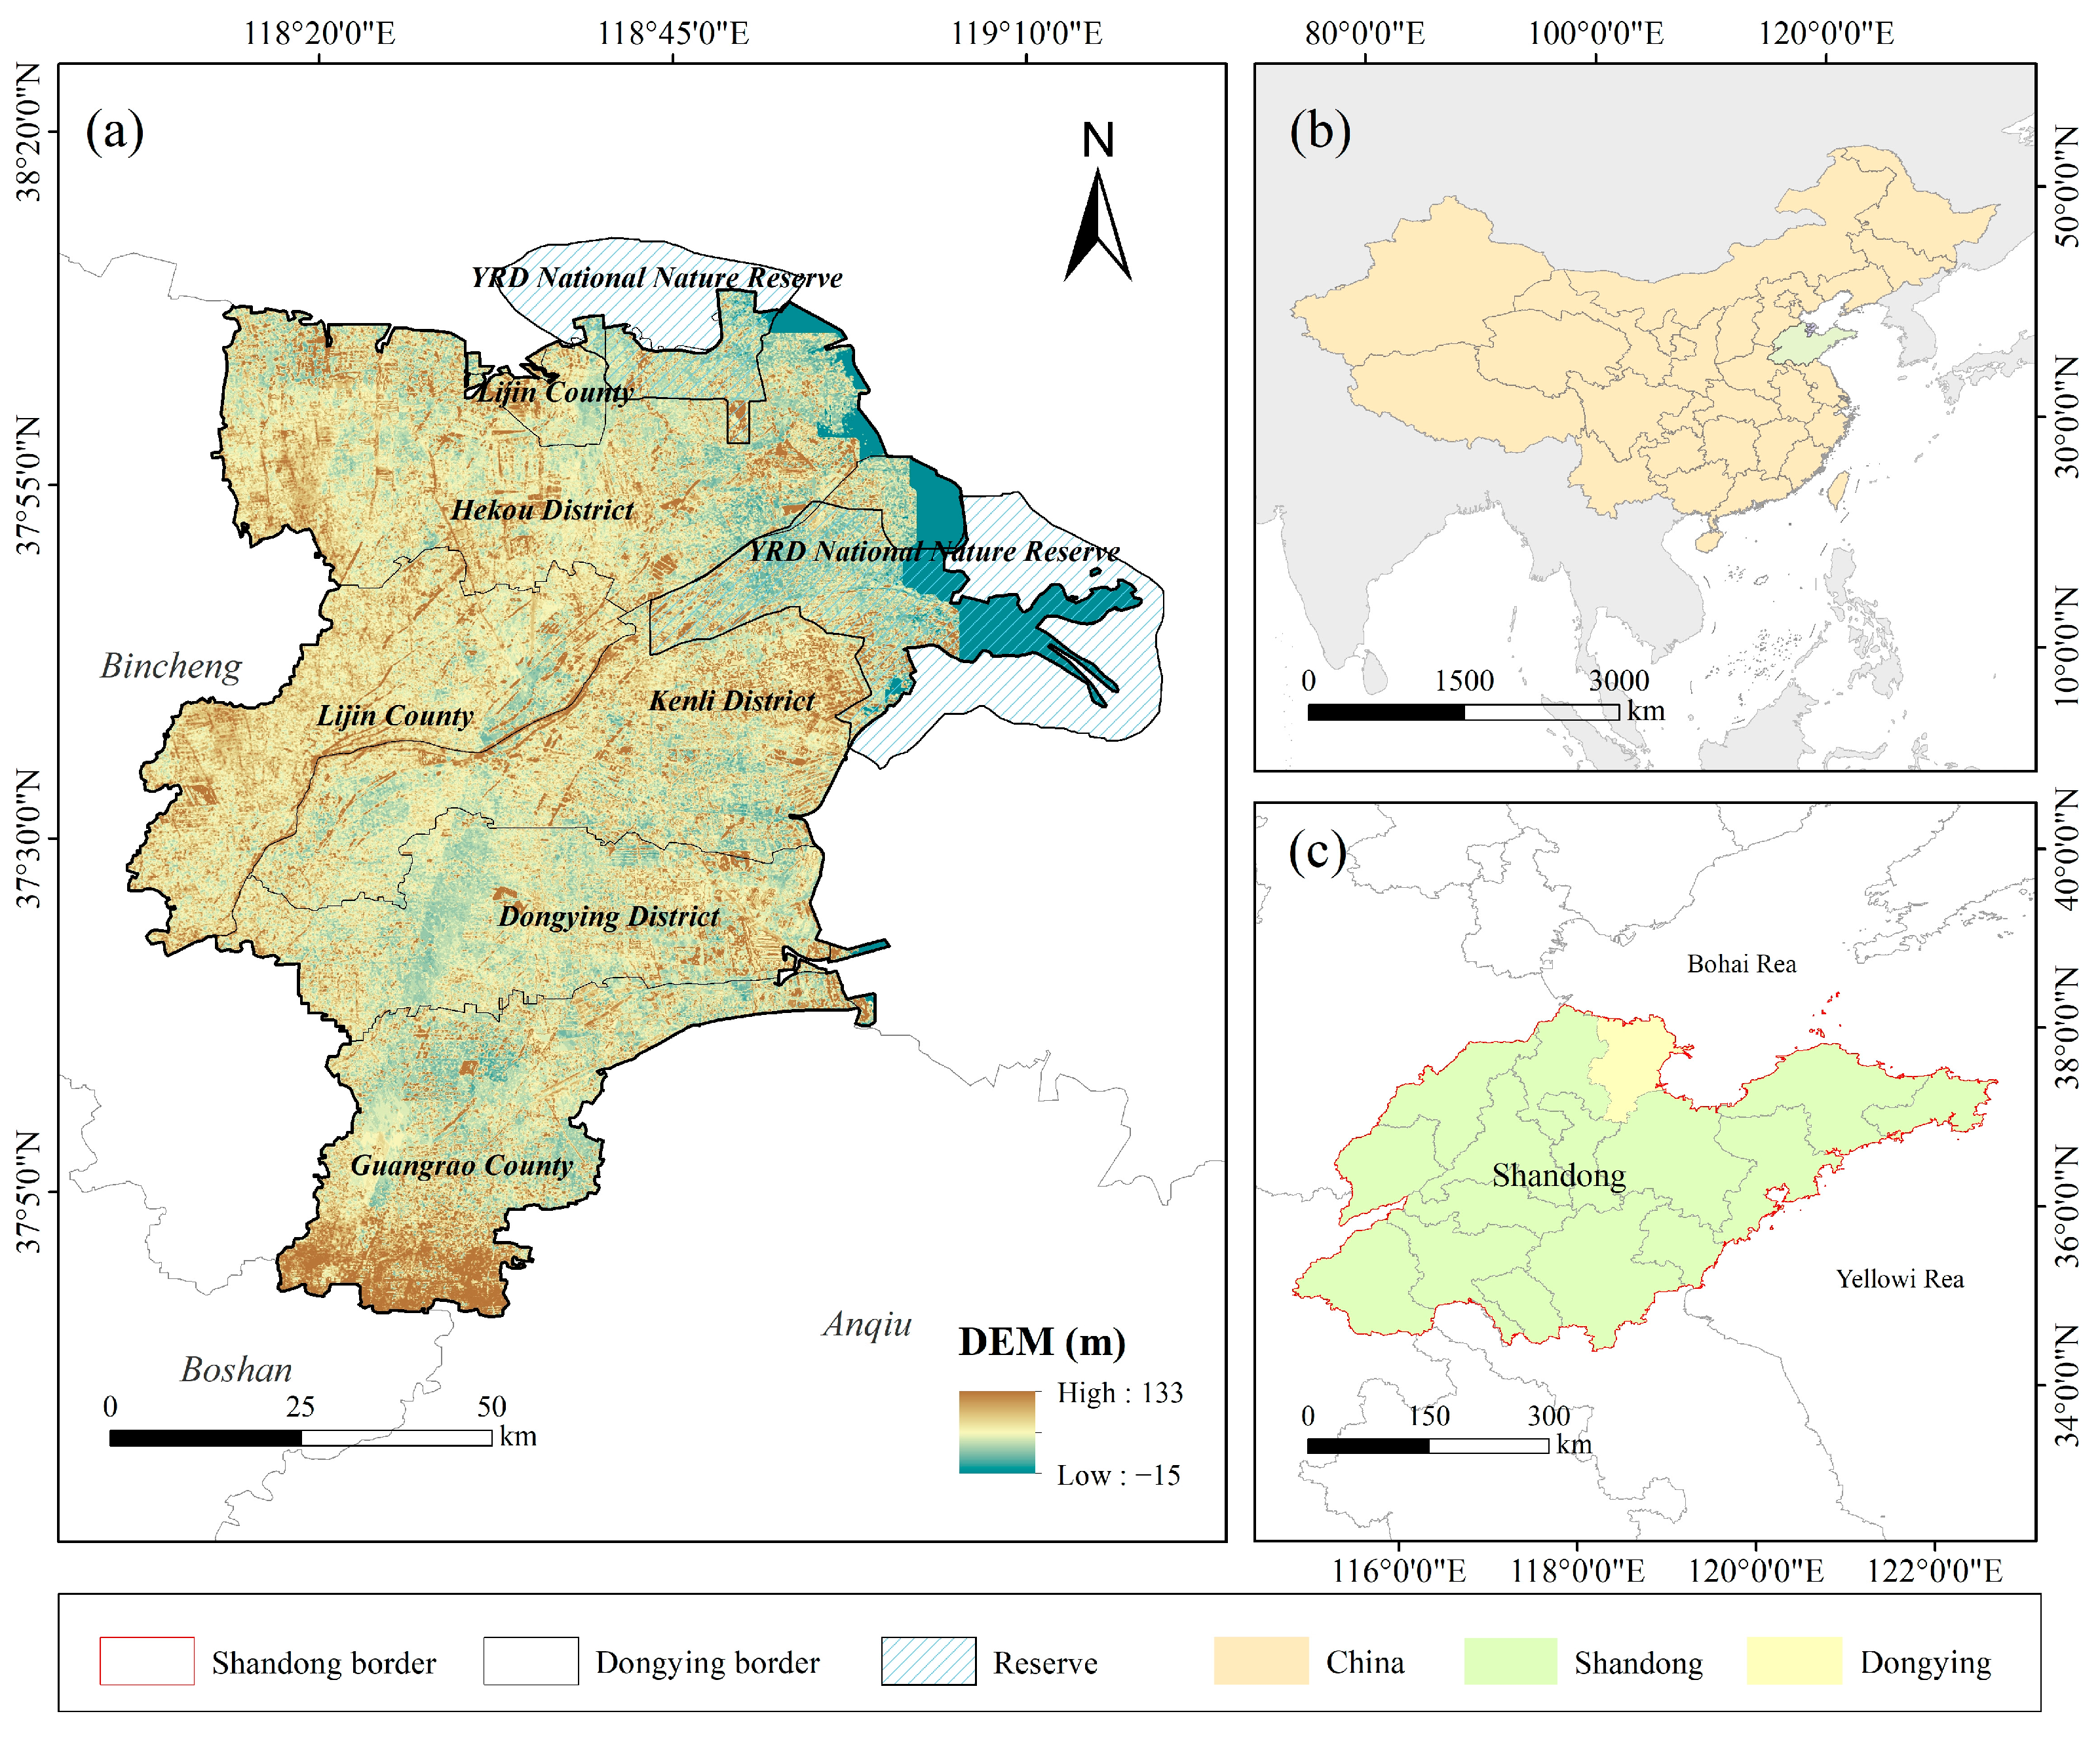
2.1. Study Area

The YRD (118°33′ E to 119°20′ E, 37°35′ N to 38°12′ N), located in Dongying City, Shandong Province, is a distinctive coastal zone formed by sea outlet sediments. The area is renowned for its wealth of biological diversity, wetlands, and ecological functions, which provide vital ES such as water regulation, climate control, and biodiversity preservation. The region has experienced significant environmental transformations in recent decades, a process that has been influenced by both natural phenomena and human interventions [34]. The YRD is distinguished by its heterogeneous land use, encompassing protected natural reserves and zones designated for agricultural and urban development. This study focuses on Dongying City, which encompasses both Reserve (144,473.76 ha) and non-Reserve (843,085.08 ha) areas. It compares the ESV of these areas and explores the driving factors of the observed variations. This study seeks to examine the spacetime dynamics of ESV and provide important insights for the management and conservation of this crucial ecological region (Figure 1).

2.2. Data

The data collected for this study encompass a range of factors, including land use, topography, climate, socio-economics, food market prices, transport infrastructure, and administrative divisions (Table 1). The land use data are suitable for monitoring land use changes in the region. Topographic, road, and climate data were used to assess the role of climate factors. In addition, socio-economic data and cereal market prices were analyzed to understand human activities and economic dynamics in the region. Administrative area data were used to delineate the impact factor data and the study area. The combination of these different data sources helps to comprehensively analyze the geographical and time variability of ESV and its drivers.

2.3. Methods

2.3.1. Land Use Change

The land use transfer matrix [35] is a matrix generated through the statistical analysis of changes in land use types over a defined time period. It holds significant analytical value, as it clearly delineates the shifts between different land use categories [36], including areas of expansion, reduction, and stability. This matrix offers a comprehensive view of the dynamism of LUCC and establishes a sound baseline for the formulation of land use strategies and management. The layout of the land use transfer matrix is shown below [37]:
Q r s = Q 11 Q 12 Q 21 Q 22 Q 1 n Q 2 n Q n 1 Q n 2 Q n n
where Q signifies the area of a land cover classification; r and s denote the land cover types before and after conversion, respectively; n is the total number of land cover types; and Qrs denotes the area converted from land cover type r to type s. Each row of the matrix provides information on the destination of land cover type r to other types, whereas each column details the source of land cover type s from other types.

2.3.2. Estimation of ESV

To ensure an accurate assessment of ESV in the YRD, the equivalence factor was adjusted based on socio-economic data for the region [38].
1.
Adjustment of the ES equivalence factor
In this study, the application of ES equivalent factors derived from other regions to the YRD may lead to inaccurate results due to regional differences in environmental conditions and land use characteristics. To address this issue, we adjusted the ES equivalent factor using a method based on grain yield unit area, ensuring a more accurate reflection of the local ecological context [39].
μ = N e N f
E p q = μ × E o p q
where μ is the adjustment factor, Ne is the amount of grain harvested per unit area within the study region, Nf is the amount of grain harvested per unit area in China, Epq is the ES equivalence factor of the adjusted ES function q for land cover category p, and Eopq is the ES equivalence factor of the ES function q for land cover category p before the adjustment. μ was calculated to be 1.06.
2.
Quantification of the ES per unit area
The primary food cereals cultivated in the YRD are soybean, maize, and wheat. The ESV per ha is typically estimated to be one-seventh of the economic benefit derived from the cereal crop harvested from one ha of farmland, according to prevailing market prices [40,41,42].
E x = n = 1 m o n p n q n S 7
where Ex refers to the ESV per ha, n indicates the type of cereal, on represents its average market price, pn is the average yield, qn is the average acreage of the nth cereal, and S denotes the total area planted with cereals. The calculated ESV for the YRD is USD 206.57 ha−1.
3.
Computation of the ESV
The ESV is calculated using the method of value transfer [43]:
Y i = j = 1 n E i j × E x
U E S V = i = 1 n Y i × S i
where Yi is the ESV of one ha of land cover category i, Eij is the adjusted ES adjustment factor for ES function j in land cover category i, Ex denotes the ESV per ha, UESV refers to the total ESV, and Si indicates the area of land cover category i.

2.3.3. Spatiotemporal Analysis of ESV

4.
Standard deviation elliptic (SDE) principle
The SDE is a visualization tool for describing the degree of dispersion and correlation of a multivariate dataset, which generates an ellipse graph by calculating the central tendency and dispersion of the data points, thus visually describing the pattern and direction of the distribution of the data points [44,45]. The center of the ellipse represents the mean center of the dataset; that is, the center of the geographic element in terms of its spatial distribution, whose center is calculated by the formula below:
S D E x = c = 1 n x c x ¯ 2 n
S D E y = c = 1 n y c y ¯ 2 n
where SDEx and SDEy denote the center of the ellipse (i.e., the center coordinates), xc and yc correspond to the spatial coordinates of each element, while x and y are the midpoints of the mean, and n is the number of element points.
The degree of rotation represents the geometry of the ellipse, indicating the direction of the main trend of the aggregation of data points, and is expressed in terms of the angle of clockwise rotation using the due north direction as a reference. Its calculation formula is as follows:
tan θ = c = 1 n x ¯ c 2 c = 1 n y ¯ c 2 + ( c = 1 n x ¯ c 2 c = 1 n y ¯ c 2 ) 2 + 4 x ¯ c 2 y ¯ c 2 2 x ¯ c y ¯ c 2
where θ is the azimuth angle, indicating the orientation of data distribution, tan θ represents the tangent value of the azimuth angle of the ellipse, and xc and yc denote the deviations of the x and y coordinates from the mean center, respectively. The direction of the ellipse is based on the x-axis, and 0° corresponds to the north direction, rotating clockwise [46].
The disparity between the long and short axes of the ellipse reflects both the direction of the data pattern and the degree of dispersion of the data points. The long axis represents the distribution direction, while the short axis signifies the extent of dispersion, as calculated by the formula in [47,48].
5.
Spatial correlation analysis
The phenomenon of ESV is characterized by spatial interactions across different units within a region, reflecting the intricate dynamics of human–environment interactions. The analysis of its spatial autocorrelation provides insights into the aggregated and dispersed distribution patterns of ESV in the examined area [49]. The most common methods for conducting geospatial correlation analysis are Moran’s I and local spatial correlation indicator maps. The respective calculation formulas are as follows [50]:
I = m p = 1 m q = 1 m W p q x p x ¯ x q x ¯ p = 1 m q = 1 m W p q p = 1 m x p x ¯ 2
I p = m x p x ¯ p W p q x q x ¯ p x p x ¯ 2
where I represents the global Moran’s I index and Ip denotes the local Moran index; m is the number of spatial cells; xp and xq are the actual values of p and q; Wpq refers to the geospatial weight matrix; and x represents the mean of xp [51].

2.3.4. Validation of ESV Estimation Accuracy

In order to ascertain the veracity of the adjusted Dongying ESV assessment outcomes, this paper introduces a Sensitivity Index (SI) to assess the correlation between ESV and the total economic value per unit area of types of land use. The specific method entails calculating the SI by increasing or decreasing the total economic value per unit area of each land cover category by 50% [52]. The formula is shown below [53]:
S I = E S V b E S V a ÷ E S V a V O E b V O E a ÷ V O E a
where SI represents the sensitivity index; ESVa and ESVb are the total ESV before and after adjustment; VOEa and VOEb represent the total value per unit area of the land cover category before and after adjustment, respectively; (ESVb − ESVa)/ESVa is used to describe the rate of change in the ESV; and (VOEb − VOEa)/VOEa is the rate of variation in the velocity coefficient.
When the SI is below 1, it suggests that the ESV is relatively unaffected by changes in the total economic value per unit area of the land cover category, showing only slight fluctuations. This indicates that the revised ESV evaluation, based on the natural and social developments in Dongying City, is both justifiable and exhibits strong stability [54].

2.3.5. Geographical Detector (GD) Model

The GD is a tool for analyzing spatial patterns, aiding in the identification of spatial heterogeneity in geographical phenomena and quantitatively determining the primary driving factors [55,56]. To investigate the interactive effects of multiple factors, this study employs the model to examine the factors influencing ESV in the region. The analysis is based on data pertaining to climate, population density, normalized difference vegetation index (NDVI), and road networks, which serve as the primary driving layers. The following formulae are employed [19]:
u = 1 S S W S S T
S S W = i = 1 j M i σ i 2
S S T = M σ 2
where the values 1, 2, …, j denote the partition; Mi is the table for district i; M is the number of cells in all districts; σi2 is the variance of district i; 2 is the variance of all districts; SSW is the sum of the variations within counties; while SST reflects the total variation between counties. The u-value is a quantitative representation of the explanatory strength of the driver, taking values between [0, 1]. An increase in the u-value suggests a higher level of spatial heterogeneity in the dependent variable and a stronger explanatory relationship between the response and explanatory variables.

3. Results

3.1. Dynamic Changes in LULC

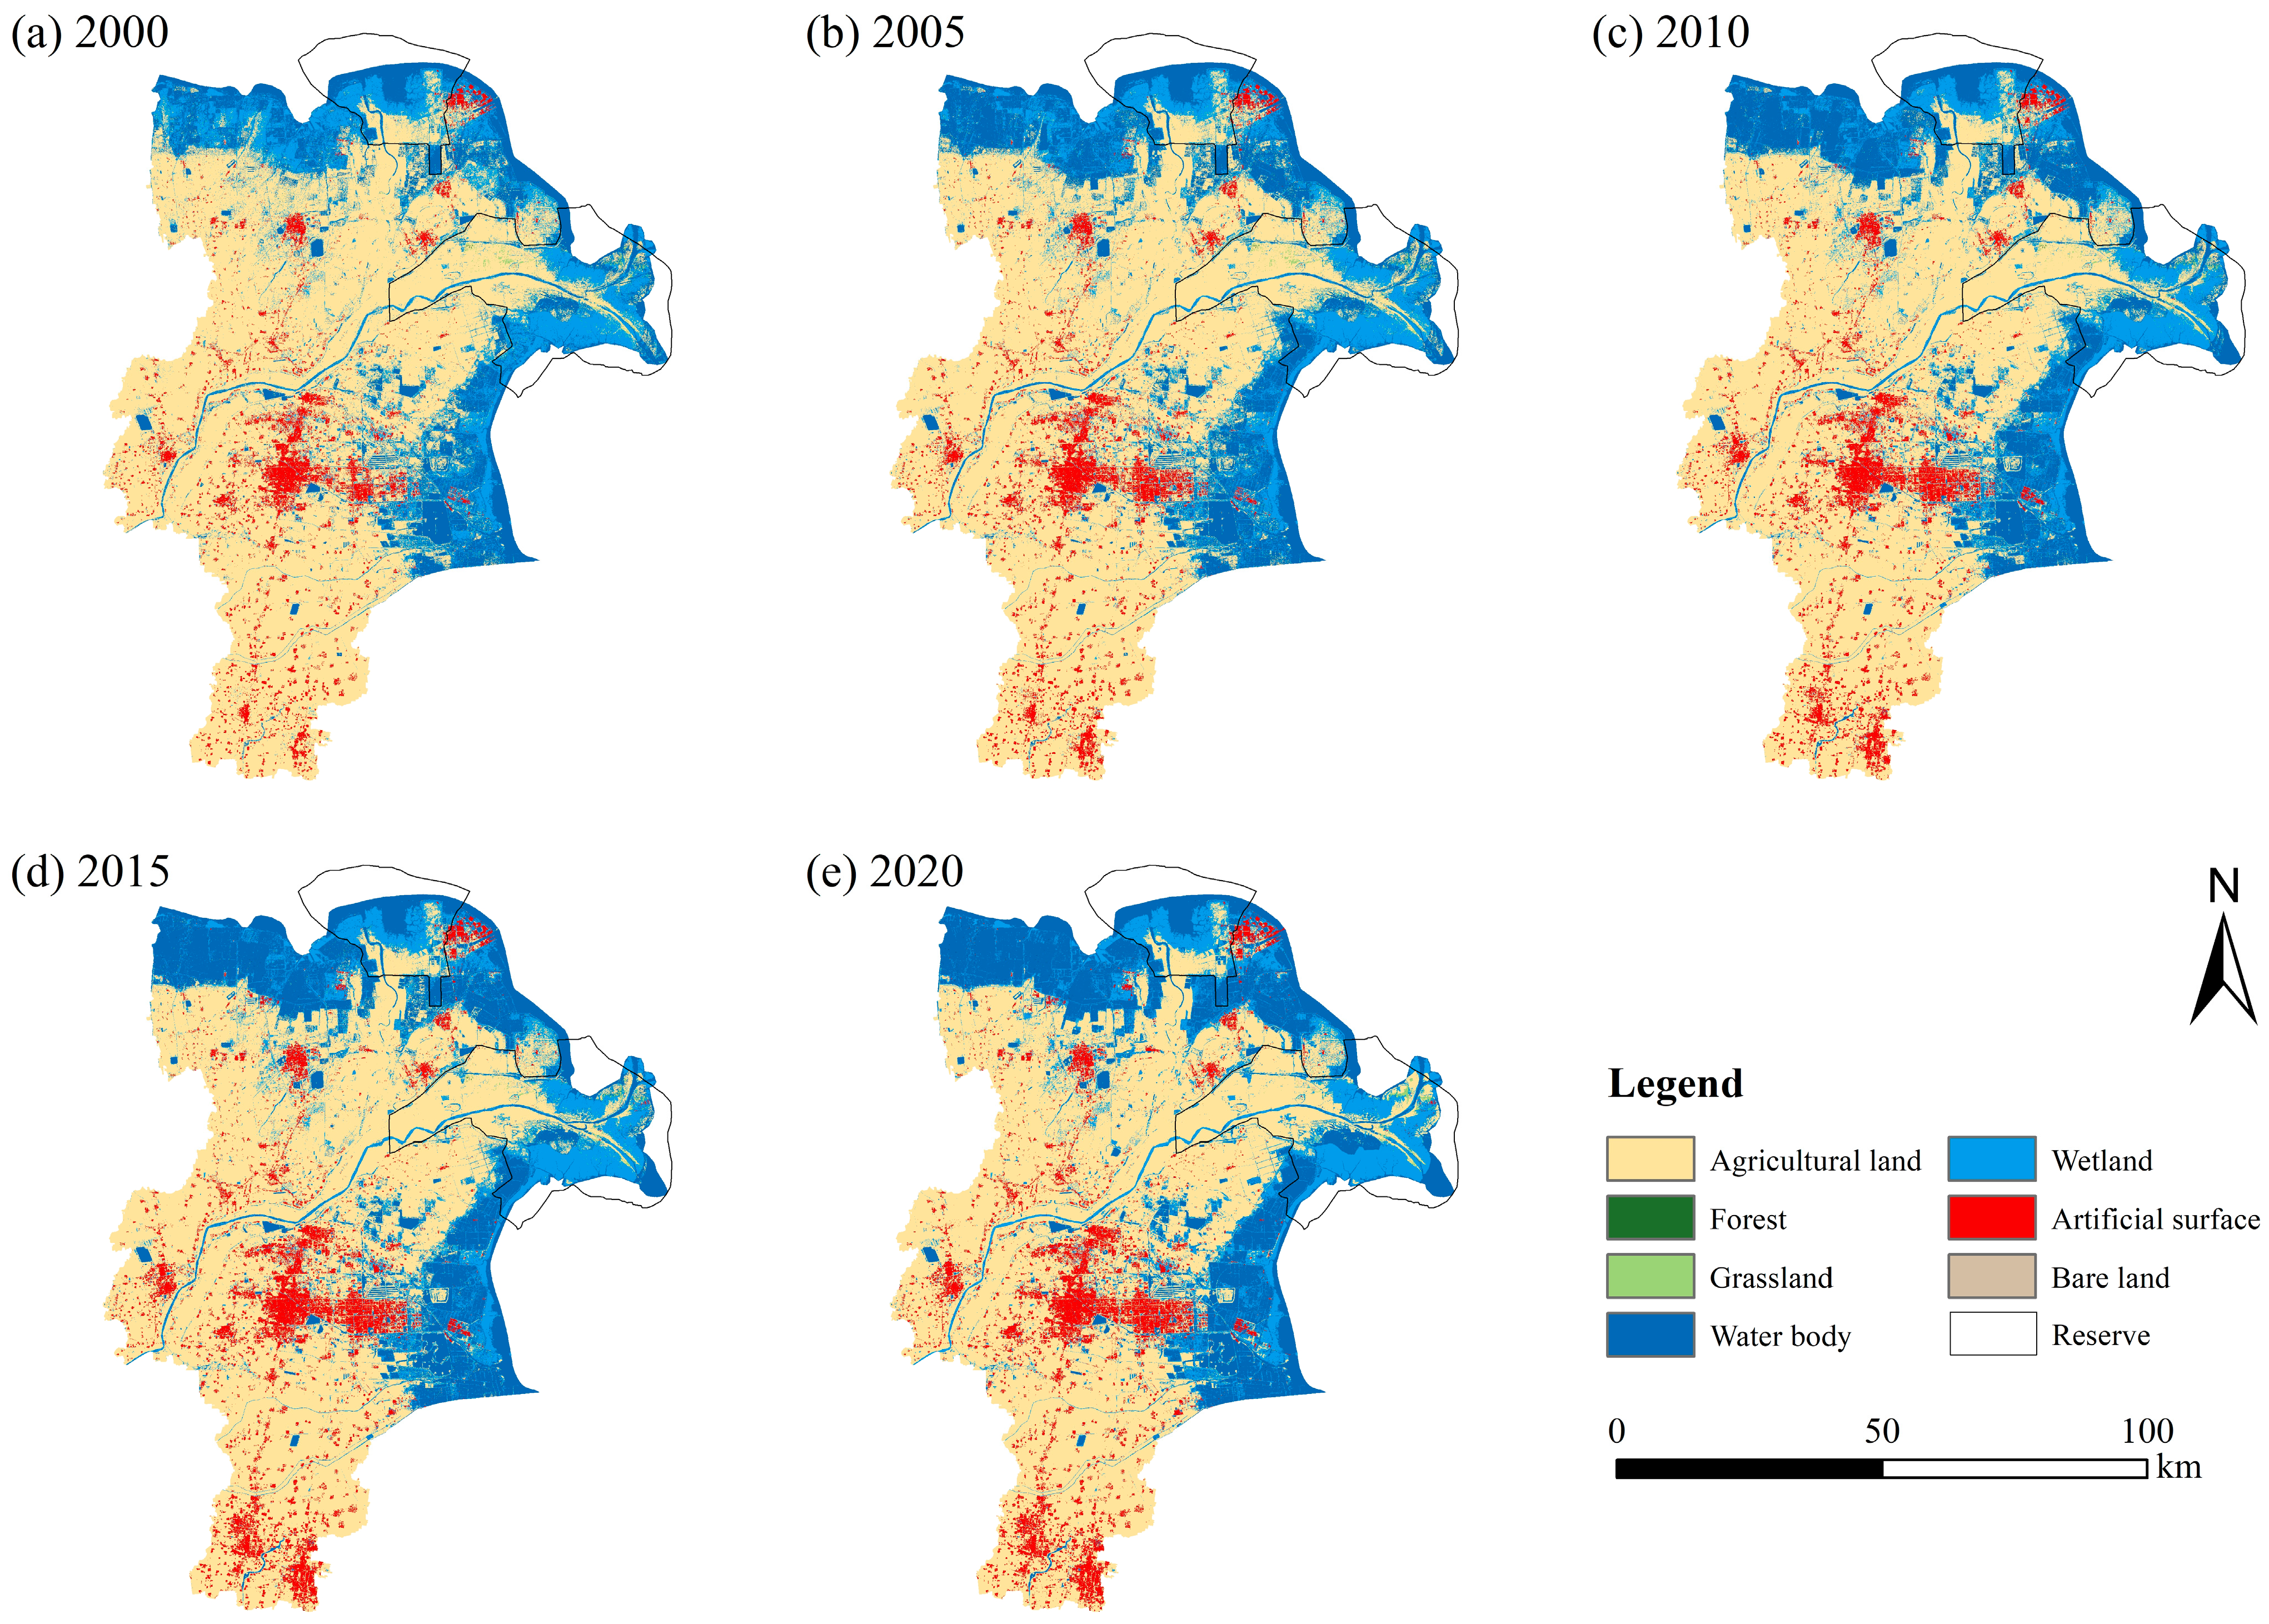
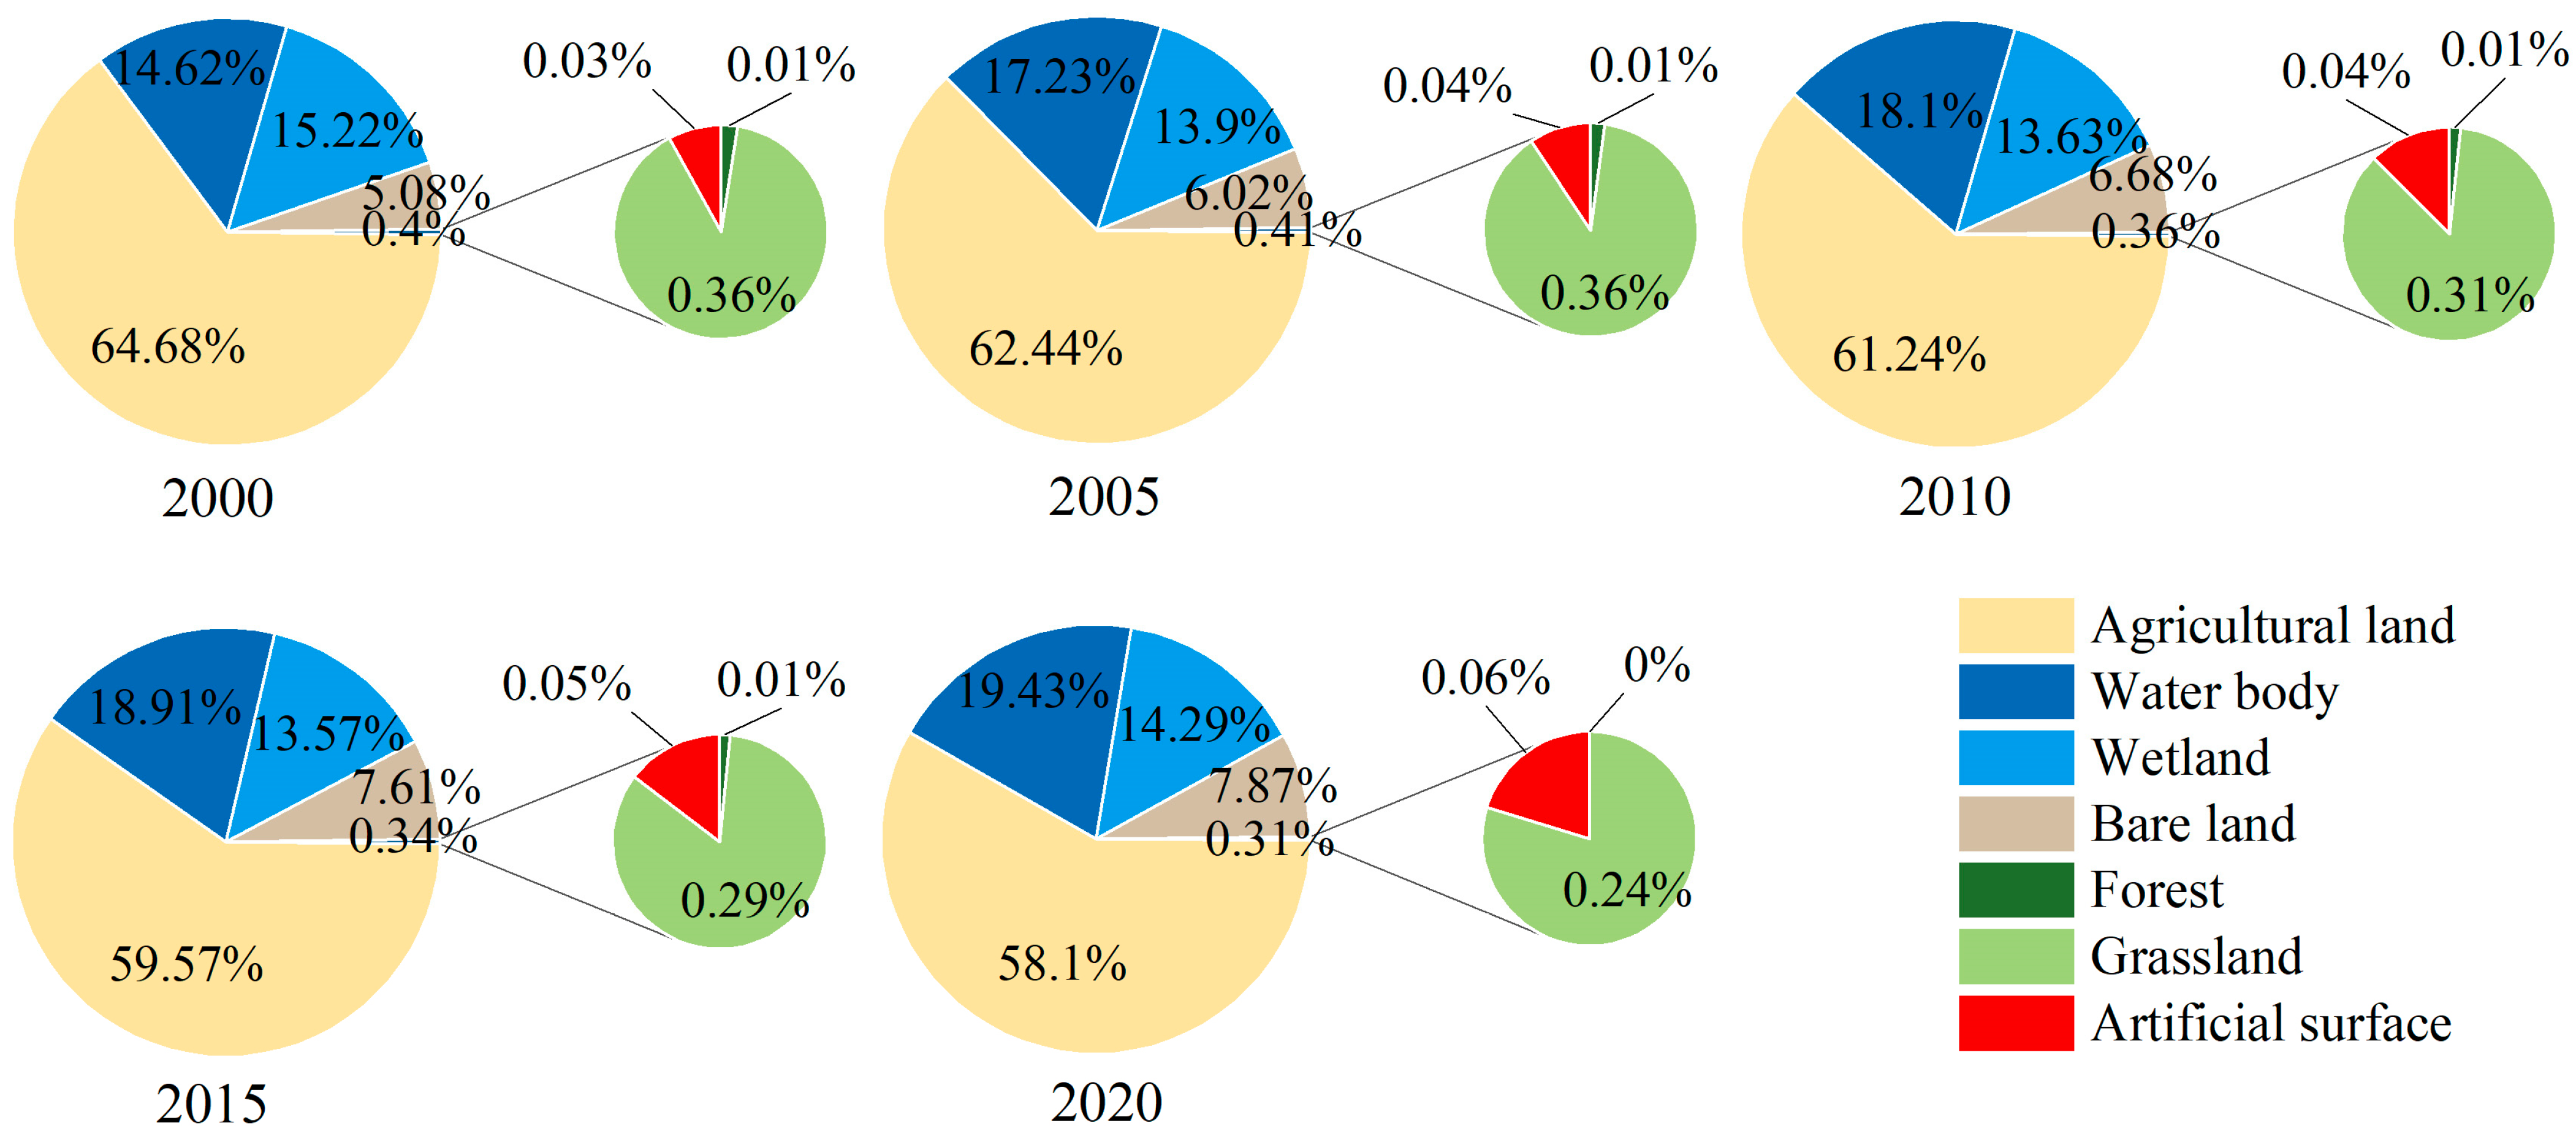
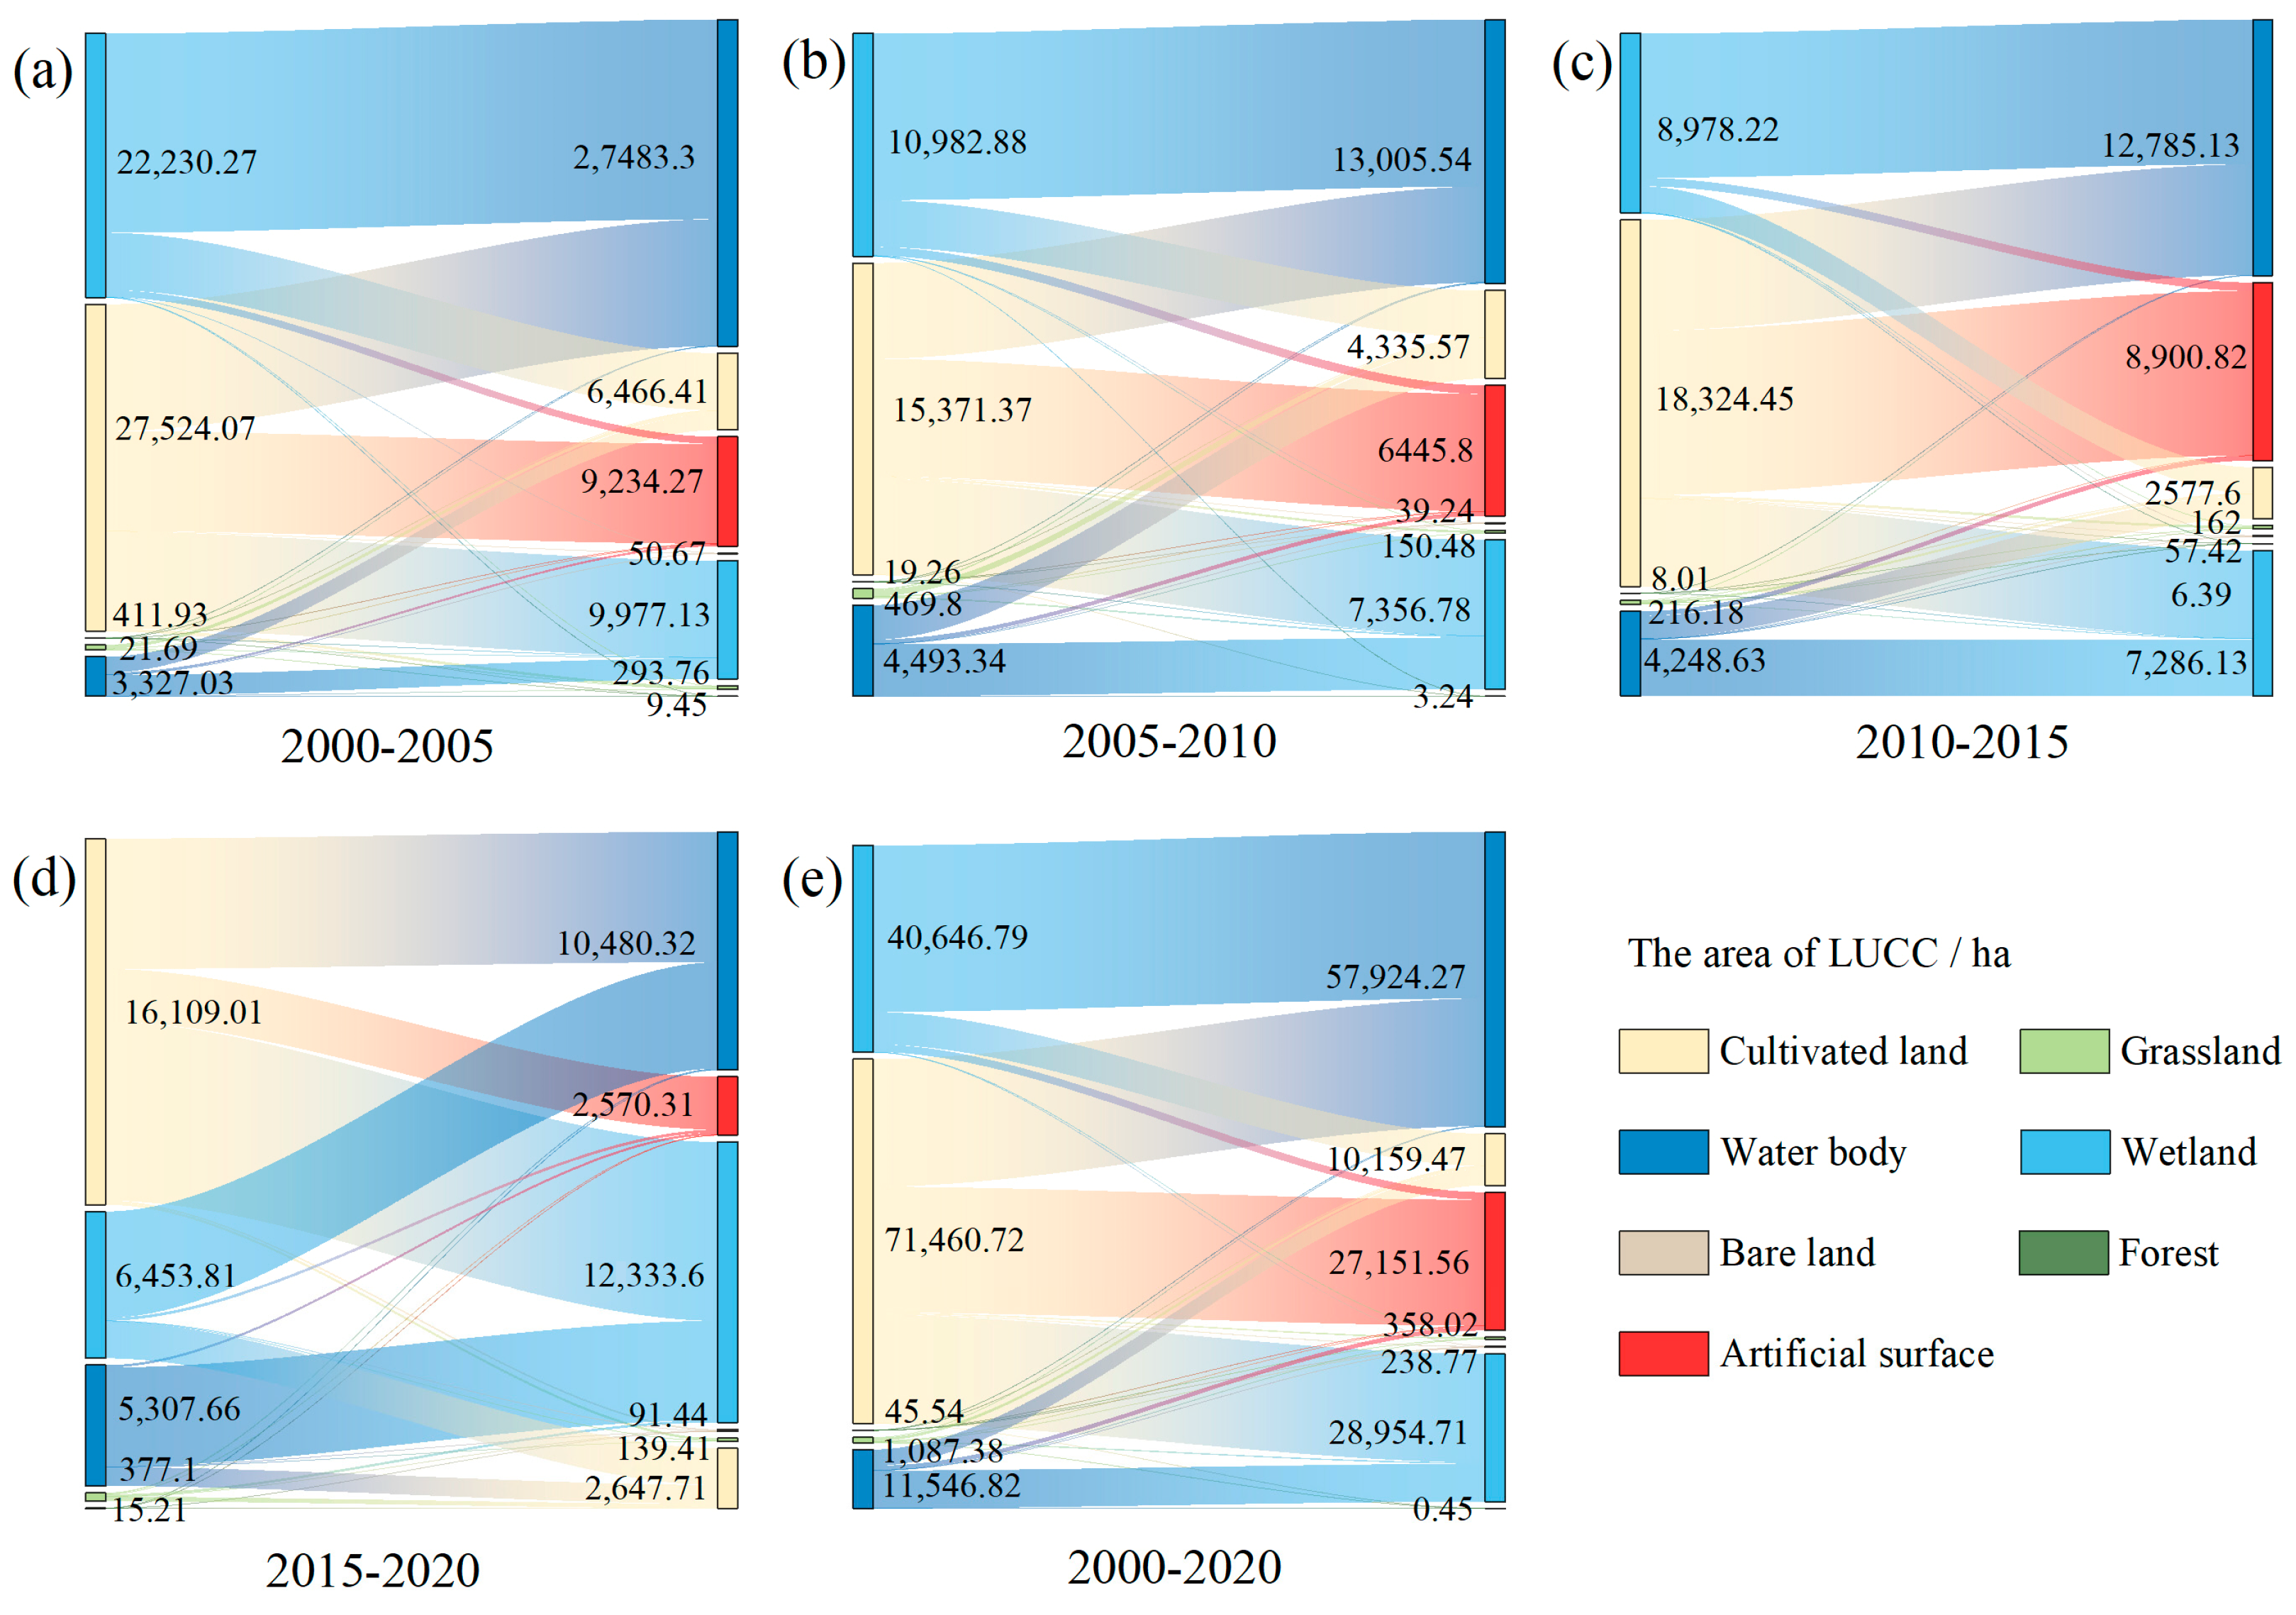
3.1.1. LUCC in Dongying in 2000–2020

Regarding the spatial distribution (Figure 2 and Figure 3), cropland is the most widespread and largest land cover category in the YRD, covering 61.21% of the whole area of Dongying City. The distribution of this land cover category is primarily concentrated in Lijin and Guangrao counties, encompassing the southwestern portion of Kenli District and the southern region of Hekou District, with a minor presence in the western section of Dongying District. The majority of water bodies and wetlands are situated in the coastal areas of Lijin County and the other three districts. The area covered by wetlands is slightly less than that of water bodies, accounting for approximately 17.66% and 14.12% of the total area, correspondingly. In contrast, the built-up land is primarily concentrated in Dongying District, which serves as the political center of the entire Dongying City. The distribution of grasslands is more extensive, encompassing nearly every district and county. The highest concentration of these lands is found within Reserve areas. The area covered by bare land is slightly greater than that covered by forested land, with the majority of the latter concentrated in non-Reserve areas. Bare land is distributed in a scattered manner, with a small amount concentrated in Reserve areas within Kenli District. The forested area is the smallest, comprising only one-thousandth of the area of cultivated land. It is primarily situated in the Reserve area in Kenli District, the central area in Hekou District, and, to a comparatively lesser degree, in Dongying District.

3.1.2. LUCC in Reserve and Non-Reserve Areas

The primary characteristics of the Reserve area are its cultivated land, wetlands, and water bodies (Table 2). About 39.51% of the total area is cultivated, while wetlands and water bodies cover 33.85% and 24.97% of the total area, respectively. The remaining four land-cover categories covered a smaller total area than that observed in the non-Reserve area. The latter exhibited an area approximately six times larger than that of the Reserve area. The majority of the area within the Reserve was dominated by cultivated land (Table 2), which accounted for 64.87% of the total.
A thorough examination of the LUCC of the Reserve and non-Reserve areas (Figure 4 and Figure 5) reveals a gradual decline in cultivated land in both regions. This decline can be primarily attributed to the Chinese government’s fallow policy and the ongoing process of urbanization. However, a more pronounced decrease has been observed in non-Reserve areas, with a decline of 10.58%, equivalent to 61,307.09 ha, compared with the year 2000. Conversely, the decrease in the Reserve area was only 6.16%, a phenomenon that may be attributed to the stringent land protection policy in these areas, which strictly controls the development and utilization of arable land. At the beginning of the observation period, the grassland area in both regions was comparable, and the results of the changes were similar, with a nearly equivalent decrease in grassland area in both regions. The decline in the non-Reserve area is substantially more pronounced, exhibiting a decrease of 729.36 ha, which is equivalent to 46.60% compared to the same period in 2000 and 21.65% relative to the same period in the Reserve area. Conversely, the areas covered by water bodies in both regions exhibited a gradual increase on an annual basis, with an augmentation of 1336.86 ha in the Reserve area and a substantial expansion of 46,377.45 ha in the non-Reserve area. The wetland landscapes in the two regions exhibited contrasting trends, with the wetland area in the Reserve area increasing by 2385.45 ha and decreasing by 11,692.80 ha in the non-Reserve area. A statistically significant difference was identified in the changes in wetland area between the two regions, with an increase of 2385.45 ha in the Reserve area and a decrease of 11,692.80 ha in the non-Reserve area. Furthermore, the non-Reserve area covered by construction land expanded significantly by 27,151.56 ha, representing a year-on-year increase of 54%. Conversely, the Reserve area exhibited a more than 100% year-on-year increase in new constructions, indicating a discernible expansion trend. The area covered by bare land has increased in both regions, exhibiting a comparable trend, although its share remains relatively small, not exceeding 0.1% of the total area. The marked difference between the changes in the area covered by water ecosystems and built-up land in the two regions may be related to factors such as protection policies, surrounding land use patterns, water recharge, level of economic development, industrial structure, population growth and distribution, transportation, and infrastructure construction. The Reserve area has demonstrated a consistent increase in watershed areas and a gradual expansion of built-up land, attributable to the implementation of stringent protection policies, environmentally sustainable land use and industrial structure, and a moderate rate of population growth. In contrast, the watershed area in the non-Reserve area has undergone substantial expansion; however, it was damaged in the early stages and underwent significant expansion of built-up land due to weak policy enforcement, high development intensity, rapid economic development, high population concentration, and high demand for infrastructure construction.

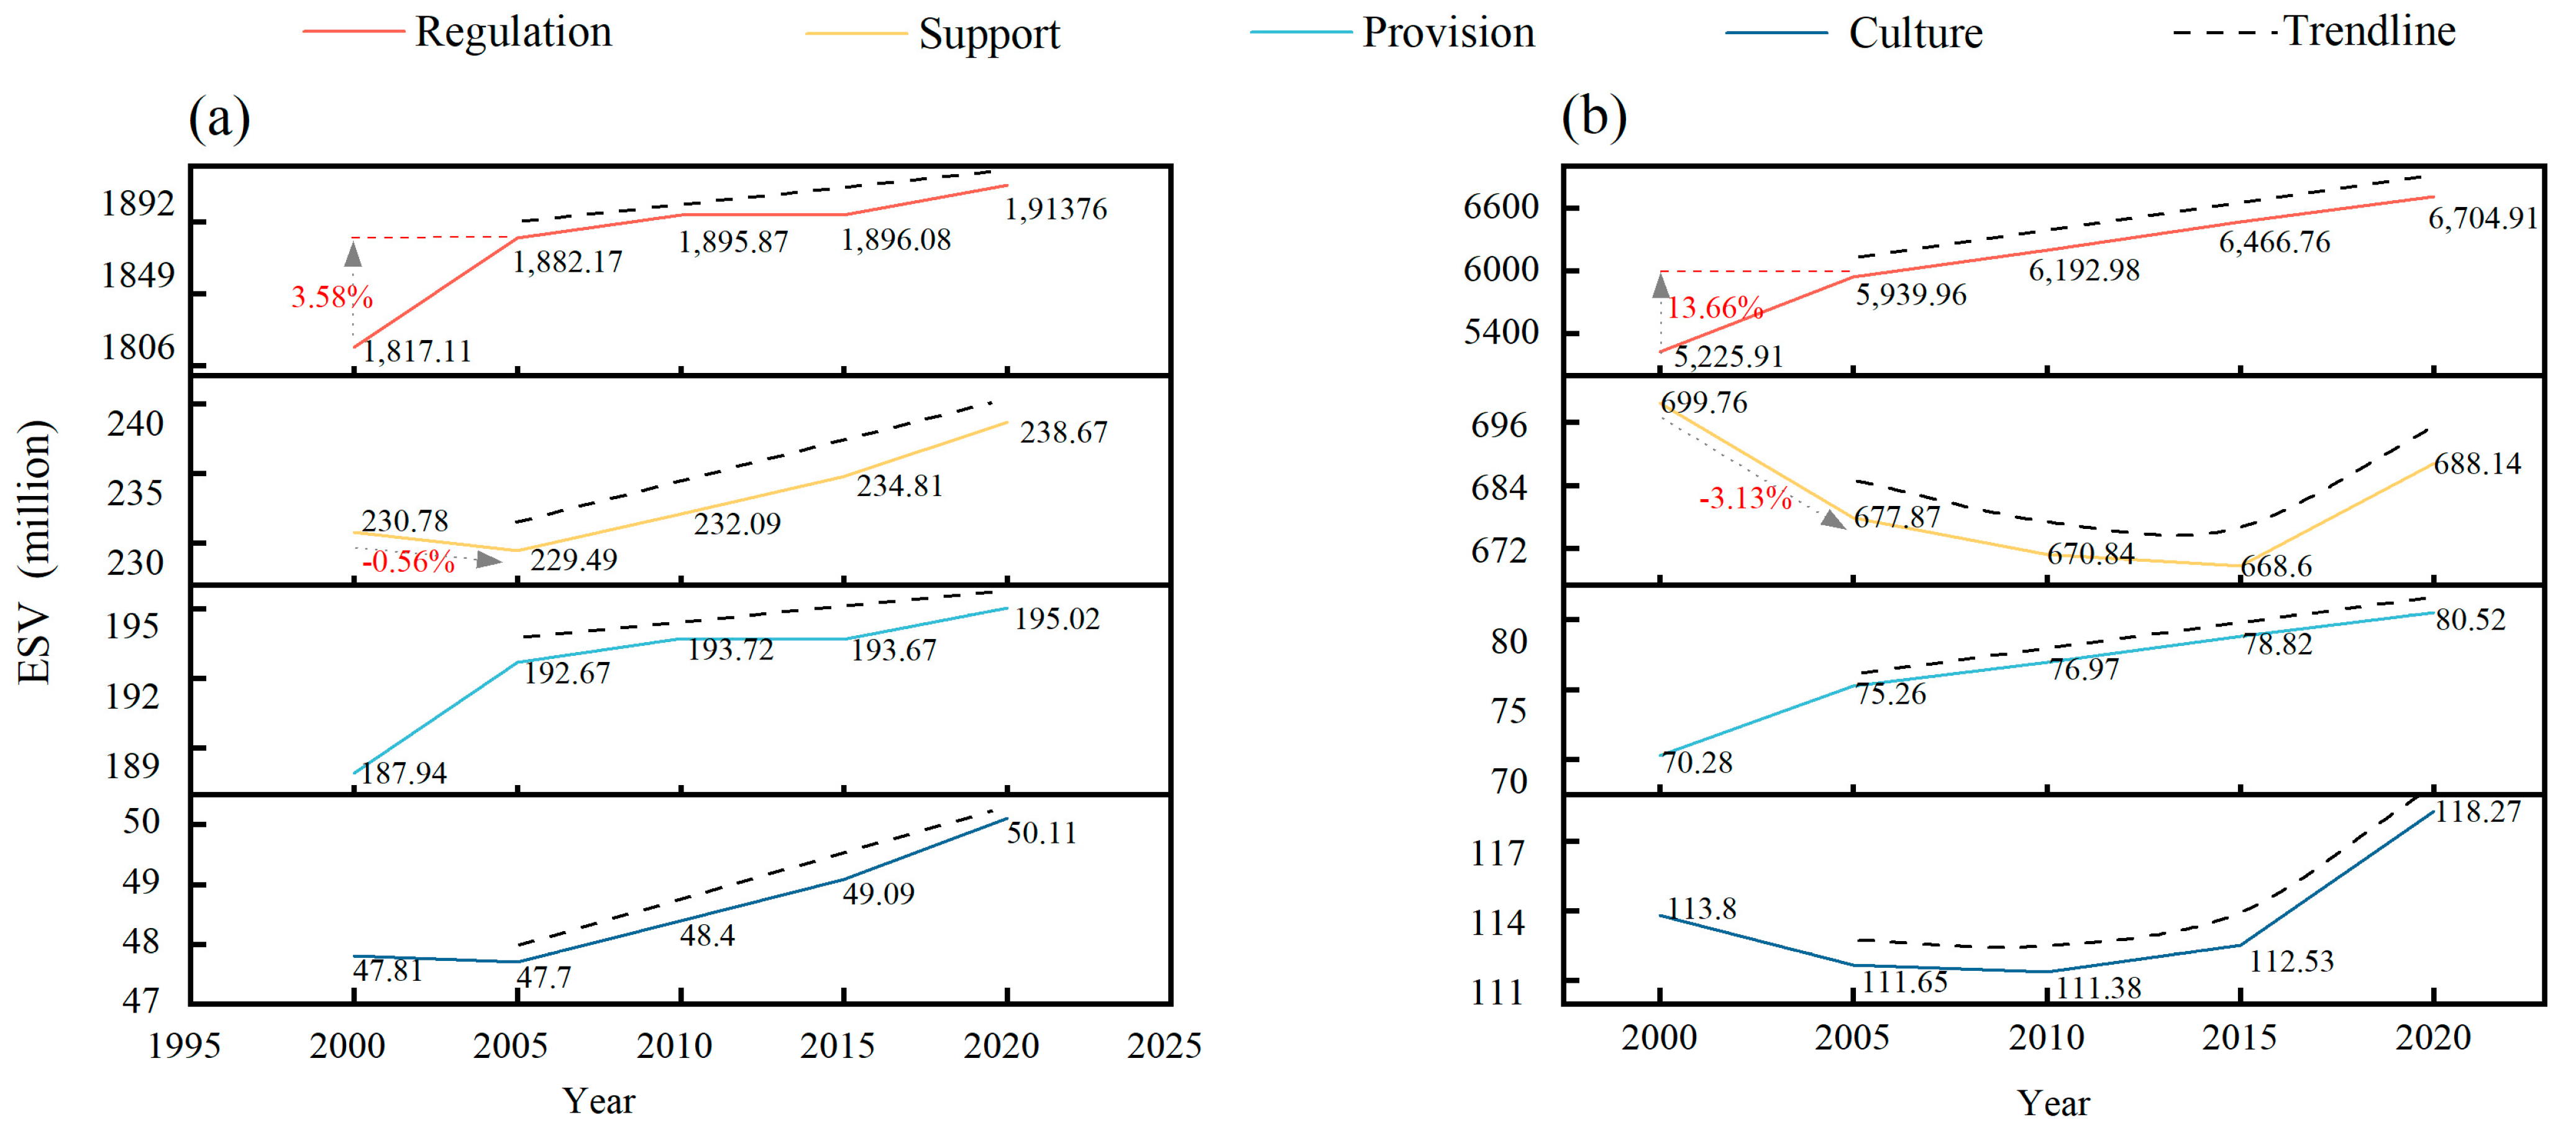
3.2. Temporal Dynamics of ESV

Figure 5 illustrates the distinct trajectories of ESV of the four primary ecological service categories within the Reserve (Figure 6a) and non-Reserve (Figure 6b) areas within Dongying City from 2000 to 2020. The report also examines the dynamics of four key categories of services: regulatory, support, provision, and cultural. The overall trend indicates an increase in regulatory services in both regions, with a more pronounced increase between 2000 and 2005. The value of regulatory services in non-Reserve areas exhibited a more rapid growth, with an annual increase of 13.66%, compared to a more moderate growth rate of 3.58 percent in Reserve areas. During the 2005–2020 period, the growth rate of regulatory services in both regions remained relatively stable, with the slope of the growth curve remaining unchanged. This indicates a continued enhancement of regulatory services in both regions, reaching a value of 1913.76 million by 2020 in the non-Reserve area and 6704.91 million in the Reserve area. In contrast, the two regions demonstrate disparate trends with respect to support services. The decline in the Reserve area was 0.56% year-on-year between 2000 and 2005 but has been followed by a period of recovery since 2005. In contrast, non-Reserve areas continued to decline from 2000 to 2015, with a year-on-year decline of 3.13% from 2000 to 2005. However, the downward trend eased from 2005 to 2015 and did not resume until 2015. In contrast, the decline in the value of support services in Reserve areas was less pronounced and recovered more rapidly. Supply services demonstrate consistent trends in both regions, with a more pronounced increase from 2000 to 2005 and a subsequent deceleration in the growth rate. Finally, cultural services exhibit greater volatility in the Reserve areas, declining between 2000 and 2005 and then recovering from 2005 onwards. In contrast, in non-Reserve areas, they reached a nadir of 111.38 million between 2000 and 2010 and then resumed an upward trajectory between 2010 and 2020, with an accelerating rate of growth.
Notwithstanding the considerable discrepancy in the aggregate ESV values between the two regions, the total ESV in the non-Reserve area was approximately three times that of the Reserve area, which was extensive. Comparison of the ESV per unit area results between the two regions (Figure 7) reveals that the total ESV per unit area in the Reserve area is significantly higher than in the non-Reserve area, which is approximately twice as much. The total ESV per unit area in both regions demonstrated an upward trajectory, with the largest absolute increase occurring during the 2000–2005 period, at 823.05 (USD/ha) and 1220.85 (USD/ha), respectively. In the Reserve area, the total ESV per unit area exhibited a notable rise from 0.022 (million/ha) in 2000 to 0.024 (million/ha). In 2000, the total ESV per unit area in the non-Reserve area was 0.010 (million/ha), which increased to 0.012 (million/ha) in 2020, representing a year-on-year increase of 24.05%. This growth is more significant in terms of both the absolute increase and the pace of growth. In both absolute increment and rate of increase, the growth effect of the non-Reserve area is more significant; however, there remains a considerable discrepancy between the total ESV per unit area of the non-Reserve area and that of the Reserve area.

3.3. Spatial Distribution and Center of Gravity Analysis of ESV

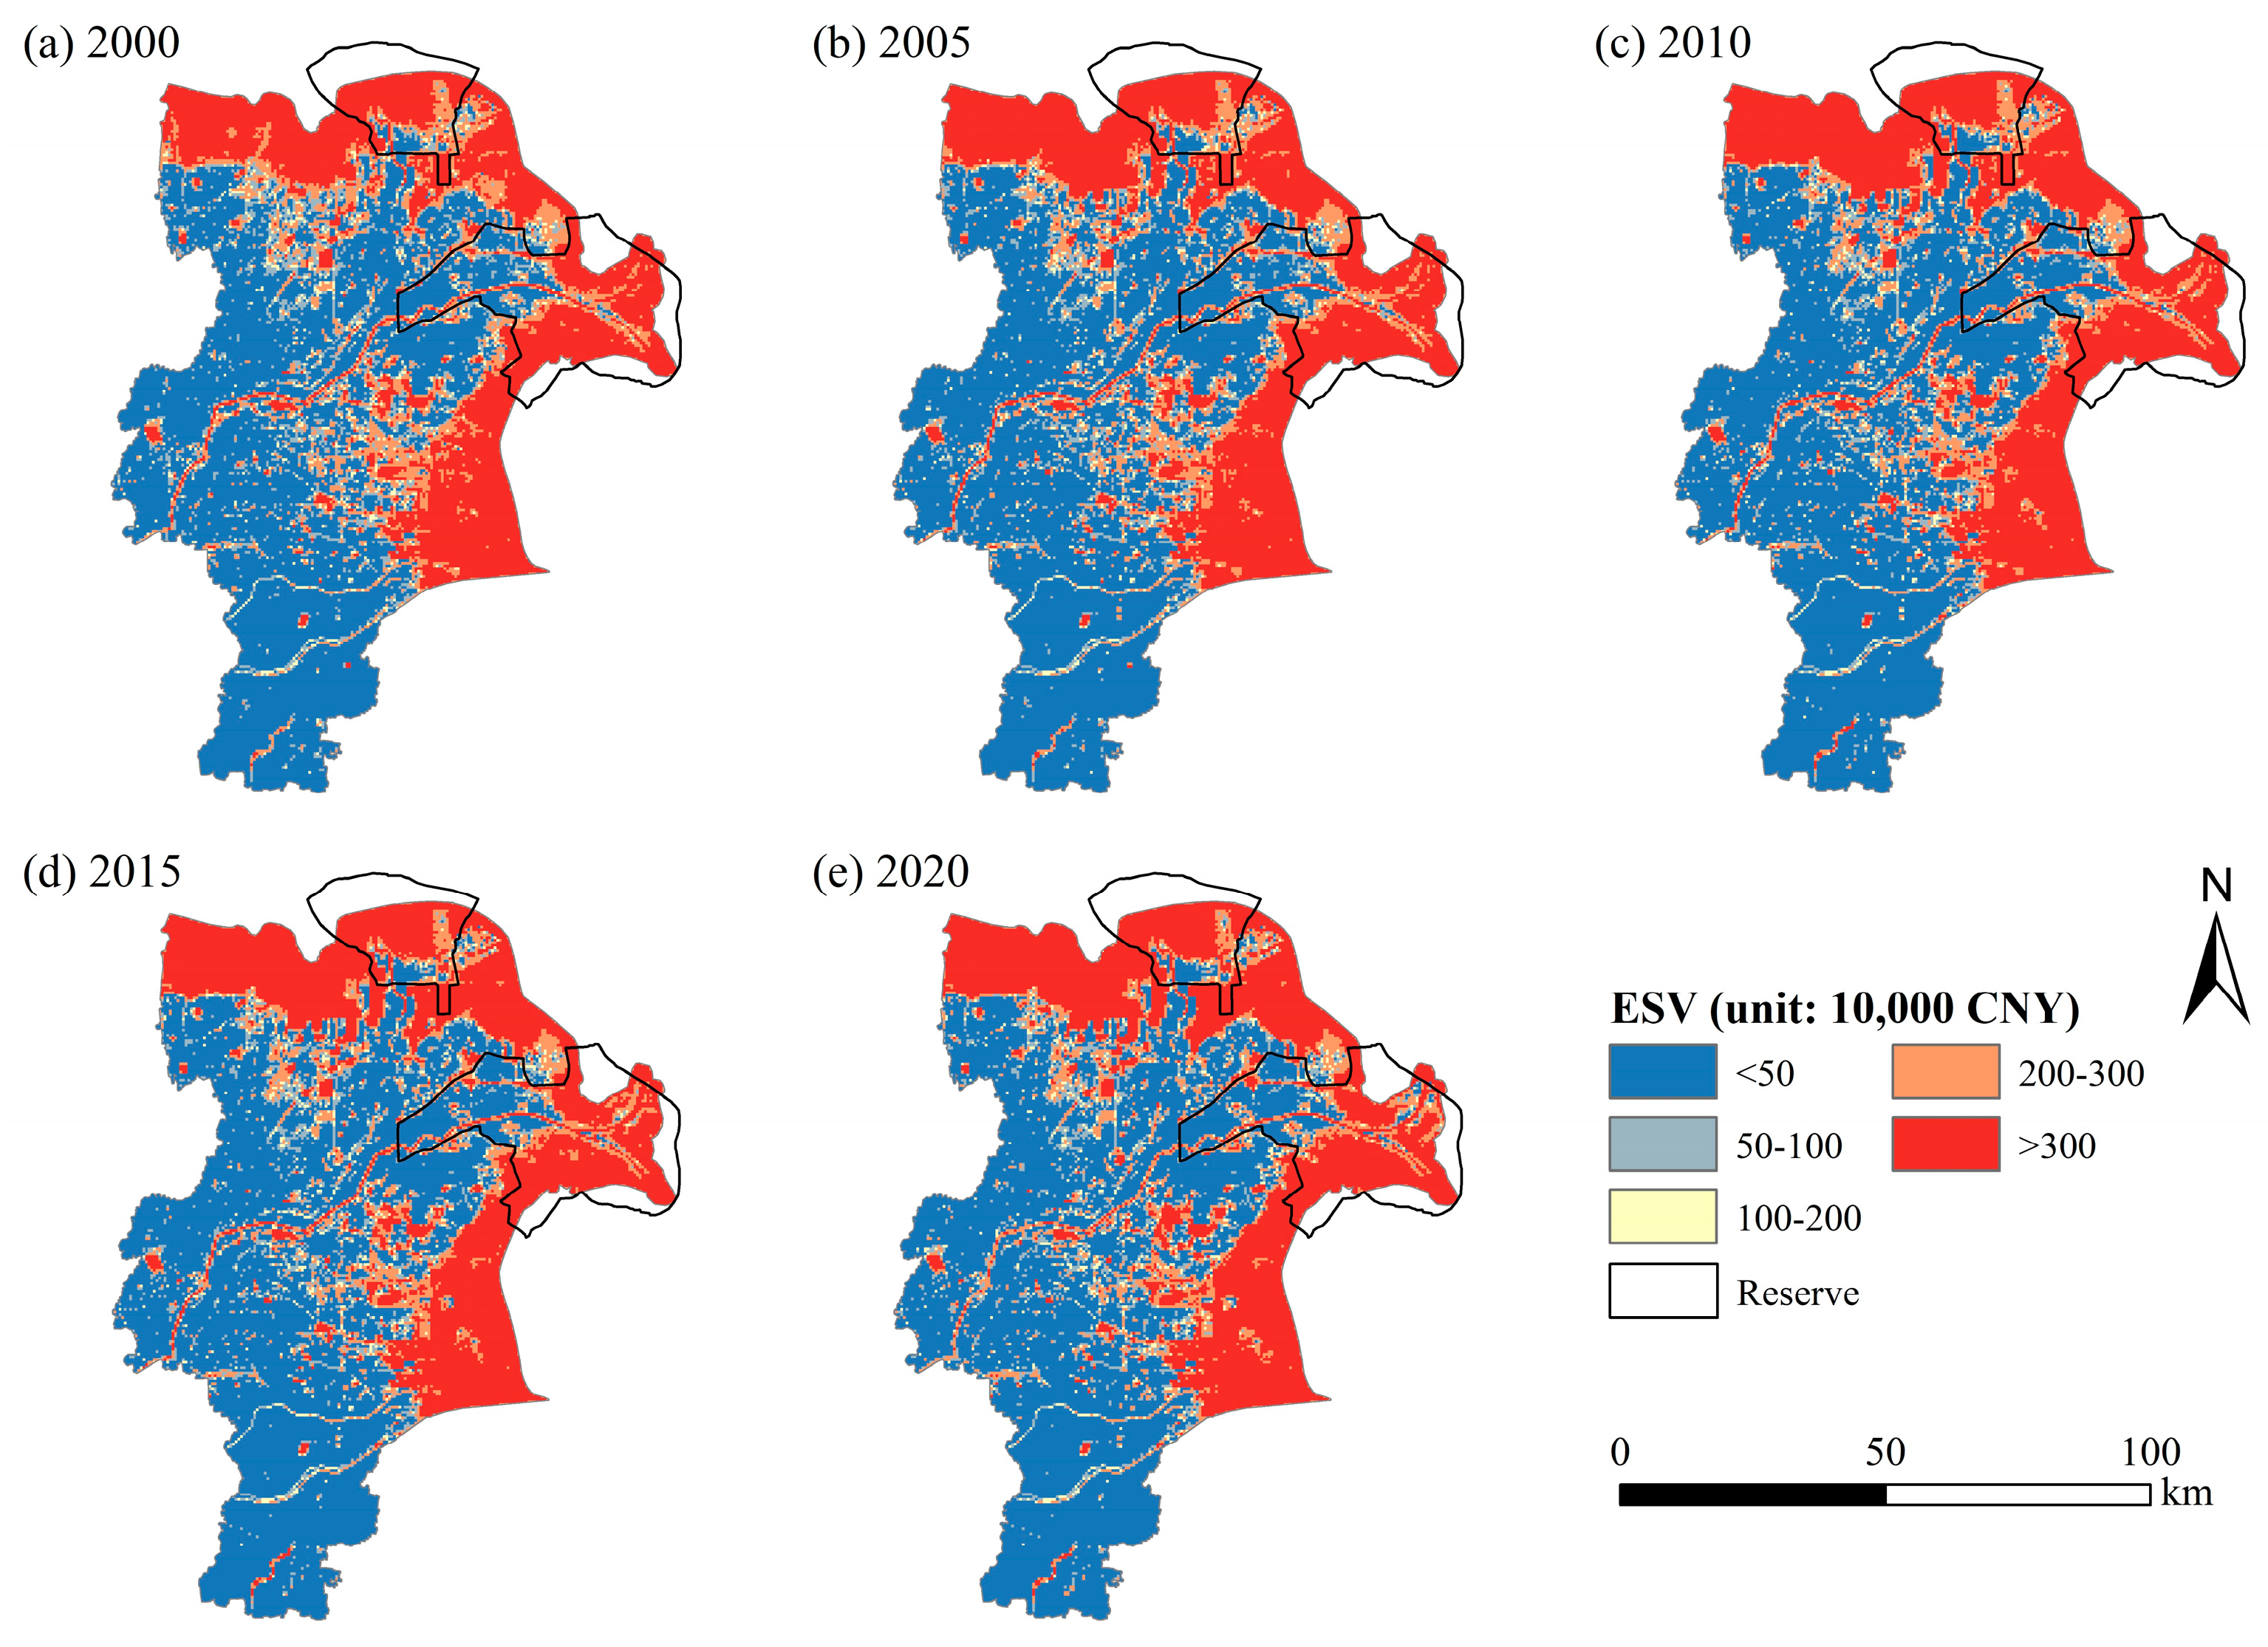
3.3.1. Spatial Distribution of ESV

A notable spatial distribution pattern emerged in the study area, with higher values predominantly located in the northeastern region and lower values concentrated in the southwest region (Figure 8). It is worth noting that the areas with high value were found to be closely aligned with the distribution of water bodies and wetlands (Figure 2). This distribution trend is particularly evident in Reserve areas, where the predominant land cover category is wetlands and water bodies. In contrast, the distribution of ESV in non-Reserve areas is characterized by low values, and these low-value areas correspond to regions where the land cover is arable land. The global spatial autocorrelation analyses demonstrated that the P-value was less than 0.01 in 2000, 2005, 2010, 2015, and 2020, with Moran’s I values reaching 0.881, 0.896, 0.901, 0.904, and 0.907, respectively. When the Moran’s I value exceeded 1, its larger value demonstrated a stronger positive spatial correlation. This suggests that the geographical spread of ESV in Dongying City has a significant positive correlation with high spatial aggregation. Furthermore, Moran’s I values were observed to increase year on year, which reveals that the spatial concentration of ESV in this region is still increasing. The clustering results (Figure 9) demonstrate the spatial aggregation features of ESV in Dongying City. A notable difference is observed between the ESV High–High and Low–Low clustering results, with the Low–Low clustering characteristics predominantly observed in non-Reserve areas. Conversely, the non-significant clustering areas and High–High areas in natural reserves account for a higher percentage. The High–High clustering areas are primarily concentrated in coastal areas.

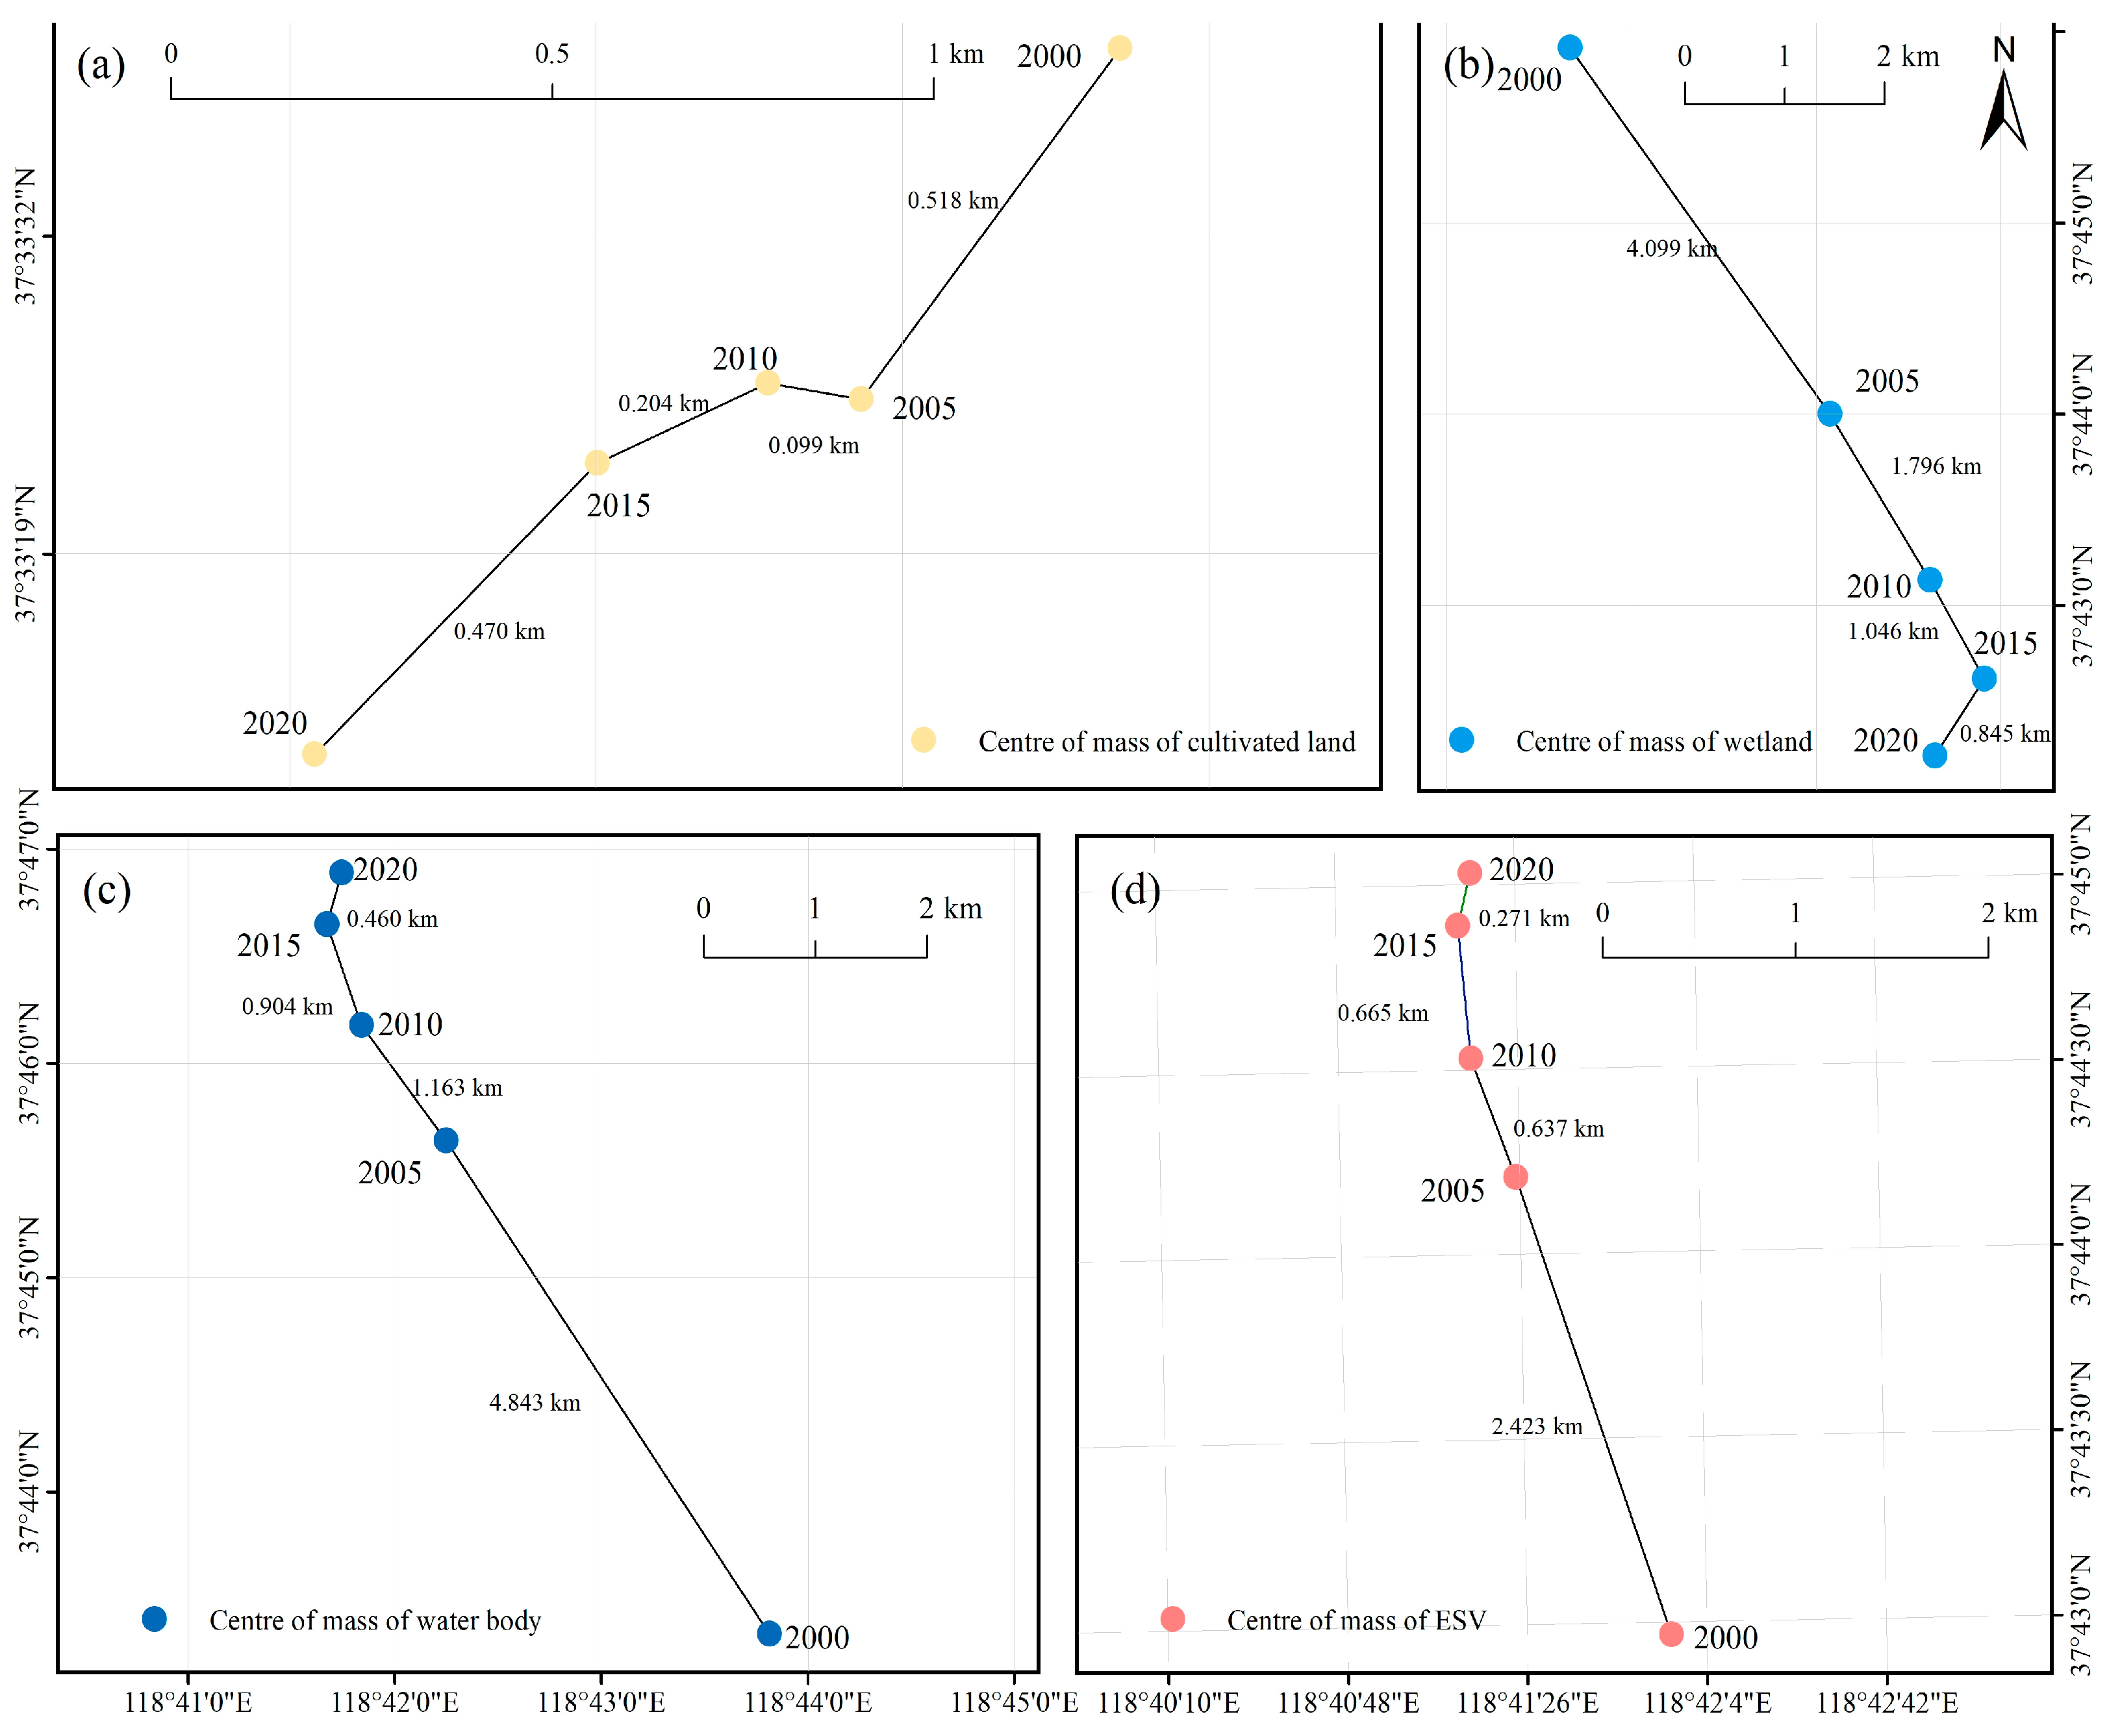
3.3.2. Analysis of ESV’s Center of Gravity

By analyzing the migration trend of the ESV’s center of gravity (Figure 10d) and the center of gravity of major land types in the Reserve area, it was found that the ESV’s center of gravity migrated towards the south in the initial period, and shifted southward by 0.470 km from 2000 to 2005, with a smaller change from 2005 to 2010, and then shifted in a northwesterly direction from 2010 onwards. The distance of the migration from 2010 to 2015 was 0.542 km, representing the largest distance for this period. The overall trend was towards the southwest, in the direction of the urban center of Dongying. The water body’s center of gravity (Figure 10c) initially migrated 1.097 km to the south and then migrated to the southwest, to the northwest, and then to the southwest again. The total distance migrated was longer than that of the ESV, with the distance migrated in each segment approximately twice that of the ESV. In contrast, the wetland’s center of gravity (Figure 10b) exhibited a northeasterly directional shift of 0.535 km from 2000 to 2005, followed by a southeasterly directional shift of 0.264 km from 2005 to 2010. Thereafter, it demonstrated a period of stability from 2010 to 2015, after which it exhibited a northwesterly directional shift of 0.412 km. Overall, the wetland’s center of gravity exhibited a migration trend towards the coastline. The center of gravity of cultivated land (Figure 10a) migrated approximately 0.55 km to the northwest from 2000 to 2010. Thereafter, its migration direction changed significantly, moving 0.75 km to the southeast. The center of gravity of other land types exhibited more significant fluctuations, whereas the center of gravity of arable land underwent two distinct phases of migration, resulting in a comparatively minor overall displacement.
The findings of the migration of ESV and major land cover category cores in non-Reserve areas demonstrate that water bodies (Figure 11c) and ESV cores (Figure 11d) continue to exhibit a similar migration trend, both moving towards the northwest. Additionally, the migration distance of water bodies is approximately twice as long as that of ESV. In the period between 2000 and 2020, the greatest distances migrated by both were observed between 2000 and 2005. The migration distances of water bodies and the ESV’s center of gravity were 4.843 km and 2.423 km, respectively. The migration of the wetland’s center of gravity (Figure 11b) can be partitioned into two phases. The first phase is characterized by a southeastward migration, with migration distances of 4.099, 1.796, and 1.046 kilometers. The second phase is a southwestern shift of 0.845 kilometers, indicating a continued overall direction of migration towards the coastal region. The direction of migration of the center of gravity of arable land in the non-Reserve region (Figure 11a) was contrary to the direction of ESV, with an overall migration of approximately 1.3 km to the southwest. The distance of migration per year was comparable to that observed in the Reserve region. The movement of the focus of arable land remained more stable across the whole of the 6,665,674,184 ha of non-Reserve land.
The migration of the ESV’s center of gravity is a dynamic process, as illustrated in Figure 12. From 2000 to 2020, the migration patterns of the ESV’s center of gravity for the four major categories of ES in Dongying City exhibited notable differences. There was a discernible tendency for the centers of gravity for regulatory and provision services to migrate in a northwesterly direction; the center of gravity for provision services exhibited a more pronounced northerly shift. It is worth noting that the migration distance during the initial phase was significantly greater than that observed during the subsequent phase for these two service types. Similarly, the centers of gravity for support services and cultural services exhibited comparable migration patterns, initially shifting southeast and subsequently migrating northeast. The migration distances for these two service types were also comparable to the first two, with the initial phase exhibiting greater distances than the subsequent phase. The centers of gravity of the ESV of all four service types were concentrated in the Kenli District, which serves to highlight the district’s pivotal role in providing ES. The mean rotational ellipse angle of the standard deviation for support services was lowest at 3.93°, while the rotational angles for the remaining three service types ranged from 155° to 180°, with an average of 164.07°. The rotation angles of the elliptical confidence intervals for all service types exhibited minimal variations over time. Moreover, the standard deviation ellipse areas of the four ES function ESV exhibited a consistent downward trend, indicating that all four ESVs were more aggregated at the regional level. This finding is corroborated by the results of the spatial autocorrelation exercise.

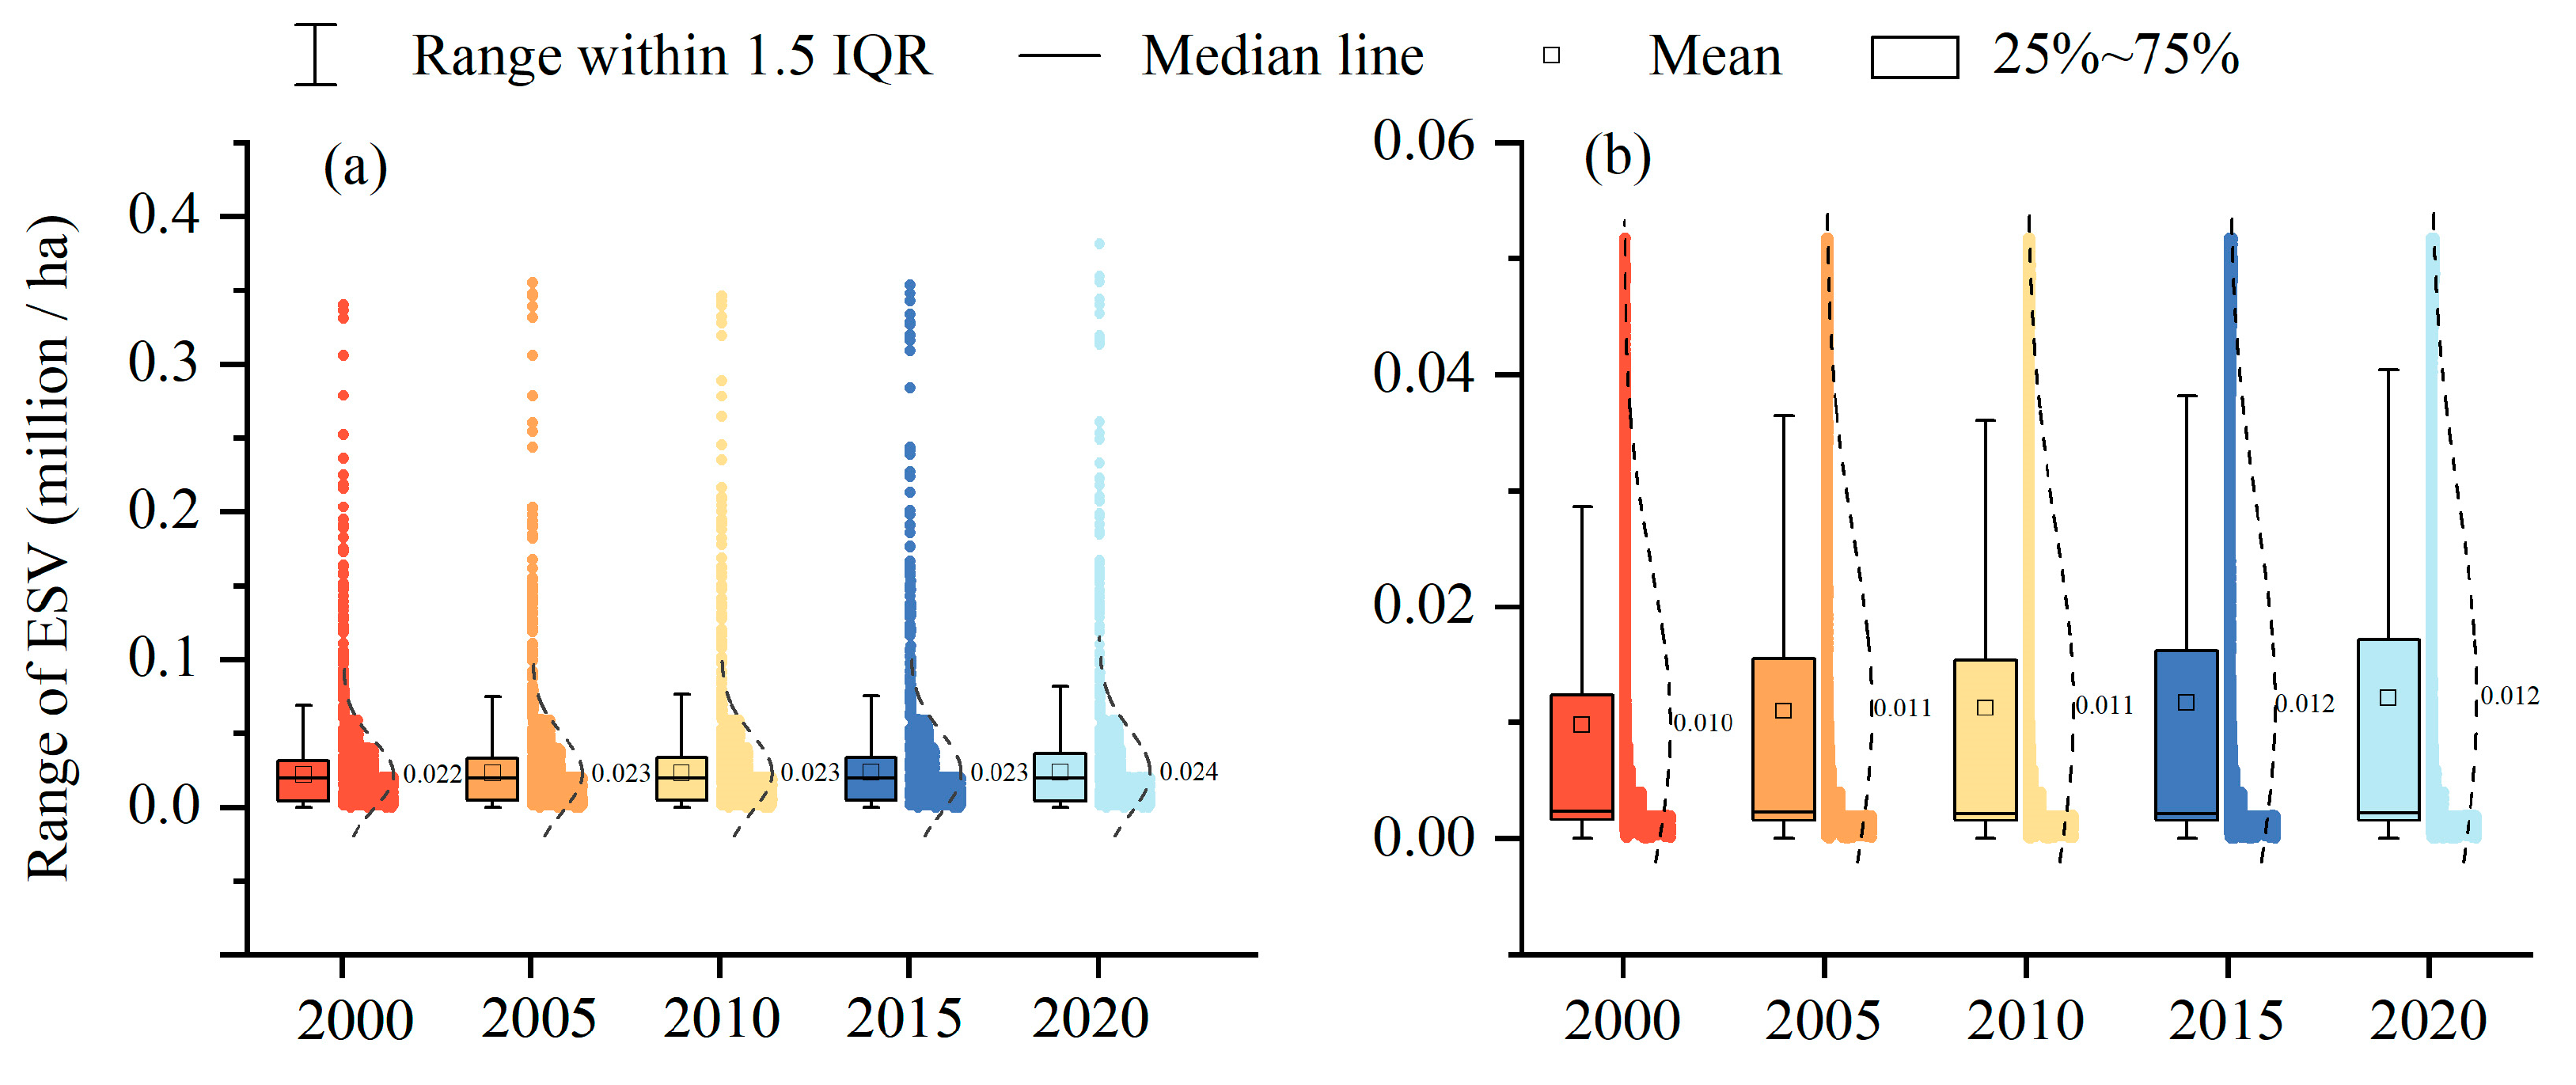
3.4. Sensitivity Analyses of the ESV

In order to evaluate the reliability of the ESV of Dongying City from 2000 to 2020, the constructed ES equivalency factor table was employed. To assess this, a sensitivity analysis was introduced. In accordance with the specifications outlined in Formula (12), the analysis entailed calculating the ESV by incrementally modifying the equivalency factors associated with distinct land use categories by a factor of 50% (Table 3).
The aforementioned results reflect a declining trend in the SI for cropland ESV, from 0.091 to 0.067. Similarly, the sensitivity indices for ESV for forests and grasslands also show a falling trend with lower values. The SI for water ESV is highest, with an average of 0.697, and there is an increasing trend that is followed by a decrease. The SI for cropland ESV displays an inverse pattern to that observed for water bodies, initially declining and then rising. The SI for bare land ESV follows a changing trend that is opposite to that of water bodies, initially exhibiting fluctuations before increasing. The SI for artificial land surfaces is zero, as it was not included in the ESV assessment. The evaluation reveals a positive and strong association between the SI of the ESV for different categories of land cover and the corresponding areas. It can be observed that the larger the area, the more sensitive it is to changes in the corresponding regulatory adjustments for ESV. Furthermore, the sensitivity indices of the various land use classes show a significant positive association with changes in area. Based on the above formula and the observed variations in the sensitivities, it can be concluded that the sensitivities for all land cover categories are below 1. According to the definition of the SI, this signifies that the adjusted ESV equivalency factor table for the period 2000–2020 is appropriate for calculating ESV in Dongying City, and the resulting calculations are reliable.

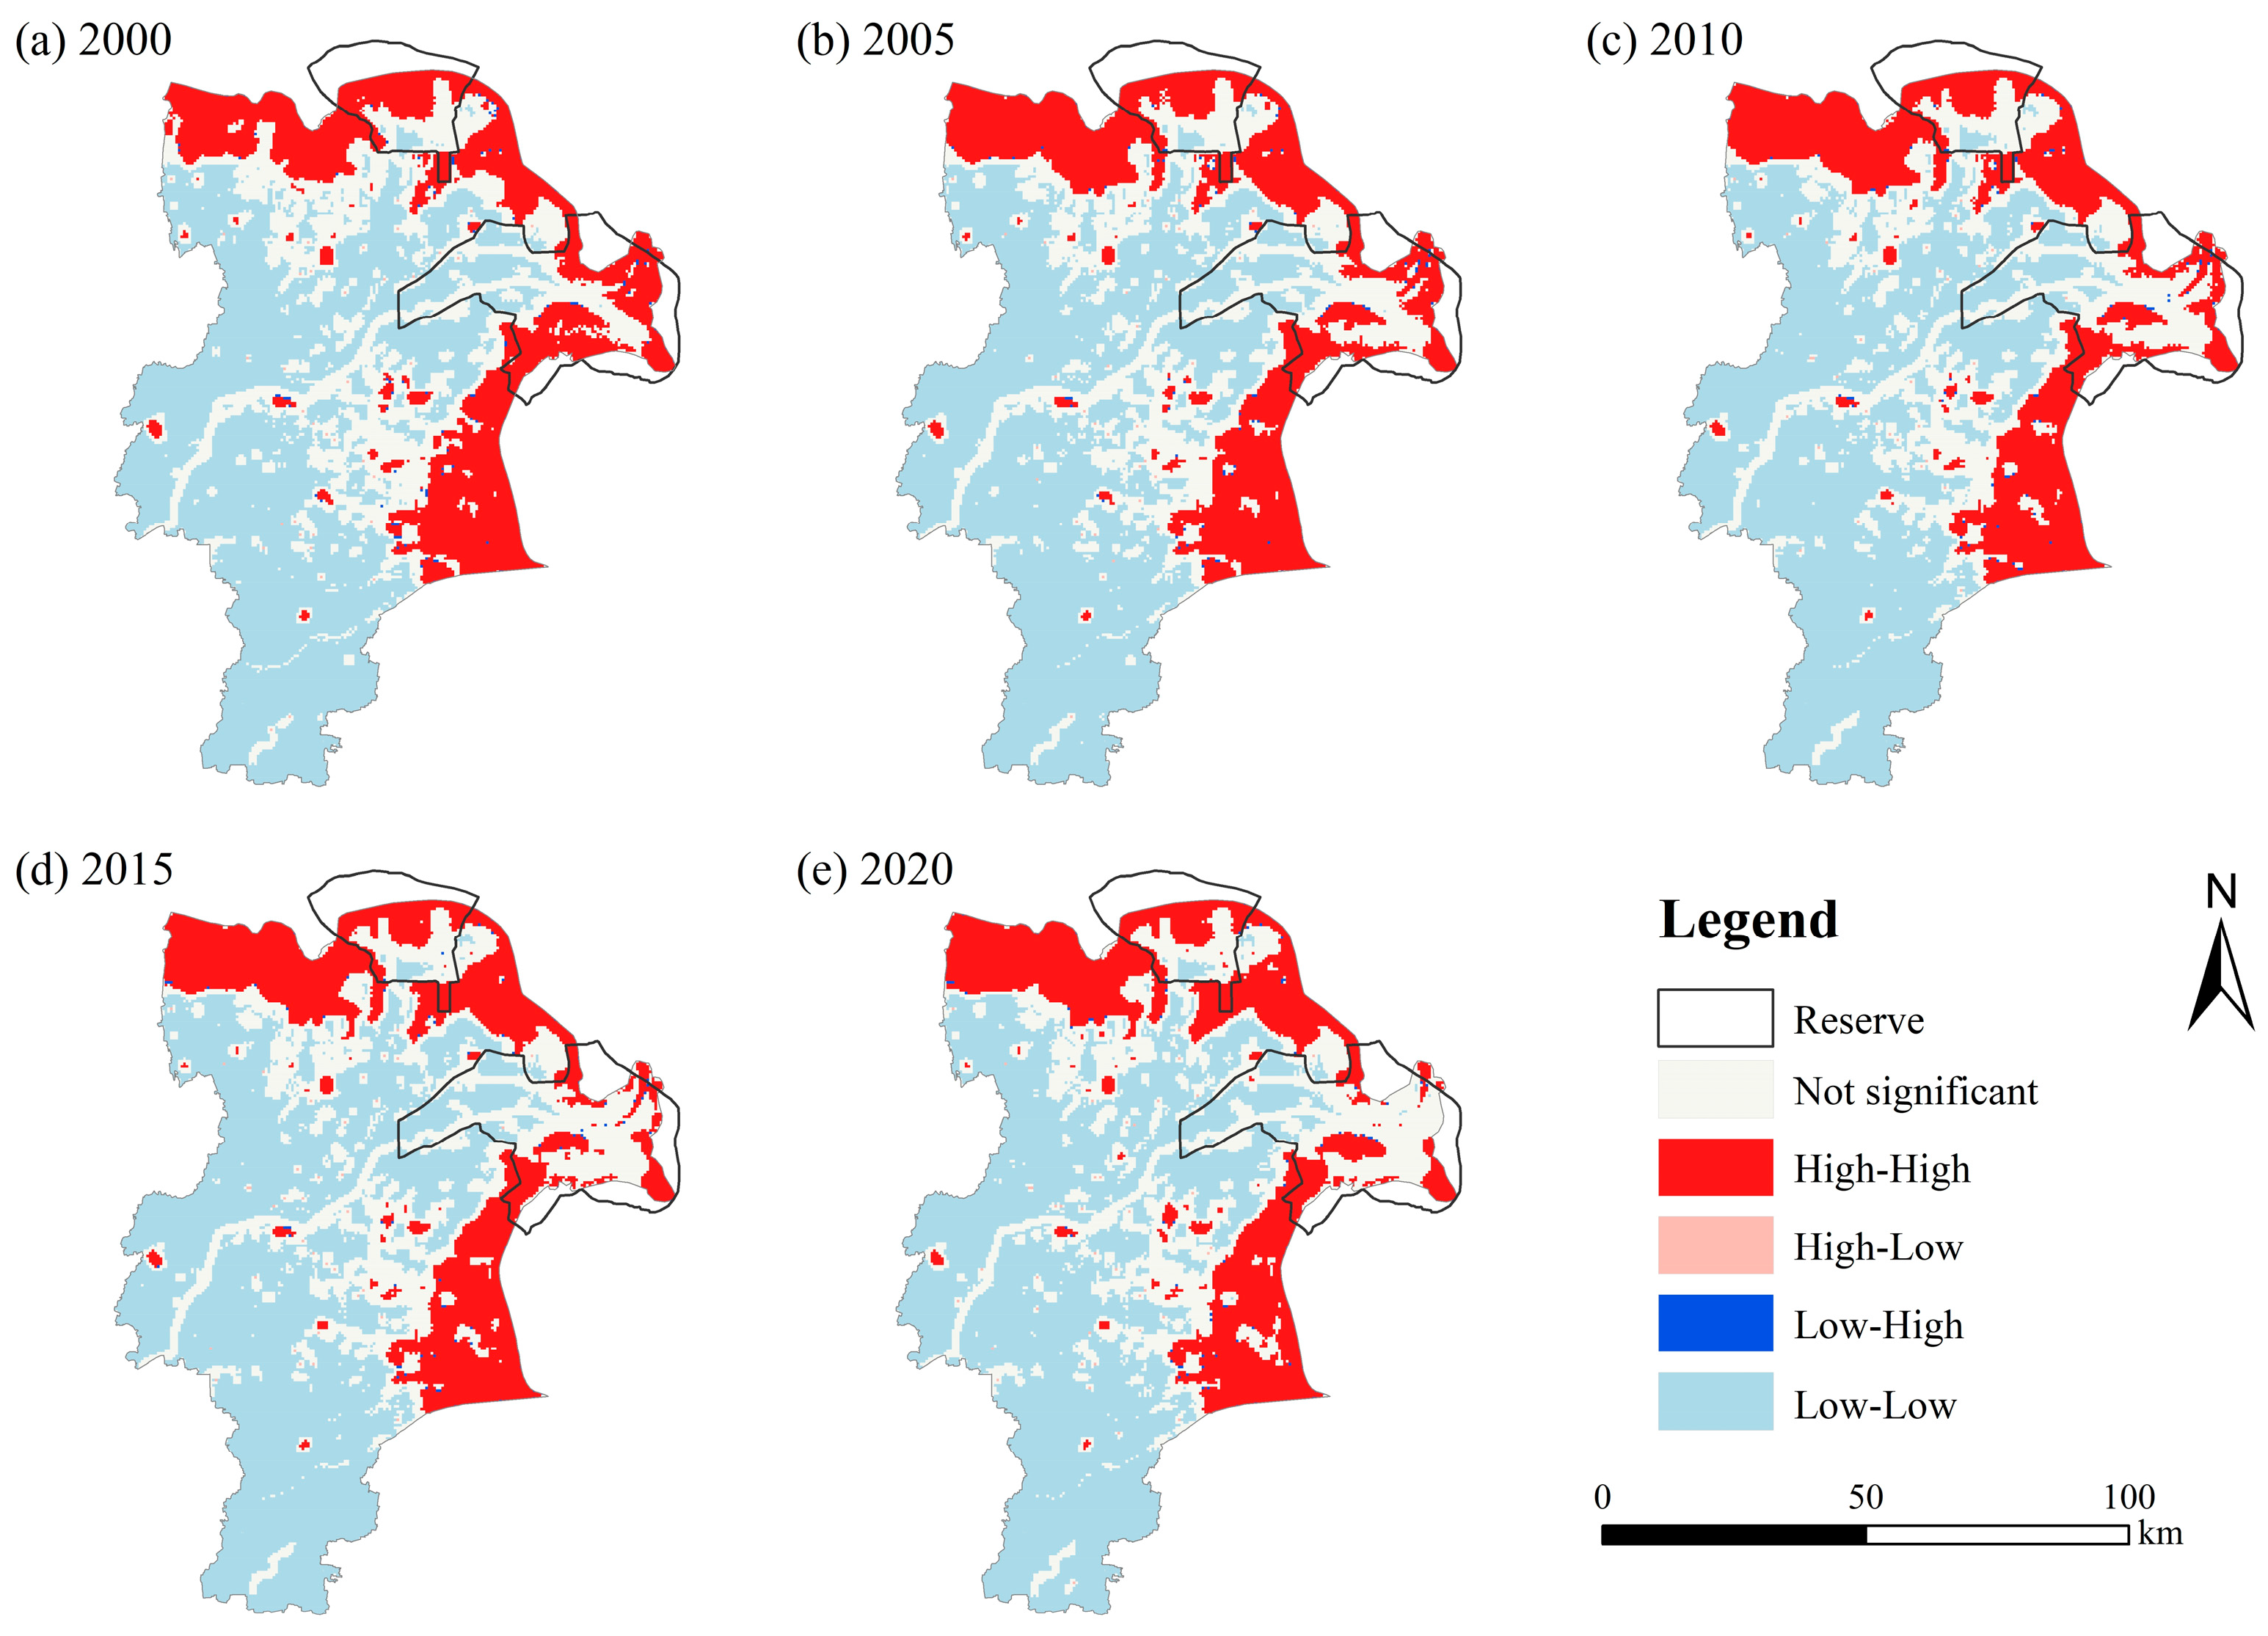
3.5. Analysis of the Drivers of Spatial Heterogeneity in ESV

3.5.1. Factor Detection

The drivers of ESV in Reserve and non-Reserve areas in the YRD were examined using the factor detection module within GD. Results highlighted the ability of both environmental and social economy factors to explain the heterogeneous spatial distribution of ESV. As shown in Table 4, there was considerable variability in the effect of the contributing variables on ESV. In light of the distribution of GDP and population data for Reserve areas, it was decided that the factors driving the detection of these two factors in Reserve areas should be removed. In the Reserve area, the explanatory power of q-statistics for the geographical heterogeneity of ESV was ranked as follows: the most significant explanatory variables were NDVI (X6), distance to railway (X4), DEM (X7), precipitation (X1), temperature (X2), distance to road (X5), and slope (X3). In contrast, the results sorted by q-statistics are as follows: NDVI (X6) was the most significant factor, followed by distance to railway (X4), precipitation (X1), temperature (X2), population (X9), distance to road (X5), GDP (X8), slope (X3), and DEM (X7). The contribution of NDVI (X6) was markedly higher than that of the other factors in both regions, accounting for 62.51% in Reserve and 73.89% in non-Reserve areas. In contrast, the contribution of DEM (X7) was more variable between the two regions, with a contribution of 22.29% in Reserve areas and only 0.90% in non-Reserve areas.

3.5.2. Interaction Detection

The findings of the interaction factor analysis were utilized to ascertain whether combining any two given factors would serve to augment or diminish the descriptive power of their respective influences on the geographic spread of ES. The results indicate that the interaction between any two factors exceeds the explanatory power of a single factor (Figure 13), both in Reserve and non-Reserve areas. Furthermore, the results indicate that all factors either enhance each other synergistically or exhibit non-linear interactions. The statistical analysis demonstrated that in the Reserve area, five pairs of factors exhibited non-linear enhancement, while 16 pairs exhibited two-factor enhancement. In the non-Reserve area, 16 pairs demonstrated non-linear enhancement, while 20 pairs exhibited two-factor enhancement. The discrepancy in the number of these two categories of interaction enhancements is more pronounced in the Reserve area, indicating that factor interactions in this region are more intricate, with a greater prevalence of non-linear relationships. Any minor change could result in significant fluctuations in the system, thereby rendering it more challenging to predict future developments in this area.
In the Reserve interaction analysis, the q-value of X6∩X5 reached 0.66, indicating that the interaction between NDVI (X6) and distance to road (X5) was dominant and had the strongest explanatory power for the spatial heterogeneity of ESV. Subsequently, the correlations between NDVI (X6), temperature (X2), slope (X3), and precipitation (X1) were investigated. These results demonstrated that under conditions of consistent dominance of NDVI (X6), temperature (X2) emerged as a key factor influencing the spatial distribution of ESV in the Reserve region. The highest q-value was identified among the non-Reserve interaction results, with a value of 0.77 for X6∩X9. The interaction between NDVI (X6) and population (X9) had the greatest explanatory power and was the dominant factor in the region. The interaction between these two factors was found to be significantly more powerful than the explanatory power of the population (X9) when considered alone. Furthermore, the explanatory powers of factors such as distance to road (X5), distance to railway (X4), GDP (X8), and population (X9) were markedly stronger when interacting with other factors in the two regions. This result underlines the crucial role of socio-economic conditions and management of catchments in shaping the spatial distribution of ESV.

4. Discussion

4.1. Changes in ESV and LULC

Most of the existing studies on the synergistic association between LUCC and ESV are limited to qualitative analyses based on spatial distribution maps [57,58,59], making it difficult to reveal their dynamic evolution. In addition, the extant literature on this subject typically focuses on a specific area, whether it is categorically protected [60,61] or unprotected [2,62]. However, a comparative analysis of temporal and spatial trends, as well as interactions between the two categories, is generally lacking in these studies. Therefore, this study used the center-of-mass transfer method to conduct a comparative study of the transfer trends of ESV and major land use types in Reserve and non-Reserve areas in Dongying City.
The spatial distribution map (Figure 8) and the results of the spatial autocorrelation analysis demonstrate that the distribution of ESV exhibits a strong correlation with the categories of land use (Figure 2). The Reserve region is located in the northeastern part of Dongying City, and its water ecosystem area is 58.82% higher than that of the non-Reserve area (27.21%), while the artificial surface area is 0.28%, which is significantly lower than that of the non-Reserve area (7.72%). This disparity in ESV per unit area between the two regions was found to be significant, with ratios of approximately 0.023 and 0.011 (million/ha), respectively. Regulatory services > Supporting services > Provision services > Cultural services in relation to the composition of ESV in both regions, which is consistent with the results of Lu [63]. The YRD is distinguished by its rich aquatic ecosystem, which possesses notable capabilities in terms of water purification, flood regulation, and climate regulation. Consequently, the regulatory services within this ecosystem are of paramount importance. In contrast, supporting services are more susceptible to the impact of human activities. The development of the region has been accompanied by activities such as overfishing and irrational agricultural development, which have disrupted the supply balance of the natural ecosystem. This has led to a clear difference in the inter-annual trend of supply services between the two regions. Since 2005, the value of supporting services in the Reserve area has been on the rise (Figure 6a), while the decline in the non-Reserve area continued until 2015 (Figure 6b). The cultural services in the region are at their lowest level, indicating a lack of adequate cultural tourism facilities, professional cultural promotion teams, and other related infrastructure. It is evident that the value of cultural services is not fully reflected in the current system. In order to address this issue, it is essential that the management and planning of this area are strengthened in the future.
The results of the center of gravity analysis demonstrate that the center of gravity of ESV in Reserve regions shifted towards the southwest (Figure 10d), and the center of gravity of ESV in non-Reserve regions shifted towards the northwest (Figure 11d). While there were some differences in the trend of the center of gravity of ESV within the two areas, they were all consistent with the trend of the center of gravity of their respective water bodies shifting towards the urban center. In relation to the configuration of land structures, cultivated land constitutes the primary source of water body and wetland transfer, in comparison with Reserve regions, with regard to both the distance of the center of gravity transfer and the proportion of area. The alterations in land structures within non-Reserve areas are more substantial [64,65,66]. A significant expansion in the area dedicated to construction, coupled with a substantial contraction in the area covered by cultivated land, has profoundly impacted ES, which is in alignment with the findings of studies conducted by scholars such as Wang [59]. The expansion of non-Reserve areas into large-scale urbanization and industrial development areas has been driven by the demand for economic growth, resulting in significant occupation of arable land and ecological space compression.
Notwithstanding the establishment of boundaries between Reserve and non-Reserve areas, the ESV remains predominantly shaped by human needs, thereby reflecting an inherent imbalance between ecological protection and economic development. In Reserve areas, the Development Plan for the YRD High-Efficiency Ecological and Economic Zone, implemented by the Shandong government in 2008, has provided policy support for the restoration of wetlands and water bodies, effectively enhancing ecological regulation services such as water supply, climate regulation, and environmental purification. Conversely, non-Reserve areas have been found to be deficient in this regard, and the ESV is more susceptible to the urbanization process and industrial development. To enhance the sustainability of the region, it is imperative to promote coordinated development of ecological protection and economic development based on the characteristics of the two regions.

4.2. ESV Driver Analysis

ESV is associated with vegetation distribution, climatic conditions, and ecological structure [67,68]. The results of the GD indicate that the primary factor influencing ESV in the YRD region was NDVI, with an explanatory power of 62.51% and 73%. This indicates that vegetation distribution is the most critical feature influencing the spatial distribution of ESV, with an explanatory power of 89% in the two regions. These findings align with those of Kang Lei and colleagues’ study conducted in the six-province region of Northwest China [69]. The distance from the railway is also a significant consideration. The influence of terrain differs considerably between Reserve and non-Reserve regions. The explanatory power of climate is more stable in the two regions, and both factors play a non-negligible role. This is consistent with the conclusion of He [70], who found that climatic conditions have a significant influence on ESV. In non-Reserve regions, the effect of economic and social variables, such as population and GDP, became evident, particularly the interaction between population and NDVI, which demonstrated a stronger explanatory power. This suggests that settlement density has a marked moderating and limiting effect on the geographical distribution of ESV in non-Reserve areas, where the impact of anthropogenic activities is more pronounced [1].
Furthermore, it is imperative to consider the impact of policy factors on the ESV. The implementation of environmental protection and land planning policies in disparate regions has the capacity to directly or indirectly modify land use patterns. These alterations, in turn, exert an influence on the ESV. The Chinese government has proposed the policy of returning farmland to forests since 1998 [71]. The initial implementation of this policy resulted in a significant decrease in arable land, leading to a substantial decline in food production and the value of provision services provided by the production of raw materials. This decline also explains why the value of the four services changed most significantly in 2000–2005 (Figure 6). Technological advances, such as more efficient agricultural technologies, should also be considered, as they may reduce the pressure on arable land and the ESV to a certain degree. Concurrently, technological progress, exemplified by the enhanced efficiency of agricultural techniques, has the potential to mitigate the pressure on cultivated land to a certain extent, thereby enhancing the ESV. In terms of environmental protection policies [72], Reserve areas are usually subject to more stringent and comprehensive protection policies, such as restrictions on development activities, strict land use planning, and intense ecological monitoring and protection measures. The overarching objective of these policies is to preserve the integrity of ecosystems in their pristine state, whilst concurrently promoting the conservation of biodiversity and the stable performance of ecological functions. Conversely, environmental protection policies in non-Reserve areas are less stringent, often permitting a certain degree of economic development and human activities.
The results reveal that the variation in ESV across space is shaped by the complex interplay of environmental and economic factors. Notably, there are pronounced differences between the Reserve and non-Reserve regions. In natural Reserves, ecological factors exert a dominant influence, whereas in non-Reserve areas, the impact of socio-economic factors gradually increases. This indicates the necessity for the implementation of regionally targeted protection and restoration strategies, with consideration for inter-regional variability.

4.3. Recommendations and Limitations

This study successfully revealed the spatial distribution characteristics and some key drivers of ESV in the YRD, providing an important scientific basis for regional ecological protection and sustainable development. However, it is not without its limitations, which provide directions and ideas for follow-up studies.
Despite the identification of the primary drivers of ESV in the YRD region, including LUCC and NDVI, in this study, the complexity of the regional ecosystem precluded the consideration of all potential drivers and their interactions. Furthermore, micro factors, such as changes in the soil microbial community, and socio-economic factors, such as the awareness of ecological conservation and the behavior of the local population, were not fully explored. This may result in an incomplete understanding of the mechanisms of ESV change. The study primarily relied on public remote sensing data, which facilitates rapid acquisition of large-scale information but lacks the capacity to accurately reflect the microscopic characteristics of the ecosystem and ecological processes. Additionally, it is deficient in complementing the findings from field research and integrating multi-source data, consequently impacting the study’s precision and comprehensiveness. Furthermore, the present study focuses exclusively on Dongying City, the core area of the YRD, while disregarding the intricate material circulation and energy flow processes between the surrounding transition zone and the core area. This includes the water quality and quantity in the neighboring rivers, as well as the indirect impact of human activities on the ES and ESV of the delta wetlands. Consequently, this restricts the study’s ability to comprehensively reflect the integrity of the ecosystems of the entire YRD and the dynamic changes in ESV.
The potential exists for the enhancement of future research in a number of ways. Firstly, the research scope of the drivers should be expanded to include more micro-ecological factors. Secondly, field research should be actively carried out, and multi-source data should be combined to improve the accuracy and reliability of the study. Furthermore, the scope of the study should be expanded to include the neighboring transition zones in the research system and a more comprehensive regional ecosystem model should be constructed so as to gain a deeper and more comprehensive understanding of the formation mechanism and dynamic change law of ESV in the YRD, and to provide a more solid theoretical support for regional ecological protection and sustainable development.

5. Conclusions

A detailed analysis of LULC and ESV dynamics in both Reserve and non-Reserve regions of the YRD highlights the relationship between key drivers and mechanisms, providing a theoretical basis for optimized management and a coordinated strategy for the basin. The survey results demonstrated that the center of gravity of ESV in the Reserve area migrated with the center of gravity of the water body to the non-Reserve area, highlighting the key role of watershed ecosystems on ESV and revealing that ESV is driven by human demand, and moreover, ES demand be regulated by NDVI, population density, and road construction. In conclusion, this analysis enriches the spatiotemporal analysis of ES supply, request, and balance of the YRD through quantitative and time-varying analyses, and the driving force analysis provides targeted management support for ES management in both Reserve and non-Reserve areas.

Author Contributions

Q.X.: Methodology, Software, Formal analysis, Writing—original draft preparation; Z.Z.: Methodology, Software, Formal Analysis; X.L.: Methodology, Resources; Z.W.: Investigation, Data curation; C.R.: Data curation, Writing—review and editing; T.X.: Investigation, Visualization; G.S.: Software, Validation; L.H.: Conceptualization, Writing—review and editing, Supervision. All authors have read and agreed to the published version of the manuscript.

Funding

This research was supported by the Natural Science Foundation of Shandong Province, grant numbers ZR2020MD018 and ZR2020MD015; and by the National Natural Science Foundation of China, grant number 42171413.

Institutional Review Board Statement

Not applicable.

Data Availability Statement

The original contributions presented in this study are included in the article. Further inquiries can be directed to the corresponding authors.

Acknowledgments

We would like to thank the editor and reviewers for improving the manuscript.

Conflicts of Interest

The authors declare no conflicts of interest.

Abbreviations

The following abbreviations are used in this manuscript:
YRDYellow River Delta
ESVecosystem service value
ESecosystem service
LULCland use and land cover
LUCCland use and cover change
ReserveYRD National Nature Reserve
Non-ReserveNon-Nature Reserve
GDGeographical Detector
NDVInormalized difference vegetation index
SDEStandard deviation elliptic
SISensitivity Index

References

  1. Ai, M.; Chen, X.; Yu, Q. Spatial correlation analysis between human disturbance intensity (HDI) and ecosystem services value (ESV) in the Chengdu-Chongqing urban agglomeration. Ecol. Indic. 2024, 158, 111555. [Google Scholar] [CrossRef]
  2. Yang, Y.; Song, G.; Lu, S. Study on the ecological protection redline (EPR) demarcation process and the ecosystem service value (ESV) of the EPR zone: A case study on the city of Qiqihaer in China. Ecol. Indic. 2020, 109, 105754. [Google Scholar] [CrossRef]
  3. Teshome, D.S.; Tolessa, T.; Gemeda, D.O.; Taddese, H.; You, S. Impact of land use/land cover (LU/LC) changes on ecosystem service values in Muger Sub-basin, Upper Blue Nile Basin, Ethiopia. Environ. Chall. 2024, 17, 101041. [Google Scholar] [CrossRef]
  4. Peng, K.; Jiang, W.; Wang, X.; Hou, P.; Wu, Z.; Cui, T. Evaluation of future wetland changes under optimal scenarios and land degradation neutrality analysis in the Guangdong-Hong Kong-Macao Greater Bay Area. Sci. Total Environ. 2023, 879, 163111. [Google Scholar] [CrossRef] [PubMed]
  5. Liu, S.; Liu, J.; Shang, S. Attribution of climate change and human activities to spatiotemporal changes of ecological service value in Yunnan Province of China. Glob. Ecol. Conserv. 2024, 55, e03221. [Google Scholar] [CrossRef]
  6. Wang, H.; Wu, R.; Liu, Q. Spatial Spillover Effects of Ecosystem Service Values in Northeast China Tiger and Leopard National Park Based on Spatial Durbin Model Analysis. Available at SSRN 4858573. 2024. Available online: https://xs.gupiaoq.com/scholar?q=Spatial+Spillover+Effects+of+Ecosystem+Service+Values+in+Northeast+China+Tiger+and+Leopard+National+Park+Based+on+Spatial+Durbin+Model+Analysis (accessed on 2 February 2025).
  7. Duan, H.; Yu, X. Linking landscape characteristics to shorebird habitat quality changes in a key stopover site along the East Asian–Australasian Flyway migratory route. Ecol. Indic. 2022, 144, 109490. [Google Scholar] [CrossRef]
  8. Chen, K.; Cong, P.; Qu, L.; Liang, S.; Sun, Z. Wetland degradation diagnosis and zoning based on the integrated degradation index method. Ocean Coast. Manag. 2022, 222, 106135. [Google Scholar] [CrossRef]
  9. Shifaw, E.; Sha, J.; Li, X.; Bao, Z.; Zhou, Z. An insight into land-cover changes and their impacts on ecosystem services before and after the implementation of a comprehensive experimental zone plan in Pingtan island, China. Land Use Policy 2019, 82, 631–642. [Google Scholar] [CrossRef]
  10. Sun, R.; Tian, Y.; Wang, X.; Mao, Y.; Qin, L.; Wu, D.; Li, S. Quantitative assessment of ecological restoration project benefits at long-term time series monitoring: Ling River Basin, Northern China—A case study. Ecol. Front. 2024, 45, 225–238. [Google Scholar] [CrossRef]
  11. Sannigrahi, S.; Chakraborti, S.; Joshi, P.K.; Keesstra, S.; Sen, S.; Paul, S.K.; Kreuter, U.; Sutton, P.C.; Jha, S.; Dang, K.B. Ecosystem service value assessment of a natural reserve region for strengthening protection and conservation. J. Environ. Manag. 2019, 244, 208–227. [Google Scholar] [CrossRef]
  12. Liu, F.; Lu, R.; Wu, C. Grassland ecosystem service value in the Tibetan Plateau has not recovered during 1995–2015. Glob. Ecol. Conserv. 2024, 55, e03248. [Google Scholar] [CrossRef]
  13. Shao, Y.; Xiao, Y.; Kou, X.; Sang, W. Sustainable land use scenarios generated by optimizing ecosystem distribution based on temporal and spatial patterns of ecosystem services in the southern China hilly region. Ecol. Inform. 2023, 78, 102275. [Google Scholar] [CrossRef]
  14. Moody, R.; Geron, N.; Healy, M.; Rogan, J.; Martin, D. Modeling the spatial distribution of the current and future ecosystem services of urban tree planting in Chicopee and Fall River, Massachusetts. Urban For. Urban Green. 2021, 66, 127403. [Google Scholar] [CrossRef]
  15. Zhong, J.; Cui, L.; Deng, Z.; Zhang, Y.; Lin, J.; Guo, G.; Zhang, X. Long-Term Effects of Ecological Restoration Projects on Ecosystem Services and Their Spatial Interactions: A Case Study of Hainan Tropical Forest Park in China. Environ. Manag. 2024, 73, 493–508. [Google Scholar] [CrossRef] [PubMed]
  16. Li, L.; Tang, H.; Lei, J.; Song, X. Spatial autocorrelation in land use type and ecosystem service value in Hainan Tropical Rain Forest National Park. Ecol. Indic. 2022, 137, 108727. [Google Scholar] [CrossRef]
  17. Liu, C.; Li, W.; Xu, J.; Zhou, H.; Wang, W.; Wang, H. Temporal and spatial variations of ecological security on the northeastern Tibetan Plateau integrating ecosystem health-risk-services framework. Ecol. Indic. 2024, 158, 111365. [Google Scholar] [CrossRef]
  18. Zhang, L.; Hu, B.; Zhang, Z.; Liang, G. Research on the spatiotemporal evolution and mechanism of ecosystem service value in the mountain-river-sea transition zone based on “production-living-ecological space”—Taking the Karst-Beibu Gulf in Southwest Guangxi, China as an example. Ecol. Indic. 2023, 148, 109889. [Google Scholar] [CrossRef]
  19. Li, Y.; Geng, H.; Luo, G.; Wu, L.; Wang, J.; Wu, Q. Multiscale characteristics of ecosystem service value trade-offs/synergies and their response to landscape pattern evolution in a typical karst basin in southern China. Ecol. Inform. 2024, 81, 102584. [Google Scholar] [CrossRef]
  20. Hou, L.; Wu, F.; Xie, X. The spatial characteristics and relationships between landscape pattern and ecosystem service value along an urban-rural gradient in Xi’an city, China. Ecol. Indic. 2020, 108, 105720. [Google Scholar] [CrossRef]
  21. Toosi, N.B.; Soffianian, A.R.; Fakheran, S.; Waser, L.T. Mapping disturbance in mangrove ecosystems: Incorporating landscape metrics and PCA-based spatial analysis. Ecol. Indic. 2022, 136, 108718. [Google Scholar] [CrossRef]
  22. Inácio, M.; Baltranaitė, E.; Bogdzevič, K.; Kalinauskas, M.; Pinto, L.V.; Barceló, D.; Pereira, P. Mapping and assessing the future provision of lake ecosystem services in Lithuania. J. Environ. Manag. 2024, 372, 123349. [Google Scholar] [CrossRef]
  23. Zhang, S.; Huang, C.; Li, X.; Song, M. The spatial–temporal evolution and influencing factors of the coupling coordination of new-type urbanization and ecosystem services value in the Yellow River Basin. Ecol. Indic. 2024, 166, 112300. [Google Scholar] [CrossRef]
  24. Li, W.; Wang, Y.; Xie, S.; Cheng, X. Coupling coordination analysis and spatiotemporal heterogeneity between urbanization and ecosystem health in Chongqing municipality, China. Sci. Total Environ. 2021, 791, 148311. [Google Scholar] [CrossRef] [PubMed]
  25. Liu, J.; Pei, X.; Liao, B.; Zhang, H.; Liu, W.; Jiao, J. Scale effects and spatial heterogeneity of driving factors in ecosystem services value interactions within the Tibet autonomous region. J. Environ. Manag. 2024, 351, 119871. [Google Scholar] [CrossRef]
  26. Wang, Z.; Liang, L.; Sun, Z.; Wang, X. Spatiotemporal differentiation and the factors influencing urbanization and ecological environment synergistic effects within the Beijing-Tianjin-Hebei urban agglomeration. J. Environ. Manag. 2019, 243, 227–239. [Google Scholar] [CrossRef]
  27. Cui, Y.; Xiao, R.; Zhang, M.; Wang, C.; Ma, Z.; Xiu, Y.; Wang, Q.; Guo, Y. Hydrological connectivity dynamics and conservation priorities for surface-water patches in the Yellow River Delta National Nature Reserve, China. Ecohydrol. Hydrobiol. 2020, 20, 525–536. [Google Scholar] [CrossRef]
  28. Li, H.; Fan, Y.; Gong, Z.; Zhou, D. Water accessibility assessment of freshwater wetlands in the yellow river delta national nature reserve, China. Ecohydrol. Hydrobiol. 2020, 20, 21–30. [Google Scholar] [CrossRef]
  29. Zhang, M.; Lv, J. Source apportionment of potentially toxic elements in soils of the Yellow River Delta Nature Reserve, China: The application of three receptor models and geostatistical independent simulation. Environ. Pollut. 2021, 289, 117834. [Google Scholar] [CrossRef] [PubMed]
  30. He, W.J.; Cui, B.S.; Hua, Y.Y.; Fan, X.Y. Assessment of management effectiveness for the national nature reserve in the yellow river delta. Procedia Environ. Sci. 2012, 13, 2362–2373. [Google Scholar] [CrossRef]
  31. Zhang, L.; Deng, C.; Kang, R.; Yin, H.; Xu, T.; Kaufmann, H.J. Assessing the responses of ecosystem patterns, structures and functions to drought under climate change in the Yellow River Basin, China. Sci. Total Environ. 2024, 929, 172603. [Google Scholar] [CrossRef] [PubMed]
  32. Yan, J.; Zhu, J.; Zhao, S.; Su, F. Coastal wetland degradation and ecosystem service value change in the Yellow River Delta, China. Glob. Ecol. Conserv. 2023, 44, e02501. [Google Scholar] [CrossRef]
  33. Zhang, B.; Li, L. Evaluation of ecosystem service value and vulnerability analysis of China national nature reserves: A case study of Shennongjia Forest Region. Ecol. Indic. 2023, 149, 110188. [Google Scholar] [CrossRef]
  34. Jiang, Z.; Li, Y.; Wu, H.; Shariff AR, B.M.; Zhou, H.; Fan, K. Unveiling the impacts of climate change and human activities on land-use evolution in ecologically fragile urbanizing areas: A case study of China’s Central Plains urban agglomeration. Ecol. Indic. 2024, 169, 112936. [Google Scholar] [CrossRef]
  35. Liu, Y.; Ma, C.; Ma, L.; Li, N. Ecological effects of land use and land cover change in the typical ecological functional zones of Egypt. Ecol. Indic. 2024, 168, 112747. [Google Scholar] [CrossRef]
  36. Hu, C.; Song, M.; Zhang, A. Dynamics of the eco-environmental quality in response to land use changes in rapidly urbanizing areas: A case study of Wuhan, China from 2000 to 2018. J. Geogr. Sci. 2023, 33, 245–265. [Google Scholar] [CrossRef]
  37. Cao, Y.; Zhang, M.; Zhang, Z.; Liu, L.; Gao, Y.; Zhang, X.; Chen, H.; Kang, Z.; Liu, X.; Zhang, Y. The impact of land-use change on the ecological environment quality from the perspective of production-living-ecological space: A case study of the northern slope of Tianshan Mountains. Ecol. Inform. 2024, 83, 102795. [Google Scholar] [CrossRef]
  38. Belay, T.; Melese, T.; Senamaw, A. Impacts of land use and land cover change on ecosystem service values in the Afroalpine area of Guna Mountain, Northwest Ethiopia. Heliyon 2022, 8, e12246. [Google Scholar] [CrossRef] [PubMed]
  39. Liu, W.; Zhan, J.; Zhao, F.; Yan, H.; Zhang, F.; Wei, X. Impacts of urbanization-induced land-use changes on ecosystem services: A case study of the Pearl River Delta Metropolitan Region, China. Ecol. Indic. 2019, 98, 228–238. [Google Scholar] [CrossRef]
  40. Zhao, Y.; Zhang, X.; Wu, Q.; Huang, J.; Ling, F.; Wang, L. Characteristics of spatial and temporal changes in ecosystem service value and threshold effect in Henan along the Yellow River, China. Ecol. Indic. 2024, 166, 112531. [Google Scholar] [CrossRef]
  41. Xie, Y.; Zhu, Q.; Bai, H.; He, H.; Zhang, Y. Combining ecosystem service value and landscape ecological risk to subdivide the riparian buffer zone of the Weihe River in Shaanxi. Ecol. Indic. 2024, 166, 112424. [Google Scholar] [CrossRef]
  42. Xie, G.D.; Zhang, C.X.; Zhang, L.M.; Chen, W.H.; Li, S.M. Improvement of the evaluation method for ecosystem service value based on per unit area. J. Nat. Resour. 2015, 30, 1243–1254. [Google Scholar]
  43. Zhang, Z.; Han, L.; Feng, Z.; Zhou, J.; Wang, S.; Wang, X.; Fan, J. Estimating the past and future trajectory of LUCC on wetland ecosystem service values in the Yellow River Delta Region of China. Sustainability 2024, 16, 619. [Google Scholar] [CrossRef]
  44. Guo, K.; Yuan, Y. Research on spatial and temporal evolution trends and driving factors of green residences in China based on weighted standard deviational ellipse and panel Tobit model. Appl. Sci. 2022, 12, 8788. [Google Scholar] [CrossRef]
  45. Wang, Z.; Li, X.; Mao, Y.; Li, L.; Wang, X.; Lin, Q. Dynamic simulation of land use change and assessment of carbon storage based on climate change scenarios at the city level: A case study of Bortala, China. Ecol. Indic. 2022, 134, 108499. [Google Scholar] [CrossRef]
  46. Zhang, P.; Liu, L.; Yang, L.; Zhao, J.; Li, Y.; Qi, Y.; Ma, X.; Cao, L. Exploring the response of ecosystem service value to land use changes under multiple scenarios coupling a mixed-cell cellular automata model and system dynamics model in Xi’an, China. Ecol. Indic. 2023, 147, 110009. [Google Scholar] [CrossRef]
  47. Huang, J.; Song, L.; Yu, M.; Zhang, C.; Li, S.; Li, Z.; Geng, J.; Zhang, C. Quantitative spatial analysis of thermal infrared radiation temperature fields by the standard deviational ellipse method for the uniaxial loading of sandstone. Infrared Phys. Technol. 2022, 123, 104150. [Google Scholar] [CrossRef]
  48. Ghasemi, K. Enhancing urban livability: Analyzing Tehran through equitable land use distribution. J. Urban Manag. 2024, 13, 596–608. [Google Scholar] [CrossRef]
  49. Xiong, C.; Ren, H.; Xu, D.; Gao, Y. Spatial scale effects on the value of ecosystem services in China’s terrestrial area. J. Environ. Manag. 2024, 366, 121745. [Google Scholar] [CrossRef]
  50. Cui, X.; Huang, S.; Liu, C.; Zhou, T.; Shan, L.; Zhang, F.; Chen, M.; Li, F.; de Vries, W.T. Applying SBM-GPA model to explore urban land use efficiency considering ecological development in China. Land 2021, 10, 912. [Google Scholar] [CrossRef]
  51. Feng, Z.; Sun, L. Response of spatial and temporal variations of ecosystem service value to land use/land cover transformation in the upper basin of Miyun Reservoir. Ecol. Indic. 2024, 160, 111819. [Google Scholar] [CrossRef]
  52. Sisay, G.; Gessesse, B.; Fürst, C.; Kassie, M.; Kebede, B.; Alemu, W.G. Evaluating the spatiotemporal dynamics of ecosystem service values in response to land use/land cover change in Goang watershed, Northwest Ethiopia. Environ. Chall. 2024, 15, 100908. [Google Scholar] [CrossRef]
  53. Liu, C.; Liu, Y.; Giannetti, B.F.; Almeida, C.M.; Sevegnani, F.; Li, R. Spatiotemporal differentiation and mechanism of anthropogenic factors affecting ecosystem service value in the Urban Agglomeration around Poyang Lake, China. Ecol. Indic. 2023, 154, 110733. [Google Scholar] [CrossRef]
  54. Pan, N.; Guan, Q.; Wang, Q.; Sun, Y.; Li, H.; Ma, Y. Spatial differentiation and driving mechanisms in ecosystem service value of arid region: A case study in the middle and lower reaches of Shule River Basin, NW China. J. Clean. Prod. 2021, 319, 128718. [Google Scholar] [CrossRef]
  55. Huang, J.; Sun, Z.; Du, M. Spatiotemporal characteristics and determinants of agricultural carbon offset rate in China based on the geographic detector. Environ. Sci. Pollut. Res. 2023, 30, 58142–58155. [Google Scholar] [CrossRef]
  56. Han, X.; Yu, J.; Zhao, X.; Wang, J. Spatiotemporal evolution of ecosystem service values in an area dominated by vegetation restoration: Quantification and mechanisms. Ecol. Indic. 2021, 131, 108191. [Google Scholar] [CrossRef]
  57. Song, W.; Deng, X. Land-use/land-cover change and ecosystem service provision in China. Sci. Total Environ. 2017, 576, 705–719. [Google Scholar] [CrossRef]
  58. Du, X.; Huang, Z. Ecological and environmental effects of land use change in rapid urbanization: The case of Hangzhou, China. Ecol. Indic. 2017, 81, 243–251. [Google Scholar] [CrossRef]
  59. Wang, C.; Wang, Y.; Wang, R.; Zheng, P. Modeling and evaluating land-use/land-cover change for urban planning and sustainability: A case study of Dongying city, China. J. Clean. Prod. 2018, 172, 1529–1534. [Google Scholar] [CrossRef]
  60. Sobhani, P.; Esmaeilzadeh, H.; Dinan, N.M. Prioritization and valuation of ecosystem services in nature reserve. J. Nat. Conserv. 2024, 84, 126804. [Google Scholar] [CrossRef]
  61. Chen, H. Land use trade-offs associated with nature reserve in China: Current state, existing evaluation methods, and future application of ecosystem service valuation. Sci. Total Environ. 2020, 711, 134688. [Google Scholar] [CrossRef]
  62. Maimaiti, B.; Chen, S.; Kasimu, A.; Simayi, Z.; Aierken, N. Urban spatial expansion and its impacts on ecosystem service value of typical oasis cities around Tarim Basin, northwest China. Int. J. Appl. Earth Obs. Geoinf. 2021, 104, 102554. [Google Scholar] [CrossRef]
  63. Lu, Z.; Song, Q.; Zhao, J.; Wang, S. Prediction and evaluation of ecosystem service value based on land use of the Yellow River source area. Sustainability 2022, 15, 687. [Google Scholar] [CrossRef]
  64. Zhang, X.; Wang, G.; Xue, B.; Zhang, M.; Tan, Z. Dynamic landscapes and the driving forces in the Yellow River Delta wetland region in the past four decades. Sci. Total Environ. 2021, 787, 147644. [Google Scholar] [CrossRef]
  65. Zhang, C.Y.; Zhao, L.; Zhang, H.; Chen, M.N.; Fang, R.Y.; Yao, Y.; Zhang, Q.-P.; Wang, Q. Spatial-temporal characteristics of carbon emissions from land use change in Yellow River Delta region, China. Ecol. Indic. 2022, 136, 108623. [Google Scholar] [CrossRef]
  66. Wang, Q.; Yang, C.H.; Wang, M.L.; Zhao, L.; Zhao, Y.C.; Zhang, Q.P.; Zhang, C.Y. Decoupling analysis to assess the impact of land use patterns on carbon emissions: A case study in the Yellow River Delta efficient eco-economic zone, China. J. Clean. Prod. 2023, 412, 137415. [Google Scholar] [CrossRef]
  67. Su, H.; Du, M.; Liu, Q.; Kang, X.; Zhao, L.; Zheng, W.; Liao, Z. Assessment of regional Ecosystem Service Bundles coupling climate and land use changes. Ecol. Indic. 2024, 169, 112844. [Google Scholar] [CrossRef]
  68. Liu, M.; Jia, Y.; Zhao, J.; Shen, Y.; Pei, H.; Zhang, H.; Li, Y. Revegetation projects significantly improved ecosystem service values in the agro-pastoral ecotone of northern China in recent 20 years. Sci. Total Environ. 2021, 788, 147756. [Google Scholar] [CrossRef] [PubMed]
  69. Kang, L.; Jia, Y.; Zhang, S. Spatiotemporal distribution and driving forces of ecological service value in the Chinese section of the “Silk Road Economic Belt”. Ecol. Indic. 2022, 141, 109074. [Google Scholar] [CrossRef]
  70. He, Z.; Shang, X.; Zhang, T.; Yun, J. Coupled regulatory mechanisms and synergy/trade-off strategies of human activity and climate change on ecosystem service value in the loess hilly fragile region of northern Shaanxi, China. Ecol. Indic. 2022, 143, 109325. [Google Scholar] [CrossRef]
  71. Shidong, L.I.; Moucheng LI, U. The development process, current situation and prospects of the conversion of farmland to forests and grasses project in China. J. Resour. Ecol. 2022, 13, 120–128. [Google Scholar] [CrossRef]
  72. Lei, L.; Jian, L.; Yutao, W.; Nvie, W.; Renqing, W. Cost-benefit analysis and payments for watershed-scale wetland rehabilitation: A case study in Shandong Province, China. Int. J. Environ. Res. 2011, 5, 787–796. [Google Scholar]
Figure 1. Geographic setting and basic information for the YRD. Note: (a) Dongying city. The YRD National Nature Reserve is designated as ‘Reserve’, whereas the remaining areas are designated as ‘Non-Reserve’; (b) China; (c) Shandong Province.
Agriculture 15 00346 g001
Figure 2. Land use coverage in Dongying, 2000–2020.
Agriculture 15 00346 g002
Figure 3. Percentage change composition of Dongying LULC in different years.
Agriculture 15 00346 g003
Figure 4. Land use conversion in the Reserve area. Note: (a) 2000–2005; (b) 2005–2010; (c) 2010–2015; (d) 2015–2020; (e) 2000–2020.
Agriculture 15 00346 g004
Figure 5. Land use conversion in Non-Reserve area. Note: (a) 2000–2005; (b) 2005–2010; (c) 2010–2015; (d) 2015–2020; (e) 2000–2020.
Agriculture 15 00346 g005
Figure 6. Interannual changes in the four ecosystem service values (reconciliation, support, supply, and cultural services) from 2000 to 2020. Note: (a) Reserve area; (b) non-Reserve area.
Agriculture 15 00346 g006
Figure 7. Change in ESV per unit area. Note: (a) Reserve area; (b) Non-Reserve area.
Agriculture 15 00346 g007
Figure 8. Spatiotemporal patterns of ESV between 2000 and 2020.
Agriculture 15 00346 g008
Figure 9. Results of spatial autocorrelation analysis of ESV 2000–2020.
Agriculture 15 00346 g009
Figure 10. Migration of the center of gravity in Reserve areas. Note: (a) cultivated land; (b) wetland; (c) water body; (d) ESV.
Agriculture 15 00346 g010
Figure 11. Migration of the center of gravity in non-Reserve land. Note: (a) cultivated land; (b) wetland; (c) water body; (d) ESV.
Agriculture 15 00346 g011
Figure 12. Changes in the ellipses of the ESV standard deviation and its centroid in the YRD.
Agriculture 15 00346 g012
Figure 13. Interaction factor detection results. Note: (a) Reserve area; (b) Non-Reserve area.
Agriculture 15 00346 g013
Table 1. Description, name, source, and resolution of data collected in this study.
DescriptionData NameData SourcesResolution
ESV and land type transfer calculationsLULCData Sharing Service System (https://data.casearth.cn/)spatial resolution of 30 m × 30 m
Driver factorsDEMGeospatial Data Cloud (https://www.gscloud.cn/)spatial resolution of 30 m × 30 m
Road dataCenter for Resource and Environmental Sciences and Data (https://www.resdc.cn/)-
Climate dataChina Meteorological Scientific Data Service Center (https://data.cma.cn/)spatial resolution of 1 km × 1 km
Calculation of standardized ecological equivalence factorsSocio-economic dataChina Statistical Yearbook, Shandong Statistical Yearbook, Dongying Statistical Yearbook-
Cereal market price dataNational Agricultural Cost-Effectiveness Surveysvarious years
MappingAdministrative division dataCenter for Resource and Environmental Sciences and Data (https://www.resdc.cn/)-
Table 2. Area and average proportion of land types in Reserve and Non-Reserve areas, 2000–2020 (ha, %).
AreaLand Type20002005201020152020Mean
AreaAreaAreaAreaAreaArea%
ReserveCultivated land58,897.1757,881.4357,034.9856,355.1255,270.0857,087.7639.51
Forest54.9053.1043.8336.630.0037.690.03
Grassland2005.472112.391892.251779.661571.311872.221.30
Water body34,841.8836,569.4336,640.8036,175.2336,178.7436,081.2224.97
Wetland48,352.2347,487.6948,438.7249,475.7950,737.6848,898.4233.85
Artificial surface261.54299.79334.26556.02600.66410.450.28
Bare land60.5769.9388.9295.31115.2986.000.06
Non-ReserveCultivated land579,396.15558,336.15547,299.18531,549.72518,088.24546,933.8964.87
Forest45.5433.3017.2815.660.4522.450.003
Grassland1565.101446.931127.611073.43835.741209.760.14
Water body109,740.24133,896.51142,408.71150,945.21156,117.69138,621.6716.44
Wetland102,260.1690,006.7586,380.6584,687.7590,567.3690,780.5310.77
Artificial surface49,820.9459,055.2165,501.0174,402.1976,972.5065,150.377.723
Bare land256.95307.62346.86404.28495.72362.290.04
Table 3. Ecosystem service value sensitivity index (ESVSI).
Land Category20002005201020152020
Cultivated land9.05 × 10−2 8.03 × 10−27.66 × 10−2 7.24 × 10−26.86 × 10−2
Forest6.87 × 10−55.43 × 10−53.73 × 10−53.11 × 10−53.00 × 10−7
Grassland1.93 × 10−31.77 × 10−31.46 × 10−31.34 × 10−31.10 × 10−3
Water body6.42 × 10−16.95 × 10−17.09 × 10−17.21 × 10−17.20 × 10−1
Wetland2.66 × 10−12.23 × 10−12.13 × 10−12.06 × 10−12.11 × 10−1
Bare land2.20 × 10−62.40 × 10−62.60 × 10−63.00 × 10−63.50 × 10−6
Artificial surface0000 0
Table 4. Results of factor detection.
Detection FactorX1X2X3X4X5X6X7X8X9
Reserveq 0.2070.0970.0810.2240.0840.6250.223--
p 0.0000.0000.0000.0000.0000.0000.000--
Non-Reserveq 0.1290.0690.0160.1830.0580.7390.0090.0190.067
p 0.0000.0000.0000.0000.0000.0000.0000.0000.000
Disclaimer/Publisher’s Note: The statements, opinions and data contained in all publications are solely those of the individual author(s) and contributor(s) and not of MDPI and/or the editor(s). MDPI and/or the editor(s) disclaim responsibility for any injury to people or property resulting from any ideas, methods, instructions or products referred to in the content.

