Article

Efficient Deployment of Peanut Leaf Disease Detection Models on Edge AI Devices

College of Information and Management Science, Henan Agricultural University, Zhengzhou 450046, China
*
Author to whom correspondence should be addressed.
Agriculture 2025, 15(3), 332; https://doi.org/10.3390/agriculture15030332
Submission received: 24 December 2024 / Revised: 17 January 2025 / Accepted: 31 January 2025 / Published: 2 February 2025
(This article belongs to the Section Digital Agriculture)

Abstract

:
The intelligent transformation of crop leaf disease detection has driven the use of deep neural network algorithms to develop more accurate disease detection models. In resource-constrained environments, the deployment of crop leaf disease detection models on the cloud introduces challenges such as communication latency and privacy concerns. Edge AI devices offer lower communication latency and enhanced scalability. To achieve the efficient deployment of crop leaf disease detection models on edge AI devices, a dataset of 700 images depicting peanut leaf spot, scorch spot, and rust diseases was collected. The YOLOX-Tiny network was utilized to conduct deployment experiments with the peanut leaf disease detection model on the Jetson Nano B01. The experiments initially focused on three aspects of efficient deployment optimization: the fusion of rectified linear unit (ReLU) and convolution operations, the integration of Efficient Non-Maximum Suppression for TensorRT (EfficientNMS_TRT) to accelerate post-processing within the TensorRT model, and the conversion of model formats from number of samples, channels, height, width (NCHW) to number of samples, height, width, and channels (NHWC) in the TensorFlow Lite model. Additionally, experiments were conducted to compare the memory usage, power consumption, and inference latency between the two inference frameworks, as well as to evaluate the real-time video detection performance using DeepStream. The results demonstrate that the fusion of ReLU activation functions with convolution operations reduced the inference latency by 55.5% compared to the use of the Sigmoid linear unit (SiLU) activation alone. In the TensorRT model, the integration of the EfficientNMS_TRT module accelerated post-processing, leading to a reduction in the inference latency of 19.6% and an increase in the frames per second (FPS) of 20.4%. In the TensorFlow Lite model, conversion to the NHWC format decreased the model conversion time by 88.7% and reduced the inference latency by 32.3%. These three efficient deployment optimization methods effectively decreased the inference latency and enhanced the inference efficiency. Moreover, a comparison between the two frameworks revealed that TensorFlow Lite exhibited memory usage reductions of 15% to 20% and power consumption decreases of 15% to 25% compared to TensorRT. Additionally, TensorRT achieved inference latency reductions of 53.2% to 55.2% relative to TensorFlow Lite. Consequently, TensorRT is deemed suitable for tasks requiring strong real-time performance and low latency, whereas TensorFlow Lite is more appropriate for scenarios with constrained memory and power resources. Additionally, the integration of DeepStream and EfficientNMS_TRT was found to optimize memory and power utilization, thereby enhancing the speed of real-time video detection. A detection rate of 28.7 FPS was achieved at a resolution of 1280 × 720. These experiments validate the feasibility and advantages of deploying crop leaf disease detection models on edge AI devices.

1. Introduction

Peanut is recognized as one of the world’s major oilseed and economic crops [1]. As the largest producer and consumer of peanuts globally, China contributes 40% of the world’s total peanut production and consumption [2]. The yield and quality of peanuts directly influence agricultural economics and food security. During the growth of peanuts, leaf diseases often impact both the yield and quality. Consequently, the detection of peanut leaf diseases is of paramount importance. Traditional manual detection methods are time-consuming and labor-intensive, rendering deep learning-based disease detection approaches highly desirable [3,4]. Deep learning generates substantial amounts of data, particularly in computer vision applications [5]. In the harsh environments of agricultural fields, limited computational resources hinder the management of such vast data. While cloud computing offloads extensive data to servers for processing, increased communication latency presents new challenges. Although the advent of edge AI devices enables the mitigation of some of this pressure, factors such as data volume, real-time application requirements, energy consumption, communication, and storage introduce additional challenges [6]. Furthermore, deep neural network inference frameworks can serve as auxiliary tools to address the challenges posed by various inference scenarios. However, constraints related to computing devices, deep neural networks, and inference frameworks complicate the efficient deployment of relevant applications in agricultural settings.
In recent years, deep neural networks have assumed an increasingly significant role in the detection of crop leaf diseases. By utilizing raw images as input, these networks automatically extract pertinent features, thereby facilitating the efficient and accurate detection and diagnosis of crop leaf diseases [7]. The adoption of deep neural networks not only circumvents issues associated with manually designed feature extraction methods but also enhances the detection accuracy and robustness [8]. Consequently, there have been a growing number of studies focused on employing deep neural networks for crop leaf disease detection, yielding notable research advancements. Lin et al. [9] introduced an improved YOLOX-Tiny network that incorporated hierarchical mixed-scale units (HMUs) within the neck network for feature optimization and integrated a convolutional block attention module (CBAM) to enhance the detection of small lesions, resulting in superior performance in terms of both detection accuracy and speed. Li et al. [10] integrated a lightweight ghost convolutional neural network (GhostNet) structure into the YOLOv8s network and introduced a triplet attention mechanism. Additionally, they employed an efficient complete intersection over union (ECIoU_Loss) function to replace the original complete intersection over union (CIoU_Loss) function, achieving significant optimization in terms of accuracy, model size, and computational complexity. Sangaiah et al. [11] proposed a UAV T-yolo-Rice (UAV Tiny Yolo Rice) network, which incorporated YOLO detection layers, spatial pyramid pooling (SPP), a CBAM, and a sand clock feature extraction module (SCFEM), attaining optimal performance on a constructed rice leaf disease dataset. Clearly, the aforementioned studies have achieved substantial progress in the detection of crop leaf diseases. However, they have not addressed the deployment of crop leaf disease detection models in resource-constrained agricultural field environments.
Several researchers have deployed crop leaf disease detection models on edge AI devices to detect crop leaf diseases in harsh agricultural field environments. Li et al. [12] modified the original backbone and neck of YOLOv4 by incorporating depthwise convolution and a hybrid attention mechanism and designing and evaluating four new network architectures, with the best-performing model being named DAC-YOLOv4. This model was applied to strawberry powdery mildew detection and achieved real-time detection speeds of 43 FPS and 20 FPS on a Jetson Xavier NX and Jetson Nano, respectively, demonstrating its effectiveness and practicality. Gajjar et al. [13] designed a novel convolutional neural network architecture capable of identifying and classifying 20 types of healthy and diseased leaves across four plant species. Deployed on the NVIDIA Jetson TX1, this model performed the efficient, real-time detection of multiple leaves in the field and accurately identified various diseases. Xie et al. [14] proposed a lightweight detection model, YOLOv5s-BiPCNeXt, for eggplant leaf disease detection in natural scenes. This model utilized the MobileNeXt backbone to reduce the parameters and computational complexity and integrated a multi-scale cross-spatial attention mechanism and content-aware feature recombination operator within the neck network. Ultimately, on the Jetson Orin Nano device a real-time detection speed of 26 FPS was achieved, outperforming other algorithms. Some researchers have deployed crop leaf disease detection models on embedded AI devices; however, efficient deployment remains a challenge, and there is a lack of experience regarding their deployment on embedded AI devices [15].
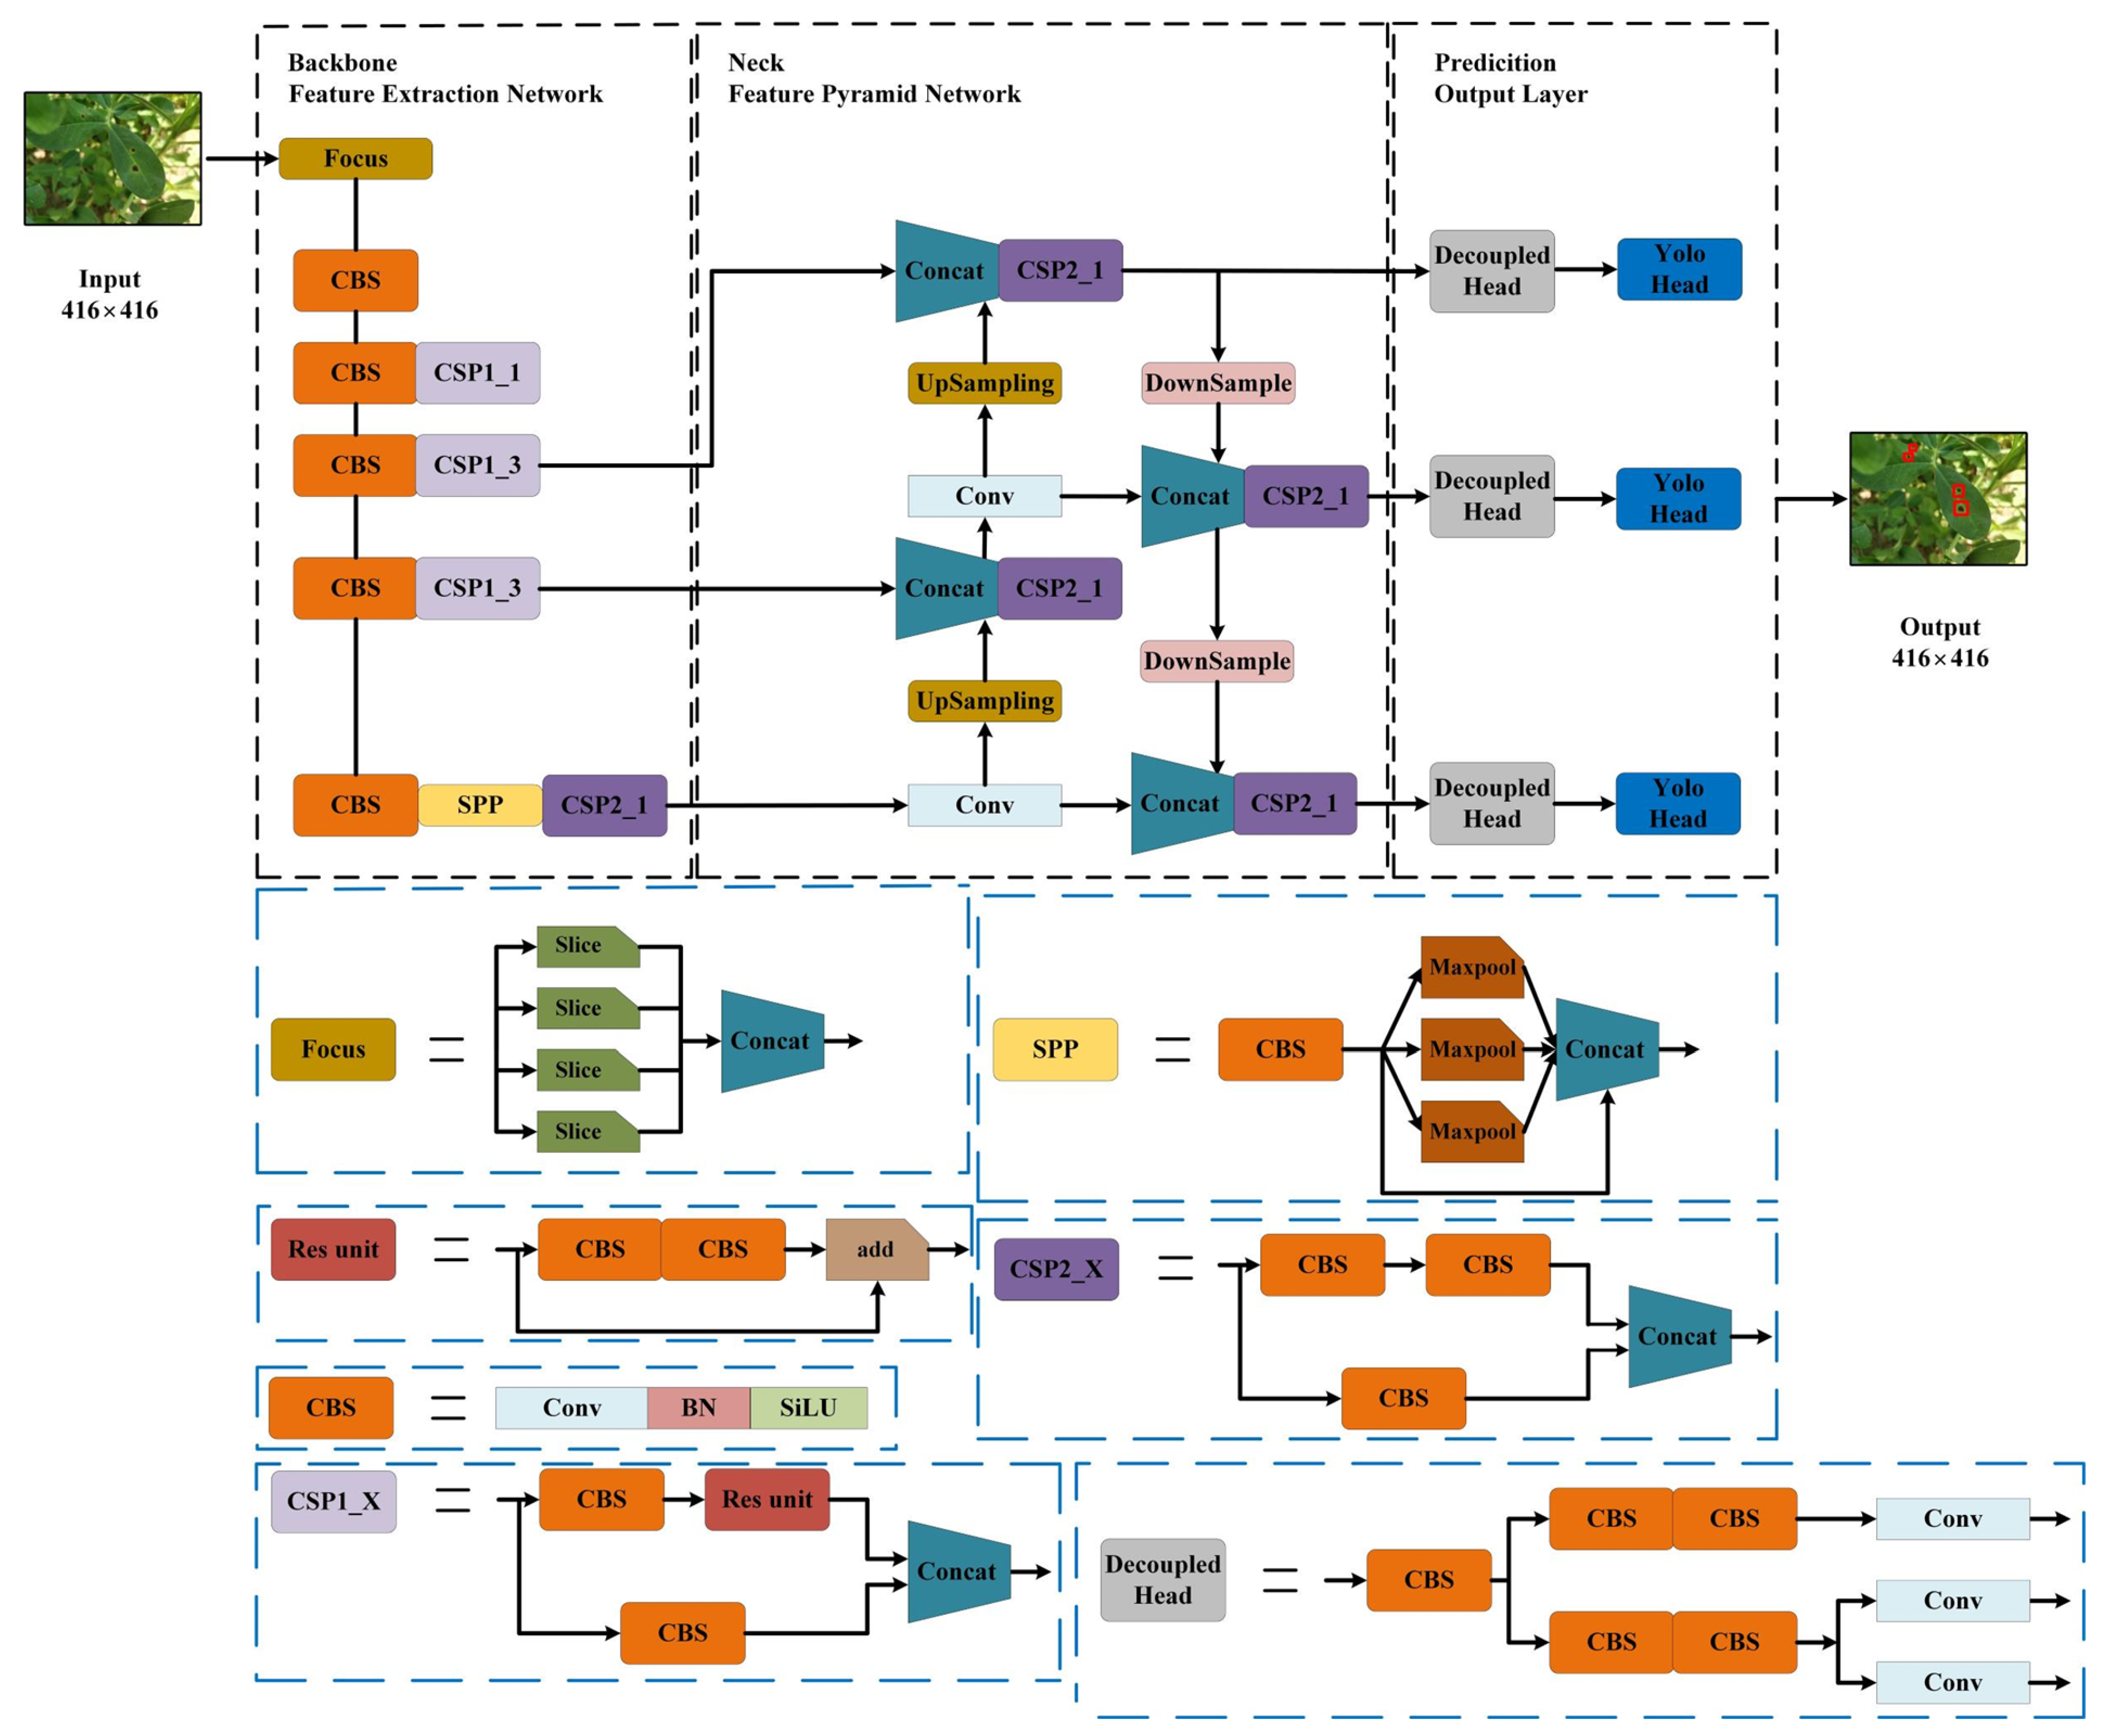
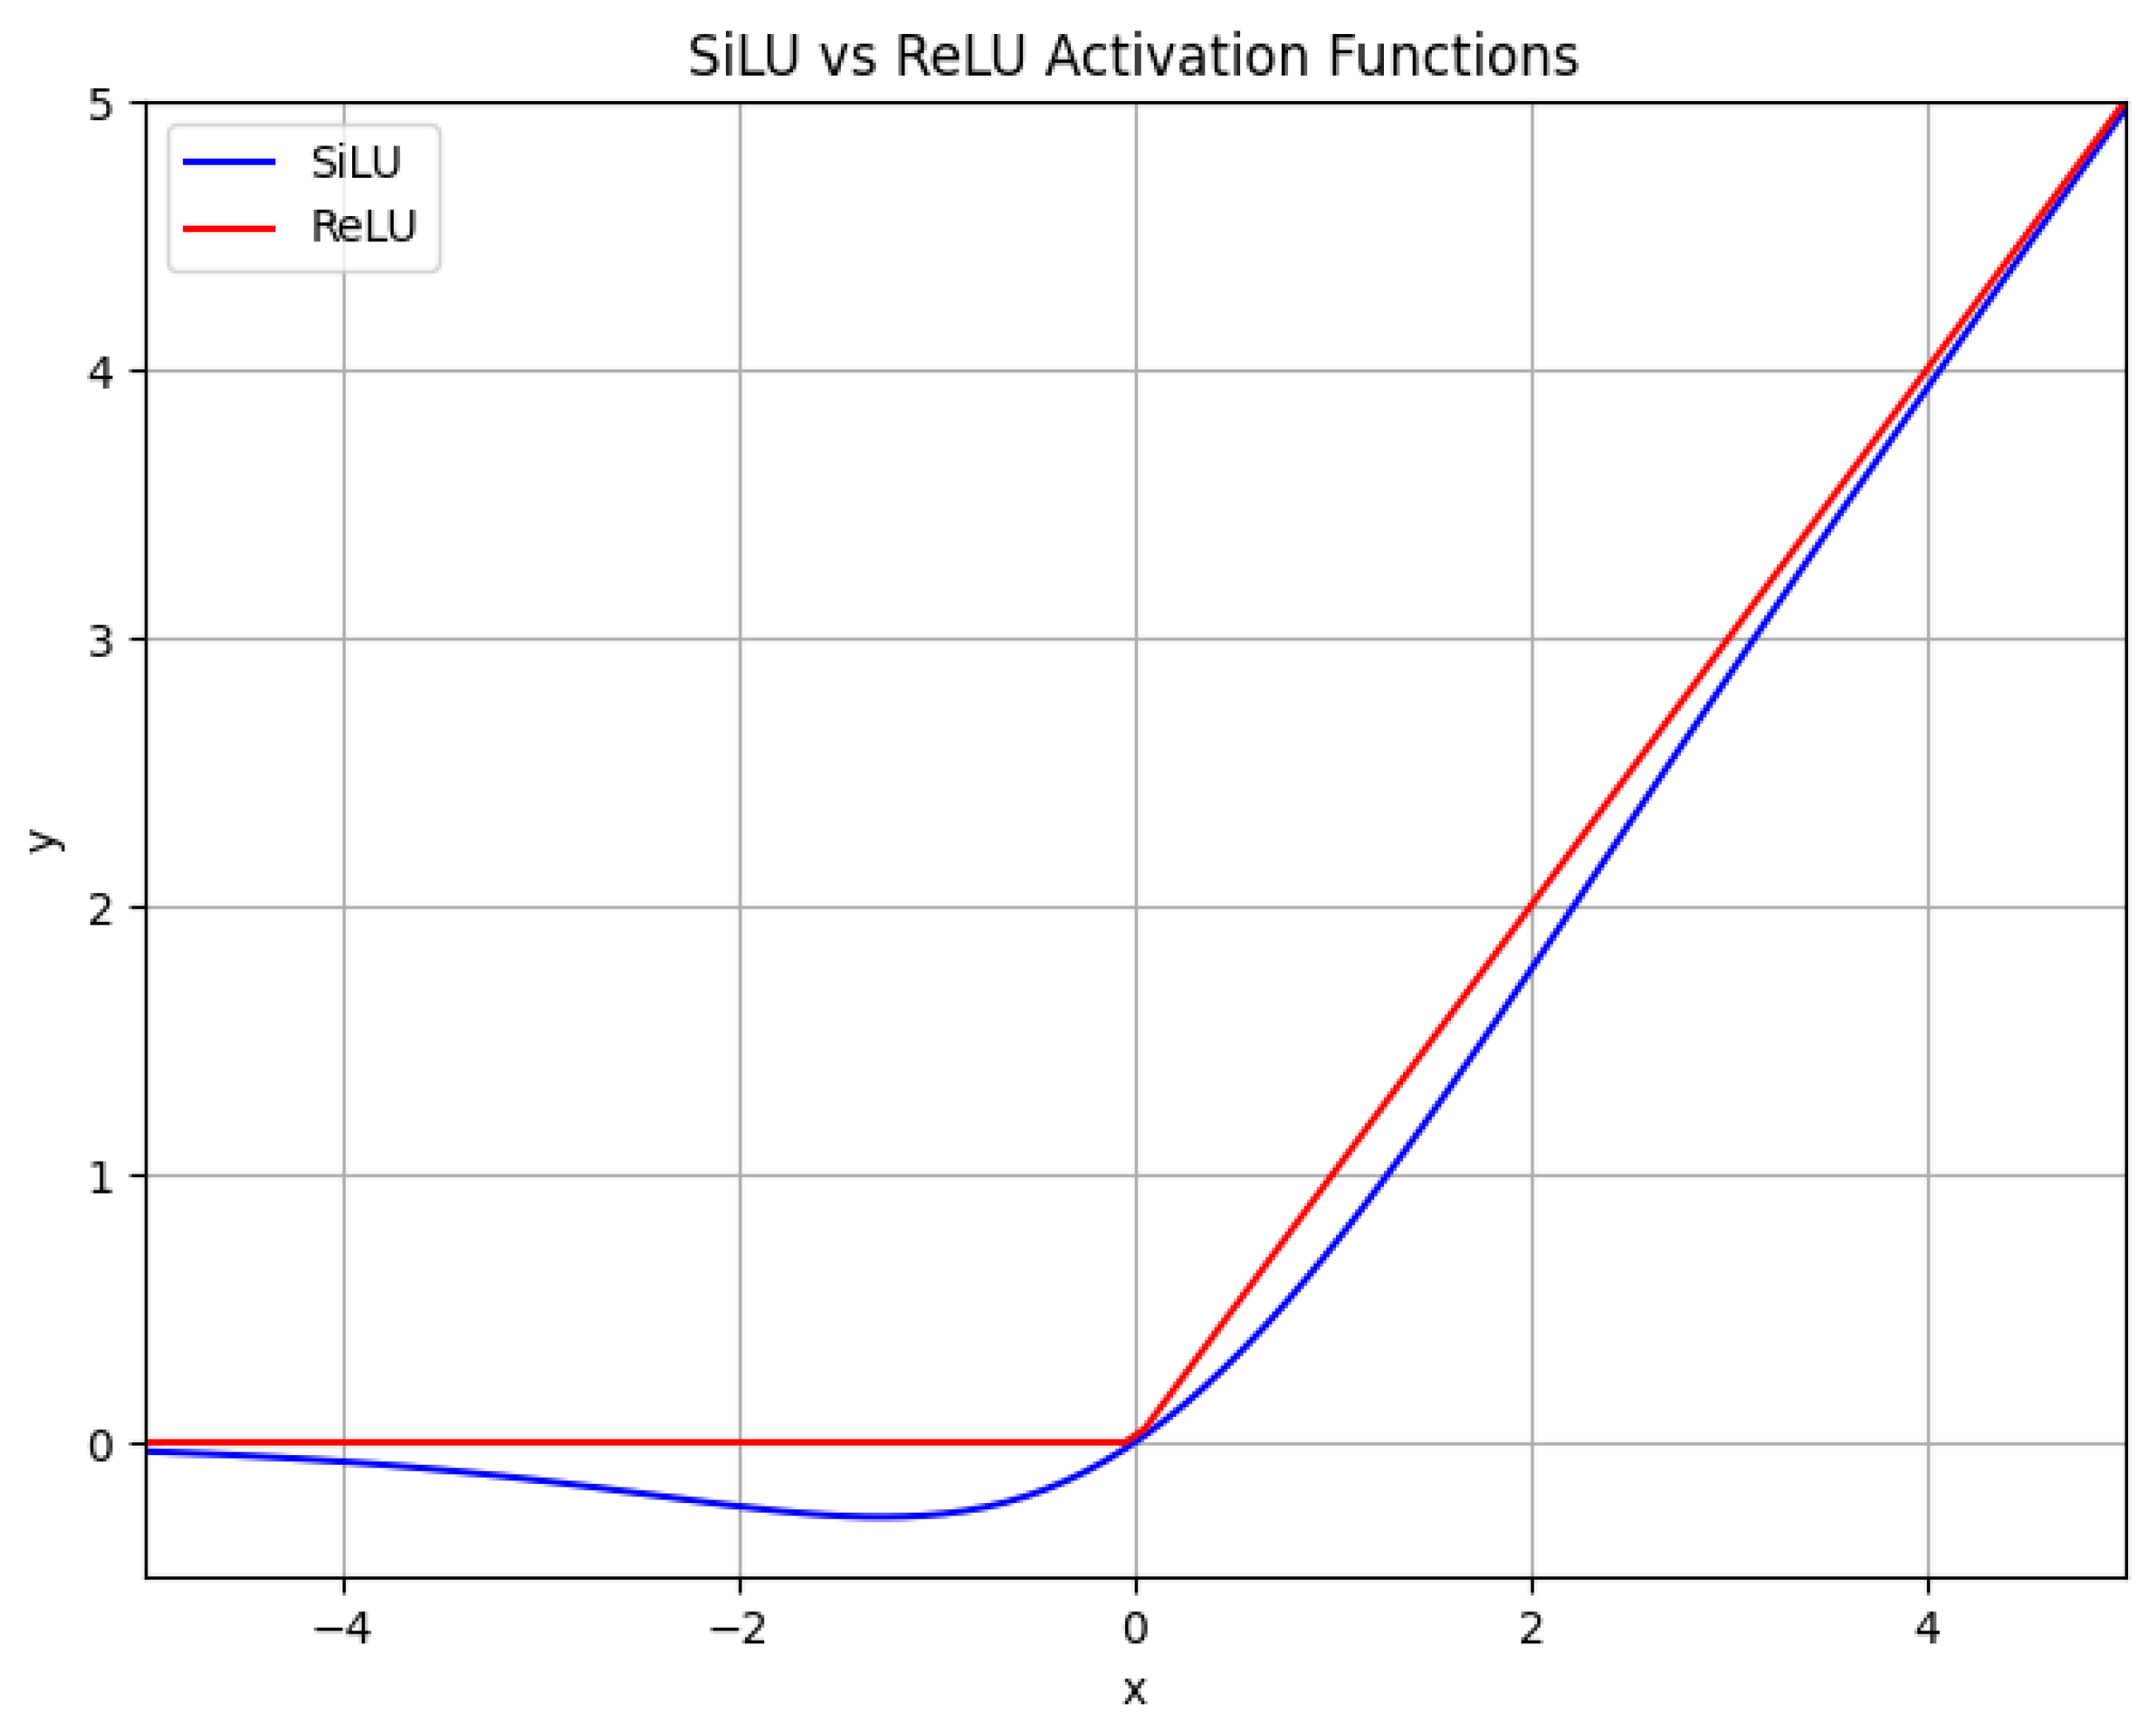
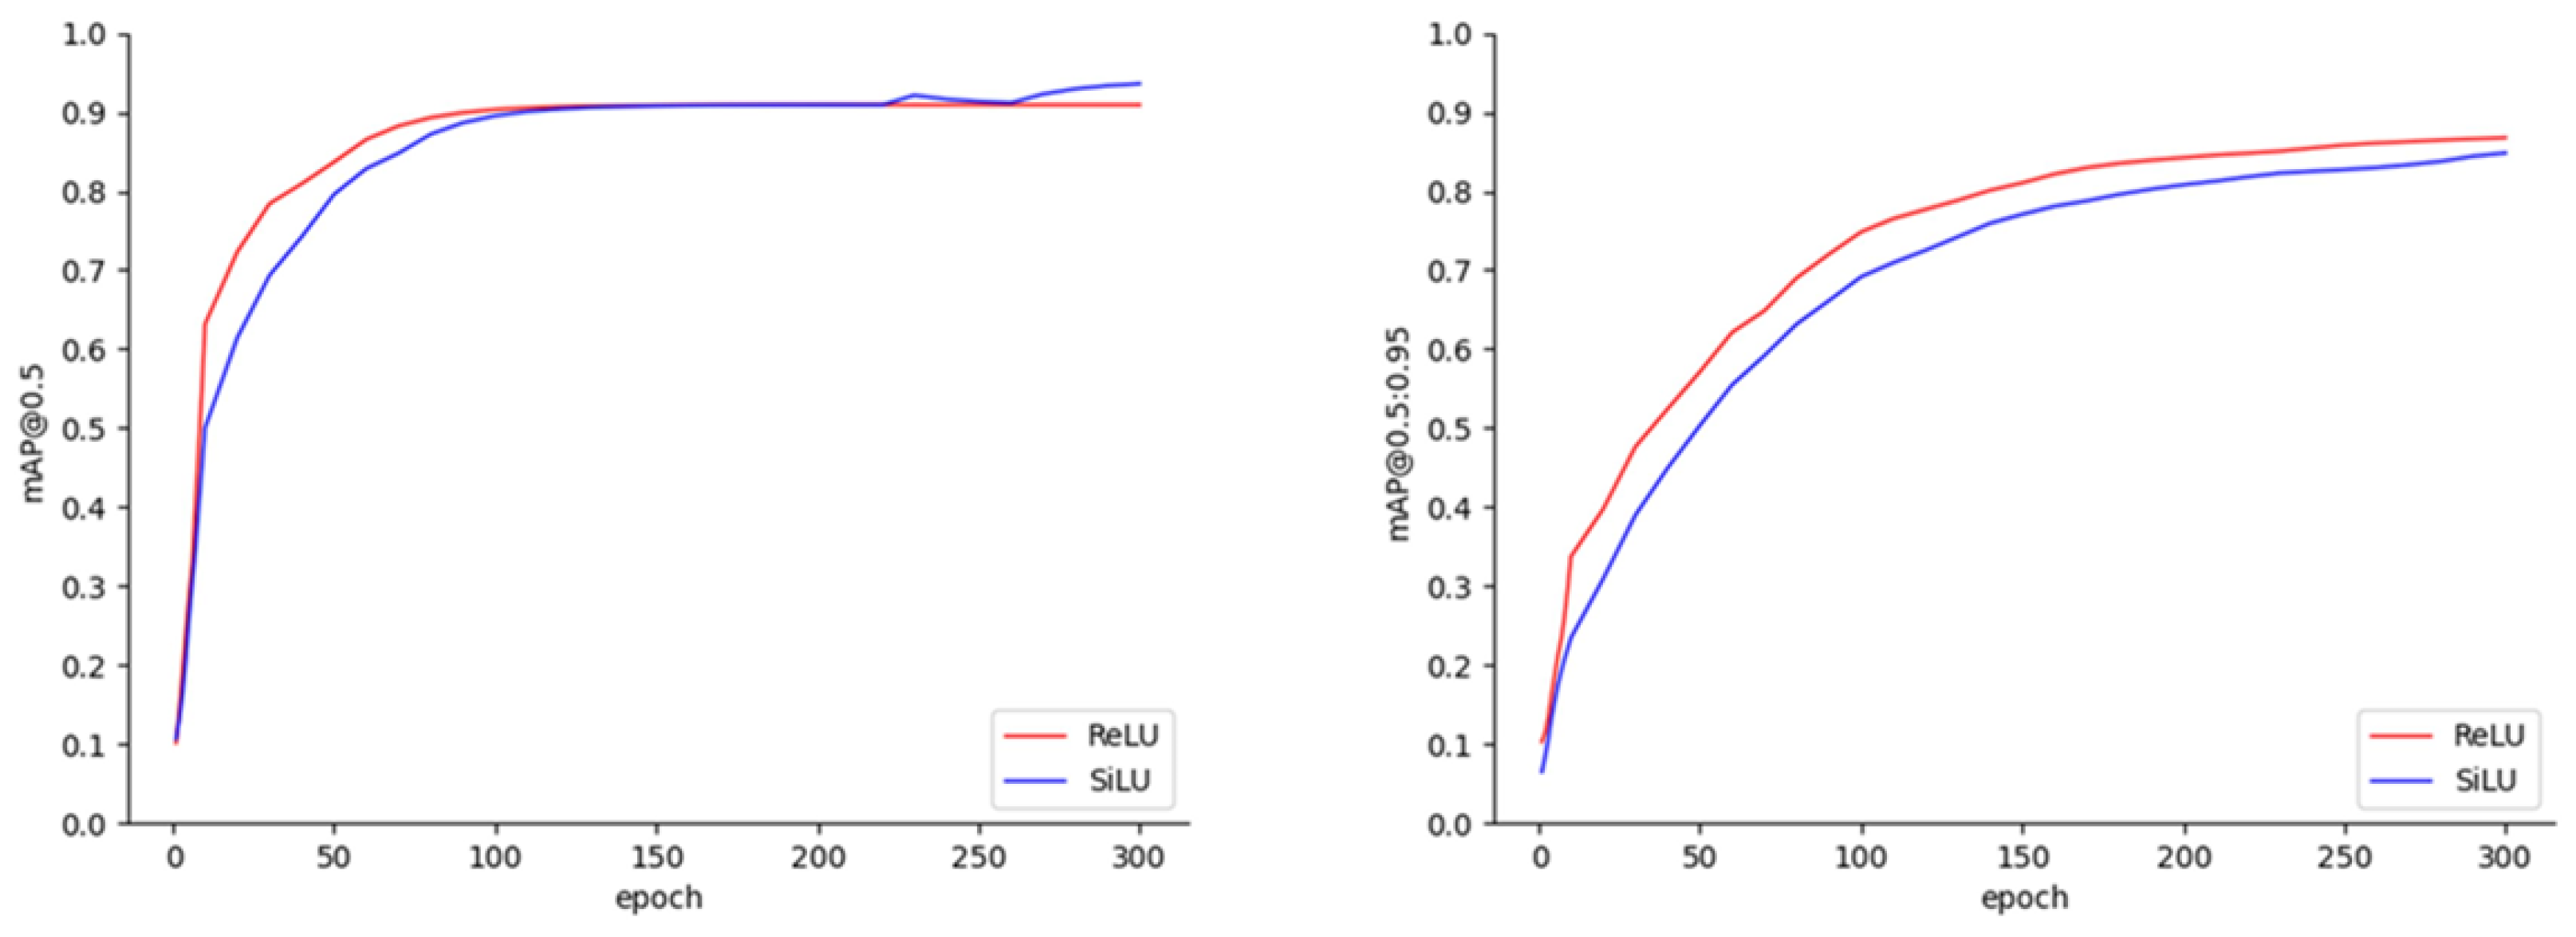
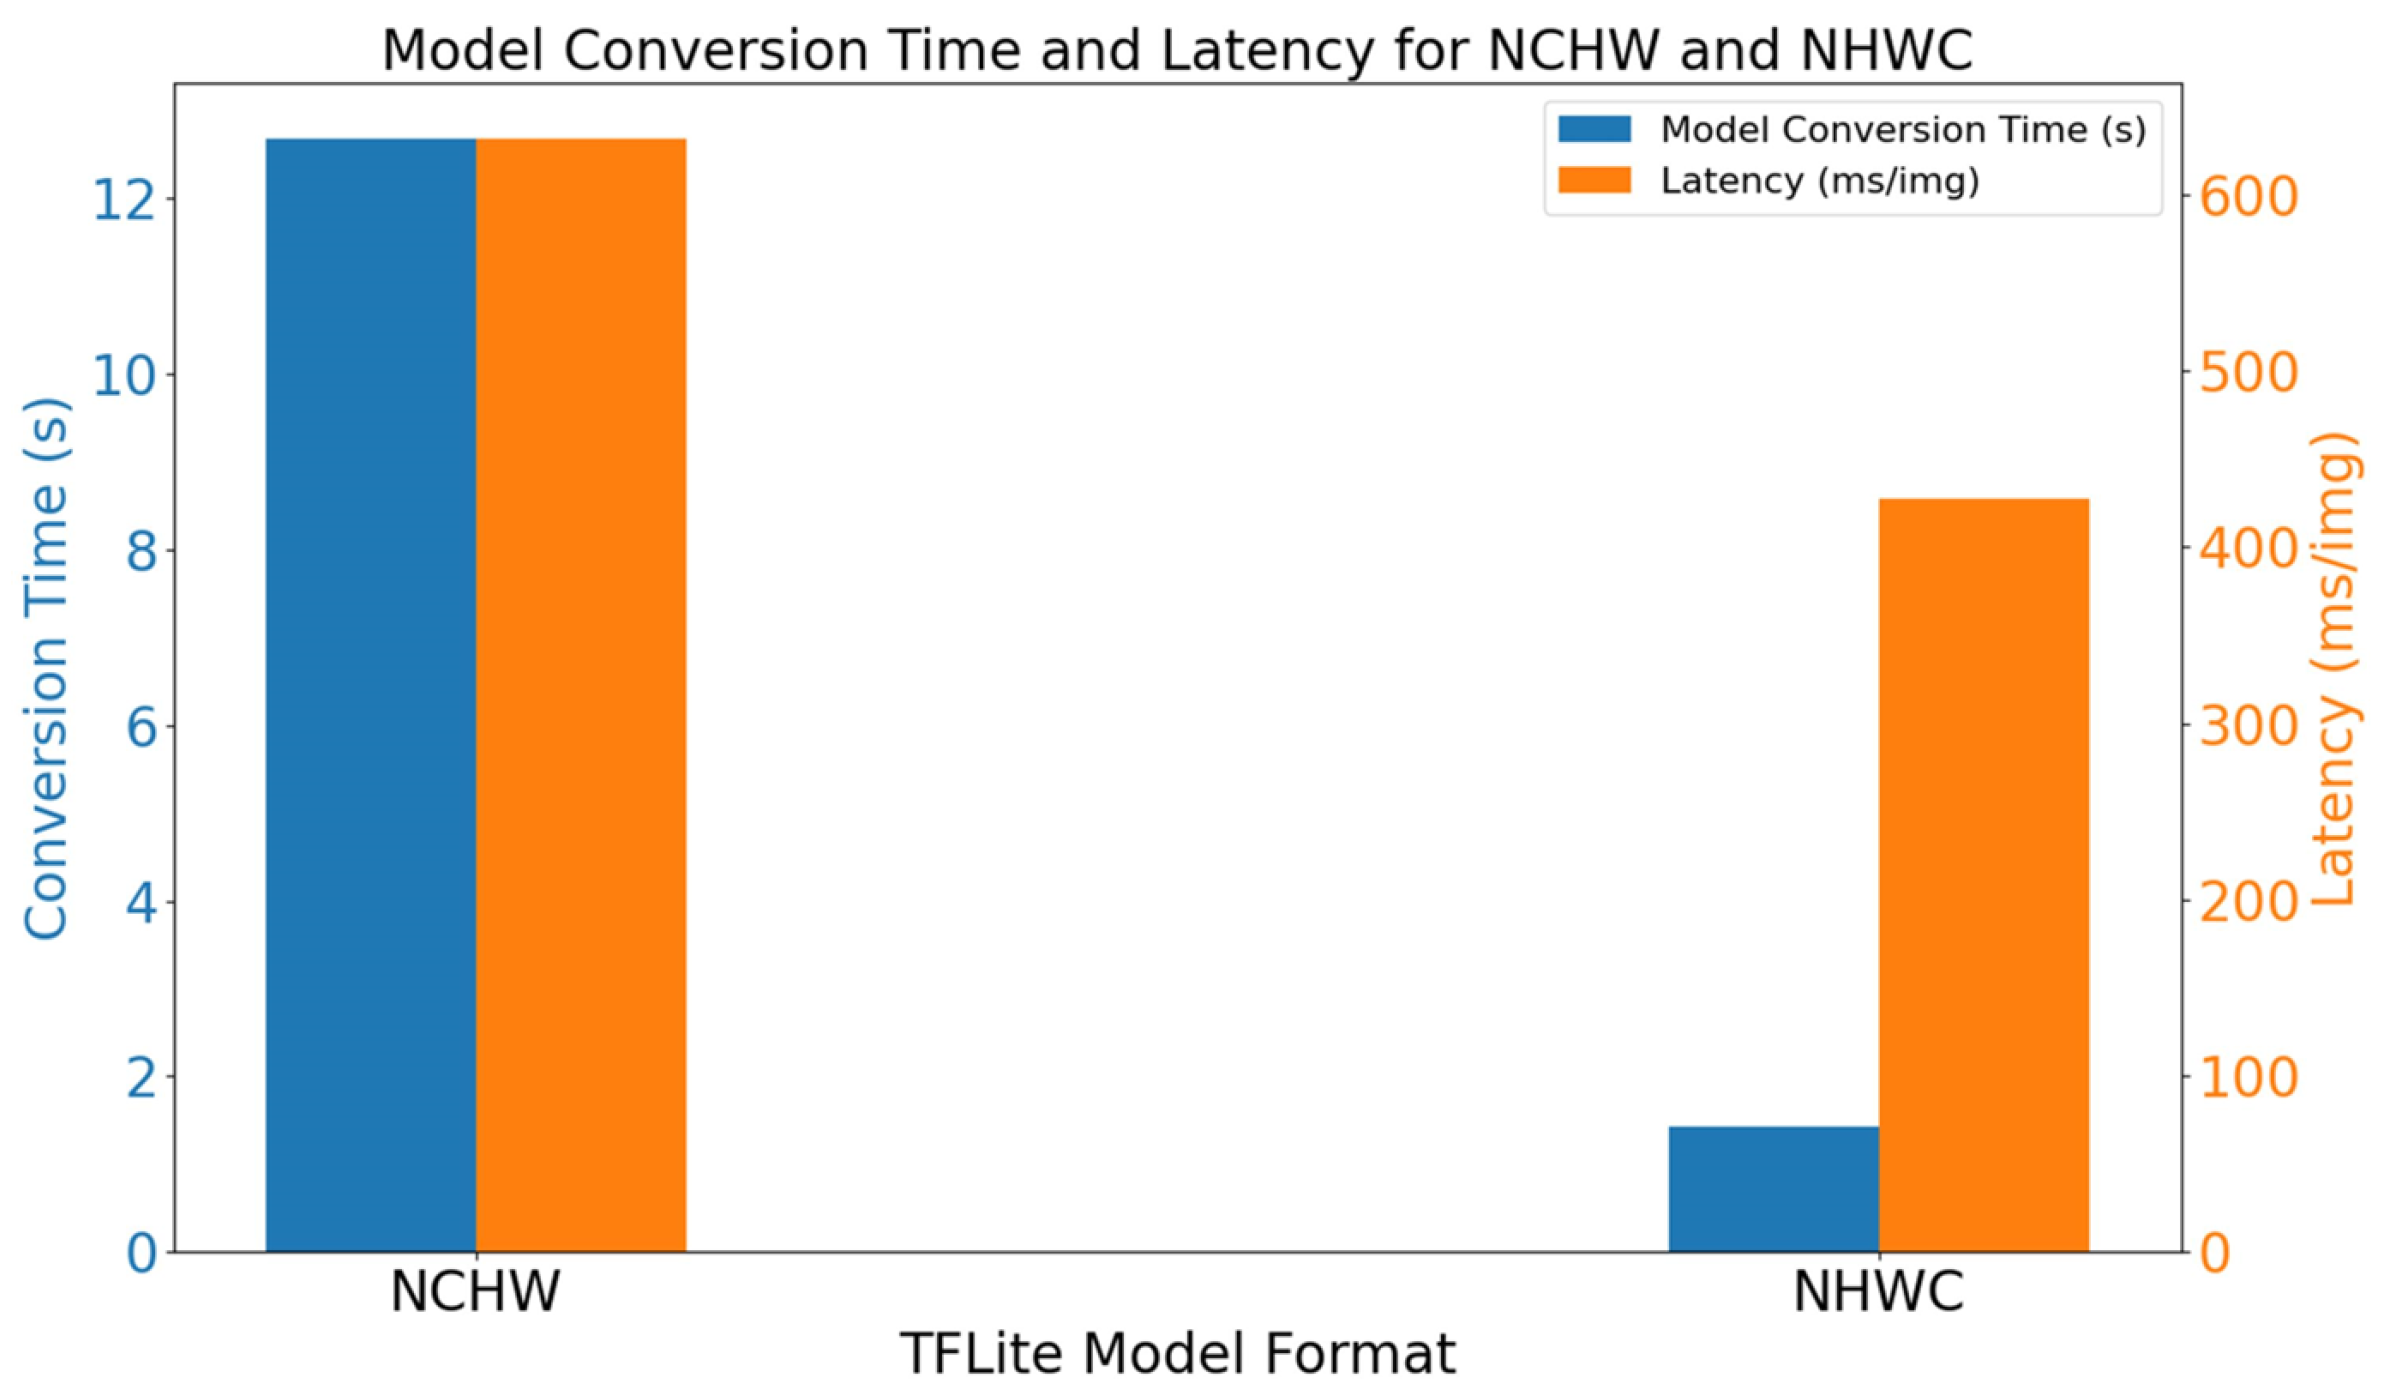
This study addresses the efficient deployment of crop leaf disease detection models in resource-constrained environments. A case study was conducted using the YOLOX-Tiny network on the Jetson Nano B01 device, providing deployment experience regarding the application of crop leaf disease detection models in agricultural field settings and advancing intelligent agricultural applications under resource limitations. The experiments initially focused on three aspects of efficient deployment optimization: the fusion of ReLU and convolution operations, the integration of EfficientNMS_TRT to accelerate post-processing within the TensorRT model, and the conversion of the model format from NCHW to NHWC in the TensorFlow Lite model. Furthermore, TensorRT and TensorFlow Lite were compared in terms of memory usage, power consumption, and inference latency. Finally, a comparative experiment on real-time video detection was conducted by combining EfficientNMS_TRT with DeepStream. This research provides valuable experience for the efficient deployment of crop leaf disease detection models on edge devices in intelligent agriculture.

2. Materials

2.1. Study Area

The peanut leaf disease image data used in this study were collected from the peanut fields at the Yuanyang base of Henan Agricultural University (35°6′45″ N, 113°57′35″ E). Figure 1 presents an overview of the study area. The legend in Figure 1 represents the elevation information for the study area. The green regions correspond to lower elevations, while the red regions correspond to higher elevations, with elevation values ranging from 66 m to 101 m.
The study area was characterized by flat terrain and a light soil texture, providing excellent aeration and drainage conditions, which are conducive to the growth of peanut roots and pods. This region experiences a temperate monsoon climate, with hot and rainy summers and cold, dry winters. The combination of the temperate monsoon climate and favorable soil conditions creates an ideal ecological environment for peanut cultivation, effectively promoting high yields and superior quality. The optimal peanut sowing period in this area occurs between late April and early May, when the soil temperatures are conducive to seed germination and early seedling growth. A planting density of 135,000 plants/ha is employed, utilizing a reasonable planting method that ensures adequate space for each plant while increasing the yield per unit area. Major peanut leaf diseases, including leaf spot, scorch spot, and rust [16], predominantly occur during the middle to late growth stages of peanuts, from August to October. These diseases significantly impact the photosynthetic efficiency and pod development of peanuts, constituting one of the primary factors affecting the high yield and quality of peanuts in this area.

2.2. Collection of the Peanut Leaf Disease Dataset

The Fuji FinePix S4500 camera was utilized for image collection, achieving a maximum resolution of 4608 × 3456 pixels. To thoroughly account for variations in lighting and shooting angles, images were captured under cloudy, sunny, and overcast weather conditions. The data collection process was conducted from 1 September to 3 September 2022, primarily between 10:00 a.m. and 12:00 p.m. and 2:00 p.m. and 5:00 p.m. Due to constraints related to the experimental timeframe and environmental conditions, the three diseases were in the late stages of progression. Consequently, the captured images primarily represented the late stages of disease development. To closely replicate the actual production environment, no manual background processing was performed prior to capturing images of the peanut leaf diseases. After the peanut leaf spot, scorch spot, and rust diseases were identified in the field by a peanut pathology expert, the researchers positioned the camera parallel to the ground and captured vertical-angle images of diseased peanut leaf canopies at heights of 10–20 cm. The locations of the diseased areas on the leaves were manually annotated to facilitate subsequent software-based labeling. A total of 700 images depicting three types of peanut leaf disease were collected, maintaining a balanced proportion among the disease categories. Figure 2 illustrates the peanut leaf spot, scorch spot, and rust diseases.

2.3. Processing of the Peanut Leaf Disease Dataset

To address the issues of sparse disease distribution, leaf occlusion, and insufficient image data regarding peanut leaf diseases, standard data augmentation methods were employed to preprocess the collected images. This approach aimed to increase the data volume and enhance the data’s diversity, thereby facilitating the development of a more effective peanut leaf disease detection model and providing a foundation for its efficient deployment on edge AI devices. Initially, 700 images were collected, with 70% designated as the training set, 15% as the test set, and the remaining 15% as the validation set. Data augmentation techniques, including flipping, Gaussian noise addition, and scaling were applied, with each method being applied to randomly augment 500 images. This process ultimately expanded the training set to 2990 images, resulting in a total dataset of 3200 images. Augmenting the image data mitigated overfitting, enhanced the network model’s learning capacity, and improved its robustness. The original images were first annotated using the LabelImg tool, and the annotations were stored in the COCO format. Subsequently, data augmentation was applied to the training set. Table 1 presents the distribution of the processed dataset. The original data were divided into training, testing, and validation sets to ensure that the testing and validation sets reflected the model’s performance on unseen data. Augmented data, however, were used exclusively in the training set, because the primary goal of data augmentation is to enhance the diversity of the training data and improve the model’s generalization capacity. These augmented samples were generated from the original training set and were not included in the testing or validation sets so as to prevent overlap in the data distribution.

3. Methods

3.1. YOLOX-Tiny

Deep learning-based object detectors are classified into two categories: one-stage detectors and two-stage detectors [17]. Currently, the mainstream object detector, YOLO (You Only Look Once), exemplifies a typical one-stage detector [18] and is distinguished by its superior speed [19,20]. This study employed YOLOX [21], an improved algorithm in the YOLO series, introduced by Megvii in 2021. The backbone and neck structures of the YOLOX network model are notably simple, avoiding complex operators that are detrimental to deployment. Its primary advantages include the adoption of a decoupled head, an anchor-free approach, and SimOTA for dynamic positive sample assignment in the head section, thereby enhancing the network’s detection performance [22]. Furthermore, YOLOX benefits from an active open-source community and detailed deployment cases, enabling researchers to quickly learn and deploy models, thereby reducing the development time. Additionally, YOLOX’s model conversion process is relatively mature. Moreover, it exhibits good compatibility with embedded AI device platforms such as the Jetson Nano B01, facilitating efficient deployment by researchers.
This study employed the YOLOX-Tiny micro-network [23] to execute peanut leaf disease detection tasks, maintaining a high inference speed while delivering satisfactory detection accuracy. Figure 3 illustrates the network architecture of YOLOX-Tiny. The input to the network consisted of 416 × 416 images generated from the original images through preprocessing. The black box highlights the backbone, neck, and prediction components of the network, while the blue boxes represent the submodules within each component. These submodules are stacked to form the final YOLOX-Tiny network structure. The output of the network is a 416 × 416 image generated through prediction. The red box in the image represents the detected leaf spot. During the preprocessing stage of the network, the original images with a resolution of 4608 × 3456 were resized to the target input size of 416 × 416 to meet the input requirements of the YOLOX-Tiny network. First, the minimum scaling ratio between the target size and the original size was calculated, resulting in a resized image with dimensions of 416 × 312. Next, the resized image was padded with 104 gray pixels along the height to achieve the final size of 416 × 416, fully aligning with the input requirements of the YOLOX-Tiny network. Specifically, during both training and testing, the original images were resized to 416 × 416 to meet the input requirements of the YOLOX-Tiny network. Annotations, however, were based on the original image resolution of 4608 × 3456 to ensure consistency and accuracy. Within the backbone of YOLOX-Tiny, the focus structure was initially utilized to process the input peanut leaf disease image data. To enhance the computational efficiency and improve the model’s representational capacity, the backbone is primarily based on the CSPDarknet [24] structure. Additionally, modules such as CSPNet and SPP are integrated to ensure high feature extraction capabilities at low computational costs. The neck adopts the PAN-FPN structure, where FPN serves as a top-down feature pyramid [25], transmitting and fusing high-level feature information through upsampling to enhance the semantic representation of lower layers. In contrast, PAN combines the advantages of PANet and FPN to more effectively strengthen the multi-scale information transmission between feature layers. The head section incorporates optimization strategies including a decoupled head, anchor-free approach, and SimOTA for dynamic positive sample assignment [26]. The decoupled head is responsible for the separation of classification and regression tasks, thereby avoiding interference between the two tasks and improving the model’s detection efficiency, resulting in a more efficient inference process. Traditional anchor-based detection methods increase the complexity of the detection head and the number of predictions per image. Given the limited computational resources of edge AI devices, traditional anchor-based methods can become a bottleneck in terms of inference latency. The anchor-free approach eliminates the use of predefined anchor boxes in object detection, instead directly predicting the position and size of targets through center points or key points, thereby reducing the computational burden of generating and matching anchor boxes and significantly improving the inference speed. SimOTA dynamically selects positive samples for each target, optimizing the label assignment method and thereby enhancing the effectiveness of model training and improving the detection accuracy.

3.2. Deployment of YOLOX-Tiny

3.2.1. Edge-Based Deployment

Deployment strategies for deep neural networks are primarily categorized into two types: (1) cloud-based deployment, which offloads all computational tasks to the cloud, leveraging the cloud’s extensive computational resources to perform complex tasks [27], and (2) edge-based deployment, which executes computations near edge devices, thereby reducing the communication latency and privacy risks [28]. Traditional deep learning models, characterized by large numbers of parameters and high computational complexity, generally necessitate the deployment of crop disease detection models on cloud servers [29]. However, as the number and demand for devices increase, cloud-based solutions become inadequate in meeting the processing and storage requirements. Additionally, uploading data from edge devices to the cloud introduces issues such as communication latency and privacy leakage [30]. In contrast, edge deployment enhances the potential of artificial intelligence by reducing the bandwidth usage and latency [31]. Moreover, cloud–edge collaborative inference combines the advantages of cloud computing and edge computing, requiring a balance between the inference performance and cost. Through rational resource scheduling, the efficiency and service quality can be optimized [32]. This study exclusively considered the deployment of deep neural networks on the edge. The reasons for selecting edge deployment are numerous. Firstly, the variety and number of terminal devices are growing exponentially, and cloud-based deployment solutions, due to their limited scalability, may be unable to accommodate the increasing demand. Furthermore, deployment on the cloud typically results in additional communication latency, which is particularly pronounced in harsh agricultural environments. Secondly, the functionality of edge devices has been significantly increasing, and deployment cases related to edge devices are becoming more numerous [33]. NVIDIA’s Jetson series edge AI devices offer outstanding performance and excellent energy efficiency, and they are gradually replacing previously used edge devices such as the Raspberry Pi, which were primarily designed for Internet of Things applications.

3.2.2. Deployment Framework

In edge-based deployment, common deep neural network frameworks such as TensorFlow and PyTorch are inadequate in executing inference tasks on low-power embedded devices. Consequently, companies such as Google and NVIDIA have developed deep neural network inference frameworks tailored to different devices and platforms. Currently, Google’s TensorFlow Lite (TFLite) and NVIDIA’s TensorRT are among the most popular. TFLite was primarily developed for mobile devices such as iOS and Android, emphasizing compatibility and cross-platform adaptation. Through techniques such as model compression and quantization, TFLite significantly reduces the model size and computational requirements, typically utilizing the CPU for inference [34]. In contrast, TensorRT is specifically optimized for NVIDIA GPUs, employing methods such as operator fusion, memory optimization, and quantization to greatly enhance the inference speed and efficiency of deep neural networks. TensorRT can be implemented in three ways: using the framework’s built-in TRT interface (TF-TRT), converting via the ONNX intermediate format, and building the network using TensorRT’s native API. These two inference frameworks optimize the models from different perspectives, making the deployment of deep neural networks more efficient and flexible across various devices and scenarios.
The YOLOX-Tiny network was initially trained on a Ubuntu host using the PyTorch framework. Upon completion of training, the best-performing weights were saved for further use. The saved PyTorch weights were converted into an intermediate ONNX format within the PyTorch framework. The ONNX model was then transferred to the Jetson Nano B01, where it was separately converted into TensorRT and TFLite models using TensorRT tools and custom scripts. Three efficient deployment optimization methods were applied to enhance both models. After optimization, the models were evaluated and compared in terms of memory usage, power consumption, and inference latency under both frameworks. Finally, the optimized TensorRT model was integrated into the DeepStream pipeline on the Jetson Nano B01 to enable accelerated real-time video detection. The overall deployment process of YOLOX-Tiny is illustrated in Figure 4. In Figure 4A, YOLO-Tiny is deployed on the Jetson Nano B01. Figure 4B illustrates the conversion to the two inference frameworks, TensorRT and TFLite, using the ONNX format. Figure 4C presents three efficient deployment optimization methods. Figure 4D compares the two inference frameworks in terms of memory usage, power consumption, and inference latency. Finally, Figure 4E illustrates real-time video detection using DeepStream.

3.3. Efficient Deployment Optimization

3.3.1. Operator Fusion

Operators, serving as the smallest scheduling units in deep neural networks, typically exist as layers within the network architecture. To reduce the computational overhead, lower the memory bandwidth requirements, decrease the storage of intermediate data, and enhance the inference efficiency [35], researchers have combined multiple operators into single operations. This allows them to be completed within one memory read–write cycle, thereby avoiding unnecessary intermediate computation and memory exchange [36]. As the primary inference framework for mobile and low-power embedded devices, TFLite primarily focuses on operator fusion between basic operators [37], exhibiting lower fusion complexity compared to TensorRT. In contrast, TensorRT not only fuses basic layers but also leverages numerous additional parameters and options internally, merging multiple layers into a single efficient execution unit based on the underlying hardware characteristics [38].
ReLU is a highly simplistic nonlinear activation function, with its computation being straightforward, requiring only a threshold operation on the input. The ReLU function is represented by Equation (1). SiLU, also known as the Swish activation function, involves significantly more complex computations compared to ReLU. Considering the difficulty of fusion and the benefits gained from such integration, this study did not perform the operator fusion of SiLU with convolution. SiLU transforms the input using σ ( x ) , the Sigmoid function, as shown in Equation (2), and subsequently multiplies it by the input itself. Due to the necessity of computing the Sigmoid function and performing multiplication operations, SiLU entails additional computational steps and complexity. The SiLU function is represented by Equation (2). The graphs of SiLU and ReLU are illustrated in Figure 5. The horizontal axis in Figure 5 represents the input values x to Equations (1) and (2), ranging from negative to positive. The vertical axis represents the corresponding output values y of Equations (1) and (2) for the given inputs.
ReLU ( x ) = max ( 0 , x )
SiLU ( x ) = x · σ ( x ) = x 1 + e x
Due to the characteristics of the ReLU activation function, many deep neural network inference frameworks, including TensorRT and TFLite, can easily fuse ReLU with convolution operations. The output of the convolution is represented by Equation (3), where the accumulator denotes the sum of the products between the input feature map and the convolution kernel. Bias[j] refers to the bias term added following convolution, typically appended after the convolutional layer. The convolution output is then processed through the activation function via Equation (4), where activation_fn represents the activation function, which is ReLU in this context. Prior to operator fusion, Equations (3) and (4) indicate that the convolution operations and activation functions are separate. After operator fusion, Equation (5) is obtained.
conv _ output [ i ] [ j ] = accumulator + Bias [ j ]
output [ i ] [ j ] = activation _ fn ( accumulator + Bias [ j ] )
output [ i ] [ j ] = activation _ fn ( conv _ output [ i ] [ j ] )
The accumulated results and bias from the convolution are immediately processed via the activation function, directly yielding the final output. This reduces memory access by performing convolution and activation within the same operation, thereby reducing the computation time and data access associated with intermediate steps. Figure 4C(1) illustrates the fusion of the ReLU and convolution operations.

3.3.2. EfficientNMS_TRT

To achieve the faster and more accurate detection of peanut leaf diseases within the TensorRT framework, the EfficientNMS_TRT operator [39], which efficiently handles non-maximum suppression (NMS) operations, was inserted into the ONNX model and subsequently successfully compiled with TensorRT. Open Neural Network Exchange (ONNX), initiated through a collaboration between Microsoft and Facebook in 2017, is a standardized open format for the description of deep neural networks. It simplifies the portability of deep neural networks across different frameworks and hardware platforms [40]. As a static computation graph, ONNX includes information such as model weights and operators. Operators are the core components that execute specific computations. While ONNX inherently supports several standardized operators, it also allows for custom operators tailored to specific tasks. NMS is a technique used in image processing. As a crucial step in object detection algorithms, the purpose of NMS is to select the optimal candidate bounding boxes from multiple proposed detections [41]. The NMS operation involves ranking the detection boxes based on confidence scores and discarding any box whose overlap with a retained box exceeds a certain threshold. This process not only removes redundant detection boxes but also ensures the accuracy of detection [42]. Typically, NMS is executed separately on the CPU during the post-processing stage; however, this approach is inefficient on edge AI devices with limited computational resources. By integrating NMS into the network, the complexity associated with manually adding post-processing code is reduced, and accelerated processing can be achieved during inference using TensorRT.
EfficientNMS_TRT is a non-maximum suppression (NMS) operation optimized for GPUs, designed to accelerate a critical step in object detection tasks. Depending on the type of input data, EfficientNMS_TRT operates in two modes. The first is the standard NMS mode. In this mode, the inputs are bounding box coordinates and classification scores. This mode functions similarly to traditional NMS by processing decoded bounding boxes and confidence scores, necessitating a decoding step prior to execution. The second is fused box decoding mode. Here, the inputs consist of raw localization predictions, classification scores, and default anchor box coordinates. This mode integrates box decoding with NMS, targeting anchor-based object detection models [43]. However, since YOLOX-Tiny is implemented in an anchor-free manner, the first operating mode was adopted in this study. In this research, NMS was directly integrated into the deep neural network, utilizing CUDA kernels and GPU parallelization to significantly reduce the computational time associated with NMS operations. Additionally, performing NMS directly on the GPU minimizes data transfer between the GPU and CPU, thereby avoiding multiple data copies and unnecessary memory operations, which reduces the memory access overhead. Furthermore, by obtaining directly usable final detection results, the deployment workflow of deep neural networks can be simplified. The input to this module comprises the coordinates of each detected bounding box and the confidence scores for each bounding box across different categories. The outputs are as follows: (1) detection_classes—the detected class labels; (2) detection_scores—the detected confidence scores; (3) detection_boxes—the final bounding box coordinates; (4) num_detections—the total number of detections recorded. Figure 4C(2) shows the insertion of the EfficientNMS_TRT module into the TensorRT model.

3.3.3. NCHW to NHWC

In the TFLite framework, the model input format can be adjusted to match the desired format of the inference framework. Number of samples, channels, height, width (NCHW) and number of samples, height, width, channels (NHWC) are two common tensor data formats, and their performance and efficiency may vary depending on the specific hardware, operations, and deep neural network architecture. In the NCHW format, the channel dimension is the second dimension. This memory layout stores data for each channel consecutively, allowing the GPU to process multiple channels simultaneously through their powerful parallel computing capabilities. Currently, the PyTorch framework primarily adopts the NCHW format. Conversely, in the NHWC format, the channel dimension is the last dimension. Its memory layout stores each row of image pixels consecutively [44], enabling the CPU to access continuous memory blocks more efficiently, thereby reducing the cache miss rates and improving the computational efficiency. Since TensorFlow and TFLite were originally designed for CPU and mobile devices, respectively, the NHWC format is commonly used in both. It is noteworthy that in TFLite, GPU acceleration can be utilized through GPU delegates. However, based on our experiments and the deployment experience of other researchers, this method performs poorly on the Jetson Nano B01 compared to using the CPU alone and does not support some conventional operators [45].
In this study, training was initially conducted using the PyTorch framework, and the resulting model was subsequently converted to an ONNX model, which maintained the NCHW format. Typically, when converting an ONNX model to the TFLite format, the NCHW format is retained. However, this format is not the preferred input format for TFLite, leading to a high number of transpose operations within the TFLite model. During the inference phase, the computational components of deep neural networks account for a substantial portion of the processing time, while rapid data transmission remains critical. Although the computational overhead of transpose operations is minimal, frequent data reordering induces additional memory access and data overheads, thereby decreasing the inference speed. Consequently, this study also involved converting the TFLite model format to NHWC. Figure 4C(3) demonstrates the conversion of the TFLite model from NCHW to NHWC format, thereby reducing the number of redundant transpose operations.

3.4. Experimental Platform

The experimental environment and hardware utilized to train the YOLOX-Tiny neural network included Ubuntu 18.04, Python 3.8, PyTorch 1.8.1, CUDA 11.1, and an RTX 3090 GPU. The specifications of the Jetson Nano B01 device are detailed in Table 2. The versions of TensorRT and TensorFlow Lite employed were 8.2.1 and 2.3.1, respectively, while DeepStream version 6.0 was utilized. For real-time video detection, a USB camera, the Jie Rui Wei Tong DF100, was employed, operating at a resolution of 1280 × 720 and a frame rate of 30 frames per second.

4. Results

4.1. Comparative Experiments on Operator Fusion

Our current work exclusively focused on images representing the late stages of progression for the peanut leaf spot, scorch spot, and rust diseases. The experiments were initially conducted using two activation functions, SiLU and ReLU, over 300 training epochs, resulting in mAP@0.5 and mAP@0.5:0.95 curves, as depicted in Figure 6. Regardless of the activation function employed, the mAP@0.5 curves demonstrated an upward trend for approximately the first 100 epochs. After the 100th epoch, the curves gradually stabilized; however, when the SiLU activation function was utilized, an approximately 3% increase in the mAP@0.5 was observed during the final 50 epochs. Additionally, the trends of the mAP@0.5:0.95 curves were similar for both activation functions, with the differences in the values remaining within approximately 2% throughout the entire training process. Upon the completion of 300 epochs, the final values of the mAP@0.5 and mAP@0.5:0.95 reached 93.93% and 85.44%, respectively, when using the SiLU activation function, compared to 90.90% and 87.00% with the ReLU activation function. The fusion of ReLU and convolution operations can reduce the number of kernel calls, thereby enhancing the inference speed. In contrast, the relatively complex activation function SiLU does not support automatic fusion in most current inference frameworks, as it requires one to balance the difficulty of fusion with the benefits gained from such integration. Subsequently, YOLOX-Tiny models employing both activation functions were deployed on the TFLite and TensorRT frameworks; the ReLU activation function was fused with convolution operations, whereas operator fusion was not performed for SiLU. Table 3 presents the mAP@0.5 and mAP@0.5:0.95 results for the leaf spot, scorch spot, and rust diseases in the test set when using the SiLU and ReLU activation functions. The relatively low mAP for leaf spot and scorch spot may be attributed to the small size of the lesions and their less distinct features. In contrast, rust disease typically forms prominent rust-colored spots on the leaves, exhibiting more distinguishable characteristics, which makes it easier to identify.
Table 4 presents the inference latency of SiLU and ReLU under the different frameworks. In the TFLite framework, with the batch size set to 1, single image inference was performed 30 times using SiLU and ReLU, resulting in average inference latencies of 563.4 ms and 427.6 ms, respectively. The inference latency with ReLU was reduced by 24.1% compared to SiLU. In the TensorRT framework, also with a batch size of 1, the inference latency when using ReLU was reduced by 26.7% compared to SiLU. However, this difference cannot be solely attributed to the fusion of ReLU with convolution operations, as it may also stem from the inherent differences between the activation functions. Therefore, to confirm that the fusion of ReLU and convolution operations accelerates the inference speed, a batch size of 64 was employed for batch processing within the TensorRT framework. Similarly, based on the average inference latency from 30 consecutive inferences, the SiLU function resulted in an average latency of 97.0 ms, whereas ReLU achieved an average latency of 43.1 ms, representing a 55.5% reduction. Considering the mAP@0.5 and mAP@0.5:0.95 results illustrated in Figure 6, the selection of activation functions should be based on the specific application scenario to achieve a balance between accuracy and inference latency. It was confirmed by the experimental results that integrating ReLU and convolution operations can indeed reduce the model’s inference latency, serving as an efficient approach to deployment optimization.

4.2. Comparative Experiments on EfficientNMS_TRT

EfficientNMS_TRT, which is an NMS operator optimized for GPUs, was integrated into the ONNX model and successfully compiled using TensorRT. Seven different batch sizes were set for the inference experiments. When a batch size of 128 was configured, the 4 GB memory of the Jetson Nano B01 prevented normal inference. In each scenario, 30 inferences were conducted, and the average inference latency was calculated, followed by the computation of the FPS. Additionally, inferences were performed using both FP32 and FP16 precision. This experiment employed post-training quantization (PTQ). This approach involves quantizing the model after training, making it both convenient and effective. Therefore, it was adopted in this study to optimize the model performance while simplifying the deployment process. Table 5 shows the comparative impacts of EfficientNMS_TRT on the inference performance across different batch sizes. In this study, the symbols and × were used to indicate whether a specific module or tool was utilized. Specifically, denotes that the module or tool was used, while × indicates that it was not used. To ensure the data’s robustness, post-processing operations were included during inference when EfficientNMS_TRT was not integrated. With FP32 precision inference, the inference latency per image was reduced by approximately 3.9% to 14.7%, and the FPS increased by approximately 4.1% to 17.3%. With FP16 precision inference, the inference latency per image was reduced by approximately 4.5% to 19.6%, and the FPS increased by approximately 4.8% to 20.4%. Table 5 demonstrates that incorporating EfficientNMS_TRT into the network and utilizing GPU-parallelized post-processing operations is an efficient method for the deployment of deep neural networks. This approach not only accelerates the inference process but also simplifies the deployment workflow.

4.3. Comparative Experiments on Model Format

The YOLOX-Tiny network was first trained on a Ubuntu host using the PyTorch framework. After training, the best-performing weights were saved. These weights were subsequently converted into an intermediate ONNX format within the PyTorch framework. The ONNX model was then transferred to the Jetson Nano B01, where it was converted into TFLite models using custom scripts. When the ONNX model was converted into TFLite format, the default conversion process did not typically account for the model’s input format. As a result, the NCHW format was changed to NHWC during the conversion procedure. This measure not only aligned with the primarily CPU-based inference of TFLite but also significantly reduced the number of unnecessary transpose operations. Although such operations are not computationally intensive, they incur extra memory access and data transfer costs, thereby slowing the inference speed.
After two distinct TFLite models were obtained through different conversion methods, their respective conversion times were recorded. Subsequently, an image inference task for peanut leaf disease, with a batch size of 1, was performed, and the average latency over 30 runs was measured for comparison. The results regarding the conversion time and inference latency are presented in Figure 7. Conversion using the NCHW format required 12.68 s, whereas the NHWC format conversion took only 1.43 s, marking a reduction of approximately 88.7%. On the one hand, the average inference latency of the NCHW-based model reached 631.9 ms. On the other hand, the model converted with the NHWC method yielded an average inference latency of 427.6 ms, decreasing by approximately 32.3%. It can be concluded from the above findings that faster model conversion and lower inference latency are attainable on the Jetson Nano B01 when adopting the NHWC format in TFLite, making this an efficient strategy for deployment optimization.

4.4. Comparative Experiments on Deployment Framework

The aforementioned efficient deployment optimization methods were applied to execute a peanut leaf disease identification task on both the TensorRT and TFLite deep neural network inference frameworks. These frameworks were evaluated on the Jetson Nano B01 in terms of memory usage, power consumption, and inference latency. Due to its optimization for parallel computation, the GPU is capable of processing multiple data points simultaneously, whereas the CPU is designed for general-purpose tasks and lacks the hardware acceleration necessary for deep learning tasks. As a result, the performance of CPU-based batch processing in TFLite is significantly lower than that of GPU-based processing on the Jetson Nano B01. A batch size of one was used for all experiments. To collect sufficient data, each framework was used to perform inference on the same image 30 times. The memory usage and power consumption were recorded every second, and the box plot in Figure 8 illustrates these measurements.
The results indicated that, when the peanut leaf disease inference task was performed with a batch size of one, TFLite exhibited relatively stable memory usage, whereas TensorRT demonstrated greater variability in memory consumption. Furthermore, TFLite’s overall memory utilization was approximately 15% to 20% lower than that of TensorRT. Although TFLite’s power consumption fluctuated more significantly, it remained approximately 15% to 25% lower than that of TensorRT. After the memory usage and power consumption were measured for both TensorRT and TFLite, their inference latencies under FP32 and FP16 precision, using a batch size of one, were recorded in Table 6. By examining Figure 8, it can be observed that TFLite maintained advantages in terms of memory usage and power consumption when performing single-image peanut leaf inference on the Jetson Nano B01. However, TensorRT achieved a 53.2% to 55.2% reduction in inference latency compared to TFLite. This discrepancy in memory usage and power consumption is largely attributable to TFLite’s design, which targets low-power embedded and mobile devices by optimizing these two factors. In contrast, TensorRT’s higher memory utilization and power consumption facilitated faster inference, aligning with its focus on high-performance inference.

4.5. Real-Time Video Detection Experiment

In order to validate the real-time detection performance of the YOLOX-Tiny network in actual peanut fields, a 30-s video was recorded using the Jie Rui Wei Tong DF100 USB camera for model testing, at a resolution of 1280 × 720 and a frame rate of 30 fps. Because TFLite is comparatively weaker than TensorRT in real-time video detection, the experiments were conducted using TensorRT. DeepStream, which was released by NVIDIA and developed based on the Gstreamer framework, is a comprehensive stream analytics toolkit designed for real-time video and image processing. Video transmission and memory management were optimized for NVIDIA GPUs in DeepStream, thereby reducing the data transfer overhead between the CPU and GPU [46]. In addition, DeepStream was specifically optimized for edge AI devices to enable more efficient inference.
At this stage, four comparative experiments were carried out under FP16 precision: (1) direct inference using the TensorRT model; (2) direct inference using the TensorRT model with the EfficientNMS_TRT plugin; (3) inference by integrating the TensorRT model into a DeepStream pipeline; (4) inference by integrating the TensorRT model with the EfficientNMS_TRT plugin into a DeepStream pipeline. According to Table 7, the respective average frame rates were 13.2 FPS, 15.4 FPS, 24.1 FPS, and 28.7 FPS. The corresponding memory usage and power consumption values, presented in Table 6 as averages, reveal that at the highest frame rate, the memory usage and power consumption reached 55.4% and 2826.1 mW, respectively. These results indicate that inserting EfficientNMS_TRT into the TensorRT model and integrating it into the DeepStream pipeline, while incurring higher memory and power costs, significantly improves the real-time video detection throughput.
Figure 9 displays four sample frames chosen from the fourth set of experiments. In this study, YOLOX-Tiny was used for the real-time detection of peanut leaf diseases in video streams, and the process was accelerated with DeepStream to achieve higher real-time performance and accuracy. This approach provides practical insights for the efficient deployment of crop leaf disease detection models and could contribute to advancing modern agriculture toward enhanced intelligence and precision.

5. Discussion

Many previous investigations have focused on improving deep neural network architectures to enhance the accuracy of crop leaf disease recognition. Different object detection networks have been adopted for various detection tasks. Lin et al. [47] introduced an improved YOLOv8n model that integrated FasterNeXt, depthwise separable convolution, and the generalized intersection over union (GIoU_Loss) function to achieve the real-time detection of peanut leaf diseases while maintaining high accuracy. Chen et al. [48] proposed the CACPNET model, which combined an efficient channel attention (ECA) module with channel pruning, making it suitable for the recognition of common plant diseases. On the other hand, Guo et al. [49] constructed a peanut leaf spot prediction model by feeding feature maps—derived from a CNN enhanced with a squeeze-and-excitation (SE) module—into a long short-term memory (LSTM) network, using multi-year meteorological data and peanut leaf spot occurrence records.
Significant contributions to peanut leaf disease detection tasks have been made by the aforementioned researchers. Considering that their work primarily focused on the algorithm research phase, the present study primarily involved the deployment of object detection networks, thereby providing other researchers with insights into the efficient deployment of such networks. Consequently, YOLOX-Tiny was initially selected for deployment on the Jetson Nano B01 as a case study for peanut leaf disease detection. Subsequently, three efficient deployment optimization methods were analyzed. First, the impact of the ReLU activation function on the inference latency was examined from the perspective of operator fusion. Additionally, optimizations within the TensorRT and TFLite models were studied separately. The former was optimized by inserting EfficientNMS_TRT to accelerate the model’s post-processing section, while the latter involved converting the model’s NCHW format to the NHWC format, which is more suitable for TFLite models. Furthermore, inference tasks on peanut leaf disease images were performed with a batch size of one, and the performance differences in the YOLOX-Tiny network under the TensorRT and TFLite inference frameworks were compared in terms of memory usage, power consumption, and inference latency. Finally, within the TensorRT framework, the more efficient real-time video detection of peanut leaf diseases was achieved through the use of EfficientNMS_TRT and DeepStream.
Several limitations remained in our experiments. Firstly, the YOLOX-Tiny network was initially selected due to its structural simplicity and mature deployment strategies. However, regarding the model’s detection capabilities, the currently employed YOLOX-Tiny network exhibits some challenges in accurately detecting peanut leaf diseases. Since the disease targets on peanut leaves are generally small, there is a need to enhance the model’s ability to detect small objects. Secondly, in terms of inference frameworks, TensorRT and TFLite were utilized to achieve the efficient inference of the object detection network. Nevertheless, this approach introduces certain constraints. For instance, on non-NVIDIA hardware, the implementation cannot be fully replicated, necessitating model adjustments. Additionally, this study was developed using Python, whereas C++ is more suitable for high-performance inference tasks.
Consequently, the pursuit of future work remains highly significant. On one hand, the structure of object detection networks can be optimized by incorporating lightweight modules, such as the CBAM or depthwise separable convolution. These modules enhance the feature extraction capabilities without substantially increasing the model’s complexity; however, specialized optimization is still required during the deployment phase. Furthermore, the adoption of more advanced object detection networks is necessary to address the complexities and challenges inherent in peanut leaf disease detection. Thus, object detection networks can be custom-optimized for edge AI devices, thereby improving the model accuracy and real-time performance and further promoting the widespread application of peanut leaf disease detection technology in agriculture. On the other hand, to overcome the limitations associated with the reliance on specific inference frameworks, future work should explore model compression techniques such as pruning, distillation, and quantization. Pruning removes redundant or insignificant weights and neurons from the model, thereby reducing its size. Distillation transfers knowledge from models with superior recognition capabilities to those requiring optimization, maintaining high recognition accuracy for peanut leaf diseases. In this study, PTQ was employed, which directly quantizes weights and activation values after model training. Conversely, quantization-aware training (QAT) simulates quantization operations during training, achieving higher precision. These techniques can significantly reduce the model complexity and enhance the inference efficiency, facilitating more efficient deployment on edge AI devices. This, in turn, can improve the efficiency and accuracy of agricultural leaf disease detection, further advancing the application and development of deep neural networks in modern agriculture and providing technical support for precision agriculture and sustainable development.

6. Conclusions

In this study, an optimized solution was developed for the efficient deployment of the YOLOX-Tiny peanut leaf disease detection model on the Jetson Nano B01 in resource-constrained agricultural environments.
The conclusions of this research are as follows.
  • The fusion of the ReLU activation function with convolution operations reduced the inference latency by 55.5% compared to using SiLU alone. In the TensorRT model, the insertion of the EfficientNMS_TRT module accelerated the model’s post-processing, resulting in a 19.6% decrease in the inference latency and a 20.4% increase in the FPS. In the TensorFlow Lite model, conversion to the NHWC format decreased the model conversion time by 88.7% and the inference latency by 32.3%. These three efficient deployment optimization methods effectively lowered the inference latency and enhanced the inference efficiency.
  • A comparison between the two frameworks revealed that TensorFlow Lite exhibited 15% to 20% lower memory usage and 15% to 25% lower power consumption compared to TensorRT. However, TensorRT achieved a 53.2% to 55.2% reduction in inference latency relative to TFLite. TensorRT is thus suitable for tasks requiring high real-time performance and low latency, whereas TFLite is more appropriate for scenarios with constraints on memory and power consumption.
  • The combination of DeepStream and EfficientNMS_TRT maximized the memory and power utilization, thereby enhancing the real-time video detection speed. At a resolution of 1280 × 720, a frame rate of 28.7 FPS was attained.

Author Contributions

Conceptualization, Z.L. and H.Z.; data curation, Z.L. and S.Y.; formal analysis, S.M.; funding acquisition, H.Z.; investigation, H.Z.; methodology, Z.L. and S.Y.; project administration, H.Z.; resources, H.Z.; software, Q.W.; supervision, Y.G. and Q.W.; validation, J.S., L.D. and J.H.; visualization, Y.G.; writing—original draft, Z.L.; writing—review and editing, H.Z. All authors have read and agreed to the published version of the manuscript.

Funding

This research was funded by the National Natural Science Foundation of China (No. 32271993) and the Key Scientific and Technological Project of Henan Province (No. 242102111193).

Institutional Review Board Statement

Not applicable.

Informed Consent Statement

Not applicable.

Data Availability Statement

The datasets presented in this article are not readily available because the data are part of an ongoing study. Requests to access the datasets should be directed to huizi@henau.edu.cn.

Acknowledgments

The authors thank the College of Information and Management Sciences of Henan Agricultural University.

Conflicts of Interest

The authors declare no conflicts of interest.

References

  1. Chen, T.; Yang, W.; Zhang, H.; Zhu, B.; Zeng, R.; Wang, X.; Wang, S.; Wang, L.; Qi, H.; Lan, Y.; et al. Early detection of bacterial wilt in peanut plants through leaf-level hyperspectral and unmanned aerial vehicle data. Comput. Electron. Agric. 2020, 177, 105708. [Google Scholar] [CrossRef]
  2. Yu, B.; Jiang, H.; Pandey, M.K.; Huang, L.; Huai, D.; Zhou, X.; Kang, Y.; Varshney, R.K.; Sudini, H.K.; Ren, X.; et al. Identification of two novel peanut genotypes resistant to aflatoxin production and their SNP markers associated with resistance. Toxins 2020, 12, 156. [Google Scholar] [CrossRef]
  3. Akkem, Y.; Biswas, S.K.; Varanasi, A. Smart farming using artificial intelligence: A review. Eng. Appl. Artif. Intell. 2023, 120, 105899. [Google Scholar] [CrossRef]
  4. Attri, I.; Awasthi, L.K.; Sharma, T.P.; Rathee, P. A review of deep learning techniques used in agriculture. Ecol. Inform. 2023, 77, 102217. [Google Scholar] [CrossRef]
  5. Liu, J.; Xiang, J.; Jin, Y.; Liu, R.; Yan, J.; Wang, L. Boost precision agriculture with unmanned aerial vehicle remote sensing and edge intelligence: A survey. Remote Sens. 2021, 13, 4387. [Google Scholar] [CrossRef]
  6. Koubaa, A.; Ammar, A.; Kanhouch, A.; AlHabashi, Y. Cloud versus edge deployment strategies of real-time face recognition inference. IEEE Trans. Netw. Sci. Eng. 2021, 9, 143–160. [Google Scholar] [CrossRef]
  7. Ranjana, P.; Reddy, J.P.K.; Manoj, J.B.; Sathvika, K. Plant Leaf Disease Detection Using Mask R-CNN. In Ambient Communications and Computer Systems: Proceedings of RACCCS 2021; Springer: Singapore, 2022; pp. 303–314. [Google Scholar]
  8. Sun, H.; Xu, H.; Liu, B.; He, D.; He, J.; Zhang, H.; Geng, N. MEAN-SSD: A novel real-time detector for apple leaf diseases using improved light-weight convolutional neural networks. Comput. Electron. Agric. 2021, 189, 106379. [Google Scholar] [CrossRef]
  9. Lin, J.; Yu, D.; Pan, R.; Cai, J.; Liu, J.; Zhang, L.; Wen, X.; Peng, X.; Cernava, T.; Oufensou, S.; et al. Improved YOLOX-Tiny network for detection of tobacco brown spot disease. Front. Plant Sci. 2023, 14, 1135105. [Google Scholar] [CrossRef]
  10. Li, R.; Li, Y.; Qin, W.; Abbas, A.; Li, S.; Ji, R.; Wu, Y.; He, Y.; Yang, J. Lightweight Network for Corn Leaf Disease Identification Based on Improved YOLO v8s. Agriculture 2024, 14, 220. [Google Scholar] [CrossRef]
  11. Sangaiah, A.K.; Yu, F.N.; Lin, Y.B.; Shen, W.C.; Sharma, A. UAV T-YOLO-Rice: An Enhanced Tiny Yolo Networks for Rice Leaves Diseases Detection in Paddy Agronomy. IEEE Trans. Netw. Sci. Eng. 2024, 11, 5201–5216. [Google Scholar] [CrossRef]
  12. Li, Y.; Wang, J.; Wu, H.; Yu, Y.; Sun, H.; Zhang, H. Detection of powdery mildew on strawberry leaves based on DAC-YOLOv4 model. Comput. Electron. Agric. 2022, 202, 107418. [Google Scholar] [CrossRef]
  13. Gajjar, R.; Gajjar, N.; Thakor, V.J.; Patel, N.P.; Ruparelia, S. Real-time detection and identification of plant leaf diseases using convolutional neural networks on an embedded platform. Vis. Comput. 2022, 38, 2923–2938. [Google Scholar] [CrossRef]
  14. Xie, Z.; Li, C.; Yang, Z.; Zhang, Z.; Jiang, J.; Guo, H. YOLOv5s-BiPCNeXt, a Lightweight Model for Detecting Disease in Eggplant Leaves. Plants 2024, 13, 2303. [Google Scholar] [CrossRef]
  15. Stäcker, L.; Fei, J.; Heidenreich, P.; Bonarens, F.; Rambach, J.; Stricker, D.; Stiller, C. Deployment of deep neural networks for object detection on edge ai devices with runtime optimization. In Proceedings of the IEEE/CVF International Conference on Computer Vision, Montreal, BC, Canada, 10–17 October 2021; pp. 1015–1022. [Google Scholar]
  16. Xu, L.; Cao, B.; Ning, S.; Zhang, W.; Zhao, F. Peanut leaf disease identification with deep learning algorithms. Mol. Breed. 2023, 43, 25. [Google Scholar] [CrossRef]
  17. Zou, Z.; Chen, K.; Shi, Z.; Guo, Y.; Ye, J. Object detection in 20 years: A survey. Proc. IEEE 2023, 111, 257–276. [Google Scholar] [CrossRef]
  18. Han, X.; Chang, J.; Wang, K. You only look once: Unified, real-time object detection. Procedia Comput. Sci. 2021, 183, 61–72. [Google Scholar] [CrossRef]
  19. Xiao, Y.; Tian, Z.; Yu, J.; Zhang, Y.; Liu, S.; Du, S.; Lan, X. A review of object detection based on deep learning. Multimed. Tools Appl. 2020, 79, 23729–23791. [Google Scholar] [CrossRef]
  20. Jiang, P.; Ergu, D.; Liu, F.; Cai, Y.; Ma, B. A Review of Yolo algorithm developments. Procedia Comput. Sci. 2022, 199, 1066–1073. [Google Scholar] [CrossRef]
  21. Ge, Z. Yolox: Exceeding yolo series in 2021. arXiv 2021, arXiv:2107.08430. [Google Scholar]
  22. Han, J.; Yang, G.; Wei, H.; Gong, W.; Qian, Y. ST-YOLOX: A lightweight and accurate object detection network based on Swin Transformer. J. Supercomput. 2024, 80, 8038–8059. [Google Scholar] [CrossRef]
  23. Ru, C.; Zhang, S.; Qu, C.; Zhang, Z. The high-precision detection method for insulators’ self-explosion defect based on the unmanned aerial vehicle with improved lightweight ECA-YOLOX-Tiny model. Appl. Sci. 2022, 12, 9314. [Google Scholar] [CrossRef]
  24. Zhang, D.; Hao, X.; Liang, L.; Liu, W.; Qin, C. A novel deep convolutional neural network algorithm for surface defect detection. J. Comput. Des. Eng. 2022, 9, 1616–1632. [Google Scholar] [CrossRef]
  25. Aubard, M.; Antal, L.; Madureira, A.; Ábrahám, E. Knowledge Distillation in YOLOX-ViT for Side-Scan Sonar Object Detection. arXiv 2024, arXiv:2403.09313. [Google Scholar]
  26. Zhao, Y.; Yang, Y.; Chen, S. An Active Semi-Supervised Learning for Object Detection. In Proceedings of the 2023 International Conference on Culture-Oriented Science and Technology (CoST), Xi’an, China, 11–14 October 2023; pp. 257–261. [Google Scholar]
  27. Shevlane, T. Structured access: An emerging paradigm for safe AI deployment. arXiv 2022, arXiv:2201.05159. [Google Scholar]
  28. Islam, J.; Kumar, T.; Kovacevic, I.; Harjula, E. Resource-aware dynamic service deployment for local iot edge computing: Healthcare use case. IEEE Access 2021, 9, 115868–115884. [Google Scholar] [CrossRef]
  29. Yu, X.; Yang, M.; Zhang, H.; Li, D.; Tang, Y.; Yu, X. Research and Application of Crop Diseases Detection Method Based on Transfer Learning. Trans. Chin. Soc. Agric. Mach. 2020, 51, 252–258. [Google Scholar]
  30. Gu, R.; Niu, C.; Wu, F.; Chen, G.; Hu, C.; Lyu, C.; Wu, Z. From server-based to client-based machine learning: A comprehensive survey. ACM Comput. Surv. (CSUR) 2021, 54, 1–36. [Google Scholar] [CrossRef]
  31. Ma, F.; Wang, B.; Dong, X.; Wang, H.; Luo, P.; Zhou, Y. Power vision edge intelligence: Power depth vision acceleration technology driven by edge computing. Power Syst. Technol. 2020, 44, 2020–2029. [Google Scholar]
  32. Rui, W.; Jianpeng, Q.; Liang, C.; Long, Y. Survey of Collaborative Inference for Edge Intelligence. J. Comput. Res. Dev. 2023, 60, 398–414. [Google Scholar]
  33. Shuvo, M.M.H.; Islam, S.K.; Cheng, J.; Morshed, B.I. Efficient acceleration of deep learning inference on resource-constrained edge devices: A review. Proc. IEEE 2022, 111, 42–91. [Google Scholar] [CrossRef]
  34. Nair, S.; Abbasi, S.; Wong, A.; Shafiee, M.J. Maple-edge: A runtime latency predictor for edge devices. In Proceedings of the IEEE/CVF Conference on Computer Vision and Pattern Recognition, New Orleans, LA, USA, 18–24 June 2022; pp. 3660–3668. [Google Scholar]
  35. Niu, W.; Guan, J.; Wang, Y.; Agrawal, G.; Ren, B. Dnnfusion: Accelerating deep neural networks execution with advanced operator fusion. In Proceedings of the 42nd ACM SIGPLAN International Conference on Programming Language Design and Implementation, Virtual, 20–25 June 2021; pp. 883–898. [Google Scholar]
  36. Cai, X.; Wang, Y.; Zhang, L. Optimus: An operator fusion framework for deep neural networks. ACM Trans. Embed. Comput. Syst. 2022, 22, 1–26. [Google Scholar] [CrossRef]
  37. TensorFlow Lite. Available online: https://www.tensorflow.org/lite/guide (accessed on 24 December 2024).
  38. TensorRT. Available online: https://developer.nvidia.com/tensorrt (accessed on 24 December 2024).
  39. Zhao, Y.; Lv, W.; Xu, S.; Wei, J.; Wang, G.; Dang, Q.; Liu, Y.; Chen, J. Detrs beat yolos on real-time object detection. In Proceedings of the IEEE/CVF Conference on Computer Vision and Pattern Recognition, Seattle, WA, USA, 17–18 June 2024; pp. 16965–16974. [Google Scholar]
  40. Shin, D.J.; Kim, J.J. A deep learning framework performance evaluation to use YOLO in Nvidia Jetson platform. Appl. Sci. 2022, 12, 3734. [Google Scholar] [CrossRef]
  41. Gong, M.; Wang, D.; Zhao, X.; Guo, H.; Luo, D.; Song, M. A review of non-maximum suppression algorithms for deep learning target detection. In Proceedings of the Seventh Symposium on Novel Photoelectronic Detection Technology and Applications. SPIE, Kunming, China, 5–7 November 2021; Volume 11763, pp. 821–828. [Google Scholar]
  42. Symeonidis, C.; Mademlis, I.; Pitas, I.; Nikolaidis, N. Neural attention-driven non-maximum suppression for person detection. IEEE Trans. Image Process. 2023, 32, 2454–2467. [Google Scholar] [CrossRef] [PubMed]
  43. EfficientNMSPlugin. Available online: https://github.com/NVIDIA/TensorRT/tree/main/plugin/efficientNMSPlugin (accessed on 24 December 2024).
  44. Fu, X.; Zhang, X.; Ma, J.; Zhao, P.; Lu, S.; Liu, X.T. High Performance Im2win and Direct Convolutions using Three Tensor Layouts on SIMD Architectures. arXiv 2024, arXiv:2408.00278. [Google Scholar]
  45. qengineering. Available online: https://qengineering.eu/install-tensorflow-2-lite-on-jetson-nano.html (accessed on 24 December 2024).
  46. NVIDIADeepStreamSDK. Available online: https://developer.nvidia.com/deepstream-sdk (accessed on 24 December 2024).
  47. Lin, Y.; Wang, L.; Chen, T.; Liu, Y.; Zhang, L. Monitoring system for peanut leaf disease based on a lightweight deep learning model. Comput. Electron. Agric. 2024, 222, 109055. [Google Scholar] [CrossRef]
  48. Chen, R.; Qi, H.; Liang, Y.; Yang, M. Identification of plant leaf diseases by deep learning based on channel attention and channel pruning. Front. Plant Sci. 2022, 13, 1023515. [Google Scholar] [CrossRef] [PubMed]
  49. Guo, Z.; Chen, X.; Li, M.; Chi, Y.; Shi, D. Construction and validation of peanut leaf spot disease prediction model based on long time series data and deep learning. Agronomy 2024, 14, 294. [Google Scholar] [CrossRef]
Figure 1. Overview of the study area.
Agriculture 15 00332 g001
Figure 2. Peanut leaf diseases: (a) leaf spot, (b) scorch spot, (c) rust disease.
Agriculture 15 00332 g002
Figure 3. YOLOX-Tiny model structure diagram.
Agriculture 15 00332 g003
Figure 4. Overall deployment process.
Agriculture 15 00332 g004
Figure 5. SiLU and ReLU.
Agriculture 15 00332 g005
Figure 6. The map@0.5 and map@0.5:0.95 results.
Agriculture 15 00332 g006
Figure 7. Model conversion time and latency.
Agriculture 15 00332 g007
Figure 8. Memory and power consumption.
Agriculture 15 00332 g008
Figure 9. Real-time video detection.
Agriculture 15 00332 g009
Table 1. Dataset distribution.
Augmentation MethodTraining SetTest SetValidation SetTotal
Original Dataset490105105700
Horizontal Flip50000500
Vertical Flip50000500
Horizontal and Vertical Flip50000500
Gaussian Noise50000500
Scaling50000500
Total29901051053200
Table 2. Jetson Nano B01.
ParameterTechnical Specification
AI performance472 GFLOPS
CUDA Parallel Processing Cores4-core ARM A57 @ 1.43 GHz
GPU128 CUDA cores Maxwell @ 921 MHz
Memory4 GB LPDDR4, 25 GB/s
StorageMicroSD
Power5 W–10 W
Jetpack Version4.6.1
Table 3. The mAP@0.5 and mAP@0.5:0.95 results for the three peanut leaf diseases.
Peanut Leaf Disease mAP@0.5 mAP@0.5:0.95
SiLUReLUSiLUReLU
Leaf Spot 86.1% 84.6% 80.9% 81.5%
Scorch Spot 89.3% 86.2% 83.2% 83.0%
Rust Disease 93.8% 90.2% 85.7% 87.4%
Table 4. Comparative results for SiLU and ReLU.
Batch SizeActivation FunctionInference FrameworkLatency (ms/img)
1SiLUTFLite563.4
1ReLUTFLite427.6
1SiLUTensorRT284.5
1ReLUTensorRT208.3
64SiLUTensorRT97.0
64ReLUTensorRT43.1
Table 5. Comparative results for EfficientNMS_TRT in terms of inference latency and FPS.
Batch Size FP32 Latency (ms/img) FP16 Latency (ms/img) FP32 FPS FP16 FPS
EfficientNMS_TRTEfficientNMS_TRTEfficientNMS_TRTEfficientNMS_TRT
××××
1200.0208.3153.8161.25.04.86.56.2
2140.8151.5109.8120.47.16.69.18.3
4102.0108.675.186.99.89.213.311.5
870.482.660.664.514.212.116.515.5
1657.861.353.456.817.316.318.717.6
3251.254.350.152.519.518.421.319.4
6443.147.332.038.623.221.131.225.9
Table 6. Comparative results regarding impact of inference framework on inference latency.
Batch SizePrecisionInference FrameworkLatency (ms/img)
1FP32TFLite427.6
1FP16TFLite343.7
1FP32TensorRT200.0
1FP16TensorRT153.8
Table 7. Comparative results regarding real-time video detection.
EfficientNMS_TRTDeepStreamFPSUsed/Total MemoryPower Consumption (mw)
××13.238.3%2498.2
×15.441.2%2514.6
×24.150.7%2670.4
28.755.4%2826.1
Disclaimer/Publisher’s Note: The statements, opinions and data contained in all publications are solely those of the individual author(s) and contributor(s) and not of MDPI and/or the editor(s). MDPI and/or the editor(s) disclaim responsibility for any injury to people or property resulting from any ideas, methods, instructions or products referred to in the content.

