Article

Temporal and Spatial Dynamics of Groundwater Drought Based on GRACE Satellite and Its Relationship with Agricultural Drought

by
Weiran Luo
1,2,
Fei Wang
3,*,
Mengting Du
3,
Jianzhong Guo
1,2,
Ziwei Li
1,2,
Ning Li
1,2,
Rong Li
3,
Ruyi Men
3,
Hexin Lai
3,
Qian Xu
3,
Kai Feng
3,
Yanbin Li
3,
Shengzhi Huang
3 and
Qingqing Tian
3
1
State Key Laboratory of Spatial Datum, Faculty of Geographical Science and Engineering, College of Remote Sensing and Geoinformatics Engineering, Henan University, Zhengzhou 450046, China
2
Henan Industrial Technology Academy of Spatiotemporal Big Data, Henan University, Zhengzhou 450046, China
3
School of Water Conservancy, North China University of Water Resources and Electric Power, Zhengzhou 450046, China
*
Author to whom correspondence should be addressed.
Agriculture 2025, 15(23), 2431; https://doi.org/10.3390/agriculture15232431
Submission received: 24 October 2025 / Revised: 19 November 2025 / Accepted: 24 November 2025 / Published: 25 November 2025
(This article belongs to the Section Ecosystem, Environment and Climate Change in Agriculture)

Abstract

Terrestrial water storage includes soil water storage, groundwater storage, surface water storage, snow water equivalent, plant canopy water storage, biological water storage, etc., which can comprehensively reflect the total change in water volume during processes such as precipitation, evapotranspiration, runoff, and human water use in the basin hydrological cycle. The Gravity Recovery and Climate Experiment (GRACE) satellite provides a powerful tool and a new approach for observing changes in terrestrial water storage and groundwater storage. The North China Plain (NCP) is a major agricultural region in the northern arid area of China, and long-term overexploitation of groundwater has led to increasingly prominent ecological vulnerability issues. This study uses GRACE and Global Land Data Assimilation System (GLDAS) hydrological model data to assess the spatiotemporal patterns of groundwater drought in the NCP and its various sub-regions from 2003 to 2022, identify the locations, occurrence probabilities, and confidence intervals of seasonal and trend mutation points, quantify the complex interactive effects of multiple climate factors on groundwater drought, and reveal the propagation time from groundwater drought to agricultural drought. The results show that: (1) from 2003 to 2022, the linear tendency rate of groundwater drought index (GDI) was −0.035 per 10 years, indicating that groundwater drought showed a gradually worsening trend during the study period; (2) on an annual scale, the most severe groundwater drought occurred in 2021 (GDI = −1.59). In that year, the monthly average GDI in the NCP ranged from −0.58 to −2.78, and the groundwater drought was most severe in July (GDI = −2.02); (3) based on partial wavelet coherence, the best univariate, bivariate for groundwater drought were soil moisture (PASC = 19.13%); and (4) in Beijing, Tianjin and Hebei, the propagation time was mainly concentrated in 1–5 months, with average lag times of 2.87, 3.20, and 2.92 months, respectively. This study can not only reduce and mitigate the harm of groundwater drought to agricultural production, social life, and ecosystems by monitoring changes in groundwater storage, but also provide a reference for the quantitative identification of the dominant factors of groundwater drought.

1. Introduction

Groundwater drought is a special type of drought, which refers to a significant shortage of groundwater reserves or a continuous decline in water head caused by factors such as reduced precipitation recharge, enhanced evaporation and transpiration, and over-exploitation of groundwater due to human activities in a specific area and period, thereby resulting in a systematic lack of groundwater resources [1,2,3,4]. During the formation and evolution of droughts, meteorological, agricultural and groundwater droughts do not occur in isolation but are interrelated through the hydrological cycle process. Usually, meteorological drought occurs first, with insufficient precipitation and increased evaporation, which leads to a decrease in soil moisture content and triggers agricultural drought. To deal with agricultural drought, people often over-extract groundwater for irrigation, eventually resulting in a reduction in groundwater recharge and the development of groundwater drought [5,6,7]. Therefore, groundwater drought is one of the main threats to water security, which may lead to water supply shortages, reduced crop yields and deterioration of the ecological environment. In particular, the impact is more profound for regions highly dependent on groundwater resources [8,9,10]. As an important political, economic, cultural center and strategic location in China, the North China Plain (NCP) has seen a significant increase in the consumption of underground water resources since the rapid economic development and the continuous growth in population size. Especially in the 21st century, the demand has become even stronger [11,12,13]. At present, the NCP has become one of the largest groundwater funnels in the world. Long-term over-exploitation of groundwater has caused a series of problems such as severe land subsidence and deterioration of water quality [14,15]. In recent years, with the implementation of the South-to-North Water Diversion Project, China has introduced relevant policies to restrict groundwater extraction. Against this backdrop, the spatio-temporal evolution patterns and driving mechanisms of groundwater reserves in the NCP have gradually become cutting-edge topics in groundwater science research [7,13,16,17]. With the emergence of the Gravity Recovery and Climate Experiment (GRACE), the monitoring of groundwater reserves based on remote sensing methods and the research on the impact mechanism of groundwater drought have become hot directions in this field.
With its unique ability to monitor changes in the Earth’s gravitational field to invert changes in the Earth’s mass, the GRACE satellite has opened up new paths for the study of groundwater reserves and drought propagation [1,18,19,20]. The GRACE Follow-On (GRACE-FO) satellite was successfully launched in May 2018 as a follow-up mission to the GRACE satellite. Conceptually, GRACE-FO is very similar to the original GRACE, and the most significant difference between the two lies in that GRACE-FO adds an experimental laser ranging interferometer to support subsequent tasks similar to GRACE [21,22]. The time-varying gravitational field model derived from GRACE (-FO) observational data has been widely applied in the analysis of terrestrial water storage anomalies (TWSAs) and groundwater storage anomalies (GWSAs) in large-scale regions and areas such as flood/drought disasters [23,24,25]. Compared with the traditional ground monitoring well method, the data obtained by GRACE satellites have advantages such as continuous spatiotemporal variation, wide coverage, and strong regional applicability, effectively making up for the shortcomings of traditional methods such as sparse and uneven distribution of monitoring wells, time-consuming and labor-intensive [26,27,28]. The inversion of terrestrial water storage through GRACE satellites not only breaks through the limitations of traditional ground observations in terms of spatiotemporal scales, but also provides a brand-new technical means for groundwater drought assessment. In addition, the GRACE satellite, in conjunction with the Global Land Data Assimilation System (GLDAS) satellite model, can also estimate the variation in groundwater reserves, solving problems such as insufficient spatial coverage and poor continuity inherent in in situ observations [29,30].
At present, water storage monitoring based on GRACE satellites has been widely applied in global, regional and basin studies. The special geographical location and climatic conditions of the NCP have also attracted many experts and scholars to conduct related research with the help of GRACE satellites. Wu et al. [31] calculated the GWSA of the Huai River Basin based on GRACE and GLDAS data from 2003 to 2023, combined with datasets such as the Normalized Difference Vegetation Index (NDVI) and water resources bulletin. They mainly studied the spatio-temporal variations in groundwater reserves and their possible causes, and discovered that during the study period, the GWSA of 80.71% of the river basins showed a significant downward trend. The dominant factor of the change was the water transfer between river basins. This study provides a theoretical basis and data support for the management and prediction of groundwater resources. Liu et al. [7] developed a groundwater drought index (GDI) based on GWSA obtained from the GRACE satellite for detecting and analyzing drought events, and stated that from 2002 to 2021, the intensity, frequency, duration and area of groundwater drought all showed an increasing trend in the NCP. The long-term over-exploitation of groundwater resources may be the main driving factor for the intensification of groundwater drought in this region. Cui et al. [32] discussed the spatio-temporal evolution, formation mechanism and impact of compound hot and drought (CHD) events, and found that the drought caused by the CHD events from 2003 to 2022 was the most severe, lasting for five months (from July to November). The degree of damage varied among different river basins. Among them, the Xijiang River Basin, the Dongting Lake Basin and the main stream of the Yellow River Basin were the three most severely affected river basins. Zhang et al. [33] estimated the long-term groundwater reserves of aquifers in seven sub-basins of the Poyang Lake Basin from 1983 to 2019 using the variable infiltration capacity model with a simple groundwater model. After multi-scale verification, groundwater drought was identified by the standardized groundwater storage drought index. The research found that there were 15 to 21 groundwater droughts in these 7 sub-river basins. The drought from 2003 to 2010 was the most severe and lasted the longest. The average recovery time ranged from 5.05 to 9.93 months, and the average recovery speed was 0.14 to 0.36. The Ganjiang and Fu River basins recovered relatively quickly, while the Yangtze River Basin recovered the slowest. Correlation analysis indicates that precipitation has a limited direct impact on drought recovery, and soil moisture anomalies (SMAs) and climate moisture index (CMI) play a dominant role. Higher SMA and CMI values are associated with faster recovery speed and shorter recovery time, and higher NDVI is associated with a longer recovery period.
As an important pillar region of China’s economy, the NCP has complex and changeable climatic conditions and abundant natural resources. However, it is also a frequently occurring area for groundwater drought disasters [34]. GRACE satellite data has application advantages such as large-scale monitoring, high-precision observation, comprehensive analysis ability, strong adaptability, early warning ability and application potential in the study of drought in the NCP. In view of this, the research purpose of this study are to: (1) reveal the temporal dynamic evolution and spatial distribution characteristics of groundwater drought in the NCP and its various regions based on GRACE data; (2) clarify the main mutation points and the probability of mutation of groundwater drought during the study period (2003–2022) using the Bayesian Estimator of Abrupt Seasonal and Trend Change (BEAST) algorithm; (3) identify the multi-scale time–frequency relative contribution of climatic factors to groundwater drought based on wavelet coherence; and (4) reveal the interrelationship between groundwater drought and agricultural drought.

2. Materials and Methods

2.1. The Research Area

The NCP is the second largest alluvial plain in China, spanning the lower reaches of the Haihe River, Huaihe River and Yellow River basins. Its geographical range is between 31° N and 43° N latitude and 110° E and 123° E longitude, with a total area of approximately 432,500 square kilometers [7,35]. The average annual temperature is 12.8 °C, and July was the hottest month of the year. The average annual precipitation is 503 mm, and more than half of the precipitation occurs between June and August [36]. The average duration of meteorological drought events before and after 2000 is 4.5 months and 2.67 months, respectively [37]. The terrain is mainly flat, and the altitude of the plain area in front of the mountains is generally around 100 m, while the central part of Shandong Province has a higher elevation, with some areas exceeding 1000 m. The NCP belongs to the warm temperate monsoon climate zone and also has the characteristics of a mid-latitude continental climate. The annual average temperature in this area remains between 14 and 15 °C, with distinct seasonal changes. Precipitation and heat are synchronized in time, and the annual precipitation ranges from 600 to 1000 mm. The main soil types in the NCP are silt, silt loam and sandy loam, with the proportions of approximately 8.3%, 61.1% and 30.6%, respectively [38]. As a major grain-producing area in China, the NCP region ranks among the top agricultural regions in the country in terms of both cultivated land area and cultivation rate. The water consumption for agricultural irrigation in this area accounts for more than 50% of the total annual water consumption, of which approximately 79% relies on groundwater extraction. Affected by topography, river sedimentation and geological structure, the hydrogeological characteristics of the NCP have significant vertical and horizontal changes. The direction of groundwater runoff in the NCP is basically the same as that of aquifer structure and landform change. From the piedmont plain to the coastal plain, the lithology of the aquifer transitions from coarse-grained to fine-grained, and the runoff speed gradually weakens. As shown in Figure 1, the NCP is divided into five major administrative regions, namely Beijing (BJ), Tianjin (TJ), Shandong (SD), Hebei (HB), and Henan (HN).

2.2. Dataset

2.2.1. GRACE Satellite

The time-varying gravitational field signals observed by GRACE satellite mainly reflect the process of mass redistribution within the earth system, which has brought about revolutionary progress in hydrology, especially in the field of large-scale monitoring of groundwater reserve changes [39,40,41]. In specific applications, researchers first extracted the contributions of soil moisture, surface snow water equivalent and surface water bodies from the changes in total terrestrial water storage observed by GRACE, using hydrological models or remote sensing observation data [42,43]. The residual part was mainly the mass change in underground aquifers. In this study, we selected the GRACE RL06 mascon model from the Space Research Center of the University of Texas, covering the period from 2003 to 2022. For data missing issues caused by battery management in certain months, linear interpolation was used to fill in the missing data based on adjacent months’ data.

2.2.2. GLDAS Land Surface Process Model

GLDAS is an advanced global land modeling framework jointly developed by NASA and the National Institute of Standards and Technology [44,45]. In the study of the hydrological cycle, GLDAS plays a crucial role and can provide high spatiotemporal resolution simulation results for a variety of key hydrological variables, including soil moisture, snow water equivalent, evapotranspiration and surface runoff. By combining the model output of GLDAS with GRACE observations, researchers are able to interpret the actual changes in groundwater reserves more accurately, thereby achieving a reliable assessment of aquifer dynamics [46,47]. Therefore, GLDAS has become an indispensable data foundation and scientific research tool in the fields of global hydrology, climatology and environmental change research. In this study, we adopted the GLDAS Noah model with a high spatial resolution, and the selected time period was consistent with the time range of GRACE data (2003–2022).

2.2.3. Digital Elevation Model

The digital elevation model (DEM) is a model that digitally represents the elevation of the earth’s surface in the form of regular grids, which is a core basic geographic information product provided by earth observation data centers such as the Geographic National Conditions Monitoring Cloud Platform [48,49]. In the field of groundwater and drought research, DEM plays a structural supporting role [50]. By integrating the DEM and multi-source remote sensing data provided by the Geographic National Conditions Monitoring Cloud Platform, comprehensive monitoring and assessment of groundwater drought conditions can be achieved, providing a scientific basis for water resource management and drought risk prevention and control.

2.3. Methodology

2.3.1. Construction Principle of Groundwater and Agricultural Drought Index

Terrestrial water storage refers to the total amount of water stored on and beneath the earth’s land surface, which is a dynamically changing quantity [5]. As one of the key indicators for understanding and monitoring the global water cycle, water resource sustainability and climate change, GRACE-based TWSA refers to the net increase or decrease in terrestrial water storage in a certain area within a specific time period (such as a month or a year). Essentially, it is a budget item for the terrestrial water cycle and a direct manifestation of the imbalance between “income” and “expenditure” [23]. The core components of TWSA include GWSAs, surface water storage anomalies (SWSAs), soil moisture storage anomalies (SMSAs), snow water equivalent anomalies (SWEAs), and canopy water storage anomalies (CWSAs). Therefore, the calculation formula of GWSAs is as follows:
G W S A = T W S A S M S A S W S A C W S A S W E A
In the formula, TWSA represents the total change in terrestrial water storage obtained based on the GRACE satellite, while SMSA, SWSA, CWSA, and SWEA, respectively, represent the equivalent representations of soil moisture, surface water, canopy water, and snow water obtained based on the GLDAS model.
C i = 1 n i 1 n i G W S A i
G S D = G W S A C i
G D I i , j = G S D i , j G S D j ¯ σ j
In the formula, i represents the i-th year from 2003 to 2022, j represents the j-th month from January to December, Ci represents the average GWSA of the i-th month, GSD represents the net deviation of groundwater reserves after deducting the average value of the current month, GDIi,j represents the groundwater drought index GDI of the j-th month of the i-th year. GSDi,j represents the net deviation of groundwater reserves in the j-th month of the i-th year, G S D j ¯ and σ j represents the mean and standard deviation of the net deviation of groundwater reserves in the j-th month, respectively.
Vegetation index changes are highly sensitive to variations in meteorological and hydrological elements. Therefore, the impact of drought on agriculture or crops can be analyzed through the interdependent relationship between drought index and vegetation index. Vegetation water consumption (VWC), vegetation water requirement (VWR) and vegetation water deficit (VWD) can represent the actual consumption, theoretical demand and supply-demand gap of vegetation water, respectively. VWC is the amount of water that must be lost to maintain the normal functioning of ecological vegetation, which can be calculated from latent heat flux and evapotranspiration. VWR is the amount of water required to maintain the health and function of vegetation in agricultural ecosystems, which can be obtained by combining crop coefficient method with different stages of crop growth. VWD is the difference between VWC and VWR. The standardized vegetation water deficit index (SVWI) is an effective remote sensing agricultural drought monitoring index, which is standardized by combining VWR and VWC based on historical data. Quantitative, comparable, and dynamic assessment has been successfully applied to evaluate the degree of vegetation water stress [51,52]. By optimizing the distribution function to fit the VWD, the cumulative distribution is transformed into a standard normal distribution, and then the SVWI can be obtained by using the inverse normalization method. The calculation formula of SVWI is as follows:
V W C = [ 1 e x p ( N D V I / N D V I m a x ) ] × A E T
V W R = K c × P E T
V W D = V W C V W R
F y i = x f y i ( t ) d t
S V W I = Φ 1 ( F y i )
In the formula, NDVImax represents the maximum NDVI value; AET and PET represent actual evapotranspiration and potential evapotranspiration, respectively; Kc is the crop coefficient; VWC, VWR and VWD represent the water consumption of vegetation, the water demand of vegetation and the water shortage of vegetation, respectively; and Fyi represents the cumulative probability.

2.3.2. Bayesian Estimator of Abrupt Seasonal and Trend Change (BEAST)

As a very powerful Bayesian time series analysis tool, the BEAST algorithm can be used to detect mutation points and decompose time series [53]. BEAST’s goal is to construct a “model collection” consisting of tens of thousands of possible models, each of which has different assumptions about the structure of the time series (such as the location and number of trend and seasonal mutation points) [54,55]. The final output is the weighted average of this set of models, with the weights being the posterior probabilities of each model. This method is similar to random forest or model averaging, achieving more robust and accurate results through integration. BEAST breaks down the time series into three components: the trend term (long-term, slowly changing direction), the periodic term (fixed, periodic fluctuations), and the residual term (random noise remaining after excluding the trend and seasonality). Trend mutation points are used to identify the time points when trend components undergo sudden changes (for example, from stable to rising, or from rapid rising to slow falling). Seasonal mutation points are used to identify the time points when seasonal patterns undergo sudden changes (for example, when the amplitude or phase of seasonal fluctuations changes). For trend and periodic components, BEAST not only provides an estimate (such as the mean), but also offers their complete probability distribution (uncertainty). Therefore, the BEAST algorithm has been widely applied in fields such as ecology, climatology, finance and epidemiology.

2.3.3. Spatial Mann–Kendall Trend Test Method (SMK)

The Mann–Kendall (MK) test can determine whether a time series data has a monotonically rising or falling trend without assuming it is linear [56]. The monotonic trend detected by the MK test is not limited to linear trends, and it can also detect any continuous, nonlinear, and unidirectional changes. The main purpose of the MK method is to determine the existence and direction of the trend, rather than to calculate the specific slope value. Its advantage is that it can perform non-parametric tests, has no requirements for the distribution of data, and is not affected by outliers. The Spatial Mann–Kendall (SMK) method extends the traditional MK trend test method from analyzing the changes in time series on the one-dimensional time axis to analyzing the changes in geographic variables in the two-dimensional space [57,58]. SMK can determine whether there are global spatial trend patterns in the entire region, such as analyzing whether temperature or precipitation shows significant spatial gradients with latitude or altitude. Due to the spatial autocorrelation in spatial data (i.e., the values of points that are close in distance are more similar), the core of SMK is to eliminate the influence of spatial autocorrelation from the original data through spatial pre-whitening processing, so that the residuals satisfy the “independence” assumption as much as possible, thereby correcting the influence of spatial autocorrelation.

2.3.4. Wavelet Coherence Analysis

Traditional correlation analysis (such as Pearson correlation) assumes that the relationship between two sequences remains constant throughout the entire time span, and thus provides a single, global correlation coefficient between two complete sequences. Wavelet coherence analysis is used to study the dynamic correlation of two time series in the dimensions of time and frequency, and can reveal local and frequency-dependent interrelationships. Continuous wavelet transform can be regarded as a “mathematical microscope”, which can observe the local characteristics of signals at different magnifications (frequency/scale). In particular, wavelet coherence analysis is essentially the standardized form of the cross-correlation spectrum of the continuous wavelet transform of two signals. Wavelet coherence can not only provide the intensity of the correlation, but also give the direction of the correlation and the leading-lag relationship through the phase angle. As a time–frequency analysis tool, wavelet coherence analysis breaks through the limitations of traditional correlation analysis and can clearly reveal the interrelationship between two non-stationary time series that varies with time and frequency [59]. Through a coherent spectrum, researchers can simultaneously obtain the intensity of the interaction, the time of occurrence, the period (frequency) in which it occurs, the direction (positive/negative correlation) and the leading-lag relationship, which provides profound insights into the intrinsic dynamics of complex systems.
The calculation method of partial wavelet coherence is similar to that of partial correlation coefficient. It explores the wavelet coherence between variable X and variable Y under the condition of controlling one or more variables Z [60,61]. It extends partial correlation analysis from the global scope of the entire time series to a localized window of time and frequency, and its results are usually presented in heat maps similar to binary wavelet coherence spectra. In addition, the Average Wavelet Coherence (AWC) is calculated by averaging all the wavelet coherence analysis results in the time–frequency domain. It condenses the complex two-dimensional time–frequency information into a global average that is easy to understand and compare. To quantify the results of wavelet coherence analysis, the Proportion of Area with Significant Coherence (PASC) is used to represent the ratio of the area of significant coherence regions that pass the 95% confidence level test to the area of the entire analysis region.

3. Results

3.1. Time Series Decomposition of Groundwater Drought Based on Bayesian Algorithm

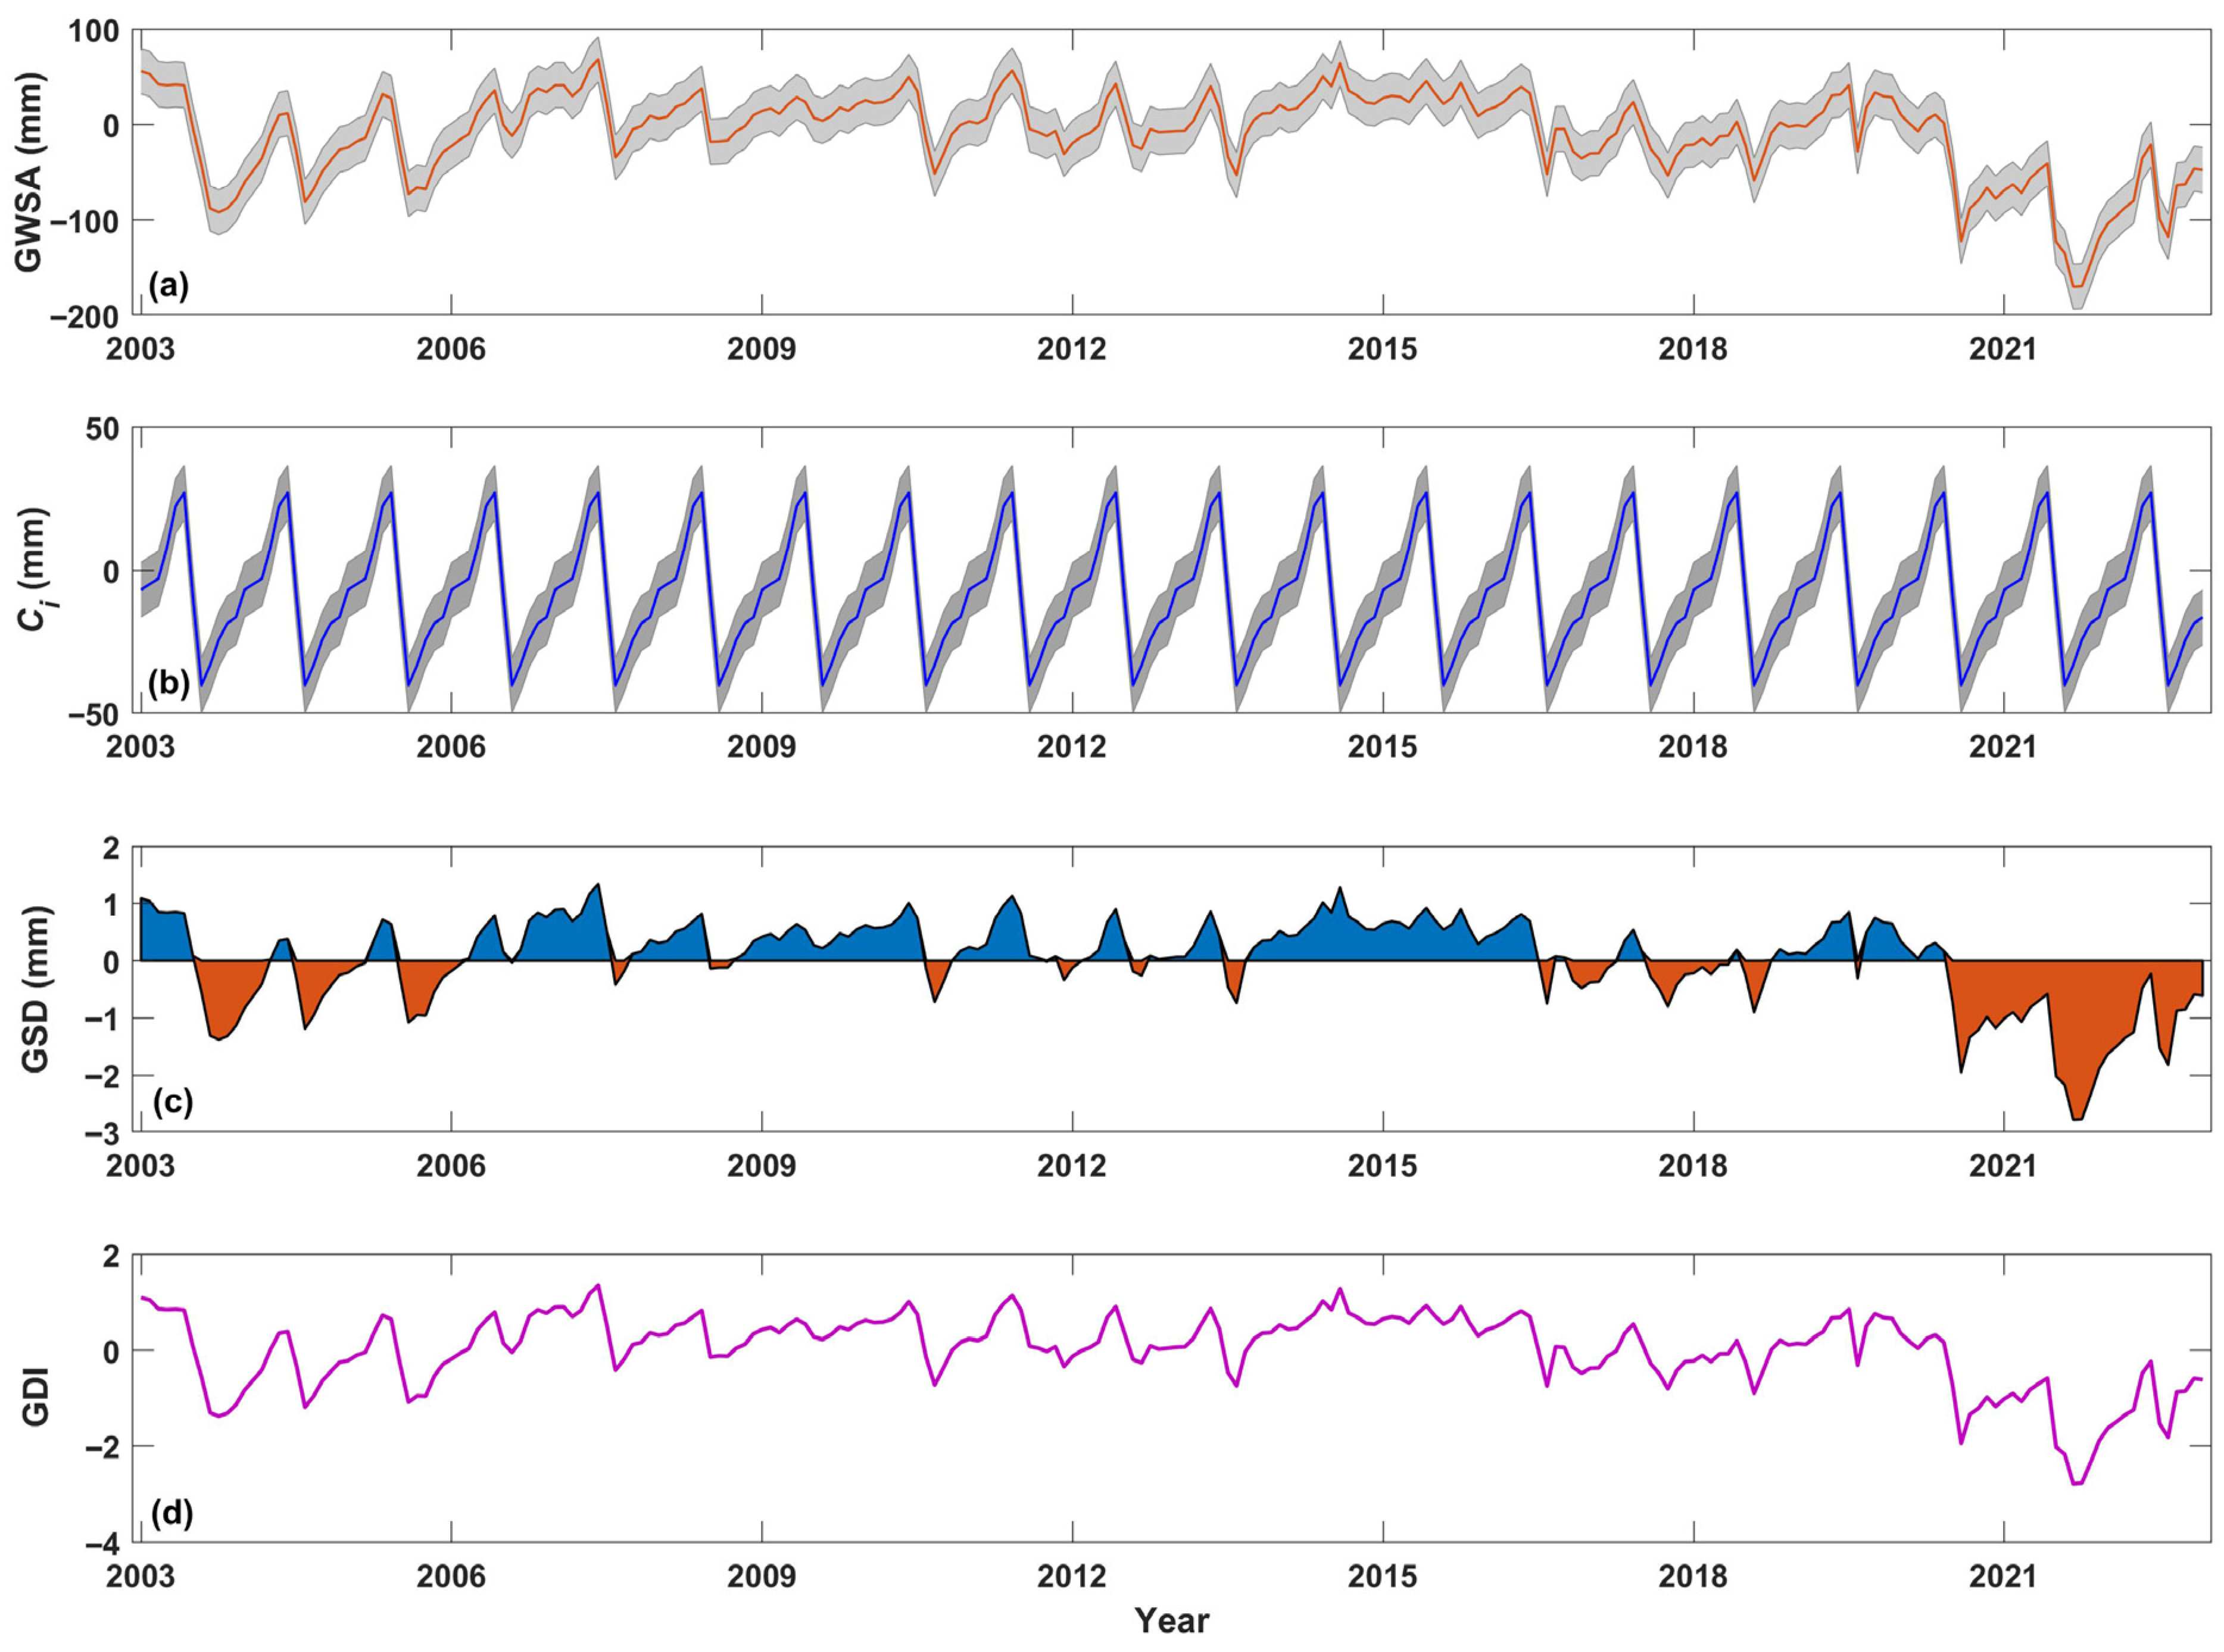
Figure 2 shows the calculation process of GDI in the NCP from 2003 to 2022 based on GRACE and GLDAS. During the research period, the monthly average of GWSA was −8.27 mm, with the maximum value (68.22 mm) occurring in June 2007 and the minimum value (−170.07 mm) in September 2021. The linear tendency rate of GWSA was −1.92 mm/10a, indicating that the groundwater showed a gradually decreasing trend. Ci showed a seasonal fluctuation characteristic with a 12-month cycle, and its value varies within the range of −40.24 mm (August) to 27.01 mm (June). Since 2020, GSD has been dominated by red negative values. The average GSD from 2003 to 2019 was 12.09 mm, and from 2020 to 2022, it was −60.84 mm, with a difference of 72.93 mm between the two. In particular, the average GSD values for 2020, 2021, and 2022 were all relatively small, with the values being −28.93 mm, −91.44 mm, and −62.15 mm, respectively. The minimum value of GDI (−2.78) occurred in September 2021, indicating that the most severe groundwater drought took place in that month. On an annual scale, the groundwater drought was the most severe in 2021 (GDI = −1.59). Overall, the groundwater drought in the NCP from 2003 to 2022 has shown a gradually worsening trend, with the linear tendency rate of GDI being −0.035/10a.
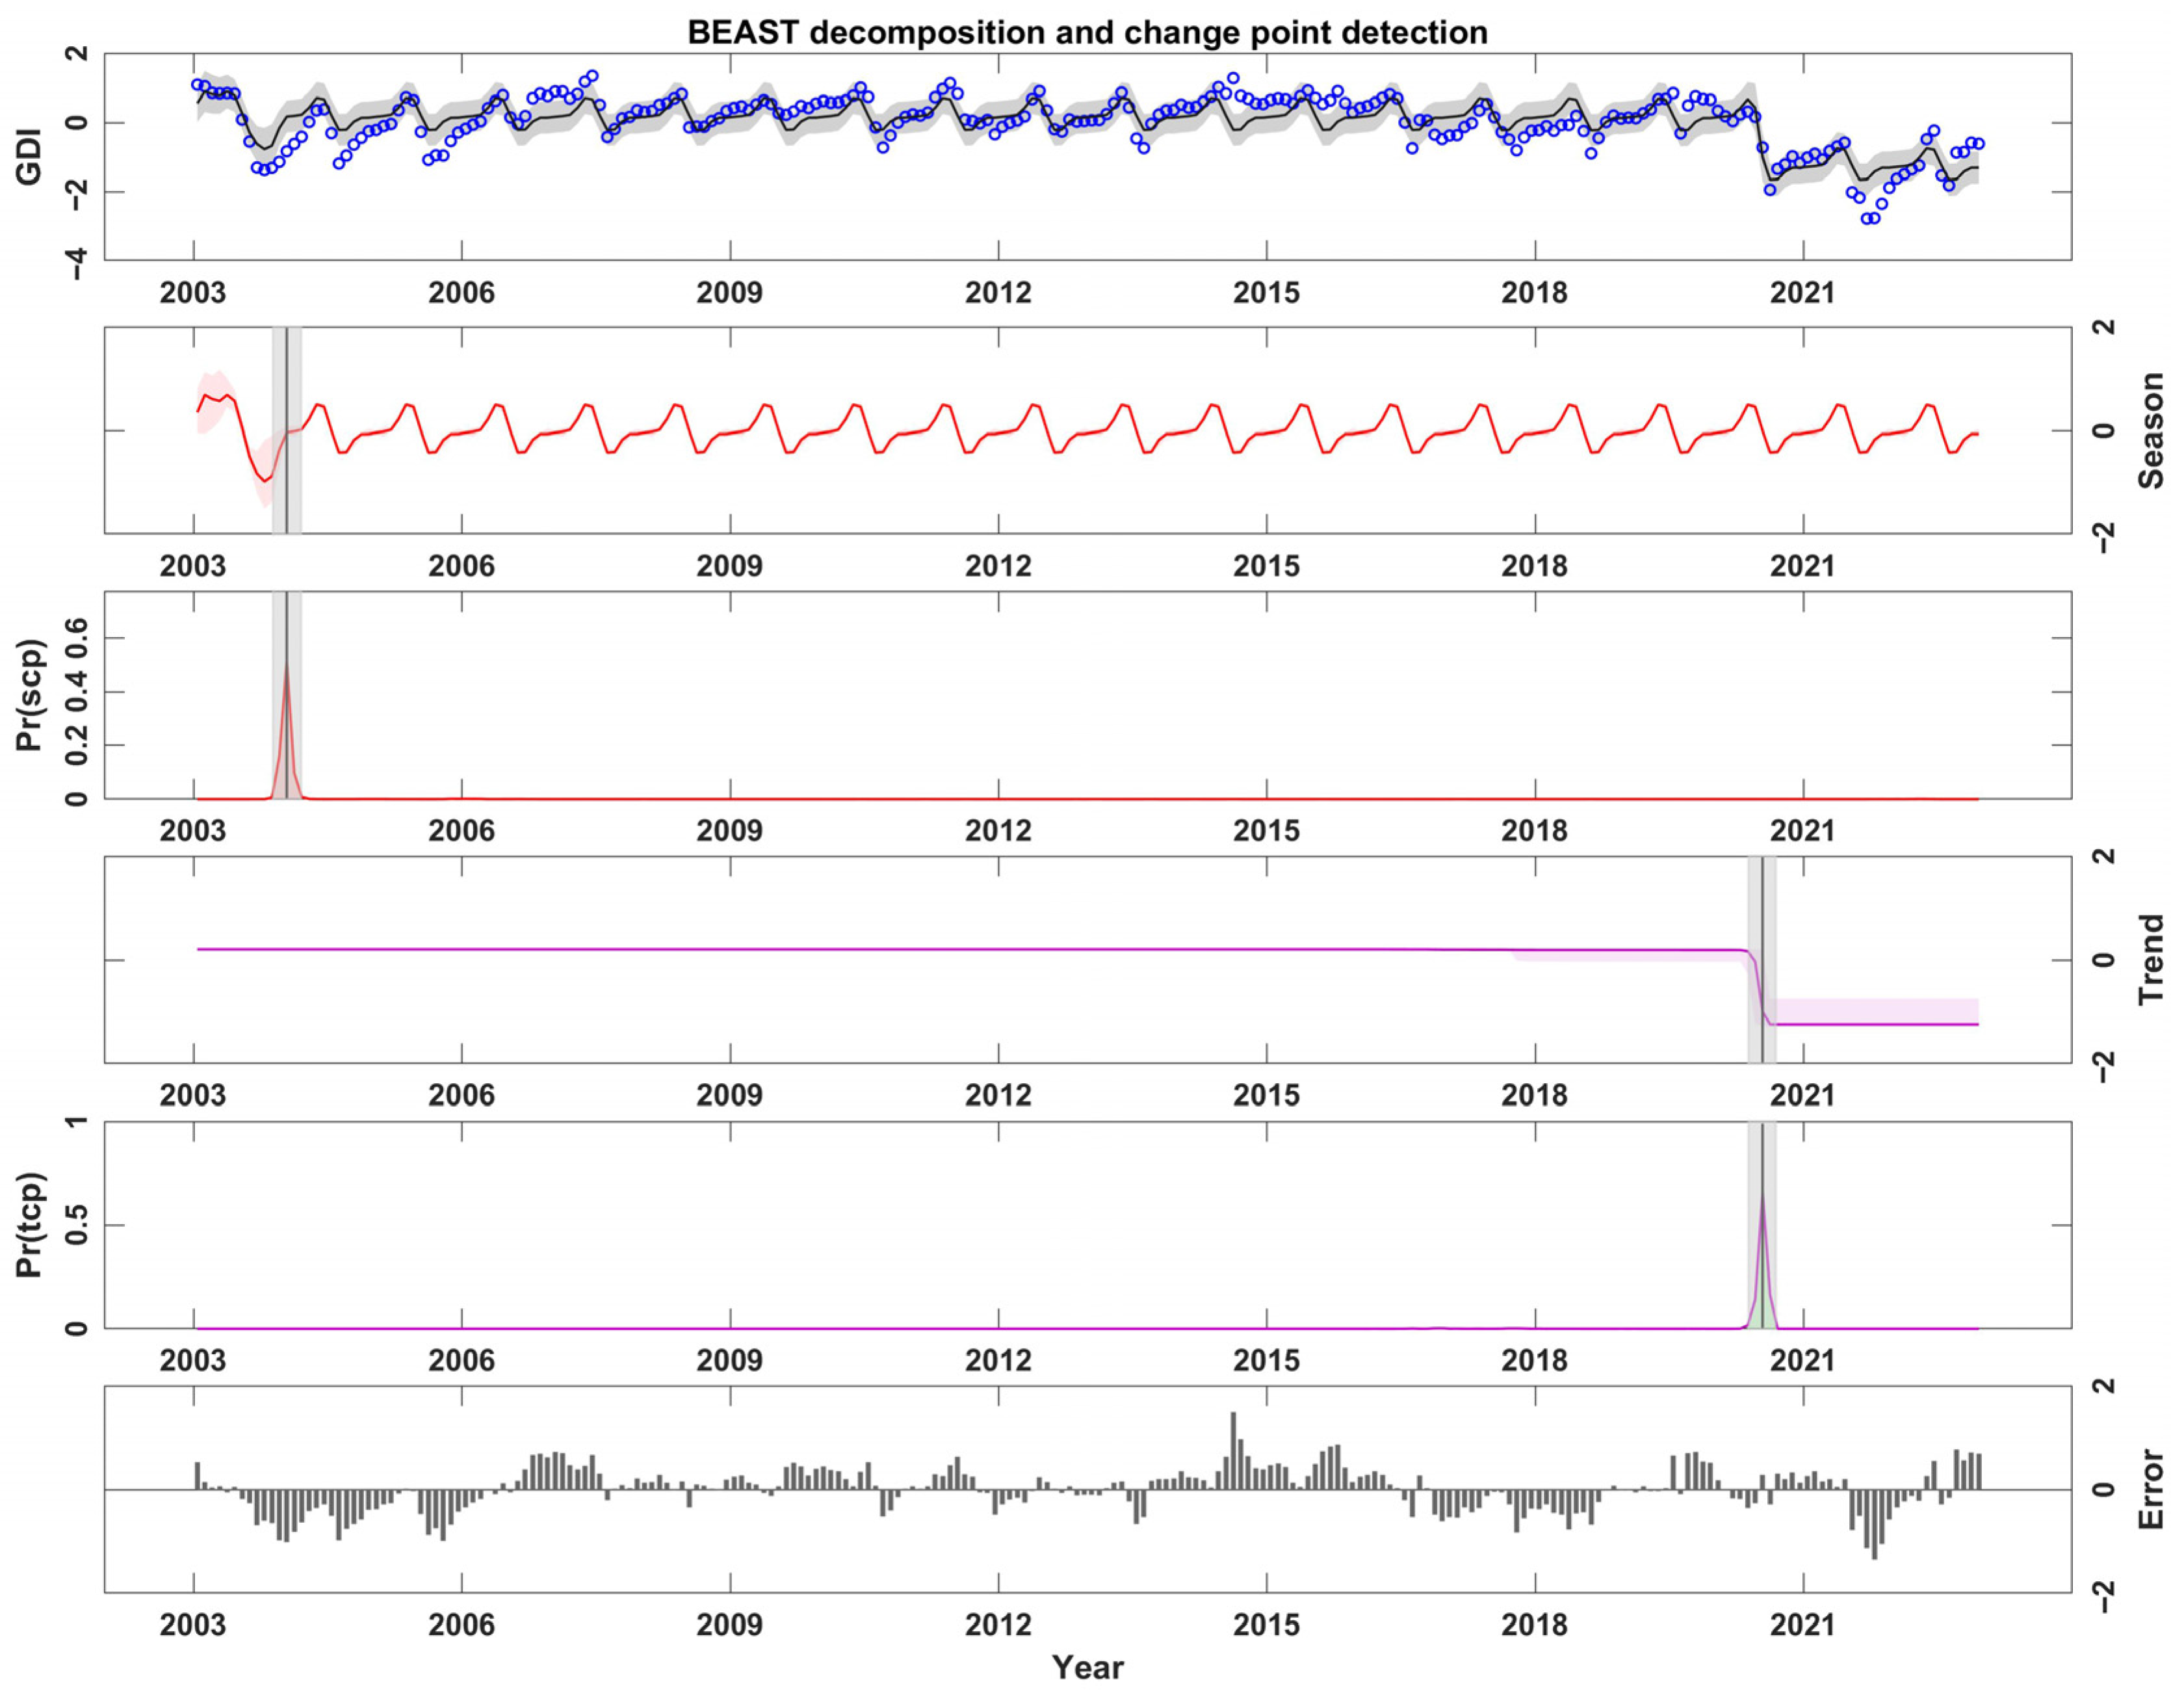
Based on the BEAST algorithm, the periodic components, trend components, residual terms and mutation points of GDI in the NCP are shown in Figure 3. From 2003 to 2022, the seasonal mutation point of groundwater drought in the NCP occurred in January 2004, with an occurrence probability of 79.15%, and the confidence interval was from November 2003 to March 2004. The mean values of GDI before and after the mutation point were –0.01 and 0.02, respectively. It can be seen that the situation of groundwater drought in the NCP after the seasonal mutation was not much different from that before the mutation. In addition to the seasonal mutation point, there was also a trend mutation point that occurred in July 2020, which the confidence interval of the trend mutation point was from April 2020 to September 2020, with an occurrence probability of 99.83%. Before the mutation point, the average GDI was 0.21, while it dropped to −1.31 after the mutation occurred, with a decrease of 1.52. The peaks and troughs of the residual term can also reflect the fluctuation of the original GDI, and it can be seen that the period when the groundwater drought in the NCP was relatively severe was from 2003 to 2006 (GDI = −0.07) and after 2020 (GDI = −1.05).
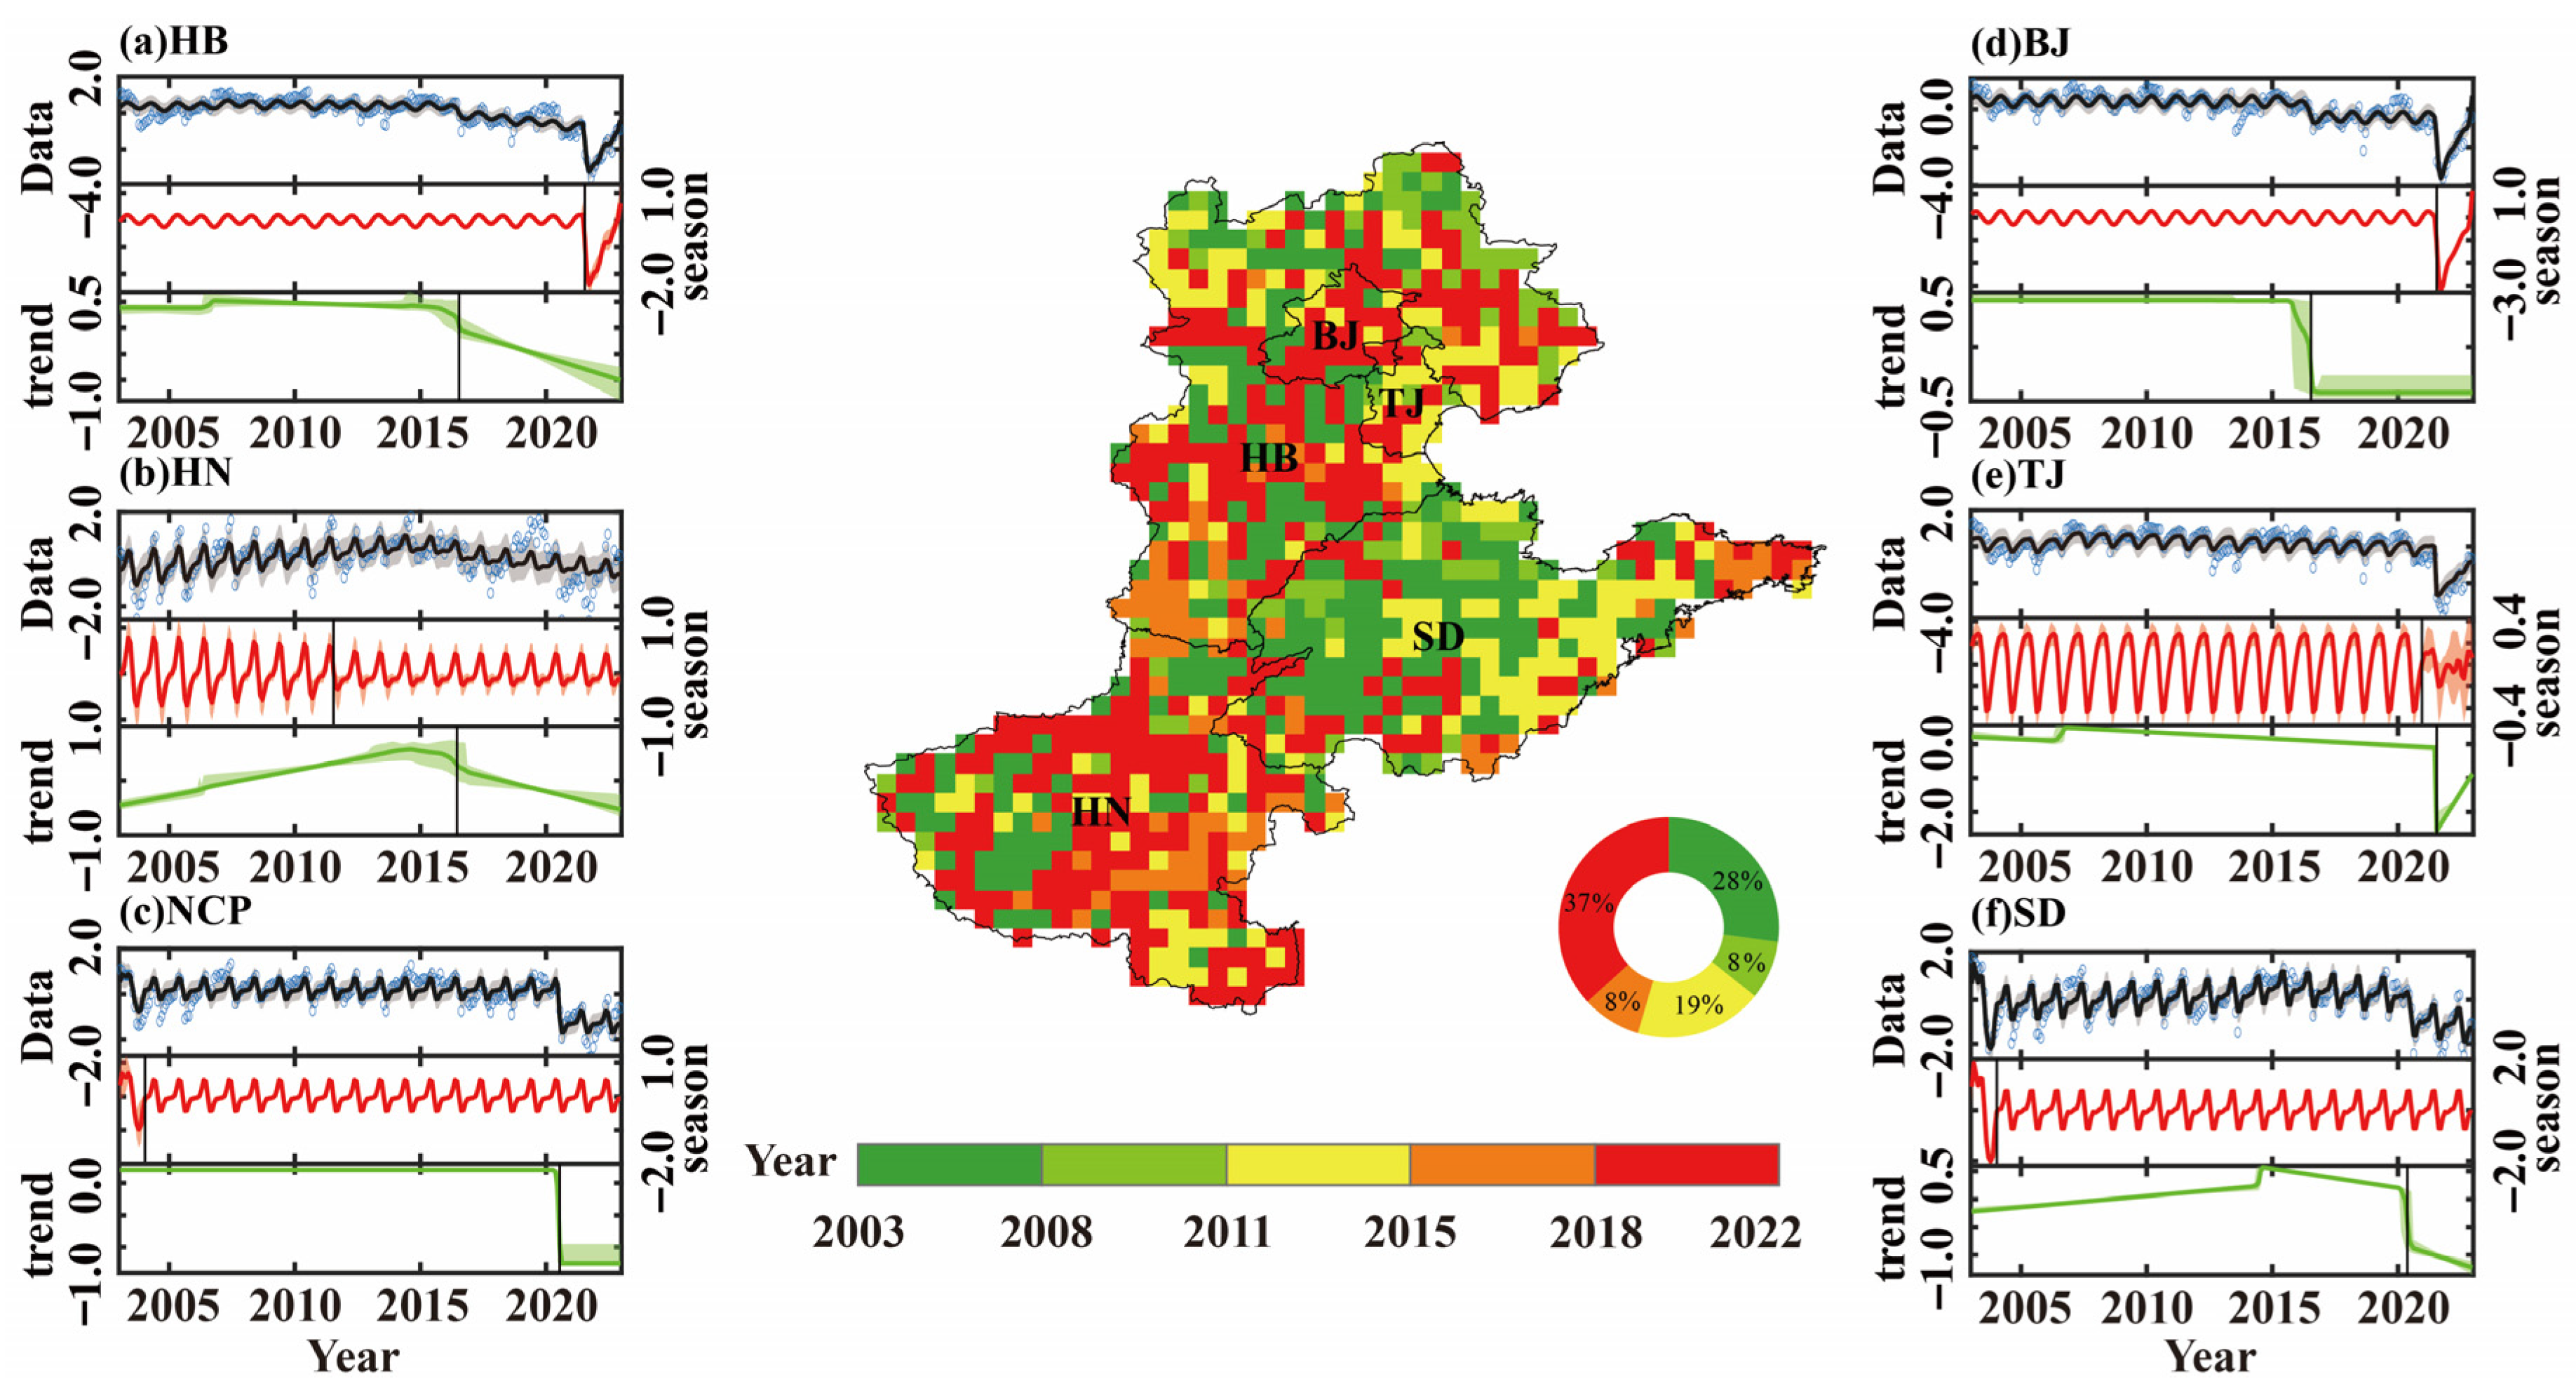
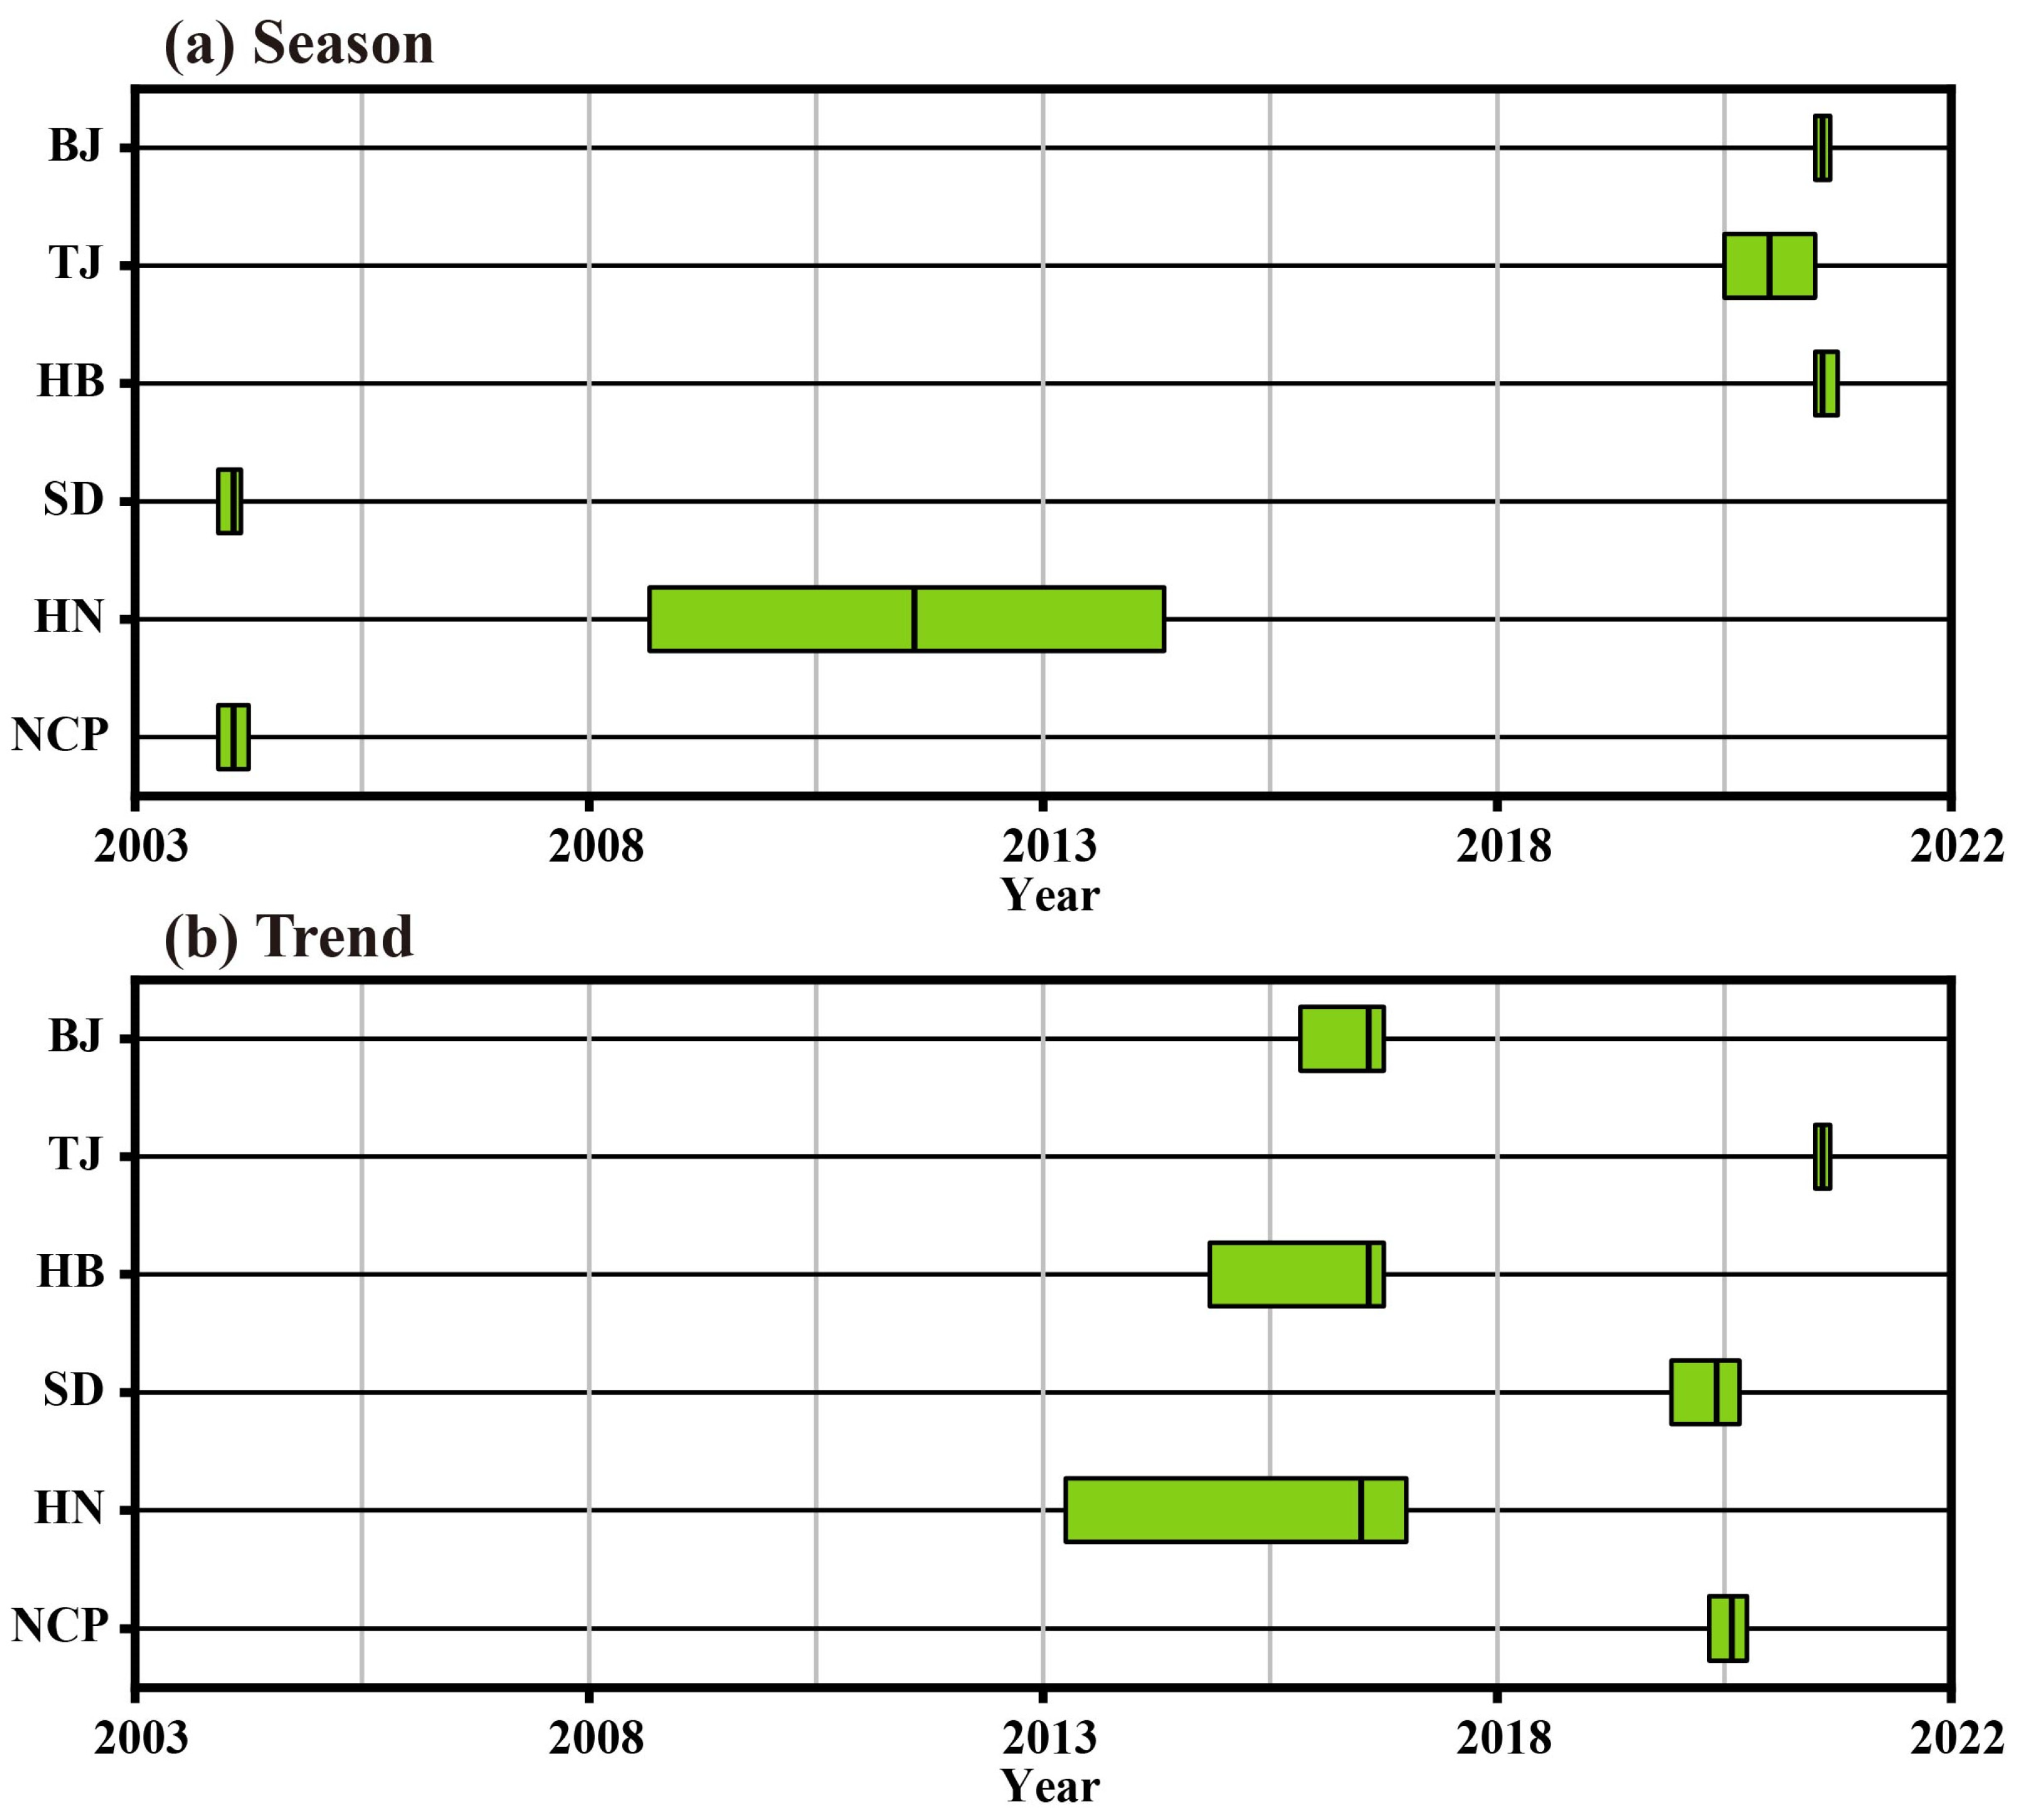
Figure 4 shows the periodic and trend sudden changes in groundwater drought in the NCP and its various regions (HB, HN, BJ, TJ, and SD) based on BEAST decomposition. Figure 5 shows the definite occurrence locations of the two mutation points and the nearby confidence intervals. During the research period, two mutation points were identified in HB Province: a seasonal mutation point (with a confidence probability of 99.82%) occurring in July 2021, and a trend mutation point (with a confidence probability of 68.65%) occurring in July 2016. The confidence intervals for these two mutation points were June 2021–September 2021 and October 2014–September 2016, respectively. The seasonal mutation point in HN occurred in July 2011, and the average GDI values before and after the mutation were −0.05 and 0.09, respectively. The trend mutation point in BJ occurred in July 2016 (with a probability of 97.69%), and the average GDI values before and after the mutation were 0.43 and −0.76, respectively, with a difference of 1.19 between the two. The seasonal and trend mutation points in TJ occurred in December 2020 (with confidence intervals from June 2020 to June 2021) and July 2021 (with confidence intervals from June 2021 to August 2021), respectively, and the occurrence probabilities were 40.38% and 66.67%, respectively. In addition, there was a seasonal mutation point in SD that occurred in January 2004 (with a probability of 99.86%) and a trend mutation point that occurred in May 2020 (with a probability of 64.41%).

3.2. Spatial Distribution Characteristics of Groundwater Drought

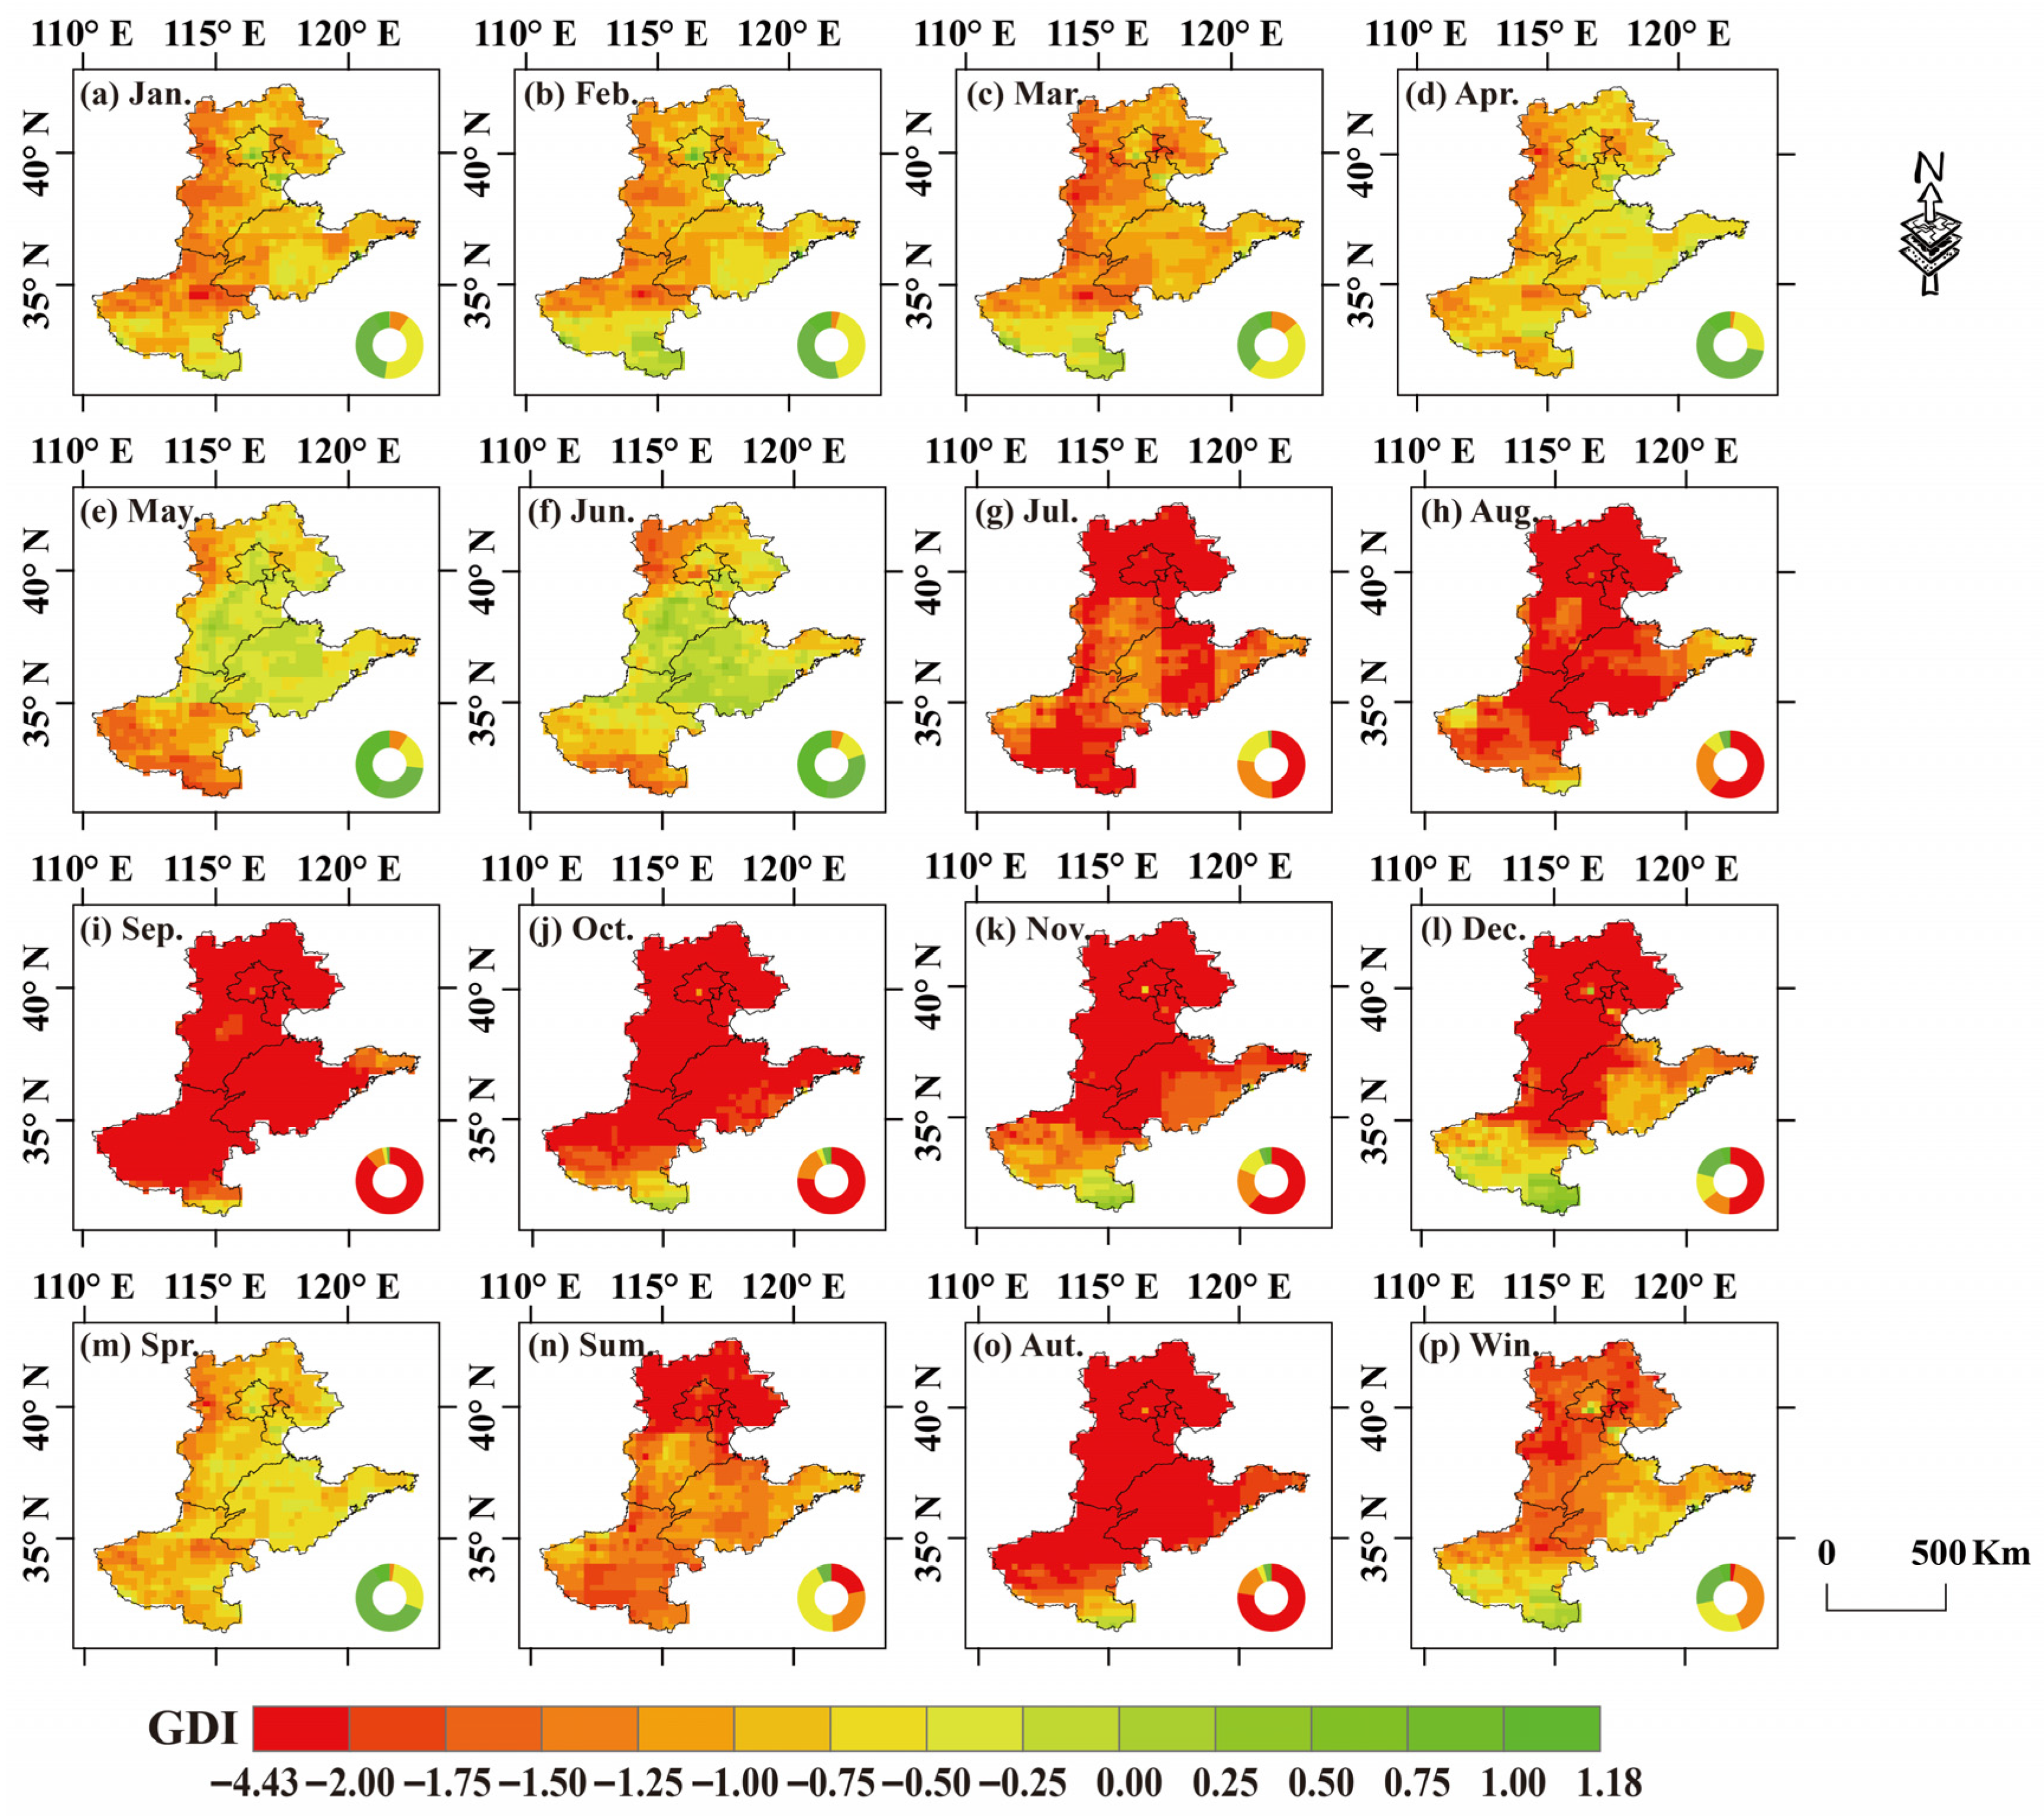
The most severe groundwater drought in the NCP occurred in 2021, when the minimum GDI value was −1.59. Figure 6 shows the monthly and quarterly spatial variation characteristics of drought within the year, and Figure 7 presents the average GDI values for different months and quarters of the year in the entire region and its various sub-districts. From January to December, the average GDI in the NCP ranged from −0.58 to −2.78. The groundwater drought situation in the entire plain was relatively severe in July (GDI = −2.02), August (GDI = −2.17), September (GDI = −2.78), and October (GDI = −2.77). The percentages of drought-stricken areas were 100%, 98.71%, 99.88% and 97.89%, respectively. From January to June, although the entire NCP region was generally in a drought situation, most areas were experiencing mild drought, with only a few regions experiencing severe drought. In July, the drought suddenly worsened—the proportion of drought-stricken areas increased from 52.51% in June to 100%, and the proportion of areas with severe drought or worse rose from 6.08% in June to 77.19%. From July to September, the drought situation continued to worsen. The average GDI in September dropped to the lowest level of the year (−2.78), and the percentage of drought-stricken area in that month was 99.88%, but 96.49% of the regional area reached the level of severe drought or above. From October to December, the average GDI of the entire region began to rise slightly. In December, the average GDI rose to −1.89, but the percentage of drought-stricken area that month was 90.18%, and still 60.17% of the area reached the level of severe drought or above. Among all the sub-regions, the average GDI of HB over 12 months was the smallest (−1.95). In addition, the minimum GDI values of HB, BJ and TJ all occurred in October, which were −3.57, −3.64 and −3.77, respectively. The minimum values of SD and HN both occurred in September, which were −2.56 and −2.62, respectively.
On a seasonal scale, the average GDI in the entire NCP was the smallest in autumn (−2.63) and the largest in spring (−0.86). The percentage of dry area in autumn was as high as 98.60%, while it was only 91.81% in spring. Among them, the proportion of areas in the region that reached severe drought or worse in autumn was 92.87%, while in spring it was only 2.34%. Among all the sub-regions, BJ’s GDI had the smallest average between four quarters, at −2.24. The minimum GDI value in autumn (−3.51) occurred in TJ, and the minimum GDI value in spring (−0.96) occurred in HN. It was worth noting that, except for the HN region where the maximum GDI value (−0.79) occurred in winter, the maximum and minimum GDI values of all other regions occurred in spring and autumn.

3.3. Gridded Trend Feature Identification

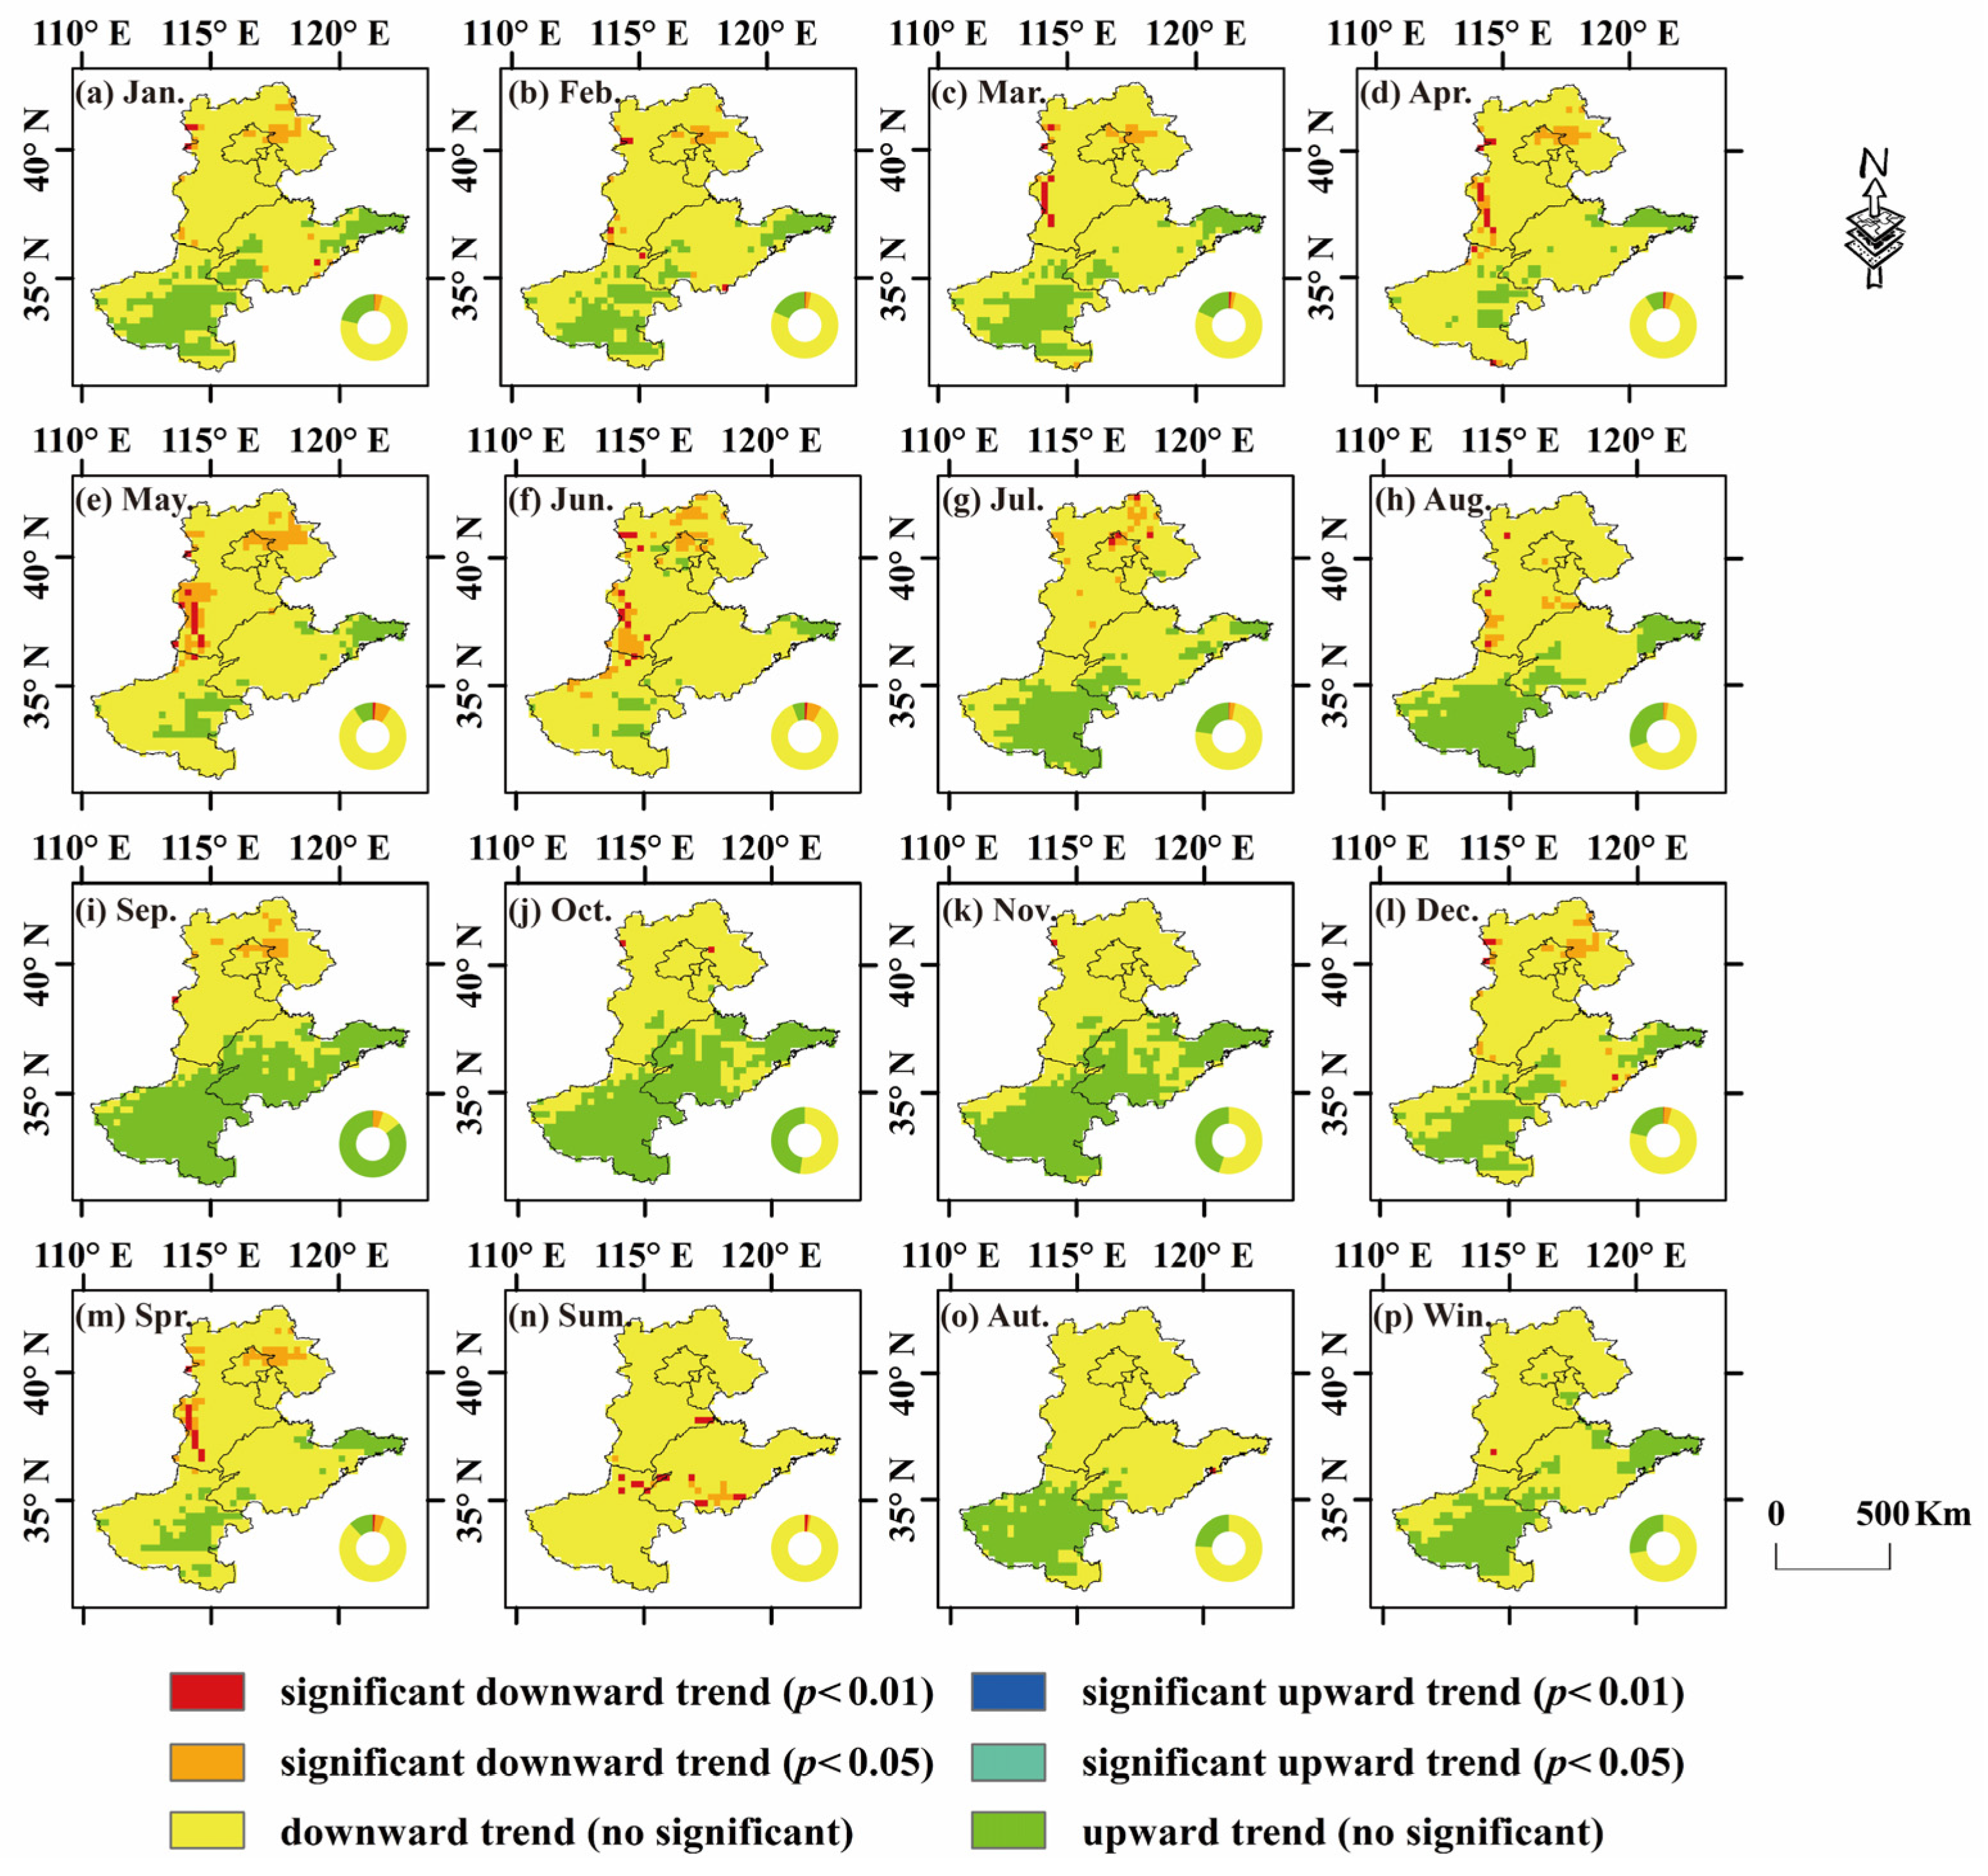
Based on the spatial trend identification method, the variation characteristics of GDI in the NCP from 2003 to 2022 are shown in Figure 8. Figure 9 shows the trend characteristic Zs values of GDI for the entire region and each sub-region. A Zs value less than 0 indicates that the drought situation is intensifying, while a Zs value greater than 0 indicates that the drought situation is gradually easing. From January to December, the SMK trend test characteristic values Zs of GDI were −0.64, −0.69, −0.67, −0.91, −0.93, −0.90, −0.56, −0.57, −0.22, −0.19, −0.26 and −0.64, respectively. It is worth noting that the proportion of areas where drought worsened in each month ranged from 8.26% (September) to 93.95% (June). Among the five secondary regions, the average Zs values in HB, TJ and BJ regions from January to December were all less than 0, indicating that drought intensified in all months throughout the year in these regions. From March to mid-June, the average Zs values of each zone were also less than 0, indicating that the groundwater drought situation in each zone showed an aggravating trend during this period. On a seasonal scale, the average Zs values of GDI in the entire region in spring, summer, autumn and winter were −0.84, −1.17, −0.21 and −0.14, respectively, and the proportions of areas with a worsening drought trend were 88.14%, 100%, 75.81% and 72.33%, respectively. In summer, the area percentages of 1.74% (p < 0.01) and 1.28% (p < 0.05) showed a significantly aggravated trend of drought, while 96.98% of the drought showed a non-significantly aggravated trend. Among the five secondary zones, the groundwater drought trend characteristics all showed seasonal aggravation trends to varying degrees. Among them, the drought aggravation trend in the BJ area was the most severe, with an average Zs of −0.90 in the four quarters, while the drought aggravation trend in the HN area was the milder, with an average Zs of −0.33. In addition, except for the HN region where the drought showed a trend of easing in the autumn and winter quarters, the drought situation in the other regions all showed a trend of worsening in the four quarters. Generally speaking, there were regional differences in the NCP with the groundwater drought variation trends of each grid unit. The Zs values of the vast majority in this area were negative, indicating that during the study period, the NCP as a whole showed a gradually worsening trend of groundwater drought.

3.4. The Relationships Between Climate Factors and Groundwater Drought

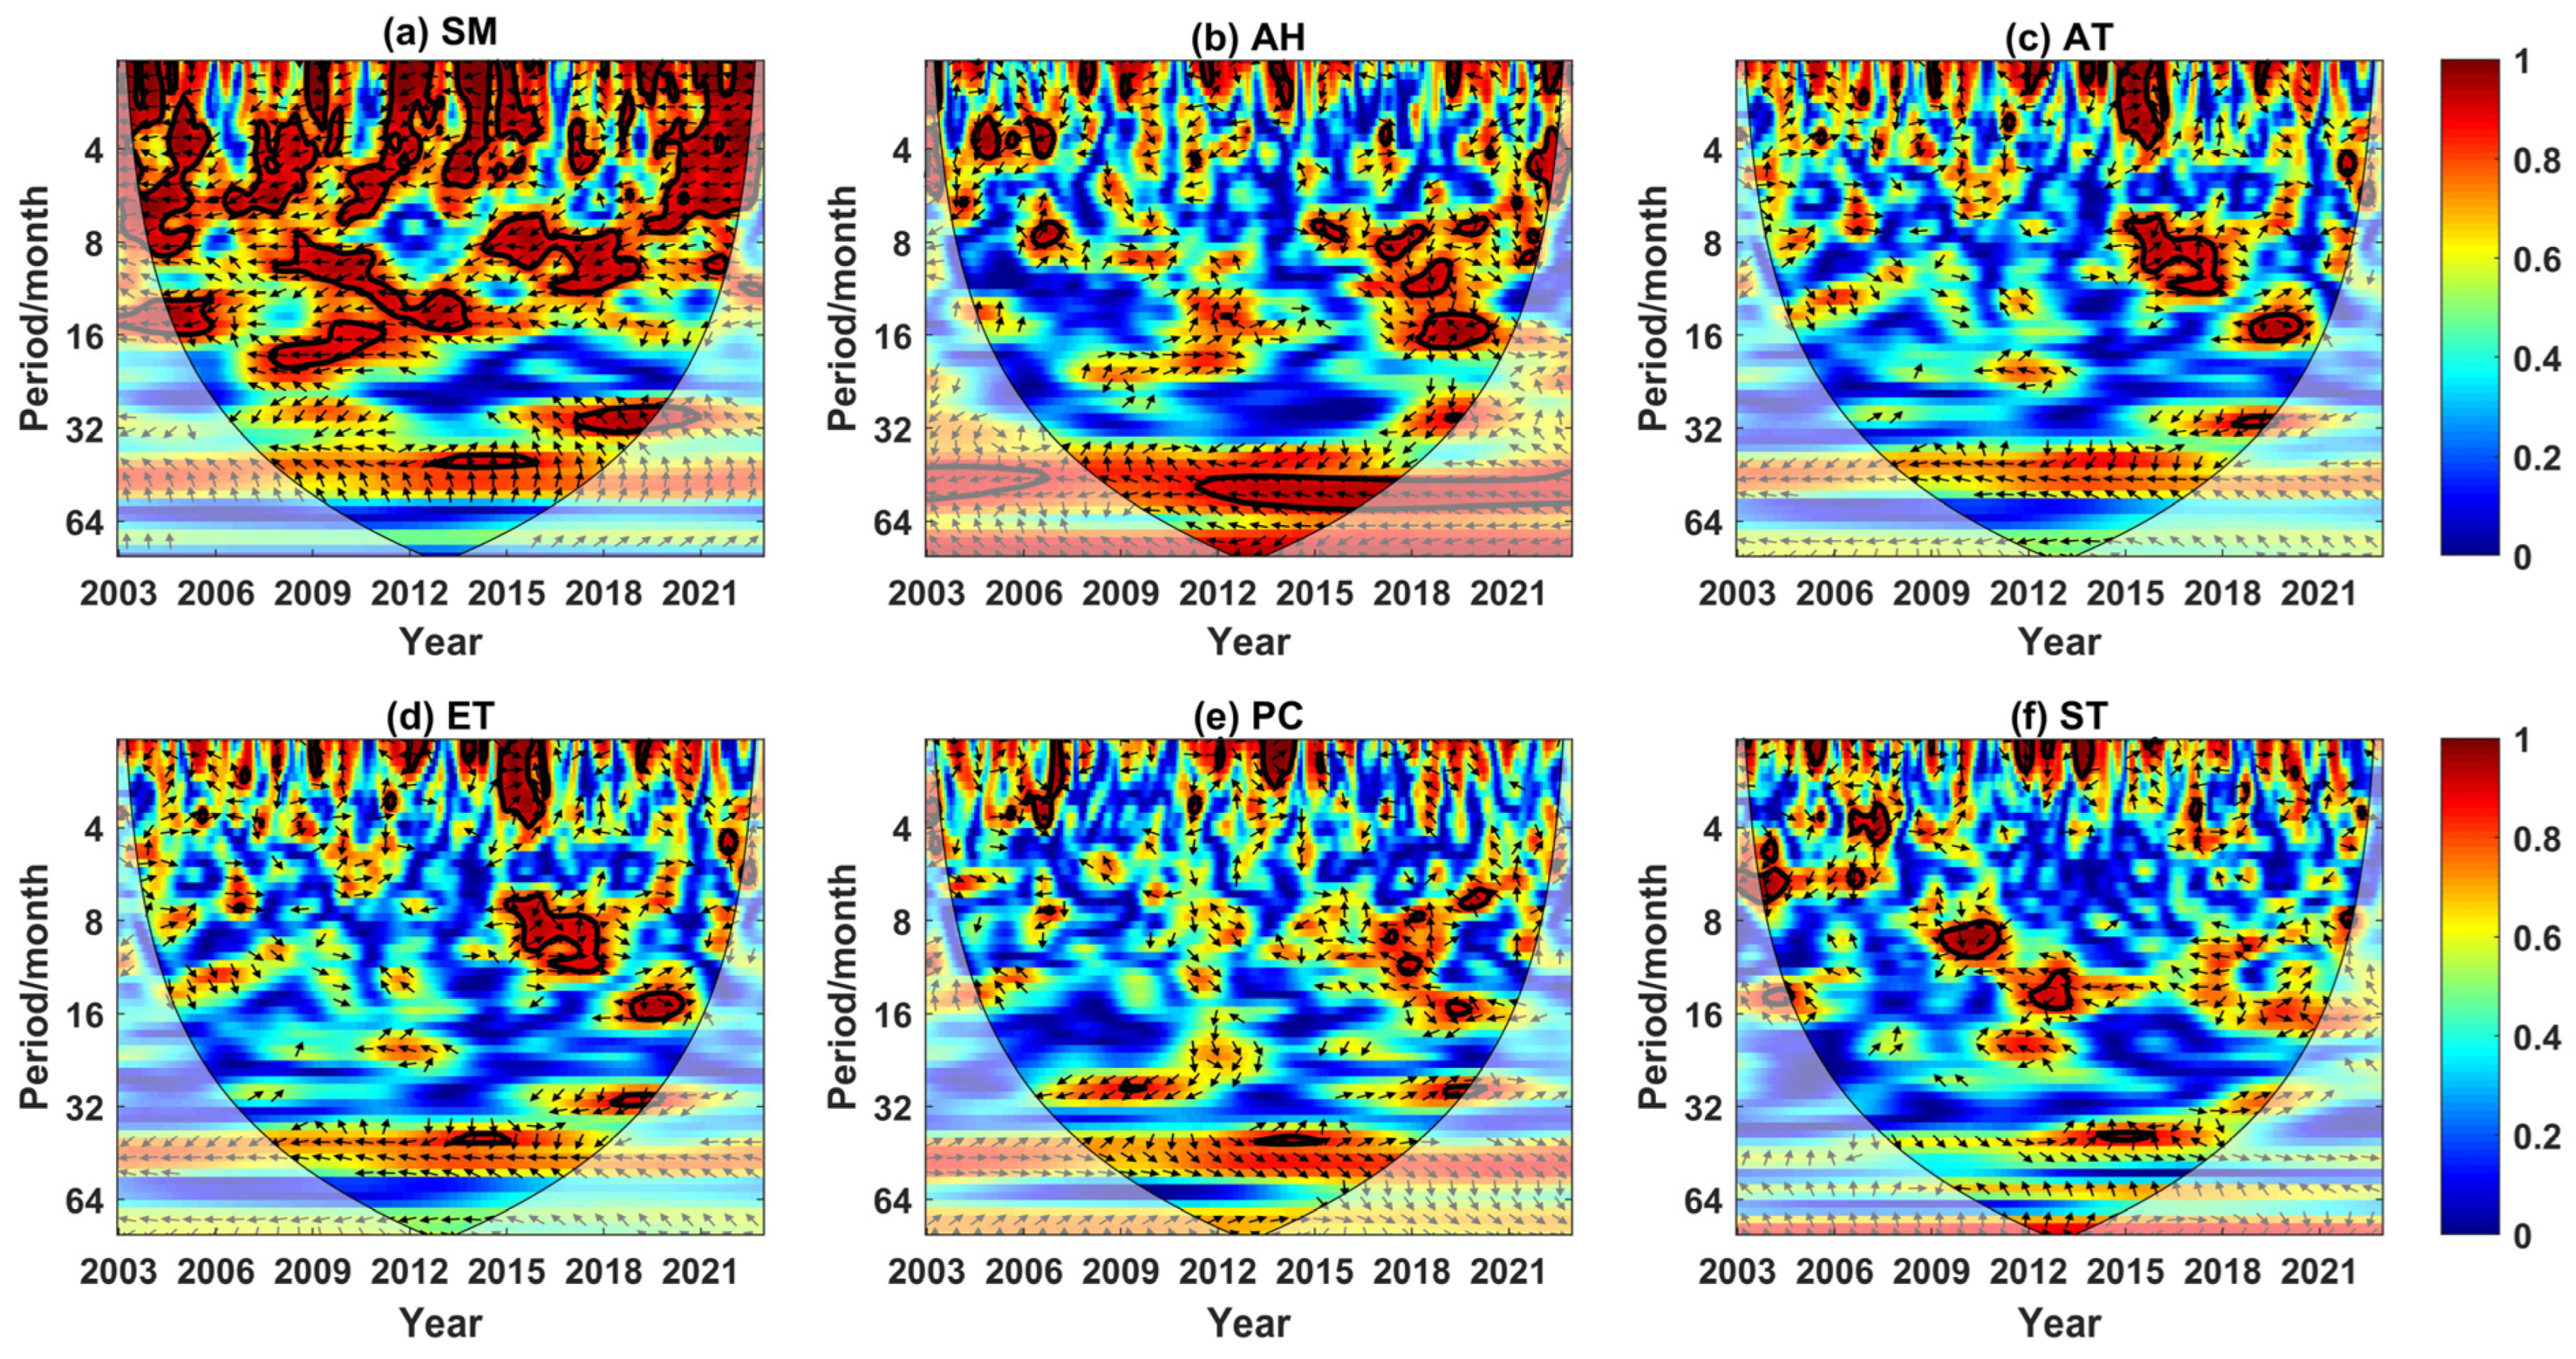
Given that partial wavelet coherence can quantify the local correlation of two time series in the time–frequency domain after excluding the influence of other variables, we adopted this method to reveal the complex nonlinear relationship between groundwater drought and climatic factors soil moisture (SM), air humidity (AH), air temperature (AT), evapotranspiration (ET), precipitation (PC), and soil temperature (ST) in the NCP from 2003 to 2022 (Figure 10). The physical meaning of the partial wavelet coherence map is the “true” or “direct” linear correlation strength between two signals at a specific time and frequency (or period), excluding the influence of one or more other signals. On a small scale (1–8 months), there were multiple significant resonance periods with negative correlations between GDI and SM in the NCP. At the medium scale (8–32 months), there were 6 significant resonance periods (negative correlation) between GDI and SM. They were, respectively, the 12–16 month cycle from 2004 to 2005, the 16–20 month cycle from 2007 to 2011, the 8–16 month cycle from 2007 to 2013, the 8–12 month cycle from 2014 to 2019, the 24–32 month cycle from 2017 to 2021, and the 8–10 month cycle from 2020 to 2021. On a large scale (>32 months), there was a significant resonance period with a negative correlation between GDI and SM, which was a 36–48 month period from 2012 to 2016. There were mainly three significant resonance periods (negative correlation) between GDI and AH on a small scale, namely the 2–4 month period from 2004 to 2005, the 2–4 month period from 2006 to 2007, and the 4–6 month period from 2021 to 2022. There were mainly three significant resonance periods between GDI and AH at the medium scale, namely two positive correlation periods of 8–10 months from 2017 to 2018 and 10–12 months from 2018 to 2019, and one negative correlation period of 14–20 months from 2018 to 2020. GDI and AH had a significant resonance period with a negative correlation on a large scale (a 48–64 month period from 2011 to 2017). AT all scales, GDI and AT mainly had three significant resonance periods (positive correlation), namely the 1–4 month period from 2015 to 2016, the 6–12 month period from 2015 to 2017, and the 14–16 month period from 2019 to 2020. For GDI and ET, the average values of PASC and AWC at all scales were 3.49% and 0.91, respectively. Overall, the PASC value between GDI and SM was the largest (PASC = 19.13%), indicating that among all the influencing factors, SM was the climate factor most closely related to GDI (Table 1).

3.5. The Propagation Time from Groundwater Drought to Agricultural Drought

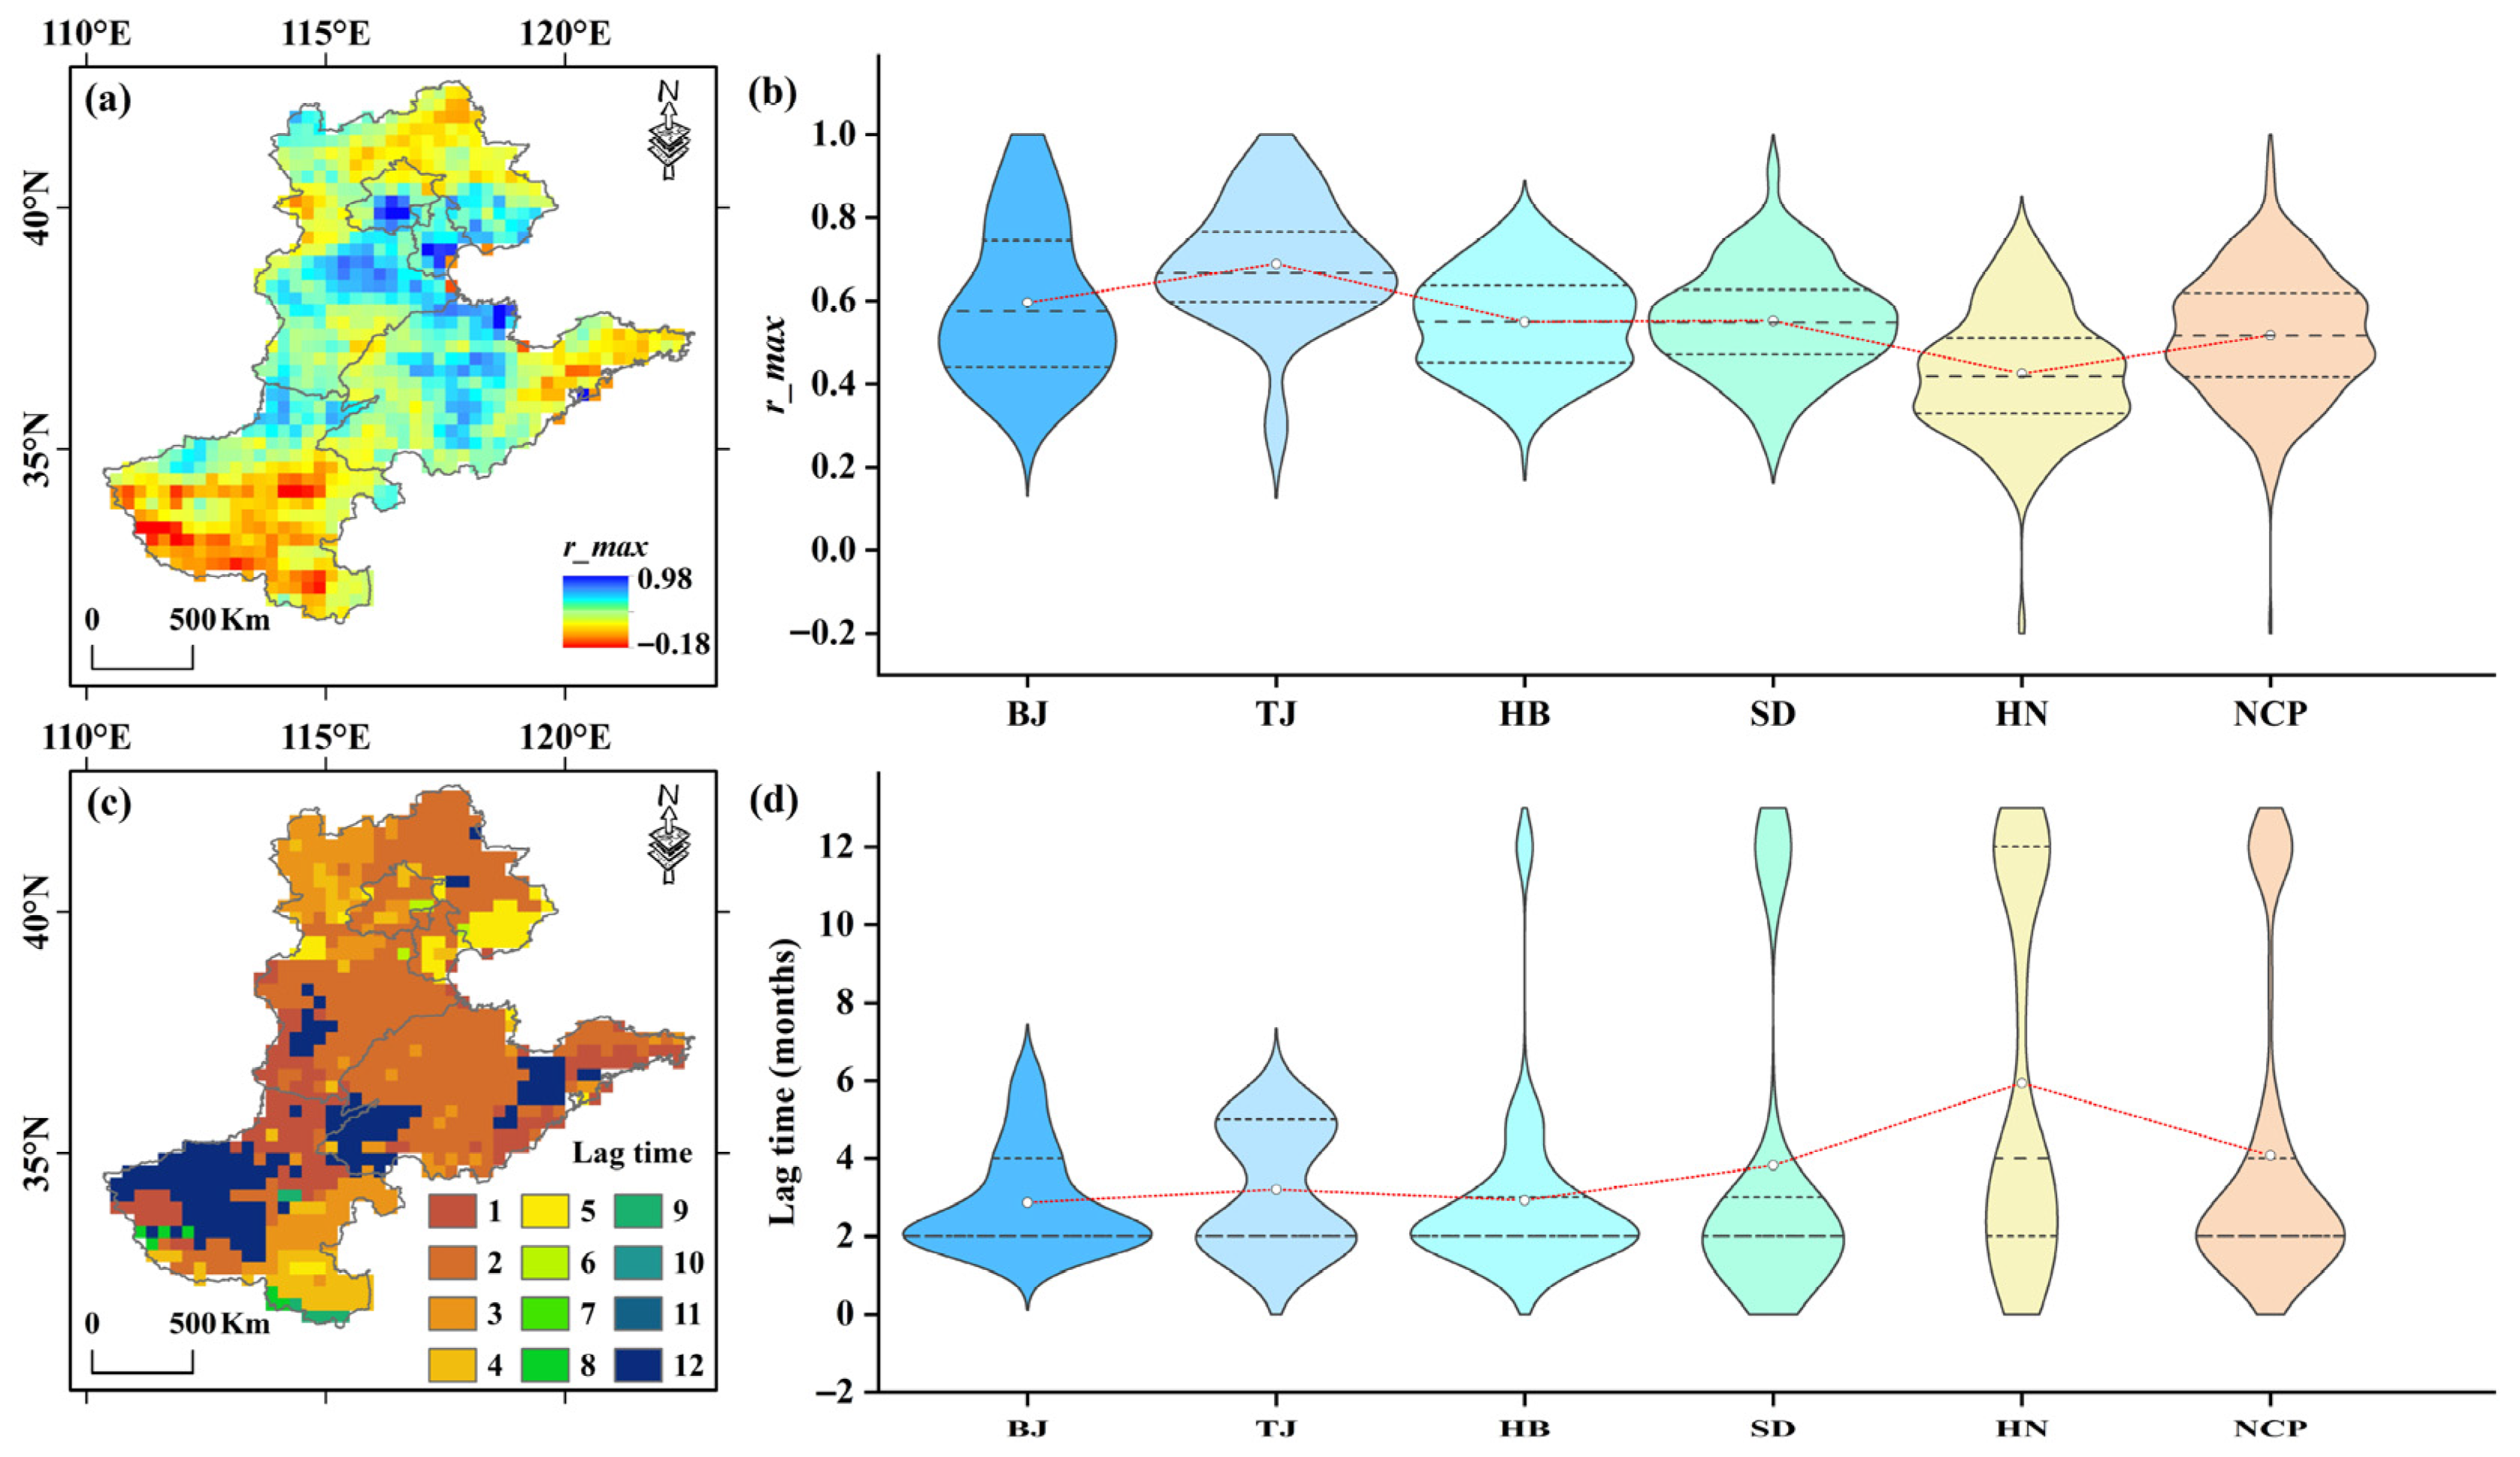
To study the propagation time of groundwater drought developing into agricultural drought, we first calculated the maximum Pearson correlation coefficient between GDI at each grid point and SVWI with a lag of 1 to 12 months. The magnitude of the correlation coefficient reflects the degree of influence of GDI on the changes in SVWI, and the higher the absolute value, the greater the influence. The corresponding lag months reflect the sensitivity of SVWI’s response to GDI. The shorter the lag time, the more sensitive the response. Figure 11 shows the maximum correlation coefficient between GDI and SVWI and the corresponding delay distribution map. The maximum correlation coefficient between GDI and SVWI in the entire NCP region from 2003 to 2022 was within the range of –0.18 to 0.98, with an average of 0.52, showing a significant positive correlation overall. Among the various divisions, the areas where the impact of groundwater drought on agricultural drought showed a significant positive correlation were mainly distributed in the eastern parts of BJ, TJ, HB and the western part of SD. The positive correlation in the TJ area was the most significant, and the maximum correlation coefficient was mainly concentrated between 0.4 and 0.8, with an average value as high as 0.69. However, GDI and SVWI showed a weak negative correlation in the southern part of HN, and the maximum correlation coefficient in the HN region was mainly concentrated between –0.18 and 0.76, with an average value of approximately 0.42. In addition, the response of agricultural drought to groundwater drought was also affected by lag time. The lag time range of the entire NCP region was mainly concentrated between 1–4 months and 10–12 months, and the average overall lag time was 4.08 months. It was worth noting that in the BJ, TJ and HB regions, the delay time was mainly concentrated in the range of 1 to 5 months, with the average delay times being 2.87, 3.20 and 2.92 months, respectively, indicating that the response of agricultural drought in these regions to groundwater drought was relatively sensitive. However, the lag time range in the HN region was mainly concentrated between 1 to 6 months and 9 to 12 months, with the longest overall average lag time (5.93 months).

4. Discussion

4.1. Advantages and Uncertainties

The terrestrial water storage provided by GRACE satellite data offers a new perspective for monitoring and assessing droughts [5]. Closely integrating climate issues with groundwater shortage problems can provide a research approach for the development and utilization of groundwater resources and promoting the sustainable development of groundwater in the context of climate change [4,43]. The NCP, as one of the regions with the most severe hydrogeological problems in the world, is an important grain production base in China. The problem of over-exploitation of groundwater caused by farmland irrigation has led to the emergence of a huge groundwater depression cone in this region, triggering a series of geological and environmental problems and causing serious negative impacts on local social and economic development [14,15,38]. As shown in Figure 2, in recent years, groundwater drought in the NCP has shown a gradually worsening trend, which is consistent with previous research results [13,17,35]. Liu et al. [7] pointed out that a severe groundwater drought event occurred in the NCP from 2020 to 2021, which is also consistent with our conclusions. From 2002 to 2021, the annual water supply in the NCP was between 813–1032 mm, while the surface water supply was between 374–503 mm, indicating that nearly half of the water resources were supplied through groundwater extraction, which is one of the main reasons for the decrease in groundwater. High temperatures have led to a significant increase in soil evaporation and plant transpiration (collectively referred to as evapotranspiration), resulting in a sharp deterioration in soil moisture. The surge in agricultural irrigation water has forced people to increase groundwater extraction, further overdrawing the already strained groundwater resources. As the second largest plain in China and one of the important agricultural regions, the high water-consuming planting structure (such as wheat and corn) in the NCP is highly dependent on groundwater irrigation, which is the core anthropogenic factor leading to groundwater drought [62].
The BEAST algorithm can not only detect abrupt changes in trends but also abrupt changes in periodic components (Figure 3). For example, it can identify that the seasonal patterns (such as amplitude and phase) of a time series have changed at a specific point in time (Figure 5). In addition, to address the issue of uncertainty in the existence of change points, BEAST calculates a probability at each potential change time to indicate the likelihood that the point is a change point [53]. The core advantage of the BEAST algorithm lies in its simultaneous adoption of the ideas of “Bayesian” and “ensemble”. It presents all possible and reasonable answers along with their credibility through probability distributions and can quantify the uncertainty of the analysis [55]. Furthermore, terrestrial water storage is a comprehensive indicator that integrates the impacts of natural climate variability and human activities. The GRACE satellite mission has enabled us to accurately monitor it from a global perspective for the first time [1,22,23]. Studying terrestrial water storage not only deepens our understanding of the global water cycle but, more importantly, provides an indispensable scientific basis for sustainable water resource management, adaptation to climate change, and mitigation of natural disaster risks. GRACE data show that the NCP is one of the global hotspots with the fastest groundwater decline, exhibiting persistent groundwater drought [14]. As China’s most important grain-producing area, the NCP requires a large amount of irrigation water. Insufficient surface water has led to long-term overexploitation of groundwater, which is the direct cause of the continuous decline in water storage in this region [38,63,64]. In terms of management responses, China has implemented the “South-to-North Water Diversion” project and the strictest water resource management system, aiming to alleviate water resource pressure in the NCP and reverse the declining trend of water storage [13,65].
The GRACE mission provides time-varying signals of the earth’s gravitational field, and the accuracy of its data is limited by various factors. We cannot fully determine the precise value, exact location, and accurate time of the earth’s mass changes (mainly water storage changes) observed by GRACE. This uncertainty stems from various links in the entire observation system [66,67]. The core of GRACE is to accurately measure the distance change between the two satellites. Although this technology is extremely advanced (with a precision of up to the micrometer level), the noise inherent in the instrument itself introduces uncertainty [68]. Secondly, the orbit of the satellite itself needs to be determined by systems such as GPS, and the uncertainty in its position will be directly transmitted to the gravitational field solution results [69]. The original data of GRACE has noise in the high-order terms (corresponding to small-scale spatial features). While filtering is used to suppress noise, it will also smooth out some real signals, which is one of the main uncertainties that GRACE data users must face [70,71].

4.2. Future Prospects

In existing studies, scholars in fields such as climatology and water resource science have mostly defined groundwater drought, and it is mostly from the perspective of water quantity. However, there has never been a definition from the perspective of water quality. Nevertheless, when the groundwater environment is polluted, the amount of available groundwater resources will decrease accordingly, which in turn will cause groundwater drought [72]. Therefore, the definition of groundwater drought from both water quantity and water quality perspectives needs to be further improved in the future. In addition, apart from remote sensing methods, when using ground monitoring data to evaluate groundwater drought, factors such as the difficulty in obtaining well data and the completeness of time-series data are key obstacles to groundwater drought research [26,28,67]. Therefore, improving the accuracy of remote sensing monitoring and expanding the scope of application of remote sensing are of great significance for in-depth research on groundwater drought [5,73,74]. In the future, given that groundwater drought itself is characterized by fuzziness, complexity, and uncertainty, we can also reveal the driving factors of groundwater drought from aspects such as climate change, aquifer characteristics, land use patterns, and human activities [24,58,75].

5. Conclusions

Based on GRACE satellites and the GLDAS hydrological model, this study reveals the spatiotemporal evolution characteristics of groundwater drought in the NCP and its five sub-regions from 2003 to 2022, identifies periodic and trend-based abrupt changes in groundwater drought, and clarifies the propagation time from groundwater drought to agricultural drought. The results show that:
(1)
From 2003 to 2022, the most severe groundwater drought in the NCP occurred in September 2021 (GDI = −1.59). The linear trend rate of GDI was −0.035/10a, indicating a gradually intensifying trend in groundwater drought. The seasonal abrupt change point (probability 79.15%) and the trend abrupt change point (probability 99.83%) of groundwater drought occurred in January 2004 (confidence interval: November 2003 to March 2004) and July 2020 (confidence interval: April 2020 to September 2020), respectively.
(2)
On an annual scale, the most severe groundwater drought occurred in 2021 (GDI = −1.59). In that year, the monthly average GDI across the NCP ranged between −0.58 and −2.78, with particularly severe groundwater drought conditions observed in July (GDI = −2.02), August (GDI = −2.17), September (GDI = −2.78), and October (GDI = −2.77). On a seasonal scale, the minimum (−2.63) and maximum (−0.86) GDI values occurred in autumn (drought-affected area: 98.60%) and spring (drought-affected area: 91.81%), respectively.
(3)
Complex nonlinear relationships exist between groundwater drought and climatic factors (SM, AH, AT, ET, PC, and ST) in the NCP from 2003 to 2022. Specifically, based on partial wavelet coherence, the optimal single-variable explanatory factor for groundwater drought was SM (PASC = 19.13%).
(4)
The maximum correlation coefficient between GDI and SVWI ranged from –0.18 to 0.98, with a mean of 0.52, indicating a generally significant positive correlation. Across sub-regions, areas where groundwater drought significantly influenced agricultural drought were mainly located in the eastern parts of BJ, TJ, HB, and the western part of SD. In the BJ, TJ, and HB regions, propagation times were primarily concentrated within 1–5 months, with mean lags of 2.87, 3.20, and 2.92 months, respectively.

Author Contributions

Conceptualization, W.L., Y.L. and S.H.; Methodology, Z.L., Q.X. and N.L.; Original draft preparation, F.W., W.L. and R.M.; Validation, K.F. and J.G.; Software, R.L., H.L. and M.D.; Funding acquisition, F.W., W.L. and Q.T. All authors have read and agreed to the published version of the manuscript.

Funding

This research was supported by National Key R&D Program of China (grant number 2023YFC3006603), National Natural Science Foundation of China (grant number 42401022 and 42301024), the State Key Laboratory of Spatial Datum Open Project (grant number SKLGIE2024-ZZ-8, SKLGIE2024-Z-4-1 and SKLGIE2023-ZZ-9), the Open Research Fund of Key Laboratory of River Basin Digital Twinning of Ministry of Water Resources (grant number Z0202042022), Key Research Projects of Higher Education Institutions in Henan Province (grant number 24A570005), Scientific and Technological Research Projects in Henan Province (grant number 242102321005), Henan Science and Technology R&D Program (Joint Funds Project) (grant number 242103810017), Joint Fund of Collaborative Innovation Center of Geo-Information Technology for Smart Central Plains, Henan Province and Key Laboratory of Spatiotemporal Perception and Intelligent processing, Ministry of Natural Resources (grant number 231103), and Key Research and Development Special Project of Henan Province (grant number 251111210700).

Data Availability Statement

The data presented in this study are available on request from the corresponding author due to the scientific research project currently in progress. The data in the scientific research project needs to be kept confidential temporarily.

Acknowledgments

We gratefully acknowledge Wenhan Yu’s help with language editing.

Conflicts of Interest

The authors declare no conflicts of interest. The funder was not involved in the study design, collection, analysis, interpretation of data, the writing of this article or the decision to submit it for publication.

References

  1. Wada, Y. Modeling groundwater depletion at regional and global scales: Present state and future prospects. Surv. Geophys. 2015, 55, 229–261. [Google Scholar]
  2. Song, X.H.; Chen, H.; Chen, T.; Qin, Z.H.; Chen, S.; Yang, N.; Deng, S.L. GRACE-based groundwater drought in the Indochina Peninsula during 1979–2020: Changing properties and possible teleconnection mechanisms. Sci. Total Environ. 2023, 908, 168423. [Google Scholar] [CrossRef]
  3. Nigatu, Z.M.; You, W.; Melesse, A.M. Drought Dynamics in the Nile River Basin: Meteorological, Agricultural, and Groundwater Drought Propagation. Remote Sens. 2024, 16, 919. [Google Scholar] [CrossRef]
  4. Christelis, V.; Mansour, M.; Jackson, C.R. Characterisation of Groundwater Drought Using Distributed Modelling, Standardised Indices, and Principal Component Analysis. Water Resour. Manag. 2025, 39, 4227–4241. [Google Scholar] [CrossRef]
  5. Thomas, B.F.; Famiglietti, J.S.; Landerer, F.W.; Wiese, D.N.; Molotch, N.P.; Argus, D.F. GRACE Groundwater Drought Index: Evaluation of California Central Valley groundwater drought. Remote Sens. Environ. 2017, 198, 384–392. [Google Scholar] [CrossRef]
  6. Han, Z.M.; Huang, S.Z.; Zhao, J.; Leng, G.Y.; Huang, Q.; Zhang, H.B.; Li, Z. Long-chain propagation pathways from meteorological to hydrological, agricultural and groundwater drought and their dynamics in China. J. Hydrol. 2023, 625, 130131. [Google Scholar] [CrossRef]
  7. Liu, Q.P.; Zhang, X.; Xu, Y.; Li, C.; Zhang, X.; Wang, X.F. Characteristics of groundwater drought and its correlation with meteorological and agricultural drought over the North China Plain based on GRACE. Ecol. Indic. 2024, 161, 111925. [Google Scholar] [CrossRef]
  8. Li, B.; Rodell, M.; Kumar, S.; Beaudoing, H.K.; Getirana, A.; Zaitchik, B.F.; de Goncalves, L.G.; Cossetin, C.; Bhanja, S.; Mukherjee, A.; et al. Global GRACE Data Assimilation for Groundwater and Drought Monitoring: Advances and Challenges. Water Resour. Res. 2019, 55, 7564–7586. [Google Scholar] [CrossRef]
  9. Pham, Q.B.; Kumar, M.; Di Nunno, F.; Elbeltagi, A.; Granata, F.; Islam, A.M.T.; Talukdar, S.; Nguyen, X.C.; Ahmed, A.N.; Al Anh, D.T. Groundwater level prediction using machine learning algorithms in a drought-prone area. Neural Comput. Appl. 2022, 34, 10751–10773. [Google Scholar] [CrossRef]
  10. Geng, G.P.; Zhang, B.; Gu, Q.; He, Z.X.; Zheng, R.L. Drought propagation characteristics across China: Time, probability, and threshold. J. Hydrol. 2024, 631, 130805. [Google Scholar] [CrossRef]
  11. Xiao, D.P.; Shen, Y.J.; Qi, Y.Q.; Moiwo, J.P.; Min, L.L.; Zhang, Y.C.; Guo, Y.; Pei, H.W. Impact of alternative cropping systems on groundwater use and grain yields in the North China Plain Region. Agric. Syst. 2017, 153, 109–117. [Google Scholar] [CrossRef]
  12. Kang, S.; Eltahir, E.A.B. North China Plain threatened by deadly heatwaves due to climate change and irrigation. Nat. Commun. 2018, 9, 2894. [Google Scholar] [CrossRef]
  13. Du, J.; Laghari, Y.; Wei, Y.C.; Wu, L.Y.; He, A.L.; Liu, G.Y.; Yang, H.H.; Guo, Z.Y.; Leghari, S.J. Groundwater Depletion and Degradation in the North China Plain: Challenges and Mitigation Options. Water 2024, 16, 354. [Google Scholar] [CrossRef]
  14. Dai, M.; Zhou, H.; Ma, W.J.; Tang, L.; Xu, S.Y.; Luo, Z.C. Tracking shallow and deep groundwater storage changes in North China Plain with improved fusion method and hybrid spectral analysis approach. J. Hydrol. 2024, 633, 131001. [Google Scholar] [CrossRef]
  15. Tian, J.Z.; Chen, Y.; Wang, S.; Chen, X.L.; Cheng, H.B.; Tian, X.L.; Wang, X.; Tan, K. Spatiotemporal monitoring of water storage in the North China Plain from 2002 to 2022 based on an improved GRACE downscaling method. J. Hydrol. Reg. Stud. 2025, 59, 102370. [Google Scholar] [CrossRef]
  16. Zhao, A.; Xiang, K.; Zhang, A.; Zhang, X. Spatial-temporal evolution of meteorological and groundwater droughts and their relationship in the North China Plain. J. Hydrol. 2022, 610, 127903. [Google Scholar] [CrossRef]
  17. Huang, J.; Cao, L.; Wang, L.; Liu, L.; Yu, B.; Han, L. Identification and spatiotemporal migration analysis of groundwater drought events in the North China Plain. Atmosphere 2023, 14, 961. [Google Scholar] [CrossRef]
  18. Tapley, B.D.; Bettadpur, S.; Ries, J.C.; Thompson, P.F.; Watkins, M.M. GRACE Measurements of Mass Variability in the Earth System. Science 2004, 305, 503–505. [Google Scholar] [CrossRef]
  19. Do, S.K.; Akhtar, F.; Goffin, B.; Aryal, A.; Tran, T.N.D.; Lipscomb, M.; Lakshmi, V. Assessing terrestrial water storage variations in Afghanistan using GRACE and FLDAS-Central Asia data. J. Hydrol. Reg. Stud. 2024, 55, 101906. [Google Scholar] [CrossRef]
  20. Duan, A.; Zhong, Y.L.; Xu, G.D.; Yang, K.J.; Tian, B.M.; Wu, Y.L.; Bai, H.B.; Hu, E. Quantifying the 2022 extreme drought in the Yangtze River Basin using GRACE-FO. J. Hydrol. 2024, 630, 130680. [Google Scholar] [CrossRef]
  21. Carlson, G.; Werth, S.; Shirzaei, M. A novel hybrid GNSS, GRACE, and InSAR joint inversion approach to constrain water loss during a record-setting drought in California. Remote Sens. Environ. 2024, 311, 114303. [Google Scholar] [CrossRef]
  22. Yang, F.; Forootan, E.; Liu, S.H.; Schumacher, M. A Monte Carlo Propagation of the Full Variance-Covariance of GRACE-Like Level-2 Data with Applications in Hydrological Data Assimilation and Sea-Level Budget Studies. Water Resour. Res. 2024, 60, e2023WR036764. [Google Scholar] [CrossRef]
  23. Feng, W.; Shum, C.K.; Zhong, M.; Pan, Y. Groundwater Storage Changes in China from Satellite Gravity: An Overview. Remote Sens. 2018, 10, 674. [Google Scholar] [CrossRef]
  24. Wu, T.T.; Zheng, W.; Yin, W.J.; Zhang, H.W. Spatiotemporal Characteristics of Drought and Driving Factors Based on the GRACE-Derived Total Storage Deficit Index: A Case Study in Southwest China. Remote Sens. 2020, 13, 79. [Google Scholar] [CrossRef]
  25. Yin, W.J.; Yang, S.; Hu, L.T.; Tian, S.Y.; Wang, X.L.; Zhao, R.X.; Li, P.J. Improving understanding of spatiotemporal water storage changes over China based on multiple datasets. J. Hydrol. 2022, 612, 128098. [Google Scholar] [CrossRef]
  26. Shen, Y.F.; Zheng, W.; Zhu, H.Z.; Yin, W.J.; Xu, A.G.; Pan, F.; Wang, Q.; Zhao, Y.L. Inverted Algorithm of Groundwater Storage Anomalies by Combining the GNSS, GRACE/GRACE-FO, and GLDAS: A Case Study in the North China Plain. Remote Sens. 2022, 14, 5683. [Google Scholar] [CrossRef]
  27. Su, K.; Zheng, W.; Yin, W.J.; Hu, L.T.; Shen, Y.F. Improving the Accuracy of Groundwater Storage Estimates Based on Groundwater Weighted Fusion Model. Remote Sens. 2022, 14, 202. [Google Scholar] [CrossRef]
  28. Qu, W.; Zhang, P.F.; Chen, P.N.; Li, J.Y.; Gao, Y. Spatiotemporal Variations and Sustainability Characteristics of Groundwater Storage in North China from 2002 to 2022 Revealed by GRACE/GRACE Follow-On and Multiple Hydrologic Data. Remote Sens. 2024, 16, 1176. [Google Scholar] [CrossRef]
  29. Gerdener, H.; Kusche, J.; Schulze, K.; Döll, P.; Klos, A. The global land water storage data set release 2 (GLWS2.0) derived via assimilating GRACE and GRACE-FO data into a global hydrological model. J. Geod. 2023, 97, 73. [Google Scholar] [CrossRef]
  30. Al-Abadi, A.M.; Hassan, A.A.; Al-Moosawi, N.M.; Handhal, A.M.; Alzahrani, H.; Jabbar, F.K.; Anderson, N.L. Drought susceptibility mapping in Iraq using GRACE/GRACE-FO, GLDAS, and machine learning algorithms. Phys. Chem. Earth 2024, 134, 103583. [Google Scholar] [CrossRef]
  31. Wu, B.; Wang, J.; Li, F.; Zhu, D.; Pan, J.; He, J.; Wang, W. Spatiotemporal variation characteristics and the possible causes of groundwater storage based on GRACE in the Huai River Basin, China. Nat. Hazards 2025, 121, 18435–18452. [Google Scholar] [CrossRef]
  32. Cui, L.; Zhong, L.; Meng, J.; An, J.; Zhang, C.; Li, Y. Spatiotemporal Evolution Features of the 2022 Compound Hot and Drought Event over the Yangtze River Basin. Remote Sens. 2024, 16, 1367. [Google Scholar] [CrossRef]
  33. Zhang, Y.; Zhang, R.; Ma, M.; Bu, Q. Identifying Groundwater Droughts and Its Recovery Based on Long-Term Groundwater Storage Simulation in Catchments Across Poyang Lake Basin. Hydrol. Process. 2025, 39, 70248. [Google Scholar] [CrossRef]
  34. Li, Z.; Huang, S.; Zhou, S.; Leng, G.; Liu, D.; Huang, Q.; Wang, H.; Han, Z.; Liang, H. Clarifying the Propagation Dynamics from Meteorological to Hydrological Drought Induced by Climate Change and Direct Human Activities. J. Hydrometeorol. 2021, 22, 2359–2378. [Google Scholar] [CrossRef]
  35. Chen, Y.Y.; Zhang, Y.Q.; Tian, J.; Tang, Z.X.; Wang, L.H.; Yang, X.N. Understanding the propagation of meteorological drought to groundwater drought: A case study of the North China Plain. Water 2024, 16, 501. [Google Scholar] [CrossRef]
  36. Liu, M.Y.; Geng, D.; Wu, L.; Min, L.L.; Wang, S.Q.; Shen, Y.J. The impact of agricultural land use change on water and nitrate fluxes in the deep vadose zone, the North China Plain. J. Hydrol. Reg. Stud. 2025, 62, 102914. [Google Scholar] [CrossRef]
  37. Wang, F.; Lai, H.X.; Men, R.Y.; Wang, Z.P.; Li, Y.B.; Qu, Y.P.; Feng, K.; Guo, W.X.; Jiang, Y.Z. Dynamic Variations of Agricultural Drought and Its Response to Meteorological Drought: A Drought Event-Based Perspective. J. Geophys. Res. Atmos. 2024, 129, e2024JD041044. [Google Scholar] [CrossRef]
  38. Wang, C.Y.; Liu, M.H.; Han, Y.P.; Chen, S.; Zhang, F.F.; Qiu, R.J.; Wu, D.F.; Zhang, G.C.; Wang, F.Q.; Liu, J.G. Assessing the impacts of irrigation and soil types on the water balance and groundwater depletion in an irrigation district of the North China Plain based on a coupled SWAT-MODFLOW model. Agric. Water Manag. 2025, 321, 109890. [Google Scholar] [CrossRef]
  39. Schumacher, M.; Forootan, E.; van Dijk, A.; Schmied, H.; Crosbie, R.; Kusche, J.; Döll, P. Improving drought simulations within the Murray-Darling Basin by combined calibration/assimilation of GRACE data into the WaterGAP Global Hydrology Model. Remote Sens. Environ. 2018, 204, 212–228. [Google Scholar] [CrossRef]
  40. Kashani, A.; Safavi, H.R. Assessing groundwater drought in Iran using GRACE data and machine learning. Sci. Rep. 2025, 15, 14671. [Google Scholar] [CrossRef]
  41. Yin, Y.; Guo, B.; Zhong, Y.; Deng, H.; Chang, L. Can GRACE and CMIP6 historical data identify groundwater drought in North China Plain? Theor. Appl. Climatol. 2023, 152, 1203–1219. [Google Scholar] [CrossRef]
  42. Liu, M.; Pei, H.; Shen, Y. Evaluating dynamics of GRACE groundwater and its drought potential in Taihang Mountain Region, China. J. Hydrol. 2022, 612, 128156. [Google Scholar] [CrossRef]
  43. Aon, S.; Nandi, S.; Sen, S.; Biswas, S. GRACE based groundwater drought evaluation of Ganga Basin and analysis of drought propagation using wavelet based quantitative approach. Sci. Total Environ. 2024, 951, 175666. [Google Scholar] [CrossRef]
  44. Mo, X.; Wu, J.; Wang, Q.; Zhou, H. Variations in water storage in China over recent decades from GRACE observations and GLDAS. Nat. Hazards Earth Syst. Sci. 2016, 16, 469–482. [Google Scholar] [CrossRef]
  45. Wu, Q.; Si, B.; He, H.; Wu, P. Determining Regional-Scale Groundwater Recharge with GRACE and GLDAS. Remote Sens. 2019, 11, 154. [Google Scholar] [CrossRef]
  46. Moghim, S. Assessment of Water Storage Changes Using GRACE and GLDAS. Water Resour. Manag. 2020, 34, 685–697. [Google Scholar] [CrossRef]
  47. Gu, Z.; Gu, L.; Yin, J.; Fang, W.; Xiong, L.; Guo, J.; Zeng, Z.; Xia, J. Impact of atmospheric circulations on droughts and drought propagation over China. Sci. China Earth Sci. 2024, 67, 2633–2648. [Google Scholar] [CrossRef]
  48. Guth, P.L.; Van Niekerk, A.; Grohmann, C.H.; Muller, J.P.; Hawker, L.; Florinsky, I.V.; Gesch, D.; Reuter, H.I.; Herrera-Cruz, V.; Riazanoff, S.; et al. Digital Elevation Models: Terminology and Definitions. Remote Sens. 2021, 13, 3581. [Google Scholar] [CrossRef]
  49. Ahmad, M.H.; Abubakar, A.; Ishak, M.Y.; Danhassan, S.S.; Zhang, J.H.; Alatalo, J.M. Modeling the influence of daily temperature and precipitation extreme indices on vegetation dynamics in Katsina State using statistical downscaling model (SDM). Ecol. Indic. 2023, 155, 110979. [Google Scholar] [CrossRef]
  50. Lidberg, W.; Nilsson, M.; Lundmark, T.; Ågren, A.M. Evaluating preprocessing methods of digital elevation models for hydrological modelling. Hydrol. Process. 2017, 31, 4660–4668. [Google Scholar] [CrossRef]
  51. Jiang, T.; Su, X.; Zhang, G.; Zhang, T.; Wu, H. Estimating propagation probability from meteorological to ecological droughts using a hybrid machine learning copula method. Hydrol. Earth Syst. Sci. 2023, 27, 559–576. [Google Scholar] [CrossRef]
  52. Jiang, T.; Su, X.; Qu, Y.; Singh, V.; Zhang, T.; Chu, J.; Hu, X. Determining the response of ecological drought to meteorological and groundwater droughts in Northwest China using a spatio-temporal matching method. J. Hydrol. 2024, 633, 130753. [Google Scholar] [CrossRef]
  53. Cai, Y.T.; Liu, S.T.; Lin, H. Monitoring the vegetation dynamics in the Dongting lake wetland from 2000 to 2019 using the BEAST algorithm based on dense Landsat time series. Appl. Sci. 2020, 10, 4209. [Google Scholar] [CrossRef]
  54. Zhao, K.G.; Wulder, M.A.; Hu, T.X.; Bright, R.; Wu, Q.; Qin, H.; Li, Y.; Toman, E.; Mallick, B.; Zhang, X.; et al. Detecting change-point, trend, and seasonality in satellite time series data to track abrupt changes and nonlinear dynamics: A Bayesian ensemble algorithm. Remote Sens. Environ. 2019, 232, 111181. [Google Scholar] [CrossRef]
  55. White, J.H.R.; Walsh, J.E.; Thoman, R.L., Jr. Using Bayesian statistics to detect trends in Alaskan precipitation. Int. J. Climatol. 2021, 41, 2045–2059. [Google Scholar] [CrossRef]
  56. Arra, A.; Keskin, M.; Şişman, E. Trend analysis of hydro-meteorological variables using Mann-Kendall and Sen’s Slope with Standardization (SSS): Case study of the Kızılırmak catchment, Türkiye. Phys. Chem. Earth 2025, 141, 104115. [Google Scholar] [CrossRef]
  57. Huang, S.; Chang, J.; Leng, G.; Huang, Q. Integrated index for drought assessment based on variable fuzzy set theory: A case study in the Yellow River basin, China. J. Hydrol. 2015, 527, 608–618. [Google Scholar] [CrossRef]
  58. Wang, F.; Lai, H.; Li, Y.; Feng, K.; Zhang, Z.; Tian, Q.; Zhu, X.; Yang, H. Dynamic variation of meteorological drought and its relationships with agricultural drought across China. Agric. Water Manag. 2022, 261, 107301. [Google Scholar] [CrossRef]
  59. Hudgins, L.; Friehe, C.A.; Mayer, M.E. Wavelet transforms and atmospheric turbulence. Phys. Rev. Lett. 1993, 71, 3279–3282. [Google Scholar] [CrossRef] [PubMed]
  60. Wu, J.; Tan, X.; Chen, X.; Lin, K. Dynamic changes of the dryness/wetness characteristics in the largest river basin of South China and their possible climate driving factors. Atmos. Res. 2020, 232, 104685. [Google Scholar] [CrossRef]
  61. Nalley, D.; Adamowski, J.; Biswas, A.; Gharabaghi, B.; Hu, W. A multiscale and multivariate analysis of precipitation and streamflow variability in relation to ENSO, NAO and PDO. J. Hydrol. 2019, 574, 288–307. [Google Scholar] [CrossRef]
  62. Fang, Q.X.; Ma, L.; Green, T.R.; Yu, Q.; Wang, T.D.; Ahuja, L.R. Water resources and water use efficiency in the North China Plain: Current status and agronomic management options. Agric. Water Manag. 2010, 97, 1102–1116. [Google Scholar] [CrossRef]
  63. Qin, H.; Cao, G.; Kristensen, M.; Refsgaard, J.; Rasmussen, M.; He, X.; Liu, J.; Shu, Y.; Zheng, C. Integrated hydrological modeling of the North China Plain and implications for sustainable water management. Hydrol. Earth Syst. Sci. 2013, 17, 3759–3778. [Google Scholar] [CrossRef]
  64. Xu, Y.; Gong, H.; Chen, B.; Zhang, Q.; Li, Z. Long-term and seasonal variation in groundwater storage in the North China Plain based on GRACE. Int. J. Appl. Earth Obs. 2021, 104, 102560. [Google Scholar] [CrossRef]
  65. Zhu, C.; Li, W. Comparison of GRACE/GRACE-FO Spherical Harmonic Coefficient and Mascon Products in Explaining the Influence of South-to-North Water Transfer Project on Water Reserves in the North China Plain. Water 2023, 15, 2343. [Google Scholar] [CrossRef]
  66. Boergens, E.; Kvas, A.; Eicker, A.; Dobslaw, H.; Schawohl, L.; Dahle, C.; Murböck, M.; Flechtner, F. Uncertainties of GRACE-Based Terrestrial Water Storage Anomalies for Arbitrary Averaging Regions. J. Geophys. Res. Solid Earth 2022, 127, e2021JB022081. [Google Scholar] [CrossRef]
  67. Wang, F.; Lai, H.; Li, Y.; Feng, K.; Zhang, Z.; Tian, Q.; Zhu, X.; Yang, H. Identifying the status of groundwater drought from a GRACE mascon model perspective across China during 2003–2018. Agric. Water Manag. 2022, 260, 107251. [Google Scholar] [CrossRef]
  68. Thomas, A.C.; Reager, J.T.; Famiglietti, J.S.; Rodell, M. A GRACE-based water storage deficit approach for hydrological drought characterization. Geophys. Res. Lett. 2014, 41, 1537–1545. [Google Scholar] [CrossRef]
  69. Felfelani, F.; Wada, Y.; Longuevergne, L.; Pokhrel, Y.N. Natural and human-induced terrestrial water storage change: A global analysis using hydrological models and GRACE. J. Hydrol. 2017, 553, 105–118. [Google Scholar] [CrossRef]
  70. Long, D.; Yang, Y.T.; Wada, Y.; Hong, Y.; Liang, W.; Chen, Y.N.; Yong, B.; Hou, A.Z.; Wei, J.F.; Chen, L. Deriving scaling factors using a global hydrological model to restore GRACE total water storage changes for China’s Yangtze River Basin. Remote Sens. Environ. 2015, 168, 177–193. [Google Scholar] [CrossRef]
  71. Sun, Z.L.; Zhu, X.F.; Pan, Y.Z.; Zhang, J.S.; Liu, X.F. Drought evaluation using the GRACE terrestrial water storage deficit over the Yangtze River Basin, China. Sci. Total Environ. 2018, 634, 727–738. [Google Scholar] [CrossRef] [PubMed]
  72. Zavareh, M.; Mahjouri, N.; Rahimzadegan, M.; Rahimpour, M. A drought index based on groundwater quantity and quality: Application of multivariate copula analysis. J. Clean. Prod. 2023, 417, 137959. [Google Scholar] [CrossRef]
  73. Han, S.; Sauber, J.; Broerse, T.; Pollitz, F.; Okal, E.; Jeon, T.; Seo, K.; Stanaway, R. GRACE and GRACE Follow-On Gravity Observations of Intermediate-Depth Earthquakes Contrasted with Those of Shallow Events. J. Geophys. Res. Solid Earth 2024, 129, e2023JB028362. [Google Scholar] [CrossRef]
  74. Liu, Y.; Dai, C.; Jing, Y.; Ru, Q.; Yan, F.; Zhang, Y. GRACE/GRACE-FO Satellite Assessment of Sown Area Expansion Impacts on Groundwater Sustainability in Jilin Province. Sustainability 2025, 17, 7731. [Google Scholar] [CrossRef]
  75. Haile, M.; Li, F.; Ai, Z.; Chen, G.; Leng, P. Spatiotemporal characteristics and driving factors of groundwater drought in Nile River Basin (NRB). Catena 2025, 257, 109194. [Google Scholar] [CrossRef]
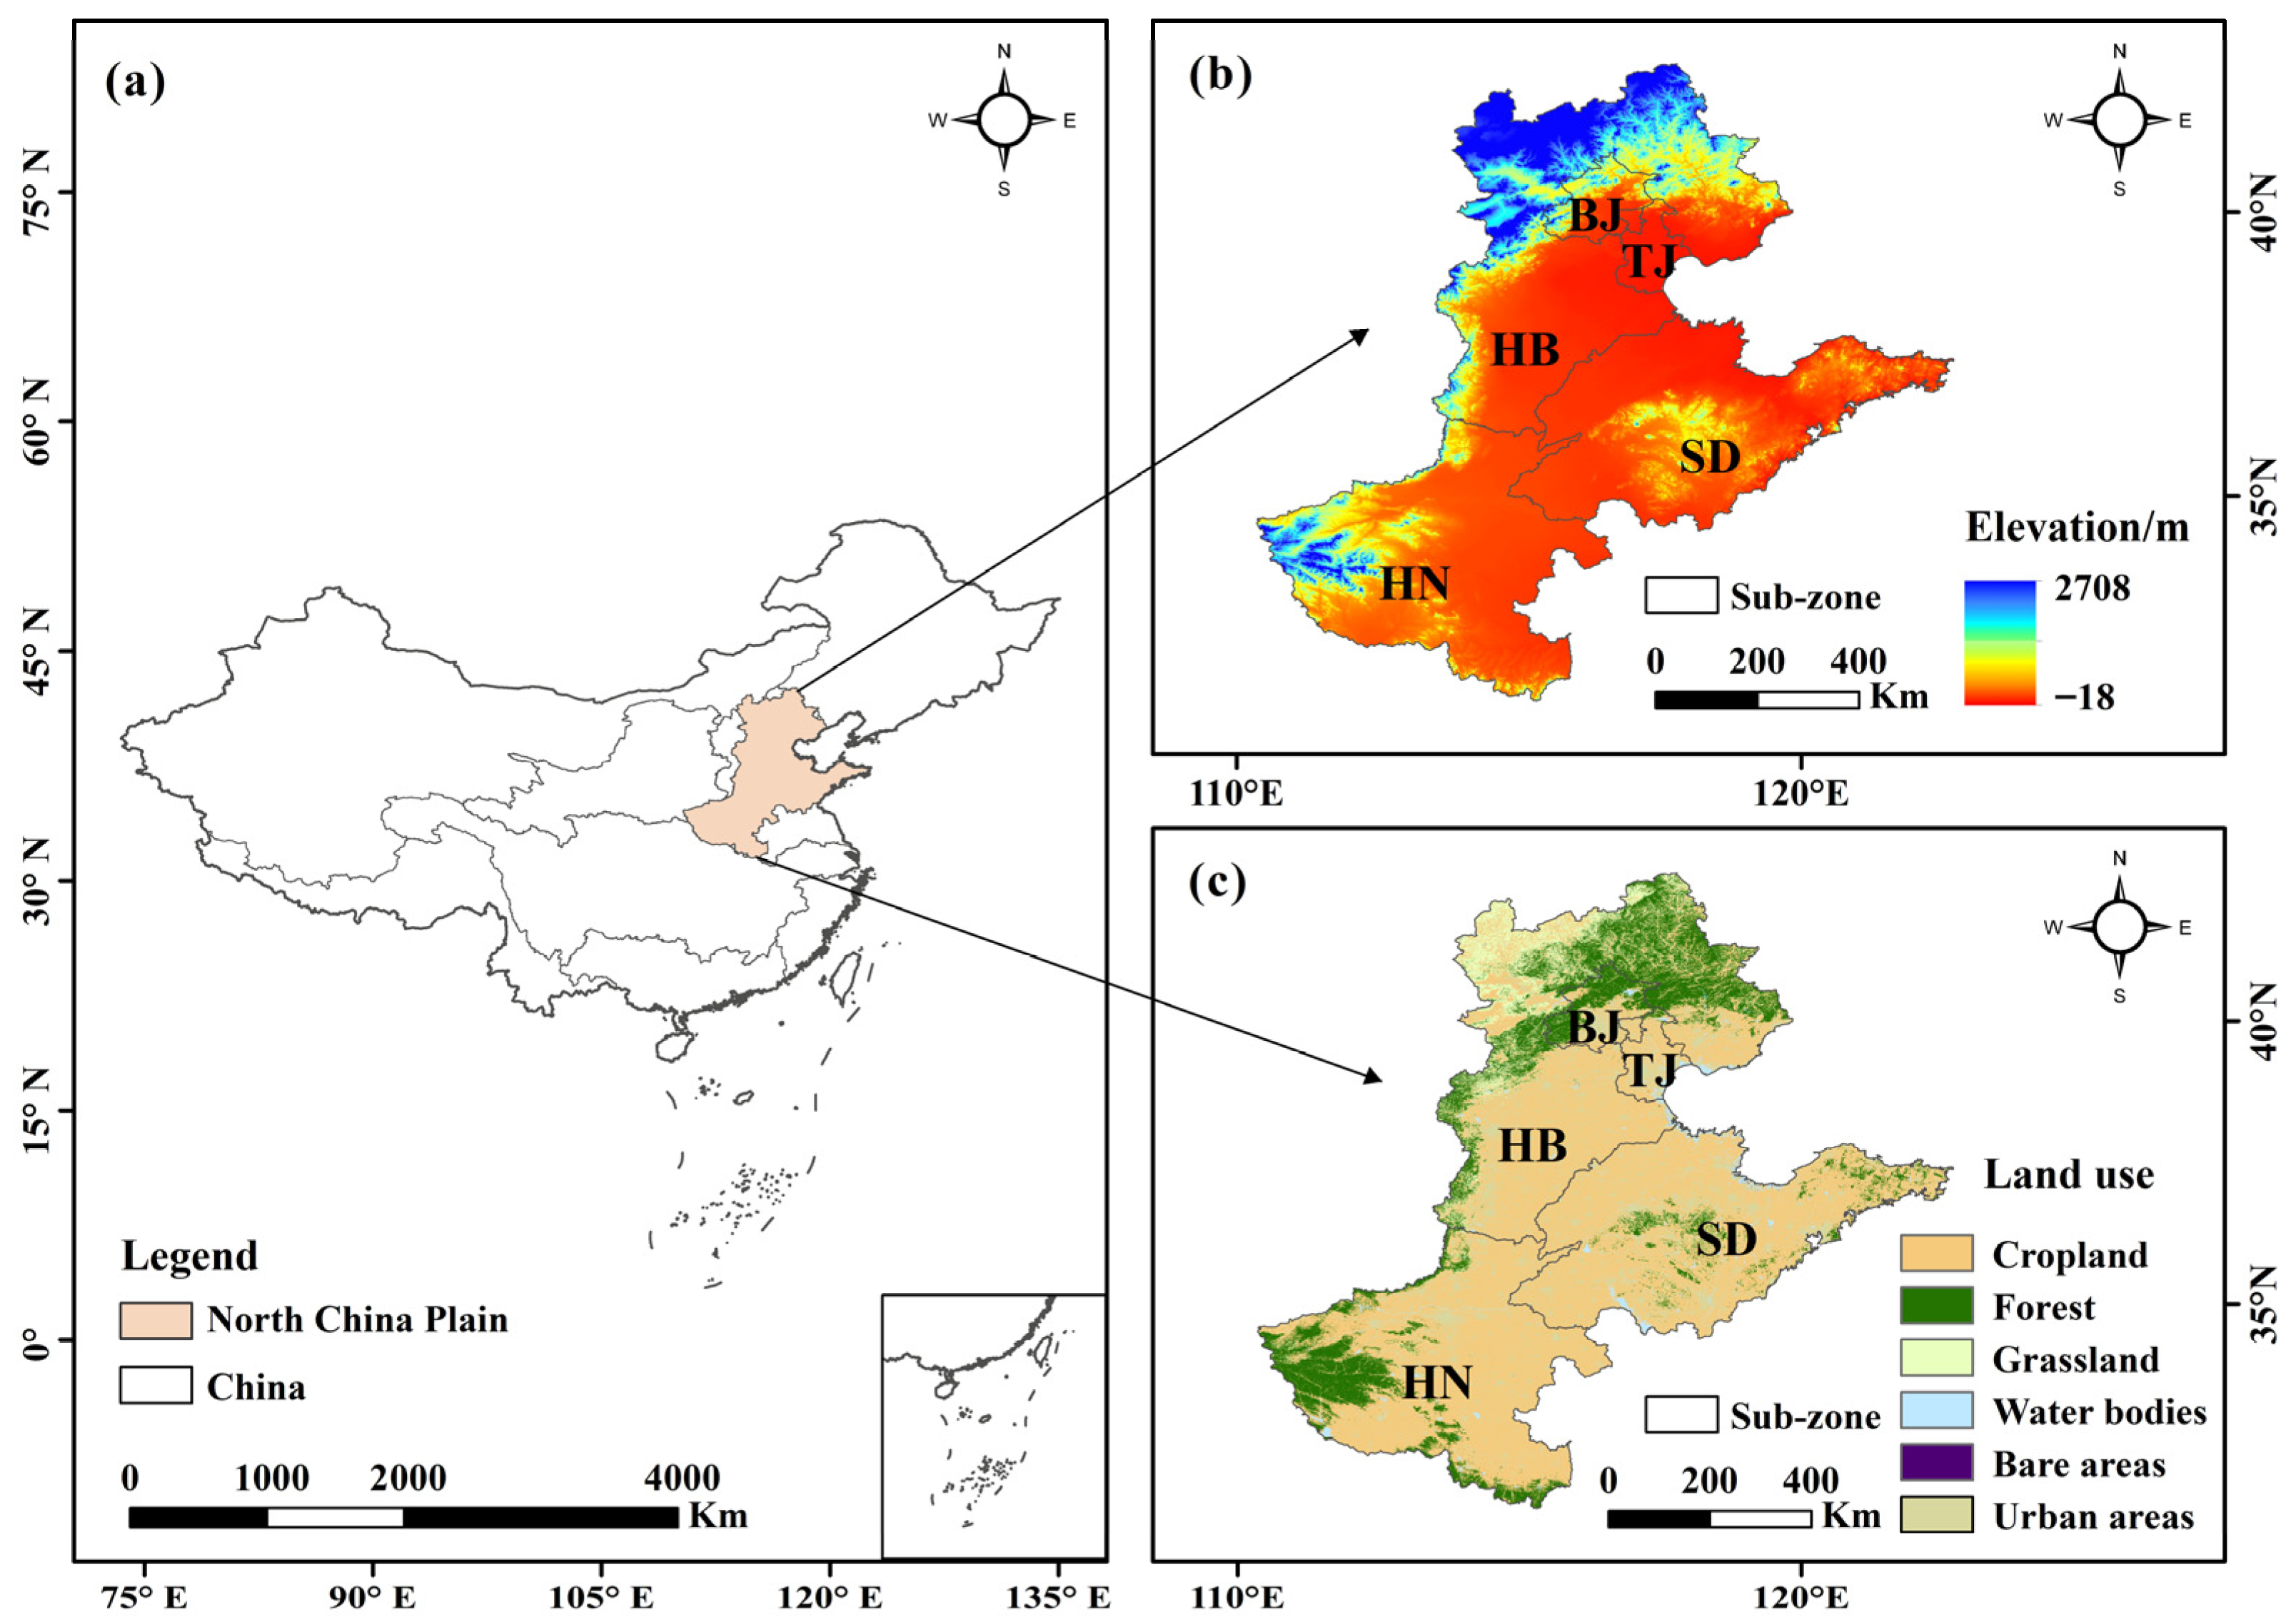
Figure 1. Geographical location and elevation distribution of the North China Plain (NCP). (a) NCP, (b) elevation, and (c) land use.
Agriculture 15 02431 g001
Figure 2. The calculation process of GDI based on GRACE and GLDAS during 2003–2022 in the NCP. Grey shadows denote uncertainties. (a) GWSA, (b) Ci, (c) GSD, and (d) GDI.
Agriculture 15 02431 g002
Figure 3. Periodic component, trend component, error term, and mutation points of groundwater drought based on BEAST decomposition and change point detection in the NCP.
Agriculture 15 02431 g003
Figure 4. The change point characteristics of groundwater drought in different sub-zones of the NCP (a) HB, (b) HN, (c) NCP, (d) BJ, (e) TJ, and (f) SD.
Agriculture 15 02431 g004
Figure 5. Locations and confidence intervals of (a) season and (b) trend mutation points in groundwater drought in the NCP.
Agriculture 15 02431 g005
Figure 6. Spatial distribution of groundwater drought in the driest year of the NCP. Red and green represent heavier and lighter drought conditions, respectively. The circular ring indicates the percentage of area affected by different groundwater drought levels.
Agriculture 15 02431 g006
Figure 7. Average values of GDI from 2003 to 2022 in different sub-zones of the NCP.
Agriculture 15 02431 g007
Figure 8. Gridded trend feature identification of groundwater drought during 2003–2022 in the NCP. The circular ring indicates the percentage of area for different trend types.
Agriculture 15 02431 g008
Figure 9. Zs values of GDI from 2003 to 2022 in different sub-zones of the NCP.
Agriculture 15 02431 g009
Figure 10. The partial wavelet coherence of groundwater drought and climatic factors (a) SM, (b) AH, (c) AT, (d) ET, (e) PC, and (f) ST during 2003–2022 in the NCP.
Agriculture 15 02431 g010
Figure 11. The response of agricultural drought to groundwater drought in various sub-zones of the NCP. Images (a,b) represent the maximum correlation coefficient between SVWI and GDI. Images (c,d) denote the propagation time from groundwater drought to agricultural drought.
Agriculture 15 02431 g011
Table 1. The PASC and AWC values between groundwater drought and climatic factors (SM, AH, AT, ET, PC, and ST) for different time–frequency scales (small, medium, and large scale).
MetricScaleSMAHATETPCST
PASC
(%)
Small35.197.765.105.243.424.34
Medium15.334.481.913.610.952.47
Large1.8117.330.010.980.930.96
Total19.138.562.593.491.862.66
AWCSmall0.940.920.930.930.930.93
Medium0.900.900.900.900.880.91
Large0.870.920.910.900.860.88
Total0.930.920.920.910.910.92
Disclaimer/Publisher’s Note: The statements, opinions and data contained in all publications are solely those of the individual author(s) and contributor(s) and not of MDPI and/or the editor(s). MDPI and/or the editor(s) disclaim responsibility for any injury to people or property resulting from any ideas, methods, instructions or products referred to in the content.