Article

Study on Lag Law of Irrigation Return Flow Based on Unit Hydrograph and Hydrus

1
School of Geology and Mining Engineering, Xinjiang University, Urumqi 830046, China
2
State Key Laboratory of Eco-Hydraulics in Northwest Arid Region, Xi’an University of Technology, Xi’an 710048, China
*
Author to whom correspondence should be addressed.
Agriculture 2025, 15(22), 2387; https://doi.org/10.3390/agriculture15222387
Submission received: 12 October 2025 / Revised: 8 November 2025 / Accepted: 18 November 2025 / Published: 19 November 2025
(This article belongs to the Section Agricultural Water Management)

Abstract

The Yellow River Diversion Irrigation District is a critical area for food security within the river basin; however, a significant contradiction exists between water supply and demand. The lag process of irrigation return flow is crucial for effective water resource management, yet this aspect has been overlooked in existing studies. This research focuses on the east-ern part of the Jingdian Irrigation District, where data related to agricultural hydrology was collected through monitoring efforts. The unit hydrograph method was introduced to construct a model, and numerical simulations were developed using Hydrus-2D to investigate the lag characteristics of irrigation return flow. The findings indicate that the lag time of return flow in response to precipitation and irrigation in the Hongbiliang Basin ranges from 0 to 2.3 months, while in the Nanshahe Basin, it spans from 0 to 5 months. The unit hydrograph model demonstrated high predictive accuracy, with a coefficient of determination (R2) exceeding 0.72 and a mean relative error (MRE) below 11.6% in both basins. The peak lag times recorded were 60 days and 110 days, respectively. The formation of return flow occurs in three stages: soil water infiltration, groundwater recharge, and channel drainage. Additionally, the unit hydrograph exhibited a strong fitting effect on silt loam and other soil types, confirming the validity of the “proportion and superposition” principle. This study contributes to the optimization of the water cycle model and the establishment of a comprehensive system within the irrigation district, thereby aiding in alleviating the pressure on water resources.

1. Introduction

The Yellow River Basin is a vital agricultural production base in China. As the primary guaranteed area for food security within the basin, the water diversion irrigation areas account for over 60% of the total agricultural irrigation water consumption in the region [1,2,3]. However, the basin has long been constrained by its inherent characteristics of “water scarcity and sediment abundance, with water and sediment originating from different sources”. Climate change has further led to an uneven spatiotemporal distribution of precipitation. At the same time, adjustments in agricultural planting structures have altered irrigation demands. These factors have intensified the water supply–demand contradiction, posing a significant bottleneck to the sustainable development of the Yellow River water diversion irrigation areas [4,5,6].
Irrigation return flow is a critical component of the water cycle in these irrigation districts. It refers to the portion of irrigation water not consumed by crops that returns to ditches, rivers, or groundwater via surface runoff or subsurface seepage [7,8,9,10]. This return flow constitutes approximately 20% to 40% of the total water diverted from the Yellow River [11]. Understanding its generation mechanisms and migration pathways, and integrating it into the irrigation district’s secondary water allocation system, could significantly reduce dependence on the main stream, thereby alleviating pressure on the basin’s water resources [12]. Current research on return flow in these districts predominantly focuses on “total amount estimation”, while largely neglecting the “lag process” between irrigation application and the eventual convergence of return flow into water bodies [13,14,15,16]. This oversight is critical: the lag diminishes the alignment between the availability of return flow and crop water demands or canal system supply schedules. Consequently, it not only hampers the reuse efficiency of return flow but may also contribute to waterlogging risks or imbalanced groundwater extraction, representing a key technical gap in the refined management of the district’s water resources [17,18].
A multi-dimensional technical framework for studying irrigation return flow has been established, providing a foundation for further research [19,20,21]. For quantifying the total volume, methods such as the water balance method [22,23], groundwater dynamics method [8,24], and isotope tracing method [25,26] are commonly used. The water balance method, for instance, estimates return flow as the difference between water diversion, crop consumption, and evaporation. Although straightforward, it overlooks intermediate migration processes [22]. The isotope tracing method can accurately identify sources but is often too costly and complex for widespread application in irrigation districts [27]. Research on the lag process itself primarily employs two types of approaches. The first involves process-based hydrological models like SWAT [28,29], MIKE SHE [30,31], and HYDRUS [32,33]. These models simulate lag times by representing interactions between land surface characteristics (e.g., soil texture, topography) and hydrological processes. While physically sound, they require high-quality input data (e.g., detailed soil moisture parameters, dense meteorological networks) [34], which are often lacking in Yellow River Diversion Irrigation Districts, leading to significant simulation errors [35]. The second category comprises empirical statistical models, such as linear regression [11,16,36] and gray system models [37,38]. These methods estimate lag parameters by correlating irrigation events with return flow discharges over time. However, they typically yield an “average lag effect” and fail to capture dynamic variations under different irrigation intensities or soil moisture conditions, while also being sensitive to outliers [39]. Overall, a quantification method for the lag law that suits the specific characteristics of these irrigation districts (e.g., silt loam soils, dense ditch networks, fixed irrigation cycles) and effectively balances accuracy with practicality is still needed.
To address the limitations of traditional physical models (high data requirements) and empirical models (lack of dynamic representation), this study introduces the unit hydrograph method to investigate the lag process of return flow. As a classical hydrological forecasting technique, this method simplifies the complex lag process into a quantifiable functional relationship through a “unit input–unit output” response framework, thereby providing a novel theoretical perspective for quantitatively characterizing the lag of return flow. Accordingly, this study aims to: (1) establish a framework for applying the unit hydrograph method to characterize the lag process of irrigation return flow in the Yellow River Diversion Irrigation Districts; (2) quantify key parameters of the lag process, such as lag time and concentration time, and analyze their influencing factors; and (3) evaluate the method’s applicability and potential value in supporting precise management and efficient reuse of water resources in the irrigation districts. The findings are expected to optimize parameter settings in water cycle models, improve the simulation accuracy of hydrological processes in irrigation districts, and provide theoretical support for constructing an integrated water cycle system encompassing “diversion–irrigation–consumption–drainage–return”.

2. Materials and Methods

2.1. Research Design Framework

This study adopted a systematic four-stage research framework to elucidate the lag process of irrigation return flow, integrating both field monitoring and numerical simulation approaches for data acquisition. In the first stage, field monitoring was conducted to collect essential data, including irrigation discharge, return flow volume measured by weirs, groundwater level data from monitoring wells, and key soil hydrological parameters determined through laboratory experiments. These field-measured data served as the foundation for the subsequent stages, specifically for calibrating model parameters and validating model accuracy.
Subsequently, based on the field data, a conceptual model of the return flow lag process was constructed using the unit hydrograph theory. The calibrated unit hydrograph model was then employed to simulate the formation process of return flow under various scenarios. Furthermore, to validate the rationality of the unit hydrograph model from a physical mechanism perspective, the Hydrus-2D Pro v2.04.058 software was utilized to develop a detailed soil water movement model. The simulation results from the Hydrus-2D model were systematically compared with the outputs of the unit hydrograph model. Finally, leveraging the validated unit hydrograph model, a quantitative analysis was performed to examine the effects of critical factors—such as irrigation intensity, soil texture, and groundwater depth—on the lag time. This progressive methodological design establishes a complete research chain, encompassing data observation, theoretical modeling, physical mechanism validation, and scenario-based mechanistic analysis.
This study integrates the unit hydrograph method and the Hydrus model based on the four considerations outlined here.
First, the unit hydrograph method and the Hydrus model are complementary in terms of their research roles and functions. The unit hydrograph method, as a system response model based on historical monitoring data, is primarily used to quantitatively describe the hysteresis characteristics of irrigation return flow. By applying the Nash instantaneous unit hydrograph principle, it simplifies the complex processes of soil water and groundwater movement into a “black-box” model controlled by a few parameters, thereby efficiently estimating the lag time and dynamics of return flow.
Second, the core connection between the two lies in the Hydrus model’s ability to validate the fundamental assumptions of the unit hydrograph approach. The applicability of the unit hydrograph method strictly depends on the assumptions of “proportionality” and “superposability”. This study designs multiple sets of Hydrus numerical experiments to systematically examine the validity of these assumptions, thereby significantly enhancing the reliability and theoretical basis of the unit hydrograph results.
Third, through its detailed simulation of hydrodynamic processes, the Hydrus model provides a mechanistic explanation for the hysteresis patterns quantified by the unit hydrograph method. While the unit hydrograph method determines “when” return flow occurs, the Hydrus model reveals “why” the process requires such a duration, thus providing a physical basis for the parameters used in the unit hydrograph method.
Finally, the combined use of both methods ultimately serves the goal of optimizing water resource management in irrigation districts. The unit hydrograph method, due to its simplicity and efficiency, is well-suited for predicting return flow at the regional scale and integrating into water allocation models. In contrast, the Hydrus model is more appropriate for mechanistic analysis and scenario simulation of management practices at the field scale. Together, they establish a comprehensive understanding spanning from micro-level mechanisms to macro-scale patterns, laying a solid foundation for building an accurate model of the entire water cycle—from water diversion, irrigation, consumption, drainage, to return flow—and ultimately helping to alleviate water supply–demand tensions in the irrigation districts of the Yellow River Basin.

2.2. Analysis of the Study Area

2.2.1. Overview of the Study Area

The study area is situated in the eastern part of the Jingdian Irrigation District in Jingtai County, Gansu Province, China (Figure 1). It spans an area of 351.3 km2, of which 235.4 km2 is irrigated, with water sourced from the Yellow River. The surface elevation of the study area ranges from 1300 m to 1710 m, featuring a terrain that is higher in the west and lower in the east. The region experiences a temperate continental arid climate, characterized by low rainfall, significant temperature fluctuations between day and night, abundant sunshine, high evaporation rates, and frequent sandstorms. According to long-term observation data from the Jingtai County Meteorological Observatory, precipitation is minimal, with multi-year totals ranging from 104 mm to 298 mm and an average of 191 mm. The average annual temperature is 8.8 °C. Monthly precipitation is highly unevenly distributed, primarily concentrated from June to September, accounting for 73% of the annual total. The monthly average temperature exhibits a single-peak distribution, peaking in July and reaching its lowest point in January. Monitoring of evaporation pans indicates that the multi-year average evaporation in the study area is 2290 mm, with a maximum annual evaporation of 2752 mm. The ratio of precipitation to evaporation is 1:18, yielding an aridity index of 3.0, classifying the area as extremely arid. The multi-year average annual sunshine duration is 2726 h, and the average wind speed is 1.8 m/s. Sandstorms frequently occur, predominantly in late spring and early summer. The main natural disasters affecting the irrigation district are drought and sandstorms.

2.2.2. Data Sources

Based on the distribution of the water system and groundwater flow field, the irrigation district was divided into two river basins: the Nanshahe Basin and the Hongbiliang Basin. To monitor irrigation return flow variations, a total of 11 water-measuring weirs (6 in Nanshahe and 5 in Hongbiliang) and two groundwater level monitoring wells (one in each basin) were established. Under normal conditions, both irrigation return flow and groundwater levels were monitored six times per month (on the 1st, 6th, 11th, 16th, 21st, and 26th). This routine frequency is sufficient to capture variation patterns during rain-free periods, when irrigation return flow is mainly recharged by dynamically stable groundwater, resulting in slow discharge changes—making it a cost-effective and rational arrangement. However, during heavy rainfall events, monitoring is intensified to capture the pulse response caused by surface runoff and rapid infiltration. Specifically, within the critical 48 h period after rainfall, the monitoring frequency is increased to hourly to accurately record the entire process of flow rise, peak, and recession. Monitoring returns to the regular schedule once flows stabilize. The layout of the weirs and monitoring wells is shown in Figure 1.
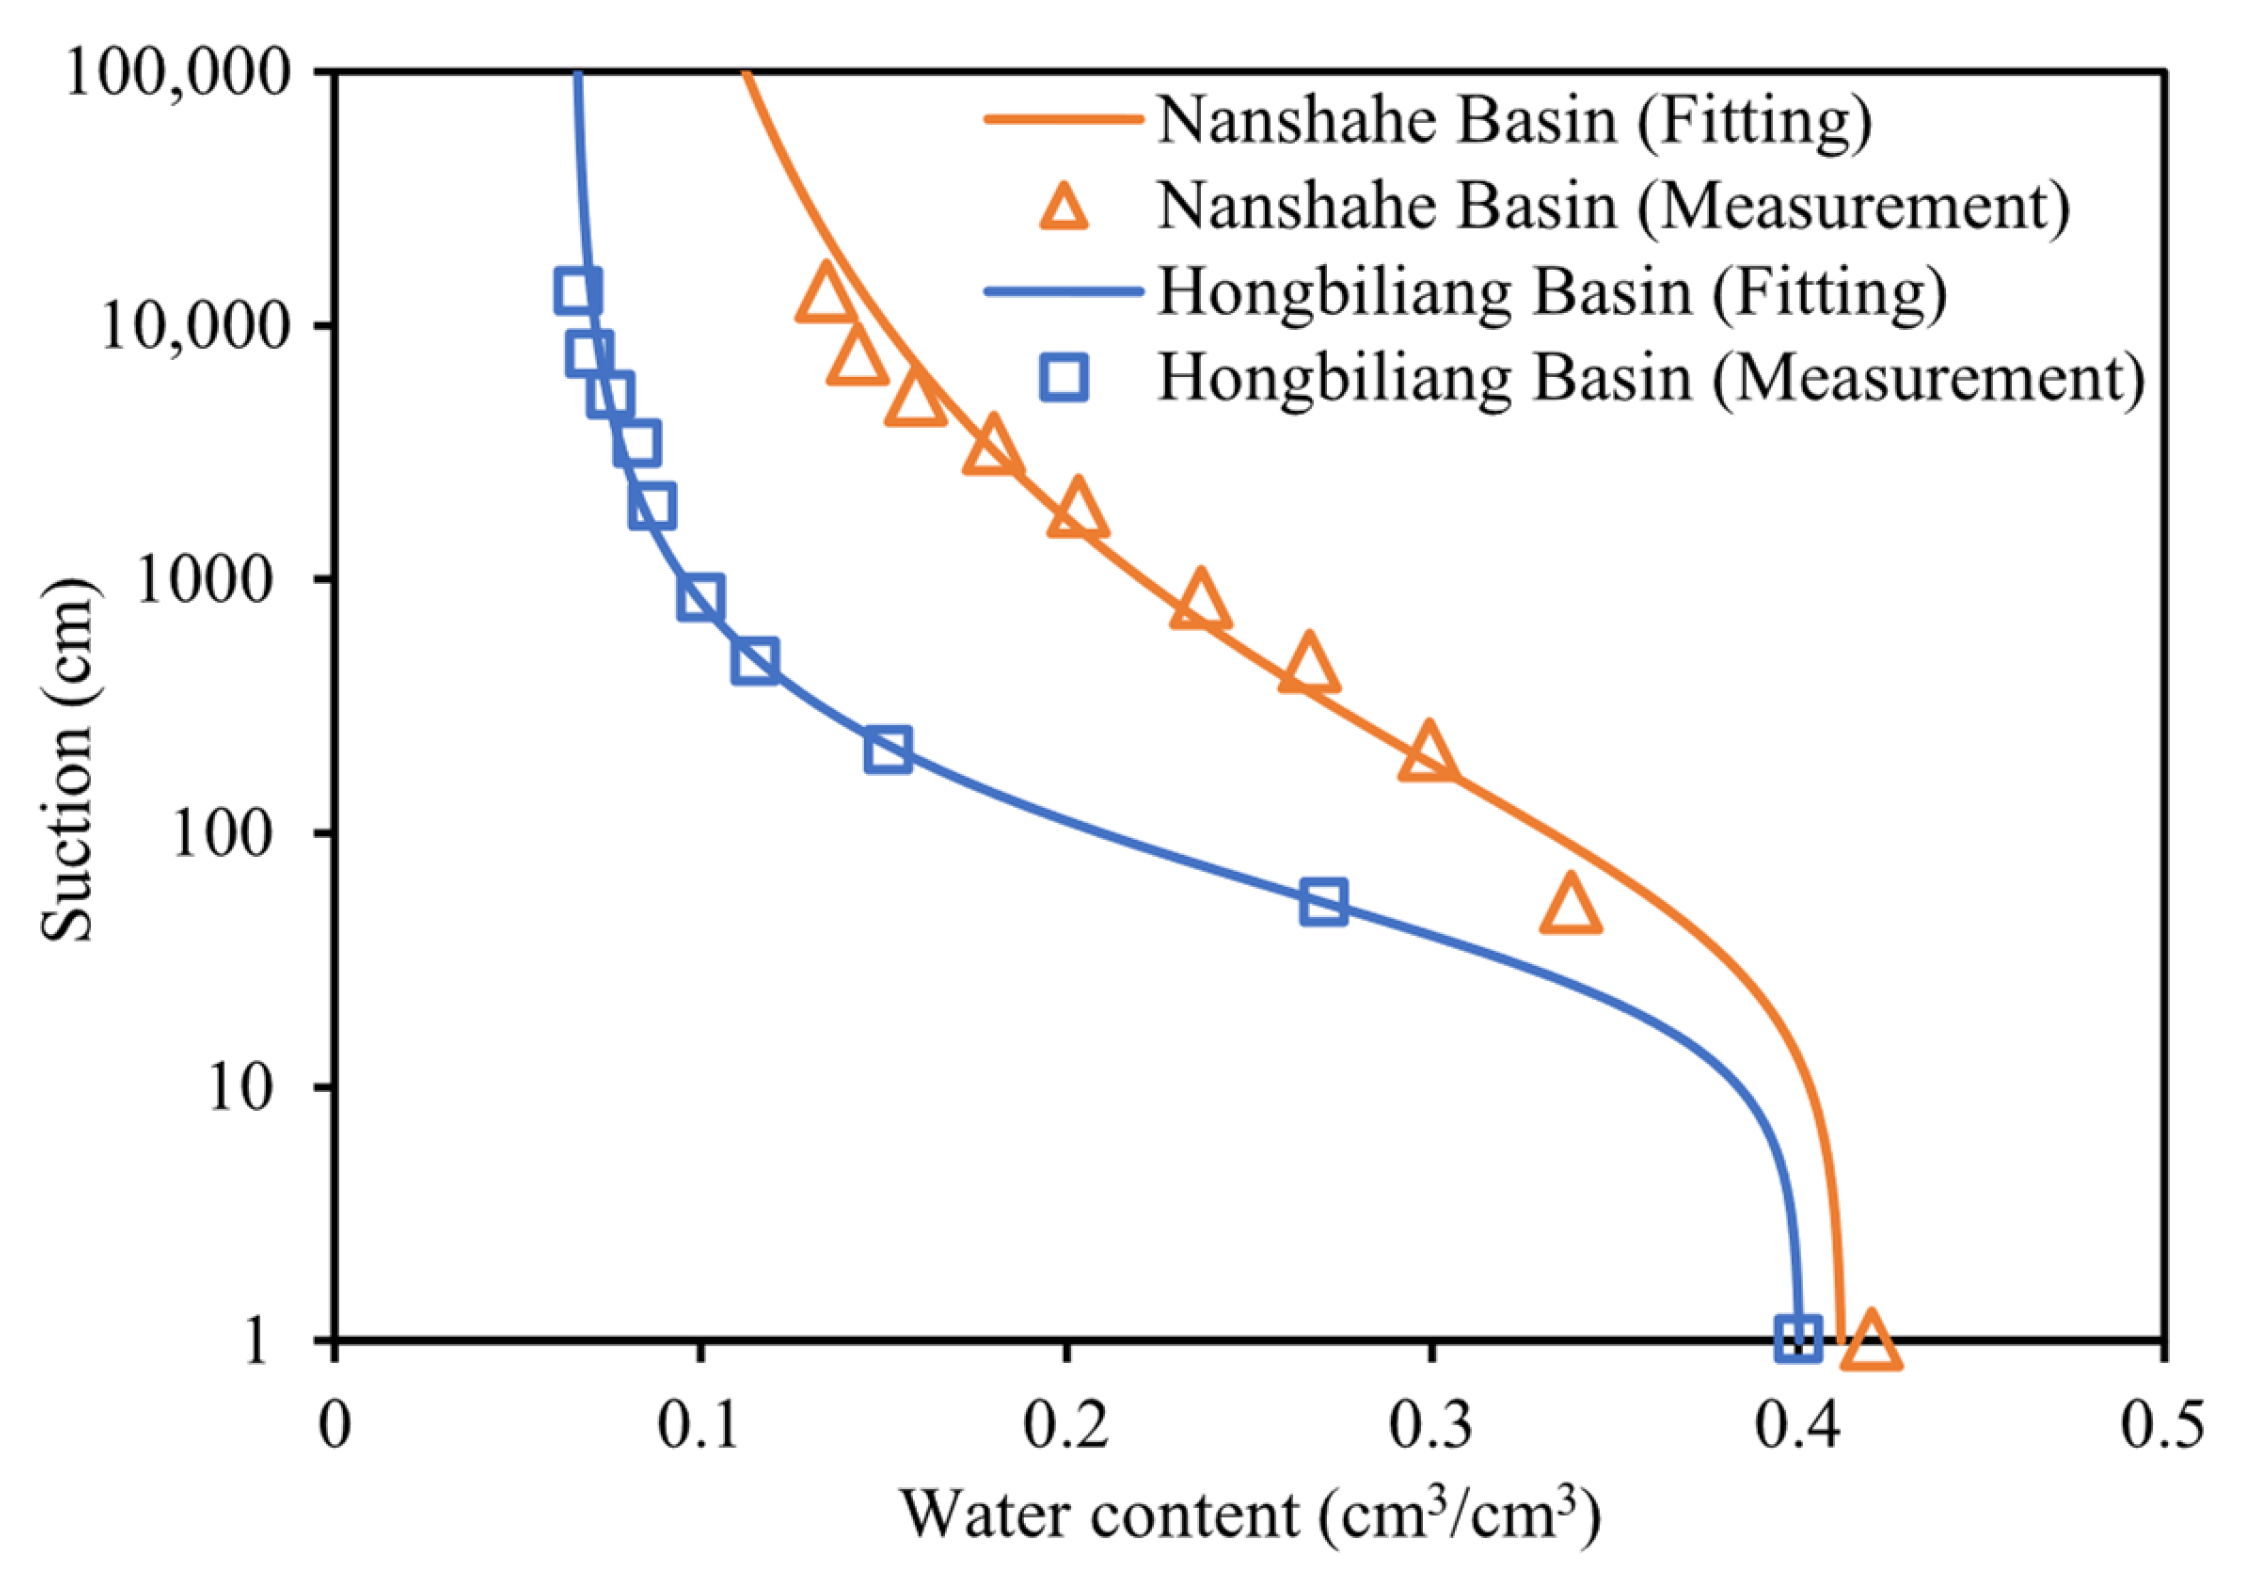
Soil texture, bulk density, saturated water content, field capacity, saturated hydraulic conductivity, and the soil water characteristic curve were determined through laboratory tests. Soil texture was analyzed by measuring the volume percentages of clay, silt, and sand in soil samples using a particle size analyzer (Mastersizer-2000, Malvern Panalytical, Malvern, UK), and the samples were classified according to the soil texture classification system of the International Society for Soil Science (ISSS). Field surveys and sampling indicated that the predominant soil textures in the irrigation district were silt loam and sandy loam, with minimal variation in particle composition within the depth range of 20–100 cm; thus, the soil in the root zone can be considered homogeneous. Soil bulk density was calculated using samples collected with a cutting ring, followed by drying and weighing. Saturated water content and field capacity were determined through water saturation, absorption, and weighing calculations. Saturated hydraulic conductivity was measured using indoor variable-head tests on undisturbed soil samples. The soil water characteristic curve was established by dehydrating soil samples with a high-speed centrifuge (H-1400PF, Kokusan, Tokyo, Japan), measuring the water content at different rotation speeds using the weighing method, and converting the centrifuge rotation speed into soil suction. For the purpose of analysis and calculation, the soil water content in this study was uniformly expressed as volumetric water content. The results of the soil parameter determinations are presented in Table 1, and the soil water characteristic curve is illustrated in Figure 2.

2.2.3. Calculation of Irrigation Return Flow

The study area experiences limited precipitation and insufficient groundwater resources, with deep percolation from irrigation and rainfall serving as the primary source of groundwater recharge. Figure 3 illustrates the schematic diagram of the irrigation return flow process in the Yellow River-diverting irrigation district located in arid regions. The key factors influencing the volume of irrigation return flow are precipitation and irrigation itself. Given that interflow in arid areas is minimal and can typically be disregarded, irrigation return flow comprises two components: surface return flow and groundwater return flow. The surface return flow is predominantly generated by field runoff. In small basin areas, the concentration time of overland flow is usually brief, allowing for the lag time to be negligible. In contrast, groundwater return flow is mainly produced by deep percolation that recharges groundwater, which subsequently discharges into the ditches. The processes of groundwater recharge and discharge occur relatively slowly, often spanning several months or even years. Therefore, it is essential to account for the lag time when calculating groundwater return flow. The volume of irrigation return flow can be computed using the following formula:
R F i = R i + G R i
where RFi refers to the irrigation return flow on the i-th day, in m3. Ri refers to the surface return flow on the i-th day. When the lag time is neglected, it is equivalent to the field runoff, which can be calculated by the SCS runoff model, in m3. GRi refers to the groundwater return flow on the i-th day, in m3.
The conversion of field runoff into return flow occurs rapidly, with a negligible lag time. In contrast, the conversion of deep percolation into return flow is a slower process, characterized by a longer lag time. The “unit hydrograph” can effectively describe the lag phenomenon associated with groundwater return flow. In hydrology, the unit hydrograph method relies on a fundamental assumption when calculating field runoff: the shape of the outlet discharge hydrograph formed by net rainfall of varying intensities remains consistent. Essentially, this method treats the confluence of net rainfall at different intensities as a linearly superimposable process.
In the study area, the formation of irrigation return flow resembles the surface confluence process. The volume of deep percolation can be considered as the “net rainfall” in the context of the unit hydrograph, while the regulation and storage processes within the unsaturated and saturated zones can be viewed as the “surface confluence process”. Thus, the irrigation return flow process can be conceptualized as a linearly superimposable system, adhering to the assumptions of “proportion and superposition”. Accordingly, the irrigation return flow unit hydrograph defined in this study is characterized as a proportional curve representing irrigation return flow generated by deep percolation water that is uniformly distributed in both time and space within a given basin over a specified time period. The unit time period may be determined based on the relevant time scale and can be set as a day, ten days, or a month for calculation purposes.
Consistent with the unit hydrograph method, the return flow unit hydrograph adheres to three fundamental assumptions: (1) The volume of deep percolation varies within a unit time period, yet the total duration of the resulting return flow hydrograph remains unchanged. (2) The return flow volume produced by x times the unit deep percolation volume is x times that of the unit hydrograph within a unit time period. (3) The return flow processes generated by deep percolation volumes across different unit time periods do not interfere with one another, and the total return flow volume is equal to the sum of the return flow volumes from deep percolation volumes in each unit time period.
Figure 4 illustrates the schematic diagram of irrigation return flow superposition. Based on the principles of proportion and superposition, the return flow volume generated by multiple periods of percolation can be expressed as:
G R j = i = 1 j D P i u j i ,
where GRj refers to the return flow volume on the j-th day, in m3. DPi refers to the deep percolation volume generated on the i-th day, in m3. j − i represents the lag time of return flow relative to deep percolation, in days (d). u(j − i) denotes the value of the unit hydrograph, i.e., the proportion of return flow generated on the j-th day from the percolation volume on the i-th day.
In summary, the calculation of return flow can be divided into two steps:
  • First step: Calculate the field runoff volume and deep percolation volume in different time periods using SCS model [40].
  • Second step: Based on the calculation results of deep percolation volume, use the unit hydrograph and the principles of proportion and superposition to calculate the groundwater return flow volume in different time periods.
  • Third step: The sum of the field runoff volume and groundwater return flow volume is the total irrigation return flow volume.

2.2.4. Principle of the Unit Hydrograph

Nash regarded the surface confluence process as a storage regulation mechanism for a series of cascaded reservoirs and derived the instantaneous unit hydrograph equation based on linear system theory [41]. Essentially, the unit hydrograph represents a lag distribution curve of net rainfall. In the study area, the irrigation return flow process can be viewed as a storage regulation and redistribution mechanism of deep percolation water within the unsaturated and saturated zones. Therefore, it is assumed that Nash’s linear reservoir theory is also applicable to the calculation of groundwater return flow.
Applying Nash’s unit hydrograph theory in the Supplementary Materials, the approximate solution for the recession flow unit hydrograph is derived as:
u τ Γ * n , τ + 1 k Γ * n , τ 1 k 2 Γ n ,
where n denotes the number of linear reservoirs, and k denotes the storage-discharge coefficient, in days (d). The Gamma function (Γ) and incomplete Gamma function (Γ*) in Equation (3) are commonly used functions, whose values can be obtained by looking up mathematical tables or calculating with software.
By combining Equations (2) and (3), the formula for calculating the return flow in each time period is obtained as follows:
G R j = i = 1 j D P i Γ * n , j i + 1 k Γ * n , j i 1 k 2 Γ ( n ) ,
In the equation, DPi (daily deep percolation volume) can be calculated using the SCS runoff model [40]. Therefore, only the unit hydrograph parameters n (number of linear reservoirs) and k (storage-discharge coefficient, in days) need to be determined to compute the groundwater return flow time series.
First, the total irrigation return flow volume is calculated from the field runoff volume and groundwater return flow volume. Then, the parameters n and k are derived by fitting the monitored values of irrigation return flow to the calculated values.
Based on the principle of least squares, the sum of squared residuals between the monitored values and calculated values of irrigation return flow can be expressed as:
Φ n , k = i = 1 N S R F i R F i 2 ,
where Φ denotes the sum of the squared residuals function. Ns denotes the length of the time series. RF denotes the calculated value of irrigation return flow, in m3. RF′ denotes the monitored value of irrigation return flow, in m3.
The unit hydrograph parameters n and k were calibrated using the least squares method by minimizing the objective function Φ(n, k) defined in Equation (5). The optimization was performed automatically using the Sequential Quadratic Programming (SQP) algorithm, an efficient method for constrained nonlinear problems. Parameter bounds were set to n ∈ [1,10] and k ∈ [0.1, 100] to ensure physical realism. The calibration used data from the period January 2018 to June 2019, and the resulting optimal parameters were validated on the independent dataset from July 2019 to December 2020. Model performance was evaluated using the coefficient of determination (R2) and the mean relative error (MRE).

2.3. Numerical Simulation of Irrigation Return Flow Based on Hydrus

2.3.1. Model Establishment

The unit hydrograph model is established based on the principles of proportionality and superposition. To verify the model’s reliability, Hydrus-2D is utilized to simulate changes in irrigation return flow under varying infiltration durations and intensities. A comparative study is then conducted between the simulation results and the calculations derived from the unit hydrograph model to assess the applicability of both the proportionality and superposition principles, as well as the unit hydrograph model itself.
As illustrated in Figure 5, this study simplifies the irrigation return flow problem into a two-dimensional cross-sectional model under ideal conditions. Assuming symmetry on both banks of the channel, only the impact of one-sided infiltration on return flow is simulated. The simulated field plot measures 10 m in length and 6 m in height. The channel is trapezoidal, with a depth of 2 m, a top width of 1 m, a bottom width of 0.8 m, and a water depth of 0.3 m. By establishing the x-z plane coordinate system, as shown in Figure 5, the governing equation of the soil water movement model can be expressed as follows:
θ t = K θ h x x + K θ h z + 1 z ,
where θ is the soil water content, with the unit of cm3/cm3. T is time, with the unit of d (day). K is the soil hydraulic conductivity, with the unit of m/d (meter per day). h is the pressure head, with the unit of m (meter).
The soil water retention curve and unsaturated hydraulic conductivity curve are determined based on the van Genuchten–Mualem model [42,43]:
θ h = θ r + θ s θ r 1 + | α · h | b a ; h < 0 θ s ; h 0 ,
K θ = K s · S e 1 2 · 1 1 S e 1 a a 2 ,
S e = θ θ r θ s θ r ,
where θs is the saturated water content, in cm3/cm3. θr is the residual water content, in cm3/cm3. Ks is the saturated hydraulic conductivity, in m/d. α, a and b are the parameters of the soil water retention curve model. Se denotes the degree of soil saturation.
To simulate the hysteresis process of irrigation return flow, this study developed a two-dimensional cross-sectional model with three distinct boundary conditions, each representing specific physical processes and hydrological implications.
The boundary conditions of the model can be classified into three types: constant flux boundary, constant head boundary, and free drainage boundary. The top boundary, which facilitates infiltration recharge, is characterized as a constant flux boundary. The channel boundary is further divided into two cases: the section below the water surface is classified as a constant head boundary, while the section above the water surface is designated as a free drainage boundary. Both the lateral boundaries and the bottom boundary exhibit no water exchange and are therefore classified as zero-flux boundaries.
The specific hydrological roles of each boundary condition are as follows:
Constant Flux Boundary: Applied at the upper boundary of the model, this condition represents the infiltration recharge process in the field. It simulates the entry of water from irrigation or precipitation into the soil surface at a constant rate, serving as the source and initial driver of return flow formation. This boundary governs the intensity and total volume of water entering the system.
Constant Head Boundary and Free Drainage Boundary: These conditions are applied together at the channel boundary to simulate groundwater discharge into the channel—the final stage of return flow formation. The constant head boundary is set below the water level in the channel, where the hydraulic head is maintained by the channel stage. It represents the steady discharge of groundwater into the channel under hydrostatic pressure, reflecting the relatively stable baseflow component of return flow. The free drainage boundary is applied above the channel water level. It allows water to drain freely when the soil pore pressure is positive (saturated conditions) and prevents flow when the pressure is negative (unsaturated conditions). This accounts for transient seepage or surface runoff along the channel banks following rainfall or irrigation events.
Zero-Flux Boundary: Applied at the lateral and bottom boundaries of the model, this condition assumes no water exchange with areas outside the model domain. It defines the field as a hydrologically isolated unit, allowing focused analysis of internal water movement and transformation processes while simplifying computational complexity.
By integrating these boundary conditions, the model effectively captures the complete pathway of water movement—from infiltration and recharge to discharge—providing a robust numerical platform for investigating the hysteresis characteristics of irrigation return flow. The governing equations for these three boundary conditions can be expressed as follows:
  • Constant flow boundary
K h z B 1 = R t ,
K h z B 2 = 0 ,
K h x B 3 = 0 ,
K h x B 4 = 0 ,
where R(t) denotes the infiltration amount at the upper boundary, with the unit of m/d (meters per day).
2.
Constant head boundary
h B 5 = 0.3 ,
h B 6 = 4.3 z ,
3.
Free seepage boundary
K h h x B 7 = 0 ; h < 0     h B 7 = 0 ; h 0 ,
Assuming that the initial pressure head is linearly distributed along the z-axis, the initial condition is expressed as:
h t = 0 = 4.3 z
Based on the Hydrus model, the total volume of irrigation return flow is calculated as the sum of flows at the constant head boundary (submerged part of the channel) and the free seepage boundary (part above the water level). To minimize the influence of initial soil water redistribution on the return flow process, the model was pre-run without infiltration until the moisture distribution stabilized. This steady-state condition was then used as the initial water content field for the subsequent infiltration simulation. Soil hydraulic parameters were adopted from the default parameter set in the Hydrus model database, which have been widely validated and ensure internal consistency.
The parameter choices and modeling assumptions in this study are grounded in sound physical mechanisms and established modeling principles, thereby ensuring the scientific validity and reliability of the irrigation return flow simulations. The boundary conditions realistically represent the channel’s role as a groundwater discharge base and fully capture the complete pathways of return flow. The use of a pre-run initial condition helps avoid errors from arbitrary assumptions, ensuring that simulation results genuinely reflect the effects of irrigation or rainfall events. By simplifying field conditions into an idealized two-dimensional cross-section, the model serves as a controlled numerical experimental platform, facilitating clear analysis of how different infiltration conditions affect return flow processes. This design effectively supports the validation of the core hypotheses—proportionality and superposition—of the unit hydrograph method.

2.3.2. Simulation Schemes

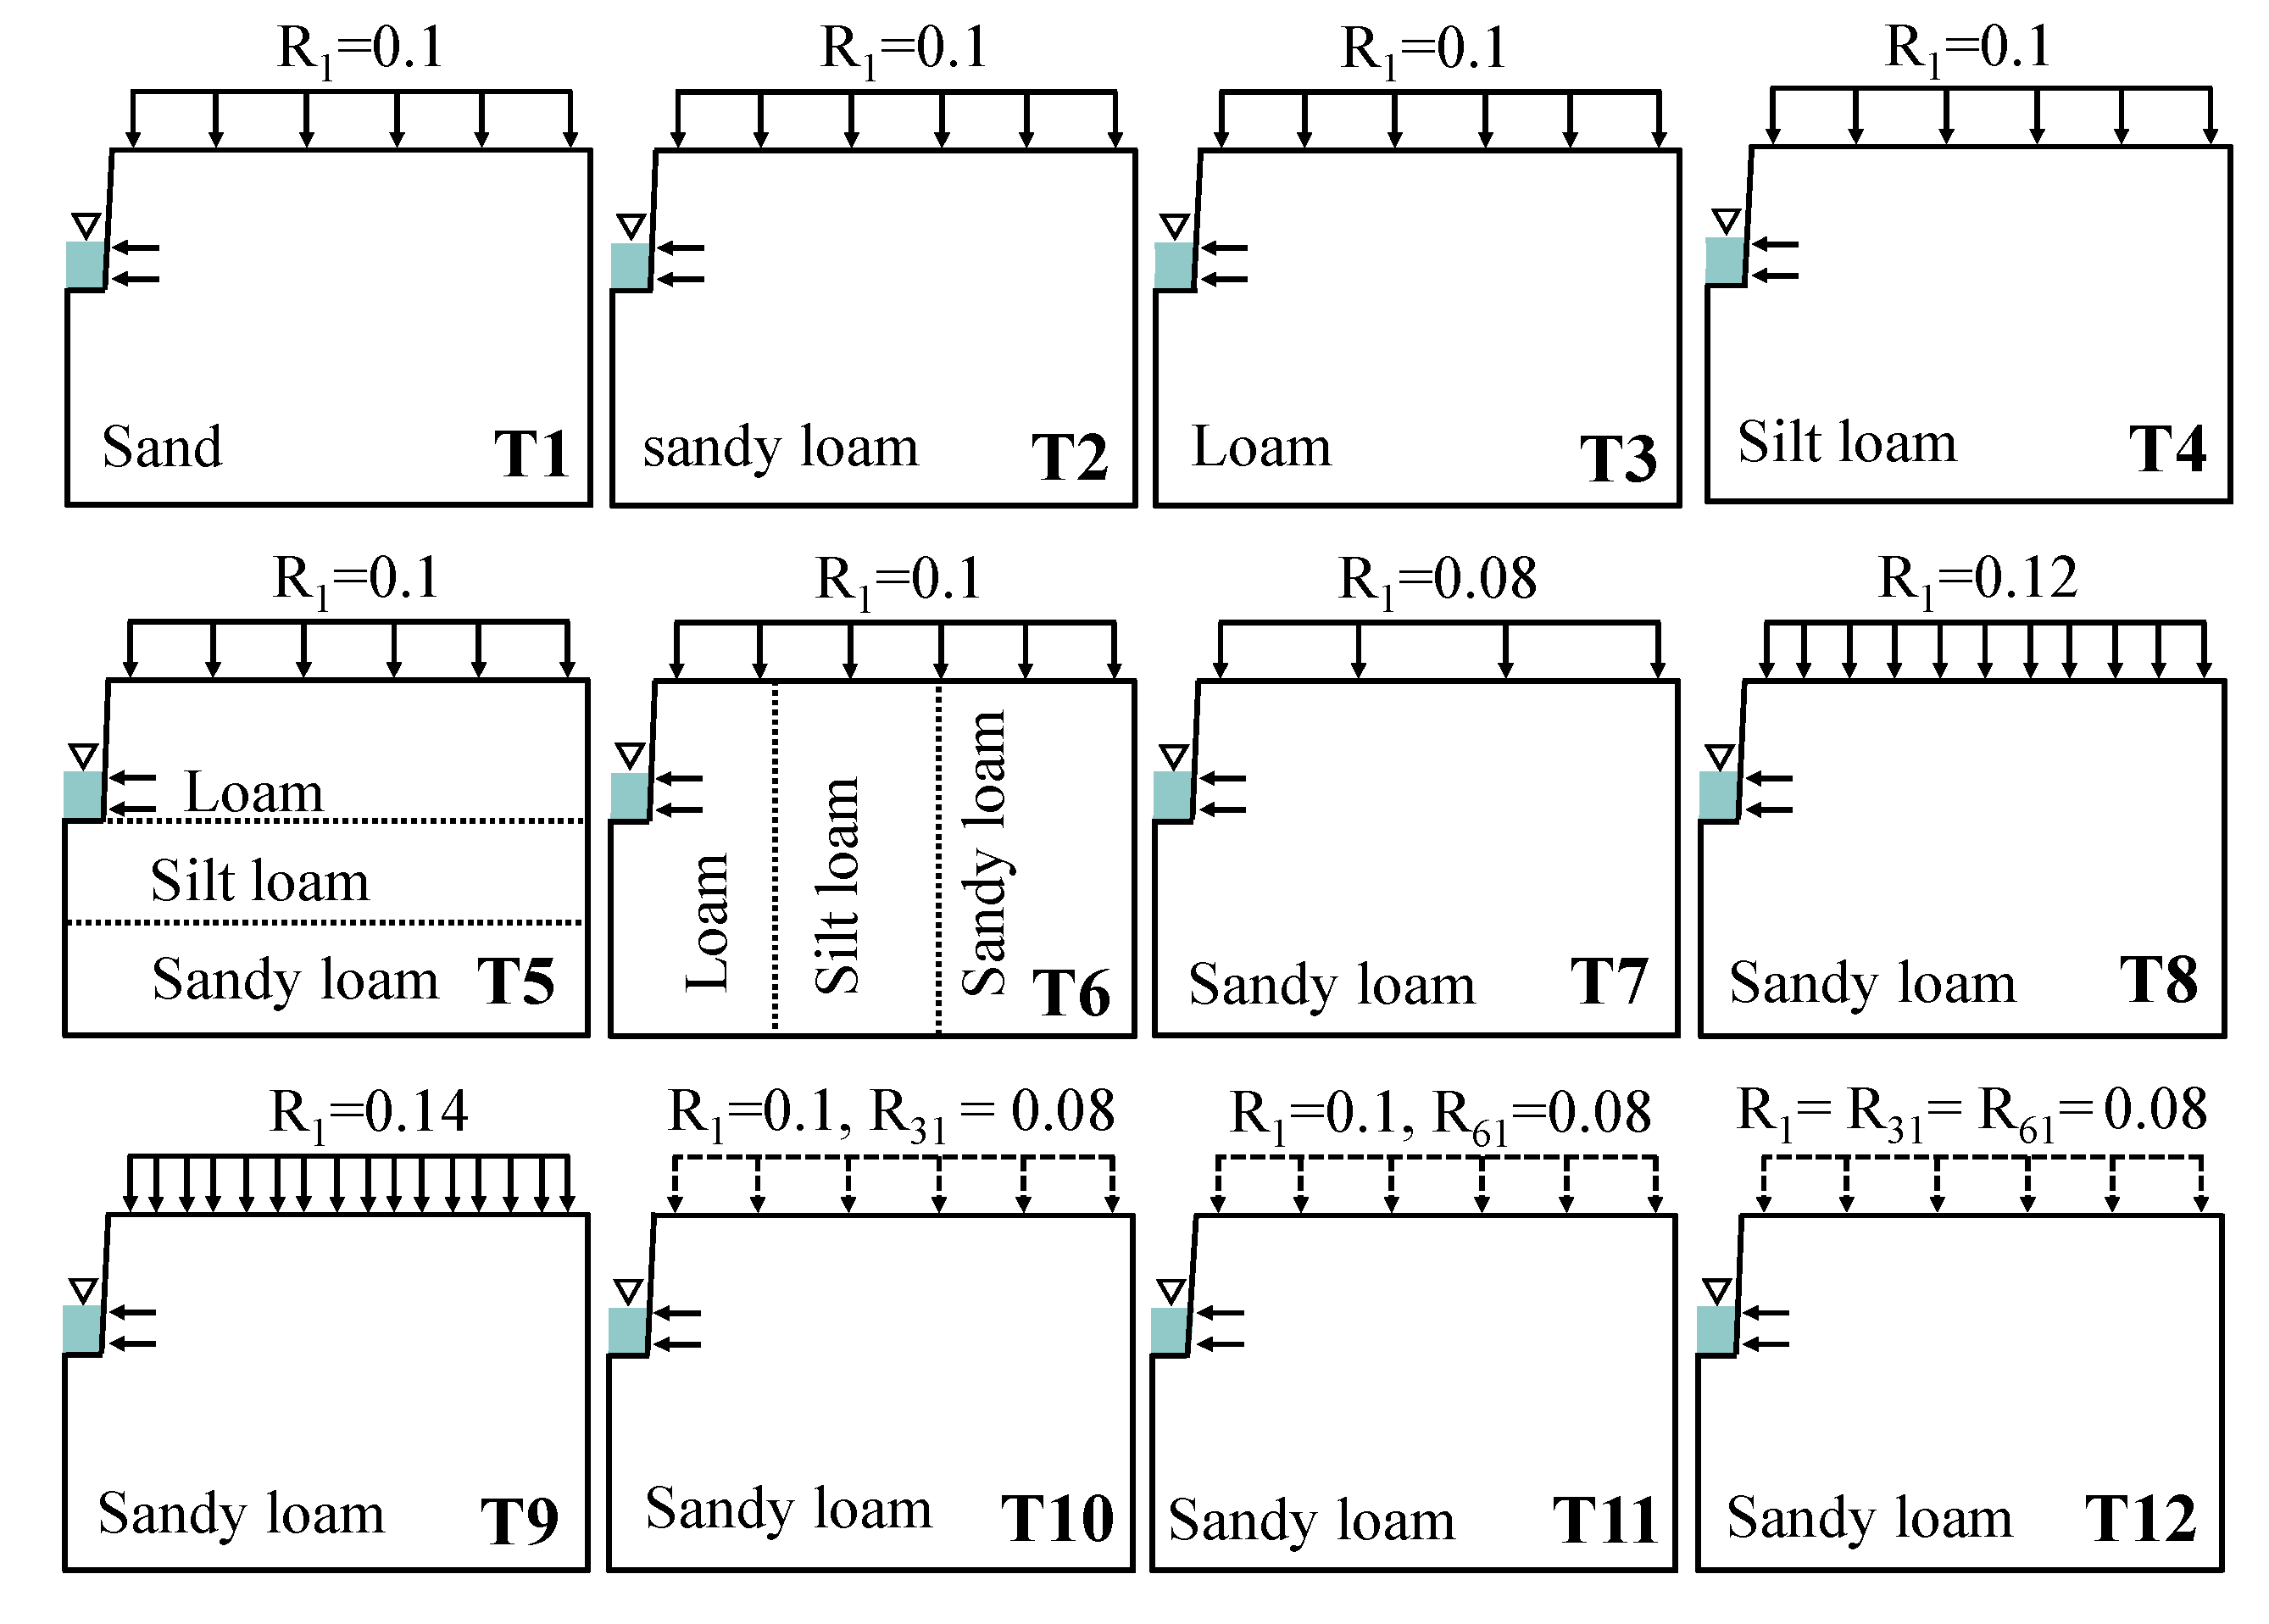
To evaluate the applicability of the unit hydrograph method, this study designed 12 sets of simulation tests (Figure 6). The core objectives can be summarized as follows: (1) to verify the applicability of the unit hydrograph under four different soil textures (T1–T4) and in layered soil conditions (T5, T6); (2) to examine the proportionality principle for return flow calculation by varying the infiltration intensity (T7, T2, T8, T9); and (3) to test the superposition principle by implementing multi-period infiltration scenarios (T10–T12). Additionally, the T2 test was specifically used to study the formation mechanism of return flow.

3. Results

3.1. Lag Law of Irrigation Return Flow in the Study Area

3.1.1. Lag Law of Groundwater Level

Figure 7 illustrates the relationship between irrigation water volume and groundwater depth in the Hongbiliang Basin. Irrigation water use is concentrated between April and November. Correspondingly, groundwater levels begin to rise or peak annually from May to December, followed by a decline from January to April. The dynamics of groundwater levels lag behind irrigation water use by approximately one month.
Figure 8 presents the corresponding relationship between irrigation water volume and groundwater depth in the Nanshahe Basin. Similarly, irrigation water use is concentrated from April to November. In this basin, groundwater levels rise or remain elevated from August to March of the following year, then decline from April to July. The observed lag time between irrigation activity and groundwater response is about four months. This longer lag is attributed to the greater average depth of the groundwater table in the Nanshahe Basin, which results in a longer infiltration path for irrigation water to recharge the aquifer and a correspondingly slower recharge rate.

3.1.2. Lag Law of Irrigation Return Flow

Figure 9 illustrates the relationship among irrigation water volume, precipitation, and return flow volume in the Hongbiliang Basin. It is evident that the peak irrigation water volume occurs in June each year, while precipitation peaks in either June or August. The return flow volume exhibits fluctuations, with its peak occurring between July and August. A temporal lag is observed between the peak return flow volume and the peaks of both irrigation water volume and precipitation in the Hongbiliang Basin, indicating a lag phenomenon in return flow.
Figure 10 depicts the relationships between irrigation water volume, precipitation, and return flow volume in the Nanshahe Basin. Similarly, the peak irrigation water volume in the Nanshahe Basin occurs in June each year, while precipitation peaks in either June or August. However, the channel return flow volume fluctuates significantly, with its peak occurring in January each year. A temporal difference is noted between the peak return flow volume and the peaks of irrigation water volume and precipitation in the Nanshahe Basin, suggesting a lag phenomenon in return flow as well.
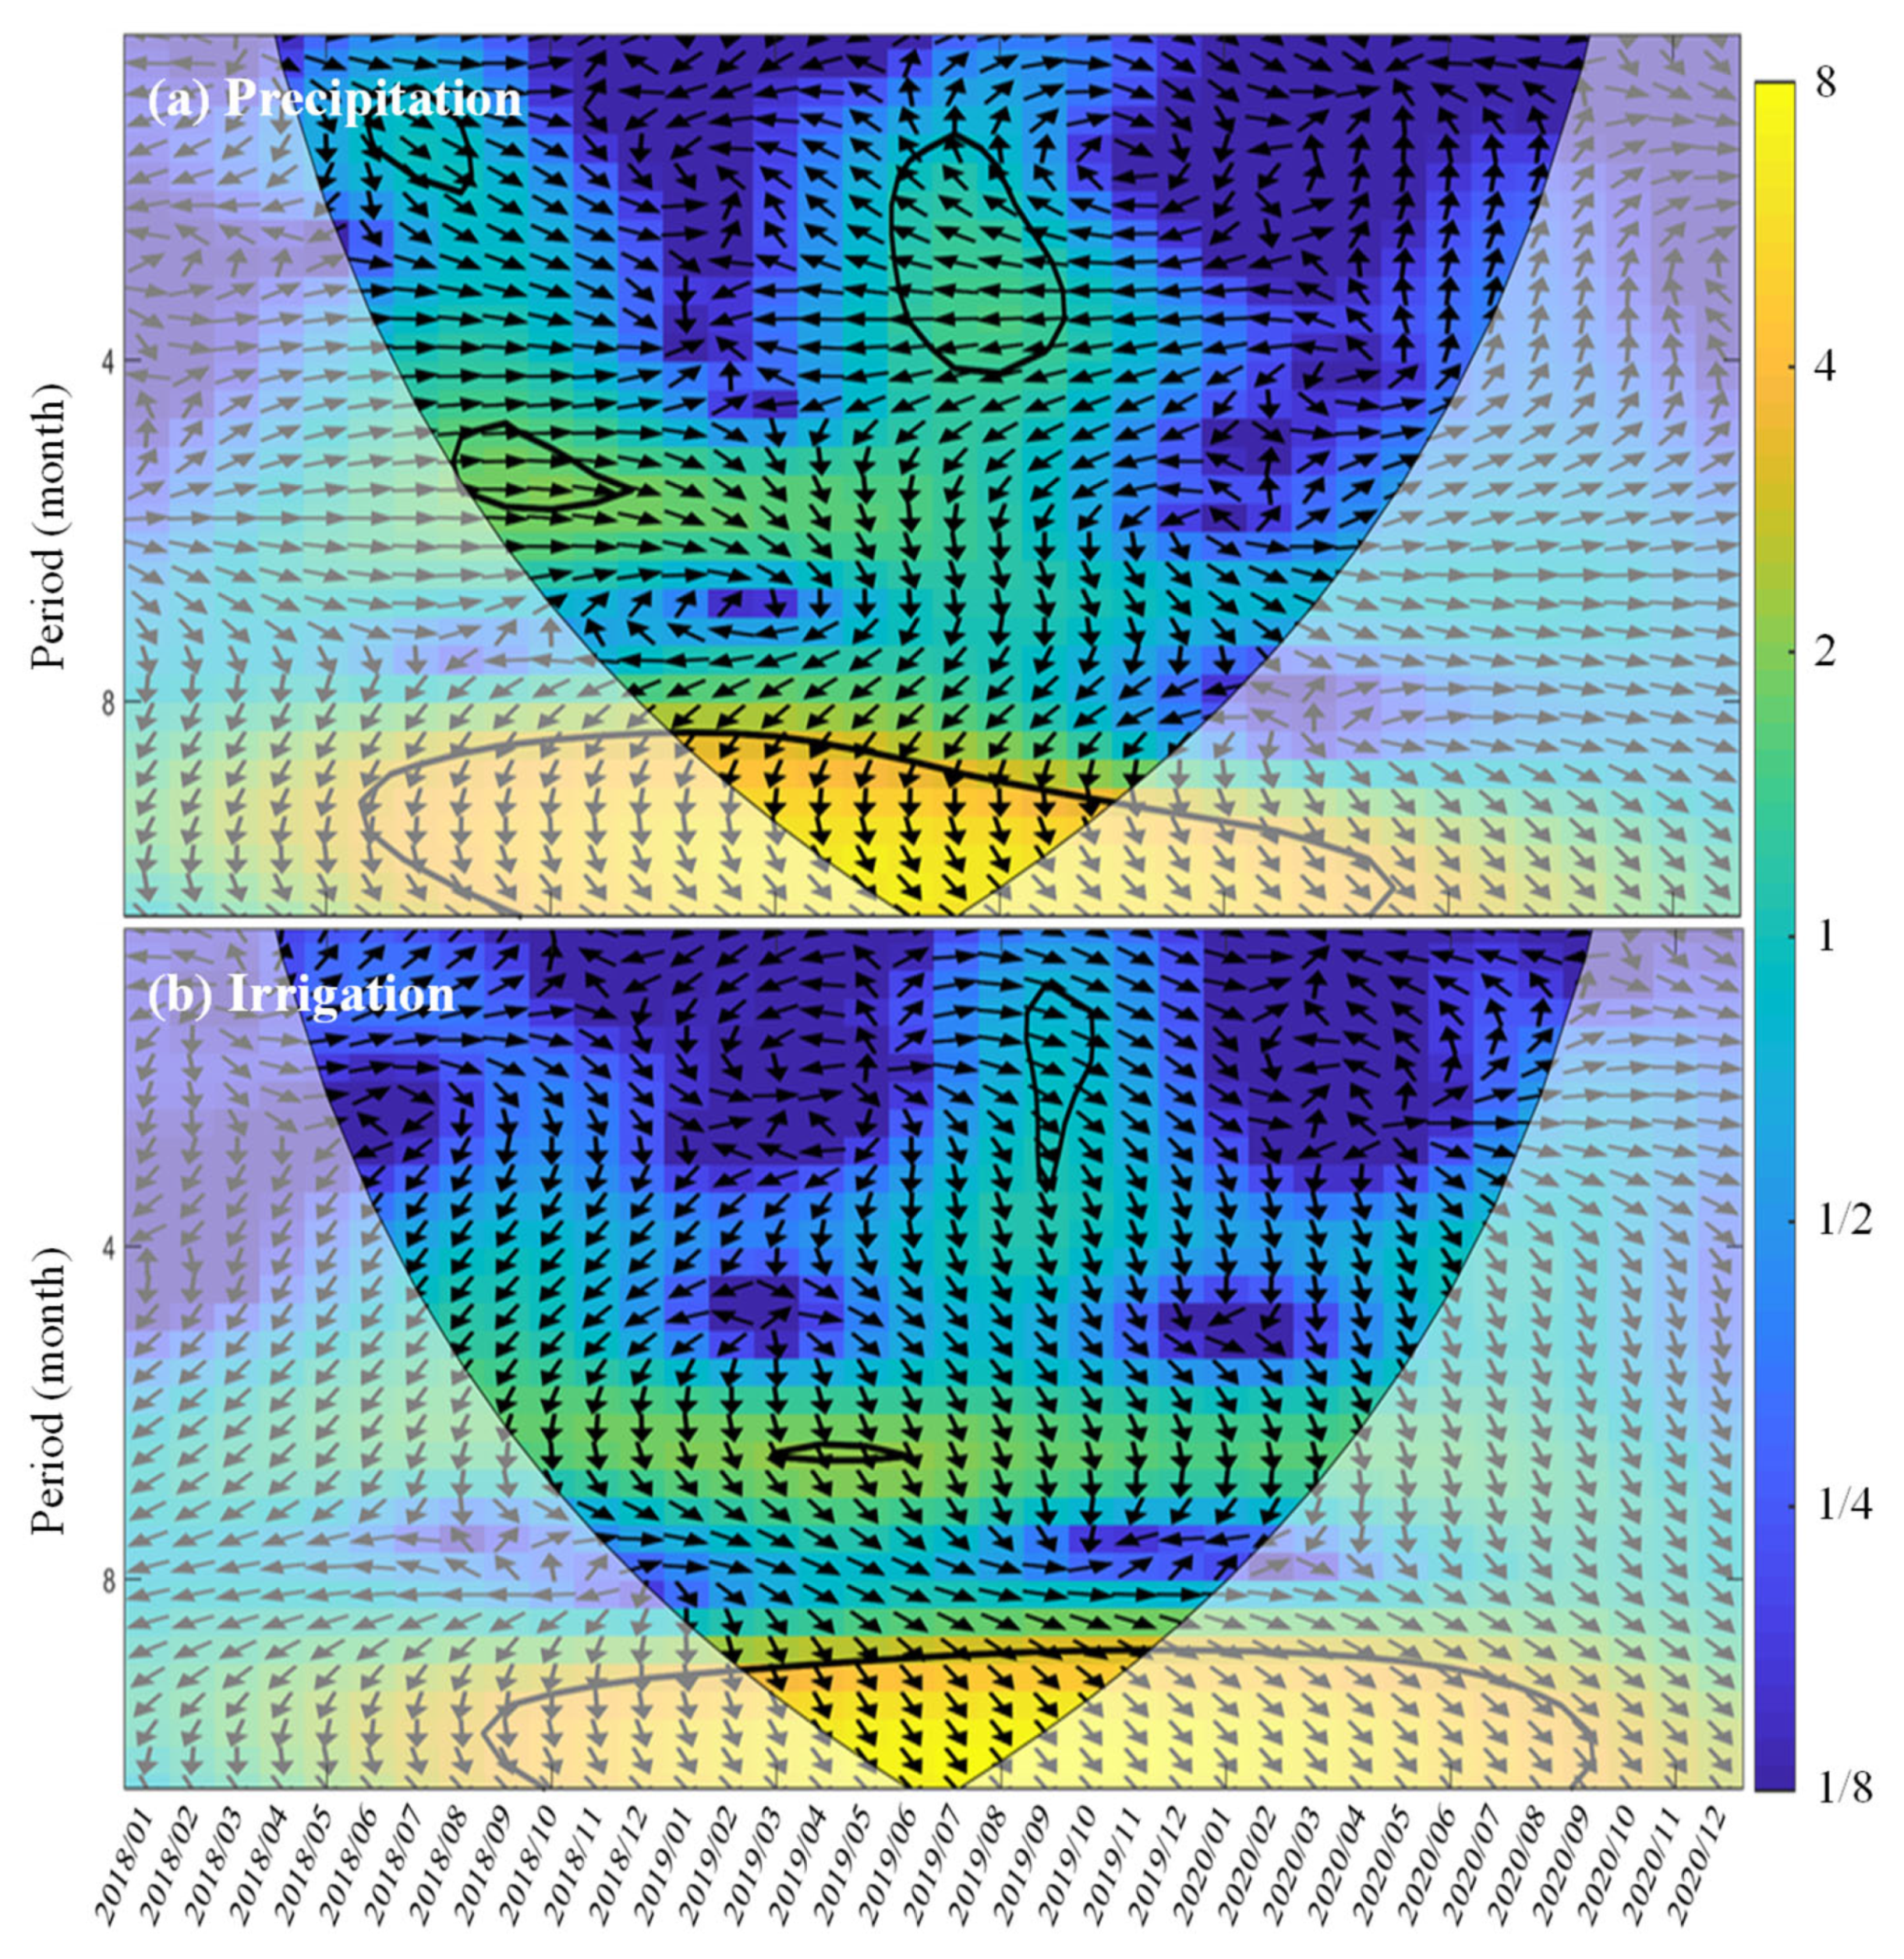
Although both basins exhibit a lag phenomenon in return flow, it is challenging to isolate the return flow lag times attributable to irrigation and precipitation based solely on the peaks of monitoring data, as return flow is influenced by both factors. Consequently, the cross-wavelet method was employed to analyze the lag times of channel return flow resulting from irrigation and precipitation, with the analysis results depicted in Figure 11 and Figure 12.
In these figures, the areas enclosed by black lines represent regions that passed the 95% confidence interval red noise test. The angle of the arrows indicates the relative phase relationship between return flow and either precipitation or irrigation:
  • An angle of 0° (→) signifies that the two are in phase, with no lag relationship.
  • An angle of 90° (↓) indicates a lag relationship of 1/4 cycle between the two.
  • An angle of 180° (←) denotes that the two are in opposite phases, with a lag relationship of 1/2 cycle.
  • An angle of 270° (↑) suggests a lag relationship of 3/4 cycle between the two.
As illustrated in Figure 11a, the return flow and precipitation in the Hongbiliang Basin exhibit four resonance periods: 1–2 months, 5–6 months, 2–4 months, and 9–11 months, respectively. Specifically:
  • For the resonance period of 1–2 months, the phase angle is approximately 45°, indicating that return flow lags behind precipitation by 1/8 of a cycle, with a lag time of about 0.1–0.3 months.
  • For the resonance period of 5–6 months, the phase angle is approximately 0°, showing no significant lag.
  • For the resonance period of 2–4 months, the phase angle is approximately 180°, indicating that return flow lags behind precipitation by 1/2 of a cycle, with a lag time of about 1–2 months.
  • The resonance period of 8.5–11 months exhibits the strongest energy, with a phase angle of approximately 75°, indicating that return flow lags behind precipitation by 5/24 of a cycle, resulting in a lag time of about 1.8–2.3 months.
Figure 11b presents the cross-wavelet power spectrum of irrigation–return flow in the Hongbiliang Basin. It reveals that return flow and irrigation exhibit three resonance periods: 2–3 months, 7 months, and 9–11 months, respectively. Specifically:
  • For the 2–3 month resonance period, the phase angle is approximately 45°, indicating that return flow lags behind irrigation by 1/8 of a cycle, corresponding to a lag time of about 0.3–0.4 months.
  • In the 6.5–7 month resonance period, the phase angle is approximately 75°, suggesting that return flow lags behind precipitation by approximately 1.4–1.5 months.
  • The 9–11 month resonance period exhibits the strongest energy, with a phase angle of about 70°, indicating that return flow lags behind irrigation by 7/36 of a cycle, resulting in a lag time of approximately 1.8–2.1 months.
As illustrated in Figure 12a, the return flow and precipitation in the Nanshahe Basin exhibit two resonance periods: 3–6 months and 9–11 months, respectively. Among these:
  • For the resonance period of 3 to 6 months, the phase angle is approximately 30°, indicating that the return flow lags behind precipitation by one-twelfth of a cycle, corresponding to a lag time of about 0.3 to 0.5 months.
  • The resonance period of 9 to 11 months exhibits the highest energy, with a phase angle of approximately 165°, indicating that the return flow lags behind precipitation by eleven twenty-fourths of a cycle, resulting in a lag time of about 4.1 to 5.0 months.
Figure 12b illustrates the cross-wavelet power spectrum of irrigation return flow in the Nanshahe Basin. It reveals that the return flow and irrigation exhibit three resonance periods, specifically 4–7 months, 6–7 months, and 9–11 months, respectively. Among these:
  • For a resonance period of 4–7 months, the phase angle is approximately 150°, indicating that the return flow lags behind irrigation by 5/12 of a cycle, corresponding to a lag time of about 1.7–2.9 months.
  • For a resonance period of 6–7 months, the phase angle is approximately 145°, signifying that the return flow lags behind precipitation by approximately 2.4–2.8 months.
  • The resonance period of 9–11 months exhibits the strongest energy, with a phase angle of about 160°, indicating that the return flow lags behind irrigation by 4/9 of a cycle, resulting in a lag time of approximately 4–4.9 months.
The lag times of return flow in relation to precipitation and irrigation, as determined through cross-wavelet analysis, are presented in Table 2. Notable differences in return flow lag times between the two basins are evident.
  • For the Hongbiliang Basin, the lag times of return flow relative to precipitation and irrigation range from 0 to 2.3 months, with lag times in the high-energy intervals consistently around 2 months.
  • In the Nanshahe Basin, the lag times of return flow in relation to precipitation and irrigation vary from 0 to 5 months, with lag times in the high-energy intervals generally between 4 and 5 months.

3.1.3. Calibration of Unit Hydrograph Parameters for Irrigation Return Flow

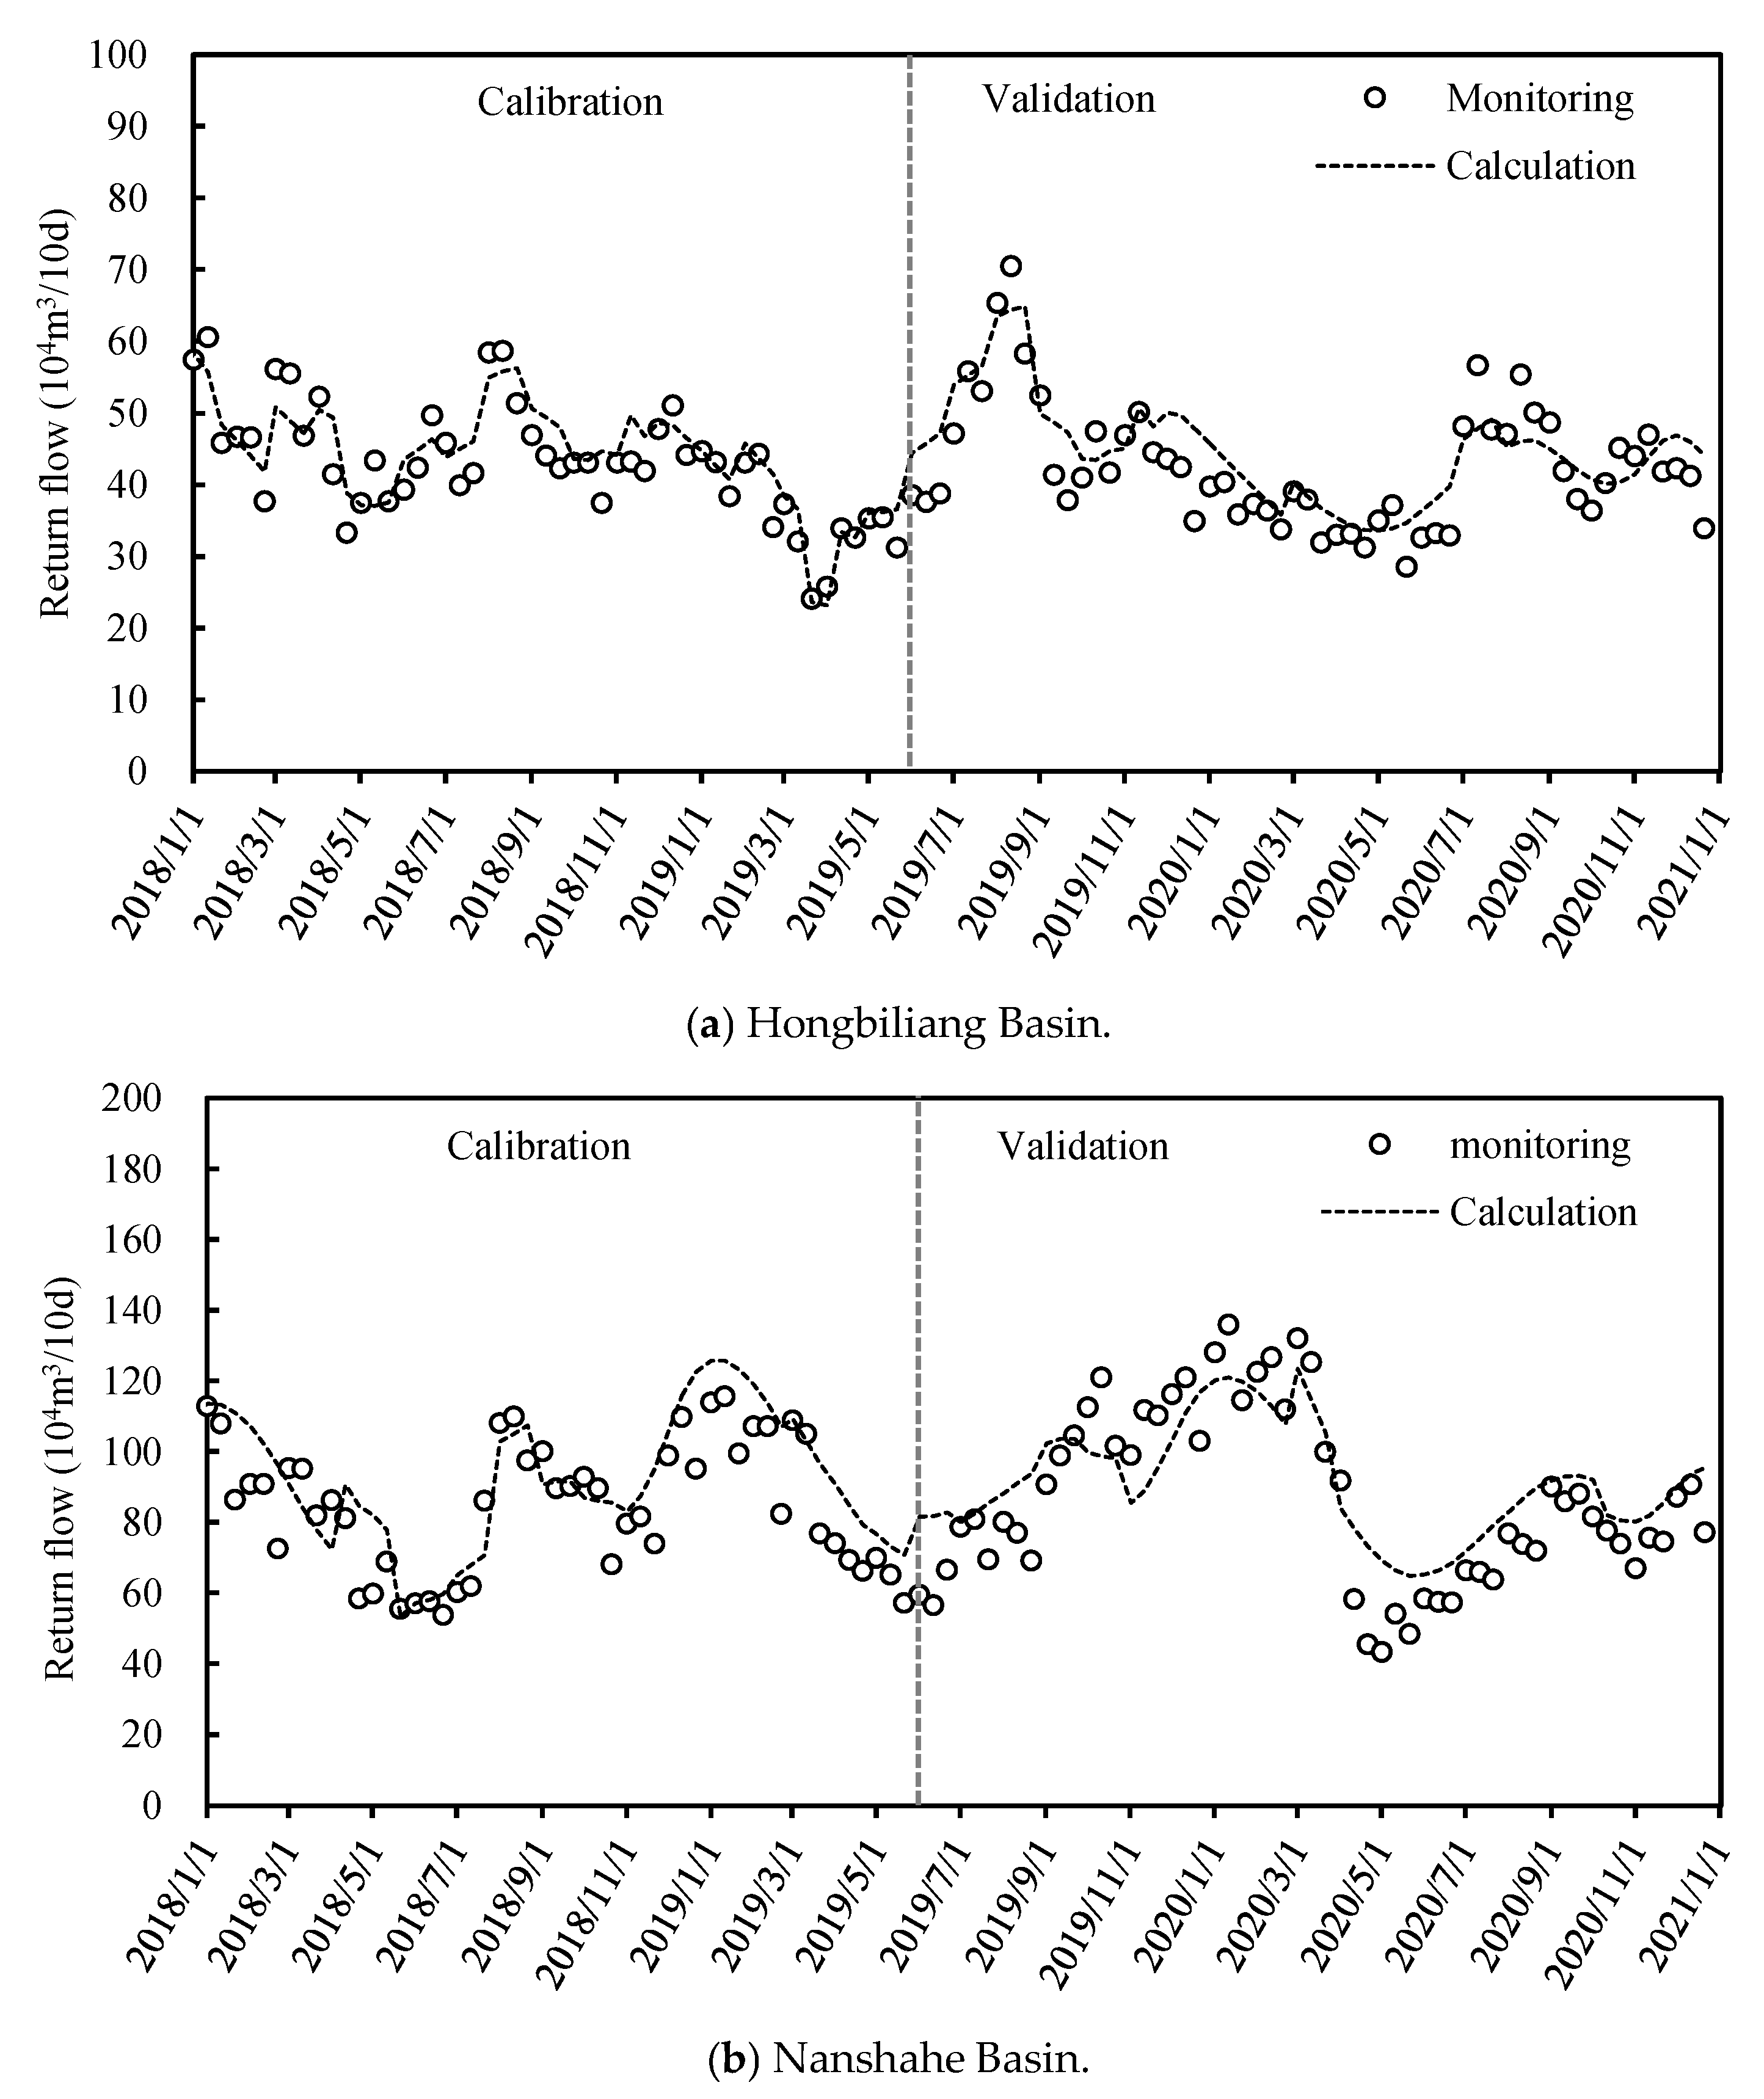
This study utilized monitoring data of irrigation return flow to calibrate the unit hydrograph parameters for the two basins. The parameter calibration period was set from January 2018 to June 2019, and the validation period spanned from July 2019 to December 2020. Based on monitoring frequency and accuracy, ten-day-scale data were used for the calibration and validation of the unit hydrograph parameters.
The selected calibration period (January 2018–June 2019) fully covers one and a half hydrological years, including the typical irrigation season (April–November) and non-irrigation season (December–March of the following year) in the study area. This period comprehensively captures the complete lag process of irrigation return flow—from its generation (via irrigation/precipitation infiltration), through migration (as subsurface runoff), to its final discharge into drainage channels. The calibration period incorporates both wet phases, characterized by concentrated irrigation and precipitation, and dry phases dominated by water consumption, thereby ensuring that the model can simultaneously calibrate the lag parameters of return flow under conditions of both rapid response and slow recession.
Table 3 presents the calibration results of the unit hydrograph parameters for the Hongbiliang Basin and the Nanshahe Basin, while Figure 13 illustrates the fitting results of the ten-day-scale channel return flow volume during the calibration and validation periods.
It can be observed that:
  • For the Hongbiliang Basin, the variation trends of the predicted and monitored return flow volumes are consistent. The coefficient of determination (R2) for both the calibration and validation periods exceeds 0.72, while the mean relative error (MRE) during these periods is below 9.2%, indicating a strong fitting performance.
  • For the Nanshahe Basin, the variation trends of the predicted and monitored return flow volumes are similarly consistent. The coefficient of determination (R2) for both the calibration and validation periods exceeds 0.74, and the mean relative error (MRE) during these periods is below 11.6%, also indicating a strong fitting performance.
These results demonstrate that the unit hydrograph can accurately predict the ten-day-scale return flow volume in the study area.
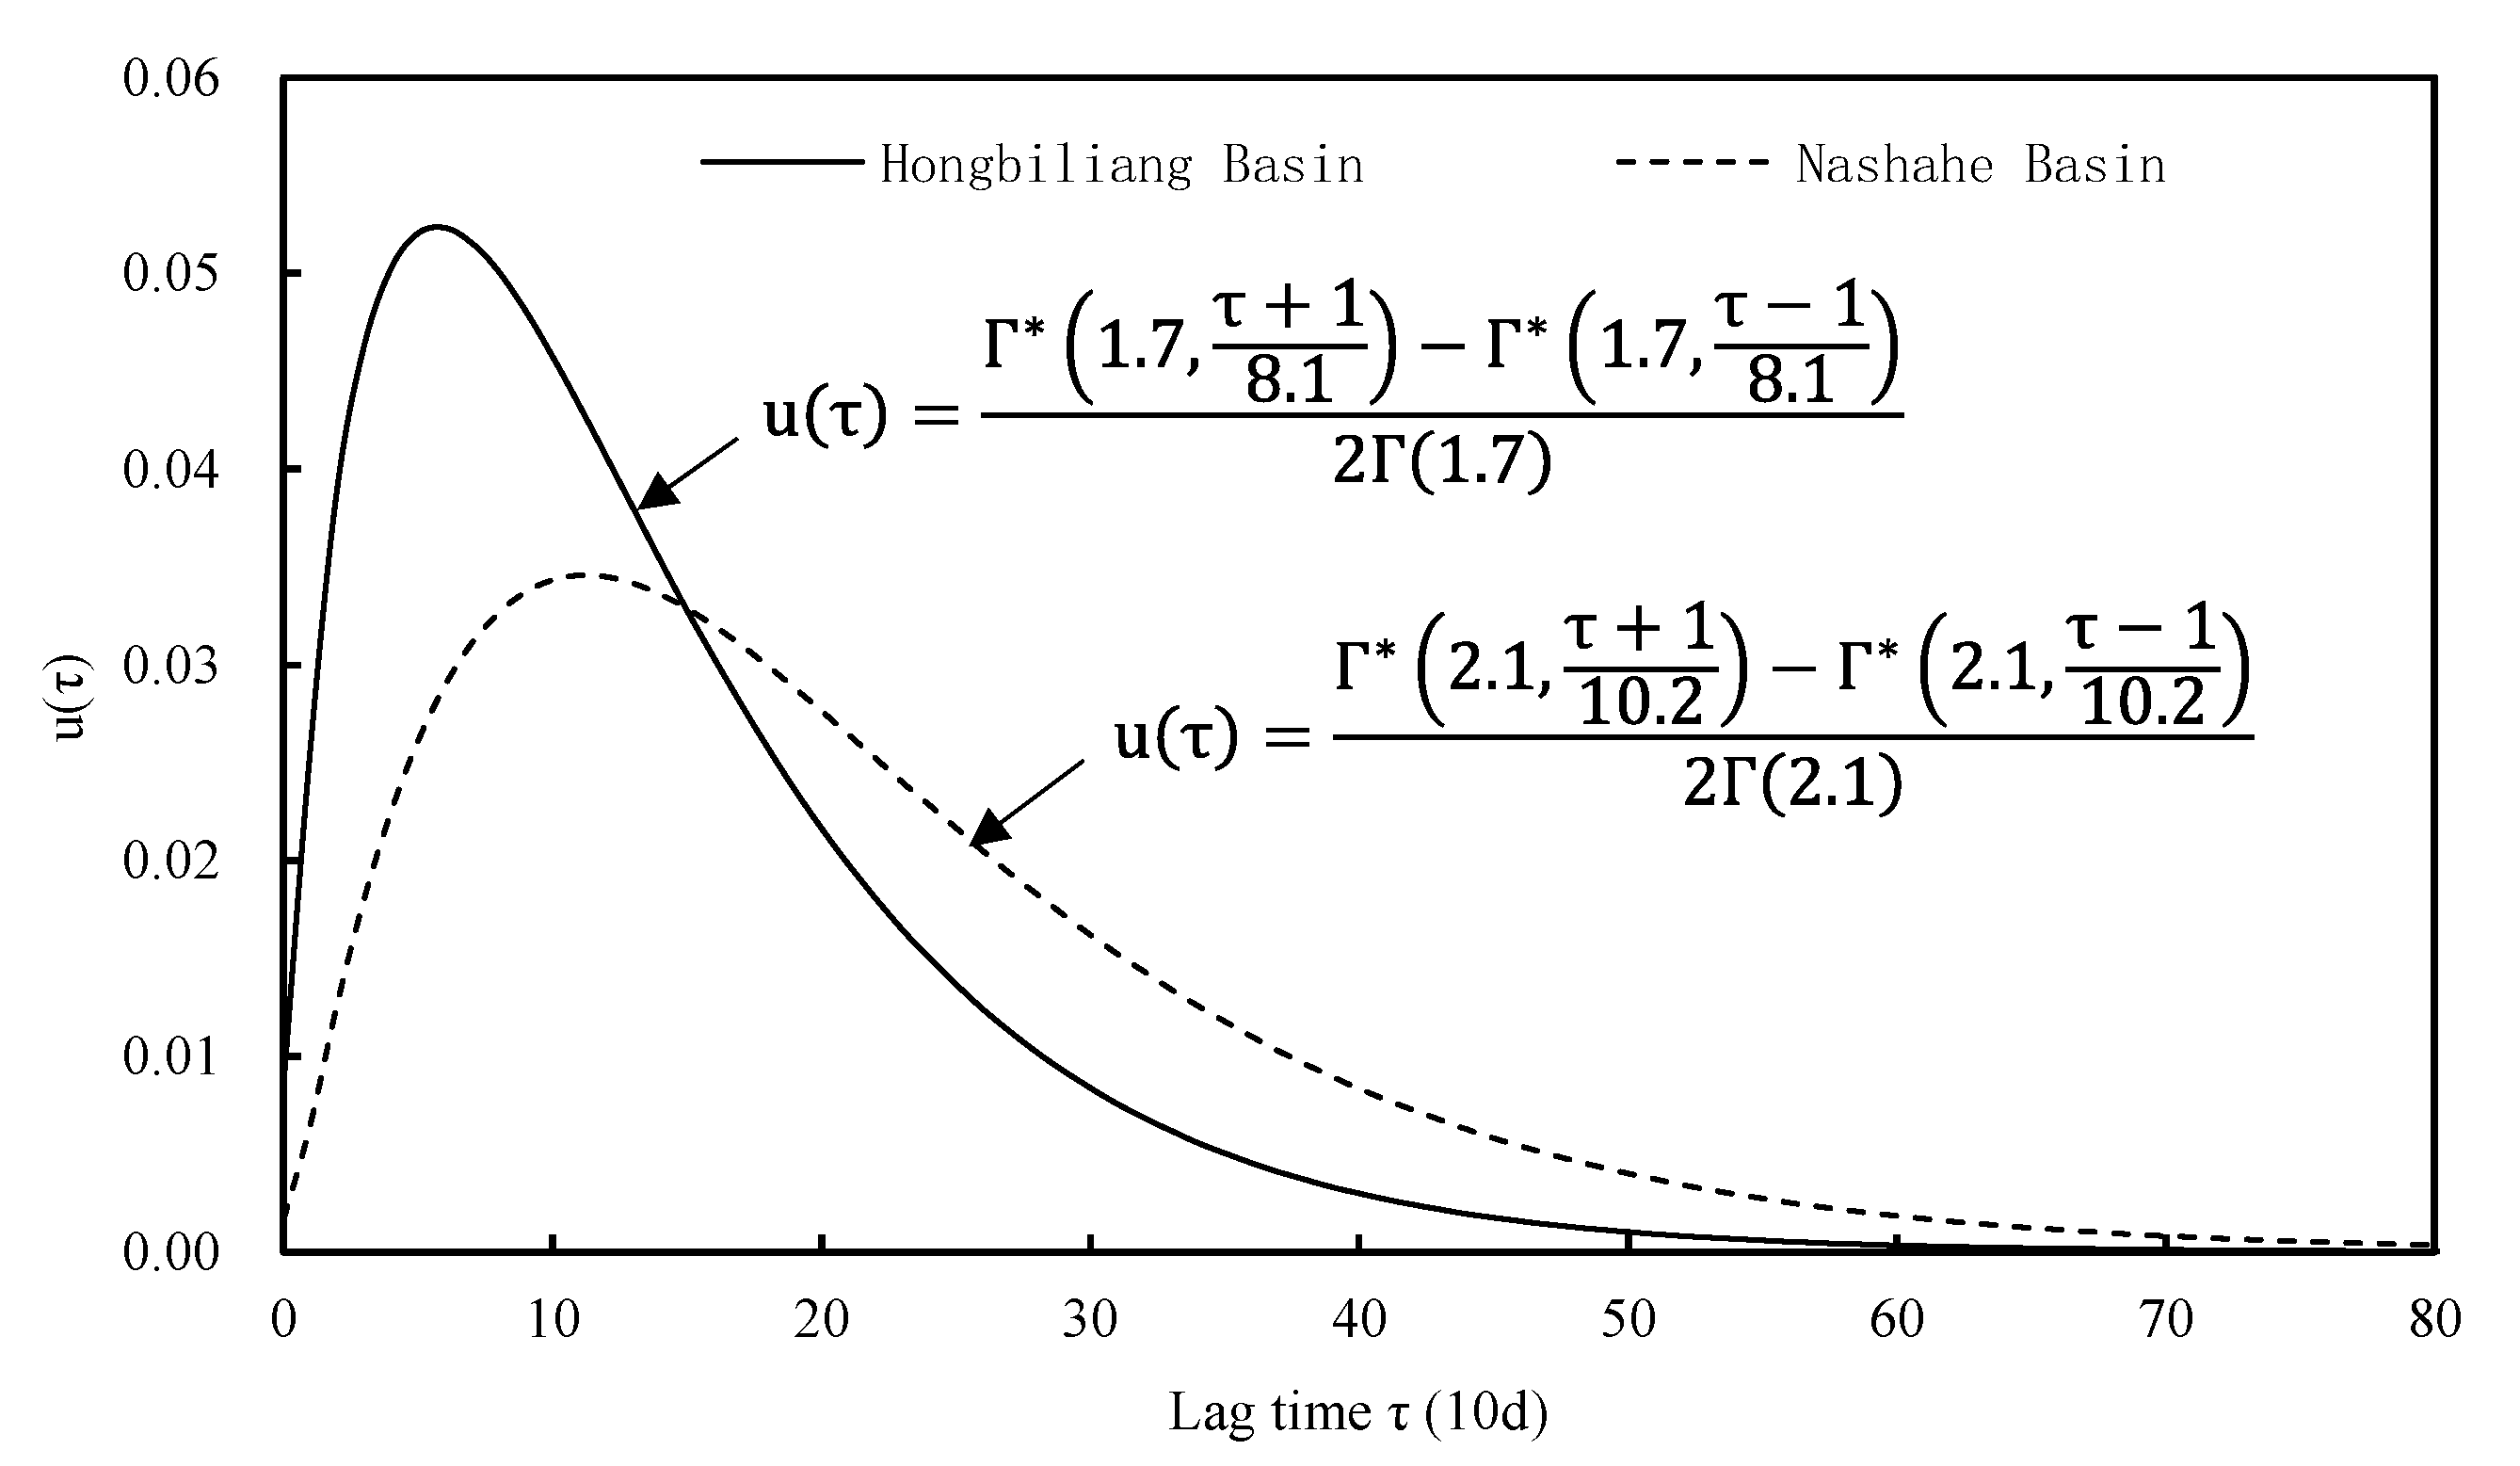
Figure 14 illustrates the unit hydrographs of the two basins. Due to differences in soil properties between the Hongbiliang Basin and the Nanshahe Basin, the shapes of their unit hydrographs differ.
  • The unit hydrograph of the Hongbiliang Basin exhibits a “slender and tall” shape, demonstrating an increasing trend from 0 to 60 days (0 to 6 ten-day periods), followed by a gradual decrease after 60 days (6 ten-day periods).
  • In contrast, the unit hydrograph of the Nanshahe Basin displays a “short and broad” shape, showing a gradual increase from 0 to 110 days (0 to 11 ten-day periods), and subsequently decreasing after 110 days (11 ten-day periods).
The unit hydrograph of the Hongbiliang Basin reaches a peak value of 0.052 at a lag time of 60 days (equivalent to 6 ten-day periods), indicating that 5.2% of the percolated water contributes to return flow during the 60th to 70th days. In contrast, the unit hydrograph of the Nanshahe Basin peaks at a value of 0.035 with a lag time of 110 days (equivalent to 11 ten-day periods), suggesting that 3.5% of the percolated water forms return flow during the 110th to 120th days.
The lag time corresponding to the peak of the Hongbiliang Basin’s unit hydrograph is 60 days, which aligns with the results of the cross-wavelet analysis (high-energy interval: 1.8 to 2.1 months). Similarly, the lag time for the peak of the Nanshahe Basin’s unit hydrograph is 110 days, which is closely related to the cross-wavelet analysis results (high-energy interval: 4.0 to 4.9 months). These consistencies suggest that the parameters of the unit hydrograph, fitted using measured return flow data, are relatively reliable.

3.2. Analysis of Influencing Factors on Unit Hydrograph Parameters Based on Hydrus

3.2.1. Hydrodynamic Process of Irrigation Return Flow

  • Hydrodynamic Analysis
Taking the sandy loam simulation test (T2) as an example, the hydrodynamic characteristics of the return flow were analyzed. According to the simulation results, the return flow volume reached its maximum approximately on the 10th day after infiltration. The distribution of total pressure head and flow direction at this moment is illustrated in Figure 15.
The total head ranged from 4.3 to 5.5 m. In the unsaturated zone above the groundwater table, the total head exhibited a strip-like distribution along the horizontal direction, decreasing gradually from top to bottom. Conversely, in the saturated zone below the groundwater table, the total head displayed a ring-like distribution, with the lowest head observed at the edge of the channel. The flow direction indicates that in the unsaturated zone above the groundwater table, soil water infiltrated vertically; upon reaching the groundwater table, the flow direction gradually shifted to the horizontal.
Figure 16 depicts the variation in total head in Section 1 (unsaturated zone) and Section 2 (saturated zone). From the total head distribution in Section 1, it can be noted that at different times, the total head decreased progressively with increasing depth. Based on the slope of the curve, the hydraulic gradient in the unsaturated zone diminished gradually over time. This is attributed to field infiltration, which increased soil water content and reduced soil suction, thereby decreasing the hydraulic gradient.
Based on the total head distribution presented in Section 2, it is evident that, over time, the total head gradually increased with the horizontal distance. An analysis of the curve slope indicates that the hydraulic gradient in the saturated zone initially increased and then decreased, reaching its maximum value around the 10th day. This phenomenon can be attributed to field infiltration, which recharged the groundwater and led to a rise in the groundwater level. Subsequently, groundwater was discharged through the channel, resulting in a gradual decrease in the water level. Consequently, the hydraulic gradient exhibited a trend of first increasing and then decreasing.
Overall, the difference in flow direction between the unsaturated and saturated zones remained relatively minor throughout the entire period. Soil water in the unsaturated zone infiltrated vertically downward, while groundwater in the saturated zone primarily flowed horizontally, with only slight local variations.
2.
Analysis of Water Velocity
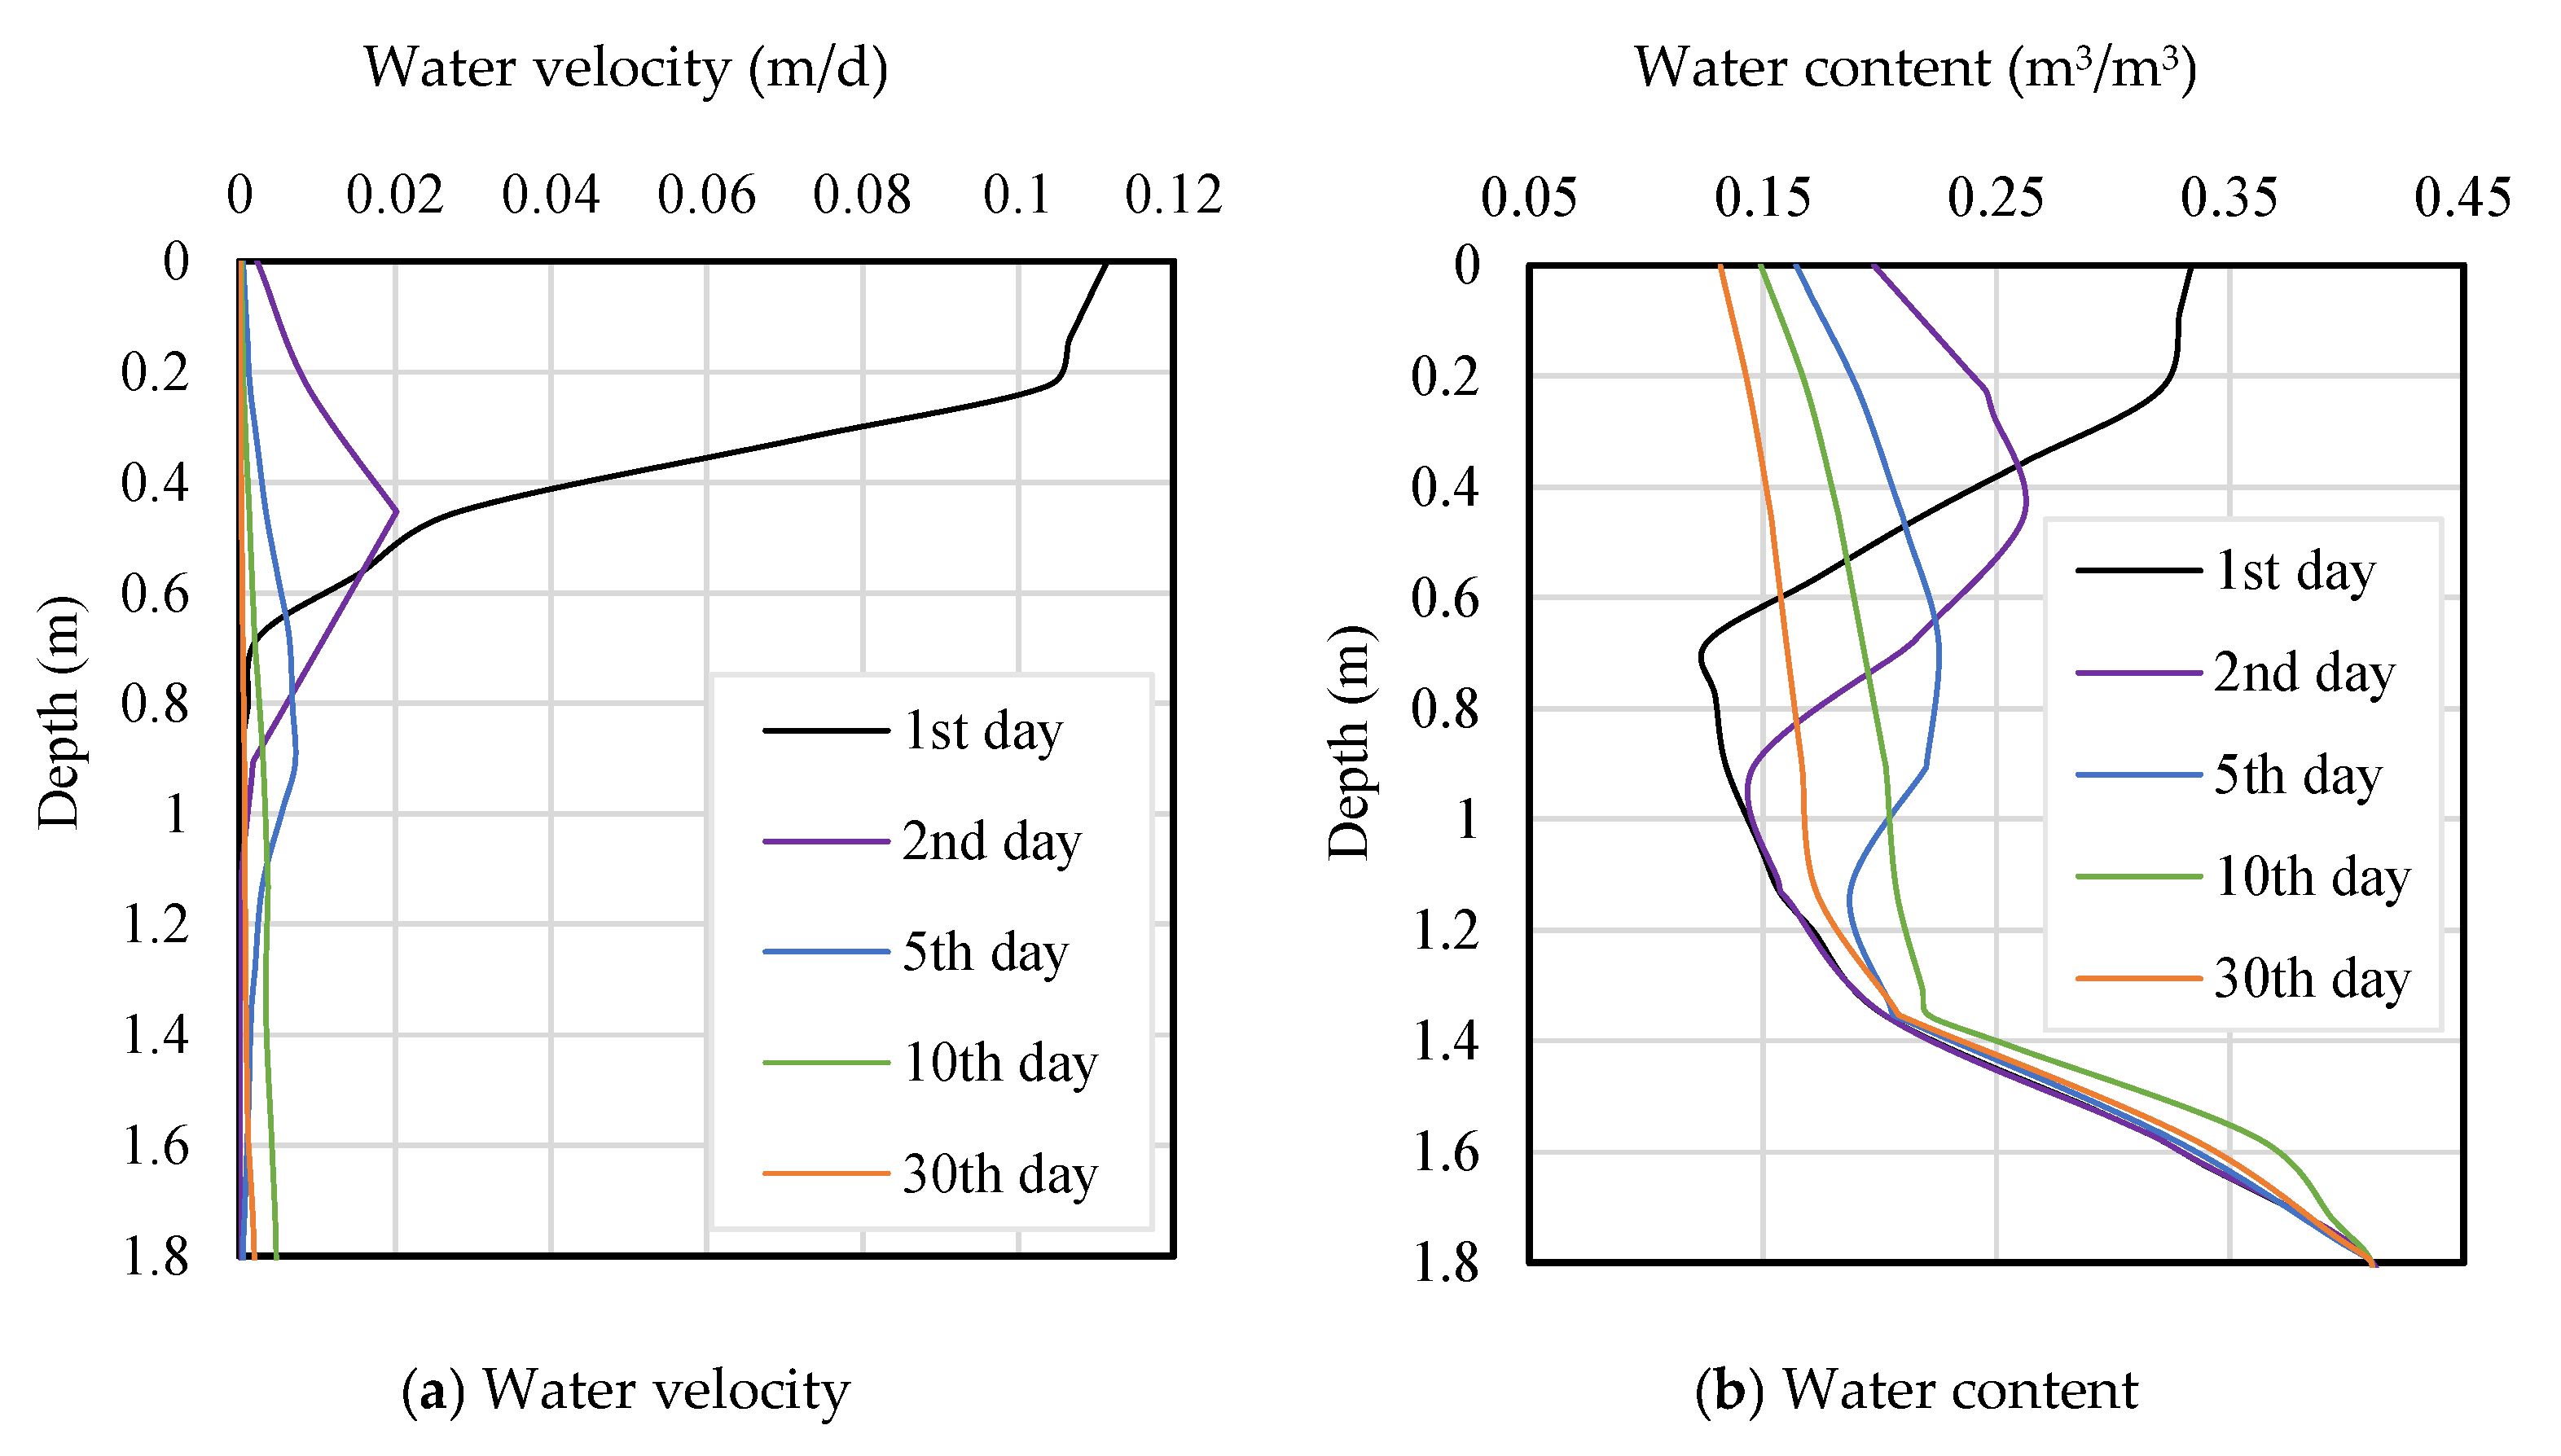
Figure 17 illustrates the variation in soil water movement rate and water content in the unsaturated zone of Section 1. By the end of the first day of infiltration, the wetting front had reached a depth of 0.7 m, with the peak soil water content in the wetted zone measuring 0.33. At this point, the soil water content in the wetted zone was relatively high, resulting in increased soil hydraulic conductivity and water movement rate, with the maximum water movement rate in the wetted zone reaching 0.11 m/d. As the soil in the lower layer of the wetted zone was comparatively drier, soil water moved downward under the combined influence of gravity and suction. By the end of the second day, the wetting front had advanced to a depth of 0.9 m, and the peak water content at a depth of 0.45 m had decreased to 0.26. During this stage, the thickness of the wetted zone increased while the average water content decreased, leading to a corresponding reduction in hydraulic conductivity and infiltration rate; the maximum water movement rate at a depth of 0.45 m was 0.02 m/d. As the wetting front continued to migrate downward, the peak water movement rate decreased to 0.007 m/d by the end of the fifth day. By the end of the tenth day, the wetted zone had connected with the capillary rise in the groundwater table, resulting in a gradual reduction in the water content gradient. At this stage, the soil hydraulic conductivity stabilized, leading to minimal vertical variation in the water movement rate, with a maximum value of approximately 0.005 m/d. By the end of the thirtieth day, the soil water content had decreased slightly, and the maximum water movement rate was around 0.002 m/d.
Figure 18 illustrates the variation in groundwater flow velocity within the saturated zone of Section 2.
  • Horizontal Distribution of Flow Velocity: The groundwater flow velocity exhibits significant variation along the horizontal direction; specifically, it increases as one approaches the channel. This phenomenon occurs because, under a constant flow rate, a smaller cross-sectional area results in a higher flow velocity. The wetted perimeter of the channel is considerably smaller than the width of the flow cross-section within the saturated zone, which contributes to the elevated groundwater flow velocity near the channel.
  • Temporal Variation in Flow Velocity: Between Day 1 and Day 10, the flow velocity in Section 2 steadily increased. This increase is attributed to the recharge of groundwater by soil water, which causes a gradual rise in the groundwater level. On the side adjacent to the channel, groundwater drainage is unobstructed, leading to a lower groundwater level; conversely, on the side further from the channel, the water level is higher. As the groundwater level continues to rise, the horizontal hydraulic gradient also increases, resulting in an associated rise in flow velocity. From Day 10 to Day 30, the volume of groundwater recharge diminishes, resulting in a gradual decline in the water level and a corresponding decrease in the horizontal hydraulic gradient—thus, the groundwater flow velocity decreases accordingly.
Figure 19 illustrates the distribution of soil water movement rates at different time intervals. At the end of Day 1, the high-velocity zone was predominantly located in the unsaturated zone, specifically within a depth of 0–0.7 m. By the end of Day 5, with continuous infiltration, the wetted zone had descended, leading to an increase in water content in the lower soil layer and a corresponding rise in hydraulic conductivity. Consequently, the high-velocity zone became concentrated in the unsaturated zone, extending to a depth of 0–1 m. Simultaneously, as the amount of groundwater recharge increased, channel drainage also rose, causing the high-velocity zone adjacent to the channel to expand and connect with the high-velocity zone in the unsaturated (vadose) zone. At the end of Day 10, as soil water fully recharged the groundwater, the water content in the unsaturated zone decreased, resulting in a reduced soil water movement rate and the transformation of the unsaturated zone into a low-velocity zone. During this period, groundwater experienced significant recharge, leading to a rise in the water level (water table mounding) and a peak in channel drainage volume, which corresponded to the highest groundwater flow velocity. The high-velocity zone was situated near the channel, with flow velocity decreasing outward in a concentric pattern. By the end of Day 30, with ongoing drainage, the groundwater level gradually declined, leading to a decrease in flow velocity within the saturated zone and a gradual contraction of the high-velocity zone near the channel, reducing its extent to approximately 0.7 m around the channel.
In summary, the entire formation process of return flow comprises three distinct stages: soil water infiltration, groundwater recharge, and channel drainage, each characterized by different hydraulic properties:
  • Soil Water Infiltration Stage: Water primarily moves vertically downward, with the rate of movement gradually decreasing.
  • Groundwater Recharge Stage: In the unsaturated zone (vadose zone), the rate of water movement decreases gradually, while groundwater flow velocity in the saturated zone increases. The groundwater recharge rate initially rises before subsequently declining.
  • Channel Drainage Stage: Groundwater flow predominantly occurs in a horizontal direction. Both the groundwater flow velocity and the channel drainage rate exhibit a trend of first increasing and then decreasing.

3.2.2. Influence of Soil Properties on the Unit Hydrograph

  • Influence of Soil Texture on the Unit Hydrograph
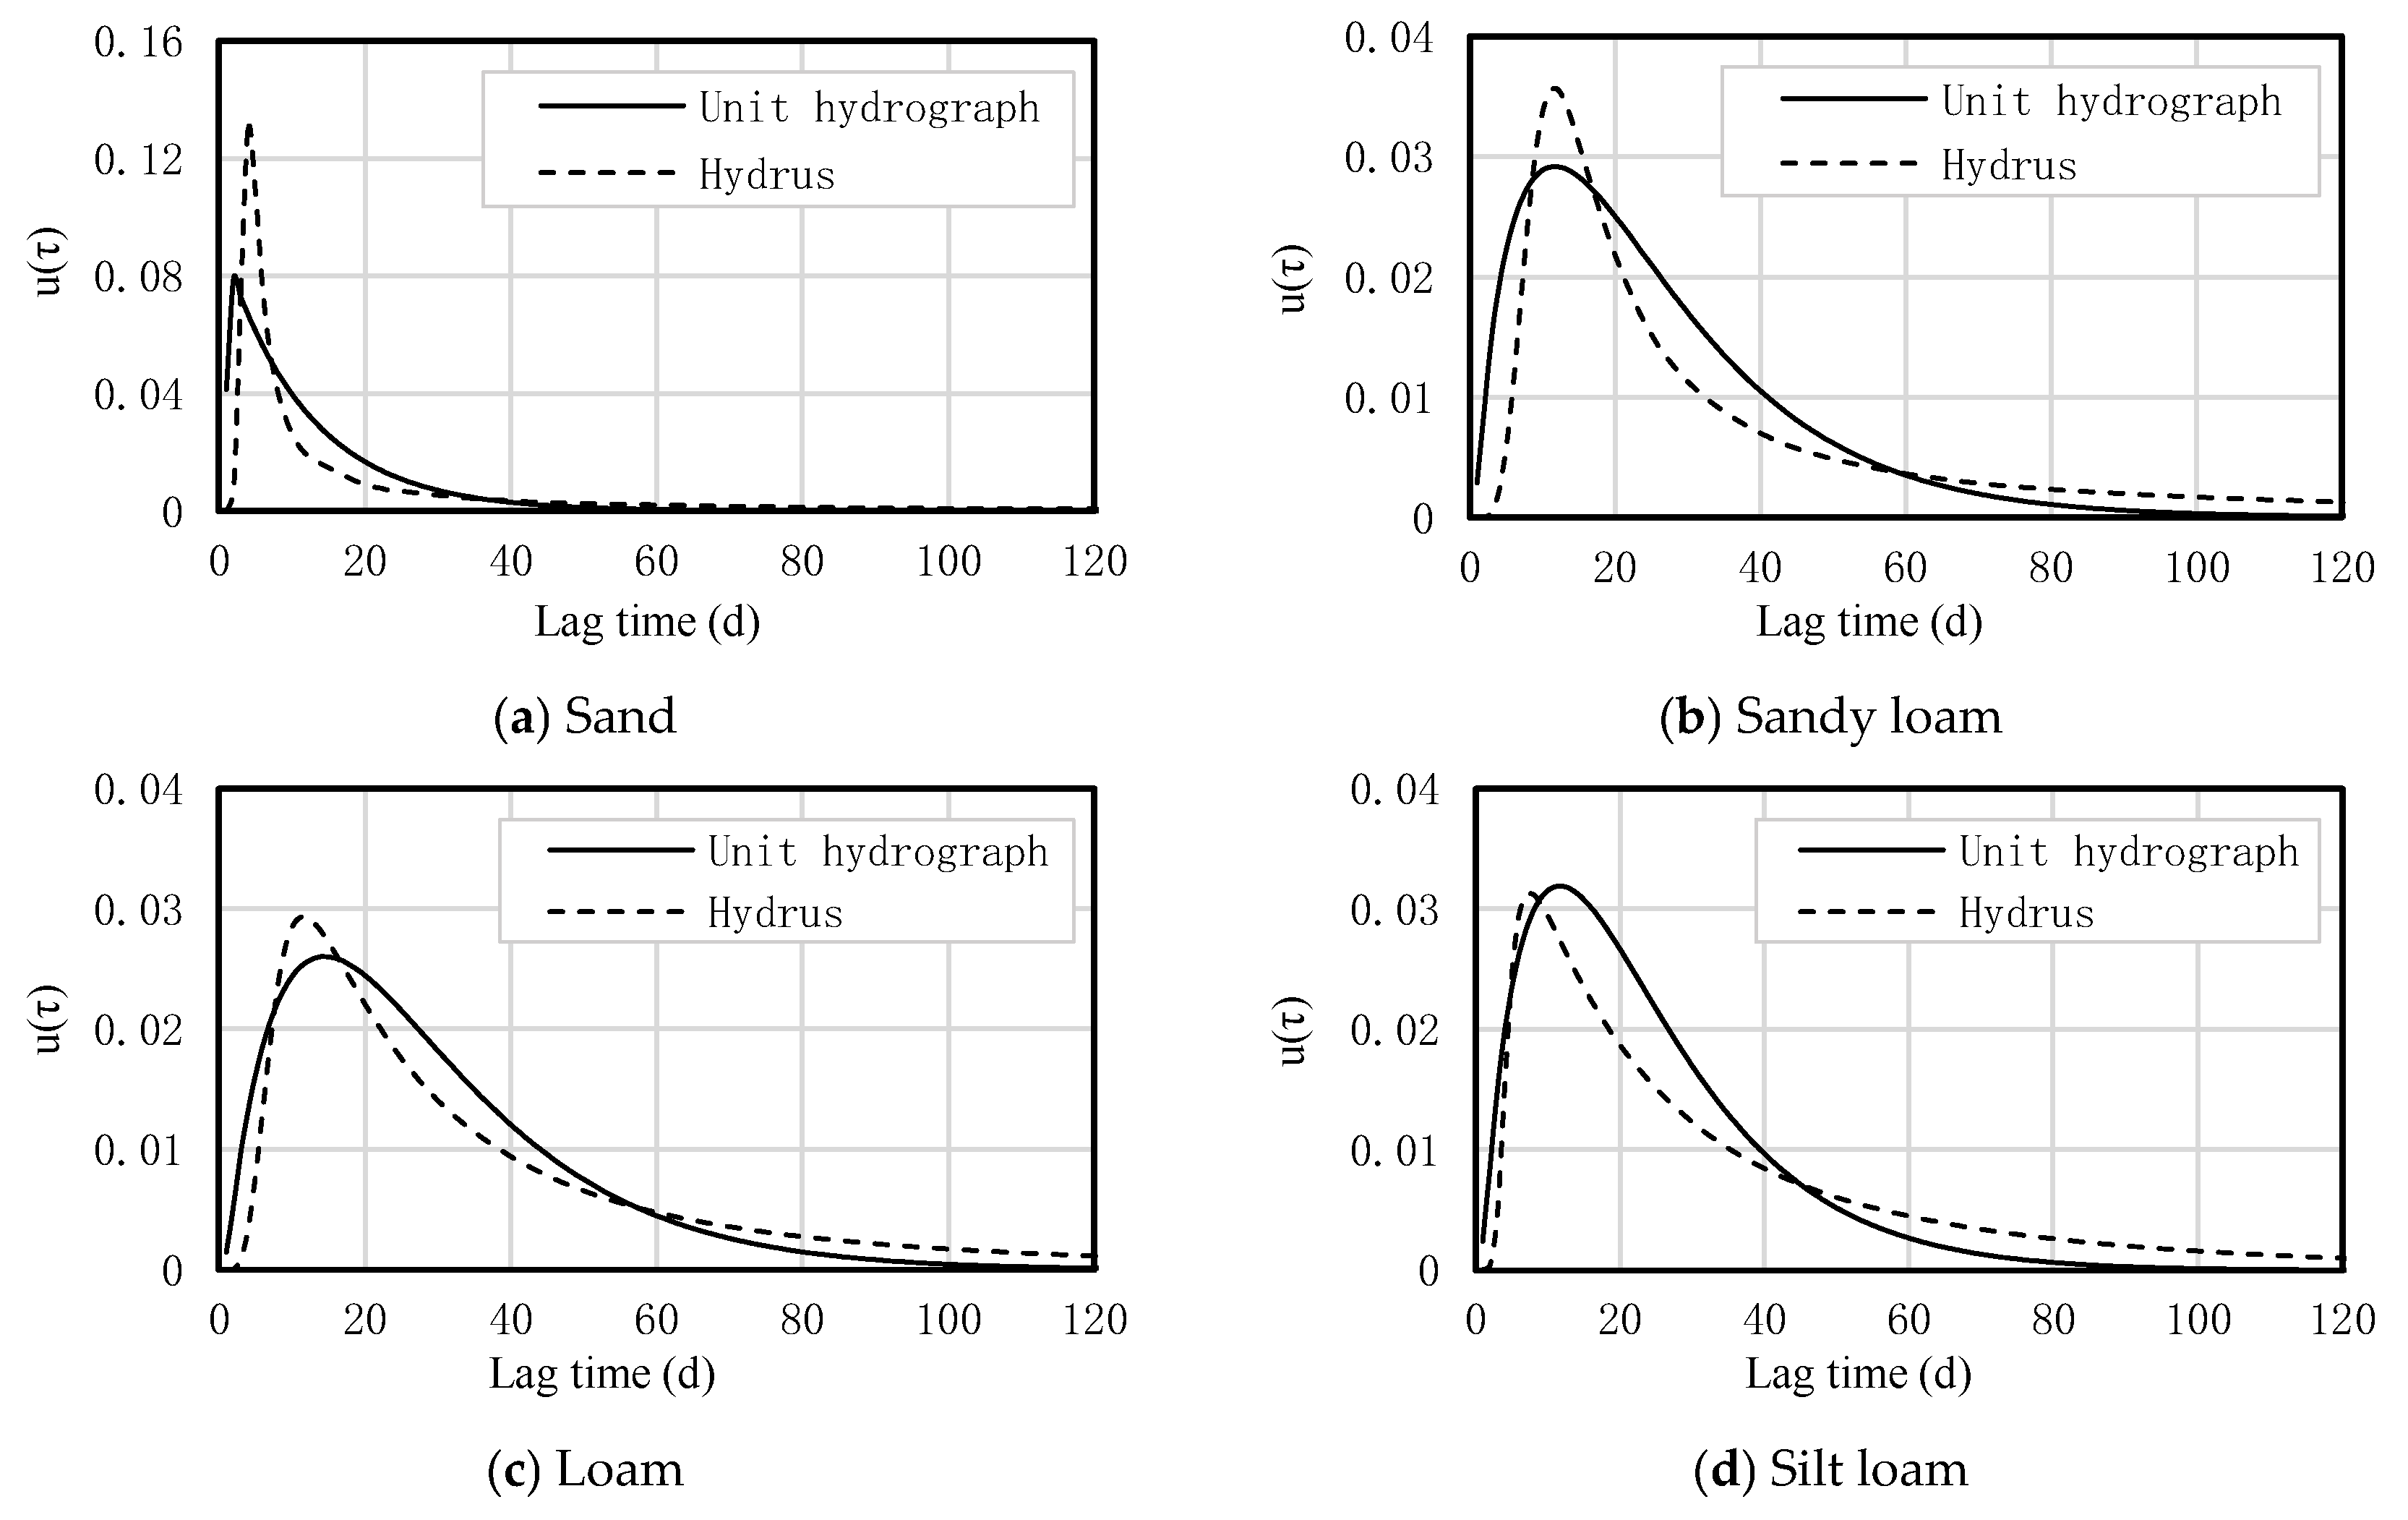
Table 4 presents the fitting results of unit hydrograph parameters for different soil textures at these scales. The fitting accuracy of the unit hydrograph for silt loam, loam, and sandy loam is superior to that for sand. This indicates that the unit hydrograph is more effective in simulating fine-grained soils.
Figure 20 and Figure 21 illustrate the unit hydrograph fitting diagrams for different soil textures at the daily and ten-day scales, respectively. It is evident that the unit hydrograph for sand exhibits a steep shape and a high peak value, with return flow developing rapidly. This rapid formation is attributed to the coarse particle size and high permeability of sand, which facilitates the quick drainage of soil water back to the channel. In contrast, the unit hydrographs for silt loam, loam, and sandy loam display a gentler shape, resulting in slower return flow formation. This is due to the finer particle sizes and lower permeability of these soil types, which prolong the retention time of soil water and delay return flow.
Since the unit hydrograph at the ten-day scale demonstrates a better fit with the simulation results, subsequent Hydrus return flow simulations will focus on exploring the unit hydrograph at the ten-day scale.
2.
Influence of Soil Heterogeneity on the Unit Hydrograph
Table 5 presents the fitting results for unit hydrograph parameters of heterogeneous soils. The coefficient of determination (R2) and the residual sum of squares (RSS) indicate that the unit hydrograph demonstrates a strong fit for both horizontally and vertically layered soils, suggesting its good applicability to heterogeneous soils.
Figure 22 displays the unit hydrographs for the two types of heterogeneous soils. It is evident that the unit hydrograph for horizontally layered soils aligns more closely with the simulation results. The primary reasons for this are as follows: during the formation of return flow, water in the unsaturated zone predominantly moves vertically, whereas water in the saturated zone mainly flows horizontally. Model calculations reveal that the proportion of water entering the channel as saturated flow (constant head boundary) constitutes a significantly larger share of the total return flow compared to unsaturated flow (free seepage boundary). Consequently, horizontal flow plays a crucial role in influencing the unit hydrograph during the formation of return flow. As a result, horizontally layered soils exert a lesser impact on the return flow formation process compared to vertically layered soils, leading to a stronger applicability of the unit hydrograph to horizontally layered soils.
In summary, the unit hydrograph demonstrates strong applicability to heterogeneous soils.

3.2.3. Applicability Analysis of Proportionality and Superposition Principles

  • Applicability Analysis of the Proportionality Principle
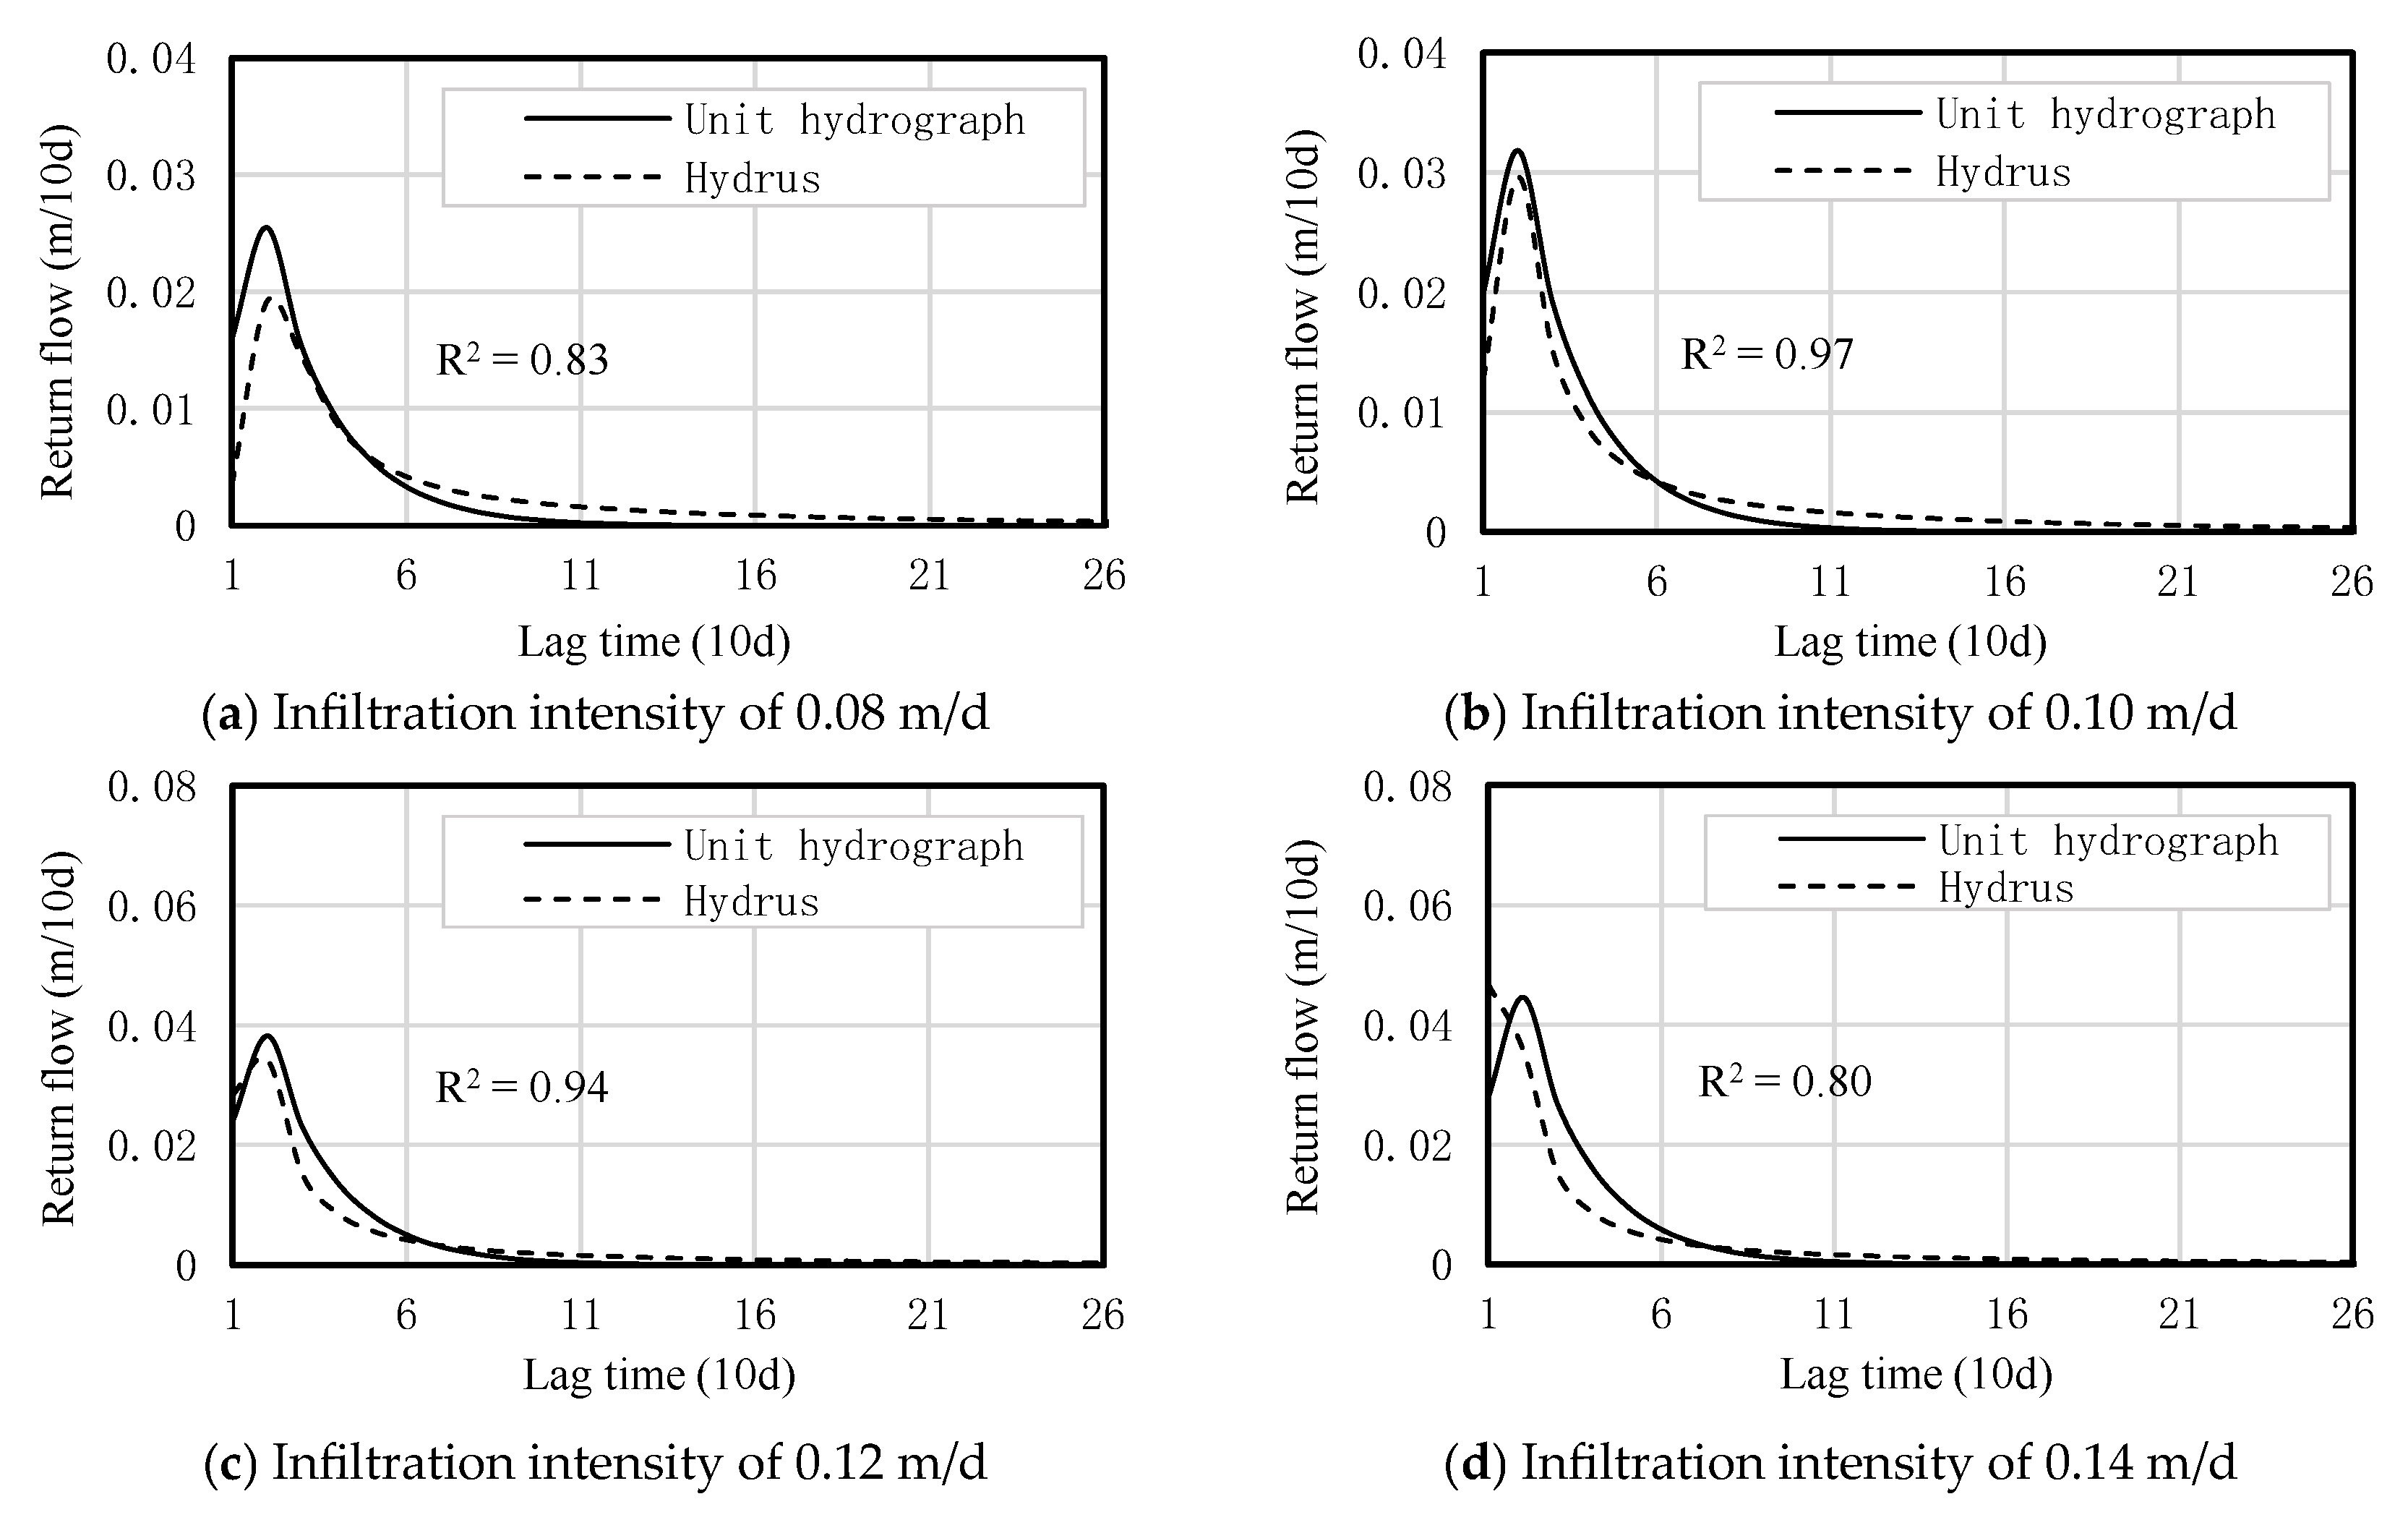
Based on the unit hydrograph of sandy loam, the proportionality principle was employed to calculate the return flow volume under varying infiltration intensities, with the calculation results presented in Figure 23. For different infiltration intensities, the coefficient of determination (R2) between the unit hydrograph model results and the Hydrus simulation results exceeds 0.8, indicating a relatively good fit. This suggests that the return flow volume generally adheres to the proportionality principle within a specific range, thus rendering the proportionality assumption in the unit hydrograph model reasonably valid. The fit is optimal when the infiltration intensity is 0.1 m/d, as the unit hydrograph is calibrated based on this intensity. In this case, the errors in return flow formation calculations stem solely from numerical simulation deviations, rather than from inaccuracies associated with the proportionality principle. The fitting results for infiltration intensities of 0.08 m/d and 0.12 m/d are superior to those at 0.14 m/d. This indicates that as the difference from the infiltration intensity used for unit hydrograph fitting increases, the errors arising from the proportionality principle in calculating the return flow volume also become larger. Therefore, it can be concluded that when determining the unit hydrograph parameters, a representative return flow sequence should be selected to derive the parameters for accurately calculating the return flow volume.
2.
Applicability Analysis of the Superposition Principle
Based on the unit hydrograph of sandy loam, the superposition principle was employed to calculate the return flow volume generated by percolation amounts over different periods. Figure 24a,b illustrate the superposition calculation results of return flow volume when the interval between two percolation events is 30 days and 60 days, respectively. The coefficient of determination (R2) for both calculation results is 0.95, indicating a strong fitting effect. This demonstrates that the return flow volume adheres to the superposition principle within a specific time interval, rendering the superposition assumption in the unit hydrograph model relatively valid. Figure 24c presents the return flow hydrograph generated by the superposition of three percolation events, with an R2 value of 0.90, also indicating a strong fitting effect. This suggests that multiple superpositions are equally effective in the return flow calculation process.

4. Discussions

4.1. Interpretation of Lag Differences in Study Area

The lag time of return flow differs significantly between the Hongbiliang and Nanshahe basins, primarily due to differences in groundwater depth, soil texture, and watershed characteristics. In the Hongbiliang basin, groundwater depth is relatively shallow, and the soil consists of sandy loam with coarser particles and high permeability. As a result, irrigation water and precipitation infiltrate quickly, leading to rapid groundwater recharge and a shorter lag time. In contrast, the Nanshahe basin has greater groundwater depth, silt loam soil with finer particles, and stronger water-retention capacity. The longer infiltration path and slower recharge rate contribute to a more prolonged lag time.
The unit hydrograph model effectively captures the lag process of irrigation return flow, with differences in its parameters n and k objectively reflecting the regulatory storage capacity and flow movement characteristics of each basin. According to the fitted unit hydrograph parameters, the values of n for the Hongbiliang and Nanshahe basins are 1.7 and 2.7, respectively, while the values of k are 8.1 and 10.2. The parameter n represents the number of linear reservoirs; a higher n value indicates more reservoirs available for regulation and storage, corresponding to a greater overall regulatory capacity in both the unsaturated and saturated zones. The larger n value in the Nanshahe Basin is attributable to two factors: (1) its greater average groundwater depth and thicker unsaturated zone, which enhance regulatory storage during soil water infiltration, and (2) its larger area, with most regions situated farther from channels, resulting in a longer average runoff path in the saturated zone and thus increased groundwater regulatory storage.
The parameter k denotes the storage–discharge coefficient of a single linear reservoir. A higher k value reflects a stronger regulatory capacity per unit thickness of the unsaturated or saturated zone. The Nanshahe Basin exhibits a larger k value than the Hongbiliang Basin, which can be explained by differences in the particle composition of the subsurface media. The Hongbiliang Basin, being closer to the Tengger Desert in the north, has sandy-dominated soils with coarser particles. In contrast, the Nanshahe Basin, located farther from the desert, contains more silt-rich soils with finer particles. As shown in Table 1, soil physical parameters from sampling points confirm that the Hongbiliang Basin has sandy loam texture, while the Nanshahe Basin is characterized by silt loam. Finer-textured soil possesses higher water storage capacity, accounting for the larger k value in the Nanshahe Basin.
In summary, the difference in return flow lag time between the Hongbiliang and Nanshahe basins is fundamentally influenced by their distinct hydrogeological and geographical conditions [6,19]. Analysis of the unit hydrograph parameters not only quantifies differences in regulatory storage capacity (n) and medium retention (k) but also elucidates the underlying mechanisms related to groundwater depth, watershed scale, and soil texture. This study confirms that the unit hydrograph model is an effective tool for characterizing irrigation return flow lag processes. Its parameters carry clear physical significance in reflecting watershed characteristics, thereby providing valuable insights for hydrological modeling and research in similar regions.

4.2. Applicability and Influencing Factors of Unit Hydrograph

Based on the numerical simulation results from Hydrus, this study systematically analyzes the applicability of the unit hydrograph model in simulating the lag process of irrigation return flow and its key influencing factors. The simulation results clearly reveal the three-stage physical mechanism of return flow formation: during the soil water infiltration stage, movement is primarily vertical, with a gradually decreasing rate; the groundwater recharge stage is characterized by a decreasing water movement rate in the vadose zone and an increasing flow velocity in the saturated zone, with the recharge rate first increasing and then decreasing; the channel drainage stage is dominated by horizontal groundwater movement, with both flow velocity and drainage volume showing a dynamic pattern of initial increase followed by decrease. This finding, from a hydrodynamic perspective, confirms the rationality of simplifying the complex lag process into a linear reservoir regulation system using the unit hydrograph model, providing a solid physical foundation for the model.
Soil texture has a decisive influence on the shape of the unit hydrograph and the fitting accuracy. Numerical simulations indicate that the fitting performance of the unit hydrograph model for fine-grained soils such as silt loam and loam is significantly better than for sand. Fine-grained soils, due to their small pores and low saturated hydraulic conductivity, result in longer water retention times, leading to a gentler return flow formation process and a “flat and wide” unit hydrograph shape. In contrast, sand, due to its strong permeability, leads to rapid return flow formation and a steep unit hydrograph shape, resulting in relatively lower fitting accuracy. This difference provides an important basis for selecting return flow prediction methods in different soil type regions [8,12,16], indicating that the unit hydrograph model is more suitable for irrigation districts dominated by fine-grained soils.
Validation of the model’s core assumptions shows that the principle of proportionality and the principle of superposition are reasonably applicable in the study area. Under different infiltration intensities, the calculated values from the unit hydrograph closely match the simulated values, confirming the proportional relationship between return flow volume and deep percolation volume. However, when the actual infiltration intensity differs significantly from the intensity used for parameter calibration, the error introduced by the principle of proportionality increases noticeably. This highlights the need to select representative return flow sequences for parameter calibration in practical applications [18,33]. Simulation results for multi-period infiltration further demonstrate that the return flow processes generated in different periods do not interfere with each other, validating the effectiveness of the superposition principle and laying the foundation for the unit hydrograph model to handle complex irrigation processes.
It is noteworthy that the model also demonstrates good adaptability to heterogeneous soils. For both horizontally and vertically layered soils, the unit hydrograph model maintains high fitting accuracy, with better adaptability to horizontally layered soils. This is because return flow is primarily discharged through lateral flow in the saturated zone, making the permeability distribution in the horizontal direction more influential on the flow path. This finding broadens the application scenarios of the model in actual irrigation districts with spatial variability [2,20]. In summary, this study deepens the understanding of the applicability of the unit hydrograph model through multi-faceted analysis, providing theoretical support and practical guidance for its scientific application in arid Yellow River diversion irrigation districts.

4.3. Research Value and Limitations

This study employs the unit hydrograph method to analyze the hysteresis effect of irrigation return flow in the Yellow River Diversion Irrigation District. This approach addresses the constraints of conventional physical models (e.g., SWAT, HYDRUS) [29], which rely heavily on high-precision baseline data and often underperform in data-sparse irrigation areas, as well as the limitations of empirical models (e.g., linear regression, gray system models), which generally reflect only an “average hysteresis effect” and fail to adequately represent dynamic processes. Based on the “proportional superposition” assumption, a unit hydrograph model is constructed to simplify the complex hysteresis process into a quantifiable functional relationship, offering a new theoretical perspective and technical pathway for quantitatively characterizing return flow hysteresis. The results not only improve the parameterization of key factors (such as hysteresis time and storage–discharge coefficient) in irrigation district water cycle models—enhancing the simulation accuracy of the complete “diversion–irrigation–consumption–drainage–return” hydrological process—but also provide a theoretical basis for establishing a systematic water allocation framework for irrigation districts [34]. These outcomes have important practical implications for mitigating water resource pressures in the mainstem of the Yellow River and advancing precision water resources management.
Nevertheless, this study has several limitations. First, numerical simulations (e.g., HYDRUS-2D) idealized the actual underlying surface conditions of the study area (e.g., topography, vegetation distribution, and ditch density). While such simplification aids mechanistic interpretation, it could reduce the model’s accuracy when applied to more complex real-world settings [9]. Second, the study focused on the eastern part of the Jingdian Irrigation District, where silt loam and sandy loam soils predominate. Although the unit hydrograph model exhibited good fitting performance in fine-textured soils such as silt loam (R2 > 0.72, MRE < 11.6%), its generalizability to other irrigation districts with notably different soil textures (e.g., clay or gravel-dominated soils) or varying groundwater table conditions requires further verification. Moreover, the calibration of unit hydrograph parameters (n, k) depends on return flow monitoring data, which may introduce uncertainty in areas with sparse gauging stations or discontinuous data records. Several sources of uncertainty in monitoring data, soil parameters, and meteorological inputs also affect the predictive accuracy of the model. First, discontinuous monitoring may lead to errors. Although routine measurements of return flow and groundwater levels (six times per month) were sufficient to capture general trends, short-term dynamics during pulse events such as heavy rainfall or concentrated irrigation could be missed, even with intensified sampling (e.g., hourly monitoring within 48 h post-rainfall). Insufficient temporal resolution in capturing rapid hydrological responses may affect the precise estimation of peak timing in the unit hydrograph model.
Second, spatial variability in key soil hydraulic parameters constitutes another major uncertainty source. Parameters including saturated hydraulic conductivity (Ks) and field capacity were determined via laboratory measurements, yet they represent only a limited set of sampling points. At the irrigation district scale, natural soil heterogeneity exists, whereas both the HYDRUS-2D and unit hydrograph models assume homogeneous soil properties [24]. This discrepancy may introduce errors in simulating soil water movement and return flow hysteresis. For instance, slight variations in Ks can significantly alter infiltration rates and water redistribution. Meteorological data simplifications also contribute to uncertainty. This study utilized long-term averages from station observations without fully accounting for spatiotemporal variability in actual evapotranspiration, temperature, and wind speed. In particular, when validating the “proportional superposition” assumption of the unit hydrograph model, neglecting actual evapotranspiration losses during irrigation intervals could lead to overestimation of the contribution of infiltrated water to return flow. Collectively, these data-level uncertainties affect the reliability of model predictions under more complex field conditions.
Future studies should aim to reduce these uncertainties through multiple strategies. For example, deploying denser sensor networks combined with geostatistical approaches (e.g., Kriging interpolation) could better characterize the spatial distribution of soil parameters and support the development of heterogeneous soil models [15]. Integrating satellite remote sensing data—such as soil moisture and leaf area index—could help constrain land surface process parameters and enhance the reliability of regional simulations. Additionally, adopting Bayesian methods for parameter calibration could explicitly quantify uncertainty intervals for both parameters and posterior predictions, offering more robust risk boundaries for water resources decision-making in irrigation districts.
Further research should also incorporate long-term measurements from multiple irrigation districts to analyze how factors such as soil structure (e.g., horizontal/vertical heterogeneity), groundwater dynamics, and irrigation scheduling influence unit hydrograph parameters, thereby refining model structure [35]. Exploring the coupling of unit hydrograph models with distributed hydrological frameworks could also help verify their applicability under more complex underlying surface conditions and expand their potential for use in varied irrigation district environments.

5. Conclusions

Based on hydrological monitoring data from 2018 to 2020, this study systematically analyzes the formation process of irrigation return flow in the Nanshahe and Hongbiliang basins by integrating the unit hydrograph model and the Hydrus model. The results reveal significant differences in the lag effect of return flow between the two watersheds. Cross-wavelet analysis indicates that the lag time of return flow relative to precipitation and irrigation in the Nanshahe basin is 0–5 months (with a high-energy interval of 4–5 months), which is significantly longer than the 0–2.3 months (high-energy interval of approximately 2 months) observed in the Hongbiliang basin. The unit hydrograph model effectively simulates the lag process of return flow in both watersheds, with good fitting results. The peak time of the unit hydrograph is 60 days for the Hongbiliang basin and 110 days for the Nanshahe basin, showing notable differences in shape. The formation process of return flow can be divided into three stages: soil water infiltration, groundwater recharge, and channel drainage, each with distinct hydraulic characteristics. During soil water infiltration, vertical percolation dominates at a decreasing rate. In the groundwater recharge stage, the flow velocity decreases in the unsaturated zone but accelerates in the saturated zone, with the recharge rate first increasing and then decreasing. During the channel drainage stage, horizontal movement predominates, with both flow velocity and drainage rate initially increasing and then decreasing. Model applicability analysis shows that the unit hydrograph model achieves better fitting results in silt loam, loam, and sandy loam soils compared to sandy soil, making it more suitable for fine-grained soils. It also demonstrates stronger applicability for horizontally layered heterogeneous soils than for vertically layered soils. The return flow processes generated under different infiltration intensities and durations generally conform to the principles of proportionality and superposition, validating the core assumptions of the unit hydrograph model.

Supplementary Materials

The following supporting information can be downloaded at: https://www.mdpi.com/article/10.3390/agriculture15222387/s1, S1: Derivation process of unit hydrograph method.

Author Contributions

Conceptualization, F.J.; methodology, F.J.; data curation, F.J.; writing—original draft preparation, F.J.; writing—review and editing, Y.P. and L.F.; funding acquisition, F.J. All authors have read and agreed to the published version of the manuscript.

Funding

This research has been supported by Tianchi talent project (Granted No. 51052401507).

Institutional Review Board Statement

Not applicable.

Informed Consent Statement

Not applicable.

Data Availability Statement

The original contributions presented in this study are included in the article. Further inquiries can be directed to the corresponding author.

Conflicts of Interest

The authors declare that they have no known competing financial interests.

References

  1. Liu, H.; Liu, X.; Zhang, T.; Du, X.; Zhao, Y.; Luo, J.; Qiu, W.; Wu, S.; Liu, H. Nitrogen and gray water footprints of various cropping systems in irrigation districts: A case from Ningxia, China. Water 2025, 17, 717. [Google Scholar] [CrossRef]
  2. Zhang, Y.; Yang, P. A simulation-based optimization model for control of soil salinization in the Hetao Irrigation District, Northwest China. Sustainability 2023, 15, 4467. [Google Scholar] [CrossRef]
  3. Ding, X.; Zhang, H.; Wang, Z.; Shang, G.; Huang, Y.; Li, H. Analysis of the evolution pattern and driving mechanism of lakes in the Northern Ningxia Yellow Diversion Irrigation Area. Water 2022, 14, 3658. [Google Scholar] [CrossRef]
  4. Liu, Y.; Ma, C.; Yang, Z.; Fan, X. Ecological security of desert–oasis areas in the Yellow River Basin, China. Land 2023, 12, 2080. [Google Scholar] [CrossRef]
  5. Li, C.; Feng, H.; Luo, X.; Li, Y.; Wang, N.; Wu, W.; Zhang, T.; Dong, Q.; Siddique, K.H.M. Limited irrigation and fertilization in sand-layered soil increases nitrogen use efficiency and economic benefits under film mulched ridge-furrow irrigation in arid areas. Agric. Water Manag. 2022, 262, 107406. [Google Scholar] [CrossRef]
  6. He, K.; Zhang, Q.; Ai, Z.; Xu, N.; Qiao, Y.; Tian, C.; Leng, P.; Cheng, H.; Chen, G.; Li, F. Characteristics and influence factors of soil water and salt movement in the Yellow River Irrigation District. Agronomy 2024, 14, 92. [Google Scholar] [CrossRef]
  7. Tulip, S.S.; Siddik, M.S.; Islam, M.N.; Rahman, A.; Haghighi, A.T.; Mustafa, S.M.T. The impact of irrigation return flow on seasonal groundwater recharge in northwestern Bangladesh. Agric. Water Manag. 2022, 266, 107593. [Google Scholar] [CrossRef]
  8. Caschetto, M.; Sacchi, E.; Pinti, D.L.; Riparbelli, C.; Bruno, S.; Zanotti, C.; Bonomi, T.; Rotiroti, M. Surface-water-irrigation return flow dominates groundwater recharge, groundwater age and nitrate dynamics in an alluvial basin aquifer. Water Res. 2025, 285, 124040. [Google Scholar] [CrossRef]
  9. Abdi, D.E.; Owen, J.S.; Brindley, J.C.; Birnbaum, A.; Cregg, B.M.; Fernandez, R.T. Irrigation return flow and nutrient movement mitigation by irrigation method for container plant production. Irrig. Sci. 2021, 39, 567–585. [Google Scholar] [CrossRef]
  10. Park, Y.; Kim, Y.; Park, S.-K.; Shin, W.-J.; Lee, K.-S. Water quality impacts of irrigation return flow on stream and groundwater in an intensive agricultural watershed. Sci. Total Environ. 2018, 630, 859–868. [Google Scholar] [CrossRef]
  11. Jie, F.; Fei, L.; Peng, Y.; Li, S.; Ge, Y. Optimal allocation of water resources in irrigation areas considering irrigation return flow and uncertainty. Appl. Sci. 2025, 15, 2380. [Google Scholar] [CrossRef]
  12. Lee, K.-S.; Park, Y.; Shin, W.-J. Hydrograph separation for a small agricultural watershed: The role of irrigation return flow. J. Hydrol. 2021, 593, 125831. [Google Scholar] [CrossRef]
  13. Ketchum, D.; Hoylman, Z.H.; Huntington, J.; Brinkerhoff, D.; Jencso, K.G. Irrigation intensification impacts sustainability of streamflow in the Western United States. Commun. Earth Environ. 2023, 4, 479. [Google Scholar] [CrossRef]
  14. Wang, W.; Zhao, J.; Duan, L. Simulation of irrigation-induced groundwater recharge in an arid area of China. Hydrogeol. J. 2021, 29, 525–540. [Google Scholar] [CrossRef]
  15. Hu, Q.; Yang, Y.; Han, S.; Yang, Y.; Ai, Z.; Wang, J.; Ma, F. Identifying changes in irrigation return flow with gradually intensified water-saving technology using HYDRUS for regional water resources management. Agric. Water Manag. 2017, 194, 33–47. [Google Scholar] [CrossRef]
  16. Mohan, S.; Vijayalakshmi, D.P. Prediction of irrigation return flows through a hierarchical modeling approach. Agric. Water Manag. 2009, 96, 233–246. [Google Scholar] [CrossRef]
  17. Eluwa, C.; Francois, B.; Bernstein, A.; Brown, C. Exploring the implications of modeling choices on prediction of irrigation water savings. Water Resour. Res. 2023, 59, e2021WR031618. [Google Scholar] [CrossRef]
  18. Chien, C.P.; Fang, W.T. Modeling irrigation return flow for the return flow reuse system in paddy fields. Paddy Water Environ. 2012, 10, 187–196. [Google Scholar] [CrossRef]
  19. Kumar, S.; Kumar, V.; Saini, R.K.; Pant, N.; Singh, R.; Singh, A.; Kumar, S.; Singh, S.; Yadav, B.K.; Krishan, G.; et al. Floodplains landforms, clay deposition and irrigation return flow govern arsenic occurrence, prevalence and mobilization: A geochemical and isotopic study of the mid-Gangetic floodplains. Environ. Res. 2021, 201, 111516. [Google Scholar] [CrossRef]
  20. Veettil, A.V.; Green, T.R.; Kipka, H.; Arabi, M.; Lighthart, N.; Mankin, K.; Clary, J. Fully distributed versus semi-distributed process simulation of a highly managed watershed with mixed land use and irrigation return flow. Environ. Model. Softw. 2021, 140, 105000. [Google Scholar] [CrossRef]
  21. Chatrabhuj; Meshram, K.; Mishra, U.; Omar, P.J. Integration of remote sensing data and GIS technologies in river management system. Discov. Geosci. 2024, 2, 67. [Google Scholar] [CrossRef]
  22. Attar, H.K.; Noory, H.; Ebrahimian, H.; Liaghat, A.-M. Efficiency and productivity of irrigation water based on water balance considering quality of return flows. Agric. Water Manag. 2020, 231, 106025. [Google Scholar] [CrossRef]
  23. Liu, W.; Fu, Q.; Meng, J.; Li, T.; Cheng, K. Simulation and analysis of return flow at the field scale in the northern rice irrigation area of China. Agric. Water Manag. 2019, 224, 105735. [Google Scholar] [CrossRef]
  24. Li, D. Quantifying water use and groundwater recharge under flood irrigation in an arid oasis of northwestern China. Agric. Water Manag. 2020, 240, 106326. [Google Scholar] [CrossRef]
  25. Kattan, Z. Estimation of evaporation and irrigation return flow in arid zones using stable isotope ratios and chloride mass-balance analysis: Case of the Euphrates River, Syria. J. Arid Environ. 2008, 72, 730–747. [Google Scholar] [CrossRef]
  26. Séraphin, P.; Vallet-Coulomb, C.; Gonçalvès, J. Partitioning groundwater recharge between rainfall infiltration and irrigation return flow using stable isotopes: The Crau aquifer. J. Hydrol. 2016, 542, 241–253. [Google Scholar] [CrossRef]
  27. Ansari, M.A.; Noble, J.; Kumar, U.S.; Deodhar, A.; Akhtar, N.; Singh, P.; Raj, R. Assessing the groundwater recharge processes in intensively irrigated regions: An approach combining isotope hydrology and machine learning. Geosci. Front. 2025, 16, 102105. [Google Scholar] [CrossRef]
  28. Kang, T.; Shin, Y.; Shin, M.; Lee, D.; Lim, K.J.; Kim, J. Evaluation of the effect of agricultural return flow on water quality, water quantity and aquatic ecology in downstream rivers. Water 2024, 16, 1604. [Google Scholar] [CrossRef]
  29. Han, J.; Lee, S.; Kim, J. Quantifying stream return flow of agricultural water using SWAT-MODFLOW-PADDY model in Korean paddy fields. Agronomy 2024, 14, 2440. [Google Scholar] [CrossRef]
  30. Rujner, H.; Leonhardt, G.; Marsalek, J.; Viklander, M. High-resolution modelling of the grass swale response to runoff inflows with Mike SHE. J. Hydrol. 2018, 562, 411–422. [Google Scholar] [CrossRef]
  31. Long, S.A.; Cook, A.M.; Fennema, R.; Tachiev, G.I.; Villamizar, V.; Kotun, K.; Miralles-Wilhelm, F. Analysis of bridge construction as a restoration technique for Everglades National Park, FL, USA, using hydrological numerical modeling. J. Hydraul. Eng. 2016, 142, 05015005. [Google Scholar] [CrossRef]
  32. Naghedifar, S.M.; Ziaei, A.N.; Ansari, H. Simulation of irrigation return flow from a Triticale farm under sprinkler and furrow irrigation systems using experimental data: A case study in arid region. Agric. Water Manag. 2018, 210, 185–197. [Google Scholar] [CrossRef]
  33. Stewart, R.D.; Lee, J.G.; Shuster, W.D.; Darner, R.A. Modelling hydrological response to a fully-monitored urban bioretention cell. Hydrol. Process. 2017, 31, 4626–4638. [Google Scholar] [CrossRef]
  34. Pérez-Blanco, C.D.; Essenfelder, A.H.; Gutiérrez-Martín, C. A tale of two rivers: Integrated hydro-economic modeling for the evaluation of trading opportunities and return flow externalities in inter-basin agricultural water markets. J. Hydrol. 2020, 584, 124676. [Google Scholar] [CrossRef]
  35. Jie, F.; Fei, L.; Li, S.; Hao, K.; Liu, L.; Li, J.; Liu, N. Quantitative effects of vadose zone thickness on delayed recharge of groundwater for an irrigation district in an arid area of Northwest China. J. Hydrol. Reg. Stud. 2022, 40, 101022. [Google Scholar] [CrossRef]
  36. Jafari, H.; Raeisi, E.; Zare, M.; Haghighi, A.A.K. Time series analysis of irrigation return flow in a semi-arid agricultural region, Iran. Arch. Agron. Soil Sci. 2011, 58, 673–689. [Google Scholar] [CrossRef]
  37. Khalaj, M.; Kholghi, M.; Saghafian, B.; Bazrafshan, J. Impact of climate variation and human activities on groundwater quality in northwest of Iran. J. Water Supply Res. Technol. 2019, 68, 121–135. [Google Scholar] [CrossRef]
  38. Tu, Q.; Li, H.; Wang, X. Multi-criteria evaluation of small-scale sprinkler irrigation systems using grey relational analysis. Water Resour. Manag. 2014, 28, 4665–4684. [Google Scholar] [CrossRef]
  39. Wu, D.; Cui, Y.; Luo, Y. Irrigation efficiency and water-saving potential considering reuse of return flow. Agric. Water Manag. 2019, 221, 519–527. [Google Scholar] [CrossRef]
  40. Jie, F. Study on the Lag and Uncertainty of Return Flow in a Large Yellow River Irrigation District. Master’s Thesis, Xi’an University of Technology, Xi’an, China, 2023. (In Chinese). [Google Scholar]
  41. Nash, J.E. The Form of the Instantaneous Unit Hydrograph. In Proceedings of the International Association of Scientific Hydrology (IAHS) General Assembly, Toronto, ON, Canada, 3–14 September 1957; pp. 114–121. [Google Scholar]
  42. van Genuchten, M.T. A closed-form equation for predicting the hydraulic conductivity of unsaturated soils. Soil Sci. Soc. Am. J. 1980, 44, 892–898. [Google Scholar] [CrossRef]
  43. Mualem, Y. A new model for predicting the hydraulic conductivity. Water Resour. Res. 1976, 12, 513–522. [Google Scholar] [CrossRef]
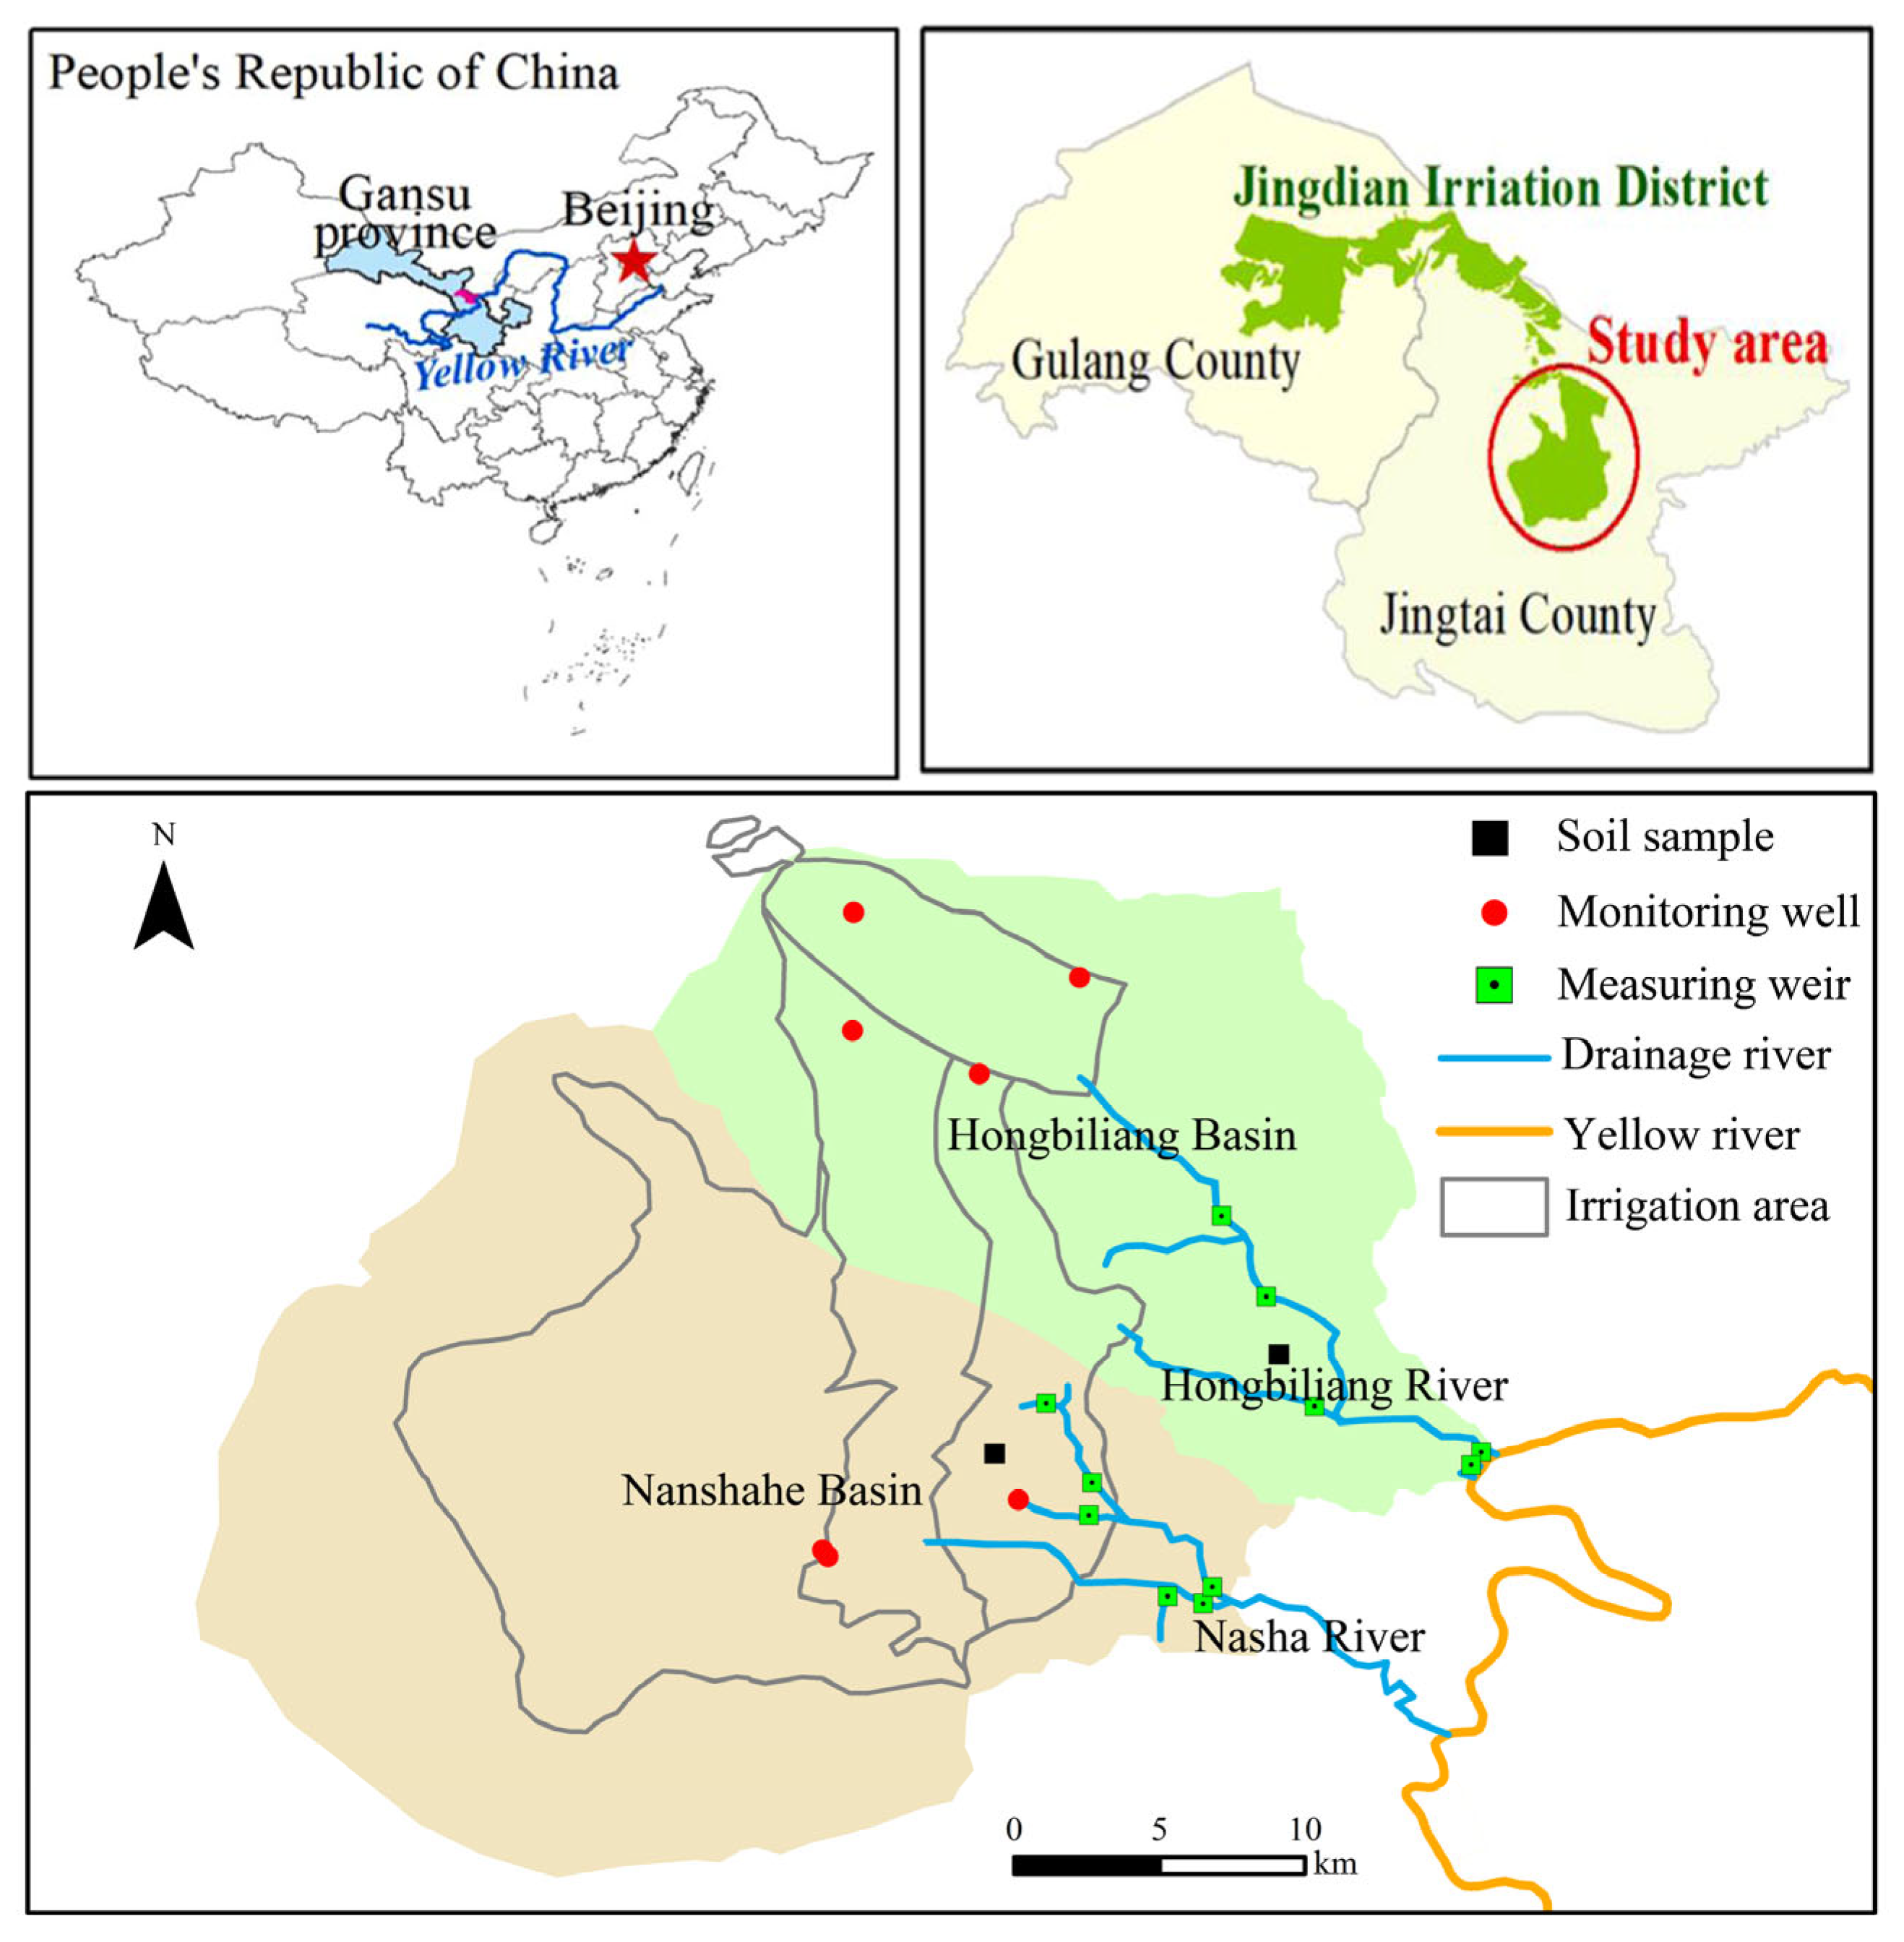
Figure 1. Location map of the study area showing the drainage system and monitoring facilities.
Agriculture 15 02387 g001
Figure 2. Soil water characteristic curves for the predominant soil textures in the study area.
Agriculture 15 02387 g002
Figure 3. Conceptual diagram of the irrigation return flow process in the arid region diversion irrigation district.
Agriculture 15 02387 g003
Figure 4. Schematic diagram of the principle of multiplication and superposition.
Agriculture 15 02387 g004
Figure 5. Geometry and boundary conditions of the HYDRUS-2D numerical simulation model. (Black arrows denote the water flow direction, the blue-filled squares represent the channel water, the green rectangle delineates the extent of the numerical simulation.).
Agriculture 15 02387 g005
Figure 6. Design of numerical simulation experiments to validate the unit hydrograph applicability. (The black arrows indicate the water flow direction, the blue-filled squares represent the channel water, and the triangles denote the channel water level.).
Agriculture 15 02387 g006
Figure 7. Temporal variation in gross irrigation amount and groundwater depth in the Hongbiliang Basin.
Agriculture 15 02387 g007
Figure 8. Temporal variation in gross irrigation amount and groundwater depth in the Nanshahe Basin.
Agriculture 15 02387 g008
Figure 9. Time-series of gross irrigation amount, precipitation, and measured return flow in the Hongbiliang Basin.
Agriculture 15 02387 g009
Figure 10. Time-series of gross irrigation amount, precipitation, and measured return flow in the Nanshahe Basin.
Agriculture 15 02387 g010
Figure 11. Cross-wavelet power spectra between (a) precipitation-return flow and (b) irrigation–return flow for the Hongbiliang Basin. (The area enclosed by the black line indicates the 95% confidence interval).
Agriculture 15 02387 g011
Figure 12. Cross-wavelet power spectra between (a) precipitation-return flow and (b) irrigation–return flow for the Nanshahe Basin. (The area enclosed by the black line indicates the 95% confidence interval).
Agriculture 15 02387 g012
Figure 13. Comparison between monitored and simulated return flow volumes during the calibration and verification periods for both basins.
Agriculture 15 02387 g013
Figure 14. Fitted duration-specific unit hydrographs for return flow in the Hongbiliang and Nanshahe Basins.
Agriculture 15 02387 g014
Figure 15. Distribution of total pressure head and flow direction during return flow formation (at day 10 of simulation T2). (Labels ① and ② represent the vertical section in the saturated zone and the horizontal section in the unsaturated zone, respectively.).
Agriculture 15 02387 g015
Figure 16. Temporal changes in total pressure head for the vadose zone (Section 1) and saturated zone (Section 2).
Agriculture 15 02387 g016
Figure 17. Temporal changes in soil water velocity and water content in the vadose zone (Section 1).
Agriculture 15 02387 g017
Figure 18. Spatiotemporal changes in groundwater flow velocity in the saturated zone (Section 2).
Agriculture 15 02387 g018
Figure 19. Contour maps of soil water flow velocity distribution at different simulation times.
Agriculture 15 02387 g019
Figure 20. Fitted unit hydrographs at a daily time step for different soil textures.
Agriculture 15 02387 g020
Figure 21. Fitted unit hydrographs at a 10-day time step for different soil textures.
Agriculture 15 02387 g021
Figure 22. Comparison of simulated return flow and unit hydrograph fits for horizontally and vertically layered soils.
Agriculture 15 02387 g022
Figure 23. Validation of the proportionality principle: Comparison of HYDRUS simulations and unit hydrograph predictions under different infiltration intensities.
Agriculture 15 02387 g023
Figure 24. Validation of the superposition principle: Comparison of HYDRUS simulations and unit hydrograph predictions for multi-period infiltration events.
Agriculture 15 02387 g024
Table 1. Measured soil physical parameters for the Hongbiliang and Nanshahe Basins.
River BasinSoil TextureBulk Density (g/cm3)Saturated Water Content (cm3/cm3)Field Capacity (cm3/cm3)Saturated Hydraulic Conductivity (cm/min)
Nanshahe BasinSilt Loam1.440.420.280.004
Hongbiliang BasinSandy Loam1.530.400.250.049
Table 2. Lag times of return flow relative to precipitation and irrigation, identified by cross-wavelet analysis.
BasinInfluencing FactorSignificant Interval of Lag Time (Months)High-Energy Interval of Lag Time (Months)
Hongbiliang BasinPrecipitation[0.1, 0.3], [1, 2], [1.8~2.3][1.8~2.3]
Irrigation[0.3, 0.4], [1.4, 1.5], [1.8~2.1][1.8~2.1]
Nanshahe BasinPrecipitation[0.3, 0.5], [4.1~5.0][4.1~5.0]
Irrigation[1.7, 2.9], [2.4, 2.8], [4~4.9][4~4.9]
Table 3. Calibrated parameters and performance metrics of the unit hydrograph model for both basins during calibration and verification periods.
BasinnkCalibrationValidation
Hongbiliang Basin1.78.1R2 = 0.77
MRE = 7.3%
R2 = 0.72
MSE = 9.2%
Nanshahe Basin2.710.2R2 = 0.74
MRE = 10.3%
R2 = 0.79
MRE = 11.6%
Table 4. Fitted unit hydrograph parameters and goodness-of-fit statistics for different soil textures.
Time ScaleSoil TexturenkRSSR2
Daily ScaleSand1.0011.600.0170.67
Sandy Loam1.7514.200.0020.87
Loam1.9214.620.0010.95
Silt Loam1.8712.180.0010.95
Ten-Day ScaleSand1.000.410.1400.68
Sandy Loam1.001.970.0100.97
Loam1.102.260.0020.99
Silt Loam1.002.970.0050.96
Table 5. Fitted unit hydrograph parameters and goodness-of-fit statistics for heterogeneous soil conditions.
Heterogeneity TypeSoil TexturenkRSSR2
Horizontally Layered SoilLoam, Silt Loam, Sand1.004.860.0010.99
Vertically Layered SoilLoam, Silt Loam, Sand1.005.780.0020.96
Disclaimer/Publisher’s Note: The statements, opinions and data contained in all publications are solely those of the individual author(s) and contributor(s) and not of MDPI and/or the editor(s). MDPI and/or the editor(s) disclaim responsibility for any injury to people or property resulting from any ideas, methods, instructions or products referred to in the content.