Abstract
We developed a model to predict the quality of fresh goji berries during storage by analyzing the correlations of their dielectric properties. The variations in these properties with storage temperature, time, and frequency were systematically characterized to inform the model. Leveraging these relationships, we developed a model to predict quality. The analysis integrated measurements of dielectric properties with assessments of texture and key physicochemical indicators. Results indicate that dielectric parameters exhibit significant frequency dependence. Complex impedance (Z), capacitance (Cp), and resistance (Rp) all decreased sharply with increasing frequency, with the most pronounced change observed in Cp. Conductance, G, and reactance, X, increased with frequency, reaching maximum increases of 360.86% and 87.79%, respectively. Under the specific test frequency of 163,280 Hz, a strong polynomial relationship was observed between the dielectric parameters and storage time, with all fitted models yielding values above 0.94. The quality factor Q (a dimensionless number for the energy efficiency of a resonant circuit or medium) showed a near-perfect correlation with brittleness, while reactance, X, was correlated with springiness and cohesiveness, with correlation coefficients approaching 0.999 under the optimal test frequency. The constructed ANN model demonstrated high prediction accuracy for hardness, brittleness, elasticity, cohesiveness, chewiness, and soluble solids content (R2 > 0.97, MSE < 5%) but performed poorly in predicting adhesiveness, stickiness, and rebound elasticity (R2 < 0.9). The constructed LSSVM model showed good prediction performance for some indicators (hardness, springiness, cohesiveness, and SSC) (R2 > 0.94), but its prediction accuracy was low for brittleness and chewiness (R2 < 0.9). Overall, its performance and generalization ability were inferior to the ANN model. This study shows that ANN models based on dielectric properties establish a technical foundation for the non-destructive, automated monitoring of goji berry storage quality, thereby providing a critical tool for dynamic quality tracking and value assessment within integrated warehouse management systems.
1. Introduction
Goji berries, also known as “Lycium barbarum” or “sweet berry seeds,” belong to the Lycium genus within the Solanaceae family and are multi-branched shrubs. They are primarily distributed across Asia, the Americas, and Europe. In China, goji berries are predominantly cultivated in Gansu, Ningxia, Xinjiang, and Qinghai. Their quality is defined by a range of attributes, covering nutritional composition, appearance, taste, flavor, and medicinal value. These traits are directly influenced by the fruit’s underlying physicochemical properties, such as cell wall integrity and moisture content, which in turn govern its dielectric behavior. Therefore, dielectric parameters serve as sensitive proxies for these internal quality attributes.
Berries are consumed worldwide due to their abundance of valuable bioactive compounds, which are beneficial to human health [1]. In addition to dietary fiber, vitamins, and minerals, they contain phytochemicals like phenolic compounds and carotenoids. These substances not only provide antioxidant, anti-inflammatory, and other health-promoting effects [2] but also, as electrically charged entities, influence the fruit’s electrical properties. After harvest, berries remain metabolically active. Changes in the quantity and distribution of various chemical constituents cause fluctuations in their internal bioelectric field, forming the theoretical basis for using electrical properties in the quality detection of fresh fruits [3]. As technology advances, the precise assessment of berry quality has become a critical research focus. This study highlights the novelty of dielectric analysis as a rapid, sensitive, and user-friendly electrical detection technology. It moves beyond the capabilities of non-contact imaging by gauging internal biochemical properties, offering a more direct method for quality assessment. Consequently, establishing a definitive relationship between the dielectric parameters and quality attributes of berries has emerged as a key research objective. This research direction is motivated by promising results obtained in other fruits. For example, studies have demonstrated the use of dielectric properties in assessing fruit firmness, ripeness, elasticity, soluble solids content, and even the sugar content in watermelons [4] and cantaloupes [5]. These applications underscore the significant role of electrical parameters as physical quantities that effectively reflect the internal structure and characteristics of materials [6].
The core novelty of this study lies in the limited exploration of dielectric properties in post-harvest modeling for berries. We conducted a systematic correlation analysis between the dielectric properties of fresh goji berries and their key textural parameters. Unlike previous studies predominantly focused on common fruits, this paper not only reveals the highly significant correlation between dielectric parameters at specific frequencies and quality indicators but also builds ANN prediction models and LSSVM models for multiple goji berry quality indicators based on this foundation, thereby addressing a critical gap in the literature—the absence of ANN-based dielectric prediction models specifically for goji berries during storage. These models are then compared and analyzed, achieving high-precision, non-destructive alternatives to traditional chemical and mechanical measurement methods. Through these innovations, this study aims to provide a dedicated theoretical framework and practical non-destructive testing solution for intelligent post-harvest quality monitoring of goji berries.
2. Materials and Methods
2.1. Materials
The fresh goji berries used in this study were the Ningqi No. 1 variety, harvested from the Goji Berry Industrial Park in Shuanglong Township, Jingyuan County, Gansu Province, during July and August 2024. To preserve their freshness and ensure data accuracy, all berries were transported and stored in a constant-temperature chamber at 4 °C and 85–90% relative humidity (RH) within three hours of harvesting, with all subsequent experiments performed concurrently. Fruit selection for each trial was based first on commercial maturity, defined by a uniform red coloration, specific soluble solids content (SSC), and appropriate firmness. From this pool, fruits were further selected for the absence of natural bruising and for displaying normal morphological and physiological characteristics.
2.2. Methods
2.2.1. Experimental Purpose
This study examined how storage temperature, duration, and frequency affect the electrical parameters and quality of fresh goji berries. The freshly harvested berries were stored at four different temperatures (0 °C, 4 °C, 8 °C, and 12 °C) for a total duration of five days. During these five days, electrical parameters and quality characteristics were measured at 0 h, 2 h, 4 h, 6 h, and 8 h each day. The investigation was designed to systematically address three key questions: first, how the electrical parameters of the berries vary with frequency at different storage temperatures; second, how storage temperature and duration impact their quality characteristics; and third, the correlation between electrical parameters and quality characteristics at specific frequencies.
2.2.2. Dielectric Parameter Measurement
The dielectric parameters of the goji berries were measured with a parallel-plate electrode setup [7], featuring two 1 mm thick, 30 mm diameter copper plates fixed in parallel inside a shielded chamber. The measurement system consisted of an HIOKI IM3536 LCR meter (HIOKI, Ueda, Japan, 4 Hz–8 MHz), the shielded chamber, and data processing software. The LCR meter’s terminals were connected directly to the parallel-plate electrodes, and data was collected via PC software. Before measurements, the LCR meter was calibrated with open-circuit and short-circuit tests.
During the experiment, goji berries were positioned between the electrodes. The lifting plate was then adjusted to achieve a fixed inter-electrode gap of 10 mm, and the shielded enclosure was sealed to minimize external interference. Measurements were taken across a frequency range of 163.280 Hz to 5,387,800 Hz, with 33 specific test points. This range was selected to encompass the critical dielectric relaxation regions associated with ionic conduction and Maxwell–Wagner polarization in hydrophilic plant tissues. A clamping force of 1 N was applied to ensure stable electrode contact. This process was repeated daily over five days using the same batch of fresh goji berries.
Based on preliminary experiments, six key electrical parameters were selected for analysis: complex impedance (Z), conductance (G), quality factor (Q), capacitance (Cp), resistance (Rp), and reactance (X). For each experiment, we randomly selected 15 goji berries and sampled them at the 0 h, 2 h, 4 h, 6 h, and 8 h time points. Each test was repeated three times, and the average value was calculated.
2.2.3. Texture Property Measurement
This experiment employed the TPA method to determine the textural parameters of fresh goji berries [8], utilizing the TA.XT Express C texturer manufactured by SMS Ltd. (Surrey, UK). of the UK as the primary testing equipment. Prior to testing, intact berries with their pedicels carefully removed were selected to ensure a uniform and standardized contact surface with the probe. The experiment was performed with five replicates (n = 5), each consisting of three randomly selected goji berry samples measured on the same day. This replication scheme provided sufficient data points for robust statistical analysis of the textural parameters over the five-day testing period. Prior to initiating the formal loading experiments, all required experimental parameters were configured, as shown in Table 1. A dedicated P-36R aluminum alloy compression probe was used, featuring a radius of 3.6 mm and a compression area of 40.7 mm2.

Table 1.
Experimental parameters of the texture analyzer.
Each test was conducted three times and the average value was taken. The parameters measured in this experiment include hardness and fracturability, adhesiveness, springiness, cohesiveness, gumminess, chewiness, and resilience, which were derived from the characteristic curves.
2.2.4. Measurement of Soluble Solid Content
The soluble solids content (SSC) of goji berries was determined with a PAL-1 refractometer (ATAGO Ltd., Tokyo, Japan) [9]. Testing was completed in five batches over five days, with samples from the same batch analyzed daily. Prior to testing, the refractometer was zeroed: the prism cover was opened, the prism surface cleaned with a soft cloth, and a sufficient amount of distilled water was added to evenly cover the surface. We aligned the light source until the scale was clear. If the reading was unclear, we adjusted the calibration screw to zero, then wiped off the distilled water. During measurement, we directly placed a drop of the goji berry sample onto the prism. After allowing the sample to equilibrate to the instrument’s temperature (20 °C) for approximately 30 s, we initiated the measurement and recorded the reading. Data are presented as the mean from five replicate samples (n = 5) per group, a sample size sufficient for robust statistical analysis.
2.2.5. Determination of Titratable Acids
The determination of titratable acid is generally performed using acid–base titration [10]. The principle involves titrating the acidic substances in the sample with a standard alkaline solution of known concentration. The content of titratable acid is calculated based on the volume of alkaline solution consumed. The procedure was as follows: Weigh 1 g of ground and thoroughly mixed goji berry sample, place it in a mortar, and transfer it to a 50 mL volumetric flask. Rinse the mortar with distilled water; add the rinse solution to the volumetric flask, dilute to volume, shake well, and allow it to stand for 30 min before filtering. Transfer 10 mL of the filtrate to a conical flask, add 2 drops of 1% phenolphthalein indicator, and titrate with a calibrated sodium hydroxide solution, which was standardized prior to each batch of analyses. The endpoint is reached when the solution turns pink and remains so for at least 30 s (pH 8.1–8.3). Record the volume of sodium hydroxide consumed and repeat the titration three times. Replace the filtrate with distilled water for titration as a blank control and calculate the content according to the Formula (1).
In the formula: V is the total volume of the sample extract (mL); c is the concentration of the NaOH titrant (mol/L); V1 is the volume of the NaOH solution consumed in titrating the filtrate (mL); V0 is the volume of the NaOH solution consumed in titrating distilled water (mL); VS is the volume of the extract taken for titration (mL); m is the mass of the sample (g); and f is the conversion coefficient of malic acid (g/mol).
2.2.6. Statistical Analysis
Excel 2023 data analysis software (Microsoft, Redmond, WA, USA) was used for data processing and SPSS 25 software (IBM, Armonk, NY, USA) for one-way (ANOVA, New Providence, NJ, USA) analysis of variance, Duncan multiple comparisons, and Pearson correlation analysis; Origin 2019 (Origin Lab, Northampton, MA, USA) software was used for image plotting and data regression analysis. A quality prediction model based on dielectric properties was constructed using MATLAB R2023a software, and training of the model was completed. The polynomial regression models (presented in Table 2, Table 3 and Table 4) were fitted to characterize the global trends within the complete experimental dataset. The coefficient of determination (R2) and adjusted R2 provided are measures of goodness of fit for the entire dataset.
Table 2.
Regression equation between dielectric parameters and storage time t for fresh goji berries.
Table 3.
The regression equation between the quality characteristics of fresh goji berries and the storage temperature T.
Table 4.
The regression equation between the quality characteristics of fresh goji berries and the storage time t.
2.2.7. Establishment of Artificial Neural Network (ANN) and Least Squares Support Vector Machine (LSSVM) Models for Predicting Goji Berry Quality
ANN models serve as powerful predictive tools capable of effectively forecasting the quality of fresh goji berries during cold storage based on their dielectric properties. This methodology has been applied in quality prediction studies for fruits such as strawberries [11] and kiwifruit [12]. Specifically for goji berry quality prediction, it primarily utilizes dielectric parameters at characteristic frequencies (impedance Z, capacitance Cp, resistance Rp, quality factor Q, conductance G, and reactance X) [13] alongside quality characteristic data measured from actual samples, including hardness, brittleness, elasticity, cohesiveness, chewiness, and soluble solids content. For model construction, a feedforward architecture of ANN [14] was adopted and trained using backpropagation. Dielectric parameters (Z, G, Q, Cp, Rp, X) served as input variables to establish corresponding prediction and nonlinear models.
Figure 1 depicts the network structure for the goji berry quality prediction model, which links dielectric properties with quality measurements. In this architecture, dielectric parameters (Z, Cp, Rp, Q, G, X) form the input layer to 9 hidden layers, while quality indicators (hardness, brittleness, etc.) constitute the output layer [15], which is activated by a logistic function. We converted raw data into a format processable by MATLAB and normalized both input and output data (0–1) to enhance the training efficiency and prediction accuracy of the neural network.
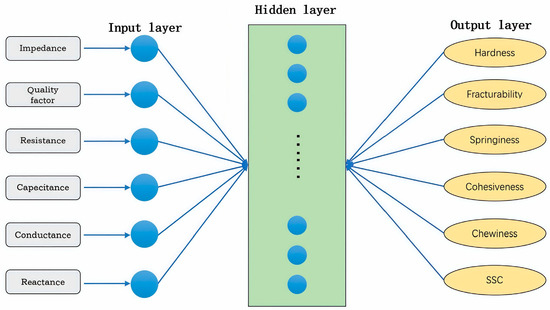
Figure 1.
Network structure diagram of the prediction model.
As an efficient machine learning method, the least squares support vector machine (LSSVM) is particularly effective for regression tasks involving limited samples and high-dimensional data. It innovates by applying equality constraints and a least-squares solution method to standard SVMs. This enhances computational efficiency and model stability without compromising fitting ability. Owing to its proven success in predicting internal quality attributes of fruits such as apples and pears, LSSVM serves as a key methodological foundation for this research.
This study leverages LSSVM to develop a predictive model that establishes a functional relationship between the quality indicators of fresh goji berries and their dielectric properties. Input variables consist of dielectric parameters (complex impedance Z, capacitance Cp, resistance Rp, quality factor Q, conductance G, and reactance X) obtained at selected characteristic frequencies. To ensure the generalization ability of the model, the dataset was randomly partitioned into training and testing sets using an 80:20 ratio, a common practice in machine learning for datasets of this size. The output variables correspond to empirically determined quality metrics, namely hardness, brittleness, elasticity, cohesiveness, chewiness, and soluble solids content (SSC). We employed an RBF kernel and optimized σ2 (0.1–10) and γ (1–100) through grid search. The incorporation of a least-squares loss function and a kernel function facilitated the transformation of the inherently nonlinear problem into the solution of a linear equation system, which allowed for the accurate prediction of quality attributes.
3. Results
3.1. Study on the Frequency Response of Dielectric Properties in Fresh Goji Berries at Different Storage Temperatures
To ensure stable data quality, we analyzed measurements from the middle three days of the experiment. This approach excluded the potentially unstable initial and final phases. The dielectric properties were examined across a frequency range of 163,280 Hz to 5,387,800 Hz. The complex impedance (Z), capacitance (Cp), and resistance (Rp) exhibited a characteristic decline with increasing frequency, consistent with the inability of interfacial polarization in biological tissues to follow high-frequency electric fields. The magnitude of these changes diminished as frequency increased, with the most pronounced variations observed at 0 °C storage: Z decreased from 2854.99 Ω to 918.04 Ω (a 67.84% reduction), Cp decreased from 2.73 × 10⁻¹⁰ F to 9.72 × 10⁻¹² F (a 96.44% decrease), and Rp decreased from 4634.39 Ω to 961.45 Ω (a 79.25% decrease). The trend in the quality factor Q largely aligned with the aforementioned parameters. This phenomenon may stem from goji berries being a non-uniform heterogeneous system, where their high dielectric constant at low frequencies primarily originates from intense interfacial polarization caused by ion aggregation at interfaces such as cell membranes. It may also relate to the dispersion of water molecules within the sample [16] and exhibits similar patterns to changes in the dielectric properties of mangoes [17], jackfruit [18], strawberries [19], and kiwifruit [20].
As shown in Figure 2e,f, the conductance (G) and reactance (X) of fresh goji berries both increased with frequency across the tested temperatures. Additionally, the change in reactance was diminished at higher frequencies. At a 0 °C storage temperature, G increased from 0.00023 S at 163,280 Hz to 0.00106 S at 5,387,800 Hz, representing a 360.86% increase. X decreased from −2256.53 Ω to −275.42 Ω, showing an 87.79% decrease.
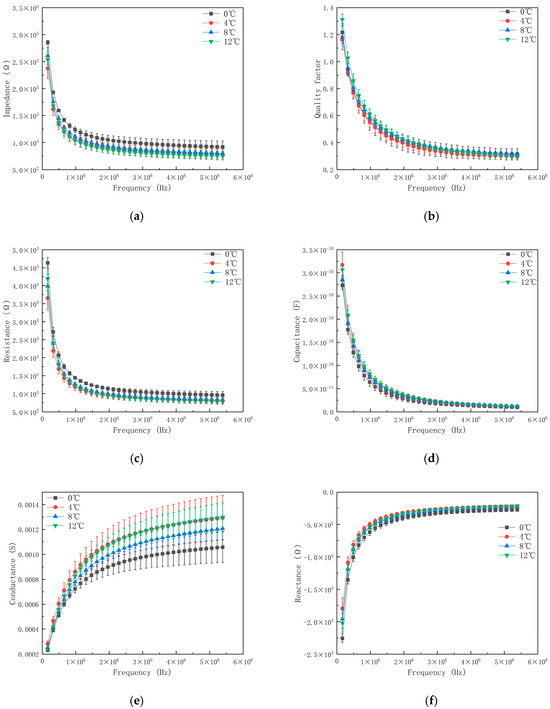
Figure 2.
The variation in electrical parameters of fresh goji berries with frequency at different temperatures. (a) The change in impedance with frequency at different temperatures; (b) variation in quality factor with frequency at different temperatures; (c) the change in resistance with frequency at different temperatures; (d) the change in capacitance with frequency at different temperatures; (e) the change in conductance with frequency at different temperatures; (f) change in reactance with frequency at different temperatures. Each of the above points represents the average of three repeated experiments.
As shown in Figure 2, within the same test frequency range, storage temperature T significantly affects certain electrical parameters of fresh goji berries. For Z and Rp values: 0 °C > 8 °C > 4 °C > 12 °C; for G values: 12 °C > 8 °C > 4 °C > 0 °C. Statistical analysis confirmed that some pairwise comparisons within the above rankings exhibited significant differences (p < 0.05). At 163,280 Hz, the values of Z and Rp were relatively low at 4 °C. Meanwhile, the G values at 0 °C and 12 °C began similarly but diverged as frequency increased. Overall, temperature had a greater influence on Z and Rp, whereas frequency more strongly affected G.
3.2. Study on the Frequency Response of Dielectric Properties in Fresh Goji Berries at Different Storage Durations
As shown in Figure 3, within the measured frequency range, the values of Z, Q, Cp, and Rp gradually decrease with increasing frequency across different storage times. Moreover, the magnitude of this decrease diminishes as frequency increases. Taking the dielectric parameter changes at 0 °C as an example: At 0 h of storage and a frequency of 163,280 Hz, the values of Z, Q, Cp, and Rp were 2854.99 Ω, 1.22, 2.73 × 10⁻¹⁰ F, and 4634.39 Ω, respectively. As frequency increased to 5,387,800 Hz, these values changed to 918.04 Ω, 0.31, 9.72 × 10⁻¹² F, and 961.45 Ω. This variation pattern correlates with the current conduction mechanism: At low frequencies, current flows primarily from the extracellular fluid, while at higher frequencies, current flows from both the extracellular and intracellular fluids [21]. Correspondingly, Figure 3 also shows that the G and X values of fresh goji berries increase with rising frequency, exhibiting a trend where the magnitude of change is diminished at higher frequencies.
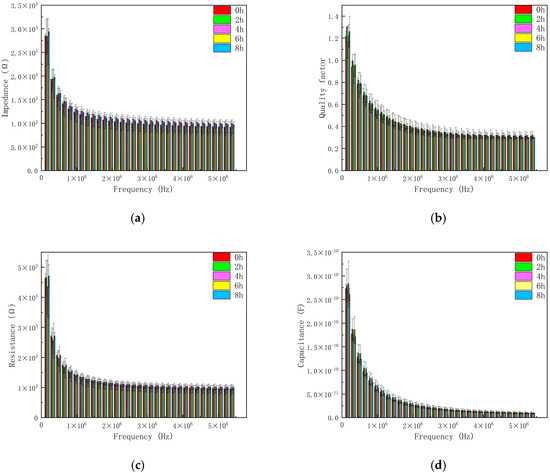
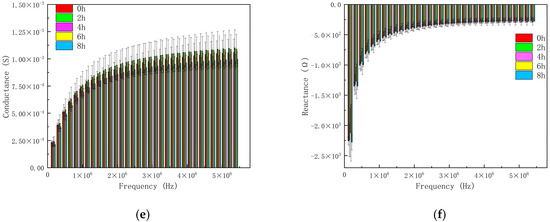
Figure 3.
The changes in electrical parameters of fresh goji berries under different storage times. (a) The impedance varies with frequency at different storage times; (b) the quality factor changes with frequency under different storage times; (c) the resistance varies with frequency at different storage times; (d) the capacitance varies with frequency at different storage times; (e) conductance varies with frequency at different storage times; (f) the change in reactance with frequency at different storage times.
Electrical parameters exhibited significant changes with storage duration. The regression equations relating electrical parameters to storage time t are shown in Table 2. At a frequency of 163–280 Hz, the Z, Q, Rp, Cp, G, and X values of fresh goji berries followed a polynomial curve model distribution with storage time t, with correlation coefficients R2 all exceeding 0.98.
3.3. Effect of Storage Temperature on the Quality Characteristics of Fresh Goji Berries
Storage temperature, as a critical storage condition, directly impacts food quality and flavor [22]. Table 5 shows significant differences in the quality characteristics of fresh goji berries at different temperatures. As storage temperature increased, fracturability, adhesiveness, and chewiness first decreased, then increased, and finally decreased again, reaching their maximum at 8 °C. Springiness and cohesiveness first increased, then decreased, peaking at 8 °C, while resilience continuously decreased. Hardness initially decreased then increased, peaking at 12 °C. Gumminess first decreased then increased, reaching its maximum at 12 °C. The soluble solids content of fresh goji berries was highest at 4 °C, reaching 20.22%. As temperature rose, the physiological activity of goji berries increased. Within this temperature range, elevated temperatures promote the conversion of bound water to free water, enhancing dielectric response through increased dipole polarization. Simultaneously, thermal kinetic energy accelerates the relaxation process, causing the relaxation peak to shift to higher frequencies. Concurrently, amylase breaks down starch and respiration consume glucose, resulting in a gradual decrease in soluble solids content. This may occur because starch is initially converted into soluble sugars by amylase during early storage, while increased respiratory rates later deplete these sugars [23]. Titratable acid content initially decreased then increased, peaking at 0.0079% at 12 °C. This may have resulted from the loss of organic acids and minerals due to low-temperature stress [24], a phenomenon also reported in tomatoes [25]. Fresh goji berries contain titratable acids, mainly malic and citric acid. Their accumulation and degradation are influenced by storage temperature. This is because temperature regulates the fruit’s internal physiological metabolism and chemical reactions.
Table 5.
The changes in the quality characteristics of fresh goji berries at different storage temperatures. Different lowercase letters above data points indicate statistically significant differences between groups (p < 0.05, following Tukey’s HSD post hoc test after one-way ANOVA).
The regression equation for the relationship between the quality characteristics of fresh goji berries and storage temperature T is shown in Table 3. The polynomial relationship revealed by this regression equation not only describes the quality deterioration process but also provides a foundational model for predicting quality changes under different storage conditions.
3.4. Effect of Storage Duration on the Quality Characteristics of Fresh Goji Berries
As storage time progresses, the quality characteristics of fresh goji berries undergo varying degrees of change under microbial influence [26]. Significant differences in quality traits are observed across different storage durations. The data in Table 6, analyzed through error values and significance tests, reveal that changes in texture and chemical properties exhibit clear patterns over time rather than random fluctuations. For instance, adhesiveness and resilience show distinct V-shaped trends, while other parameters such as springiness demonstrate more complex multi-stage variations. This systematic change provides objective evidence for interpreting the phased characteristics of quality alterations during storage.
Table 6.
The changes in the quality characteristics of fresh goji berries under different storage times. Different lowercase letters above data points indicate statistically significant differences between groups (p < 0.05, following Tukey’s HSD post hoc test after one-way ANOVA).
The regression equations for the quality characteristics of fresh goji berries versus storage time t are shown in Table 4. Our fitting analysis revealed that most quality indicators follow quadratic or cubic polynomial trends with storage time, demonstrating clear nonlinearity. This pattern means the quality of fresh goji berries changes through distinct phases, rather than in a simple linear manner, reflecting underlying physiological and biochemical processes. Springiness and cohesiveness, for instance, peaked at 4 h, likely from tissue contraction after initial water loss, before declining with further cellular damage and enzymatic activity. Titratable acidity, however, reached its maximum at 8 h, possibly concentrated by water evaporation or produced by activated metabolic pathways.
3.5. Correlation Between Dielectric Parameters and Quality Characteristics of Fresh Goji Berries at Test Frequency
In a study investigating the correlation between the dielectric properties of goji berries and storage duration [27], different characteristic frequencies corresponded to distinct dielectric parameters [28]. When the sample preservation temperature was set to 0 °C, the preservation time to 0 h, and the specific test frequency to 163,280 Hz, the electrical parameters and quality characteristics are shown in Table 7. The strong correlations suggest that reactance (X) and quality factor (Q) are promising predictors for tracking textural changes in fresh goji berries, as they appear sensitive to cellular structural degradation. This structural change, which alters the fruit’s electrical properties, is captured by X and Q, thereby reflecting mechanical properties. In contrast, parameters like impedance (Z) and conductance (G) show no significant correlation, likely because they represent broader electrical properties. Based on the principle of least squares, regression analysis was performed on the quality characteristics of fresh goji berries and their electrical parameters at specific test frequencies [29]. The regression results are shown in Table 8. In summary, the fracturability, springiness, and cohesiveness of fresh goji berries are correlated with their electrical parameters at specific test frequencies (R = 0.999).
Table 7.
The correlation between the electrical parameters and quality characteristics of fresh goji berries at a specific test frequency.
Table 8.
The regression equations with a significant correlation between the electrical parameters and quality characteristics of fresh goji berry.
3.6. ANN Model Construction and Performance Analysis
3.6.1. Training Results
This study employed the LM algorithm to evaluate model performance, which trains the dataset iteratively. To evaluate the model’s generalization capability, we randomly split the dataset into training and testing sets at an 80:20 ratio. To ensure consistent class distribution, stratified sampling was employed for classification tasks. All reported model performance metrics utilized cross-validation with k = 5. A feedforward artificial neural network model was developed, utilizing dielectric properties as input with a three-layer architecture. The model was trained on 70% of the dataset and tested on the remaining 20%, achieving a coefficient of determination R2 of 0.96 on the test set. This validated the model’s practical application potential in non-destructive quality assessment, enabling evaluation by directly converting dielectric measurements into quality predictions. The number of input layer nodes equals the dimension of the input vector. All input signals are transmitted to each hidden layer node as weighted sums and processed through activation functions; the signal processing from the hidden layer to the output layer follows the same procedure. As shown in Figure 4, the average accuracy of the training data (R2 = 0.98) indicates that this model can be used for predicting data in subsequent analyses [30].
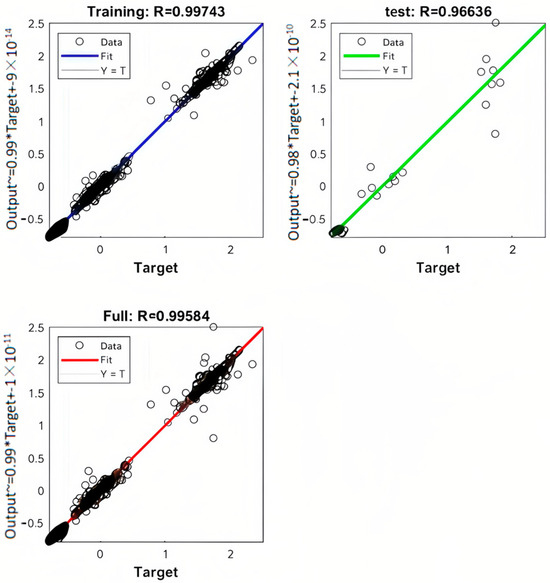
Figure 4.
The results of model training.
3.6.2. Prediction Results and Analysis of Fresh Goji Berry Quality Indicators Based on ANN Models
Using an ANN model, multiple quality indicators of fresh goji berries were predicted at five time points under four temperature conditions (0 °C, 4 °C, 8 °C, and 12 °C), including hardness, fracturability, springiness, cohesiveness, chewiness, and soluble solids content (SSC). Systematic comparisons were conducted between predicted and actual measured values, with results shown in Figure 5. Across various storage temperatures and durations, the model’s predictions for quality indicators (a–f) showed excellent agreement with actual measurements. The correlation coefficients (R2) were above 0.97, and the mean square errors (MSE) were below 5%. This indicates the model’s overall excellent predictive performance and high reliability. However, the model performed poorly when predicting adhesiveness, gumminess, and resilience based on dielectric parameters, exhibiting significant errors between predicted and measured values. The R2 values for these parameters were all below 0.9, and the MSE exceeded 5%. Despite noticeable deviations in predicting certain indicators, this study generally validated the feasibility of using dielectric parameters to predict fresh goji berry quality characteristics. This study provides a theoretical foundation for future evaluations of fresh goji berry quality using electrical parameters. It also establishes a methodological basis for these assessments under different storage conditions.
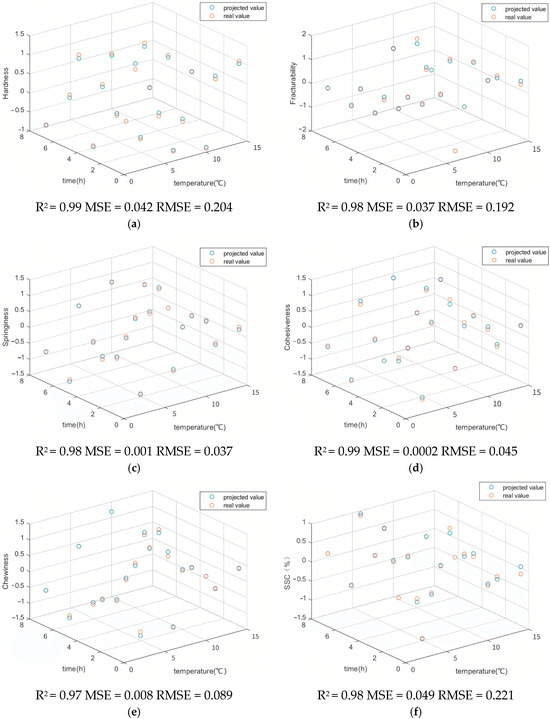
Figure 5.
The predicted values and actual values of fresh goji berries by the neural network. (a) Correlation coefficients and mean squared errors for goji berry hardness; (b) correlation coefficients and mean squared errors for goji berry fracturability; (c) correlation coefficients and mean squared errors for goji berry springiness; (d) correlation coefficients and mean squared errors for goji berry cohesiveness; (e) correlation coefficients and mean squared errors for goji berry chewiness; (f) correlation coefficients and mean squared errors for goji berry SSC.
3.7. Evaluation of LSSVM Model Predictive Performance
3.7.1. Training Results
This study uses the least squares support vector machine (LSSVM) method. This method first converts the inequality constraints of traditional SVMs into equality constraints and then solves the system using a least-squares approach. Original dielectric parameters serve as inputs, with a single quality characteristic as the output. The traditional slack variables are replaced by least-squares error terms, transforming the problem into a system of linear equations for solution. Data were randomly split into training and test sets at an 8:2 ratio. Results indicate excellent fitting performance during training (R = 0.96), but significantly degraded performance during testing (R = 0.44), demonstrating limited generalization capability. As shown in Figure 6.
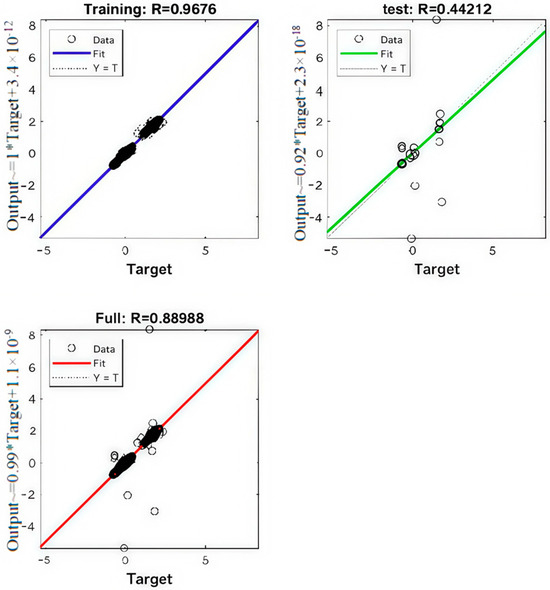
Figure 6.
The results of model training.
3.7.2. Evaluation of LSSVM Model Performance in Predicting Fresh Goji Berry Quality Indicators
The LSSVM model was employed to predict multiple quality indicators of fresh goji berries at five time points under four temperatures (0 °C, 4 °C, 8 °C, and 12 °C), with systematic comparisons conducted between predicted and actual measured values. Results shown in Figure 7 indicate that the model demonstrated good predictive performance for hardness (a), springiness (c), cohesiveness (d), and soluble solids content (SSC) (f) under different temperature and time conditions, with correlation coefficients R2 exceeding 0.94. However, the prediction accuracy for fracturability (b) and chewiness (e) was lower, with R2 values below 0.9.
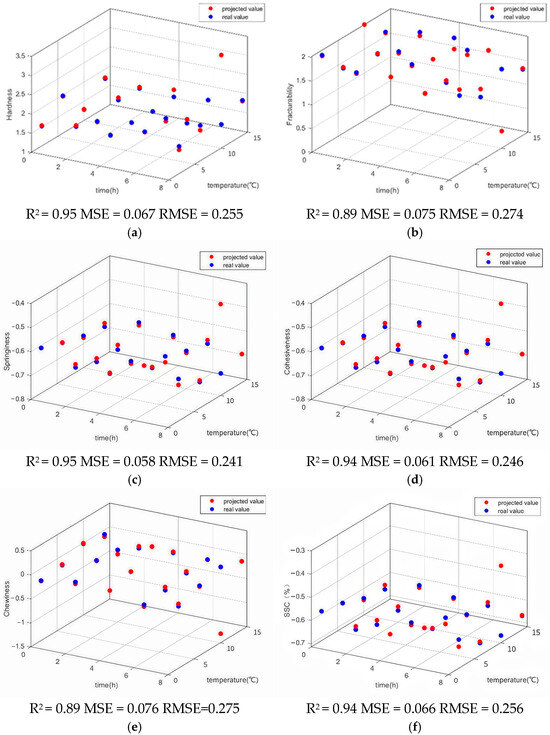
Figure 7.
The predicted values and actual values of fresh goji berry by the neural network. (a) correlation coefficients and mean squared errors for goji berry hardness; (b) correlation coefficients and mean squared errors for goji berry fracturability; (c) correlation coefficients and mean squared errors for goji berry springiness; (d) correlation coefficients and mean squared errors for goji berry cohesiveness; (e) correlation coefficients and mean squared errors for goji berry chewiness; (f) correlation coefficients and mean squared errors for goji berry SSC.
Overall, the LSSVM-based regression prediction model demonstrated good predictive capability for most quality characteristics of fresh goji berries, indicating that dielectric parameters can be effectively used to evaluate their quality. However, the model showed poor prediction accuracy for certain indicators (e.g., fracturability and chewiness), suggesting limitations in its applicability for these aspects.
3.8. The ANFIS Regression Model Serves as the Reference Benchmark
To further validate the performance of the artificial neural network (ANN) and least squares support vector machine (LSSVM) models, the traditional neural fuzzy inference system (ANFIS) model was employed as a benchmark reference. The ANFIS model effectively integrates the learning capabilities of neural networks with the intuitive linguistic reasoning characteristics of fuzzy logic, making it a powerful and widely recognized tool for modeling complex nonlinear systems. As shown in Figure 8, the ANFIS model demonstrated moderate predictive capability for goji berry quality indicators. However, its performance consistently lagged significantly behind both the ANN and LSSVM models across all key metrics. For instance, the R2 values predicted by ANFIS were notably lower (ranging from 0.69 to 0.89), while the root means square error values were markedly higher than those of the other two models. Systematic comparisons reveal that while ANFIS captures fundamental trends, the specialized architectures of ANN and LSSVM demonstrate significant advantages in effectiveness and accuracy for the specific task of predicting goji berry quality based on dielectric properties. Compared to established benchmark models, the proposed model exhibits superior performance, strongly highlighting its innovation and practical value.
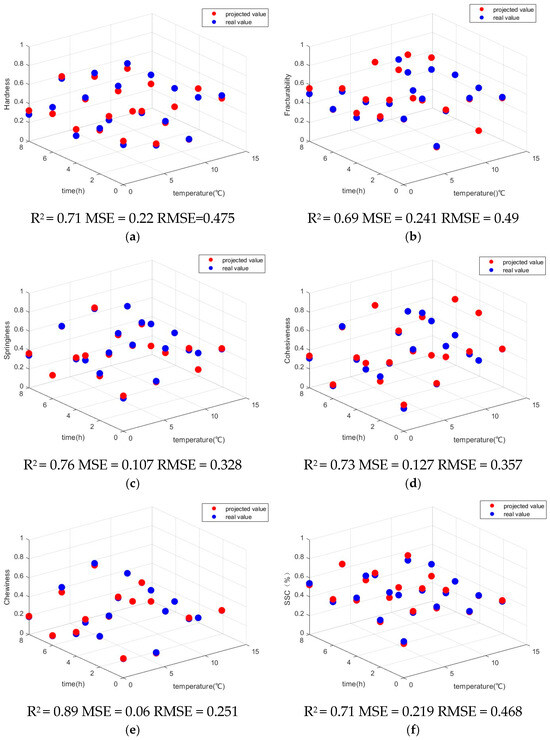
Figure 8.
The predicted values and actual values of fresh goji berry by the neural network. (a) Correlation coefficients and mean squared errors for goji berry hardness; (b) correlation coeffi-cients and mean squared errors for goji berry fracturability; (c) correlation coefficients and mean squared errors for goji berry springiness; (d) correlation coefficients and mean squared errors for goji berry cohesiveness; (e) correlation coefficients and mean squared errors for goji berry chewiness; (f) correlation coefficients and mean squared errors for goji berry SSC.
3.9. Model Comparison Analysis
This study systematically evaluated and compared the performance of artificial neural network (ANN) and least squares support vector machine (LSSVM) models in predicting the quality attributes of fresh goji berries based on dielectric parameters. To comprehensively quantify model performance, the coefficient of determination (R2) and mean squared error (MSE) were employed as core evaluation metrics, and their generalization ability and overfitting risks were thoroughly investigated.
Statistical results indicated that the ANN model demonstrated high accuracy and robustness in predicting hardness, fracturability, springiness, cohesiveness, chewiness, and soluble solids content (SSC) (R2 > 0.97, MSE < 5%). In contrast, the LSSVM model performed well in predicting hardness, springiness, and SSC (R2 > 0.93), but showed significantly larger errors in predicting fracturability (R2 = 0.89) and chewiness (R2 = 0.89), indicating its limited capability in capturing the complex nonlinear relationships between these indices and the dielectric parameters. Sensitivity analysis of connection weights based on artificial neural network models indicates that capacitance (Cp) and reactance (X) are the most influential predictors. The quality factor (Q) is also significant, particularly in brittleness prediction, while impedance (Z) and resistance (Rp) exhibit moderate influence. Conductance (G) exhibits the weakest predictive capability, consistent with its previously observed lower correlations. These findings validate dielectric properties as effective surrogate indicators of internal quality and provide a basis for future feature selection.
In terms of robustness, the ANN model exhibited excellent generalization performance, albeit with a potential overfitting risk that was mitigated using early stopping. The LSSVM model, due to the inherent inductive bias of its structure, presented a lower overfitting risk; however, this was achieved at the cost of reduced ability to fit complex relationships, resulting in overall inferior accuracy.
In conclusion, the ANN model significantly outperformed the LSSVM model in both prediction coverage and comprehensive accuracy, making it a more reliable choice for constructing non-destructive quality detection models for fresh goji berries. Although the LSSVM model still holds application potential for certain core indicators, its performance limitations suggest that if selected, in-depth optimization of the kernel function and hyperparameters for specific prediction targets is essential. This study provides a solid foundation for model selection and clear directions for algorithmic improvement in quality evaluation based on dielectric properties.
4. Conclusions
This work systematically analyzed the dielectric parameters and quality characteristics of fresh goji berries across different storage conditions (0 °C, 4 °C, 8 °C, 12 °C; 0–8 h) and established a corresponding quality prediction model. Our main findings are as follows:
Research indicates that the dielectric parameters of goji berries (such as Z, Q, etc.) exhibit systematic variations with testing frequency and storage conditions. High-precision polynomial models (R2 > 0.98) were established for all parameters in relation to storage duration, confirming their validity as effective indicators for monitoring physiological changes during goji berry storage. The quality characteristics of goji berries significantly depend on storage temperature and duration, with different indicators exhibiting optimal performance at specific temperatures: Most textural properties (springiness, cohesiveness, and chewiness) peak at 8 °C; soluble solids content reaches its maximum at 4 °C; and titratable acidity is highest at 12 °C. High-precision polynomial regression models were fitted between each quality parameter and temperature/time, demonstrating excellent predictive capability. At a characteristic frequency of 163,280 Hz, the quality factor Q and reactance X showed extremely significant correlations (R = 0.999) with key texture properties (fracturability, springiness, and cohesiveness). The underlying mechanism lies in the fact that changes in cell wall integrity and water migration during storage directly alter tissue microstructure, thereby synchronously affecting mechanical properties and dielectric response. This lays a solid foundation for achieving non-destructive, rapid quality detection of goji berries. Model comparisons demonstrate that ANNs exhibit superior performance in predicting multiple quality indicators (R2 > 0.97, MSE < 5%), with significantly better overall capability and reliability than LSSVMs. This confirms their immense potential as the core algorithm for non-destructive quality assessment of goji berries.
In summary, the ANN model based on dielectric properties offers a highly accurate solution for non-destructive monitoring of goji berry post-harvest quality. Its value lies in its potential to replace cumbersome laboratory testing methods, enabling rapid online grading and quality monitoring compared to the RGB and hyperspectral imaging proposed by Tsaniklidis et al. [31]. Future work will focus on two aspects: first, optimizing lightweight models for embedded device development; second, extending this technical framework to other high-value fruits and vegetables to advance the practical industrial application of intelligent post-harvest detection technologies for produce.
Author Contributions
Conceptualization, X.Q. and G.M.; methodology, G.M. and F.W.; software, X.M. (Xiaobin Mou) and X.M. (Xin Meng); validation, F.W., X.H., Z.L., and X.J.; formal analysis, X.Q.; investigation, G.M.; resources, F.W.; data curation, X.M. (Xiaobin Mou); writing—original draft preparation, X.Q. and F.W.; writing—review and editing, X.Q., G.M., F.W., X.H., X.M. (Xin Meng), Z.L., X.J., and Z.Z.; visualization, X.J.; supervision, F.W. and X.H.; funding acquisition, F.W., X.H., and X.M. (Xiaobin Mou). All authors have read and agreed to the published version of the manuscript.
Funding
This research was funded by the National Natural Science Foundation of China fund project grant number 32160426 and the Gansu Province Rural Revitalization Special Fund project grant number 25CXNA054. The APC was funded by Fangxin Wan. This research was funded by the Gansu Province University Industry Support Program (2024CYZC-35), the University Teachers’ Innovation Fund of Gansu Province, China (2024A-050), and the University Teachers’ Innovation Fund of Gansu Province, China (2025B-093).
Institutional Review Board Statement
Not applicable.
Informed Consent Statement
Not applicable.
Data Availability Statement
The original contributions presented in this study are included in the article. Further inquiries can be directed to the corresponding author.
Acknowledgments
We thank the scientific research team for agricultural mechanization and automation at Gansu Agricultural University for their help and encouragement.
Conflicts of Interest
The authors declare that they have no known competing financial interests or personal relationships that could appear to influence the work reported in this paper.
References
- De Souza, V.R.; Pereira, P.A.P.; da Silva, T.L.T.; de Oliveira Lima, L.C.; Pio, R.; Queiroz, F. Determination of the Bioactive Compounds, Antioxidant Activity and Chemical Composition of Brazilian Blackberry, Red Raspberry, Strawberry, Blueberry and Sweet Cherry Fruits. Food Chem. 2014, 156, 362–368. [Google Scholar] [CrossRef]
- Mikulic-Petkovsek, M.; Schmitzer, V.; Slatnar, A.; Stampar, F.; Veberic, R. Composition of Sugars, Organic Acids, and Total Phenolics in 25 Wild or Cultivated Berry Species. J. Food Sci. 2012, 77, C1064–C1070. [Google Scholar] [CrossRef]
- Bian, H.; Tu, P.; Hua-li, X.; Shi, P. Quality Predictions for Bruised Apples Based on Dielectric Properties. J. Food Process. Preserv. 2019, 43, e14006. [Google Scholar] [CrossRef]
- Sherwin, C.P.; May, C.E. Concerning the Sugar Content of Watermelons. J. Ind. Eng. Chem. 1912, 4, 585–588. [Google Scholar] [CrossRef][Green Version]
- Sun, T.; Wang, N.; Wang, C.; Ren, J. Effect of Hot Air Temperature and Slice Thickness on the Drying Kinetics and Quality of Hami Melon (Cantaloupe) Slices. Sci. Rep. 2024, 14, 29855. [Google Scholar] [CrossRef]
- Urvashi; Zeeshan; Daya, K.S.; Doneria, P. Measurement of Dielectric Properties of Biological Materials Using Co-Axial Fork-Type Probe. IEEE Sens. J. 2019, 19, 10482–10489. [Google Scholar] [CrossRef]
- Everard, C.D.; Fagan, C.C.; O’Donnell, C.P.; O’Callaghan, D.J.; Lyng, J.G. Dielectric Properties of Process Cheese from 0.3 to 3 GHz. J. Food Eng. 2006, 75, 415–422. [Google Scholar] [CrossRef]
- Bajd, F.; Škrlep, M.; Čandek-Potokar, M.; Serša, I. MRI-Aided Texture Analyses of Compressed Meat Products. J. Food Eng. 2017, 207, 108–118. [Google Scholar] [CrossRef]
- Lin, F.; Chen, D.; Liu, C.; He, J. Non-Destructive Detection of Golden Passion Fruit Quality Based on Dielectric Characteristics. J. Appl. Sci. 2024, 14, 2200. [Google Scholar] [CrossRef]
- Althoff, H. Acid-base titration & electrometric titration methods. In ARCH PHARM; Wiley: Hoboken, NJ, USA, 1958. [Google Scholar]
- Zhang, N.; Jiang, H. Relationship between Soil Nutrients in Lycium barbarum Orchards and Fruit Quality. North. Hortic. 2006, 6, 34–36. Available online: https://kns.cnki.net/kcms2/article/abstract?v=uSrlZFhNZxKY3b4r9B8DDhgOYRgHB1dl4CwIYszYLrCXRIgxRNFUfKEhQyQGeOX-um6RH_jdkn-Hq_zplKjnvPHq__KDijNjPETTSVl34guE6tmtlbEDHpdVmikkIxvhdzoEu2XqNxCu2D73BQlWgEE1A1n3gwTVzoVSv0sskczRKMoutU3fEog==&uniplatform=NZKPT&language=CHS (accessed on 12 October 2025).
- Amoriello, T.; Ciccoritti, R.; Ferrante, P. Prediction of Strawberries’ Quality Parameters Using Artificial Neural Networks. Agronomy 2022, 12, 963. [Google Scholar] [CrossRef]
- Chen, A.; Fan, S.; Guan, W.; Xiong, J.; He, X. Artificial Neural Network Based on Microenvironmental Parameters for Quality Prediction of Kiwifruit in Storage and Transportation. Food Meas. 2024, 18, 8918–8930. [Google Scholar] [CrossRef]
- Mohammed, M.; Munir, M.; Aljabr, A. Prediction of Date Fruit Quality Attributes during Cold Storage Based on Their Electrical Properties Using Artificial Neural Networks Models. Foods 2022, 11, 1666. [Google Scholar] [CrossRef]
- Sampaio, P.S.; Almeida, A.S.; Brites, C.M. Use of Artificial Neural Network Model for Rice Quality Prediction Based on Grain Physical Parameters. Foods 2021, 10, 3016. [Google Scholar] [CrossRef] [PubMed]
- Jiao, Y.; Tang, J.; Wang, S.; Koral, T. Influence of Dielectric Properties on the Heating Rate in Free-Running Oscillator Radio Frequency Systems. J. Food Eng. 2014, 120, 197–203. [Google Scholar] [CrossRef]
- Bon, J.; Váquiro, H.; Benedito, J.; Telis-Romero, J. Thermophysical Properties of Mango Pulp (Mangifera indica L. Cv. Tommy Atkins). J. Food Eng. 2010, 97, 563–568. [Google Scholar] [CrossRef]
- Souza, M.A.; Bonomo, R.C.; Fontan, R.C.; Minim, L.A.; Coimbra, J.S.D.R. Thermophysical Properties of Jackfruit Pulp Affected by Changes in Moisture Content and Temperature. J. Food Process Eng. 2011, 34, 580–592. [Google Scholar] [CrossRef]
- Delgado, A.E.; Gallo, A.; De Piante, D.; Rubiolo, A. Thermal Conductivity of Unfrozen and Frozen Strawberry and Spinach. J. Food Eng. 1997, 31, 137–146. [Google Scholar] [CrossRef]
- Zhou, X.; Li, R.; Lyng, J.G.; Wang, S. Dielectric Properties of Kiwifruit Associated with a Combined Radio Frequency Vacuum and Osmotic Drying. J. Food Eng. 2018, 239, 72–82. [Google Scholar] [CrossRef]
- Zhbanov, A.; Lee, Y.S.; Son, M.; Kim, B.J.; Yang, S. Improved Hematology Analysis Based on Microfluidic Impedance Spectroscopy: Erythrocyte Orientation and Anisotropic Dielectric Properties of Flowing Blood. Anal. Chem. 2025, 97, 4871–4880. [Google Scholar] [CrossRef]
- Tao, J.; Zuo, J.; Watkins, C.B.; Bai, C.; He, X.; Liu, S.; Han, L.; Zhao, X.; Liu, Y.; Li, J.; et al. Low Storage Temperature Affects Quality and Volatile Compounds in Fresh Tomatoes. Food Chem. 2024, 460, 140400. [Google Scholar] [CrossRef] [PubMed]
- Li, X.; Zhou, Y.J.; Tang, R.F.; Wang, Y.; Jiang, Y.M.; Huang, X.M.; Ma, S.M.; Qu, H.X. Effects of Storage Temperature on Physiological Parametersand Nutritional Quality of Wolfberry Fruit. Food Ind. Technol. 2018, 39, 264–269+281. Available online: https://link.cnki.net/doi/10.13386/j.issn1002-0306.2018.14.050 (accessed on 12 October 2025).
- Fatchurrahman, D.; Amodio, M.L.; Colelli, G. Quality of Goji Berry Fruit (Lycium barbarum L.) Stored at Different Temperatures. Foods 2022, 11, 3700. [Google Scholar] [CrossRef]
- Ibrahim, R.; Rhani, S.A.; Buhri, A. Reduction of Chilling Injury in Tomato (Solanum lycopersicum) Using Different Postharvest (Pre-Storage) Treatments. Acta Hortic. 2013, 1012, 473–478. [Google Scholar] [CrossRef]
- Shi, Y.; Wei, C.H.; Chen, Z.J.; Hou, Y.T. Research progress on postharvest physiology and preservation technology of fresh goji berries. Preserv. Process. 2016, 16, 102–106. [Google Scholar]
- Li, X.L.; Kang, N.B.; Li, D.; Liu, X.L.; Jia, Y.H.; Li, F.; Wang, Y.Z.; Pan, Z.G. A Study on Relativity Dielectric Properties of Lycium Chinese and Storage Period. Agric. Mech. Res. 2015, 37, 136–140. Available online: https://link.cnki.net/doi/10.13427/j.cnki.njyi.2015.06.034 (accessed on 12 October 2025).
- Ahmed, J.; Ramaswamy, H.S.; Raghavan, V.G.S. Dielectric Properties of Indian Basmati Rice Flour Slurry. J. Food Eng. 2007, 80, 1125–1133. [Google Scholar] [CrossRef]
- Al-Saif, A.M.; Abdel-Sattar, M.; Aboukarima, A.M.; Eshra, D.H.; Górnik, K. Physico-Chemical Properties Prediction of Flame Seedless Grape Berries Using an Artificial Neural Network Model. Foods 2022, 11, 2766. [Google Scholar] [CrossRef]
- Huang, X.; Wang, H.; Qu, S.; Luo, W.; Gao, Z. Using Artificial Neural Network in Predicting the Key Fruit Quality of Loquat. Food Sci. Nutr. 2021, 9, 1780–1791. [Google Scholar] [CrossRef]
- Tsaniklidis, G.; Makraki, T.; Papadimitriou, D.; Nikoloudakis, N.; Taheri-Garavand, A.; Fanourakis, D. Non-Destructive Estimation of Area and Greenness in Leaf and Seedling Scales: A Case Study in Cucumber. Agronomy 2025, 15, 2294. [Google Scholar] [CrossRef]
Disclaimer/Publisher’s Note: The statements, opinions and data contained in all publications are solely those of the individual author(s) and contributor(s) and not of MDPI and/or the editor(s). MDPI and/or the editor(s) disclaim responsibility for any injury to people or property resulting from any ideas, methods, instructions or products referred to in the content. |
© 2025 by the authors. Licensee MDPI, Basel, Switzerland. This article is an open access article distributed under the terms and conditions of the Creative Commons Attribution (CC BY) license (https://creativecommons.org/licenses/by/4.0/).