Article

How Much Area of a Pear Orchard Can One Honey Bee Colony Pollinate?

1
State Key Laboratory of Resource Insects, Institute of Apicultural Research, Chinese Academy of Agricultural Sciences, Beijing 100193, China
2
College of Bioscience and Resource Environment, Beijing University of Agriculture, Beijing 102206, China
3
Shijiazhuang Animal Disease Prevention and Control Center, Shijiazhuang 050026, China
4
Hebei Ruiyuan Bee Industry Co., Ltd., Shijiazhuang 051230, China
5
Hebei Lezhitang Agricultural Technology Co., Ltd., Shijiazhuang 051530, China
*
Author to whom correspondence should be addressed.
These authors contributed equally to this work.
Agriculture 2025, 15(21), 2302; https://doi.org/10.3390/agriculture15212302
Submission received: 16 September 2025 / Revised: 28 October 2025 / Accepted: 4 November 2025 / Published: 5 November 2025
(This article belongs to the Section Crop Production)

Abstract

Pear trees, though self-pollinating, are self-incompatible and depend on insect pollination—primarily by honey bees. The optimal density of honey bee colonies per unit area in pear orchards remains uncertain, hindering scientific pollination management. This study in Zhao County, Hebei, compared honey bee (Apis mellifea ligustica), artificial, and natural pollination effects on pear yield and fruit size. Honey bee pollination achieved a higher, more stable fruit set (inflorescence fruit set rate was 71.52%), increased yield, and significantly improved fruit size—in transverse diameter (90.96 mm), longitudinal diameter (92.48 mm), and single-fruit weight (407.39 g)—compared with natural pollination. Although the fruit set rates and fruit quality of bee-pollinated pears were not significantly higher than those of artificially pollinated pears, the data still demonstrated the advantages of honey bee pollination. One bee colony (containing ~20,000 honey bees) was found to pollinate approximately 3846.5 m2 of a pear orchard. This provides data-supported guidance for the scientific allocation of pollinating honey bee colonies in future pear orchard pollination practices.

1. Introduction

The pear (Pyrus spp.), one of the three largest temperate fruits, is widely cultivated in the Temperate Zone area including Asia, Europe, and North America [1]. In 2023, a total of 26.51 million tons of pears were produced in the world, with a pear planting area of 1.32 million hectares [2]. In China alone, a total of 19.954 million tons of pears were produced, accounting for 75.27% of the world production volume of pears in that year [3].
Pear trees are self-infertile fruit trees [4]. Therefore, pear cultivation requires rational allocation of pollinizer varieties as well as supplemental pollination to ensure a high yield, stable production, and good fruit quality [5]. Currently, the primary supplemental pollination methods for pear trees include traditional manual pollination, insect-mediated pollination, and drone-assisted pollination [6,7,8,9]. It is reported that approximately 50% of pear growers adopt manual pollination to address pollination challenges in production in China [10]. Although manual pollination serves as an effective technique to improve fruit setting rates, traditional manual pollination suffers from multiple drawbacks, including being time-consuming, labor-intensive, uneven pollination coverage, and high production costs [8,11]. Additionally, the short flowering period of pear trees leaves a tight timeframe for manual pollination. This not only competes with other agricultural activities for labor resources, but also leads to seasonal labor shortages in major pear-producing regions during pollination seasons, significantly increasing production costs for growers [8,11]. Drone-assisted pollination has begun to be used in some pear orchards in China. However, it has not been widely adopted due to high technical requirements and weather constraints.
The physiological trait of self-incompatibility in pear trees necessitates reliance on external assistance for successful reproduction and fertilization. Honey bees are the most important pollinators [12]. Globally, around 75% of crops depend on honey bee pollination [12]. Particularly in current agricultural production, honey bee pollination significantly increases planting revenues by enhancing the fertilization and fruit-set rates of crops, boosting yields, improving quality, and reducing the cost of manual pollination [12]. Given that manual pollination hinders industrial-scale pear cultivation, honey bee pollination demonstrates significant potential for pear orchards [13,14]. Although the scent of pear blossoms is not the most attractive to honey bees, it does not compromise their effectiveness in pollinating these flowers. The analysis of pollen loads of bees collected at pear flowers in blooming pear plantations showed that fidelity was as high as 89–90% towards pear, which is perfectly high [15]. Also, a study on the foraging behavior of honey bees in pears showed that overwhelming majority of honey bees visiting the flowers of 13 pear cultivars in 1996 were pollen gatherers (95.6%) [15]. Accordingly, honey bees could be much more important and effective pollinating agents of pear cultivars than generally believed [12,15,16]. At present in China, people are aware of the importance of honey bee pollination, and increasingly, more pear orchards are employing honey bees for pollination, considering their efficiency. Wang et al. found that honey bee pollination significantly increased the number of fruits per inflorescence in pears in China [17]. Studies indicate that honey bee-pollinated pear trees exhibit significantly higher fruit setting rates compared with natural pollination [13,17]. Honey bee-pollinated fruits also show increased single-fruit weight, volume, and diameter [13,17]. However, with the large-scale production and concentrated regional planting of the pear tree industry, the number of pollinating honey bee colonies in a certain area is insufficient to meet the pollination needs of pear trees, which affects the pollination efficiency and then affects the yield and quality of pears [18]. Therefore, studying the effect of honey bee pollination on pear trees and clarifying the demand for pollinating honey bee colonies per unit area in pear orchards to scientifically allocate pollinating honey bee colonies and improve the pollination effect have become the focus of our research.
In Zhao County, Hebei province, there is a Xuehua pear (Pyrus bretschneideri ‘Xue Hua’) planting area of 91,000 hectares, with an annual output value of 2.5 billion CNY [19]. However, the efficacy of honey bee pollination for Xuehua Pear and optimal hive allocation strategies for Xuehua orchards remain unclear. This study conducted a pollination experiment in a Xuehua pear orchard in Zhao County, Hebei Province, China, to assess the impact of honey bee pollination on Xuehua pear trees. The pollination efficacy of honey bees was evaluated by comparing fruit setting rates and fruit quality following artificial versus honey bee pollination. Then, the effective pollination area was determined by examining fruit setting rates at varying distances from beehives. This study provides practical guidance for rational deployment of pollination beehives in pear orchards in the future.

2. Materials and Methods

2.1. Site and Plant Materials

This study was conducted annually from 2023 to 2025 in the pear orchards that belonged to Zhao County (37.76° N, 114.78° E), Hebei province, China (Figure 1). This region is dominated by open fields, and orchards are located less than 1 km from the villages. Xuehua pear (Pyrus bretschneideri) was used as the main commercial cultivar, and Yali pear (Pyrus bretschneideri Rehd.) was planted as the main pollinizer cultivar. The pollinizer cultivar was planted in the same row as the main cultivar at a mean ratio of 1 pollinizer tree to 4 Xuehua pear trees. The orchards covered 4800 hectares with pear trees planted at 4 m × 4 m spacing. The pollination experiment was implemented in an area covered 400 hectares (2000 m × 2000 m) inside the orchard. The orchard was irrigated, and the soil management method was clean tillage. The average yield was approximately 3500 kg/667 m2, and the management level was relatively high. Each year, at the beginning of the flowering period, honey bee (Apis mellifera ligustica) colonies (~20,000 individuals per colony) were introduced. Each colony contained 4–5 brood combs. To stimulate the colony to collect pollen and nectar, only a small amount of pollen was kept in the colony, and only one honey comb was retained. Pear pollen was collected during the pear tree pollination period.

2.2. Comparison of Pollination Effects Between Different Methods

2.2.1. Pollination Treatment

To compare the pollination effects of different pollination methods on pear trees, we set up two experimental groups, namely the artificial pollination group and the honey bee pollination group, with natural pollination as the blank control. Three groups of Xuehua pear trees with consistent growth were selected. On each tree, branches in two randomly selected directions from different parts of the crown were marked. In the honey bee pollination treatment group, about 200 colonies were provided in the pear orchard at a ratio of 1 beehive for <2000 m2 of pear trees. For the convenience of beekeepers’ management, these 200 colonies were placed in the same location. In the honey bee pollination group, 25 trees (5 trees in each group) were selected at about 50 m, 100 m, 200 m, 300 m and 500 m at straight-line distances from the pollinating honey bee colonies, respectively, to observe the honey bee pollination effect. In the artificial pollination group, 6 trees were randomly selected for artificial pollination in the pear orchard more than 3 km away from the honey bee pollination site (no artificially reared honey bees were found in the pear orchard areas more than 3 km away). The pollen used in the artificial pollination treatment (with a pollen germination rate of 71%) was mixed with corn starch at a ratio of 1:3. Artificial pollination should be conducted within 5 days after bloom, with the third day after bloom being the optimal timing. The best period for pollination is between 10:00 a.m. and 5:00 p.m. on clear days. One round of pollination is sufficient when flowers bloom uniformly, whereas an additional round may be applied if blooming is inconsistent. Typically, flowers pollinated on the day they open achieve the highest fruit set rate. During pollination, workers dipped a brush into pollen and gently dabbed each flower 2–3 times, proceeding branch by branch, from the inside to the outside and from the top to the bottom of each branch; it was impossible to visually determine whether a flower had completed artificial pollination right after dabbing, but since this dabbing method had been practiced locally for many years before honeybee or drone pollination was introduced, workers had extensive experience to guarantee the effectiveness of artificial pollination. For the natural pollination treatment, nylon net bags were put on the selected branches of 9 trees to prevent honey bee pollination. The experiment was repeated three times (from 2023 to 2025).

2.2.2. Fruit Set

Pear flowers form a corymb inflorescence. In the experiment, each inflorescence of pear flowers contained 5–7 flowers, with an average of 5 ± 0.78. We counted the inflorescence fruit set rate and flower fruit set rate separately. The inflorescence fruit setting rate and flower fruit setting rate were investigated once 14 days after pollination (first fruit setting rate of flowers) and during the physiological fruit drop period (28 days after pollination, second fruit setting rate of flowers). We counted the fruit flower ration under different treatments. The fruit setting rate was calculated using the following formula.
IFSR = TNEI/TNII × 100%
IFSR = Inflorescence fruit setting rate. TNEI = Total number of effective inflorescences. TNII = Total number of investigated inflorescences.
FSRF = TNFS/TNF × 100%
FSRF = Fruit setting rate of flowers. TNFS = Total number of fruits set. TNF = Total number of flowers.

2.2.3. Fruit Quality

To compare fruit quality under different pollination methods, we collected all fruits from our treatments approximately 160 days after pollination. We measured the fruit weight, size (height and diameter), and sugar concentration with reference to previous methods [20]. Specifically, 30 fruits were collected from each experimental tree in different directions (east, west, south, north, and center). Each treatment had three replicates (30 fruits per tree), resulting in a total of 270 fruits across all three treatments, which were brought back to the laboratory to measure the single-fruit weight and the transverse and longitudinal diameters of the fruits. Weight was measured using a digital balance with 0.1 g of precision (SHIMADZU, Beijing, China). Height and diameter were measured using a digital caliper with 0.1 mm of precision (Shanghai Tool Factory Co., Ltd., Beijing, China). The nutritional quality of pears was measured by mixing five pears each from different directions as a sample in each tree to determine the firmness, soluble solids, soluble sugar, and total acid content. Six samples in each pollonational treatment were measured totally. A GY-1 fruit firmness tester was used to measure the peeled fruit firmness. A handheld refractometer (Shanghai Tool Factory Co., Ltd., Beijing, China) was used to measure the soluble solids content [21]. The anthrone–sulfuric acid method was used to determine the soluble sugar content, and the titration method was used to measure the total acid content [22].

2.3. Comparison of Pollination Effects at Different Pollination Distances

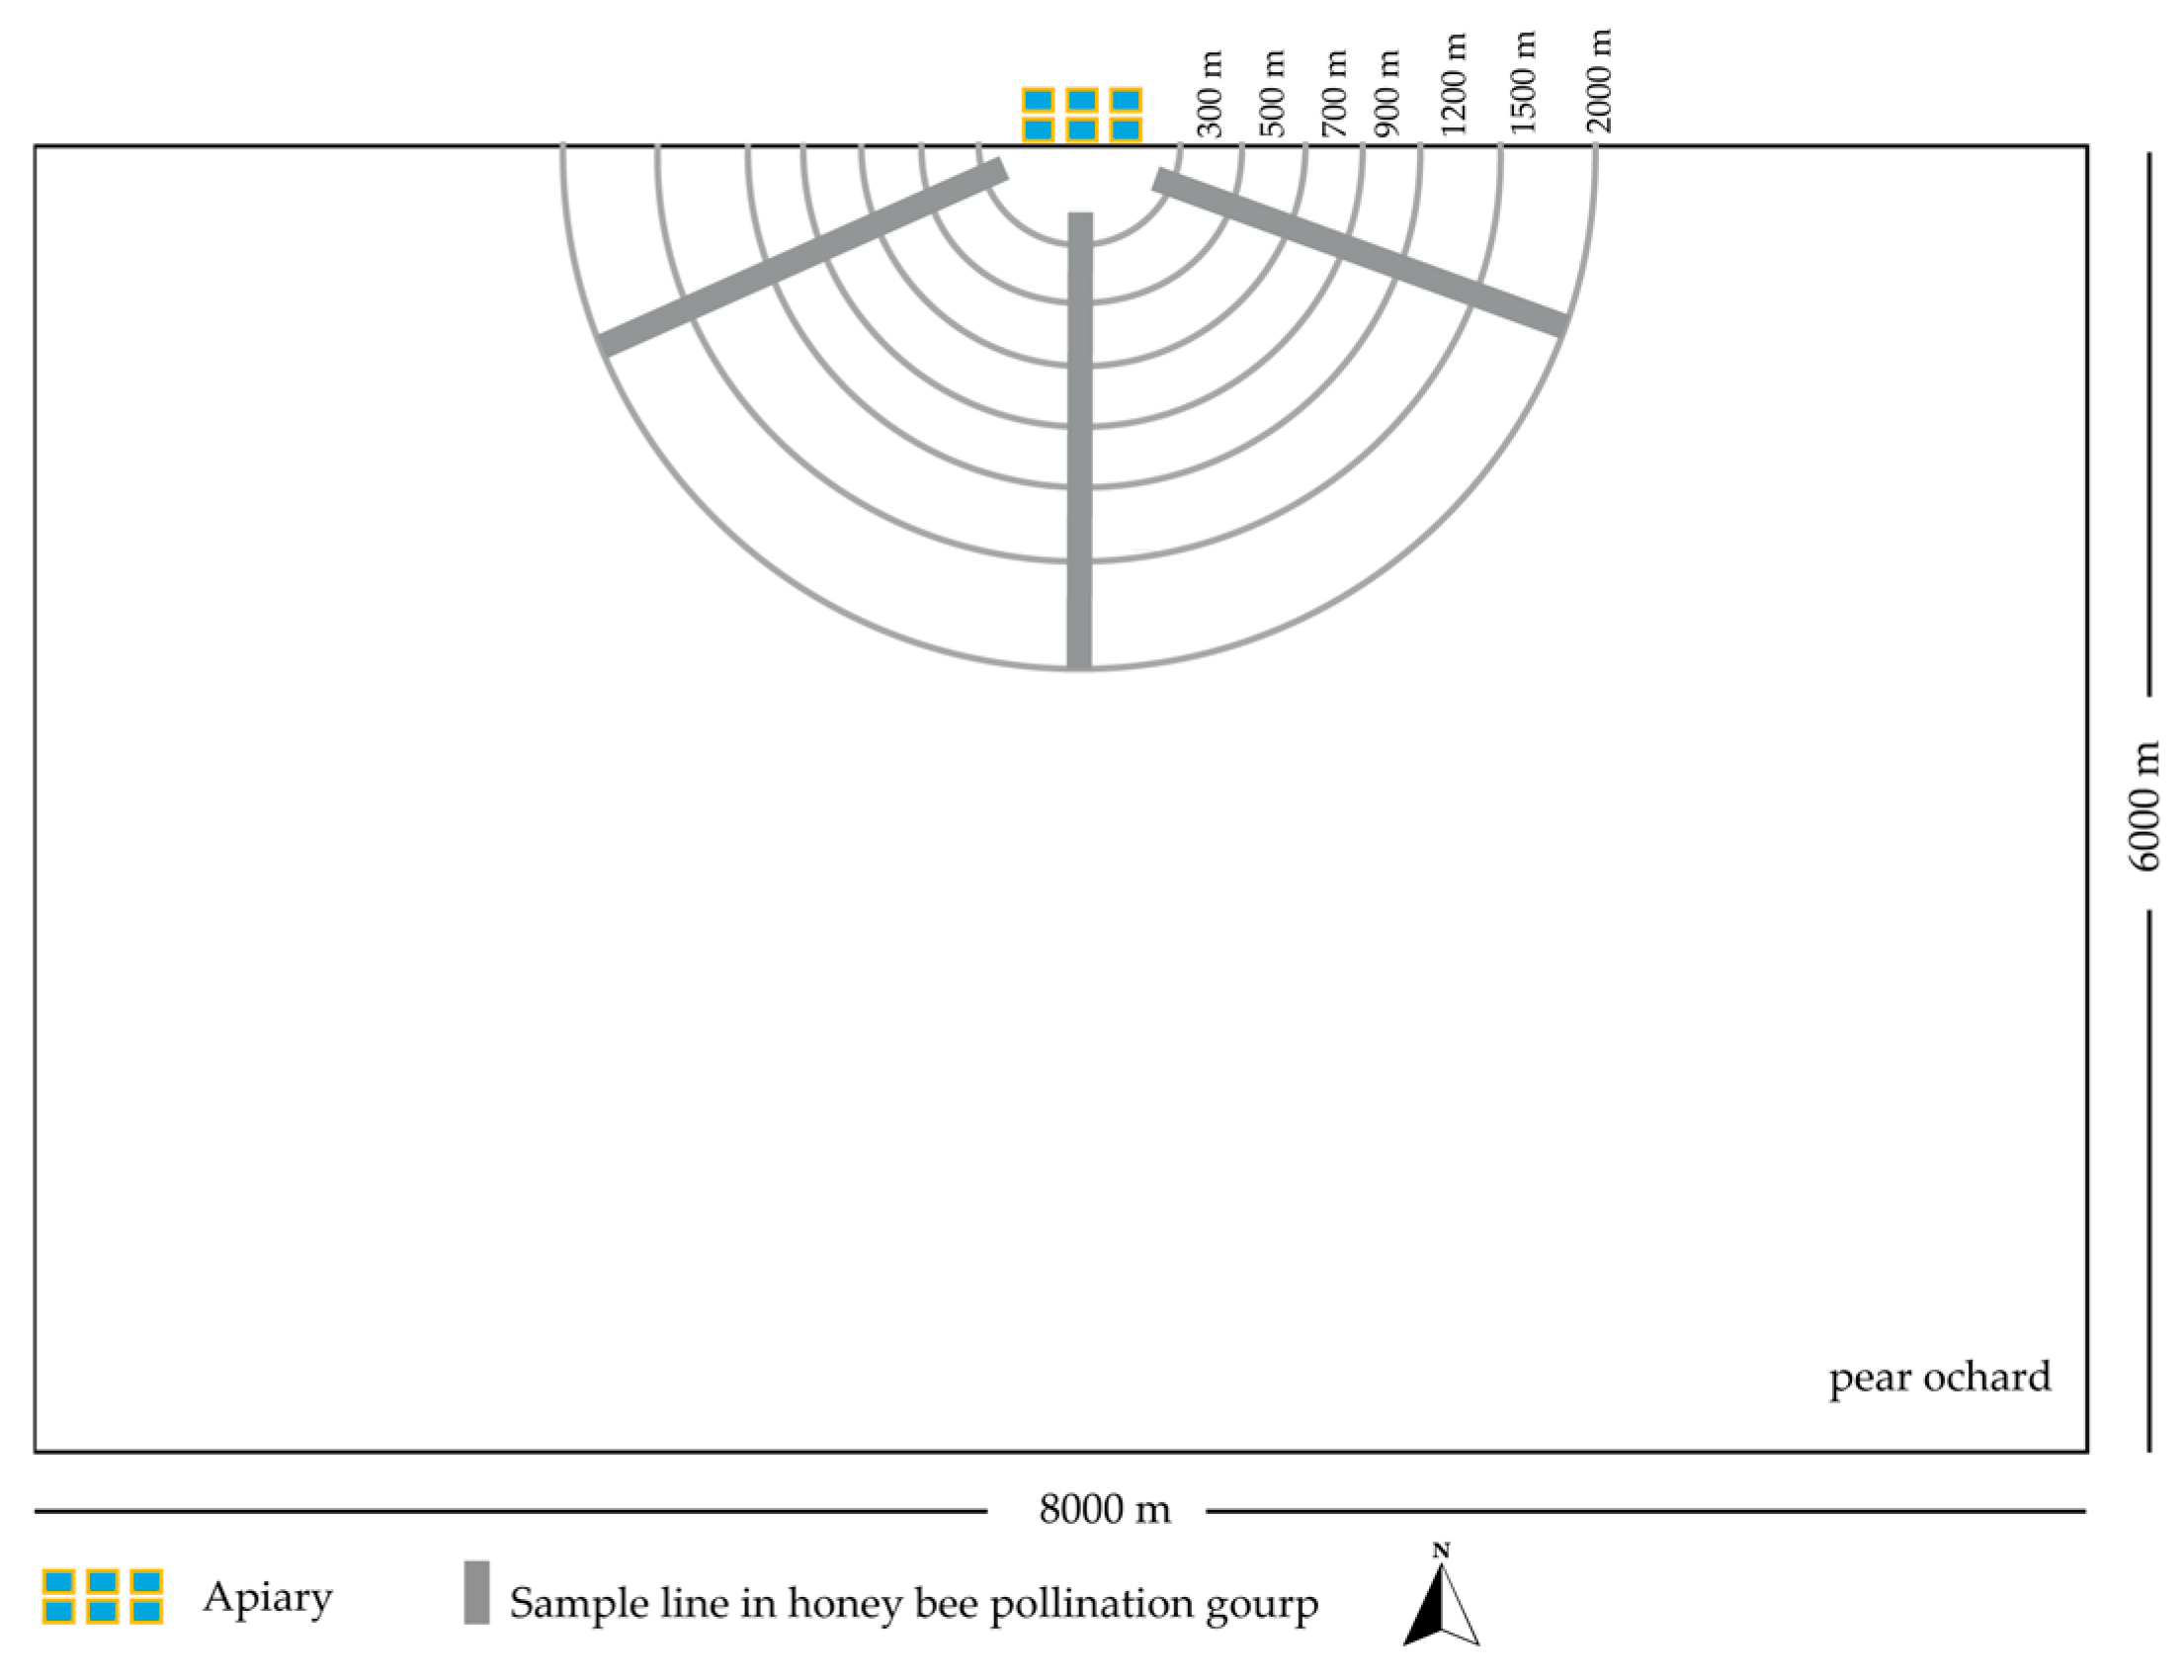
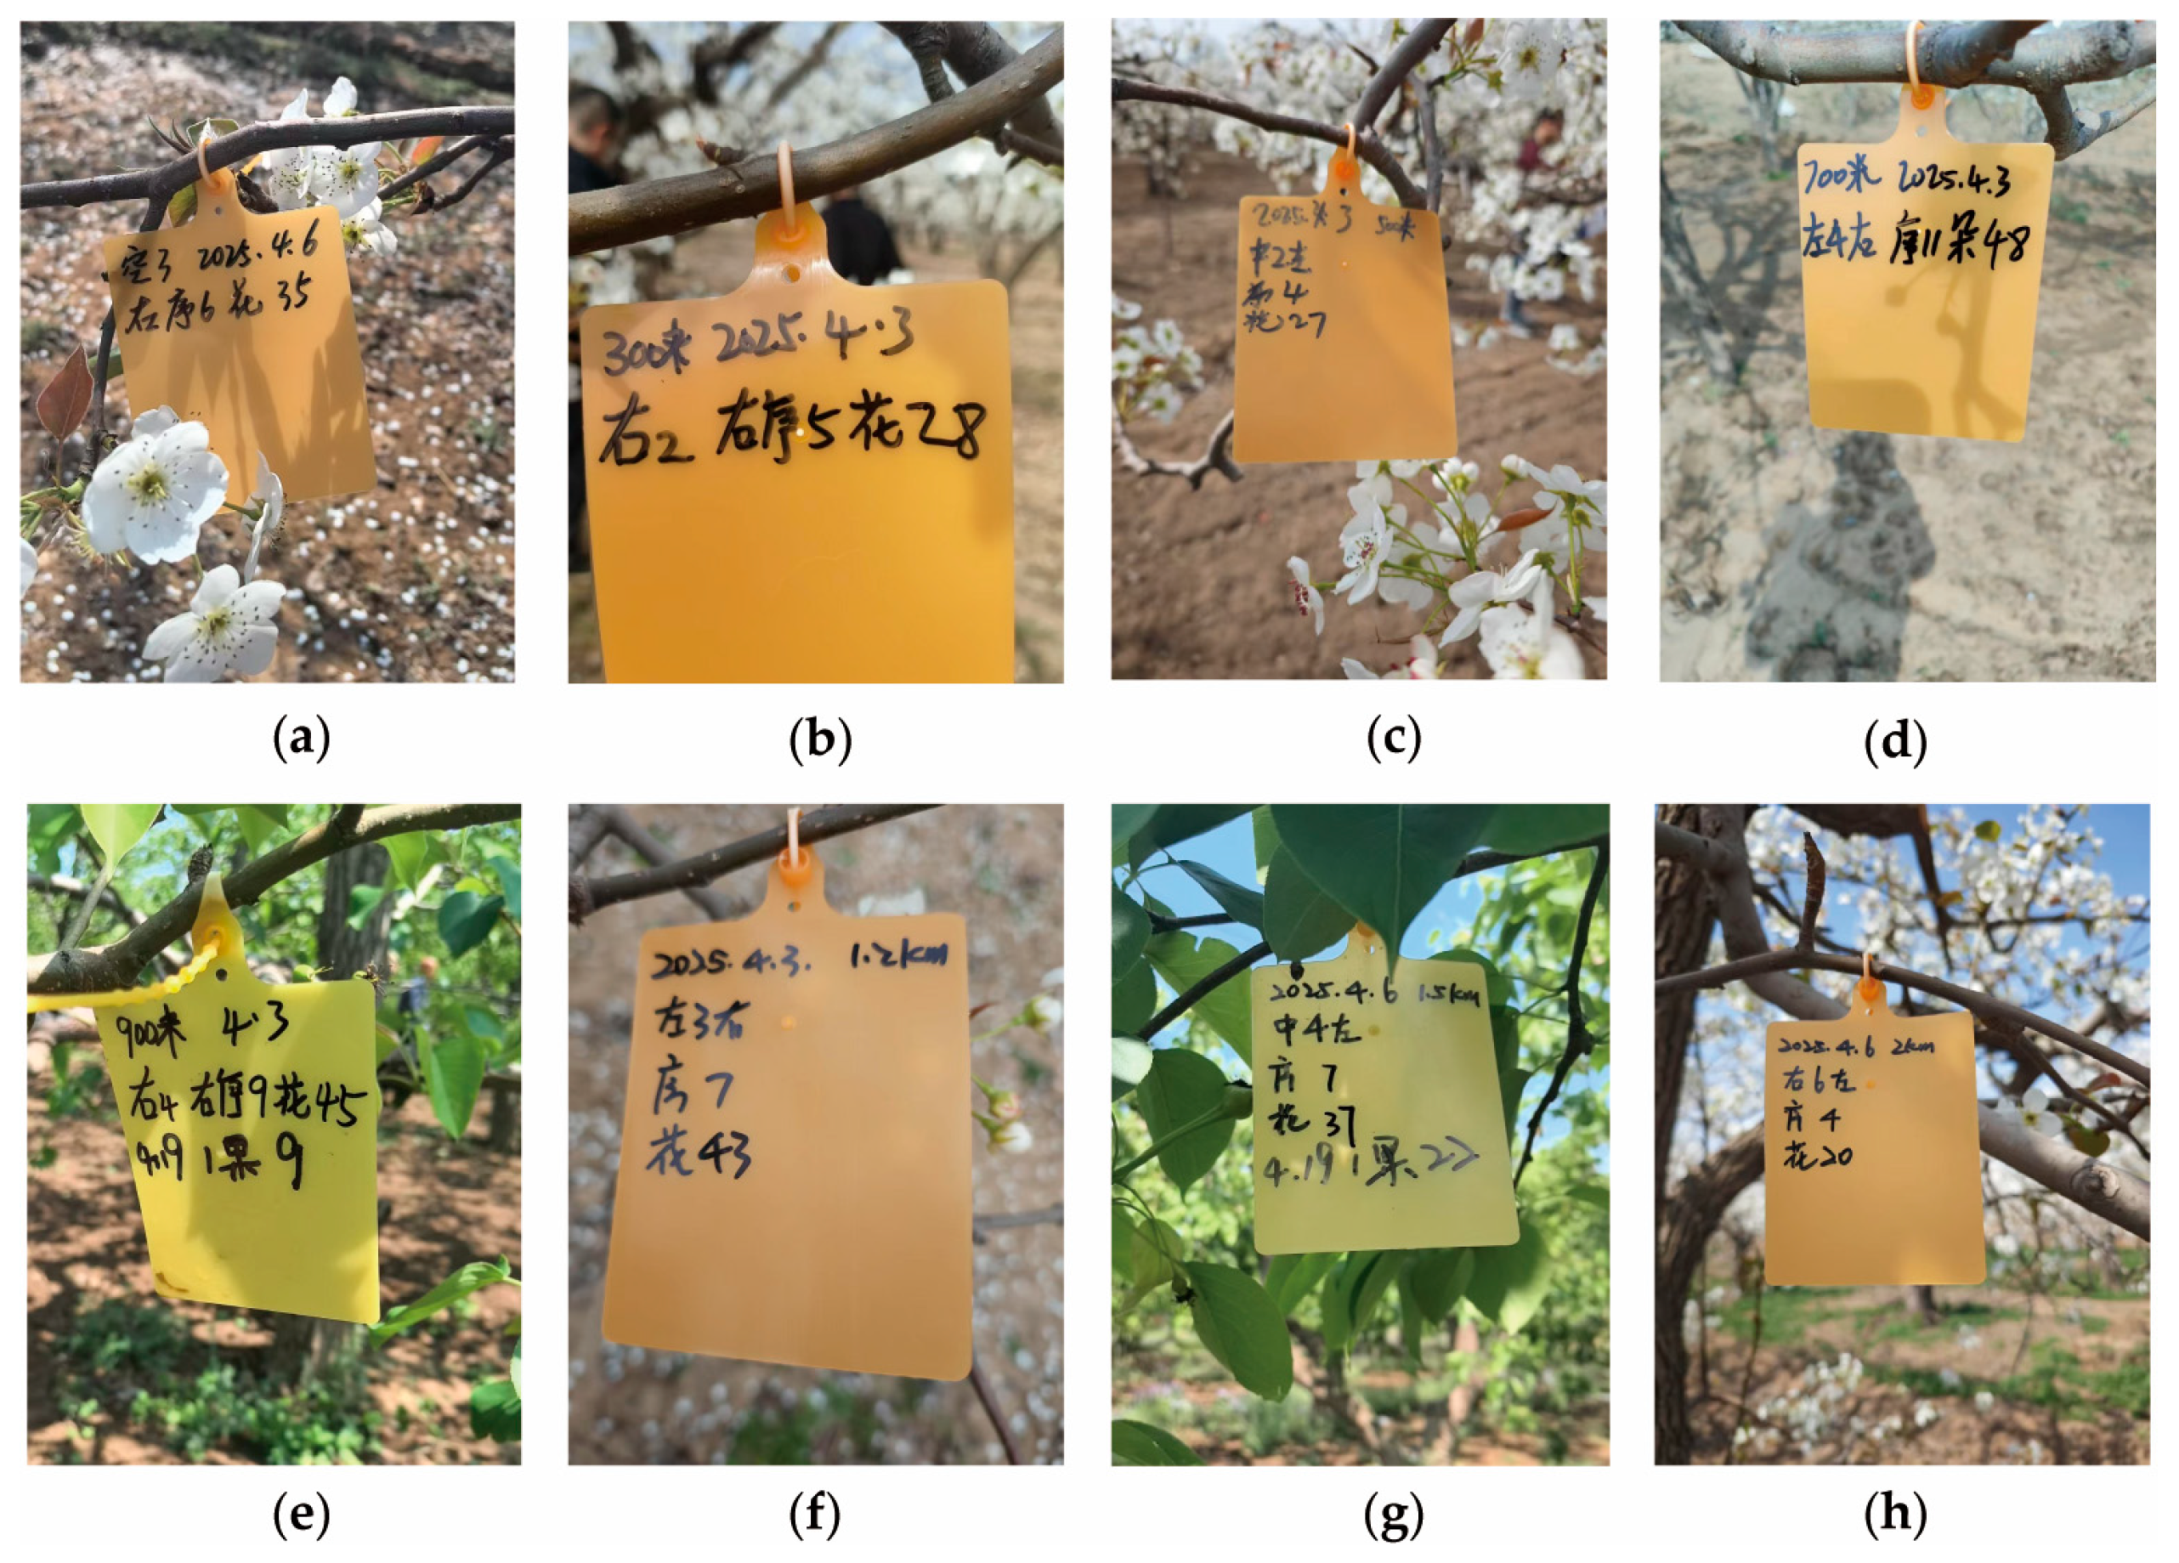
To determine the effective pollination area of honey bees, pear trees in the honey bee pollination treatment group were selected, pear trees (3~6 trees × 3 directions × 7 different distances) at approximately 300 ± 2 m, 500 ± 2 m, 700 ± 2 m, 900 ± 2 m, 1200 ± 2 m, 1500 ± 2 m, and 2000 ± 2 m in a straight-line distance from the pollination honey bee colonies, respectively, were selected, and the fruit setting rates were recorded (Figure 2 and Figure 3). The fruit setting rates of flowers were investigated once 14 days after the end of pollination for the first time and during the physiological fruit drop period (28 days after flowering) for the second time. The effective pollination area of the honey bee colony was determined by comparing the fruit setting rates of pear trees at different distances.

2.4. Data Analysis

The data were organized and subjected to significance analysis using Microsoft Excel 2021. For inferential statistics, a one-way analysis of variance (ANOVA) was performed using IBM SPSS Statistics 27.0.1, with mean separations carried out by Duncan’s multiple range test at an a priori significance level of p < 0.05.

3. Results

3.1. Effects of Different Pollination Methods on the Fruit Set Rate of Xuehua Pears

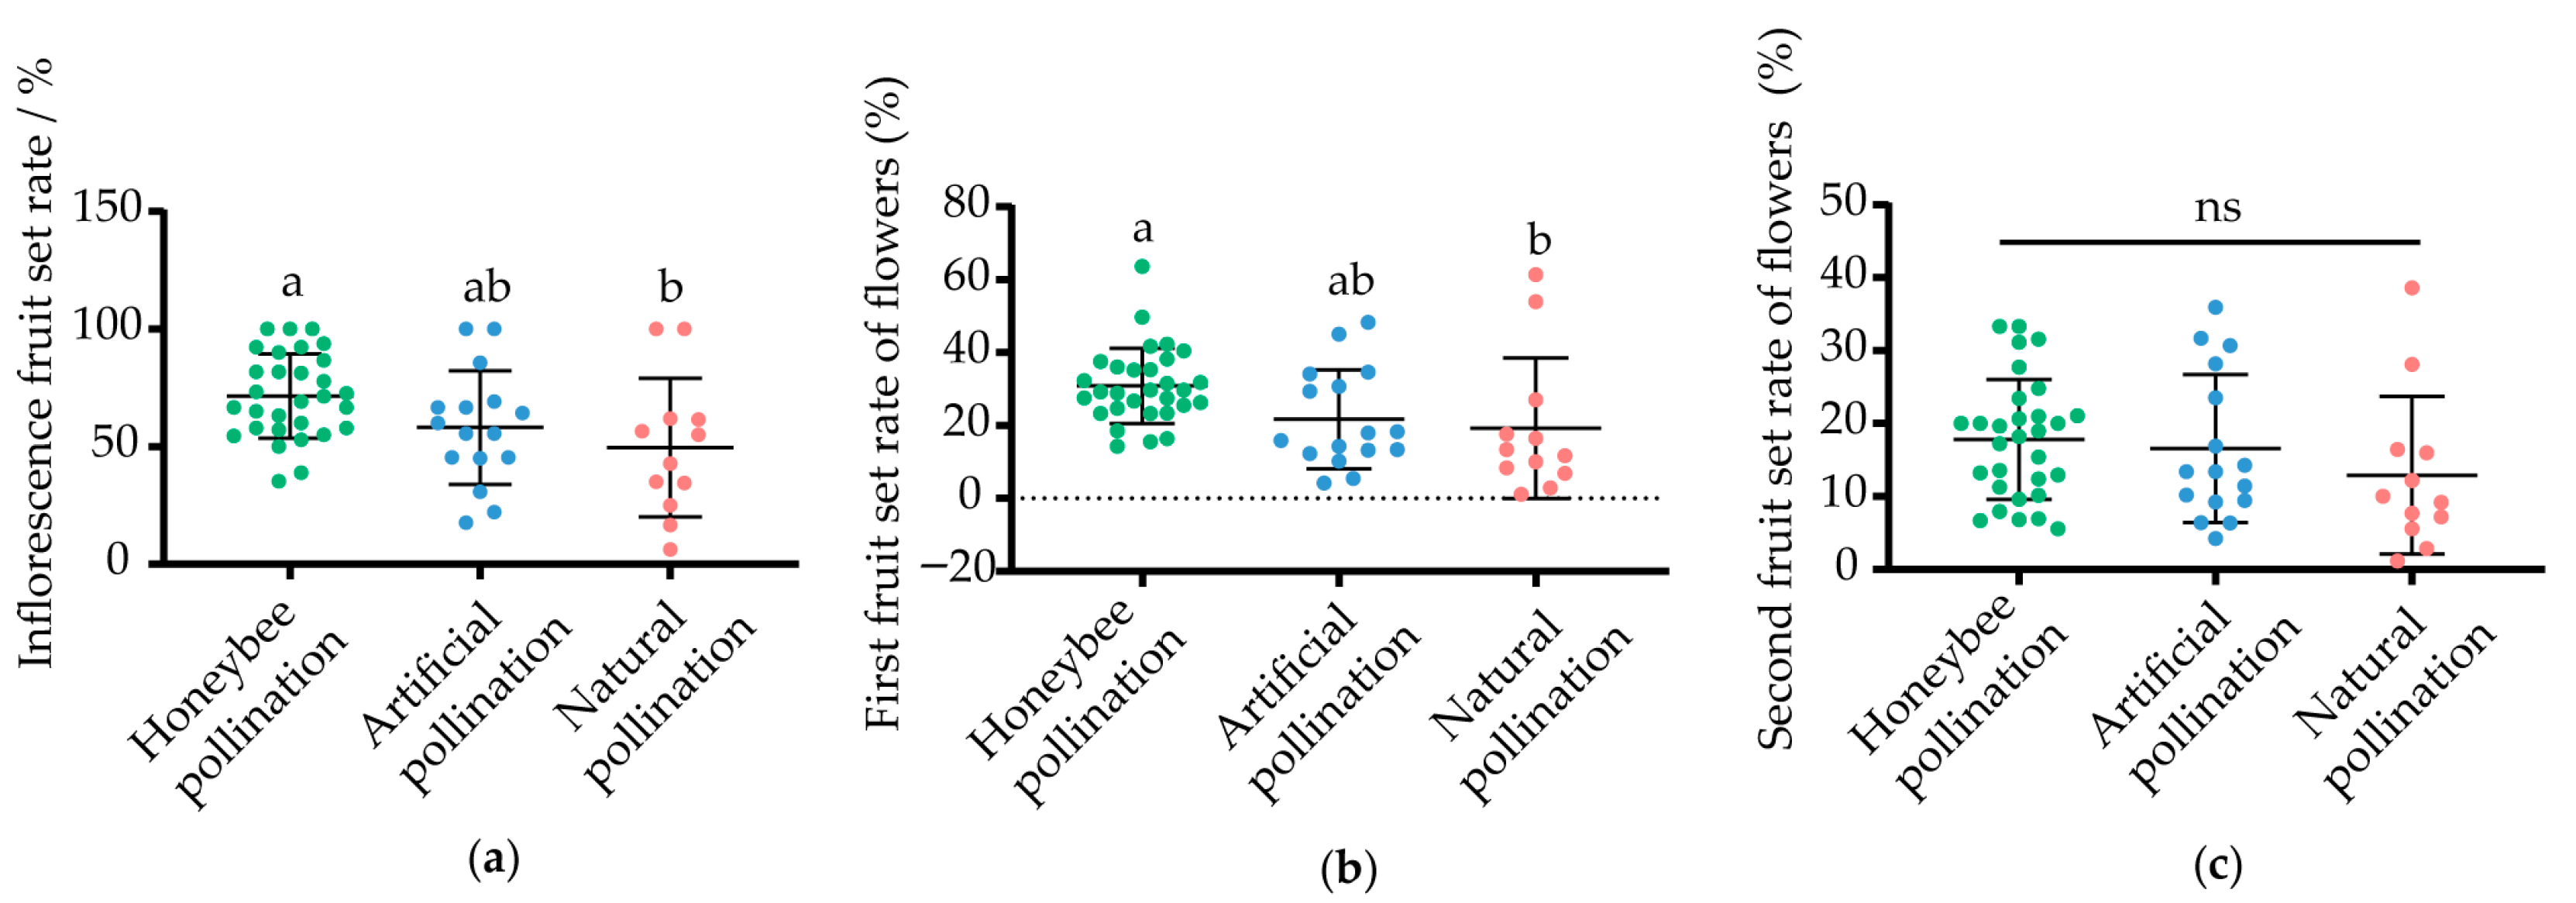
Pear fruit set showed significant differences under different pollination treatments (Figure 4). Pear flowers pollinated by honey bees had the highest fruit set (71.52 ± 17.64%), followed by pear flowers treated with artificial pollination (58.14 ± 23.03%) and natural pollination (49.61 ± 28.14%). Compared to natural pollination, bee pollination significantly increased first fruit set rate by 93.41% (p < 0.05) and second fruit set rate by 50.71% (p < 0.05). Pears pollinated by honey bees also had more stable fruit set (CV = 24.66% for inflorescence fruit set rate, CV = 33.02% for first fruit set rate of flowers, CV = 45.28% for second fruit set rate of flowers) than artificial (CV = 40.25% for inflorescence fruit set rate, CV = 60.49% for first fruit set rate of flowers, CV = 59.26% for second fruit set rate of flowers) or natural pollination (CV = 56.72% for inflorescence fruit set rate, CV = 96.05% for first fruit set rate of flowers, CV = 80.23% for second fruit set rate of flowers).

3.2. Effects of Different Pollination Methods on the Fruit Quality of Xuehua Pears

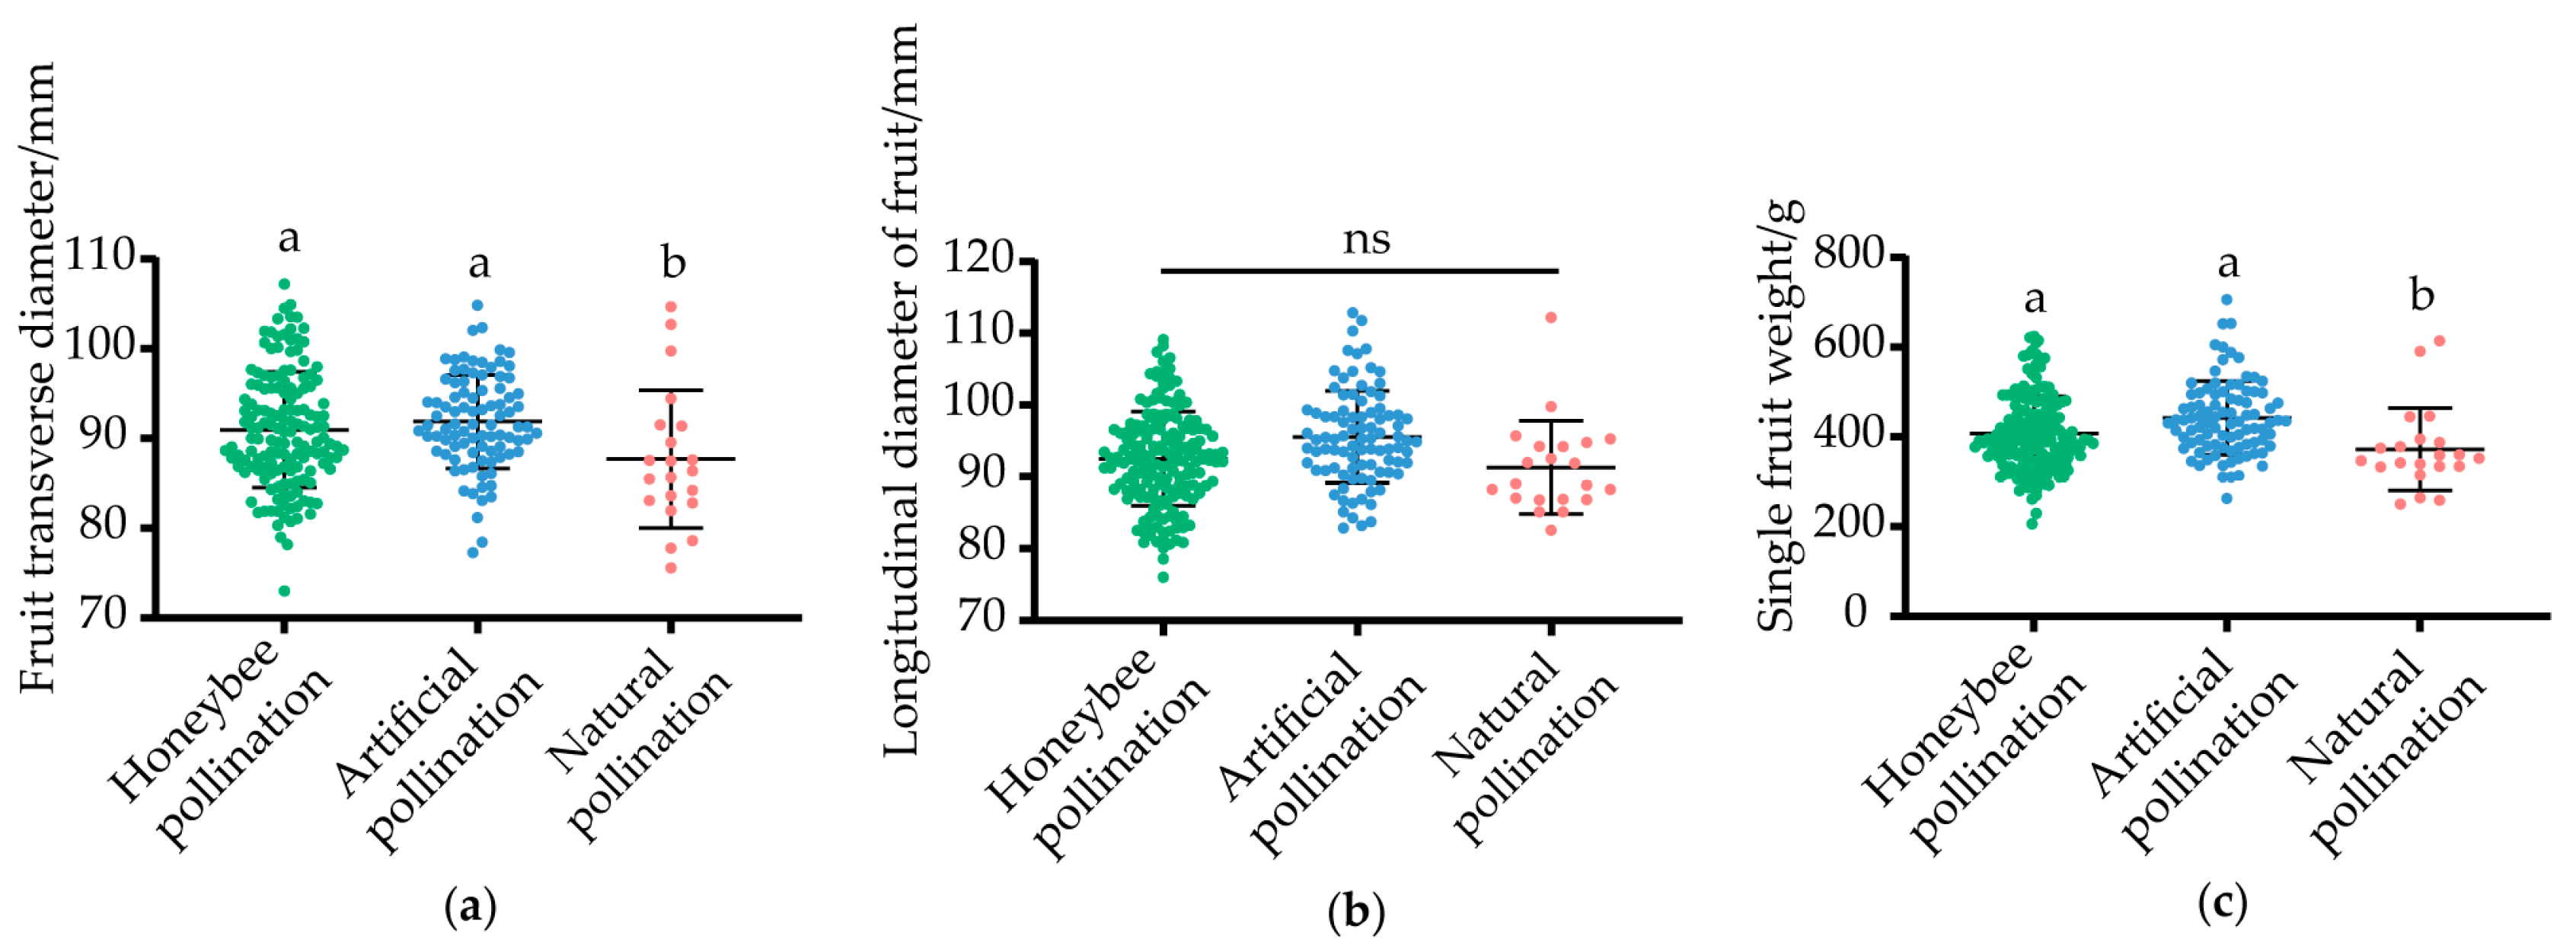
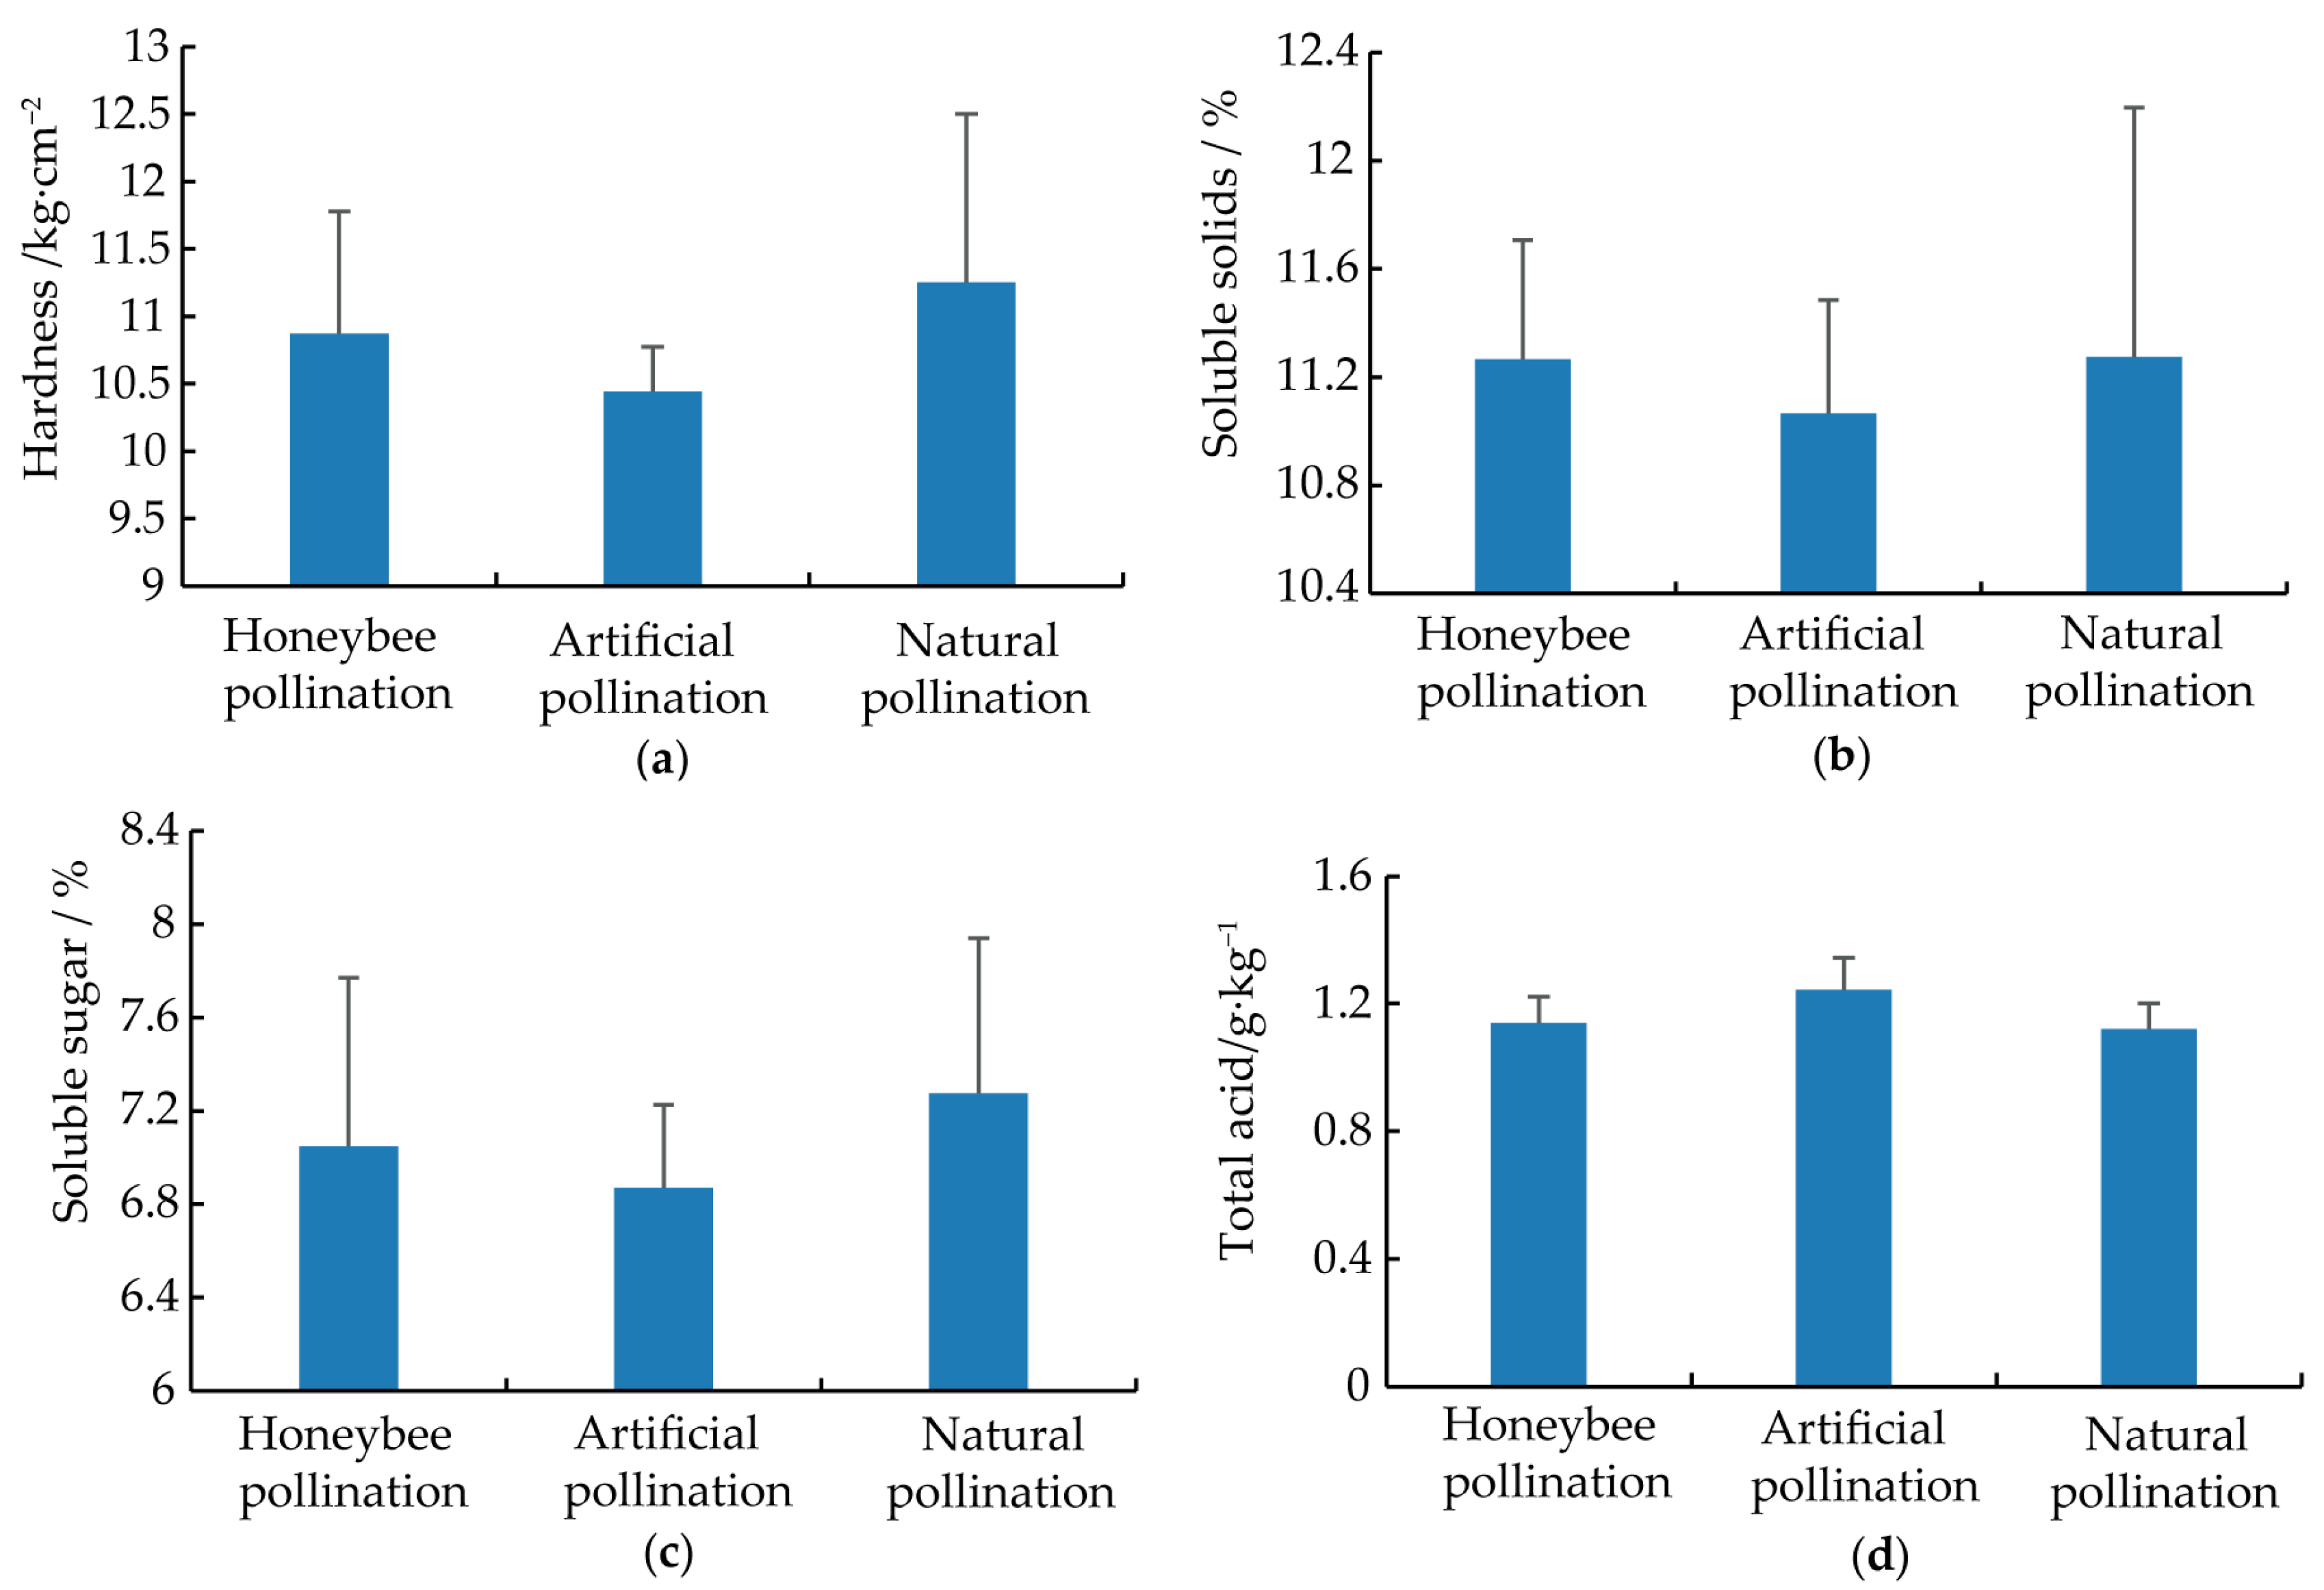
Significant differences were also found in fruit weight and fruit quantity (Figure 5) under different pollination treatments. Artificially pollinated fruits had the highest fruit weight and size, followed by pears pollinated with honey bees (Apis mellifera ligustica) and under natural conditions, where both had the smallest sizes and weight. Compared to pears under natural pollination, the fruit transverse diameter of pears pollinated by honey bees significantly increased by 3.71% (p < 0.05) and the single-fruit weight increased by 9.36% (p < 0.05). However, the study did not find that honey bee pollinated pears demonstrate significant differences in fruit quality compared to those pollinated artificially or naturally (Figure 6). Compared to artificial pollination, bee-pollinated pears showed a 2.57% increase in soluble sugar and an 8.31% decrease in total acid, though these differences did not reach a significant level.

3.3. Effects of Different Distances of Beehives on the Pollination Efficacy for Xuehua Pears

Pear trees at different distances exhibited varying fruit set rates (Figure 7). Overall, the fruit set rate of pears decreased with increasing distance from the bee colonies. Specifically, marked pear trees at 300 m and 500 m showed the highest fruit set rates in both the first survey (51.30% at 300 m and 52.34% at 500 m) and the second survey (17.42% at 300 m and 24.43% at 500 m). This was followed by trees within 700 m, where first fruit set rate was 36.30% and second fruit set rate was 17.26%. When the distance reached 1500 m, the fruit set rate was 18.60% in the first survey and 11.49% in the second survey. Under natural pollination conditions, the fruit set rate was 19.23% in the first survey and 12.91% in the second survey. Therefore, the results of bee pollination and natural pollination are similar. Although the fruit set rates within 900 m and 1200 m were higher than those at 1500 m, there was no statistical significance.

4. Discussion

Honey bees are one of the most important pollinating insects in nature, accounting for over 85% of all pollinating insects. As highly efficient pollinators, honey bees pollinate fruit and vegetable crops, which not only increases their yields but also significantly improves their quality [23]. Therefore, giving full play to honey bee pollination is significant for increasing yields and improving quality.
Pear trees are self-sterile fruit trees and are typical plants that rely on insect-mediated cross and artificial cross pollination [24]. Currently, with the large-scale development of agriculture, pear trees are planted in large contiguous areas with a single plant variety, which fails to provide a suitable living environment for wild pollinating insects. The extensive use of pesticides and chemical fertilizers has disrupted the agricultural ecological balance, leading to a decrease in natural pollinating insects, making pollination of pear trees a difficult problem [25]. At present, the main pollination methods for pear trees are artificial pollination and honey bee pollination, and drone pollination is also gradually being carried out [26,27,28]. Artificial pollination has high costs and low efficiency, which restricts the industrial development of pears [29]. Honey bee pollination is selective towards flowers [29], can make full use of effective flowers, enhance the transportation of nutrients from the plant to young fruits, and at the same time overcome the limitation of the difficulty in performing artificial pollination on the upper parts of tall pear trees, thus improving the fruit set rate of pear trees and increasing the yield [30]. Meanwhile, the pear pollen collected by honey bees during pollination is of excellent quality and can be provided to late-blooming areas for drone pollination [31]. Therefore, clarifying the effect of honey bee pollination on pear trees and determining the effective pollination area of honey bee colonies, so as to scientifically allocate pollinating honey bee colonies for pear orchards, has become the focus of our research.
In our study, analysis of pear fruit set rates under different pollination methods showed that compared to natural pollination, bee pollination significantly increased first fruit set rate by 60.51% (p < 0.05) and second fruit set rate by 37.98% (not significantly). Compared to artificial pollination, bee pollination increased first fruit set rate by 42.22% (not significantly) and second fruit set rate by 7.46% (not significantly). Fruit quality analysis revealed that compared to natural pollination, honey bee pollination increased fruit diameter by 3.71% (p < 0.05) and single-fruit weight by 9.36% (p < 0.05). Pollination by honey bees enhances pear yield, thereby increasing the economic income of pear orchards. In fact, the economic benefits of honey bee pollination to pear orchards are not only reflected in increased yield, but also in the additional economic income generated from pear pollen. In the experimental pear orchard, beekeepers sell pear pollen at a price of 5 yuan/g. During the approximately seven days pear tree flowering and pollination period, a beekeeper with 100 colonies could harvest 10 kg of pear pollen, with a direct income of 50,000 RMB, which even exceeds the income from the service of honey bee pollination. Therefore, under normal conditions, honey bee pollination is undoubtedly the best choice for large scale pear orchard pollination.
Since pollination by honey bees has been confirmed as the optimal choice for pear tree pollination, we need to further determine the appropriate number of pollinating colonies to place in a pear orchard. In the study, we recommend that honey bee colonies effectively pollinate pear trees within a range of 700 m. Based on this finding, one bee colony (containing approximately 20,000 honey bees) can pollinate approximately 3846.5 m2 of a pear orchard. It should be noted that the pear trees in the experimental orchard were over 100 years old. These trees are large and might require a greater number of pollinating bees. In practical applications, when determining the number of pollinating colonies, adjustments can be made based on the age of the pear trees. Future research is needed to analyze whether trees of different sizes have varying requirements for pollinating colonies.
Honey bee pollination provides high value to crop quality and quantity, while also improving global economic and dietary outcomes [32]. Compared with natural pollination, pollination by honey bee features high single-day pollination efficiency [33], a reduced fruit deformation rate [34], and controllable scale. The significance of the superiority of honey bee pollination over natural pollination also lies in that a higher fruit-setting rate directly translates into more fruits and seeds, which is the most direct manifestation of economic benefits [31]. Meanwhile, it also plays a potential role in ecosystem balance and biodiversity [23].

5. Conclusions

In this study, we found that pollination by honey bees resulted in higher pear fruit set rates compared to natural pollination. Although the fruit set rates and fruit quality of bee-pollinated pears were not significantly higher than those of artificially pollinated pears, the data still demonstrated the advantages of honey bee pollination. In experiments aimed at determining the number of pollinating colonies required for a pear orchard, we found that one bee colony (containing~20,000 honey bees) could pollinate approximately 3846.5 m2 of a pear orchard. Natural pollination, artificial cross-pollination, and insect-mediated cross-pollination had no significant effect on the fruit quality of Xuehua pears. This provides data-supported guidance for the scientific allocation of pollinating honey bee colonies in future pear orchard pollination practices.

Author Contributions

Conceptualization, X.C.; methodology, X.Q. and X.Z.; software, X.Q.; validation, X.Q., X.Z. and X.C.; formal analysis, X.Q.; investigation, R.W., Y.W., Q.C. and Y.X.; resources, X.C.; data curation, X.Q., X.Z. and R.W.; writing—original draft preparation, X.Q., X.Z. and X.C.; writing—review and editing, X.C.; visualization, X.Q., L.X. and H.L.; supervision, X.C.; project administration, X.C.; funding acquisition, X.C. All authors have read and agreed to the published version of the manuscript.

Funding

This research was funded by the Agricultural Science and Technology Innovation Program (CAAS-ASTIP-2025-IAR).

Institutional Review Board Statement

Not applicable.

Data Availability Statement

The original contributions presented in this study are included in the article. Further inquiries can be directed to the corresponding author.

Acknowledgments

The authors would like to thank Researcher An Jiandong for his guidance on this experiment, and express gratitude to Hebei Ruiyuan Bee Industry Co., Ltd., Shijiazhuang Bee Industry Association, and Shijiazhuang Bee Industry Technology Research Institute for their support in the fieldwork.

Conflicts of Interest

Author Yuesen Wang was employed by the company Hebei Ruiyuan Bee Industry Co., Ltd. Authors Qingfang Cheng and Yaxiong Xu were employed by the company Hebei Lezhitang Agricultural Technology Co., Ltd. The remaining authors declare that the research was conducted in the absence of any commercial or financial relationships that could be construed as a potential conflict of interest.

References

  1. Teng, Y. The pear industry and research in China. Acta Hortic. 2011, 909, 161–170. [Google Scholar] [CrossRef]
  2. FAOSTAT Report of FAO on the Harvested Area and Yield of Pear. 2023. Available online: https://www.fao.org/faostat/en/#home (accessed on 1 January 2024).
  3. Musacchi, S.; Iglesias, I. Training systems and sustainable orchard management for European pear (Pyrus communis L.) in the Mediterranean area: A review. Agronomy 2021, 11, 1765. [Google Scholar] [CrossRef]
  4. Sun, W.; Chen, C. YOLOv8-Pearpollen: Method for the Lightweight Identification of Pollen Germination Vigor in Pear Trees. Agriculture 2024, 14, 1348. [Google Scholar] [CrossRef]
  5. Quinet, M.; Jacquemart, A.-L. Troubles in pear pollination: Effects of collection and storage method on pollen viability and fruit production. Acta Oecologica 2020, 105, 103558. [Google Scholar] [CrossRef]
  6. Chen, Y.; Zhang, C. Pollination services in the North China Plain measured using buckwheat sentinel plants; is there a deficit? Agric. Ecosyst. Environ. 2024, 373, 109129. [Google Scholar] [CrossRef]
  7. Hao, W.; Wang, X. Design and experiment of pollination wind tunnels: A novel approach for studying artificial pollination in kiwifruits. Comput. Electron. Agric. 2025, 237, 110644. [Google Scholar] [CrossRef]
  8. Wang, C.-H.; Pan, Q.-K. An effective knowledge-based evolutionary algorithm for task assignment problem of pollination robots and spraying drones in multi-orchard scenarios. Expert Syst. Appl. 2025, 279, 127408. [Google Scholar] [CrossRef]
  9. Kuwahara, A.; Kimura, T. Cluster-Based Flight Path Construction for Drone-Assisted Pear Pollination Using RGB-D Image Processing. Drones 2025, 9, 475. [Google Scholar] [CrossRef]
  10. Wu, W.; Guo, Y. Present situation investigation of bee pollination for pear. Apic. China 2011, 62, 40–44. [Google Scholar]
  11. Richardson, A.; Anderson, P. Hand pollination effects on the set and development of cherimoya (Annona cherimola) fruit in a humid climate. Sci. Hortic. 1996, 65, 273–281. [Google Scholar] [CrossRef]
  12. Mashilingi, S.K.; Zhang, H. Honeybees are far too insufficient to supply optimum pollination services in agricultural systems worldwide. Agric. Ecosyst. Environ. 2022, 335, 108003. [Google Scholar] [CrossRef]
  13. Li, Q.; Sun, M. High pollination deficit and strong dependence on honeybees in Pollination of Korla Fragrant Pear, Pyrus sinkiangensis. Plants 2022, 11, 1734. [Google Scholar] [CrossRef]
  14. Zisovich, A.; Goldway, M. Adding bumblebees (Bombus terrestris L., Hymenoptera: Apidae) to pear orchards increases seed number per fruit, fruit set, fruit size and yield. J. Hortic. Sci. Biotechnol. 2012, 87, 353–359. [Google Scholar] [CrossRef]
  15. Benedek, P.; Ruff, J. Flower constancy of honeybees (Apis mellifera L.) to blooming pear plantations. Int. J. Hortic. Sci. 2000, 6, 3. [Google Scholar] [CrossRef]
  16. Hünicken, P.L.; Morales, C.L. Insect pollination, more than plant nutrition, determines yield quantity and quality in apple and pear. Neotrop. Entomol. 2020, 49, 525–532. [Google Scholar] [CrossRef] [PubMed]
  17. Wang, J.; Wang, Y. Pollination Effects of Pear Trees by Honeybee and Its Influencing Factors. Asian Agric. Res. 2023, 15, 59–62. [Google Scholar]
  18. Khan, S.A.; Tanveer, M. Declining abundance of pollinating insects drives falls in loquat (Eriobotrya japonica) fruit yields in the Pothwar region of Pakistan. Agric. Ecosyst. Environ. 2022, 339, 108138. [Google Scholar] [CrossRef]
  19. Fei, H.; Martin, T.R. Starvation affects vitellogenin production but not vitellogenin mRNA levels in the lubber grasshopper, Romalea microptera. J. Insect Physiol. 2005, 51, 435–443. [Google Scholar] [CrossRef]
  20. Ding, C.W.; Zhang, W. Variation law and comprehensive evaluation of fruit quality of Korla fragrant pear from different production areas during growth period. J. Food Saf. Qual. 2022, 13, 6032–6041. (In Chinese) [Google Scholar]
  21. Wang, G.P.; Wang, J.Z. Analysis of Fruit Quality and Aromatic Components of Plum New Variety “Jinhong” in Different Harvest Times. Acta Agric. Univ. Jiangxiensis 2015, 27, 88–91. (In Chinese) [Google Scholar]
  22. Ren, J.; Li, J.F. Establishment of a method for rapid determination of fructose content based on anthraquinone sulfate colorimetric method. Heilongjiang Sci. 2017, 8, 82–85. (In Chinese) [Google Scholar]
  23. Klein, A.-M.; Vaissière, B.E. Importance of pollinators in changing landscapes for world crops. Proc. R. Soc. B Biol. Sci. 2007, 274, 303–313. [Google Scholar] [CrossRef] [PubMed]
  24. Okada, K.; Tonaka, N. Related polymorphic F-box protein genes between haplotypes clustering in the BAC contig sequences around the S-RNase of Japanese pear. J. Exp. Bot. 2011, 62, 1887–1902. [Google Scholar] [CrossRef] [PubMed]
  25. Zhang, Q.; Zhang, Z. A comprehensive review of autonomous flower pollination techniques: Progress, challenges, and future directions. Comput. Electron. Agric. 2025, 237, 110577. [Google Scholar] [CrossRef]
  26. Quinet, M.; Jacquemart, A.-L. Cultivar placement affects pollination efficiency and fruit production in European pear (Pyrus communis) orchards. Eur. J. Agron. 2017, 91, 84–92. [Google Scholar] [CrossRef]
  27. Decourtye, A.; Alaux, C. Toward the protection of bees and pollination under global change: Present and future perspectives in a challenging applied science. Curr. Opin. Insect Sci. 2019, 35, 123–131. [Google Scholar] [CrossRef]
  28. Wang, P.; He, M. Optimization of Application Parameters for UAV-Based Liquid Pollination in Pear Orchards: A Yield and Cost Perspective. Agronomy 2024, 14, 2033. [Google Scholar] [CrossRef]
  29. Wurz, A.; Grass, I. Hand pollination of global crops–a systematic review. Basic Appl. Ecol. 2021, 56, 299–321. [Google Scholar] [CrossRef]
  30. Komlatskiy, G.; Makarova, T. Pollination by bees in industrial crop production. BIO Web Conf. 2023, 66, 12001. [Google Scholar] [CrossRef]
  31. Wang, G.-M.; Gu, C. Characteristic of pollen tube that grew into self style in pear cultivar and parent assignment for cross-pollination. Sci. Hortic. 2017, 216, 226–233. [Google Scholar] [CrossRef]
  32. Khalifa, S.A.; Elshafiey, E.H. Overview of bee pollination and its economic value for crop production. Insects 2021, 12, 688. [Google Scholar] [CrossRef]
  33. Winfree, R.; Williams, N.M. Wild bee pollinators provide the majority of crop visitation across land-use gradients in New Jersey and Pennsylvania, USA. J. Appl. Ecol. 2008, 45, 793–802. [Google Scholar] [CrossRef]
  34. Klatt, B.K.; Holzschuh, A. Bee pollination improves crop quality, shelf life and commercial value. Proc. R. Soc. B Biol. Sci. 2014, 281, 20132440. [Google Scholar] [CrossRef]
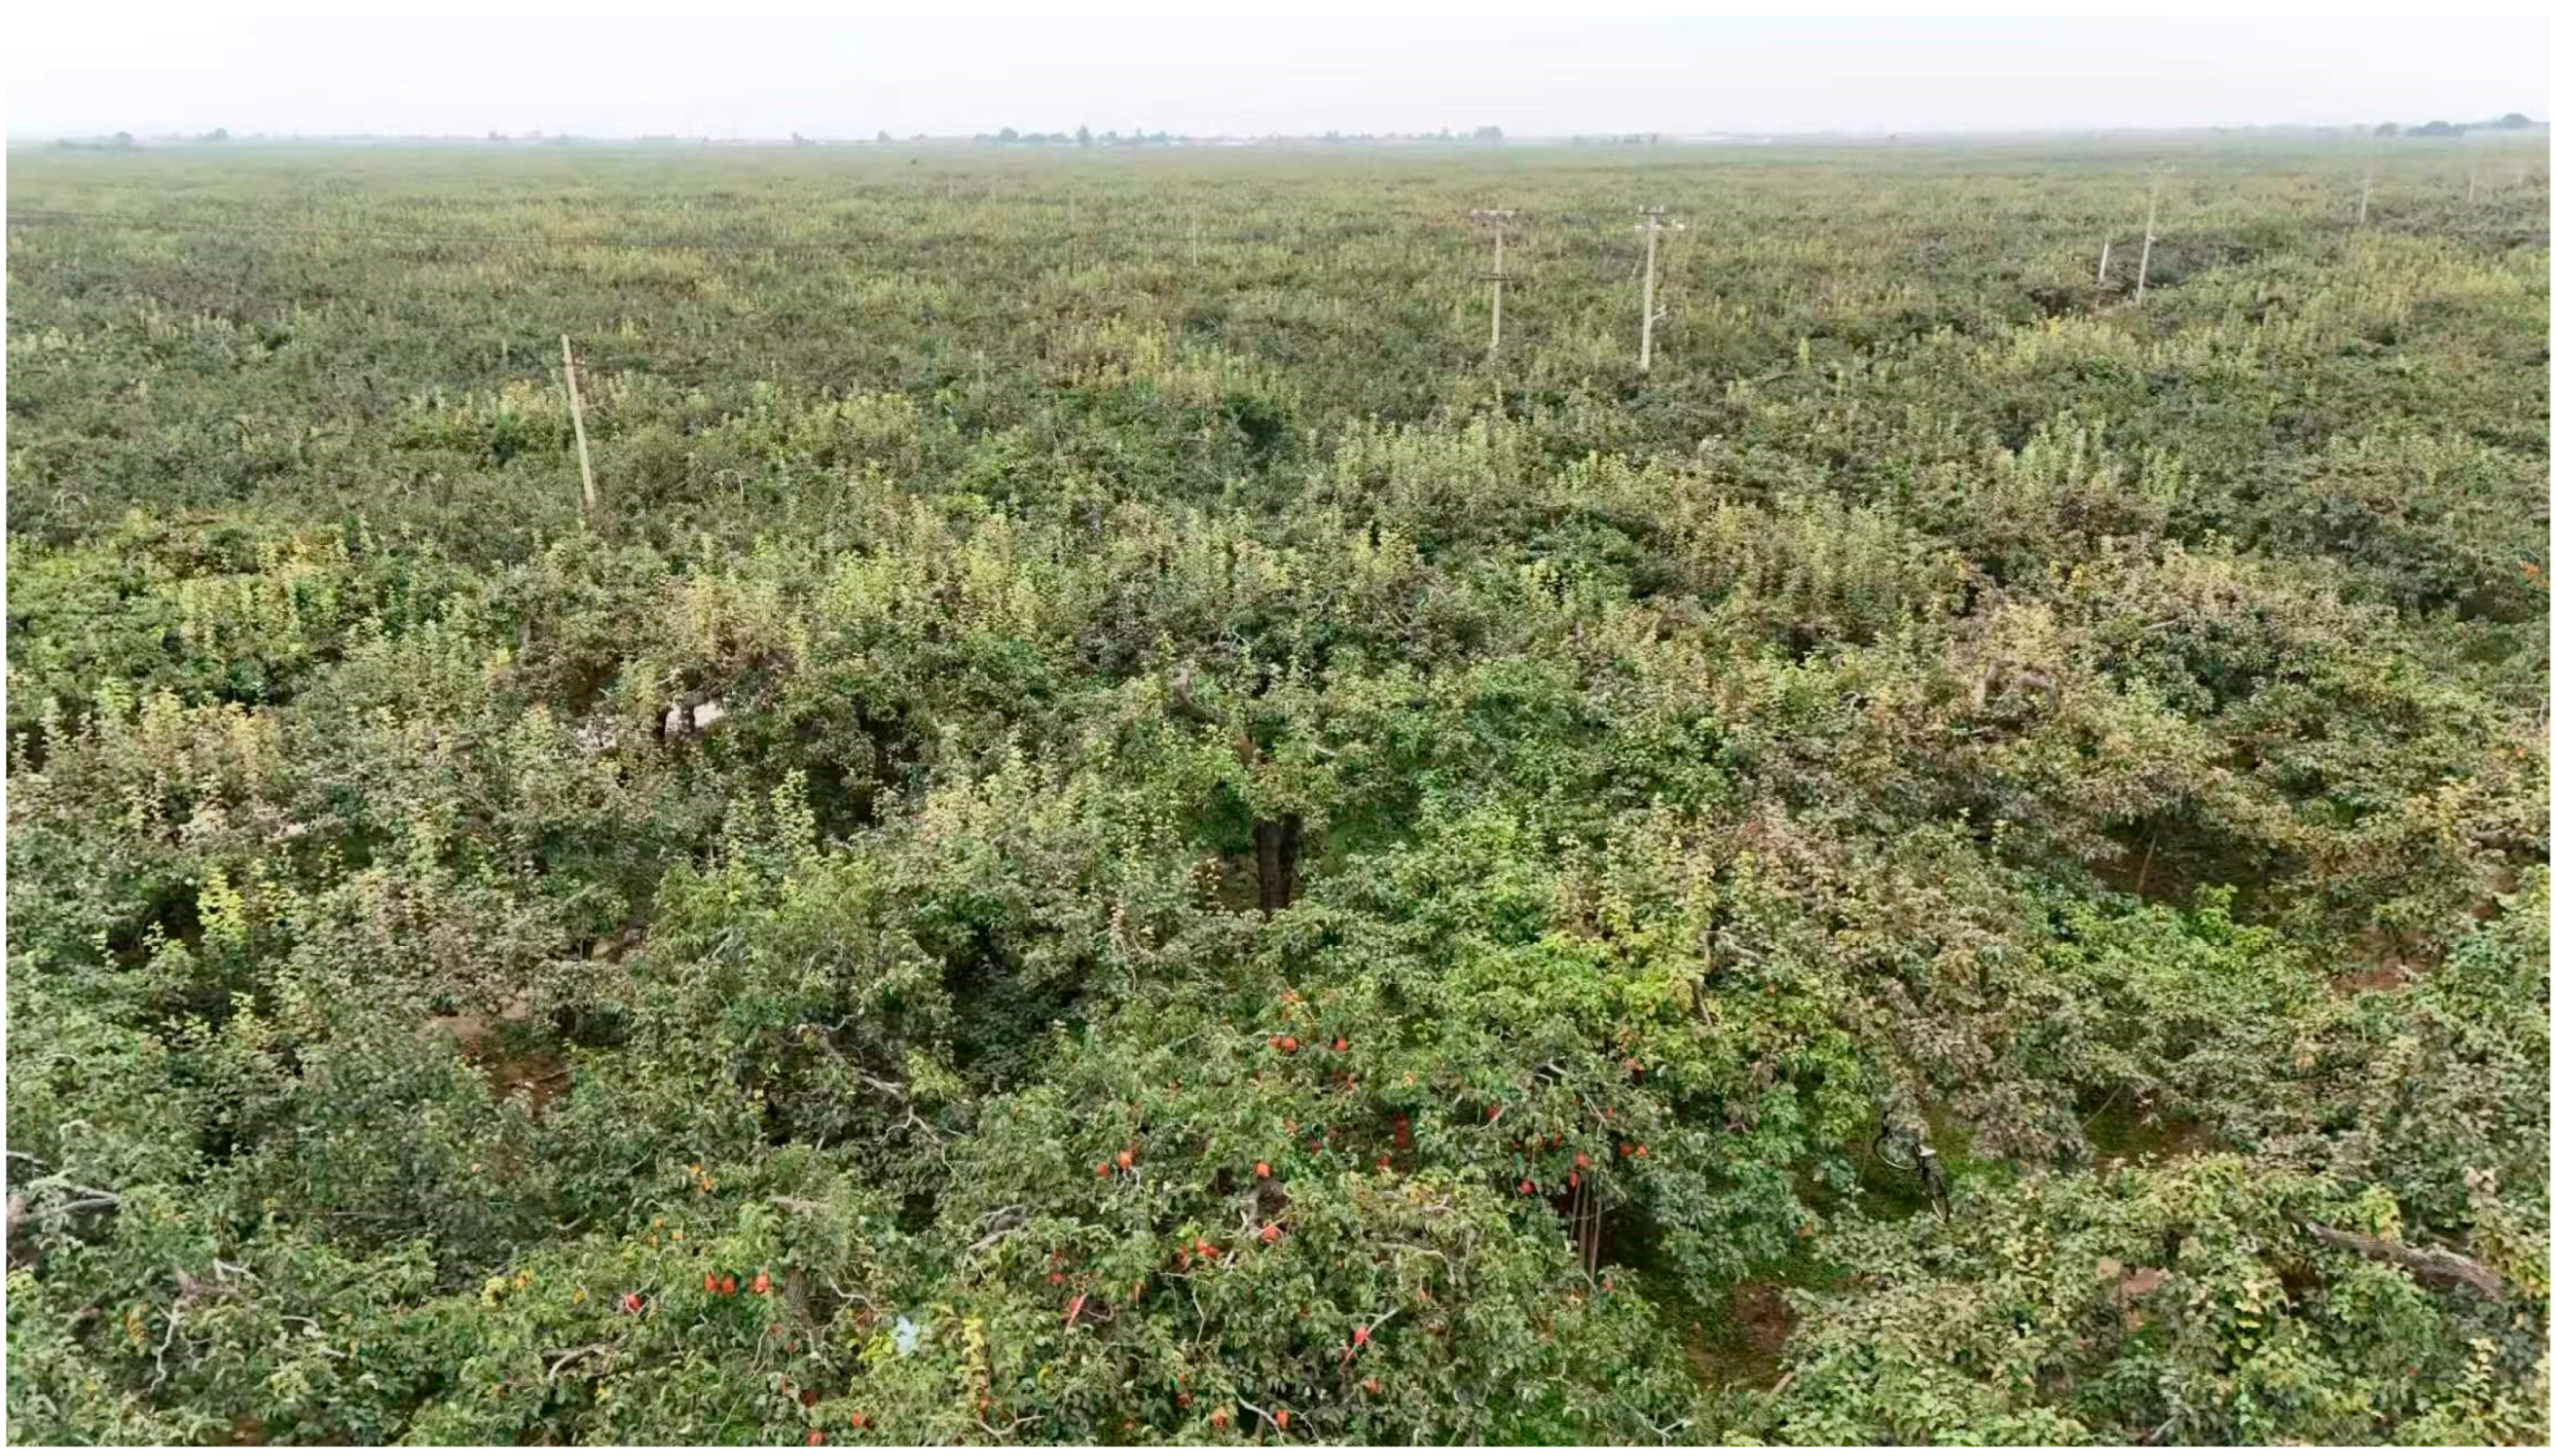
Figure 1. Aerial view of the pear orchard.
Agriculture 15 02302 g001
Figure 2. Layout of sampling plots of pear trees.
Agriculture 15 02302 g002
Figure 3. The marked pear trees at different distances. (a) On 6 April 2025, there were 6 inflorescences and 35 flowers on the pear tree in the blank control group. (b) On 3 April 2025, there were 5 inflorescences and 28 flowers on the pear tree at 300 m on the right line. (c) On 3 April 2025, there were 4 inflorescences and 27 flowers on the pear tree at 500 m on the middle line. (d) On 3 April 2025, there were 11 inflorescences and 48 flowers on the pear tree at 700 m on the left line. (e) On 3 April 2025, there were 9 inflorescences and 45 flowers on the pear tree at 900 m on the right line. There were 9 fruits on 19 April 2025. (f) On 3 April 2025, there were 7 inflorescences and 43 flowers on the pear tree at 1200 m on the right line. (g) On 6 April 2025, there were 7 inflorescences and 37 flowers on the pear tree at 1500 m on the middle line. There were 22 fruits on 19 April. (h) On 6 April 2025, there were 4 inflorescences and 20 flowers on the pear tree at 2000 m on the right line.
Agriculture 15 02302 g003
Figure 4. Effects of different pollination methods on the fruit set rate of Xuehua pears. (a) The inflorescence fruit set rate under three different pollination methods. (b) The first fruit set rate of the position flowers under three different pollination methods. (c) The second fruit set rate of the position flowers under three different pollination methods. Note: values followed by different letters (a, b) are significantly different at p < 0.05, ns: there is no significant difference between each other.
Agriculture 15 02302 g004
Figure 5. Determination of fruit quality of Xuehua pears under different pollination methods. (a) Fruit transverse diameter. (b) Longitudinal diameter of fruit. (c) Single-fruit weight. Note: values followed by different letters (a, b) are significantly different at p < 0.05, ns: there is no significant difference between each other.
Agriculture 15 02302 g005
Figure 6. Determination of fruit quality of Xuehua pears under different pollination methods. (a) Fruit hardness. (b) Fruit soluble solids (c) Fruit soluble sugar. (d) Total acid content of fruits.
Agriculture 15 02302 g006
Figure 7. Fruit set rate of trees at different distances. (a) First fruit set rate of flowers. (b) Second fruit set rate of flowers. Note: values followed by different letters (a, b, c) are significantly different at p < 0.05.
Agriculture 15 02302 g007
Disclaimer/Publisher’s Note: The statements, opinions and data contained in all publications are solely those of the individual author(s) and contributor(s) and not of MDPI and/or the editor(s). MDPI and/or the editor(s) disclaim responsibility for any injury to people or property resulting from any ideas, methods, instructions or products referred to in the content.