Article

Heavy Metal Source Apportionment, Environmental Capacity, and Health Risk Assessment in Agricultural Soils of a Rice-Growing Watershed in Eastern China

1
School of Resources Environment and Tourism, Anyang Normal University, Anyang 455000, China
2
School of Business, Anyang Normal University, Anyang 455000, China
3
College of Earth and Planetary Sciences, Chengdu University of Technology, Chengdu 610059, China
4
College of Earth Sciences, Jilin University, Changchun 130061, China
5
Institute of Geophysical and Geochemical Exploration, Chinese Academy of Geological Sciences, Langfang 065000, China
*
Authors to whom correspondence should be addressed.
Agriculture 2025, 15(21), 2275; https://doi.org/10.3390/agriculture15212275
Submission received: 19 September 2025 / Revised: 25 October 2025 / Accepted: 28 October 2025 / Published: 31 October 2025
(This article belongs to the Section Agricultural Soils)

Abstract

This study collected 427 cultivated topsoil samples from the Mohe watershed in Tangcheng County, eastern China. By integrating positive matrix factorization (PMF) for quantitative source apportionment with self-organizing maps (SOMs) for spatial clustering, we effectively identified pollution factors and conducted a systematic evaluation of pollution sources, environmental capacity, and health risks. The results show that: (1) the soils were slightly acidic and enriched in Cd, Cr, Cu, Hg, and Pb, with Cd and Hg showing high spatial variability linked to anthropogenic inputs. (2) Quantitative source apportionment indicated that 25.9% of heavy metals (As, Cr, Ni, Pb) originated mainly from natural pedogenic sources, while agricultural activities contributed 20.8% (Cd) and 42.8% (Cu, Zn). Hg (10.5%) enrichment was attributed to residential coal combustion and wind patterns, demonstrating source-specific anthropogenic influences. (3) The environmental capacity assessment indicated a moderate capacity level across the study area. However, the improved index (PImin) revealed overload phenomena at localized sites, and these overloaded areas exhibited high spatial consistency with the distributions of agricultural and mixed sources. (4) Health risk evaluation indicated that hand-to-mouth ingestion was the dominant exposure pathway, with children facing significantly higher risks than adults. Non-carcinogenic risks remained within safe limits, but carcinogenic risks were non-negligible, with 86.7% of sites exceeding the threshold for children, especially in cultivated lands and riverbank villages. Findings underscore the importance of addressing synergistic effects of natural and agricultural sources in watershed management and prioritizing children’s health protection.

1. Introduction

Soil is a critical environmental medium within the Earth’s critical zone, supporting ecosystem functions, sustaining agricultural productivity, and safeguarding human health. Approximately 95% of human food is derived directly or indirectly from soils [1], and its continued availability depends fundamentally on soil health. Ultimately, these conditions are a prerequisite for producing high-quality and nutritious food. However, escalating pollution from industrialization and urbanization, combined with rising agricultural chemical inputs, has intensified soil heavy metal (a term that is widely used in environmental science, although its chemical definition is controversial [2]). Heavy metals pose a serious threat to soil security and agricultural product quality because of their inherent toxicity, persistence, non-degradability, and potential for biomagnification in food chains. Their harmful impacts are mainly reflected in two ways: (1) the degradation of soil fertility and function, which reduces crop yield and quality [3]; and (2) their entry into the human body through the food chain, posing significant health risks [4]. Consequently, regulatory bodies, including the United States Environmental Protection Agency and related organizations, have designated eight heavy metals—Pb, Cd, Cr, Hg, As, Cu, Zn, and Ni—as priority pollutants in soils [5,6]. A recent study [7] estimated that roughly 14–17% of global arable land is contaminated by toxic metals such as arsenic and cadmium, directly affecting the health of 1.4–1.9 billion people. This finding underscores the urgent need for research on soil heavy metal environmental capacity, health risk assessment, and pollution control.
The Eastern China Plains, characterized by favorable natural conditions and a long history of cultivation, support the production of numerous renowned specialty rice varieties (e.g., Wuchang rice [8,9], Yutai rice [10], and Jianghu Tribute Rice [11]). These production regions are not only vital national commodity grain bases but also hold distinctive economic and cultural significance. However, the simultaneous expansion of high-intensity industrialization, urbanization, and intensive agriculture in this region has substantially increased the input fluxes of heavy metals into soils [8,9,10,11], posing a serious threat to the safe production of these specialty rice varieties. Because rice has a strong tendency to accumulate heavy metals, it can transfer contaminants from polluted soils into the food chain [8,10], creating long-term potential health risks for consumers. Although existing studies have documented heavy metal accumulation in soils of some eastern Chinese rice production areas [8,9,10,11] and applied various methods (e.g., receptor models such as Positive Matrix Factorization (PMF), multivariate statistics, and geostatistics) for source apportionment, several important limitations remain: (1) assessments in specialty rice regions are often confined to plot scales, lacking systematic watershed-scale sampling and sufficient regional-scale resolution; and (2) research has primarily focused on potential ecological risk assessment, with limited investigation into soil heavy metal environmental capacity, while the integrated discussion linking source apportionment with environmental capacity and health risk evaluations has received insufficient attention. Moreover, heavy metals from different sources exhibit significant differences in bioavailability, environmental behavior, and health risks. Consequently, neglecting these source-specific characteristics can lead to biases in environmental capacity estimations and risk assessments. Therefore, to effectively and objectively evaluate the contamination and risks of heavy metals in soils, it is necessary to integrate assessments of source apportionment, environmental capacity, and health risk.
In response to the urgent need to control heavy metal pollution in soils of region-specific crop-producing areas and to address the limitations of existing research, this study focuses on a representative rice production region in the Huang-Huai-Hai Plain of eastern China. It develops and applies a systematic research framework integrating “source apportionment–environmental capacity–health risk assessment.” The study area is a relatively isolated, small watershed system characterized by Quaternary alluvial deposits, a simple drainage network, and limited spatial extent. Therefore, as a designated protected geographical indication area for agricultural products, it experiences minimal external industrial influence. Consequently, soil heavy metals in this watershed primarily originate from domestic activities, agricultural practices, and the inherent geological background. Studying such a constrained watershed enables more precise identification of localized heavy metal distribution patterns, environmental capacity characteristics, and their temporal dynamics, thereby supporting a more targeted health risk assessment. Based on this rationale, the research objectives are as follows: (1) to elucidate the enrichment characteristics and sources of soil heavy metals by applying complementary receptor models—PMF and SOM—integrated with GIS and geostatistical analysis; (2) to quantify the existing environmental capacity and analyze its dynamics using established environmental capacity concepts together with a refined Minimum Comprehensive Capacity Index; and (3) to conduct a human exposure health risk assessment of heavy metals in the region’s topsoil. This study represents an innovative integration of heavy metal source apportionment, source-oriented environmental capacity evaluation, and health risk assessment into a cohesive framework. The findings aim to provide both a scientific foundation and practical guidance for precise pollution control and risk management strategies in high-value agricultural production regions of eastern China and beyond.

2. Materials and Methods

2.1. Study Area

The study area is situated in the southern part of Tancheng County, Shandong Province, China (Figure 1). It constitutes the designated production zone of “Jianghu Tribute Rice”, a nationally recognized specialty crop protected by geographical indication status. The area extends between 118°13′14″ E–118°19′56″ E and 34°28′24″ N–34°34′09″ N, covering approximately 60.0 km2. The region has a warm-temperate East Asian monsoon climate with distinct seasons and a concurrence of rainfall and heat, and is dominated year-round by prevailing east-southeast (ESE) winds. Key climatic parameters include an average annual sunshine duration of 2354.5 h (53% sunshine percentage), a mean annual temperature of 13.2 °C, and a frost-free period of about 212 days. Mean annual precipitation is 835.5 mm, of which 809.4 mm (97%) falls during the ≥0 °C farming season, 733.5 mm (88%) during the ≥10 °C thermophilic crop growth season, and 569.6 mm (68%) during the ≥20 °C active growth season for thermophilic crops. This synchronization of thermal and hydrological conditions provides an optimal environment for rice cultivation. The study area lies within the Mo River catchment of the central Yishu River alluvial plain, characterized by flat terrain with an average elevation of 35.0 m. Structurally, it is located at the junction of the Matou Sag in the Central Shandong Uplift and the Tancheng Sag of the Yishu Fault Zone. The region is extensively mantled by Quaternary deposits of considerable thickness, with no bedrock exposures. Parent materials are dominated by Holocene fluvial clastic sediments from the Linyi Formation (Qhl) and lacustrine-swamp sediments from the Heituhu Formation (Qhh). The Linyi Formation comprises clayey silt and gravel-bearing medium-to-coarse sand, while the Heituhu Formation consists mainly of silty clay and clayey silt. Paddy soils are the predominant soil type, with a band of sticky Chao soils distributed along the central Mo River (Figure 1). Land use is primarily agricultural, with cultivated areas consisting largely of irrigated land and paddy fields.

2.2. Sampling and Analysis

Based on the current land use map of the study area, surface soil samples were collected at a density of 7 points per km2, with targeted sampling in cultivated lands along the Mo River, where the Jianghu Tribute Rice production zone is located (Figure 1). Sampling followed standardized protocols: at each site, a composite sample (0–20 cm depth) was prepared by homogenizing five subsamples. Fresh samples (≥1000 g) were sealed in labeled bags, resulting in a total of 427 surface soil specimens.
Soil samples were air-dried, sieved through a 10-mesh (2 mm) nylon screen, and quartered. A 100 g subsample was then pulverized to pass through a 200-mesh (75 μm) sieve for heavy metal analysis. The analytical procedures were as follows: (1) Pb, Ni, Cr, Zn, Cu, and Fe2O3 were quantified by X-ray fluorescence spectrometry (Axiosmax, PANalytical B.V., Almelo, Netherlands) using powder-pellet preparation (4.00 g pressed in low-pressure polyethylene rings); (2) Cd was determined by graphite furnace atomic absorption spectrometry (GF-AAS, PE600, Thermo Elemental, Waltham, MA, USA) following mixed-acid digestion (HF–HClO4–HNO3 in PTFE crucibles, 0.2500 g sample); (3) As and Hg were analyzed by hydride generation–atomic fluorescence spectrometry (AFS9750, Beijing Haiguang Instrument, Beijing, China) after aqua regia digestion in colorimetric tubes (0.5000 g sample, 10% HCl dilution). Soil pH was measured potentiometrically with a PHS-3C meter (Shanghai Precision & Scientific Instrument Co., Ltd., Shanghai, China). Method detection limits (mg·kg−1) were as follows: As (0.2), Cd (0.02), Cr (2), Cu (1), Hg (0.0003), Ni (2), Pb (1), and Zn (2); pH resolution was 0.01. Glassware was pre-cleaned with 10% HNO3 for 24 h, all reagents were of analytical grade, and ultrapure water was used throughout. Throughout the analytical process, comprehensive quality control measures were implemented by analyzing one duplicate sample and four certified national soil reference materials (GBW-07403) per batch of 50 samples. The implemented quality assurance protocol yielded the following results: sample reproducibility tests demonstrated a >90.0% acceptance rate, reanalysis of outliers achieved a >95.0% qualification rate, and complete data reporting (100%) was maintained. All measurements of certified reference materials consistently fell within their certified ranges, verifying analytical accuracy and precision. All analyses were carried out in the Central Laboratory of the Shandong Provincial Bureau of Geology and Mineral Resources.

2.3. Evaluation Method

2.3.1. Enrichment Factor Method

The enrichment factor (EF) is a key indicator for quantitatively evaluating anthropogenic contributions to heavy metal accumulation in soils [12,13]. It compares measured heavy metal concentrations against background levels, with Fe commonly selected as the reference element due to its high natural abundance, relatively low variability, and minimal anthropogenic influence [14,15,16]. The EF is calculated as:
E F = C i Fe   sample C i Fe   background ,
where (Ci/Fe)sample is the ratio of element i to Fe in the study-area soils, and (Ci/Fe)background denotes the corresponding ratio in geochemical background soils. In this study, Fe concentration was derived from Fe2O3 measurements using International Union of Pure and Applied Chemistry (IUPAC) standard atomic weights (Fe = 55.845; O = 15.9994). EF values were interpreted as follows [17,18,19]: EF ≤ 0.5: No enrichment (dominantly lithogenic sources); 0.5 < EF ≤ 1.5: Minor enrichment (primarily from soil parent material or natural weathering); 1.5 < EF ≤ 5: Moderate enrichment (influenced by non-parent-material sources, e.g., diffuse or point-source pollution); 5 < EF ≤ 20: Significant enrichment (substantial non-geogenic inputs); EF > 20: Extreme enrichment (strongly dominated by anthropogenic or non-natural weathering processes).

2.3.2. Positive Matrix Factorization

The Positive Matrix Factorization (PMF) model, a widely used receptor model, is an effective tool for pollutant source identification [20] and has seen increasing application in recent years [6,11]. It decomposes the original data matrix (Xij) into three components: the source composition profile matrix (Fkj), the factor contribution matrix (Gik), and the residual matrix (Eij). This relationship can be expressed as:
X i j = k = 1 p G i k × F k j + E i j ,
where Xij is the concentration matrix in receptor samples, representing the concentration (mg·kg−1) of element j in soil sample i; p is the number of factors (i.e., pollution sources); Gik is the factor contribution matrix, indicating the contribution (mg·kg−1) from source k to sample i; Fkj is the factor profile matrix, representing the concentration (mg·kg−1) of element j in source profile k; and Eij is the residual matrix, derived from the defined objective function Q. By incorporating uncertainty information, the PMF model normalizes prediction errors for elements in matrix X. It then iteratively solves for the non-negative matrices G and F that minimize the objective function Q. The objective function Q is defined as:
Q = i = 1 n j = 1 m E i j U i j 2 ,
where Q is a key output parameter of the PMF analysis, and model runs typically report two Q values; Uij represents the uncertainty associated with the concentration of element j in sample i. Uncertainty is calculated using one of two approaches: (i) when the concentration of an element is less than or equal to its method detection limit (MDL), the uncertainty is computed using Equation (4); (ii) when the concentration exceeds the corresponding MDL, the uncertainty is computed using Equation (5). The calculation formulas are as follows:
U i j = 5 / 6 × M D L ,
U i j = δ × C 2 + 0.5 × M D L 2 ,
where δ denotes the model uncertainty typically ranging from 0.05 to 0.20 [20] and was set to 0.05 in this study; C is the measured element concentration (mg·kg−1); and MDL is the method detection limit for the heavy metal (mg·kg−1).

2.3.3. Self-Organizing Map

The Self-Organizing Map (SOM), proposed by Professor Teuvo Kohonen of the University of Helsinki, Finland, in 1981 [21,22], is an unsupervised neural network model. It consists of neurons arranged in a regular low-dimensional grid, with each neuron represented by a weight vector whose dimensionality matches that of the input data [23]. The primary function of the SOM is nonlinear dimensionality reduction. By projecting high-dimensional input data onto a low-dimensional (2D or 3D) grid, it ensures that similar input samples remain close to one another, thereby preserving the most significant intrinsic topological structures of the original data. This feature allows the SOM to intuitively reveal inherent relationships among data points [22]. Unlike many other machine learning approaches, the SOM can identify and classify data without preliminary training. The SOM network consists of a one-dimensional input layer and a two-dimensional output (competitive) layer, structured as a hexagonal or rectangular grid. The network operates through connections between neurons in the input layer and those in the competitive layer. Within this framework, the input layer receives input vectors (representing external sample information) and maps each vector to the optimal neuron, known as the Best Matching Unit (BMU). The competitive layer then updates the weights of the matched neurons (each initialized with a random weight vector) to reveal classification patterns [24]. The core distance metric is calculated as follows:
D i = i = 1 n x i t ω i j t 2 = || X W j || ,
where xi is the input vector of neuron i, ωij is the weight value between neuron i in the input layer and neuron j in the competitive layer, and n is the number of vectors in the input layer. In this study, the number of neurons (m) in the competitive layer was determined using the empirical formula m = 5 × √a [25], where a denotes the sample size. All modeling, training, and application procedures were conducted using the SOM Toolbox v2.0 in the MATLAB R2022a computational environment.

2.3.4. Soil Environmental Capacity

  • Soil heavy metal static environmental capacity
The concept of static environmental capacity takes a fixed perspective, measuring the net amount of pollutants that soil can accommodate while still meeting a specific environmental quality standard. This value is considered constant [26,27,28]. It indicates that the background concentration of an element, along with its permissible limit, determines the environmental capacity of the topsoil. However, this static capacity does not consider the soil’s self-purification ability [29,30]. The calculation formulas are as follows:
C sp = 10 6 × M × C ic C ip ,
C ss = 10 6 × M × C ic C ib ,
P i = C sp / C ss ,
P I = 1 n i = 1 n P i ,
where Csp is the existing environmental capacity of heavy metal i in the topsoil (kg·hm−2); Css is the static environmental capacity of heavy metal i in the topsoil (kg·hm−2); M is the mass of the plough layer (0–20 cm depth) of the topsoil per unit area, with an empirical value of 2.25 × 10⁶ kg·hm−2 [31,32,33]; Cic is the permissible limit value for heavy metal i, defined as the Risk Screening Values for Soil Contamination of Agricultural Land [34] (mg·kg−1); Cip is the measured concentration of heavy metal i in the topsoil (mg·kg−1); Cib is the background concentration of heavy metal i, corresponding to the geochemical background levels of topsoil in Linyi City, Shandong Province [35,36] (mg·kg−1); Pi is the single-factor environmental capacity index of heavy metal i in the topsoil; PI is the comprehensive environmental capacity index of heavy metals in the topsoil; and n is the number of heavy metals evaluated. The PI is classified into five levels ranging from low to high [30]: PI > 1, Level I (High Capacity), indicating the soil environment is essentially uncontaminated (No Risk); 0.7 < PI ≤ 1, Level II (Moderate Capacity), indicating the soil environment is lightly contaminated (Slight Risk); 0.3 < PI ≤ 0.7, Level III (Low Capacity), indicating the soil environment is moderately contaminated (Moderate Risk); 0 < PI ≤ 0.3, Level IV (Alert Level), indicating the soil environment is severely contaminated (Severe Risk); PI ≤ 0, Level V (Overloaded), indicating soil contamination exceeds the risk benchmark (Extreme Risk).
2.
Improved comprehensive Environmental Capacity Index
The conventional comprehensive environmental capacity index is calculated as the arithmetic mean of eight heavy metals, which fails to adequately reflect the true capacity levels due to the masking effect of averaging. Based on the barrel principle (or limiting factor principle), a modified approach is proposed by incorporating the minimum value (the limiting factor value) to correct the composite capacity index. The formula is defined as follows:
P I m i n = min P j i ,
where PImin represents the improved comprehensive environmental capacity Index; i and j retain the same definitions as described previously. The improved comprehensive environmental capacity index adopts the classification criteria of the PI.

2.3.5. Health Risk Assessment

Health risk assessment quantitatively links environmental pollution to human health by evaluating risk levels and describing the potential hazards posed by heavy metal contaminants. The health risks associated with soil heavy metal contamination depend primarily on two factors: (1) the level of environmental pollution, determined by heavy metal concentrations, supergene geochemical characteristics, and contaminant toxicity in the study area [37]; and (2) the human exposure scenario, influenced by the age distribution of the exposed population and behavioral patterns related to soil contact [38]. It is widely recognized [37,38,39] that heavy metals in agricultural soil can affect human health through three main exposure pathways: direct ingestion via hand-to-mouth transfer, inhalation of soil particles, and dermal contact with exposed skin. In this study, these pathways are used to calculate the Average Daily Dose (ADD) of heavy metals from soil. The assessment covers both non-carcinogenic and carcinogenic risks [39,40], with the specific formulas provided as follows.
A D D i n g = C × I n g R × E F × E D × C F B W × A T ,
A D D i n h = C × I n h R × E F × E D × C F P E F × B W × A T ,
A D D d e r m = C × S A × A F × A B F × E F × E D × C F B W × A T ,
H I = i = 1 n H Q = i = 1 n   A D D i n g e s t i o n ,       i n h a l a t i o n ,       d e r m a l i R f D i ,  
C R = i = 1 m C R i = i = 1 m A D D i i n g e s t i o n ,       i n h a l a t i o n ,       d e r m a l × S F i ,
where C is the concentration of soil heavy metal (mg·kg−1); ADD is the average daily dose (mg·kg−1); RfD is the non-carcinogenic reference dose for a given exposure route; HQ is the non-carcinogenic hazard quotient of heavy metal i; and HI is the total non-carcinogenic hazard index for heavy metals. If HI < 1, the health risk is considered negligible, whereas HI ≥ 1 indicates the presence of a non-carcinogenic risk. SFi is the carcinogenic slope factor of heavy metal i; CR is the carcinogenic risk of heavy metal i; and TCR is the total carcinogenic risk of arsenic and cadmium. Based on the risk benchmarks recommended by the U.S. EPA [37,38], the TCR is categorized into four levels: an acceptable level (TCR < 1 × 10⁻⁶), slight risk (1 × 10⁻⁶TCR < 1 × 10⁻⁵), moderate risk (1 × 10⁻⁵TCR < 1 × 10⁻⁴), and high risk (TCR ≥ 1 × 10⁻⁴). The parameters for the three exposure models are provided in Table 1, and the slope factors and reference doses used in the health risk assessment are listed in Table 2.

2.4. Data Processing

Data processing and statistical analyses were conducted using SPSS 19.0 (IBM, Armonk, New York, NY, USA), Origin 2022 (OriginLab, Northampton, MA, USA), and MATLAB R2022a (MathWorks, Natick, MA, USA). The PMF model was performed using the US EPA PMF 5.0 software. The number of significant digits retained for raw data and statistical parameters was determined based on the detection limits specified in national standards and the reliable thresholds of laboratory methods. Spatial distribution maps of heavy metal concentrations, environmental capacity, and health risk hazard indices were generated using the Inverse Distance Weighting (IDW) method in ArcGIS 10.8 (Esri, Redlands, CA, USA). All graphical outputs were subsequently refined using CorelDRAW X8 (Corel, Ottawa, ON, Canada).

3. Results and Discussion

3.1. Soil Heavy Metal Concentration and Spatial Distribution Characteristics

The statistical results of heavy metal concentrations in surface soils of the study area are summarized in Table 3. Soil pH, a key variable influencing the distribution and migration of chemical elements, averaged 6.21, indicating slightly acidic conditions that are generally suitable for rice cultivation [48]. Notably, the mean concentrations of several heavy metals exceeded various environmental benchmarks. Compared with the geochemical background values of surface soils in Shandong Province, the mean concentrations of Cr, Cu, Hg, and Pb were elevated, with exceedance rates of 61.1%, 62.5%, 74.7%, and 77.3%, respectively. Similarly, when contrasted against the geochemical baseline values of deep soils in Shandong Province, significantly higher levels of Cr, Hg, Pb, and Zn were observed, with exceedance rates of 73.7%, 100%, 72.3%, and 42.4%. Relative to the national average values of Chinese surface soils, the mean concentrations of Cd, Cr, Cu, Hg, and Pb were also higher, with exceedance rates of 73.5%, 66.7%, 60.5%, 77.9%, and 51.5%, respectively. Furthermore, when assessed against the soil environmental quality risk control standard f agricultural land [34], the maximum concentrations of Cr and Ni at one sampling site (pH 6.5–7.5) exceeded the corresponding risk screening values. These results indicate noticeable heavy metal accumulation in the study area. The coefficient of variation (CV) serves as a useful metric for evaluating spatial variability of elements and assessing the degree of anthropogenic influence on their distribution. In general, a greater degree of dispersion corresponds to a higher CV [35]. According to established classification thresholds [49,50,51], the CV values for As (20.2%), Cr (21.3%), Cu (24.7%), Pb (17.0%), and Zn (27.5%) in the study area indicated moderate variability, whereas Cd (34.9%), Hg (38.7%), and Ni (36.2%) exhibited high variability. The observed moderate-to-high spatial heterogeneity of these eight heavy metals suggests that their distribution is strongly influenced by human activities.
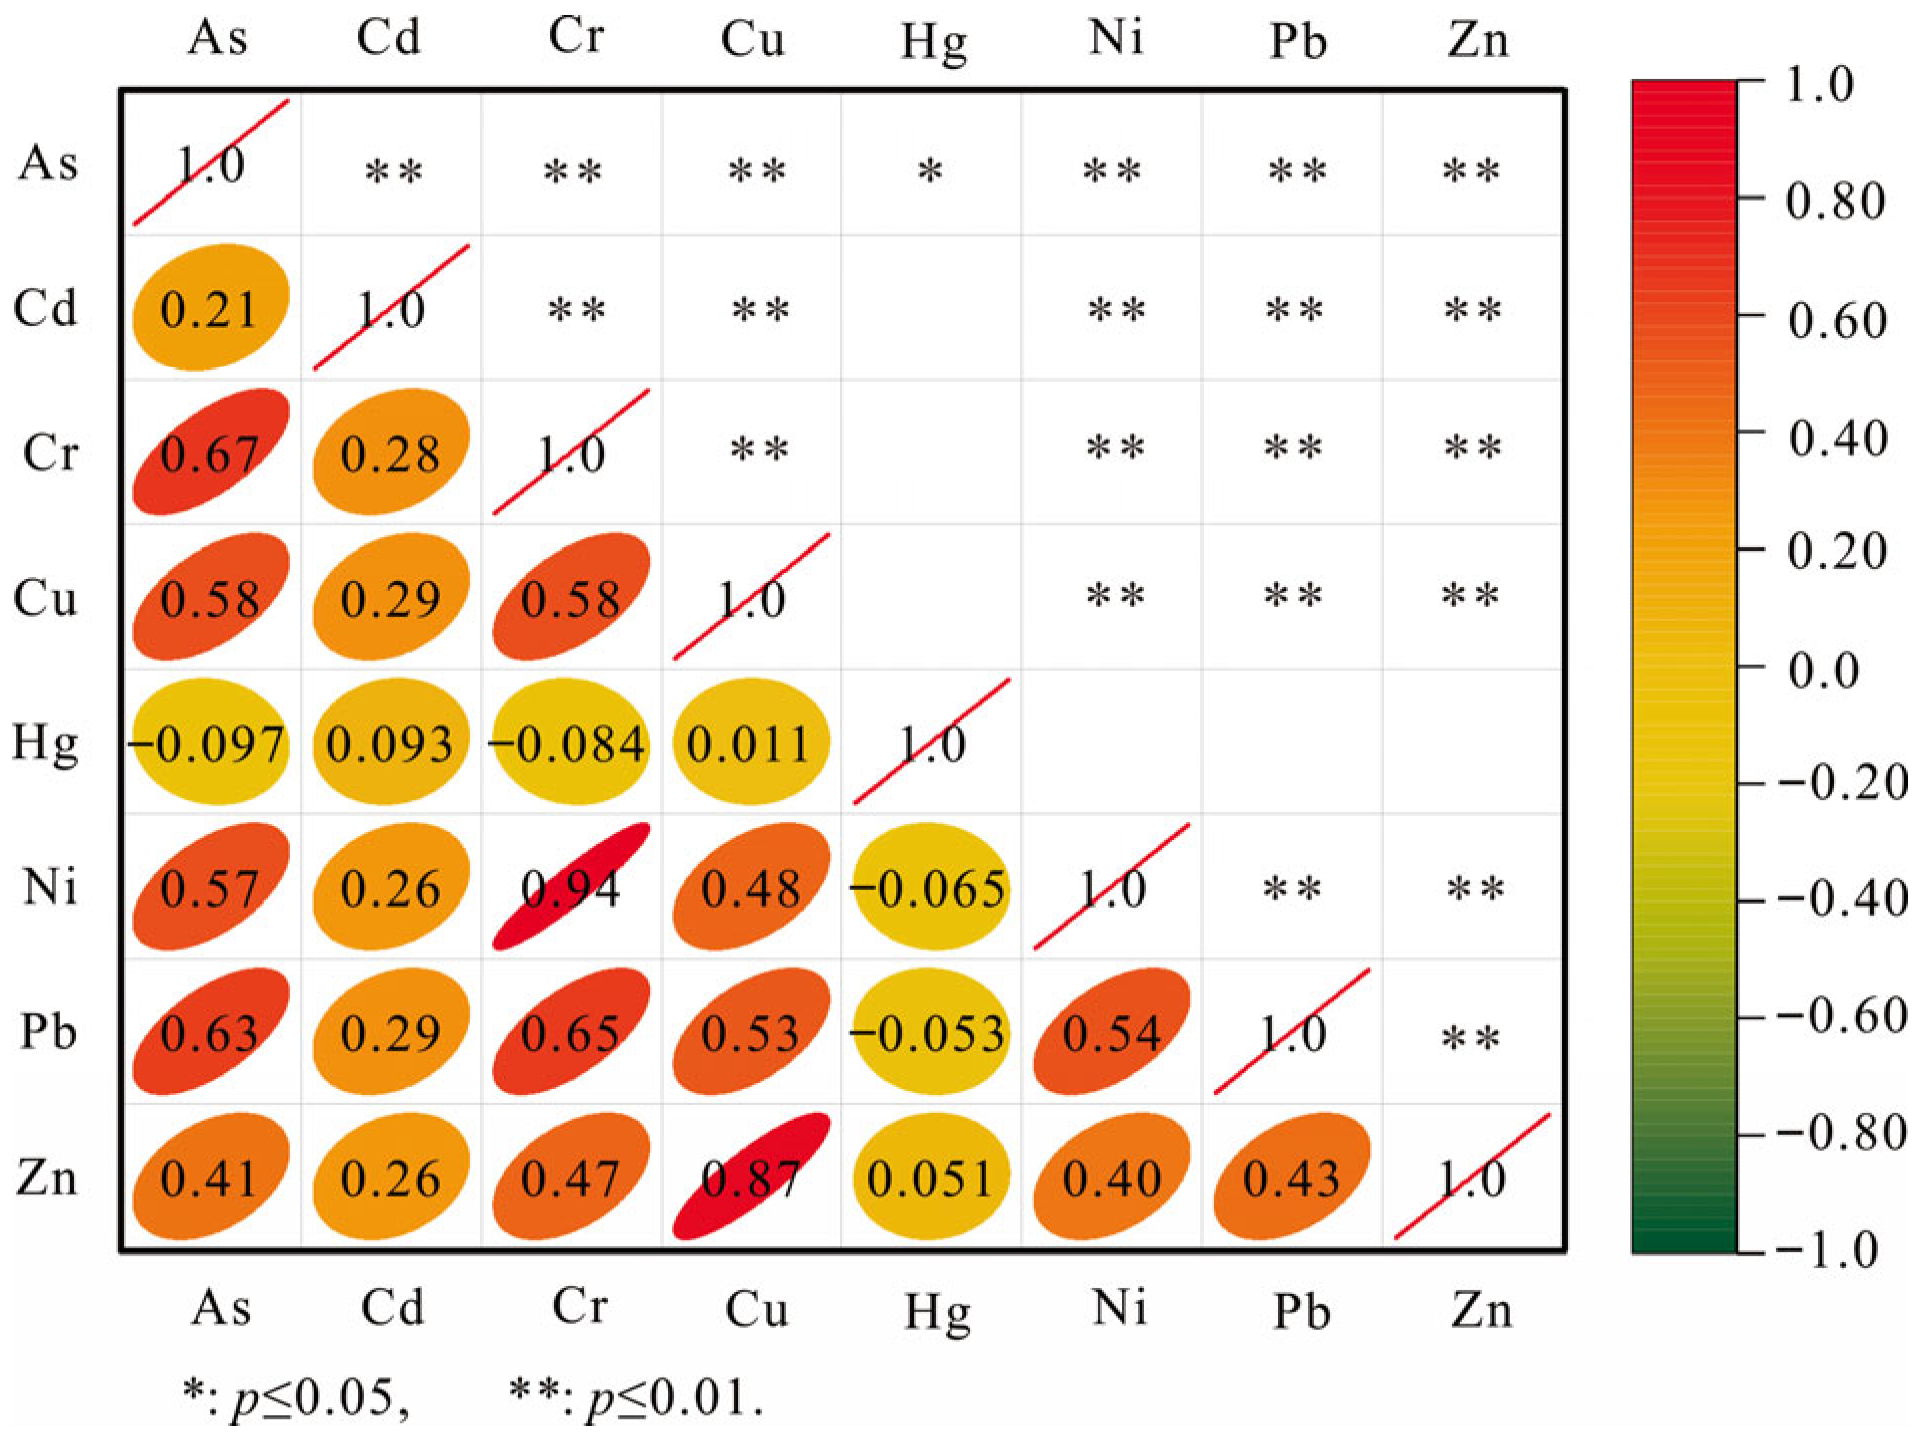
The study area represents a typical small-watershed geographic unit, where soil pH and chemical element concentrations are influenced by the watershed’s acid–base environment [54,55]. Spatial distribution maps of the elements are shown in Figure 2, and the correlation matrix is presented in Figure 3. The pH values were generally neutral along the river but relatively acidic in the adjacent paddy soils (Figure 2i). Elements such as As, Cr, Ni, Pb, Cu, and Zn exhibited significant correlations (p ≤ 0.01, r > 0.55), and their spatial distributions corresponded closely to the pH pattern. Specifically, As, Pb, Cu, and Zn—moderately variable chalcophile elements—tend to undergo slow hydrolysis or leaching with increasing pH near the river, resulting in consistently low-value distributions in the fluvo-aquic soils along the Mo River. Cr and Ni, belonging to the iron group elements (p ≤ 0.01, r = 0.94), are more mobile due to their variable valence states. Under supergene conditions, they often form complex anions (e.g., Cr is readily oxidized to hexavalent chromate ions), which also leads to low-value distributions along the Mo River. The partial correlations between Cr, Ni and pH were not significant (Table 4), suggesting that their relationships with pH may be influenced by other factors. Furthermore, the paddy soils on both sides of the river are relatively enriched in clay components (e.g., Fe, Mn, and Al) and organic matter, which readily adsorb and immobilize elements such as As, Cr, Ni, Pb, Cu, and Zn, resulting in elevated concentrations in these soils. Cd and Hg exhibited significant negative partial correlations (r = −0.218 and −0.181, respectively, Table 4) with pH, indicating strong negative associations between pH and these elements after controlling for the effects of other heavy metals. The spatial distribution of Cd differed from that of the other elements. Numerous point anomalies were identified in farmland along both sides of the river (Figure 2b), and a pronounced high-value zone was observed in the central–southern premier rice production area. Cd is generally considered to have strong polarizing ability under supergene conditions and is readily adsorbed by colloidal solutions in paddy soils under natural conditions [55,56], leading to its enrichment. Hg exhibited distinctly medium-to-high values in farmland soils near the river and slightly to the west (Figure 2e), consistent with the distribution of surrounding villages and towns. This spatial pattern suggests a potential association with anthropogenic activities contributing to elevated Hg concentrations.

3.2. Heavy Metal Source Apportionment

3.2.1. Enrichment Characteristics of Heavy Metals in Soil

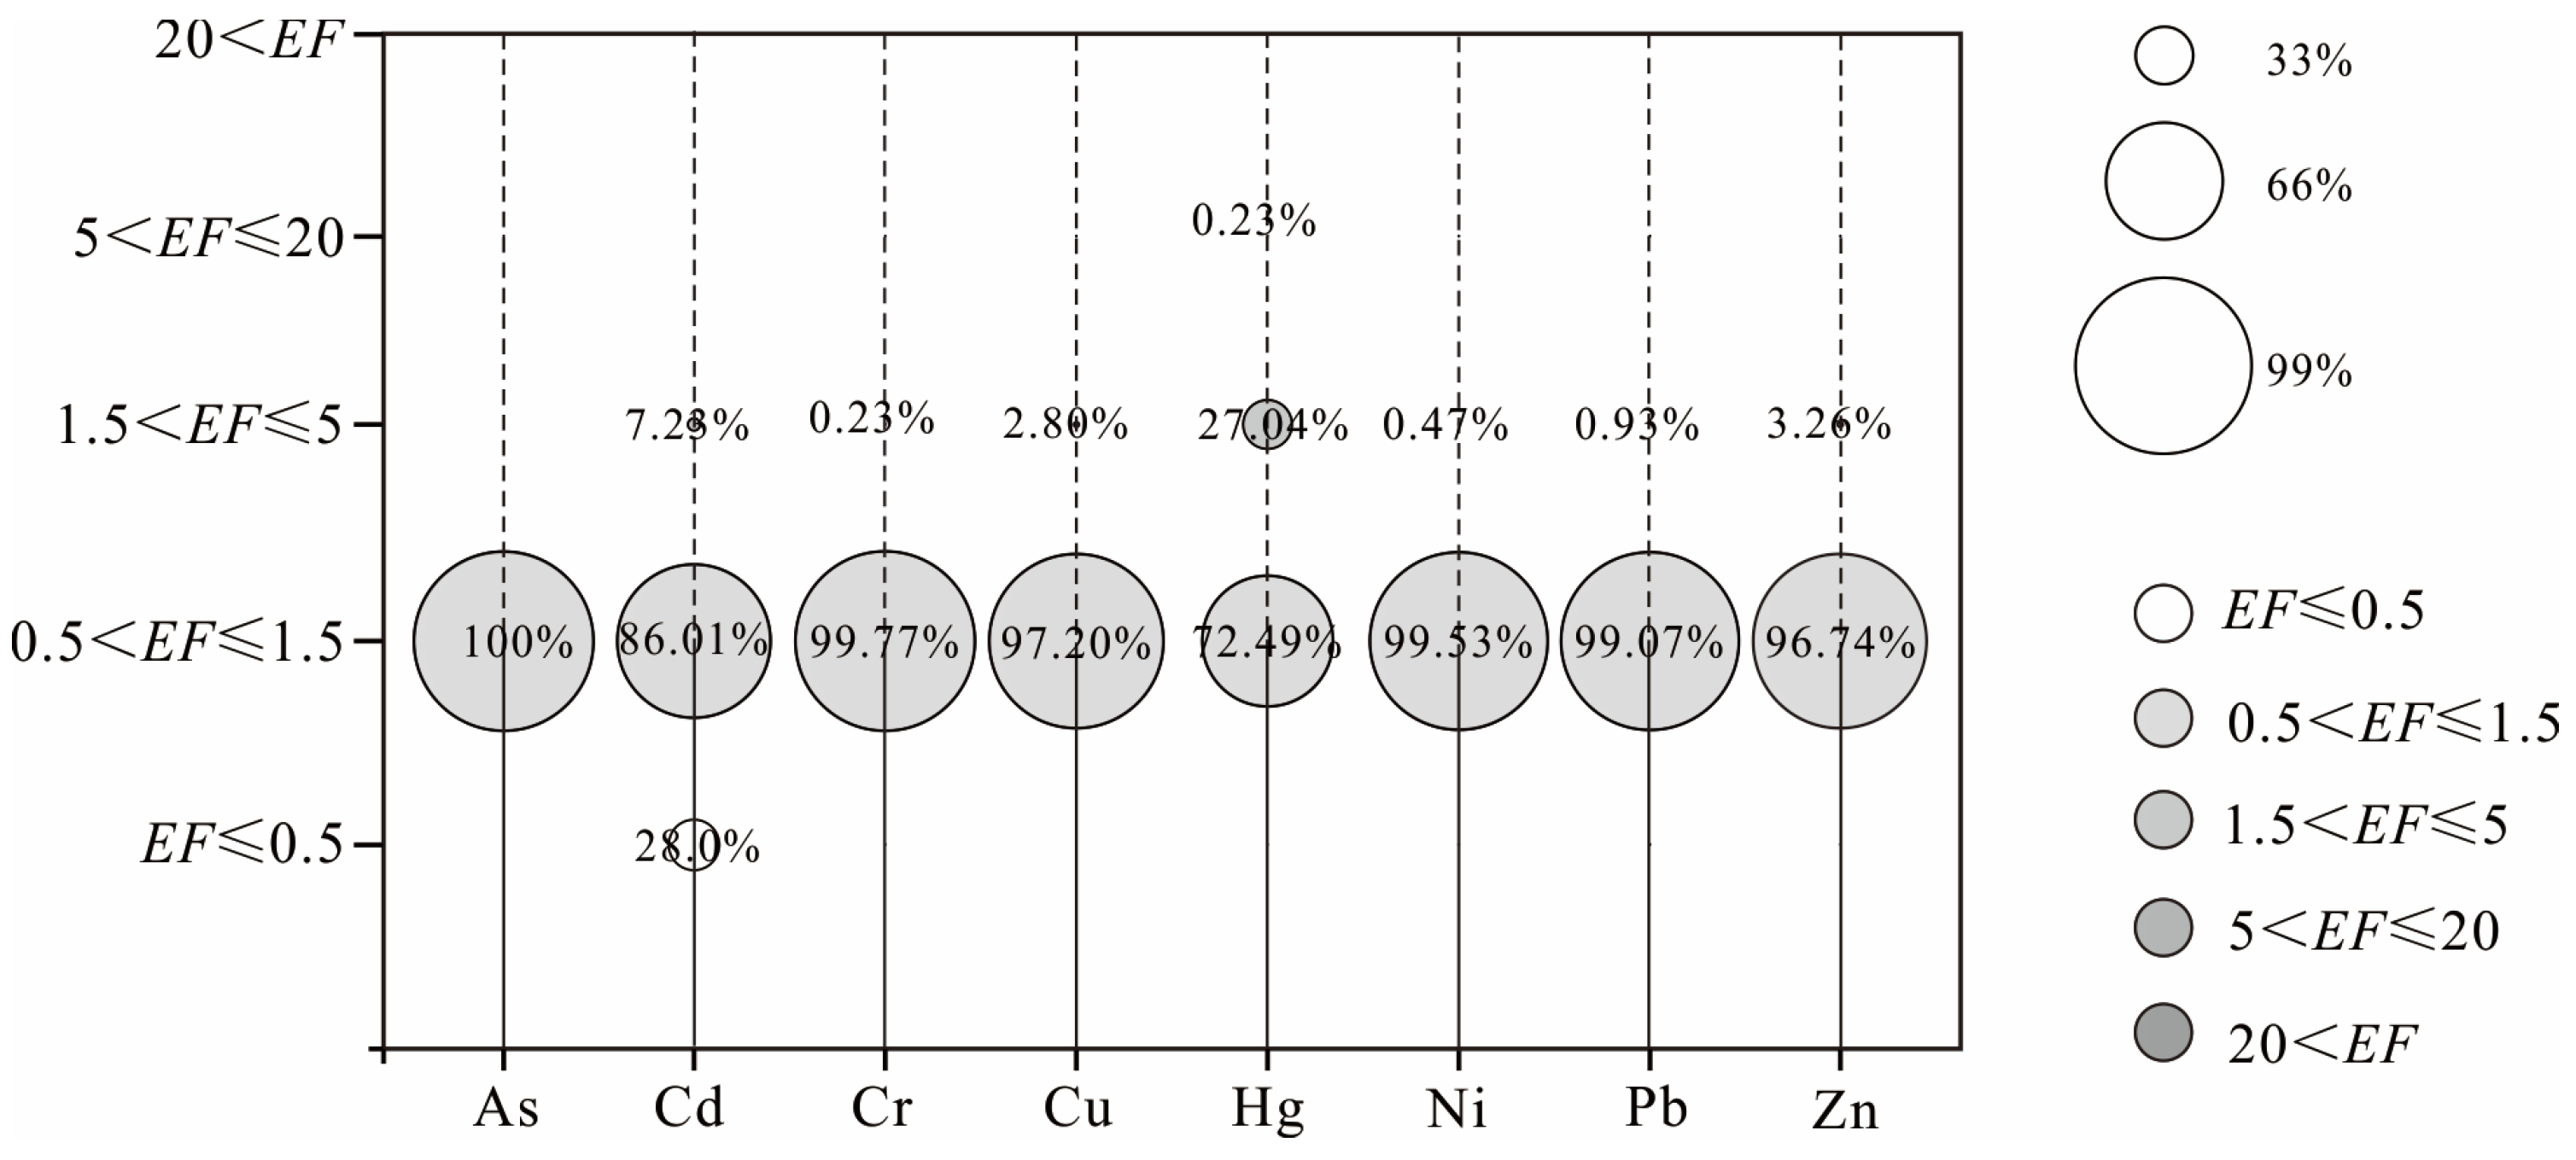
According to the calculated enrichment factors (EFs) of heavy metals in soils of the study area, the average EFs of As and Hg were 1.01 and 1.37, respectively, while the EFs of the other elements ranged from 0.5 to 1, indicating that the soils were overall in a minor enriched state. Based on EF classifications (Figure 4), heavy metals in the topsoil of the study area exhibited varying degrees of enrichment. Among them, As was consistently concentrated within the slightly enriched category. In contrast, Cd, Cr, Cu, Ni, Pb, and Zn were all moderately enriched, with proportions of 7.23% (31 sites), 0.23% (1 site), 2.8% (12 sites), 0.47% (2 sites), 0.93% (4 sites), and 3.26% (14 sites), respectively. A significant enrichment site for Hg was also identified, accounting for 0.23% (1 site). The presence of moderate enrichment and isolated significant enrichment points suggests that soils in the study area are predominantly controlled by natural sources and weathering processes, whereas some high-value points are likely influenced by exogenous inputs such as human activities.

3.2.2. Positive Matrix Factorization Analysis

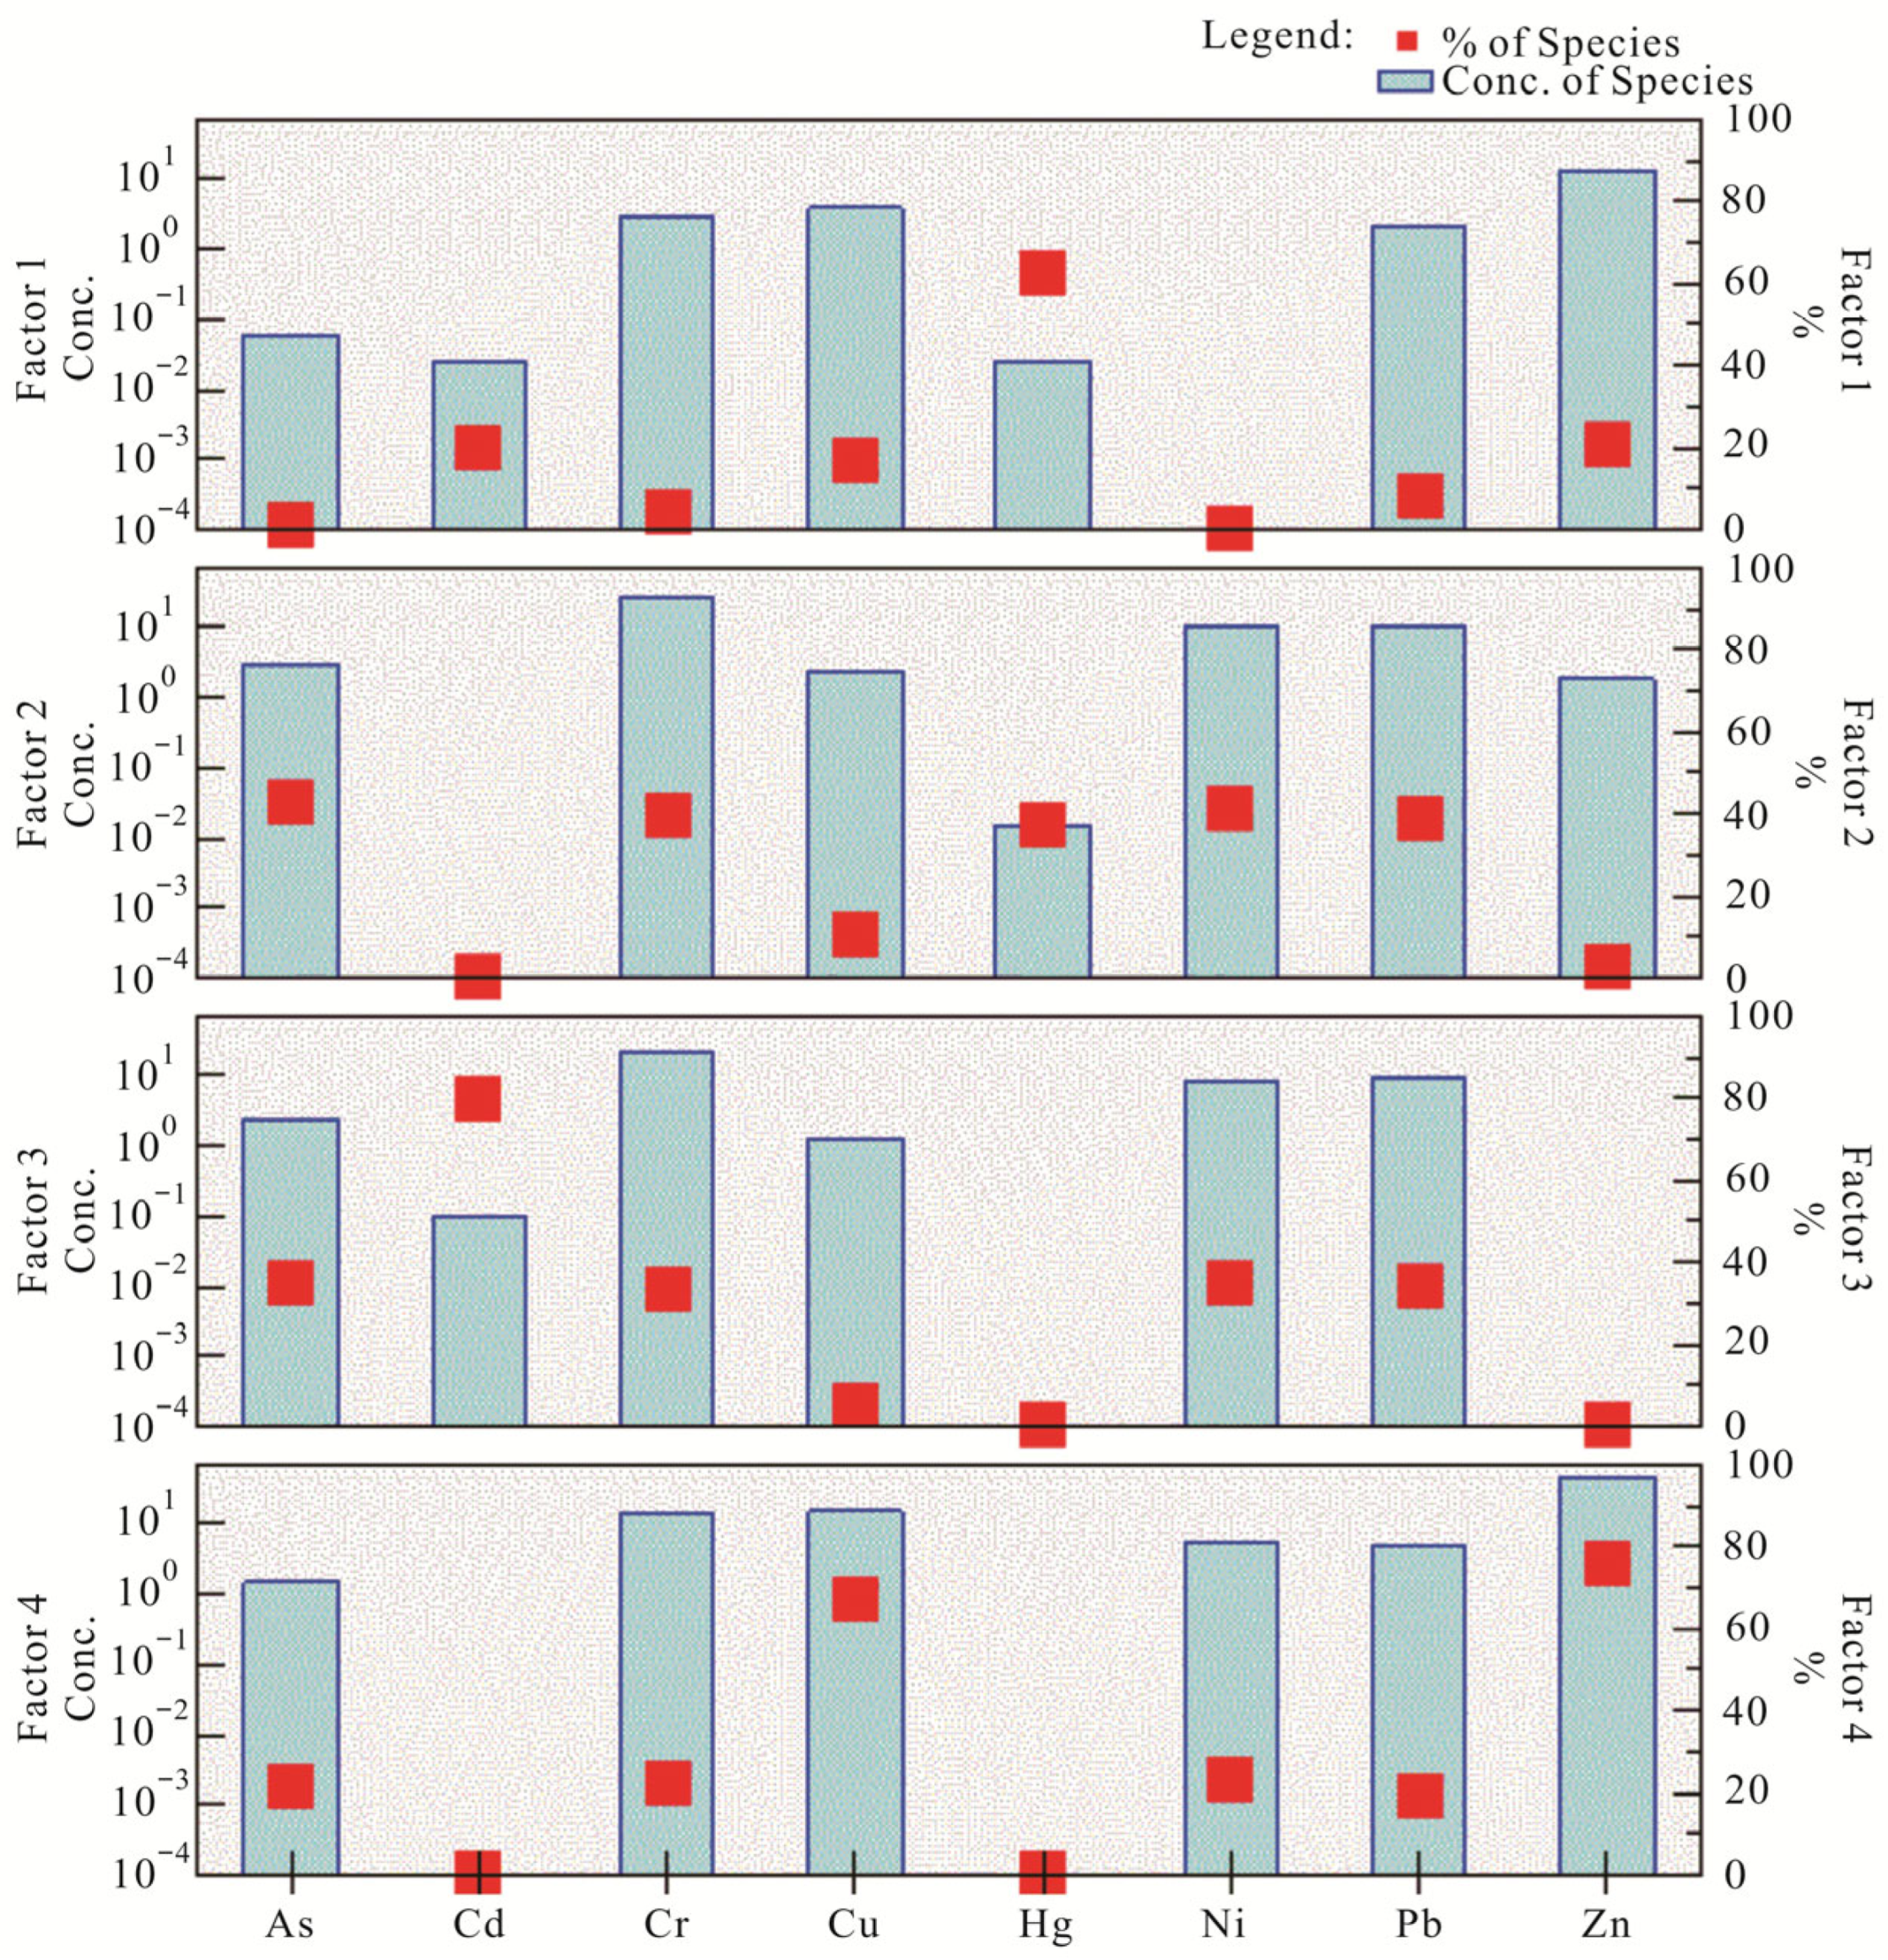
To address the uncertainties inherent in the enrichment factor analysis and to quantitatively resolve the precise sources of heavy metals, a Positive Matrix Factorization (PMF) analysis was performed. The number of factors was set between 2 and 5, and the model was iteratively executed for 20 runs with randomly selected initial seed points. The optimal factor number was determined by comparing the QRobust/QTrue ratios across different factor solutions [20]. In this study, the signal-to-noise (S/N) ratios for all input heavy metal concentration data and their associated uncertainty estimates were classified as “strong”. After multiple runs and comparisons, a stable solution was obtained with four factors. For this model, QRobust and QTrue were both 270.0, and the scaled residuals fell within the range of –3 to 3, confirming the stability of the computational solution. In the goodness-of-fit evaluation between measured and model-predicted values, the coefficients of determination (r2) exceeded 0.65 for As, Cd, Cr, Cu, Hg, Pb, and Zn, while Ni exhibited an r2 of 0.49. These results demonstrate that the overall performance of the PMF model was satisfactory, and the four extracted factors are interpreted as representing four distinct sources of heavy metals (Figure 5 and Figure 6).
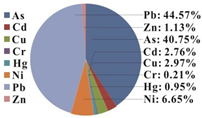
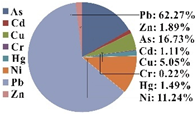
Factor 1 is dominated by Hg, accounting for 10.5% (Figure 6) of the total explained variance. The enrichment factor of Hg across the study area is 1.37, and the element exhibits pronounced spatial heterogeneity, with numerous outliers (CV = 38.7%). Anthropogenic sources of Hg are diverse, including industrial emissions [57,58], irrigation with contaminated effluents [59], agrochemical applications [60], municipal solid-waste disposal [57], and coal combustion for domestic heating [61,62]; all are closely linked to human activities. However, the study region is primarily agricultural, lacking large-scale industry, with settlements generally distributed along the Mo River. Field surveys indicate that coal remains the primary fuel for winter heating and cooking. Spatially, elevated Hg concentrations form a ribbon-like zone slightly west of the river axis (Figure 2e), suggesting that riparian soils have been variably affected by Hg inputs. Wind-rose data from the Tancheng meteorological station (ID 58034) between 1999 and 2022 show that the prevailing wind direction (Figure 1) is east-southeast, with a frequency of 10.55%. This persistent airflow governs the dispersal and deposition of coal-derived particulates, resulting in preferential accumulation of Hg on the west bank of the river. Existing studies have indicated that the spatial distribution of the heavy metal mercury (Hg) can serve as a critical indicator for identifying its sources [63]. Furthermore, factors such as prevailing wind patterns can facilitate the transport of gaseous and particulate mercury through the atmosphere, which subsequently deposits onto soils. Once deposited, Hg tends to accumulate in the topsoil through adsorption processes involving clay minerals and organic matter in the soil pore water, leading to elevated soil mercury concentrations [64]. Accordingly, Factor 1 is interpreted as representing a coal-combustion source.
Factor 2, primarily associated with As, Cr, Ni, and Pb, accounted for 25.9% (Figure 6) of the total data variance. These four elements exhibited highly significant positive correlations (p ≤ 0.01, r > 0.50, Figure 3). Their enrichment factors were concentrated between 0.5 and 1.5. Previous studies suggest that strong correlations between Cr and Ni are often linked to parent materials or pedogenic processes [55,56,65]. Considering the surficial geochemical characteristics of Cr and Ni, and their reflection of parent material, As and Pb are also inferred to be primarily associated with natural alluvial deposition and soil formation processes of the plain’s river sediments. This interpretation aligns with the spatial distribution patterns of As, Cr, Ni, and Pb along the Mo River and its banks (Figure 2), consistent with findings from Nanos & Rodríguez Martín [66] in the Duero River basin, Spain. Accordingly, Factor 2 is attributed to a natural source.
Factor 3, dominated by Cd, accounted for 20.8% (Figure 6) of the total data variance. Cd concentrations in the study area’s farmland soils exhibited high variability (CV = 34.9%) and pronounced spatial heterogeneity. External sources of Cd typically include industrial emissions and fossil fuel combustion [67], vehicle exhaust and traffic dust [68], and pesticides or fertilizers [69]. Notably, in areas lacking industrial activity, Cd is often considered an indicator of agricultural practices [60]. As a traditional farming region with no industrial development, the study area displayed extensive zones of elevated Cd concentrations, particularly in the middle-south section near a river bend, coinciding with the core production area of a characteristic local rice variety. Field studies confirm the prevalent use of phosphate, nitrogen, compound fertilizers, and livestock manure in local rice farming. Since phosphate fertilizers originate from cadmium-bearing phosphate rock, their application contributes up to 0.15% annual cadmium enrichment in soils—characterized by high bioavailability for crops [60]. Concurrently, livestock manure represents another major pathway for cadmium introduction into the soil system [69]. Accordingly, Factor 3 is identified as an agricultural source associated with farmland activities.
Factor 4, primarily associated with Cu and Zn, accounted for the largest proportion of the total data variance (42.8%, Figure 6). Cu and Zn concentrations exhibited moderate spatial variability and a relatively dispersed distribution pattern. Research by Li et al. [70] reported significant spatial variation in Cu and Zn in orchard soils, potentially linked to intensive pesticide application. Similarly, Tian et al. [61] found no significant correlations between Cu and elements such as Hg or Cd in orchard soils, noting that Zn accumulation was associated with fertilizer and pesticide use. Although the study area is primarily a rice-growing region, scattered ginkgo and orchard plantations are present in the northern, central-eastern, and central-western parts. These plantation areas correspond spatially with zones of moderate to high Cu and Zn concentrations. Additionally, Cu and Zn are commonly used in vehicle components, such as tires and brake systems [71]. Wear, exhaust emissions, and brake friction can result in localized enrichment of these metals in roadside soils [71,72]. The spatial distributions of Cu and Zn in this study partially overlap with transportation routes; notably, medium-to-high concentration zones align with an east–west highway near a river bend (Figure 2d,h). Integrating these observations, the distribution of Cu and Zn likely reflects combined inputs from pesticide application and traffic-related sources. Accordingly, Factor 4 is classified as a mixed source.

3.2.3. Self-Organizing Map Analysis

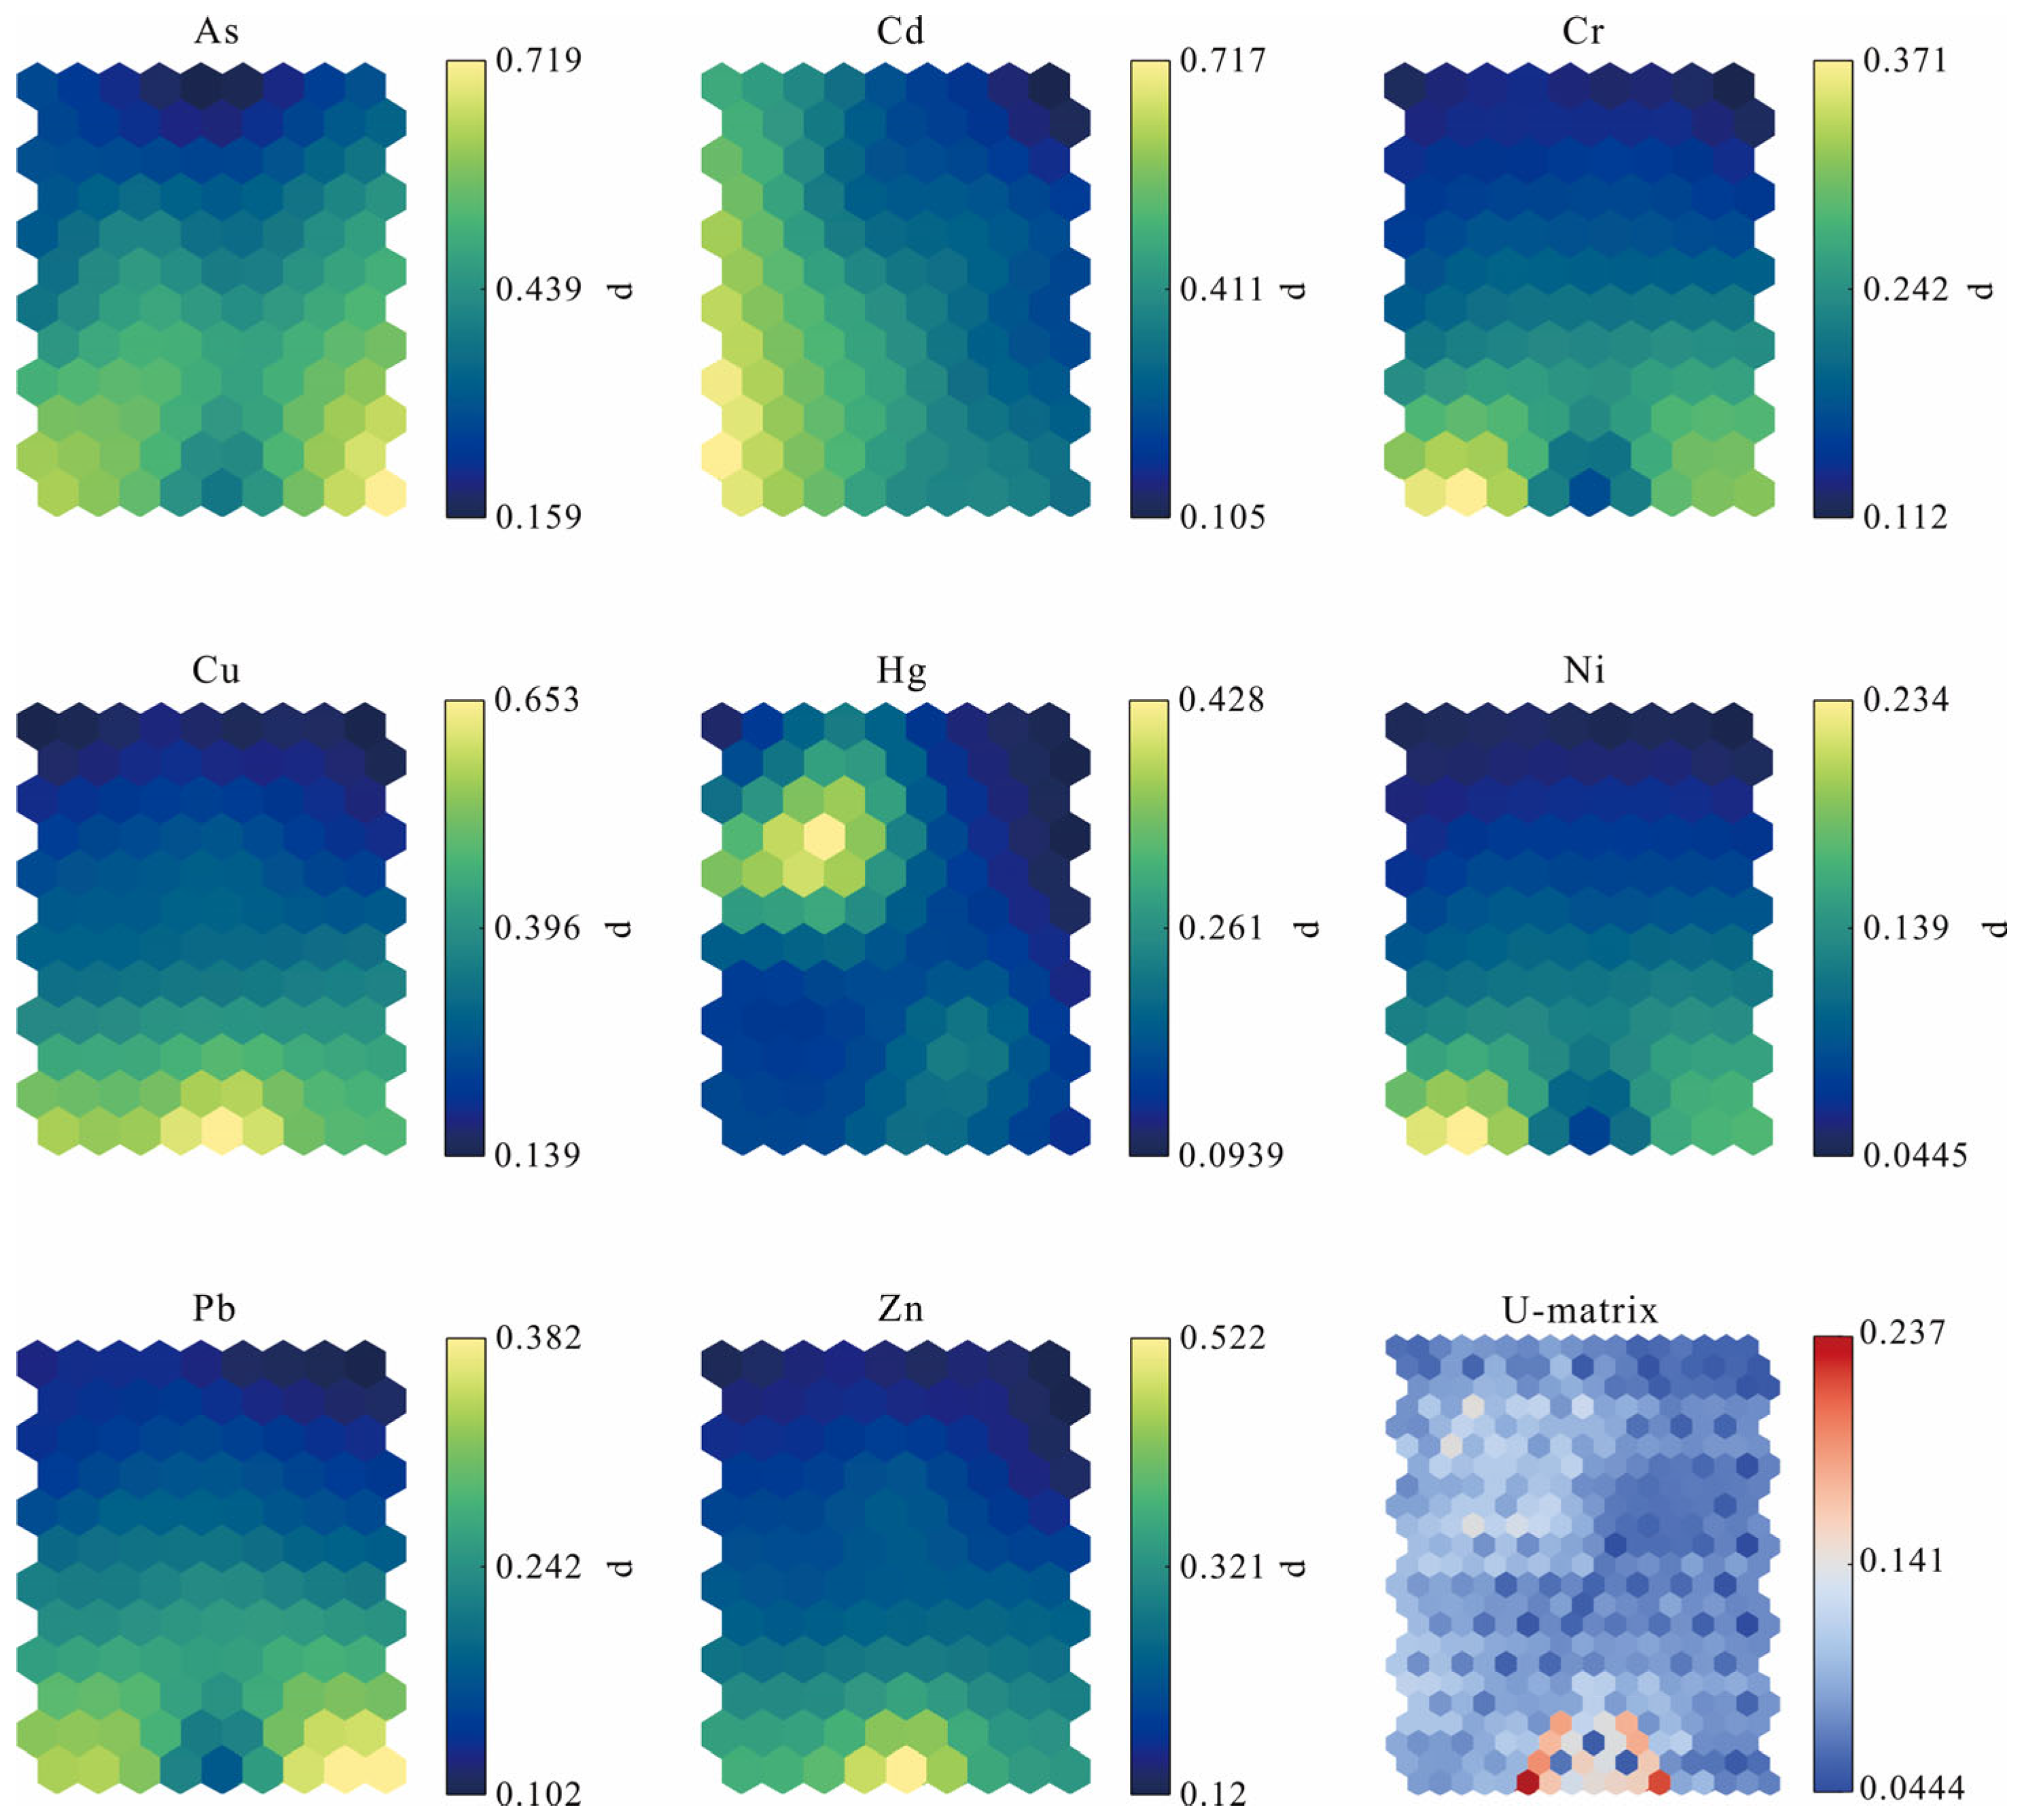
Based on the quantitative source apportionment obtained from PMF, the contribution rates of element groupings were determined. To investigate the spatial characteristics of heavy metal sources, the SOM method was employed to validate the grouping of heavy metals. The SOM model was implemented using the MATLAB SOM Toolbox 2.0 with the following configuration: Input data were normalized via Z-score standardization to eliminate dimensional influences. The output layer was configured as a 12 × 9 two-dimensional grid with hexagonal topology, whose dimensions were determined based on the 5√a heuristic rule. The training procedure employed a linearly decaying learning rate strategy (from 0.05 to 0.01) with a Gaussian neighborhood function, running for 1000 training epochs. Internal validation, in addition to the final quantization error (QE = 0.140) and final topographic error (TE = 0.035), included assessment through visualization results (U-Matrix and component planes). The results demonstrate well-defined cluster structures, effective preservation of the original data’s topological relationships, and confirm that the model reached a stable convergence state. In the SOM plane clustering dendrogram (Figure 7), As and Pb exhibited similar clustering characteristics, with high clustering features primarily located in the lower-right corner of the matrix. Cr and Ni also showed comparable clustering patterns, with high clustering features mainly in the lower-left corner. Similarly, Cu and Zn demonstrated analogous clustering behaviors, with high clustering features concentrated in the lower-middle portion of the matrix. In contrast, Hg and Cd displayed distinctly different clustering characteristics compared to the other elements, reflecting greater spatial heterogeneity, consistent with their higher coefficients of variation. Overall, the SOM plane matrix showed good agreement with the PMF classification results, and the color patterns in the feature planes highlighted the effectiveness of SOM in analyzing the spatial heterogeneity of the elements.
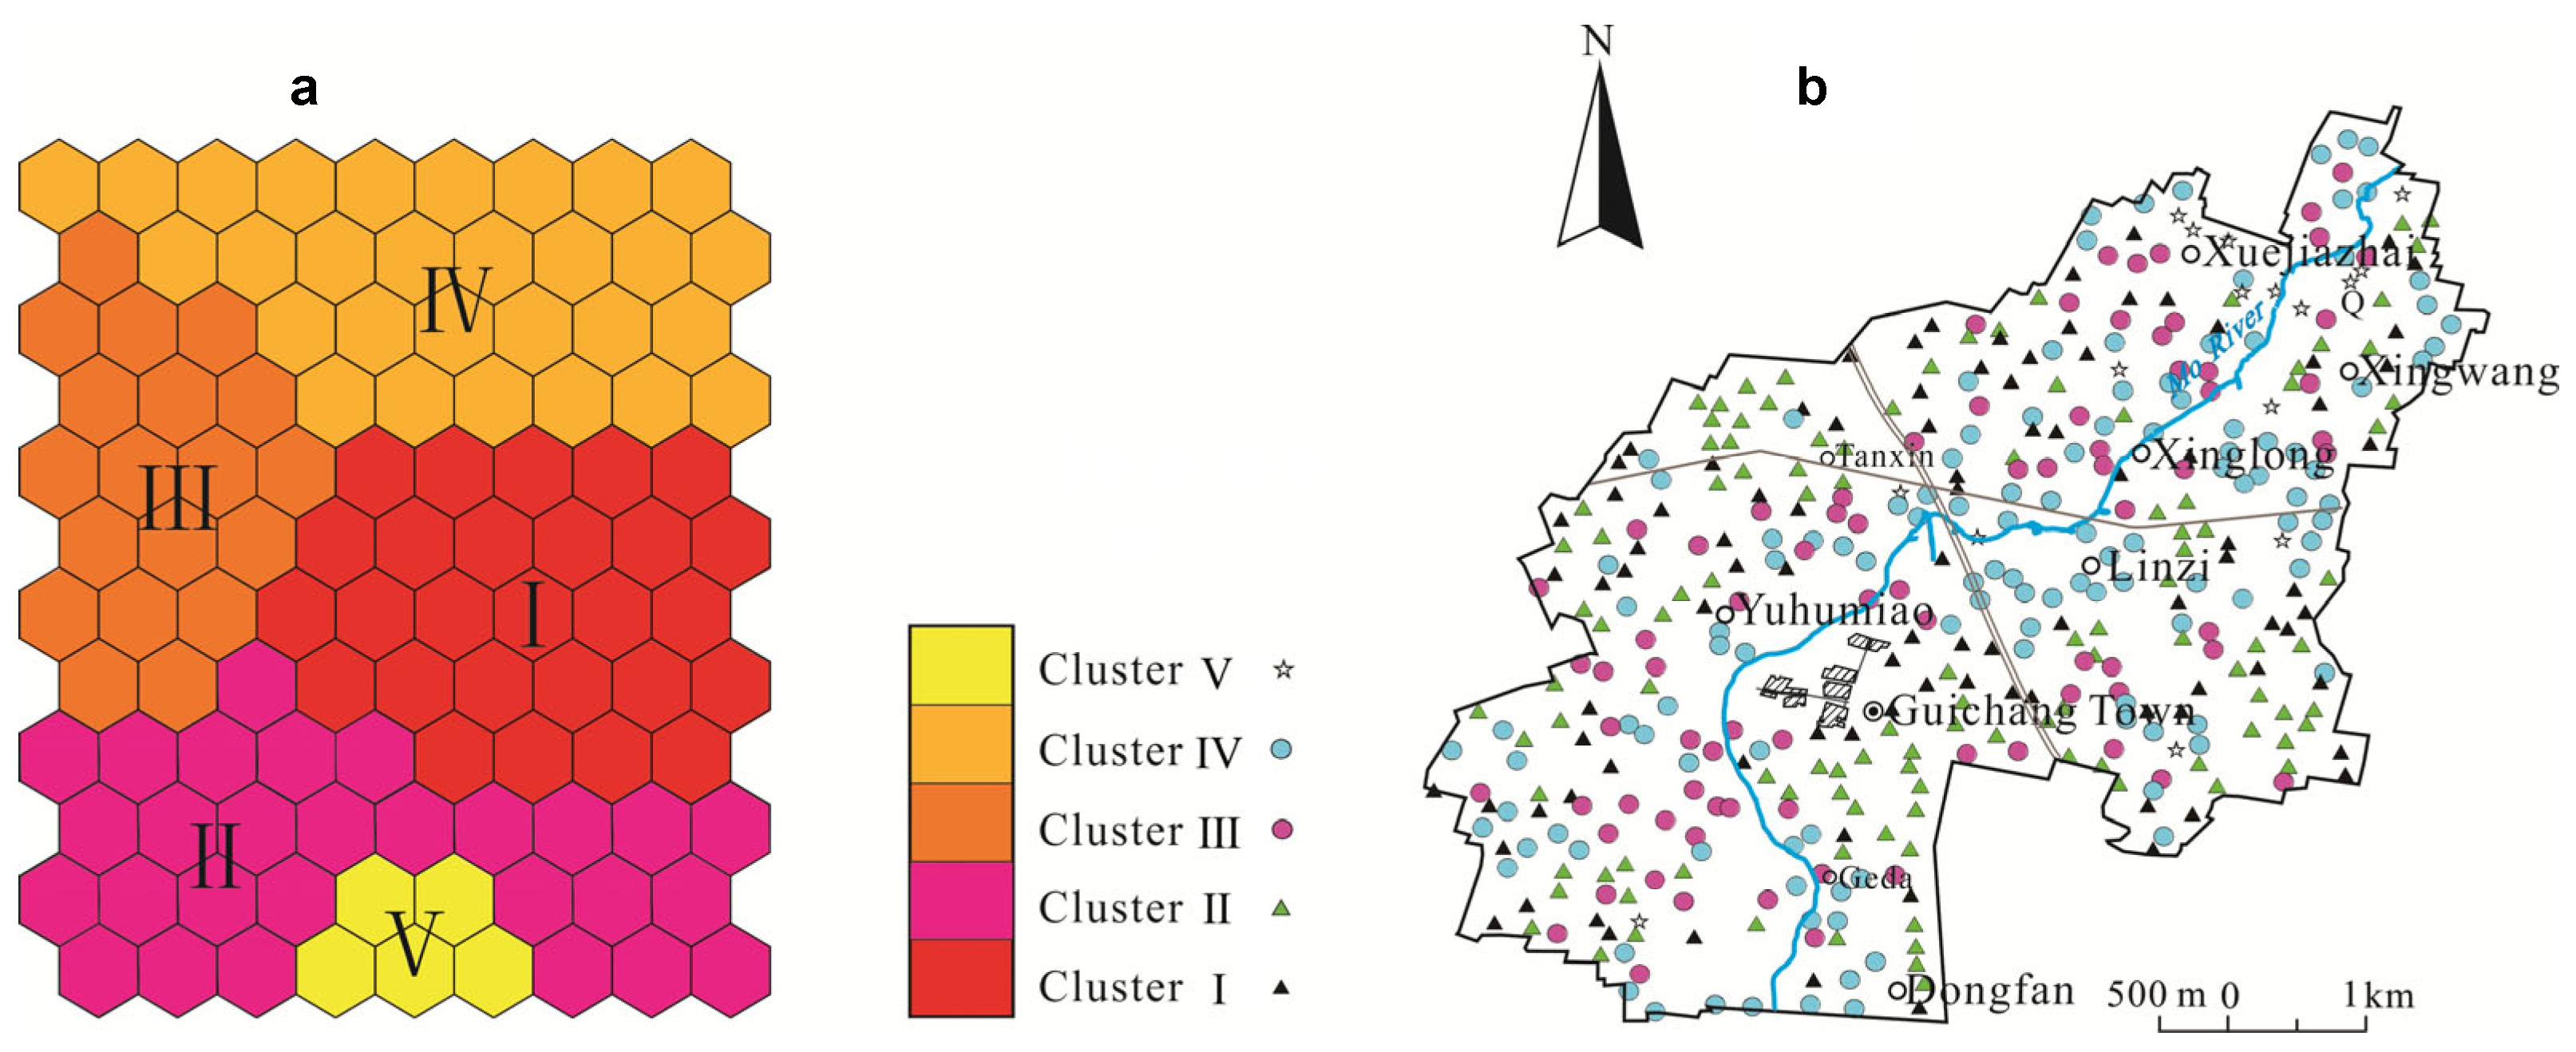
Based on the classification information revealed by the SOM feature planes, K-means clustering was applied. The Elbow Method was used to determine the optimal number of clusters, which was found to be k = 5. At this value, the 427 sampling points were grouped into five clusters (Figure 8a): Cluster I (N = 196), Cluster II (N = 112), Cluster III (N = 79), Cluster IV (N = 124), and Cluster V (N = 16). Considering the spatial distribution of sampling points (Figure 8b), the element patterns, and the geomorphological features, Clusters I and IV account for the majority of sampling information, covering both the river and the adjacent paddy soils. These clusters collectively represent the distribution of elements such as As, Pb, Cr, and Ni in the river and surrounding paddy soils, thereby reflecting the geological background of the small watershed. This interpretation is consistent with the information conveyed by Factor 2 in the PMF analysis. Cluster II points are distributed farther from the river within the paddy soil regions, with a concentration in the central–southern area. This distribution corresponds to the high areal concentrations of Cd in the same region and is consistent with the information conveyed by Factor 3 in the PMF analysis. Cluster III points show a strip-like distribution along the predominant wind direction, concentrated in the western part of the river, where Hg exhibits relatively elevated concentrations. This pattern aligns with the information conveyed by Factor 1 in the PMF analysis. Cluster V points are primarily located in the north-central part of the study area, corresponding to the upper reaches of the watershed where ginkgo gardens and orchard bases are situated. This area shows pronounced anomalies of Cu and Zn, which are largely consistent with the information conveyed by Factor 4 in the PMF analysis.

3.3. Environmental Capacity of Soil Heavy Metals

3.3.1. Static Environmental Capacity of Heavy Metals

Based on the background values and soil risk screening values of heavy metals in the study area, the static environmental capacity (Csp) and existing environmental capacity (CSS) of heavy metals in the soil were calculated (Table 5). Table 5 shows that the average concentrations of As, Cd, Cr, Cu, Hg, Ni, Pb, and Zn in the study area are 41.63, 0.39, 200.03, 59.13, 1.06, 73.58, 98.78, and 348.88 kg·hm−2, respectively. The corresponding average Csp values are 40.14, 0.39, 207.47, 83.37, 1.08, 113.10, 153.69, and 332.43 kg·hm−2, respectively. The ranking order of both sets of values is: Zn > Cr > Pb > Ni > Cu > As > Hg > Cd. The existing capacities of the eight heavy metals in the soil decreased by 1.49, 0, 105.50, 88.30, 0.21, 50.47, 57.59, and 84.95 kg·hm−2, respectively. The decreasing order was: Cr > Cu > Zn > Pb > Ni > As > Hg > Cd. Among these, the decreases in Cr, Cu, Ni, Pb, and Zn were the most pronounced, each exceeding 50%. According to the coefficients of variation in soil heavy metal environmental capacity, As, Hg, and Zn exhibit low to medium variability, and their existing environmental capacities changed only slightly. In contrast, the remaining elements display moderate to high variability, with substantial changes in their capacities. The variation coefficients of Ni and Cu are 30.5% and 56.67%, respectively, indicating high variability, which is related to their spatial distributions and the selection of risk screening values under different pH conditions.

3.3.2. Evaluation of Soil Environmental Capacity

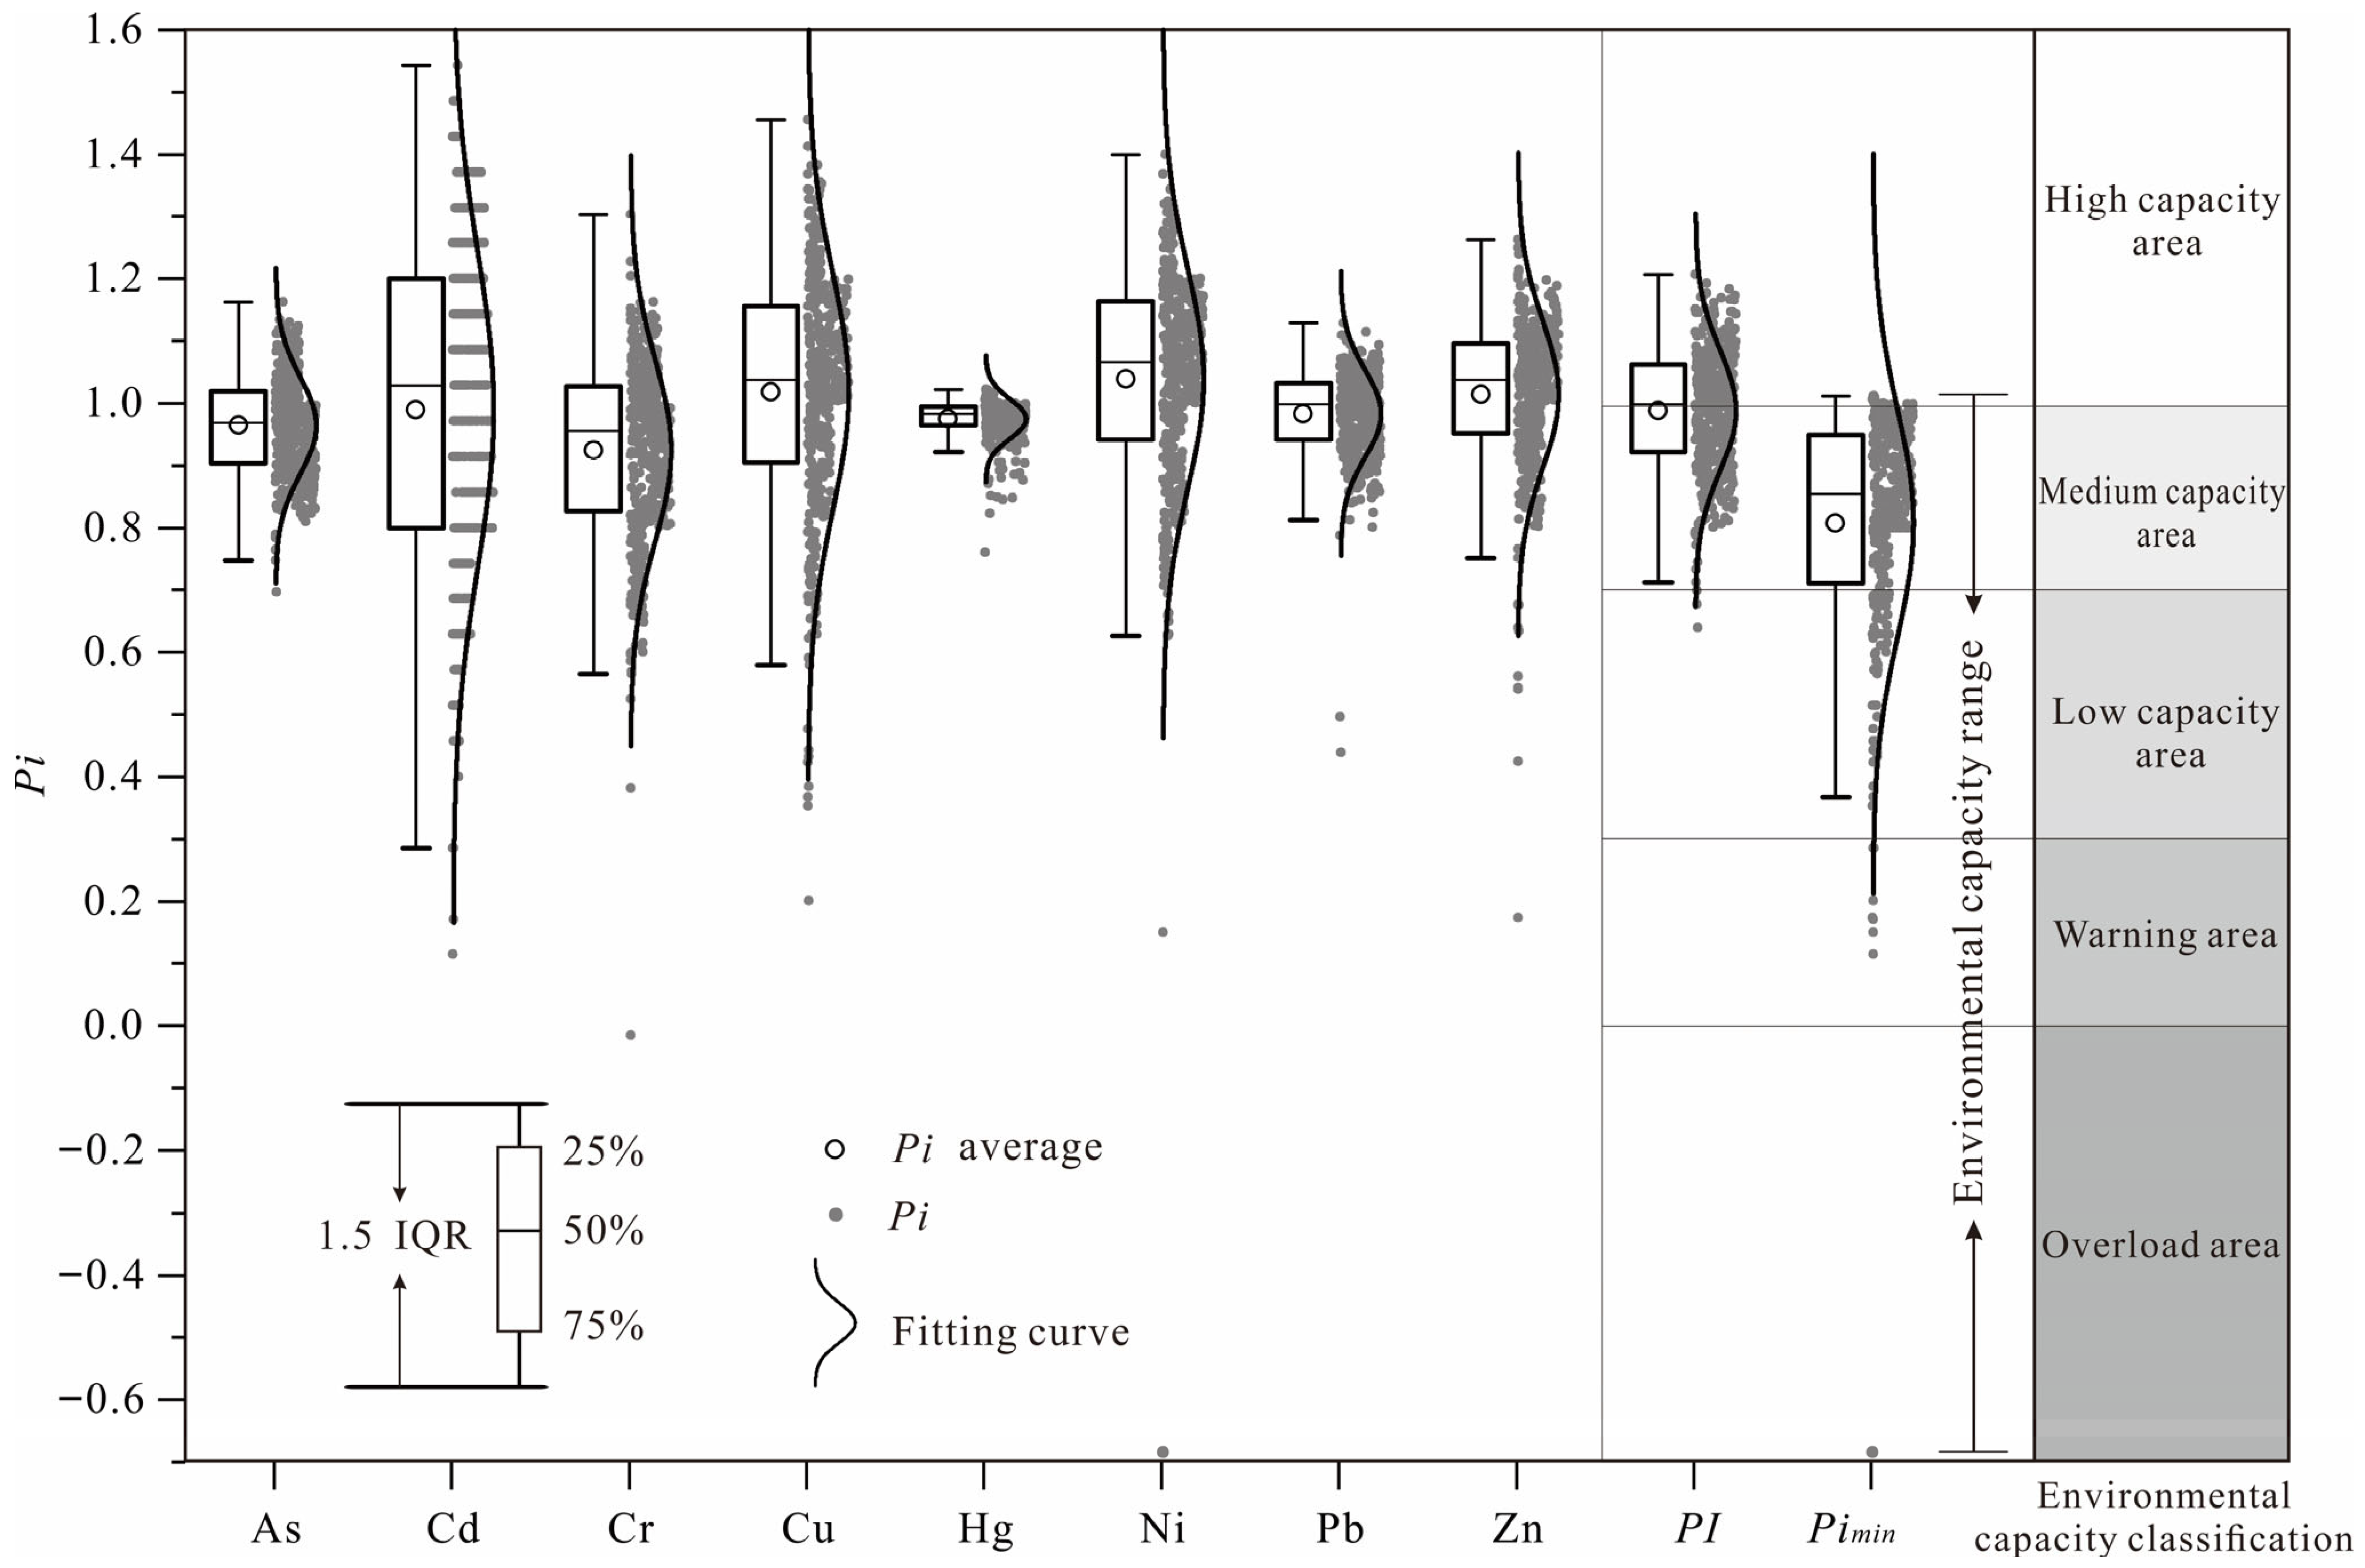
The Pi values of heavy metals in the study area, together with the comprehensive environmental capacity indices (PI and PImin), and their classification results are presented in Table 6 and Figure 9. Table 6 and Figure 9 show that the environmental capacity indices of soil As, Cd, Cr, Cu, Hg, Ni, Pb, and Zn differ to some extent across the study area. The average environmental capacity indices of the eight heavy metals were 0.96, 0.99, 0.92, 1.02, 0.98, 1.04, 0.98, and 1.01, respectively. The average PI was 0.99, and the average PImin was 0.81, indicating that the overall environmental capacity of soil heavy metals in the study area is at a medium capacity level. Specifically, As, Cd, Cr, Cu, Ni, Pb, and Zn show low-capacity levels, accounting for 0.2% (1 point), 13.3% (57 points), 8.0% (34 points), 5.6% (24 points), 1.4% (6 points), 0.5% (2 points), and 2.1% (9 points), respectively. Among these, Cd, Cr, Cu, Ni, and Zn also include warning-level points, accounting for 1.2% (5 points), 0.2% (1 point), 0.2% (1 point), 0.2% (1 point), and 0.2% (1 point), respectively, while Ni further includes one overload-level point. These results indicate that the farmland system in the study area is generally at a relatively clean level, although Cd, Cr, Cu, Ni, and Zn in the farmland show slight pollution. Further comparison of the comprehensive environmental capacity index (Figure 9) shows that the PI values correspond to 424 medium- and high-capacity level points and 3 low-capacity level points, accounting for 99.3% and 0.7%, respectively. Based on the minimum Pi value (PImin), the results correspond to 324 medium- and high-capacity level points, 94 low-capacity level points, 8 warning points, and 1 overload point, accounting for 75.9%, 22.0%, 1.9%, and 0.2%, respectively. The distribution range of PImin values is significantly larger than that of PI. According to the “bucket principle”, the risk level of a single heavy metal can influence the comprehensive evaluation results, and the same applies to the environmental capacity index. Based on this reasoning, we propose that the improved comprehensive environmental capacity index (PImin) provides a more objective assessment of the environmental capacity level in the study area.
To further validate the comprehensive environmental capacity index described above, spatial distribution maps of PI and PImin were generated (Figure 10). The PI values (Figure 10a) generally indicated high capacity levels in the fluvo-aquic soil areas near the central river, whereas the paddy soil areas on both sides predominantly showed medium capacity levels. Sporadic low-capacity sites were observed in the western part of Dongfang Village, located in the lower reaches of the watershed. In contrast, the PImin values (Figure 10b) demonstrated a more uniform distribution of medium capacity levels across the study area. Low-capacity zones were primarily identified in northern areas, including Xuejiazhai–Xingwang Village, Tanxin–Yuhuangmiao Village, and Geda Village. Isolated sites with alert-to-overload levels were observed in the western part of Dongfang Village, located in the lower watershed. The spatial distribution of PImin showed a significant correlation with the spatial patterns of elements such as Cr, Ni, Cu, Zn, and Cd. Based on previous findings regarding heavy metal sources, the comprehensive environmental capacity index in the study area is mainly influenced by the combined effects of natural sources (represented by Cr and Ni) and agricultural sources (represented by Cu, Zn, and Cd).

3.4. Health Risk Assessment of Heavy Metals

3.4.1. Heavy Metal Exposure Assessment

Statistical results for different exposure routes (Table 7) indicate that, for both adults and children, the average daily dose follows the order: ADDing > ADDder > ADDinh. Among these, ADDing is the dominant pathway, accounting for over 95% of the total ADD (96.2% for adults and 97.3% for children). Children exhibit significantly higher exposure levels than adults, likely due to behavioral characteristics such as frequent hand-to-mouth activity (e.g., finger sucking) and greater involvement in ground-level play [72], which increase contact with heavy metal-contaminated soil. Regarding individual elements, Cr concentrations in the study area exceeded relevant reference values, with maximum levels surpassing risk-screening thresholds. Consequently, ingestion accounted for the highest Cr intake in both adults and children. These findings confirm hand-to-mouth ingestion as the primary exposure route and highlight children’s heightened vulnerability, consistent with previous research on heavy metal exposure risks in small watershed soils [42].

3.4.2. Health Risk Characterization and Spatial Distribution

To assess the differential toxic effects of eight heavy metals on adults and children across various exposure pathways, we calculated single-element non-carcinogenic hazard quotients (HQs) and the overall non-carcinogenic hazard index (HI) (Table 8; Figure 11a).
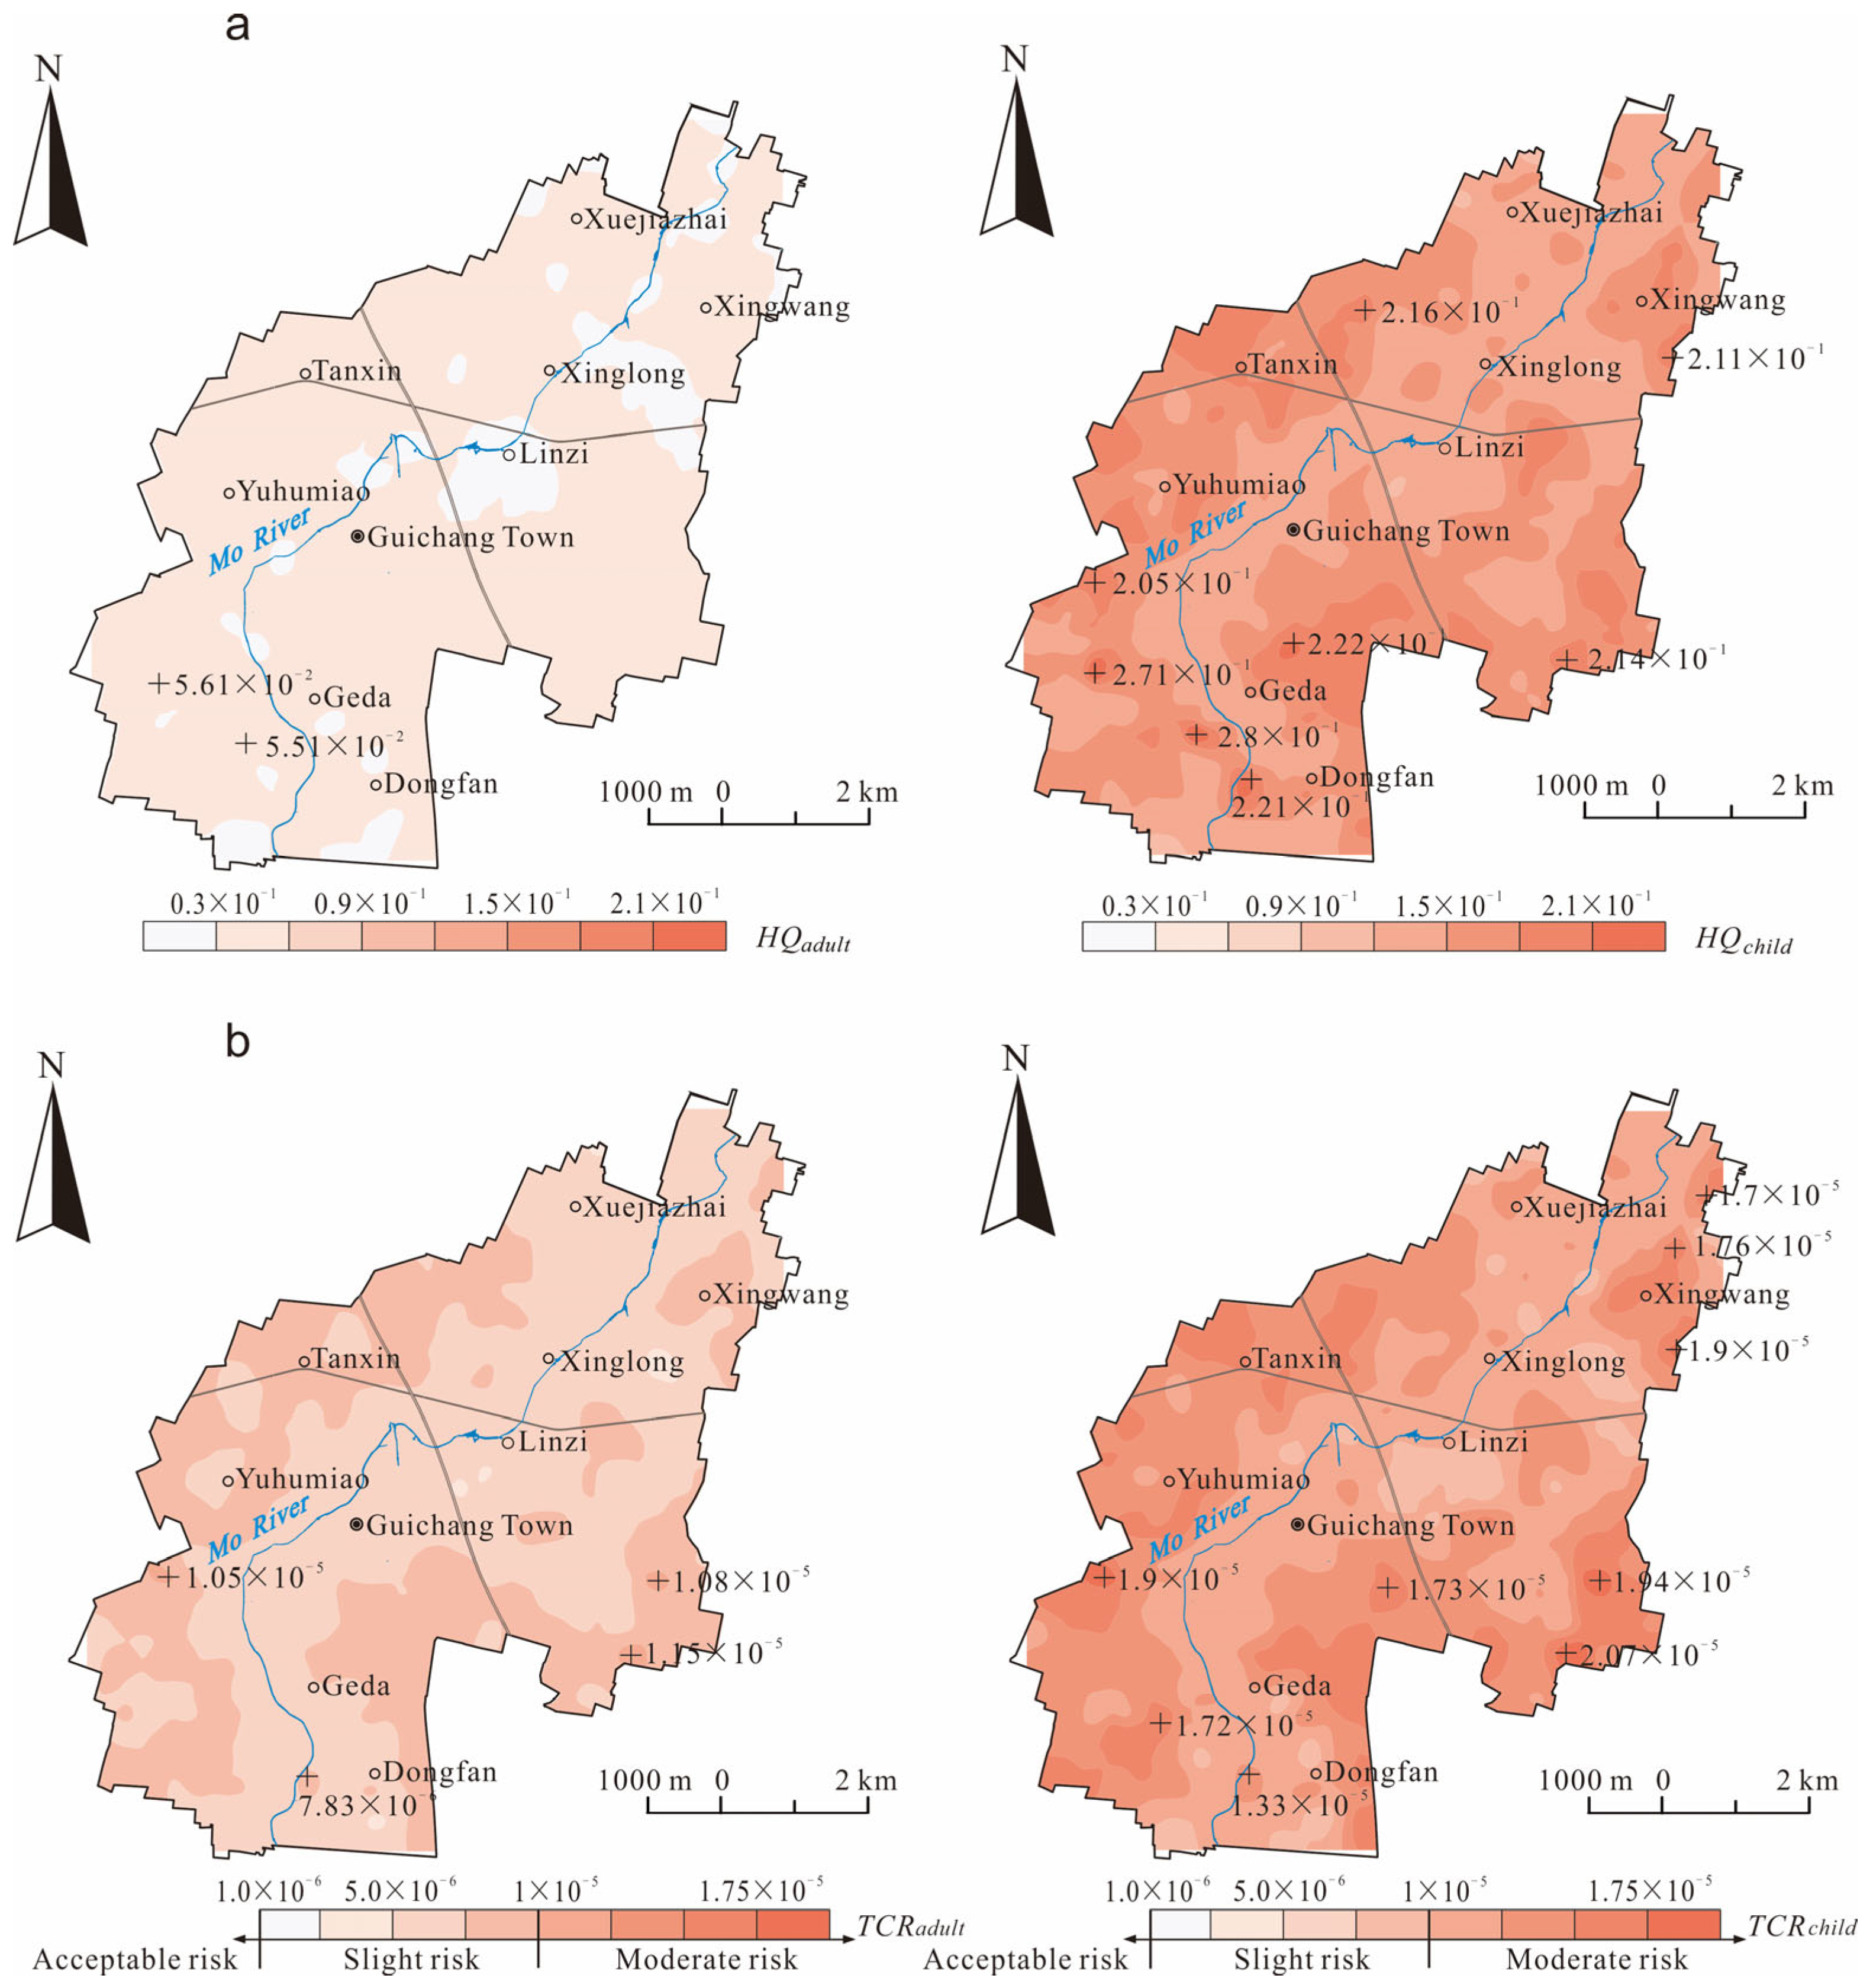
The non-carcinogenic risk assessment revealed that HQ values for adults followed the order Pb > As > Ni > Cu > Cd > Zn > Hg > Cr, whereas for children the order was Pb > As > Ni > Cu > Zn > Hg > Cd > Cr. For individual metals, all HQ values were below 1 for both groups, indicating no significant non-carcinogenic health risks from single-metal exposure. The cumulative HI values were 3.53 × 10⁻² for adults and 1.57 × 10⁻¹ for children, both below the safety threshold (HI > 1), indicating no appreciable non-carcinogenic health risks for residents. As, Pb, Ni, and Cu together contributed more than 94% of the HI (Table 8), representing the primary non-carcinogenic risk factors. Spatially, HIadult values were uniformly below 0.9 × 10⁻¹, whereas elevated HIchild values (>2.1 × 10⁻¹) clustered in cultivated lands and villages along riverbanks (Figure 11a). This spatial pattern reflects intensified human activity in riverside areas, where children’s greater soil exposure through diet and behavior increases vulnerability. Elevated non-carcinogenic risks in these zones were primarily driven by naturally derived As, Pb, and Ni, with the highest concentrations occurring in central–southern river bends where physicochemical conditions promote fine-particle enrichment. Notably, the HQ and HI values obtained in this study were substantially lower than those reported by Liu et al. [73], Fan et al. [74], and Bo et al. [75] in adjacent regions, likely due to our larger spatial scale, denser sampling design, and relatively homogeneous soil types within this small watershed system.
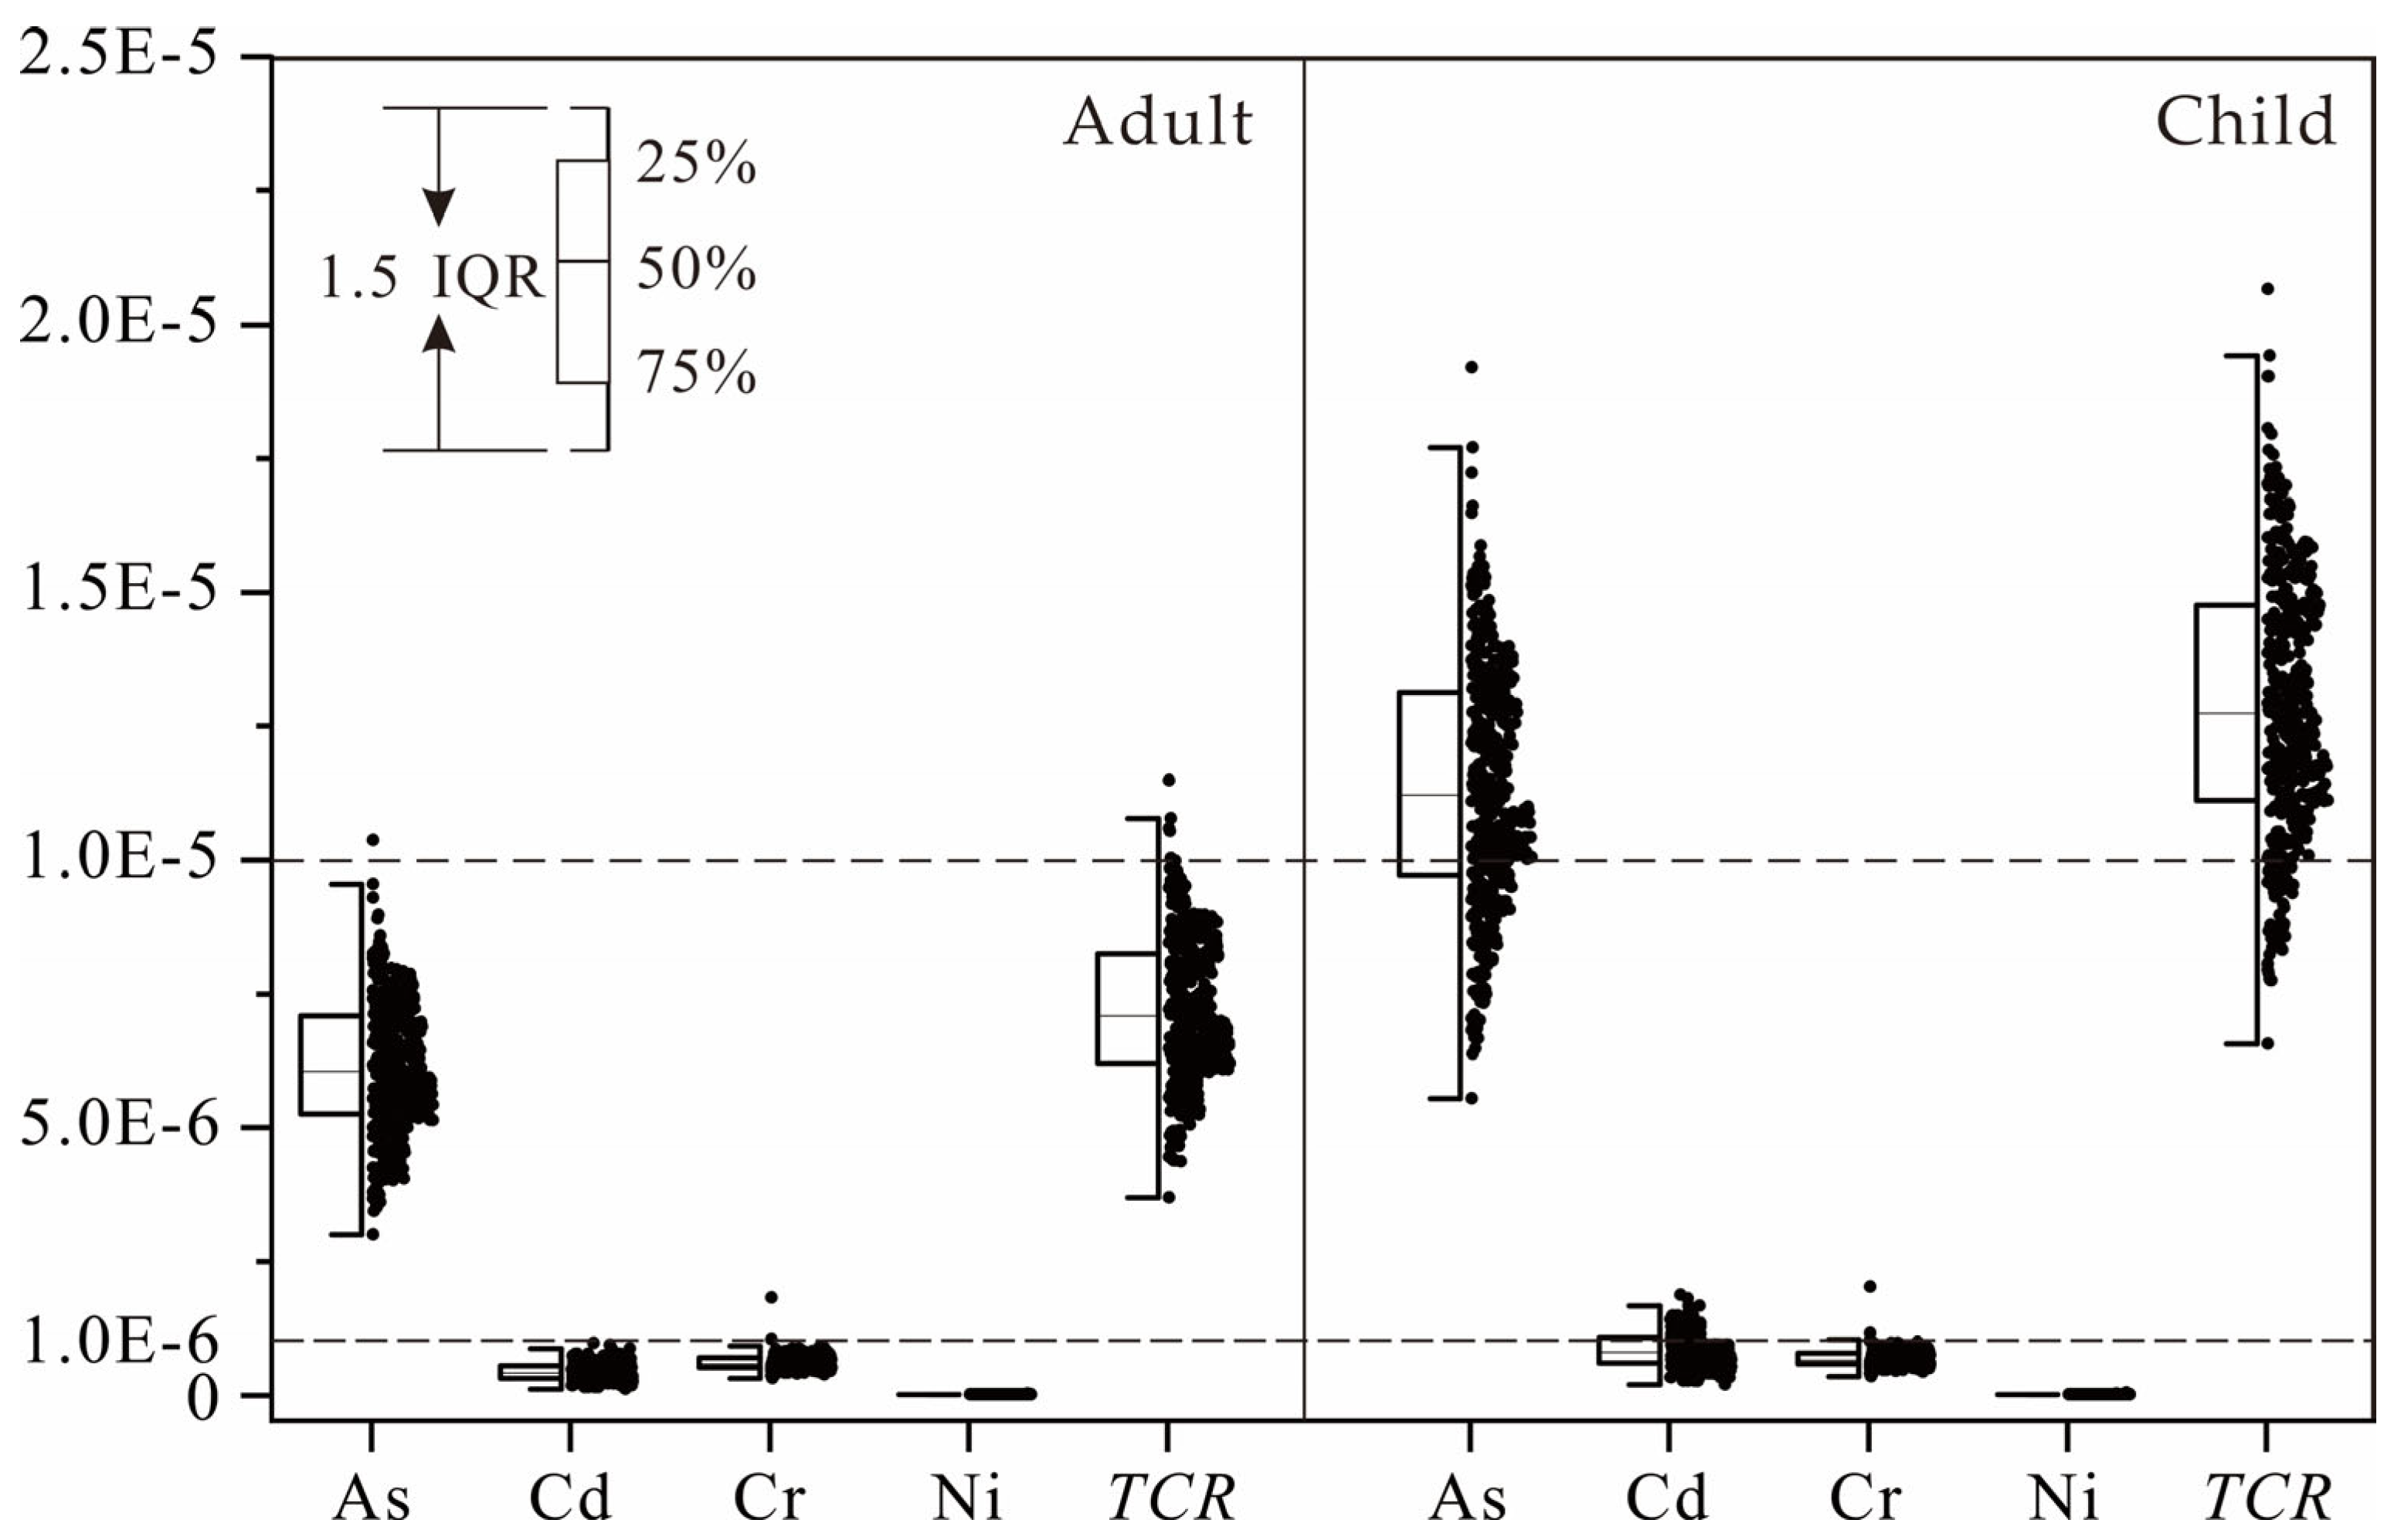
As, Cd, Ni, and Cr—classified as Group 1 carcinogens by the International Agency for Research on Cancer (IARC)—were evaluated for carcinogenic risk [32,74]. The carcinogenic risk assessment (Table 9) showed that for both As and Cd, exposure pathways followed the order CRing > CRdermal > CRinh, confirming hand-to-mouth ingestion as the primary carcinogenic exposure route. Carcinogenic risks for adults and children decreased in the order As > Cr > Cd > Ni. As was the predominant contributor (Figure 12), with mean contributions of (85.1 ± 2.6)% and (87.8 ± 2.6)% to the TCR in adults and children, respectively. The mean total carcinogenic risks (TCRs) were 7.18 × 10⁻⁶ for adults and 1.29 × 10⁻⁵ for children, both exceeding the acceptable risk threshold (1 × 10⁻⁶) (Figure 11b and Figure 12). The maximum TCRadult was 1.15 × 10⁻⁵, with five sampling points (1.2% of the total) exceeding the 1 × 10⁻⁵. In contrast, TCRchild levels were generally higher, reaching a maximum value of 2.07 × 10⁻⁵, with 372 sampling points (86.7% of the total) surpassing the 1 × 10⁻⁵. To quantify the uncertainty in the TCRchild, the 95% confidence interval of the mean was calculated as 1.27 × 10⁻⁵ to 2.07 × 10⁻⁵. Statistical analysis confirmed that even the lower confidence limit (1.27 × 10⁻⁵) remains above the moderate risk threshold (1 × 10⁻⁵), substantiating the credibility of the conclusion that elevated TCR is widespread among children. These findings demonstrate that the population in the study area, particularly children, is exposed to discernible carcinogenic risks. However, these TCR values were lower than those reported by Liu et al. [73] in nearby hilly areas, with the different risk prioritization potentially reflecting unique supergene geochemical processes in small-watershed environments. Notably, areas of high carcinogenic risk and non-carcinogenic risk for children were colocated, primarily near riverside croplands and villages. A distinct convergence pattern was evident to the east and south of Geda Village and southwest of Yuhumiao Village, which aligns consistently with the spatial distribution reflected by the PImin index (Figure 10). This indicates that children in these locales are subject to dual health risks, which are often associated with areas of concurrent environmental capacity limitation and moderate health risks. However, while some studies consider carcinogenic risks acceptable within the range of 1 × 10⁻⁶–1 × 10⁻⁶ [42], it is important to note that our assessment accounted only for direct soil exposure pathways. In reality, humans are exposed to heavy metals through multiple vectors, including drinking water and contaminated foodstuffs (e.g., vegetables, meat, and liquids) [47,68]. A comprehensive multi-pathway exposure assessment is therefore recommended to identify the dominant exposure routes [42,47].

4. Conclusions

The soils in the study area were weakly acidic, with varying degrees of accumulation observed for multiple heavy metals. Cd and Hg exhibited high spatial variability (CV > 34%), and Hg showed particularly significant enrichment (EFaverage = 1.37). As, Cr, Ni, and Pb displayed significant negative correlations with pH and were distributed in low-concentration zones along the Mo River. In contrast, Cd exhibited areal high concentrations in the central-southern farmland, while Hg hotspots corresponded well with the distribution of villages and towns, reflecting significant anthropogenic influence.
Quantitative source apportionment based on PMF and SOM revealed that As, Cr, Ni, and Pb were primarily derived from natural pedogenic parent materials, accounting for 25.9% of the total variance. Cd, Cu and Zn were closely associated with agricultural activities, contributing 20.8% and 42.8% of the variance, respectively. Hg enrichment was influenced by residential coal combustion and prevailing wind patterns, contributing 10.5% of the variance, highlighting the source-specific characteristics of anthropogenic inputs.
Environmental capacity assessment indicated that the remaining capacities of Cr, Cu, Zn, Pb, and Ni decreased by more than 50%. Although the overall environmental capacity remained at a moderate level, localized sites exhibited reduced to alert-level capacity, particularly for Cd, Cu, and Zn, which are closely linked to agricultural practices.
Health risk assessment demonstrated that non-carcinogenic risks in the study area remain within acceptable limits (HI < 1). However, carcinogenic risks for children were notably high, with 86.7% of the sampling sites exceeding the TCR threshold of 1 × 10⁻⁵. As was identified as the primary carcinogenic factor, and hand-to-mouth ingestion was the dominant exposure pathway, accounting for over 95% of the average daily dose. Notably, the high health risk areas showed strong spatial consistency with regions of low environmental capacity in farmland and riverside villages.
This study provides a scientific basis for the precise prevention and control of soil heavy metals at the small watershed scale, both methodologically and practically. By integrating a systematic framework encompassing “source apportionment—environmental capacity—health risk assessment,” it elucidates the synergistic effects of natural and anthropogenic sources and identifies priority control elements along with their spatial distribution. The findings highlight the necessity to prioritize the management of agricultural and coal combustion inputs and to enhance health protection for children. This work advocates for establishing an integrated management system tracing “sources–key pathways–health risks,” offering a practical paradigm for ensuring soil safety and safeguarding public health in high-value agricultural product regions.

Author Contributions

Conceptualization, L.Y., Y.C. and Z.S.; methodology, L.Y. and Z.Z. (Zhaoyu Zhou); writing—original draft preparation, L.Y., Y.C., Z.Z. (Zhaoyu Zhou), J.Z. and H.L.; writing—review and editing, L.Y., J.Z. and S.L.; visualization, J.Z.; supervision, S.L., Z.Z. (Zhigao Zhang) and F.Z.; project administration, Z.S.; funding acquisition, Z.S. All authors have read and agreed to the published version of the manuscript.

Funding

This research was supported by the Henan Provincial Science and Technology Key Research and Development Project (252102320218) and the Key Scientific Research Project Plan of Colleges and Universities in Henan Province (25A170002).

Informed Consent Statement

Not applicable.

Data Availability Statement

The data presented in this study are available on request from the corresponding author due to the processed data not being publicly available and being used in an ongoing study.

Acknowledgments

The authors sincerely thank the editors and reviewers for their valuable comments and suggestions.

Conflicts of Interest

The authors declare no conflicts of interest.

References

  1. Food and Agriculture Organization of the United Nations (FAO). The State of the World’s Land and Water Resources for Food and Agriculture: Systems at Breaking Point (SOLAW 2021); Food and Agriculture Organization of the United Nations (FAO): Rome, Italy, 2021. [Google Scholar] [CrossRef]
  2. Food and Agriculture Organization of the United Nations (FAO); United Nations Environment Programme (UNEP). Global Assessment of Soil Pollution: Report; Food and Agriculture Organization of the United Nations (FAO): Rome, Italy; United Nations Environment Programme (UNEP): Gigiri Nairobi, Kenya, 2021. [Google Scholar] [CrossRef]
  3. Balkhair, K.S.; Ashraf, M.A. Field accumulation risks of heavy metals in soil and vegetable crop irrigated with sewage water in western region of Saudi Arabia. Saudi J. Biol. Sci. 2016, 23, 32–44. [Google Scholar] [CrossRef] [PubMed]
  4. Zhao, D.J.; Wang, X.Q. Distribution, sources and potential ecological risk of heavy metals in the floodplain soils of the karst area of Yunnan, Guizhou, Guangxi. China Environ. Sci. 2020, 40, 1609–1619. [Google Scholar] [CrossRef]
  5. Li, X.; Tang, K.; Jiang, J.; Wang, X.; Yan, Z. A study on soil priority management of toxic and hazardous substances for development land. Asian J. Ecotoxicol. 2023, 18, 308–326. [Google Scholar] [CrossRef]
  6. Chai, L.; Wang, X.; Ma, L.; Cheng, Z.X.; Su, L.M.; Wang, Y.H. Sources appointment of heavy metals in cultivated soils of Lanzhou based on PMF models. China Environ. Sci. 2020, 40, 3919–3929. [Google Scholar] [CrossRef]
  7. Hou, D.Y.; Jia, X.Y.; Wang, L.W.; Steve, P.M.; Zhu, Y.G.; Hu, Q.; Zhao, F.J.; Michael, S.B.; O’Connor, D.; Jerime, N. Global soil pollution by toxic metals threatens agriculture and human health. Science 2025, 388, 316–321. [Google Scholar] [CrossRef]
  8. Qian, L.L.; Zuo, F.; Liu, H.Y.; Zhang, C.D.; Chi, X.X.; Zhang, D.J. Determination of geographical origin of Wuchang Rice with the geographical indicator by multielement analysis. J. Food Qual. 2019, 1, 8396865. [Google Scholar] [CrossRef]
  9. Wang, X.H.; Song, X.J.; Cao, D.M.; Zhang, D.J.; Li, Z.J.; Zhang, C. Distribution and health risk evaluation of heavy metal lead in the main production area of rice in Heilongjiang Province. Food Sci. Technol. 2023, 43, e000623. [Google Scholar] [CrossRef]
  10. Zhao, Q.L.; Li, Q.; Xie, J.; Li, Y.; Ji, H.; Pang, C.; Wan, M. Characteristics of soil heavy metal pollution and its ecological risk assessment in South Jining District using methods of enrichment factor and index of geoaccumulation. Rock Miner. Anal. 2015, 34, 129–137. [Google Scholar] [CrossRef]
  11. Yu, L.; Wan, F.; Fan, H.; Kang, G.; Liu, H.; Wang, D.; Xu, J. Spatial distribution, source apportionment, and ecological risk assessment of soil heavy metals in Jianghugongmi Producing Area, Shandong Province. Environ. Sci. 2022, 43, 4199–4211. [Google Scholar] [CrossRef]
  12. Abrahim, G.; Parker, R.J. Assessment of heavy metal enrichment factors and the degree of contamination in marine sediments from Tamaki Estuary, Auckland, New Zealand. Environ. Monit. Assess. 2008, 136, 227–238. [Google Scholar] [CrossRef]
  13. Gu, Y.G.; Wang, Z.H.; Lu, S.H.; Jiang, S.J.; Mu, D.H.; Shu, Y.H. Multivariate statistical and GIS-based approach to identify source of anthropogenic impacts on metallic elements in sediments from the mid Guangdong coasts, China. Environ. Pollut. 2012, 163, 248–255. [Google Scholar] [CrossRef]
  14. Müller, G. Heavy metal pollution of the sediments of Neckars and its tributary: A stocktaking. Chem. Ztg. 1979, 105, 157–164. [Google Scholar]
  15. Reimann, C.; Caritat, P. Intrinsic flaws of element enrichment factors (EFs) in environmental geochemistry. Environ. Sci. Technol. 2000, 34, 5084–5091. [Google Scholar] [CrossRef]
  16. Kumar, V.; Sharma, A.; Pandita, S.; Bhardwaj, R.; Thukral, A.; Cerda, A. A review of ecological risk assessment and associated health risks with heavy metals in sediment from India. Int. J. Sediment Res. 2020, 35, 516–526. [Google Scholar] [CrossRef]
  17. Zhang, L.P.; Ye, X.; Feng, H.; Jing, Y.; Yu, X.; Liang, R.; Gao, C.; Chen, W. Heavy metal contamination in western Xiamen Bay sediments and its vicinity, China. Mar. Pollut. Bull. 2007, 54, 974–982. [Google Scholar] [CrossRef]
  18. Yan, L.P.; Xie, X.M.; Tang, Z.H. Study on soil heavy metal environmental capacity in Shantou City based on source analysis. Earth Sci. Front. 2024, 31, 403–416. [Google Scholar] [CrossRef]
  19. Sutherland, R.A. Bed sediment-associated trace metals in an urban stream, Oahu, Hawaii. Environ. Geol. 2000, 39, 611–627. [Google Scholar] [CrossRef]
  20. US EPA. EPA Positive Matrix Factorization 5.0 Fundamentals and User Guide; U.S. EPA: Washington, DC, USA, 2014. Available online: https://www.epa.gov/air-research/epa-positive-matrix-factorization-50-fundamentals-and-user-guide (accessed on 15 May 2025).
  21. Kohonen, T. The self-organizing map. Neurocomputing 1998, 21, 1–6. [Google Scholar] [CrossRef]
  22. Kohonen, T.; Oja, E.; Simula, O.; Visa, A.; Kangas, J. Engineering applications of the self-organizing map. Proc. IEEE 1996, 84, 1358–1384. [Google Scholar] [CrossRef]
  23. Vesanto, J.; Alhoniemi, E. Clustering of the self-organizing map. IEEE Trans. Neural Netw. 2000, 11, 586–600. [Google Scholar] [CrossRef]
  24. Bigdeli, A.; Maghsoudi, A.; Ghezelbash, R. Application of self-organizing map (SOM) and K-means clustering algorithms forportraying geochemical anomaly patterns in Moalleman district, NE lran. J. Geochem. Explor. 2022, 233, 106923. [Google Scholar] [CrossRef]
  25. Han, C.; Hu, G.; Yu, R.; Zhao, D.; Wu, Y. Self-organizing map (SOM) and positive matrix factorization (PMF) Models for source apportionment of metals in sediments of a wetland park. Environ. Sci. 2025, 46, 5070–5081. [Google Scholar] [CrossRef]
  26. Xie, X.; Wang, S.; Li, M.; Zhou, Z.; Zhang, Z.; Tang, Z. Assessment of soil environmental capacity for heavy metals in Shantou City, Guangdong Province, China: Source analysis and enrichment evaluation. Environ. Monit. Assess. 2024, 196, 978. [Google Scholar] [CrossRef]
  27. Fu, C.C.; Wang, W.Y.; Pan, J.J.; Lu, H.D.; Liao, Q.L. Research of heavy metal environmental capacity in Lishui District, Nanjing. Chin. J. Soil Sci. 2014, 45, 734–742. [Google Scholar] [CrossRef]
  28. Liang, F.; Pan, Y.; Peng, H.; Zeng, M.; Huang, C. Time-space simulation, health risk warning and policy recommendations of environmental capacity for heavy metals in the Pearl River Basin, China. Int. J. Environ. Res. Public Health 2022, 19, 4694. [Google Scholar] [CrossRef] [PubMed]
  29. Liu, H.; Wei, W.; Song, Y.; Pan, Y. Evaluation and prediction of environmental capacities of heavy metals in the surface sediments of lakes in Huoqiu County. Environ. Sci. 2023, 44, 6106–6115. [Google Scholar] [CrossRef]
  30. Pan, Y.; Ding, L.; Xie, S.; Zeng, M.; Zhang, J.; Peng, H. Spatiotemporal simulation, early warning, and policy recommendations of the soil heavy metal environmental capacity of the agricultural land in a typical industrial city in China: Case of Zhongshan City. J. Clean. Prod. 2021, 285, 124849. [Google Scholar] [CrossRef]
  31. Yang, W.; Zhou, W.; Wan, W.; Gou, S.; Luo, L. Assessing soil environmental capacity on different land uses in a suburban area of Chengdu, China. Environ. Prot. Eng. 2019, 45, 55. [Google Scholar] [CrossRef]
  32. Li, Y.; Gao, B.; Xu, D.; Peng, W.; Zhang, M. Hydrodynamic impact on trace metals in sediments in the cascade reservoirs, North China. Sci. Total Environ. 2020, 716, 136914. [Google Scholar] [CrossRef]
  33. Liu, M.X.; Yang, Y.Y.; Yun, X.Y.; Zhang, M.; Wang, J. Distribution and ecological assessment of heavy metals in surface sediments of the East Lake, China. Ecotoxicology 2014, 23, 92–103. [Google Scholar] [CrossRef] [PubMed]
  34. Ministry of Ecology and Environment of the People’s Republic of China; State Administration for Market Regulation. Soil Environmental Quality—Risk Control Standard for Soil Contamination of Agricultural Land (GB 15618-2018); China Environmental Science Press: Beijing, China, 2018.
  35. Yu, L.; Zhang, F.; Zang, K.; He, L.; Wan, F.; Liu, H.; Zhang, X.; Shi, Z. Potential ecological risk assessment of heavy metals in cultivated land based on soil geochemical zoning: Yishui County, North China case study. Water 2021, 13, 3322. [Google Scholar] [CrossRef]
  36. Pang, X.; Wang, Z.; Zhao, X.; Zeng, X.; Ren, W.; Dai, J. Background values of soil geochemistry in Shandong Province. Shandong Land Resour. 2018, 34, 39–43, CNKI:SUN:SDDI.0.2019-01-008. [Google Scholar]
  37. Hu, Y.; He, K.; Sun, Z.; Chen, G.; Cheng, H. Quantitative source apportionment of heavy metal(loid)s in the agricultural soils of an industrializing region and associated model uncertainty. J. Hazard. Mater. 2020, 391, 122244. [Google Scholar] [CrossRef]
  38. Varol, M.; Gündüz, K.; Sünbül, M.R. Pollution status, potential sources and health risk assessment of arsenic and trace metals in agricultural soils: A case study in Malatya province, Turkey. Environ. Res. 2021, 202, 111806. [Google Scholar] [CrossRef] [PubMed]
  39. Ministry of Environmental Protection of China. Chinese Population Exposure Parameter Manual. Adult Volume; China Environmental Science Press: Beijing, China, 2013.
  40. Ministry of Environmental Protection of China. Chinese Population Exposure Parameters Handbook (Children Volume: 6–17 Years Old); China Environmental Science Press: Beijing, China, 2016.
  41. US EPA. Supplemental Guidance for Developing Soil Screening Levels for Superfund Sites; Office of Emergency and Remedial Response: Washington, DC, USA, 2002.
  42. Liu, Y.; He, Z.H.; Niu, X.K.; Zhang, D.; Pan, B. Health risk assessment of soil heavy metals in a small watershed of a mining area in Yunnan. Environ. Sci. 2022, 43, 936–945. [Google Scholar] [CrossRef]
  43. US EPA. Risk Assessment Guidance for Superfund Volume I: Human Health Evaluation Manual (Part E, Supplemental Guidance for Dermal Risk Assessment) Final; Office of Emergency and Remedial Response: Washington, DC, USA, 2004.
  44. Duan, X.L. Exposure Factors Handbook of Chinese Population; China Environmental Science Press: Beijing, China, 2013. [Google Scholar]
  45. Ahmad, W.; Alharthy, R.D.; Zubair, M.; Ahmed, M.; Rafique, S. Toxic and heavy metals contamination assessment in soil and water to evaluate human health risk. Sci. Rep. 2021, 11, 17006. [Google Scholar] [CrossRef]
  46. US EPA. Exposure Factors Handbook; National Center for Environmental Assessment: Washington, DC, USA, 2011. Available online: https://www.epa.gov/expobox/about-exposure-factors-handbook (accessed on 15 May 2025).
  47. Li, Y.W.; Wang, J.; Ju, T.Z.; Wang, L.N.; Zhang, S.N.; Zha, X.H. Heavy metal pollution characteristics and human health risk assessment in soils from different functional areas of Baiyin, Gansu, China. Chin. J. Ecol. 2017, 36, 1408–1418. [Google Scholar] [CrossRef]
  48. Chang, C.Y.; Yin, R.S.; Zhang, H.; Yao, L. Bioaccumulation and Health Risk Assessment of Heavy Metals in the Soil-Rice System in a Typical Seleniferous Area in Central China. Environ. Toxicol. Chem. 2019, 38, 1577–1584. [Google Scholar] [CrossRef]
  49. Varol, M. Assessment of heavy metal contamination in sediments of the Tigris River (Turkey) using pollution indices and multivariate statistical techniques. J. Hazard. Mater. 2011, 195, 355–364. [Google Scholar] [CrossRef]
  50. Ju, T.N.; Wu, X.; Shi, H.D.; Gao, F.; Li, X.Z.; Wang, Y.; Luan, T.; Fan, P. Heavy metal pollution and ecological risk assessment of arable land soil in Haigou small watershed. J. Environ. Eng. Technol. 2018, 8, 556–562. [Google Scholar] [CrossRef]
  51. Wu, Z.; Xia, T.; Jia, X. Spatial variation and pollution risk assessment of heavy metals in industrial soil based on geochemical data and GIS-A case of an iron and steel plant in Beijing, China. Int. J. Environ. Anal. Chem. 2022, 104, 6826–6847. [Google Scholar] [CrossRef]
  52. Pang, X.; Dai, J.; Yu, C.; Ren, T.; Liu, H.; Zhang, H.; Cao, H.; Zeng, X.; Ren, W.; Wang, Z.; et al. Soil geochemistry Reference value of 17 cities in Shandong Province. Shandong Land Resour. 2019, 35, 36–45. [Google Scholar]
  53. Chi, Q.H.; Yan, M.C. Handbook of Elemental Abundance for Applied Geochemistry; Geological Press: Beijing, China, 2007. [Google Scholar]
  54. Chi, Q.H.; Ma, S.M. Comparison between chemical composition of bedrocks in the upper reaches and that of alluvial plain soils in the lower reaches of a drainage area. Geol. Bull. China 2008, 27, 188–195. [Google Scholar] [CrossRef]
  55. Li, X.H. Soil Chemistry; Higher Education Press: Beijing, China, 2001. [Google Scholar]
  56. Liu, Y.; Zong, K. Trace Element Geochemistry; Science Press: Beijing, China, 2024. [Google Scholar]
  57. Liu, R.H.; Wang, Q.C.; Lu, X. Distribution and speciation of mercury in the peat bog of Xiaoxing’an mountain, Northeastern China. Env. Pollut. 2003, 124, 39–46. [Google Scholar] [CrossRef]
  58. Chonokhuu, S.; Batbold, C.; Chuluunpurev, B. Contamination and health risk assessment of heavy metals in the soil of major cities in Mongolia. Int. J. Environ. Res. Public Health 2019, 16, 2552. [Google Scholar] [CrossRef] [PubMed]
  59. Cai, L.; Xu, Z.; Bao, P.; He, M.; Dou, L.; Chen, L.; Zhou, Y.; Zhu, Y. Multivariate and geostatistical analyses of the spatial distribution and source of arsenic and heavy metals in the agricultural soils in Shunde, Southeast China. J. Geochem. Explor. 2015, 148, 189–195. [Google Scholar] [CrossRef]
  60. McLaughlin, M.J.; Parker, D.R.; Clarke, J.M. Metals and Micronutrients—Food Safety Issues. Field Crops Res. 1999, 60, 143–163. [Google Scholar] [CrossRef]
  61. Tian, X.; He, J.; Luo, L. Spatial distribution characteristics and source apportionment of heavy metals in vineyard soil at east piedmont of Helan Mountains. Southwest China J. Agric. Sci. 2021, 34, 641–646. [Google Scholar] [CrossRef]
  62. Tian, H.Z.; Wang, Y.; Xue, Z.G.; Cheng, K.; Qu, Y.P.; Chai, F.H.; Hao, J.M. Trend and characteristics of atmospheric emissions of Hg, As, and Se from coal combustion in China, 1980–2007. Atmos. Chem. Phys. 2010, 10, 11905–11919. [Google Scholar] [CrossRef]
  63. Pérez, P.A.; Hintelman, H.; Lobos, G.; Bravo, M.A. Mercury and Methylmercury Levels in Soils Associated with Coal-Fired Power Plants in Central-Northern Chile. Chemosphere 2019, 237, 124535. [Google Scholar] [CrossRef] [PubMed]
  64. Dong, L.; Zhang, Z.; Zhang, T. Mercury Pollution in Soil Environment: Current Status and Its Influencing Factors. Earth Environ. 2022, 50, 397–414. [Google Scholar] [CrossRef]
  65. Zhang, F.G.; Peng, M.; Wang, H.Y.; Ma, H.H.; Xu, R.T.; Cheng, X.M.; Hou, Z.L.; Chen, Z.; Li, K.; Cheng, H.X. Ecological risk assessment of heavy metals at township scale in the high background of heavy metals, Southwestern, China. Environ. Sci. 2020, 41, 4197–4209. [Google Scholar] [CrossRef]
  66. Nanos, N.; Rodríguez Martín, J.A. Multiscale analysis of heavy metal contents in soils: Spatial variability in the Duero River basin (Spain). Geoderma 2012, 189–190, 554–562. [Google Scholar] [CrossRef]
  67. Li, Z.Y.; Ma, Z.W.; Kuijp, T.J.; Yuan, Z.; Lei, H. A review of soil heavy metal pollution from mines in China: Pollution and health risk assessment. Sci. Total Environ. 2014, 468–469, 843–853. [Google Scholar] [CrossRef] [PubMed]
  68. Men, C.; Liu, R.M.; Xu, F.; Wang, Q.G.; Shen, Z. Pollution characteristics, risk assessment, and source apportionment of heavy metals in road dust in Beijing, China. Sci. Total Environ. 2018, 612, 138–147. [Google Scholar] [CrossRef]
  69. Zhang, Z.X.; Lu, Y.; Li, H.P.; Tu, Y.; Liu, B.Y.; Yang, Z. Assessment of heavy metal contamination, distribution and source identification in the sediments from the Zijiang River, China. Sci. Total Environ. 2018, 645, 235–243. [Google Scholar] [CrossRef]
  70. Li, R.; Zhang, M.; Yang, H. Forms, contents and distribution of Cu, Zn in some orchard soils in Shandong Province. J. Ecol. Rural. Environ. 2002, 18, 41–44. [Google Scholar] [CrossRef]
  71. Li, F.; Liu, S.Y.; Li, Y.; Shi, Z. Spatiotemporal variability and source apportionment of soil heavy metals in a industrially developed city. Environ. Sci. 2019, 40, 934–944. [Google Scholar] [CrossRef]
  72. Han, L.; Xu, X. Quantitative evaluation of human health risk of heavy metals in soils based on positive matrix factorization model and geo-statistics. Environ. Sci 2020, 41, 5114–5124. [Google Scholar] [CrossRef]
  73. Liu, T.; Liu, C.P.; Deng, J.; Kang, P.; Wang, K.; Zhao, Y. Ecological health risk assessment of soil heavy metals in eastern Yinan County, Shandong Province. Geol. China 2022, 49, 1497–1508. [Google Scholar] [CrossRef]
  74. Fan, L.; Zhang, B.C.; Chen, L.; Yuan, X.X.; Shao, M.J.; Dong, Y.J.; Wang, L.; Zhao, S.C. Pollution Characteristics and Risk Assessment of Heavy Metals in Honeysuckle and Soil From the Main Producing Area in China. J. Nucl. Agric. Sci. 2021, 35, 2341–2351. [Google Scholar] [CrossRef]
  75. Bo, L.; Li, B.; Zhang, R.Q.; Li, Y.P.; Li, Y.; Duan, G.; Gao, X. Characteristics and Potential Ecologic al Risk Assessment of Heavy Metals in Garlic Producing Areas of Jinxiang. Chin. J. Soil Sci. 2021, 52, 434–442. [Google Scholar] [CrossRef]
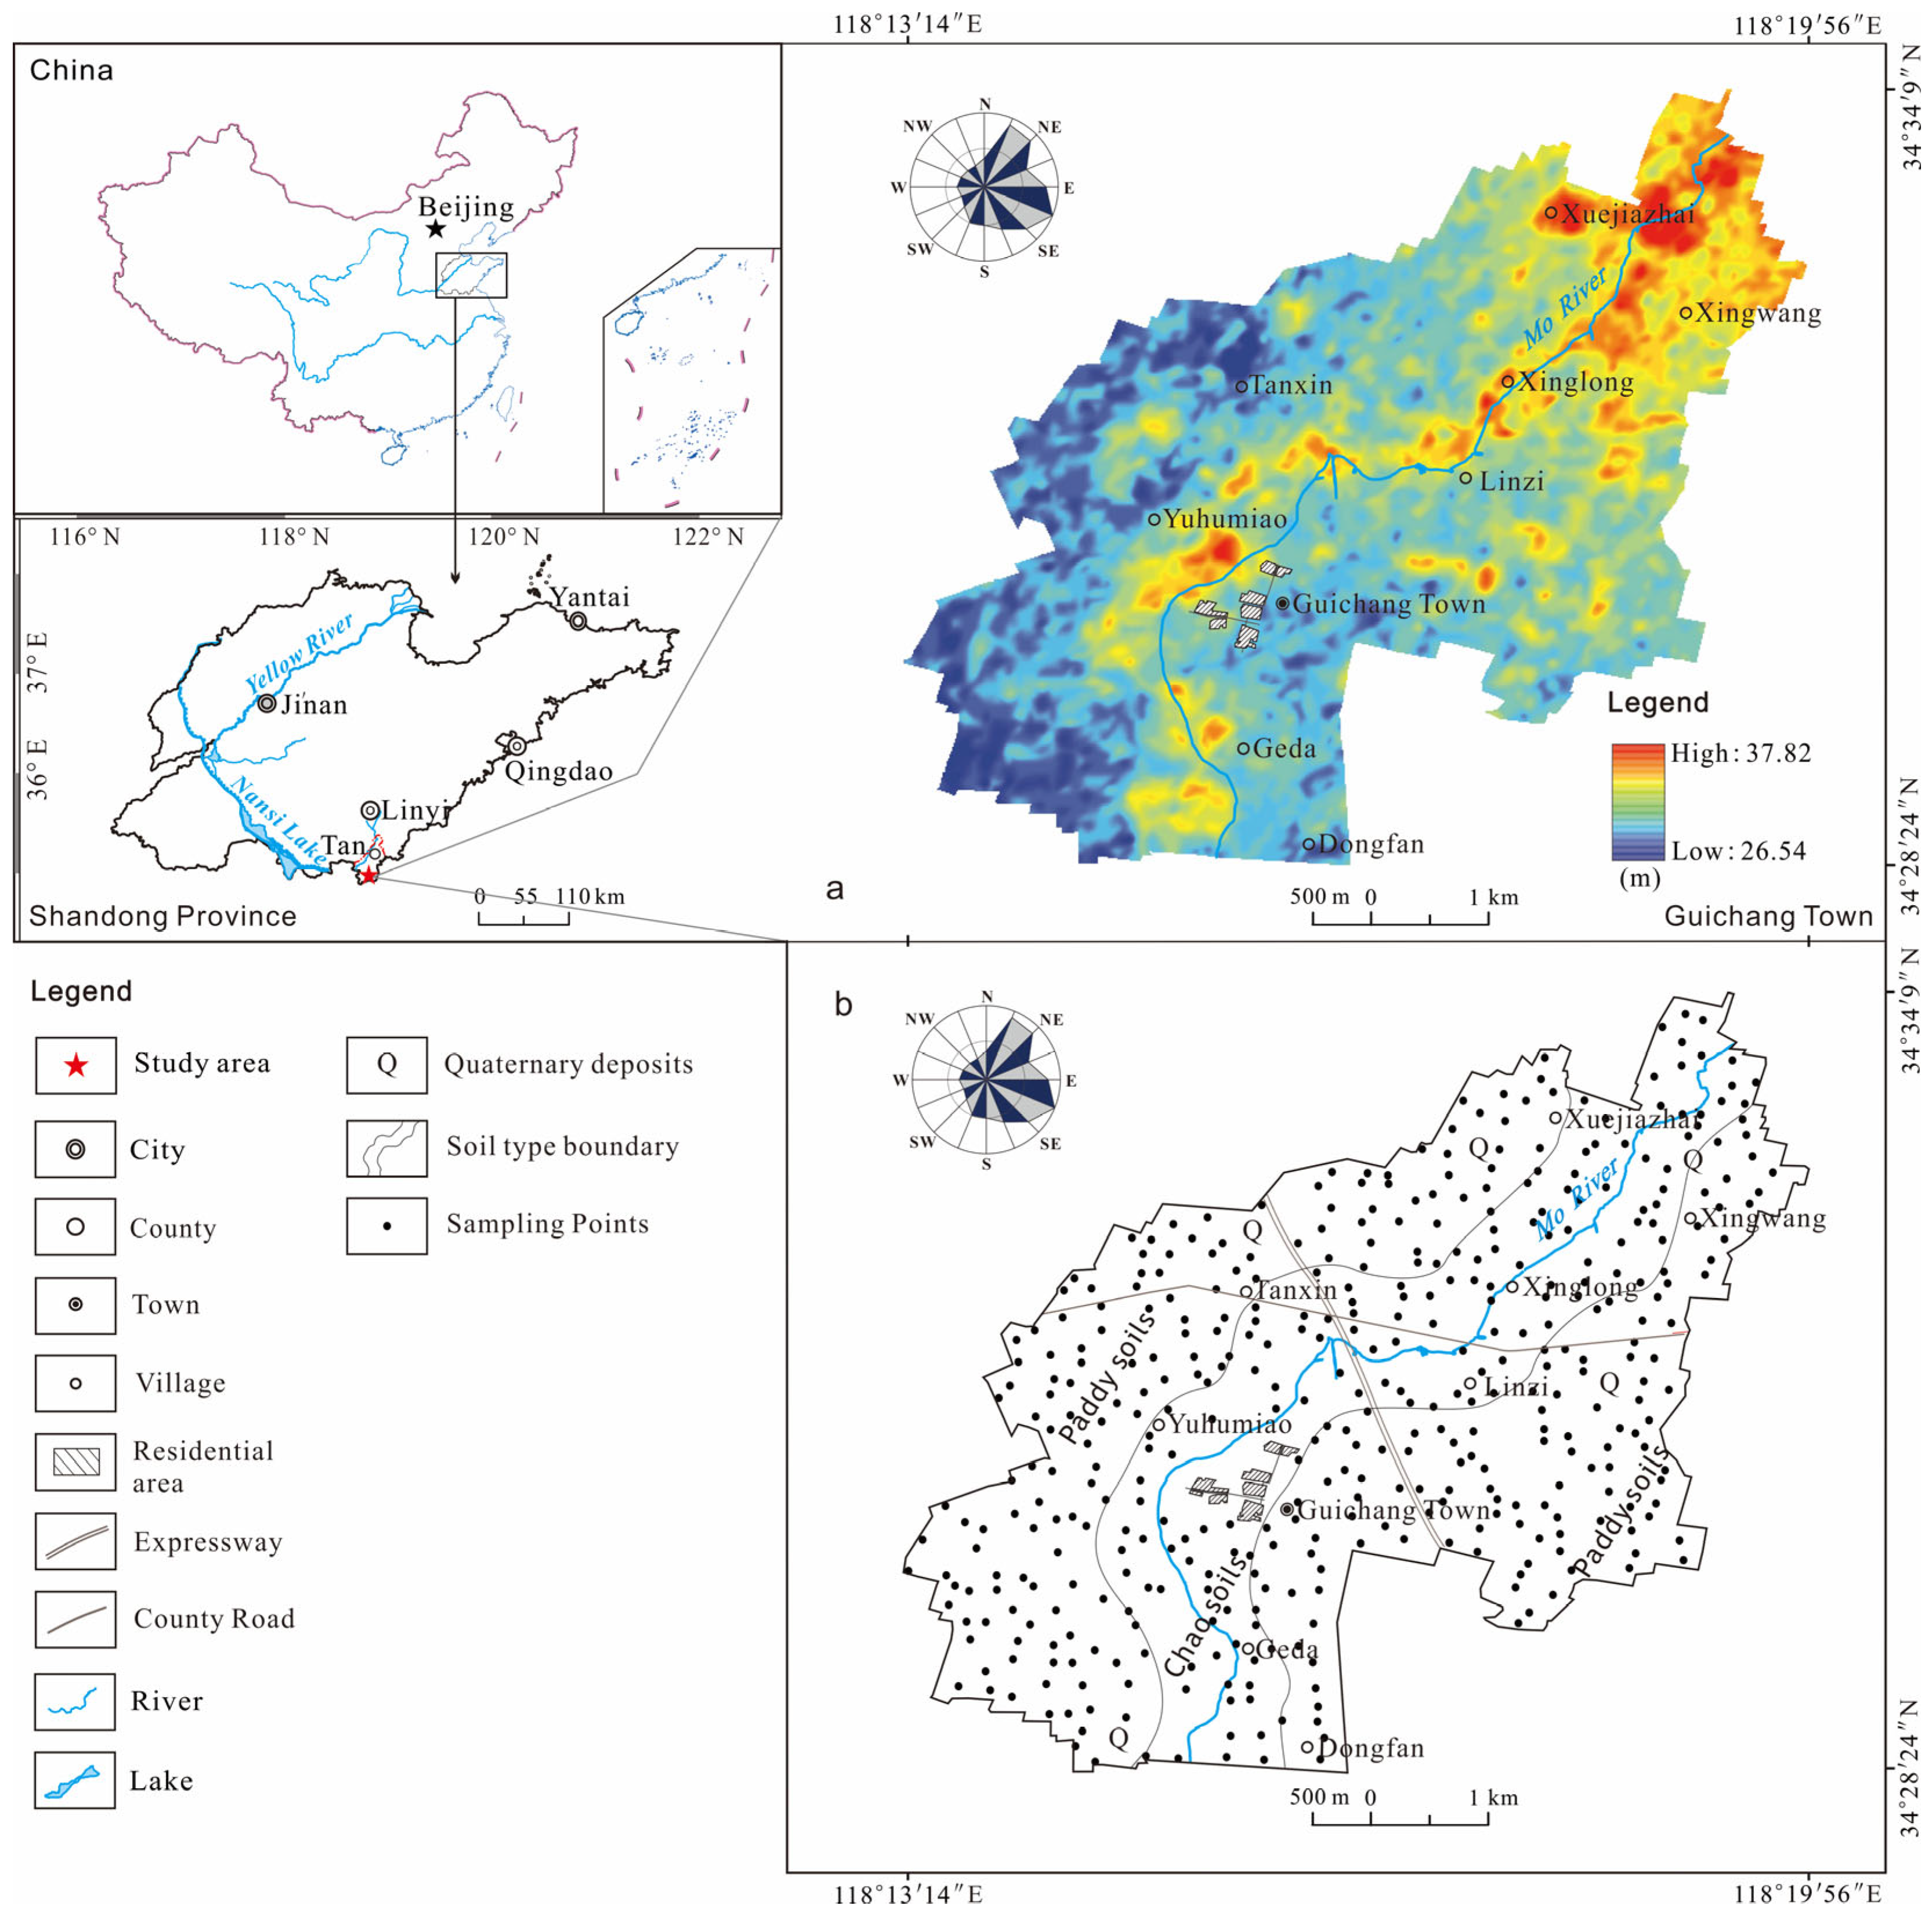
Figure 1. Location (a) and geochemical sampling points (b) in the study area.
Agriculture 15 02275 g001
Figure 2. Spatial distribution of heavy metals in soils across the study area. Note: (a) As; (b) Cd; (c) Cr; (d) Cu; (e) Hg; (f) Ni; (g) Pb; (h) Zn; and (i) pH.
Agriculture 15 02275 g002
Figure 3. Geochemical correlations of heavy metals in soils of the study area.
Agriculture 15 02275 g003
Figure 4. Percentage diagram of EF classifications of heavy metals in soils.
Agriculture 15 02275 g004
Figure 5. Factor profiles and source contributions of eight heavy metals based on PMF analysis.
Agriculture 15 02275 g005
Figure 6. Contribution rates of different factors in the PMF model for the study area.
Agriculture 15 02275 g006
Figure 7. SOM-based concentration and U-matrix outputs. Note: The color columns for each element and the U-matrix represent normalized concentrations and the distances between neurons, respectively.
Agriculture 15 02275 g007
Figure 8. Clustering of sampling points (a) and their spatial distribution (b) in the study area.
Agriculture 15 02275 g008
Figure 9. Classification of soil heavy metal environmental capacity index.
Agriculture 15 02275 g009
Figure 10. Spatial distribution of the comprehensive index of soil environmental capacity. Note: (a) PI; (b) PImin.
Agriculture 15 02275 g010
Figure 11. Spatial distribution of non-carcinogenic hazard index (HI, (a)) and total carcinogenic risk (TCR, (b)) in the study area.
Agriculture 15 02275 g011
Figure 12. Boxplot of carcinogenic risk for adults and children.
Agriculture 15 02275 g012
Table 1. Parameters used in the exposure models.
FactorsDescription UnitValues Source
AdultChild
CHeavy metal concentration in topsoilmg·kg−1This study
IngRIngestion rate mg·d−1100200[41,42]
InhRInhalation rate m3·d−17.515[41,42]
EFExposure frequencyd·a−1350350[43,44]
EDExposure durationa246[41,42]
CFConversion factorkg·mg−11 × 10−61 × 10−6[42,45]
SAExposed skin areacm257002800[41,42]
AFSkin adherence factormg·cm−2·d−10.070.2[41,42]
ABSDermal absorption factorunitless0.010.01[45]
PEFParticle emission factorm3·kg−11.36 × 10−91.36 × 10−9[41,42]
BWAverage body weightkg62.516[42,43]
ATAverage timenon-carcinogensdED × 365[39,40,46]
carcinogensd70 × 365
Table 2. Reference doses (RfDs) for non-carcinogenic metals and slope factors (SFs) for carcinogenic metals (mg·kg−1).
RfDSourceSFSource
IngestionDermalInhalationIngestionDermalInhalation
As3.00 × 10−41.23 × 10−43.00 × 10−4[42,46]1.501.504.30 × 10−3[47]
Cd1.00 × 10−41.00 × 10−51.00 × 10−4[45]6.106.101.80 × 10−3[47]
Cu4.00 × 10−21.20 × 10−24.02 × 10−2[45]
Cr3.00 × 10−36.00 × 10−52.86 × 10−5[42,46]42.00[47]
Hg3.00 × 10−42.10 × 10−53.00 × 10−4[42,46]
Ni2.00 × 10−25.40 × 10−32.06 × 10−2[42]8.40 × 10⁻¹[47]
Pb3.50 × 10−35.25 × 10−43.25 × 10−3[45]
Zn3.00 × 10−16.00 × 10−23.00 × 10−1[42]
Table 3. Concentrations of heavy metals in surface soils (N = 427) (mg·kg−1).
pHAsCdCrCuHgNiPbZn
Minimum4.823.500.03034.1911.710.01711.5817.8526.93
Maximum7.7812.120.280202.0647.300.141149.7361.98176.51
Mean6.21 ± 0.027.16 ± 0.070.127 ± 0.00268.21 ± 0.7023.13 ± 0.280.040 ± 0.00125.52 ± 0.4527.15 ± 0.2262.44 ± 0.83
S.D.0.401.440.0414.535.720.029.244.6117.17
CV (%)6.520.234.921.324.738.736.217.027.5
SEQRCS (1)pH ≤ 5.530.000.300150.0050.000.50060.0070.00200.00
5.5 < pH ≤ 6.530.000.300150.0050.000.50070.0090.00200.00
6.5 < pH ≤ 7.530.000.300200.00100.000.600100.00120.00250.00
SD topsoil (2)7.328.600.13262.0022.600.03127.1023.6063.30
SD baseline value (3)8.018.700.09262.6021.300.01627.9021.4058.60
China topsoil (4)6.7011.200.10061.0023.000.03026.9026.0074.20
(1) Soil environmental quality risk control standard for soil contamination of agricultural land, China. (GB15618-2018) (MEEC, 2018) [34]. (2) Background values of soil geochemistry in Shandong Province, East China [35,36]. (3) Baseline values of soil geochemistry in Shandong Province, East China [52]. (4) China National Environmental Monitoring Centre and Wei F S (1991), N = 4095 [53].
Table 4. Partial correlation analysis between soil pH and heavy metal concentrations (N = 427).
MetalPartial Correlation Coefficientp-ValueSignificance
pHAs−0.1520.002**
Cd−0.218<0.001***
Cr0.0840.089n.s.
Cu−0.1340.006**
Hg−0.181<0.001***
Ni0.0960.051n.s.
Pb−0.1230.012*
Zn−0.1410.004**
Note: Significance levels: *** p < 0.001, ** p < 0.01, * p < 0.05, n.s. = not significant.
Table 5. Characteristic parameters of static environmental capacity (kg·hm−2) for soil heavy metals in the study area.
AsCdCrCuHgNiPbZn
CspMinimum28.980.04−4.6411.880.81−111.8963.0552.85
Maximum48.380.61360.18198.451.31194.85226.46501.91
Mean40.140.39207.4783.371.08113.10153.69332.43
S.D.3.250.1058.3347.250.1034.4931.8059.69
CV/%8.1025.5828.1156.679.0330.5020.6917.95
CsspH ≤ 5.541.630.39200.0359.181.0673.5898.78304.88
5.5 < pH ≤ 6.541.630.39200.0359.181.0696.08143.78417.38
6.5 < pH ≤ 7.541.630.39312.53171.681.29163.58211.28417.38
Table 6. Classification and proportion of soil heavy metal environmental capacity indices in the study area.
AsCdCrCuHgNiPbZn
Environmental capacity levelHigh Capacity15621914526073276208265
Moderate Capacity270146247142354143217152
Low Capacity15734240629
Alert Level05110101
Overloaded Level00000100
Range of Pi0.70~1.160.11~1.54−0.01~1.300.20~1.460.76~1.02−0.68~1.390.43~1.130.17~1.26
Proportion/%High Capacity36.551.334.060.917.164.648.762.1
Moderate Capacity63.234.257.833.382.933.550.835.6
Low Capacity0.213.38.05.601.40.52.1
Alert Level01.20.20.200.200.2
Overloaded Level000000.200
Table 7. Average daily doses (ADD, mg·kg−1·d−1) for adults and children via three exposure routes.
AdultChild
ADDingADDderADDinhADDingADDderADDinh
As3.93 × 10−61.57 × 10−75.26 × 10−107.35 × 10−62.06 × 10−72.35 × 10⁻¹⁰
Cd6.96 × 10−82.78 × 10−99.31 × 10−121.36 × 10−73.81 × 10−94.35 × 10⁻¹²
Cu3.70 × 10−51.48 × 10−64.95 × 10−92.89 × 10−48.10 × 10−69.25 × 10⁻⁹
Cr1.09 × 10−44.35 × 10−61.46 × 10−85.12 × 10−41.43 × 10−51.64 × 10⁻⁸
Hg6.39 × 10−82.55 × 10−98.55 × 10−124.99 × 10−71.40 × 10−81.60 × 10⁻¹¹
Ni4.08 × 10−51.63 × 10−65.46 × 10−93.19 × 10−48.93 × 10−61.02 × 10⁻⁸
Pb4.34 × 10−51.73 × 10−65.81 × 10−93.39 × 10−49.50 × 10−61.09 × 10⁻⁸
Zn9.99 × 10−53.99 × 10−61.34 × 10−87.81 × 10−42.19 × 10−52.50 × 10⁻⁸
Table 8. Non-carcinogenic health risk assessments (HQ and HI) for adults and children exposed to soils in the study area.
HQ-non-canc.AsCdCuCrHgNiPbZnHIProportion of HQ
AdultMinimum2.43 × 10−22.15 × 10−32.14 × 10−32.24 × 10−41.18 × 10−31.38 × 10−23.59 × 10−21.13 × 10−35.61 × 10−2Agriculture 15 02275 i001
Maximum7.02 × 10−32.30 × 10−45.31 × 10−43.79 × 10−51.46 × 10−41.06 × 10−31.03 × 10−21.72 × 10−42.24 × 10−2
Mean1.44 × 10−29.74 × 10−41.05 × 10−37.57 × 10−53.35 × 10−42.34 × 10−31.57 × 10−23.99 × 10−43.53 × 10−2
S.D.2.90 × 10−33.40 × 10−42.59 × 10−41.61 × 10−51.29 × 10−48.49 × 10−42.67 × 10−31.10 × 10−45.93 × 10−3
Amount (>1)000000000
ChildMinimum4.43 × 10−23.84 × 10−31.62 × 10−21.04 × 10−38.22 × 10−31.03 × 10−12.22 × 10−18.38 × 10−32.80 × 10−1Agriculture 15 02275 i002
Maximum1.28 × 10−24.11 × 10−44.00 × 10−31.76 × 10−41.02 × 10−37.99 × 10−36.43 × 10−21.28 × 10−31.02 × 10−1
Mean2.62 × 10−21.74 × 10−37.90 × 10−33.51 × 10−42.33 × 10−31.76 × 10−29.75 × 10−22.97 × 10−31.57 × 10−1
S.D.5.29 × 10−36.07 × 10−41.95 × 10−37.47 × 10−59.02 × 10−46.38 × 10−31.65 × 10−28.16 × 10−42.64 × 10−2
Amount (>1)000000000
Table 9. Carcinogenic risk indices (CR) for ingestion, dermal contact, and inhalation of soils for adults and children in the study area.
CR-canc.AsCdCRTCR
RfDingRfDdermalRfDinhRfDHQingRfDdermalRfDinhAsCdCr (RfDinh)Ni (RfDinh)
AdultMaximum9.97 × 10−63.98 × 10−73.83 × 10−129.37 × 10−73.74 × 10−83.70 × 10−141.04 × 10−59.74 × 10−71.82 × 10−62.69 × 10−81.15 × 10⁻⁵
Minimum2.88 × 10−61.15 × 10−71.10 × 10−121.00 × 10−74.01 × 10−93.96 × 10−152.99 × 10−61.04 × 10−73.07 × 10−72.08 × 10−93.70 × 10⁻⁶
Mean5.89 × 10−62.35 × 10−72.26 × 10−124.24 × 10−71.69 × 10−91.68 × 10−146.13 × 10−64.41 × 10−76.13 × 10−74.59 × 10−97.18 × 10⁻⁶
S.D.1.19 × 10−64.74 × 10−84.56 × 10−131.48 × 10−75.91 × 10−95.85 × 10−151.24 × 10−61.54 × 10−71.31 × 10−71.66 × 10−91.37 × 10⁻⁶
Amount (>10−4)00000000000
ChildMaximum1.87 × 10−55.23 × 10−71.71 × 10−121.83 × 10−65.12 × 10−81.73 × 10−141.92 × 10−51.88 × 10−62.04 × 10−65.03 × 10−82.07 × 10⁻⁵
Minimum5.39 × 10−61.51 × 10−74.95 × 10−131.96 × 10−75.49 × 10−91.85 × 10−155.54 × 10−62.02 × 10−73.44 × 10−73.89 × 10−96.56 × 10⁻⁶
Mean1.10 × 10−53.09 × 10−71.01 × 10−128.29 × 10−72.32 × 10−87.82 × 10−151.13 × 10−58.52 × 10−76.87 × 10−78.57 × 10−91.29 × 10⁻⁵
S.D.2.23 × 10−66.23 × 10−82.04 × 10−132.89 × 10−78.11 × 10−92.73 × 10−152.29 × 10−62.98 × 10−71.46 × 10−73.10 × 10−92.47 × 10⁻⁶
Amount (>10−4)00000000000
Disclaimer/Publisher’s Note: The statements, opinions and data contained in all publications are solely those of the individual author(s) and contributor(s) and not of MDPI and/or the editor(s). MDPI and/or the editor(s) disclaim responsibility for any injury to people or property resulting from any ideas, methods, instructions or products referred to in the content.