Abstract
Wheat powdery mildew poses a serious threat to crop growth and yield, highlighting the critical need for accurate detection to ensure food security and maintain agricultural productivity. This study explores the integration of polarization remote sensing with a Multi-Verse Optimizer (MVO)–enhanced Random Forest (RF) model for disease detection. Polarization imaging equipment was used to extract key polarization parameters, including the degree of polarization (DOP) and angle of polarization (AOP), from wheat leaves to capture subtle structural differences between healthy and diseased tissues. The MVO algorithm was employed to optimize RF hyperparameters, thereby improving classification performance and addressing the limitations of manual parameter tuning and conventional machine learning methods. Several machine learning algorithms were also evaluated for comparison. The results indicate that the proposed MVO_RF approach outperformed traditional methods, achieving an F1-score of 0.9715, a Kappa coefficient of 0.9797, and an overall accuracy of 0.9878. These findings demonstrate that the integration of polarization characteristics with MVO-optimized machine learning establishes a robust and efficient framework for monitoring wheat powdery mildew. More importantly, it facilitates early in-field disease warnings, enhances the accuracy and efficiency of targeted pesticide application, and offers quantitative decision-making support for smart agricultural management and disease prevention strategies.
1. Introduction
The sustained production of wheat, one of the most important food crops in the world, is crucial for Chinese societal and economic stability [1]. Wheat powdery mildew is an airborne fungal disease caused by the fungus Blumeria graminis [2]. This obligate parasite germinates on the surface of the plant through conidia, forming appressoria that penetrate the epidermal cell walls directly and develop haustoria to absorb nutrients from living cells, which poses a substantial danger to the world’s wheat production and significantly reduces wheat productivity and quality [3]. The disease affects not only wheat leaves but also stalk spikes, leading to early leaf wilting, fewer spikes, and reduced grain weight. While yield losses usually range between 5 and 10%, severe cases can result in losses exceeding 20% or even complete crop failure, thereby endangering the global wheat supply [4]. Under favorable environmental circumstances, such as warm temperatures and high humidity, the disease spreads quickly through airborne spores [5]. Powdery mildew is prevalent worldwide, particularly in temperate wheat-growing regions of China, Europe, and North America [6]. Since the 1920s, wheat powdery mildew has continued to expand and has become one of the most severe diseases in China. Annual crop losses have occurred due to the disease, especially in 1990 and 1991, when outbreaks spread nationwide, damaging over 12 million hectares each year. Moreover, with the international exchange of wheat varieties, the spread of powdery mildew strains has intensified, further complicating disease prevention and control [7].
Accurate and timely monitoring of the frequency, progression, and transmission patterns of powdery mildew is essential due to the serious impact of the disease on wheat production. With advances in computer technology and remote sensing, image recognition has become an effective tool for monitoring and predicting wheat diseases [8]. Wheat diseases can be accurately identified, monitored, and evaluated through the analysis of leaf images, providing a scientific basis for effective disease prevention and control [9]. In recent years, machine learning techniques have progressed rapidly, with models such as Random Forest (RF), Support Vector Machines (SVM), and k-Nearest Neighbors (KNN) being widely applied in disease detection and classification [10,11,12,13]. Classification accuracy is improved by extracting multiple image features and applying classifier hyperparameter optimization algorithms [14,15]. However, these approaches rely heavily on large volumes of high-quality training data and comprehensive feature sets. Poor data quality may lead to overfitting, thereby impairing classification performance. Since the emergence of deep learning, methods based on this technology have shown significant improvements in disease identification [16,17]. In complex environments, the development of automated recognition systems is crucial for the precise and efficient detection of plant diseases [18]. Classification accuracy is further enhanced by deep neural networks, residual networks, and related architectures [19,20]. Moreover, improvements in network modules strengthen the model’s capability to focus on and extract disease-specific features, thereby increasing identification accuracy. By combining deep learning with various feature extraction algorithms, disease severity can be graded more precisely, aiding in targeted control and prevention. The incorporation of lightweight networks such as the YOLO series increases the feasibility of real-world applications and reduces computational demands [21,22,23]. These methods, however, are time-consuming and computationally demanding, which poses serious problems for small-scale studies or settings with limited resources. Furthermore, the majority of current techniques focus on visible images, with polarization information receiving relatively little attention. By catching features not possible with traditional images, polarization imaging provides a unique perspective on the reflecting qualities of the surface of an object. Therefore, researching the function of polarization information in agricultural disease identification offers a novel approach that may overcome the drawbacks of existing techniques and improve disease detection accuracy and efficiency.
Polarization is an inherent property of light [24]. Polarization remote sensing reveals distinct target features and provides advantages over conventional techniques by identifying the polarimetric characteristics of reflected radiation. This technology enhances contrast between targets and backgrounds, accentuates highly polarized objects, and improves detection and classification performance in complex environments—demonstrating considerable application potential. Consequently, it has been widely used in vegetation monitoring [25,26,27,28], aerosol inversion [29,30,31], environmental monitoring [32,33,34], three-dimensional imaging [35,36], and biomedicine [37,38]. In the field of crop disease monitoring, polarization provides unique opportunities [39]. Monitoring the polarization state of reflected light enables the precise detection of minute changes in leaf structure. This approach offers advantages over traditional remote sensing, helping to mitigate current limitations and offering novel solutions for accurate and early disease identification. Polarization imaging characterizes surface reflection properties by capturing directional information of the reflected light. Fungal infections such as powdery mildew disrupt the leaf’s microstructure, altering epidermal cell arrangement and forming dense networks of hyphae and conidiophores [40]. These changes influence light scattering and reflection patterns, producing discernible differences in polarization signatures between healthy and infected tissues. Thus, polarization imaging facilitates the detection of subtle biophysical changes associated with early stages of infection.
This study focuses on wheat powdery mildew and proposes an identification method optimized using the Degree of Polarization (DOP) in combination with the RF algorithm. The Multi-Verse Optimized Random Forest (MVO_RF) method is introduced to optimize the hyperparameter selection of the RF model, addressing the limitations of empirical tuning and enhancing classification accuracy. The polarization image of wheat powdery mildew leaves is obtained using polarization imaging equipment, and then the leaf DOP image is subsequently extracted using Stokes parameters. Experimental results demonstrate that MVO_RF significantly enhances classification accuracy and improves model robustness, thereby reducing overfitting and clarifying the classification boundary. Following that, powdery mildew leaves are detected and identified using the MVO_RF algorithm and six additional machine learning algorithms. Finally, classification accuracy is assessed using several evaluation metrics. This study aims to develop new technical methods for detecting and identifying wheat powdery mildew, which is crucial for accurately controlling this disease, enhancing pesticide efficiency, and ensuring food safety. Although this study presents an innovative approach in polarization feature extraction and MVO_RF optimization, its direct applicability to field disease management is constrained due to the entirely controlled indoor conditions under which it was conducted. Polarization imaging, capable of capturing subtle biophysical changes, remains underutilized in disease monitoring. Integrating polarization features with advanced optimization algorithms, therefore, offers a promising solution to these challenges. Future research should prioritize field validation under natural environmental conditions and explore the integration of unmanned aerial vehicles (UAVs) or ground platforms to enhance practicality and robustness.
2. Materials and Methods
2.1. Study Sites
The Jiyang Experimental Demonstration Base of the Shandong Academy of Sciences (117°07′ E, 36°54′ N) is located in Dongsheng Village, Taiping Street, Jiyang District, where it serves as the site for collecting wheat powdery mildew leaves. This experimental base was specifically established for wheat powdery mildew research and is maintained under expert supervision by a team of plant pathologists specializing in cereal fungal diseases. Artificial inoculation was performed using Blumeria graminis f. sp. tritici, the causal pathogen of wheat powdery mildew, under controlled field conditions. Disease identification was jointly conducted by two experienced plant protection experts. The identification process relied on morphological features of lesions, the presence of white powdery fungal hyphae, and field-observed infection symptoms, ensuring high accuracy and consistency of the labeled data. The climate of the region is warm temperate, characterized by a semi-humid monsoon, with four distinct seasons that coincide with heat and rainfall, and an abundance of sunshine. Mild spring temperatures support wheat growth and development, while cold winters promote dormancy. Additionally, the region is suitable for using remote sensing technology to study wheat powdery mildew due to its flat topography, fertile soil rich in organic matter, and favorable agricultural conditions. The study area is represented in the figure below (Figure 1).
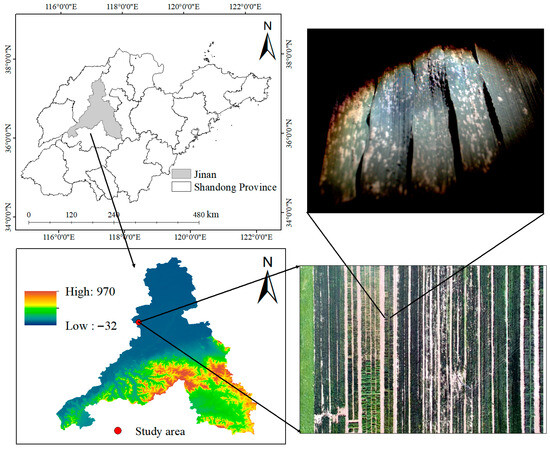
Figure 1.
Overview map of the study area.
2.2. Data Acquisition and Processing
To systematically analyze the polarization characteristics of wheat powdery mildew, an indoor polarization imaging system was designed to capture high-quality polarized images of both infected and healthy wheat leaves (Figure 2). Before polarization imaging, wheat leaves were collected from the experimental field. The sampling was carried out during different stages of infection to ensure the diversity of disease severity, including healthy, mildly, moderately, and severely infected leaves. Each sampled leaf was carefully labeled in the field by plant pathology experts based on lesion morphology, hyphal structure, and visible disease symptoms to ensure diagnostic accuracy (Figure 3). The collected samples were then transferred to the laboratory under controlled conditions for polarization imaging.
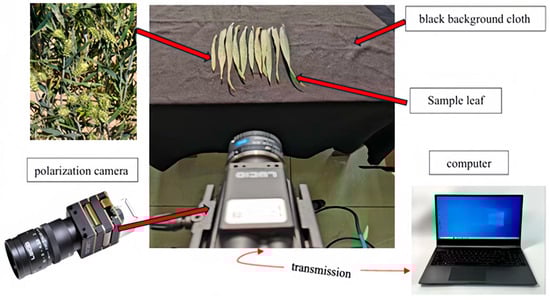
Figure 2.
Image collection scene.
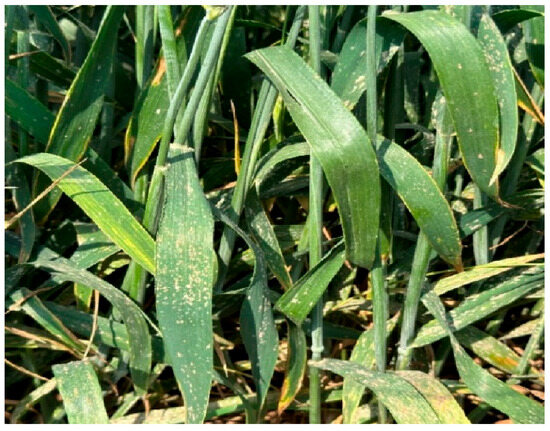
Figure 3.
Disease-infected wheat.
The imaging system consisted of a Phoenix polarization camera (LUCID Vision Labs, Richmond, BC, Canada) equipped with a micro polariser array (Sony, Tokyo, Japan) and a CMOS sensor (Sony, Tokyo, Japan), ensuring precise polarization measurements. The system was carefully calibrated before data acquisition. This included polarimetric calibration, which utilized linearly polarized light at 10-degree intervals to verify the sensor’s response accuracy and extinction ratio, flat-field correction, which employed a uniform diffuse reflectance standard to normalize pixel response variations, and dark-frame subtraction to eliminate sensor noise. Specifically, the system used a PHX050S-P camera (LUCID Vision Labs, Richmond, BC, Canada fitted with a SONY IMX250MZR CMOS (Sony, Tokyo, Japan) sensor. The sensor provides a resolution of 2448 × 2048 pixels with a pixel size of 3.45 μm and supports multi-angle polarization detection (0°, 45°, 90°, and 135°) through its integrated micro-polariser array. At a wavelength of 500 nm, it achieves an extinction ratio greater than 300:1, ensuring high-quality polarization measurements mainly within the visible spectrum (400–700 nm). Focusing on this spectral range is beneficial since polarization effects and disease symptoms are typically apparent in visible wavelengths, making identification and analysis more accurate. To minimize external interference and enhance image stability, the camera was securely mounted on a fixed stand, maintaining a perpendicular optical axis relative to the leaf surface. This setup effectively eliminated angular deviation, reducing errors caused by misalignment. A balanced light source was used to ensure consistent image quality. The leaves were carefully arranged on a black background cloth to allow full unfolding and avoid overlap. The black background enhanced contrast along leaf edges, facilitating subsequent image processing. Image analysis was conducted using MATLAB (R2024a) to extract relevant features and quantify the polarization characteristics.
In this study, rather than using the number of leaves as the sampling unit, a pixel-level sampling strategy was adopted. Each polarization image contained thousands of pixels, each corresponding to a unique polarization signature associated with specific physiological and pathological conditions. This approach ensured sufficient sample diversity and data robustness while enhancing spatial continuity within the feature space. After configuring the environment, several sets of polarized images were captured, including images at various angles (e.g., 0°, 45°, 90°, and 135°), providing a comprehensive representation of the polarization characteristics of light reflected from the leaf surface. These multi-angle images were crucial for extracting key polarization parameters, including DoP, AoP, and polarization intensity. These parameters served as important features for disease detection and classification. This image acquisition process provided a robust foundation for subsequent image processing, feature extraction, and identification using the MVO_RF algorithm. The integration of polarization imaging with machine learning enables more detailed and accurate analysis of wheat powdery mildew symptoms, improving the reliability of disease detection and classification.
By assessing the polarization state both before and after light wave transformation, polarization imaging techniques can be employed to obtain information regarding an object’s polarization characteristics [41]. Typically, two mathematical frameworks-the Jones vector and the Stokes vector—are used to express polarization information. The Stokes vector can be applied to fully, partially, or unpolarized light, while the Jones vector is primarily used for fully polarized light. In the context of remote sensing imagery of feature targets, the Stokes coefficients I, Q, U, and V are commonly used to characterize polarization information [42]. For example, Q and U represent linear polarization along two orthogonal axes, V denotes circular polarization, and I represents the total intensity of the polarized light wave. However, circular polarization is typically negligible in targets reflecting sunlight or in natural atmospheric conditions. Furthermore, the Stokes vector components can be used to calculate two crucial polarization parameters: the angle of polarization and the degree of polarization.
The polarization camera collects polarized images in specific orientations, denoted as I0°(x,y), I45°(x,y), I90°(x,y), and I135°(x,y). By analyzing these four directional images, various polarization parameter maps can be derived. This set of parameters is widely used in polarization imaging and provides a comprehensive depiction of the light’s polarization properties. The expression for the Stokes vector is as follows:
The polarization characteristics of light are primarily described by the degree of polarization and the angle of polarization. DOP is a quantitative measure representing the extent of polarization, where fully polarized light has a value of 1, and unpolarized light has a value of 0. This parameter enhances the visual distinction of object edges and contours by reflecting changes in the vibration direction of reflected and refracted light on the target surface. AOP indicates the orientation of the polarized wave, defined as the angle between the vibration direction of the light and a reference axis.
This angle changes when the light hits the target surface, creating an obvious difference in brightness. The following equations provide the first three components of the Stokes vector, from which DOP and AOP can be gained:
Following the above calculations, the DOP and AOP information of the image can be derived, which reflects the polarization characteristics within the scene and facilitates target feature detection.
In this study, DOP and AOP were selected as key polarization features for detecting wheat powdery mildew. Powdery mildew infection modifies the leaf surface microstructure, thereby altering the reflection and scattering behavior of incident light. These structural changes affect the polarization state of the reflected light, which can be quantitatively characterized by variations in DOP and AOP. Healthy wheat leaves generally exhibit higher polarization uniformity due to their relatively smooth and intact surface, whereas infected regions disrupt this uniformity, resulting in localized fluctuations in polarization parameters. By analyzing the spatial distribution and statistical characteristics of DOP and AOP, it becomes possible to effectively distinguish between healthy and diseased tissues, providing reliable input features for subsequent machine learning-based classification and disease monitoring.
The Stokes vector method is a standard technique for generating DOP and AOP images. However, the calculation process can amplify image noise, producing speckled artifacts. Consequently, polarized images may contain uneven high-brightness points and low-contrast regions, obscuring disease features. To address this issue, a median filter is applied, whereby each pixel is replaced with the median of its surrounding window. This method effectively suppresses isolated noise while preserving edge details, thus avoiding image blurring. As a result, the contrast between healthy and infected areas is enhanced, leading to improved classification accuracy. The filtering performance was assessed using several metrics: entropy, which reflects the complexity and randomness of image content; contrast-to-noise ratio (CNR), which quantifies the contrast between target and background relative to noise; and peak signal-to-noise ratio (PSNR), which measures image fidelity by comparing the original and denoised images.
2.3. Constructing MVO_RF Classification Algorithm
Random Forest is a classification algorithm that uses an ensemble of decision trees for both training and prediction [43]. The algorithm constructs multiple trees through a randomized process, using bootstrap resampling to create new training datasets. Specifically, a subset of samples Di = B(D,n) is selected from the original dataset D via bootstrap sampling, where n denotes the number of samples per subset. In this process, samples are drawn randomly with replacement, and independent decision trees are trained on each subset. In Random Forest, the Gini index is typically used as the default splitting criterion during node division, while information gain is another commonly used measure. In this study, we did not directly apply information gain but included it only as a supplementary reference.
where G represents the impurity measure of the dataset, C denotes the total number of classes, and pi corresponds to the proportion of the i-th class within the dataset.
where IG represents the contribution of a feature to dataset classification, and E(S) is the entropy of the dataset S, which quantifies the dataset’s uncertainty.
Also, m features Fs = R(F,m) are randomly selected from the full feature set for each split. The final RF model aggregates predictions from all trees using a majority voting mechanism, thereby improving classification accuracy and reducing the risk of overfitting. In this study, RF enhances classification performance by integrating outputs from multiple decision trees, enabling effective distinction between healthy and diseased regions. The final model’s performance is assessed using a loss function, with classification error employed as the evaluation metric. The formula is as follows:
where L denotes the proportion of incorrectly predicted samples, ranging from 0 to 1, N represents the total number of samples, and I is the indicator function that determines whether the prediction is correct. is the true label, and is the predicted label.
The MVO is an intelligent optimization algorithm proposed by Prof. Seyedali Mirjalili and his research team in late 2015 [44]. The algorithm evaluates solution quality by simulating the universe’s expansion rate, where a higher expansion rate increases the likelihood of white hole formation while reducing the probability of black hole emergence. This mechanism allows higher-fitness solutions to exert greater influence over the search process, thereby enhancing global optimization performance [45,46]. The specific process of MVO is illustrated in the figure below (Figure 4).
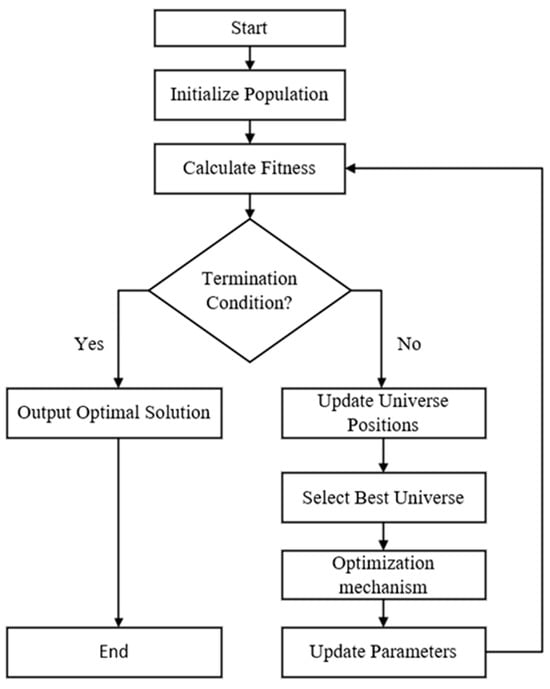
Figure 4.
Flowchart of the Multi-verse algorithm.
In MVO, a universe represents a solution to the optimization problem, where each object within a universe corresponds to a position vector of that solution. The expansion rate of a universe is proportional to the fitness of its solution. The optimization process begins with initialization, followed by iterative updates governed by an asymptotic iteration rule. The stochastic initialization U of the multiverse population is defined as:
where d denotes the number of objects, representing the dimensionality of the search space, and n indicates the number of universes.
To obtain a globally optimal solution based on the initial solution set U, the MVO mathematical model incorporates three key concepts: white holes, black holes, and wormholes. These elements govern the algorithm’s optimization behavior: (1) A universe with a higher expansion rate is more likely to produce a white hole and less likely to contain a black hole. (2) Objects are transferred from white holes to black holes. (3) Objects in all universes may move randomly through wormholes towards the optimal universe, regardless of their expansion rate. Each universe expands at a distinct rate, and the renewal process utilizes a roulette wheel selection mechanism, whereby objects are transferred through the orbits of white and black holes, as defined by the following equation:
where denotes the j-th parameter of the ith universe, is the k-th universe’s j object chosen by the roulette wheel mechanism, r1 is a random number between [0, 1], Ui represents the i-th universe, and NI(Ui) denotes the normalized inflation rate of that universe.
In addition to using Equation (8) to update universe objects, wormholes are also incorporated into the iterative process. A wormhole connects universes, stimulating internal objects to migrate towards the current best universe, thus increasing the probability of convergence. This movement is defined by Equation (9):
where is the j-th object in the current optimal universe bl,j, and bu,j are the lower and upper limits, respectively, r2, r3, and r4 are random numbers in the interval [0, 1], The wormhole existence probability (WEP) controls the probability of agents moving toward the current best solution through a “wormhole” mechanism. It determines the balance between exploration and exploitation during the optimization process. The traveling distance rate (TDR) defines the movement step size of agents toward the current optimal solution. It directly influences the convergence speed of the algorithm. WEP and TDR are two key parameters, updated according to the following principles:
where l is the current iteration number, and L is the maximum number of iterations, min and max correspond to the minimum and maximum wormhole probabilities, respectively, and ρ denotes the degree of wormhole utilization.
The selection of key hyperparameters, such as the number of trees and the maximum depth, has a significant influence on the performance of the RF algorithm. The MVO algorithm is applied to effectively optimize hyperparameter configurations, maximizing out-of-bag (OOB) accuracy and thereby enhancing classification performance. MVO eliminates the need for manual tuning and enables the RF model to reach its optimal configuration. The ability of MVO to balance local exploitation and global exploration is essential to improving model performance. Pseudo-code flow illustrates the main program (Algorithm 1).
| Algorithm 1: Multiverse Optimization (MVO) for Random Forest Parameter Tuning |
 |
- Initialization: A population of candidate solutions (termed “universes”) is randomly generated within the predefined hyperparameter space. Each universe corresponds to a distinct set of RF hyperparameters.
- Model Training and Evaluation: An RF model is trained using the hyperparameters defined by each universe.
- Performance Assessment: Out-of-bag accuracy is computed to assess the generalization ability of each RF configuration.
- Best Solution Selection: The best-performing universe is selected based on OOB performance. This optimal universe acts as the “black hole”, attracting other universes in subsequent iterations.
- Iteration and Update: If the maximum number of generations is not yet reached, the population is updated using MVO’s black hole and boundary control mechanisms to generate new candidates. This cycle continues until the convergence criteria are met.
2.4. Accuracy Evaluation Methods
To evaluate the effectiveness of the MVO_RF algorithm in recognizing and identifying wheat powdery mildew using polarimetric images, this study compares its performance with that of six traditional machine learning models. To ensure rigorous performance evaluation and prevent overfitting, 10-fold cross-validation was applied to the dataset. The data were randomly partitioned into 10 folds, maintaining the original class distribution. For each iteration, the model was trained on 90% of the data and tested on the remaining 10%. The results were averaged across all folds. Five metrics—F1 score, recall, accuracy, precision, and Kappa coefficient—were used to assess the classification performance of MVO_RF. This method ensures that the reported results are not inflated due to data leakage and aims to determine the most effective approach for identifying powdery mildew in a comparative setting.
The kappa coefficient is a metric utilized to assess how well predictions and actual classification results agree.
where Pe indicates the probability of random classification, and Po represents the observed classification accuracy.
Accuracy is used to describe the ratio of correctly classified leaf spot samples to the total number of leaf samples, which can be calculated using Equation (13).
Precision represents the proportion of samples predicted as diseased spots that belong to the diseased spot category, which can be calculated using Equation (14).
Recall is used to measure the proportion of actual diseased spot samples that are correctly classified, which can be calculated using Equation (15).
The F1 Score is the harmonic mean of Precision and Recall, which can be calculated according to Equation (16).
In the above formulas, TP (True Positive) represents the number of correctly identified diseased spot samples, TN (True Negative) refers to the correctly classified non-diseased spot samples, FN (False Negative) denotes diseased spot samples misclassified as non-diseased, and FP (False Positive) represents non-diseased spot samples incorrectly identified as diseased spots.
3. Results
3.1. Image Noise Processing Visualization
Below are the degree of polarization image (Figure 5) and the image processed using median filtering (Figure 6). The leaf surface appears smoother due to the effective reduction of high-frequency noise by median filtering, which makes diseased patches easier to recognize. In contrast, noise in the original image causes uneven brightness in affected regions. Quantitative evaluation demonstrates improved image quality after filtering: a PSNR of 25.17 dB indicates effective noise suppression with good signal fidelity; a CNR of 3.32 reflects enhanced contrast between diseased and healthy areas; and the OIE and DIE values suggest improved edge preservation and detail retention (Table 1). These results confirm that median filtering achieves a balance between noise removal and feature preservation, supporting its suitability for wheat powdery mildew detection.
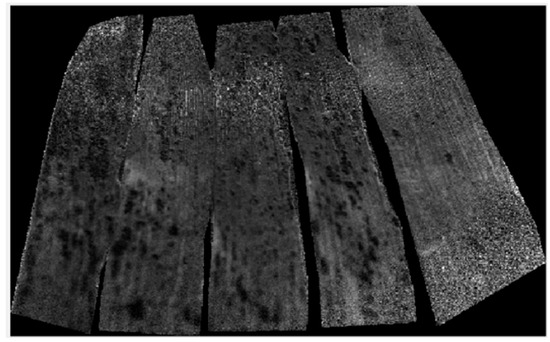
Figure 5.
Original Degree of Polarization image of a wheat leaf.
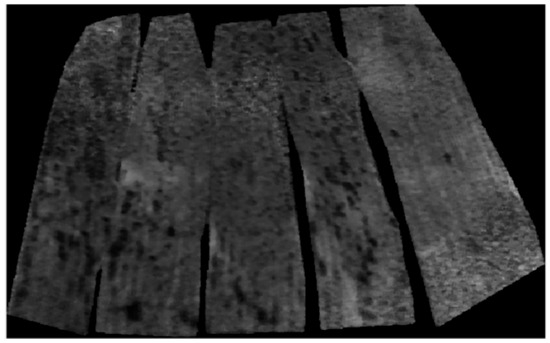
Figure 6.
Processed Degree of Polarization image after median filtering.

Table 1.
Quantitative Evaluation Indicators for Denoising Effect of Polarization Images.
3.2. Visualization of Classification Recognition
In addition to RF, other machine learning methods are also widely employed in classification tasks. SVM uses kernel functions to perform non-linear transformations, enabling the identification of optimal classification boundaries in high-dimensional space for accurate data classification [47]. KNN classifies samples based on a majority voting mechanism among the K most similar instances [48]. Naive Bayes (NB), with minimal data requirements, can handle numerous features by computing the posterior probability of each class for classification [49]. Artificial Neural Networks (ANN) consist of interconnected neurons functioning as basic computational units [50]. In this study, we specifically adopt a single-layer ANN architecture, comprising an input layer directly connected to the output layer. Specifically, the Multi-Layer Perceptron (MLP) adjusts its weights through the back-propagation algorithm during training, allowing the network to effectively fit the training data and enhance classification accuracy [51].
Below are the classification results, demonstrating the varying effectiveness of different algorithms in distinguishing healthy and diseased regions (Figure 7). In the classification maps, green represents healthy areas, while red indicates diseased regions. Among the algorithms evaluated, MVO_RF achieves the most accurate and balanced classification, effectively separating healthy and infected areas with minimal noise and clearer region boundaries. As an optimization of RF, MVO_RF enhances parameter selection, leading to more stable and continuous classification outputs. This results in well-distributed disease patterns with reduced classification noise, improved spatial continuity, and sharper boundaries, highlighting its superior ability to capture subtle differences between healthy and diseased tissues. In contrast, standard RF, without hyperparameter optimization, is more susceptible to noise, producing fragmented and irregular red patches. Due to the assumption of feature independence, NB often misclassifies healthy areas as diseased, resulting in excessive red patches. Although SVM performs reasonably well, it still exhibits more noise at region edges, reducing consistency. The multi-layer perceptron suffers from poor generalization, misclassifying healthy areas and producing overly dispersed red regions. Likewise, ANNs exhibit even greater dispersion and misclassification, particularly near leaf edges, which decreases classification accuracy. KNN struggles to handle the high-dimensional feature space in polarization images, resulting in significant noise and indistinct classification boundaries, which underlines its limitations in complex classification tasks.
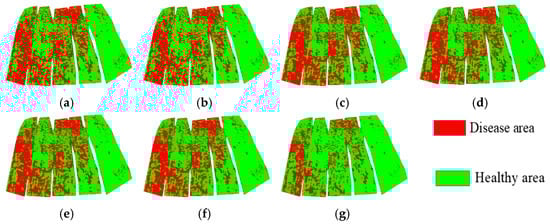
Figure 7.
Visualization of different identification classification algorithms, including red disease zone and green healthy zone: (a) MVO_RF; (b) RF; (c) NB; (d) SVM; (e) MLP; (f) ANN; and (g) KNN.
3.3. Overall Classification Accuracy Evaluation
Below is a comprehensive evaluation of various classification algorithms based on key performance metrics, including Overall Accuracy (OA), Average Precision (AP), Average Recall (AR), Average F1 Score (AF1), and the Kappa Coefficient (Table A1). The results show that MVO_RF consistently outperforms the other classifiers across multiple evaluation criteria, confirming its robustness and effectiveness for powdery mildew classification. Regarding overall classification accuracy, all models perform well, with OA exceeding 0.9850. MVO_RF attains an OA of 0.9878, slightly higher than RF (0.9876), KNN (0.9864), and SVM (0.9865). Kappa Coefficient results mirror this trend, with all methods scoring above 0.9700. MVO_RF achieves the highest Kappa value of 0.9797, indicating a reliable classification. In terms of distinguishing healthy and diseased areas, MVO_RF achieves an AR of 0.9682, while KNN lags at 0.9559. Furthermore, MVO_RF achieves the highest AF1 score of 0.9715 (Figure 8), confirming its balanced classification and low misclassification rate. Compared to SVM and ANN, MVO_RF demonstrates superior consistency across AP, AR, and AF1, making it particularly well-suited to disease classification tasks.
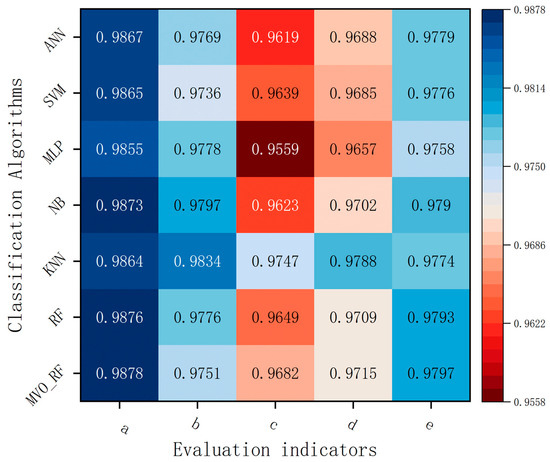
Figure 8.
Recognition results based on different algorithms: a is OA, b is AP, c is AR, d is AF1, and e is Kappa.
In summary, MVO_RF outperforms traditional machine learning approaches, particularly excelling in recall, overall accuracy, and the Kappa Coefficient. Its strong recall and classification balance make it an ideal method for detecting wheat powdery mildew. This comparative analysis illustrates the benefit of multiverse optimization in enhancing classification accuracy, showcasing its potential for real-world applications in precision agriculture, where early and reliable disease detection is vital for effective crop management.
3.4. Performance Evaluation of Different Categories
Below is the classification performance of various algorithms in identifying healthy regions (Table A2). The results indicate that MVO_RF achieves the highest F1 score of 0.9809. This improvement is attributed to the optimization provided by the MVO, which enhances hyperparameter tuning and decision boundary formation, improving precision to 0.9738 and recall to 0.9882. While improvements over other methods—particularly RF and SVM—are slight, they demonstrate the efficacy of combining MVO with RF for improving classification performance.
The findings show that MVO_RF obtains the highest F1 score of 0.9621, confirming the effectiveness of integrating MVO with RF for enhanced classification accuracy. The model achieves a precision of 0.9763 and a recall of 0.9483, indicating a good balance in detecting diseased areas while minimizing false positives. Although traditional RF records slightly higher precision (0.9872), it yields a marginally lower recall (0.9361), suggesting a more conservative classification. Similarly, KNN and SVM report very high precision values (0.9986 and 0.9959, respectively), but their lower recall (0.9125 and 0.9266) indicates a greater risk of missed detections. These trade-offs underscore the balanced performance of MVO_RF, which achieves more stable and reliable results across both precision and recall metrics.
Overall, the results confirm the robustness and effectiveness of MVO_RF in classifying both healthy and diseased regions, reinforcing its suitability for remote sensing-based vegetation health monitoring (Table A3). The following shows that MVO_RF outperforms traditional classifiers in terms of accuracy, recall, and F1 score, particularly excelling in disease identification (Figure 9). Its exceptional stability and balanced performance make it highly suitable for real-world agricultural applications where precise and early detection of crop diseases is critical. These advantages further underscore the potential of MVO_RF in improving the efficiency of wheat powdery mildew detection using polarization-based remote sensing technology.
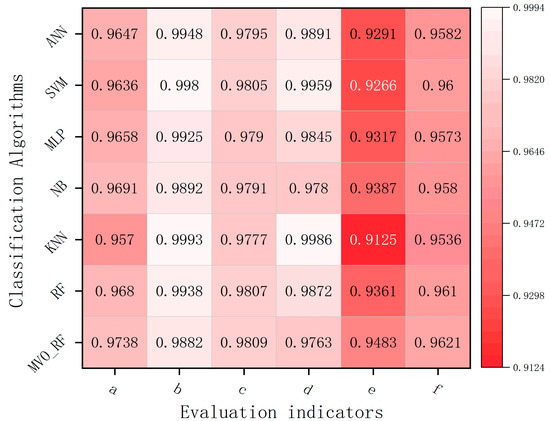
Figure 9.
Performance comparison of different algorithms in healthy (a–c) and diseased (d–f) zones: a and d are Precision, b and e are Recall, and c and f are F-score.
4. Discussion
This study proposes an effective approach for identifying wheat powdery mildew by integrating MVO_RF with remote polarization sensing. The method captures microstructural changes on the leaf surface caused by fungal infection, thereby enhancing detection accuracy and providing a novel solution for crop disease monitoring. Powdery mildew infection modifies the leaf surface morphology, altering the reflection and scattering characteristics of incident light and subsequently affecting the polarization state of the reflected light [52,53]. These effects can be quantitatively described by DOP and AOP, which serve as key diagnostic parameters. Healthy wheat leaves generally exhibit higher polarization uniformity due to their smooth surface, while infected areas disrupt this uniformity, leading to localized fluctuations in DOP and AOP. By analyzing the spatial distribution of these polarization parameters, the MVO_RF model effectively distinguishes between healthy and diseased tissues, achieving high classification accuracy with minimal noise and clear boundary definition. This demonstrates that polarization information provides valuable insight into plant surface texture, roughness, and light-scattering mechanisms, offering a promising foundation for early disease detection, precision spraying, and intelligent agricultural management.
These findings are consistent with previous studies reporting that leaf surface roughness and structural anisotropy significantly affect polarization responses [54,55]. Similarly, An et al. and Chen et al. demonstrated that fungal infections alter optical scattering properties, which can be effectively detected through changes in DOP and AOP [56,57]. However, unlike earlier research that primarily relied on spectral indices or texture features for disease discrimination, the present study demonstrates that polarization parameters provide a more direct and physically meaningful representation of surface structural alterations. This enables earlier and more precise detection of infection, even before the appearance of visible symptoms. Moreover, compared with traditional machine learning approaches such as SVM or Random Forest alone, the integration of the MVO optimization algorithm improved model generalization and stability. The proposed MVO_RF model effectively utilizes polarization information to identify subtle differences between healthy and infected areas, thus enabling more accurate and noise-resistant disease classification. As the pathogen Blumeria graminis f. sp. tritici colonizes the leaf surface, it disrupts the microstructural uniformity, resulting in localized deformation of epidermal cells and increased optical roughness [58]. The DOP, in particular, acts as a robust optical indicator capable of detecting these microstructural anomalies even before visible symptoms emerge, consistent with the observations of Liang et al. on early-stage disease detection using polarization cues [59]. Hence, the proposed framework contributes to advancing early disease warning systems in precision agriculture by exploiting the unique diagnostic value of polarization information.
Despite the encouraging results obtained under controlled indoor conditions, this study acknowledges several limitations and outlines potential directions for future research. The current experimental design, based on uniform illumination, fixed leaf orientation, and a black background, facilitated accurate polarization imaging but may not fully capture the complexity of field environments. In real agricultural scenarios, factors such as varying sunlight intensity and angle, irregular leaf curvature, complex backgrounds, and wind-induced motion can significantly influence polarization signals and classification accuracy. Future work will therefore focus on conducting field experiments under natural sunlight conditions, using in situ wheat plants at different growth stages to validate the robustness and adaptability of the proposed MVO_RF model. Moreover, integrating the polarization imaging system with unmanned aerial vehicles (UAVs) or portable ground-based sensors could enable high-throughput, non-destructive disease monitoring in large-scale or smallholder farming systems [60]. Combining polarization information with complementary sensing modalities—such as multispectral, hyperspectral, or thermal data—may further enhance detection stability under variable environmental conditions. Ultimately, embedding this approach within a precision agriculture framework could facilitate early disease warning, optimize site-specific fungicide application, and contribute to more sustainable and intelligent crop protection strategies.
5. Conclusions
This study proposes a method for identifying wheat powdery mildew by integrating MVO_RF with remote polarization sensing. This approach significantly enhances detection accuracy and offers an innovative solution for monitoring agricultural diseases. The conclusions are as follows: (1) Polarization remote sensing was used to extract polarization parameters—DOP and AOP—from wheat leaves to study optical differences under varied health conditions. The results indicate that polarization features exhibit greater sensitivity and reliability compared to traditional spectral and texture-based characteristics. (2) The limitations of conventional RF in parameter selection were addressed by optimizing the model with MVO, significantly improving classification performance through efficient global search and fast convergence. (3) The study showed that MVO_RF excelled in classifying powdery mildew, achieving an accuracy of 0.9878. Its F1 score, recall, and Kappa coefficient significantly outperformed traditional machine learning models. In conclusion, the integration of MVO_RF with polarization remote sensing provides a novel and effective approach for wheat powdery mildew detection and offers potential for broader agricultural disease identification. Future work will explore extending this framework to other crop diseases, evaluating different optimization strategies, and promoting intelligent, data-driven agriculture.
Author Contributions
Conceptualization, Q.Q.; methodology, T.L.; software, Q.Q. and T.L.; validation, Q.Q., T.L., X.C., Q.T. and Q.Y.; formal analysis, X.C. and Z.W.; investigation, Q.Q., X.C. and Q.T.; resources, Q.Q., T.L., Z.W., X.C. and Q.Y.; writing—original draft, Q.Q.; project administration, T.L.; funding acquisition, T.L. All authors have read and agreed to the published version of the manuscript.
Funding
This research was supported by the Natural Science Foundation of Shandong Province, China under Grant numbers ZR2021MD090, and ZR2023MD129; and the National Natural Science Foundation of China under Grant number 31800367; and the Liaocheng University Undergraduate Innovation and Entrepreneurship Training Program under Grant numbers cxcy2025032, and cxcy2025033.
Institutional Review Board Statement
Not applicable.
Data Availability Statement
Data will be made available on request.
Conflicts of Interest
The authors declare that they have no known competing financial interest or personal relationships that could have appeared to influence the work reported in this paper.
Appendix A
Table A1.
Comparison of identification accuracies for the MVO_RF, RF, KNN, NB, MLP, SVM, and ANN.
Table A1.
Comparison of identification accuracies for the MVO_RF, RF, KNN, NB, MLP, SVM, and ANN.
| Image Classification Methods | OA | AP | AR | AF1 | Kappa |
|---|---|---|---|---|---|
| MVO Optimizes RF | 0.9878 | 0.9751 | 0.9682 | 0.9715 | 0.9797 |
| Random Forests | 0.9876 | 0.9776 | 0.9649 | 0.9709 | 0.9793 |
| K-Nearest Neighbors | 0.9864 | 0.9834 | 0.9747 | 0.9788 | 0.9774 |
| Naive Bayes | 0.9873 | 0.9797 | 0.9623 | 0.9702 | 0.9790 |
| Multi-Layer Perceptron | 0.9855 | 0.9778 | 0.9559 | 0.9657 | 0.9758 |
| Support Vector Machine | 0.9865 | 0.9736 | 0.9639 | 0.9685 | 0.9776 |
| Artificial Neural Networks | 0.9867 | 0.9769 | 0.9619 | 0.9688 | 0.9779 |
Table A2.
Classification results of health areas based on different algorithms.
Table A2.
Classification results of health areas based on different algorithms.
| Image Classification Methods | Precision | Recall | F-Score |
|---|---|---|---|
| MVO Optimizes RF | 0.9738 | 0.9882 | 0.9809 |
| Random Forests | 0.9680 | 0.9938 | 0.9807 |
| K-Nearest Neighbors | 0.9570 | 0.9993 | 0.9777 |
| Naive Bayes | 0.9691 | 0.9892 | 0.9791 |
| Multi-Layer Perceptron | 0.9658 | 0.9925 | 0.9790 |
| Support Vector Machine | 0.9636 | 0.9980 | 0.9805 |
| Artificial Neural Networks | 0.9647 | 0.9948 | 0.9795 |
Table A3.
Classification results of disease areas based on different algorithms.
Table A3.
Classification results of disease areas based on different algorithms.
| Image Classification Methods | Precision | Recall | F-Score |
|---|---|---|---|
| MVO Optimizes RF | 0.9763 | 0.9483 | 0.9621 |
| Random Forests | 0.9872 | 0.9361 | 0.9610 |
| K-Nearest Neighbors | 0.9986 | 0.9125 | 0.9536 |
| Naive Bayes | 0.9780 | 0.9387 | 0.9580 |
| Multi-Layer Perceptron | 0.9845 | 0.9317 | 0.9573 |
| Support Vector Machine | 0.9959 | 0.9266 | 0.9600 |
| Artificial Neural Networks | 0.9891 | 0.9291 | 0.9582 |
References
- Shaheen, A.; Li, Z.; Yang, Y.; Xie, J.; Zhu, L.; Li, C.; Nie, F.; Wang, M.; Wang, Y.; Rasheed, A.; et al. Genetic Regulation of Wheat Plant Architecture and Future Prospects for Its Improvement. New Crops 2025, 2, 100048. [Google Scholar] [CrossRef]
- Xuan, G.; Li, Q.; Shao, Y.; Shi, Y. Early Diagnosis and Pathogenesis Monitoring of Wheat Powdery Mildew Caused by Blumeria graminis Using Hyperspectral Imaging. Comput. Electron. Agric. 2022, 197, 106921. [Google Scholar] [CrossRef]
- Cui, L.; Siskos, L.; Wang, C.; Schouten, H.J.; Visser, R.G.F.; Bai, Y. Breeding Melon (Cucumis melo) with Resistance to Powdery Mildew and Downy Mildew. Hortic. Plant J. 2022, 8, 545–561. [Google Scholar] [CrossRef]
- Bilstein-Schloemer, M.; Müller, M.C.; Saur, I.M.L. Technical Advances Drive the Molecular Understanding of Effectors from Wheat and Barley Powdery Mildew Fungi. Mol. Plant-Microbe Interact. 2025, 38, 213–225. [Google Scholar] [CrossRef] [PubMed]
- Xie, D.; Cai, X.; Yang, C.; Xie, L.; Qin, G.; Zhang, M.; Huang, Y.; Gong, G.; Chang, X.; Chen, H. Studies on the Control Effect of Bacillus subtilis on Wheat Powdery Mildew. Pest. Manag. Sci. 2021, 77, 4375–4382. [Google Scholar] [CrossRef]
- Zhu, M.; Zhang, W.; Duan, X.; Yan, S.; Cai, Y.; Gong, S.; Fahad, S.; Qiu, Z. Biocontrol Potential of Cladosporium sphaerospermum Against the Wheat Powdery Mildew Fungus Blumeria graminis f. sp. Tritici. Plant Dis. 2024, 108, 2983–2988. [Google Scholar] [CrossRef]
- Takács, G.; Gergely, I.; Ördög, V.; Vörös, L.; Iváncsics, J. Approaches to Studying Wheat and Maize Drought Stress Responses. Plant Soil 2025, early access. [Google Scholar] [CrossRef]
- He, P.; Cui, W.; Peng, L. Biocontrol Efficacy of Bacillus velezensis HC-8 against Powdery Mildew of Honeysuckle Caused by Erysiphe lonicerae Var. Lonicerae. Biol. Control 2022, 166, 104834. [Google Scholar] [CrossRef]
- Zhu, C.; Hu, Y.; Mao, H.; Li, S.; Li, F.; Zhao, C.; Luo, L.; Liu, W.; Yuan, X. A Deep Learning-Based Method for Automatic Assessment of Stomatal Index in Wheat Microscopic Images of Leaf Epidermis. Front. Plant Sci. 2021, 12, 716784. [Google Scholar] [CrossRef]
- Sun, Z.; Wang, G.; Li, P.; Wang, H.; Zhang, M.; Liang, X. An Improved Random Forest Based on the Classification Accuracy and Correlation Measurement of Decision Trees. Expert Syst. Appl. 2024, 237, 121549. [Google Scholar] [CrossRef]
- Zhang, S. Challenges in KNN Classification. IEEE Trans. Knowl. Data Eng. 2022, 34, 4663–4675. [Google Scholar] [CrossRef]
- Amer, A.A.; Ravana, S.D.; Habeeb, R.A.A. Effective K-Nearest Neighbor Models for Data Classification Enhancement. J. Big Data 2025, 12, 86. [Google Scholar] [CrossRef]
- Yang, L.; Jin, Y.; Lu, W.; Wang, X.; Yan, Y.; Tong, Y.; Su, D.; Huang, K.; Zou, J. Application of Machine Learning in Depression Risk Prediction for Connective Tissue Diseases. Sci. Rep. 2025, 15, 1706. [Google Scholar] [CrossRef] [PubMed]
- Wang, J.; Xu, Y.-P.; She, C.; Xu, P.; Bagal, H.A. Optimal Parameter Identification of SOFC Model Using Modified Gray Wolf Optimization Algorithm. Energy 2022, 240, 122800. [Google Scholar] [CrossRef]
- Zhang, M.; Xu, Z.; Lu, X.; Liu, Y.; Xiao, Q.; Taheri, B. An Optimal Model Identification for Solid Oxide Fuel Cell Based on Extreme Learning Machines Optimized by Improved Red Fox Optimization Algorithm. Int. J. Hydrogen Energy 2021, 46, 28270–28281. [Google Scholar] [CrossRef]
- Mzoughi, O.; Yahiaoui, I. Deep Learning-Based Segmentation for Disease Identification. Ecol. Inform. 2023, 75, 102000. [Google Scholar] [CrossRef]
- Lee, S.H.; Goëau, H.; Bonnet, P.; Joly, A. New Perspectives on Plant Disease Characterization Based on Deep Learning. Comput. Electron. Agric. 2020, 170, 105220. [Google Scholar] [CrossRef]
- MacGillivray, A.; De Jong, C. A Reference Spectrum Model for Estimating Source Levels of Marine Shipping Based on Automated Identification System Data. JMSE 2021, 9, 369. [Google Scholar] [CrossRef]
- Samek, W.; Montavon, G.; Lapuschkin, S.; Anders, C.J.; Muller, K.-R. Explaining Deep Neural Networks and Beyond: A Review of Methods and Applications. Proc. IEEE 2021, 109, 247–278. [Google Scholar] [CrossRef]
- Zhang, Y.; Zhong, W.; Pan, H. Identification of Stored Grain Pests by Modified Residual Network. Comput. Electron. Agric. 2021, 182, 105983. [Google Scholar] [CrossRef]
- Aishwarya, N.; Manoj Prabhakaran, K.; Debebe, F.T.; Reddy, M.S.S.A.; Pranavee, P. Skin Cancer Diagnosis with Yolo Deep Neural Network. Procedia Comput. Sci. 2023, 220, 651–658. [Google Scholar] [CrossRef]
- Zhao, C.; Shu, X.; Yan, X.; Zuo, X.; Zhu, F. RDD-YOLO: A Modified YOLO for Detection of Steel Surface Defects. Measurement 2023, 214, 112776. [Google Scholar] [CrossRef]
- Wang, Y.; Yan, G.; Meng, Q.; Yao, T.; Han, J.; Zhang, B. DSE-YOLO: Detail Semantics Enhancement YOLO for Multi-Stage Strawberry Detection. Comput. Electron. Agric. 2022, 198, 107057. [Google Scholar] [CrossRef]
- Lao, S.; Robertson, B.A.; Anderson, A.W.; Blair, R.B.; Eckles, J.W.; Turner, R.J.; Loss, S.R. The Influence of Artificial Light at Night and Polarized Light on Bird-Building Collisions. Biol. Conserv. 2020, 241, 108358. [Google Scholar] [CrossRef]
- Sun, Z.; Huang, Y.; Bao, Y.; Wu, D. Polarized Remote Sensing: A Note on the Stokes Parameters Measurements from Natural and Man-Made Targets Using a Spectrometer. IEEE Trans. Geosci. Remote Sens. 2017, 55, 4008–4021. [Google Scholar] [CrossRef]
- Kong, J.; Ryu, Y.; Jeong, S.; Zhong, Z.; Choi, W.; Kim, J.; Lee, K.; Lim, J.; Jang, K.; Chun, J.; et al. Super Resolution of Historic Landsat Imagery Using a Dual Generative Adversarial Network (GAN) Model with CubeSat Constellation Imagery for Spatially Enhanced Long-Term Vegetation Monitoring. ISPRS J. Photogramm. Remote Sens. 2023, 200, 1–23. [Google Scholar] [CrossRef]
- Sun, Z.; Wu, D.; Lv, Y.; Zhao, Y. Bidirectional Polarized Reflectance Factors of Vegetation Covers: Influence on the BRF Models Results. IEEE Trans. Geosci. Remote Sens. 2017, 55, 5687–5701. [Google Scholar] [CrossRef]
- Mandal, D.; Kumar, V.; Ratha, D.; Dey, S.; Bhattacharya, A.; Lopez-Sanchez, J.M.; McNairn, H.; Rao, Y.S. Dual Polarimetric Radar Vegetation Index for Crop Growth Monitoring Using Sentinel-1 SAR Data. Remote Sens. Environ. 2020, 247, 111954. [Google Scholar] [CrossRef]
- Li, S.; Jiao, J.; Chen, J.; Wang, C. A New Polarization-Based Vegetation Index to Improve the Accuracy of Vegetation Health Detection by Eliminating Specular Reflection of Vegetation. IEEE Trans. Geosci. Remote Sens. 2022, 60, 4414718. [Google Scholar] [CrossRef]
- Wang, H.; Zhai, Y.; Zhao, M.; Qin, K. Evaluation of Aerosol Optical Depth Products From Multiangular and Polarized Satellite Measurements Over Mountainous Areas. IEEE Trans. Geosci. Remote Sens. 2022, 60, 4109810. [Google Scholar] [CrossRef]
- Jin, S.; Ma, Y.; Chen, C.; Dubovik, O.; Hong, J.; Liu, B.; Gong, W. Performance Evaluation for Retrieving Aerosol Optical Depth from the Directional Polarimetric Camera (DPC) Based on the GRASP Algorithm. Atmos. Meas. Tech. 2022, 15, 4323–4337. [Google Scholar] [CrossRef]
- Judge, M.; Kashima, Y.; Steg, L.; Dietz, T. Environmental Decision-Making in Times of Polarization. Annu. Rev. Environ. Resour. 2023, 48, 477–503. [Google Scholar] [CrossRef]
- Gu, Q.; Han, Y.; Xu, Y.; Yao, H.; Niu, H.; Huang, F. Laboratory Research on Polarized Optical Properties of Saline-Alkaline Soil Based on Semi-Empirical Models and Machine Learning Methods. Remote Sens 2022, 14, 226. [Google Scholar] [CrossRef]
- Wei, B.; Zou, B.; Liu, J.; Wang, W.; Wang, W.; Cao, Z.; Han, T.; Li, F.; Luo, W.; Shan, L.; et al. Polarization-Sensitive Photodetector Based on Quasi-1D (TaSe4)2 I Nanowire Response to 10.6 Μm. Adv. Funct. Mater. 2024, 34, 2315194. [Google Scholar] [CrossRef]
- Usmani, K.; O’Connor, T.; Javidi, B. Three-Dimensional Polarimetric Image Restoration in Low Light with Deep Residual Learning and Integral Imaging. Opt. Express 2021, 29, 29505. [Google Scholar] [CrossRef]
- Zhu, Z.; Dong, Y.; You, D.; Sun, X. Accurate Three-Dimensional Measurement Based on Polarization-Defocused Encoded Structured Light. Measurement 2022, 205, 112128. [Google Scholar] [CrossRef]
- Yang, S.; Fan, L.; Yin, L.; Zhao, Y.; Li, W.; Zhao, R.; Jia, X.; Dong, F.; Zheng, Z.; Zhao, D.; et al. Ginseng Exosomes Modulate M1/M2 Polarisation by Activating Autophagy and Target IKK/IκB/NF-κB to Alleviate Inflammatory Bowel Disease. J. Nanobiotechnol. 2025, 23, 198. [Google Scholar] [CrossRef]
- Luo, L.; Liu, M.; Fan, Y.; Zhang, J.; Liu, L.; Li, Y.; Zhang, Q.; Xie, H.; Jiang, C.; Wu, J.; et al. Intermittent Theta-Burst Stimulation Improves Motor Function by Inhibiting Neuronal Pyroptosis and Regulating Microglial Polarization via TLR4/NFκB/NLRP3 Signaling Pathway in Cerebral Ischemic Mice. J. Neuroinflamm. 2022, 19, 141. [Google Scholar] [CrossRef]
- Wu, B.; Zhang, M.; Zeng, H.; Tian, F.; Potgieter, A.B.; Qin, X.; Yan, N.; Chang, S.; Zhao, Y.; Dong, Q.; et al. Challenges and Opportunities in Remote Sensing-Based Crop Monitoring: A Review. Natl. Sci. Rev. 2023, 10, nwac290. [Google Scholar] [CrossRef]
- Mapuranga, J.; Chang, J.; Yang, W. Combating Powdery Mildew: Advances in Molecular Interactions between Blumeria graminis f. sp. Tritici and Wheat. Front. Plant Sci. 2022, 13, 1102908. [Google Scholar] [CrossRef]
- Tienda-Vazquez, M.A.; Arredondo, P.; Mejía-Delgadillo, X.; Rodríguez-González, J.A.; Soto-Cajiga, J.A.; Sabath, E.; Lozano, O.; Almanza-Arjona, Y.C. Biological Testing Unification for Hemodialysis Membranes Evaluation: A Step towards Standardization. Biomater. Adv. 2025, 169, 214165. [Google Scholar]
- Yu, Z.; Li, Y.; Deng, L.; Luo, B.; Wu, P.; Geng, D. A High-performance Cell-phone Based Polarized Microscope for Malaria Diagnosis. J. Biophotonics 2023, 16, e202200290. [Google Scholar]
- Jiang, Q.; Wang, H.; Wang, H. Severity Assessment of Wheat Stripe Rust Based on Machine Learning. Front. Plant Sci. 2023, 14, 1150855. [Google Scholar] [CrossRef] [PubMed]
- Sawant, S.S.; Prabukumar, M.; Loganathan, A.; Alenizi, F.A.; Ingaleshwar, S. Multi-Objective Multi-Verse Optimizer Based Unsupervised Band Selection for Hyperspectral Image Classification. Int. J. Remote Sens. 2022, 43, 3990–4024. [Google Scholar] [CrossRef]
- Aljarah, I.; Faris, H.; Heidari, A.A.; Mafarja, M.M.; Al-Zoubi, A.M.; Castillo, P.A.; Merelo, J.J. A Robust Multi-Objective Feature Selection Model Based on Local Neighborhood Multi-Verse Optimization. IEEE Access 2021, 9, 100009–100028. [Google Scholar] [CrossRef]
- Kumar, S.; Panagant, N.; Tejani, G.G.; Pholdee, N.; Bureerat, S.; Mashru, N.; Patel, P. A Two-Archive Multi-Objective Multi-Verse Optimizer for Truss Design. Knowl.-Based Syst. 2023, 270, 110529. [Google Scholar] [CrossRef]
- Daviran, M.; Maghsoudi, A.; Ghezelbash, R. Optimized AI-MPM: Application of PSO for Tuning the Hyperparameters of SVM and RF Algorithms. Comput. Geosci. 2025, 195, 105785. [Google Scholar]
- Cunningham, P.; Delany, S.J. K-Nearest Neighbour Classifiers—A Tutorial. ACM Comput. Surv. 2022, 54, 1–25. [Google Scholar] [CrossRef]
- Wilson, A.J.; Lakeland, B.S.; Wilson, T.J.; Naylor, T. A Naive Bayes Classifier for Identifying Class II YSOs. Mon. Not. R. Astron. Soc. 2023, 521, 354–388. [Google Scholar] [CrossRef]
- Srisai, S.; Kongkeaw, P.; Harnsoongnoen, S. Noncontact and Noninvasive Detection of Glucose Concentration Using a Single-Port Microwave Sensor Coupled with Artificial Neural Networks. IEEE Trans. Instrum. Meas. 2025, 74, 9510910. [Google Scholar] [CrossRef]
- Meng, Z.; Zhao, F.; Liang, M. SS-MLP: A Novel Spectral-Spatial MLP Architecture for Hyperspectral Image Classification. Remote Sens. 2021, 13, 4060. [Google Scholar] [CrossRef]
- Zeng, T.; Zhang, H.; Li, Y.; Yin, C.; Liang, Q.; Fang, J.; Fu, W.; Wang, J.; Zhang, X. Monitoring the Severity of Rubber Tree Infected with Powdery Mildew Based on UAV Multispectral Remote Sensing. Forests 2023, 14, 717. [Google Scholar] [CrossRef]
- Chen, X.; Miao, Y.; Kusnierek, K.; Li, F.; Wang, C.; Shi, B.; Wu, F.; Chang, Q.; Yu, K. Potential of Multi-Source Multispectral vs. Hyperspectral Remote Sensing for Winter Wheat Nitrogen Monitoring. Remote Sens. 2025, 17, 2666. [Google Scholar]
- Bapela, T.; Shimelis, H.; Terefe, T.; Bourras, S.; Sánchez-Martín, J.; Douchkov, D.; Desiderio, F.; Tsilo, T.J. Breeding Wheat for Powdery Mildew Resistance: Genetic Resources and Methodologies—A Review. Agronomy 2023, 13, 1173. [Google Scholar] [CrossRef]
- Song, L.; Wang, L.; Yang, Z.; He, L.; Feng, Z.; Duan, J.; Feng, W.; Guo, T. Comparison of Algorithms for Monitoring Wheat Powdery Mildew Using Multi-Angular Remote Sensing Data. Crop J. 2022, 10, 1312–1322. [Google Scholar]
- An, L.; Liu, Y.; Wang, N.; Liu, G.; Liu, M.; Tang, W.; Sun, H.; Li, M. Classification of Wheat Powdery Mildew Based on Hyperspectral: From Leaves to Canopy. Crop Prot. 2024, 177, 106559. [Google Scholar] [CrossRef]
- Chen, X.; Liang, T.; Tang, Q.; Yu, Q. Circular Polarization Characterization Analysis: A Case Study of the Scaled Model of the Ship and Water Body. Measurement 2024, 235, 115024. [Google Scholar] [CrossRef]
- Zhao, J.; Fang, Y.; Chu, G.; Yan, H.; Hu, L.; Huang, L. Identification of Leaf-Scale Wheat Powdery Mildew (Blumeria graminis f. sp. Tritici) Combining Hyperspectral Imaging and an SVM Classifier. Plants 2020, 9, 936. [Google Scholar] [CrossRef] [PubMed]
- Liang, T.; Tang, Q.; Yu, Q.; He, Z.; Zhang, B. Measurement of Polarization-Sensitive Characteristic of Scientific CCD Detector. Optik 2020, 223, 165593. [Google Scholar] [CrossRef]
- Liu, Y.; Liu, G.; Sun, H.; An, L.; Zhao, R.; Liu, M.; Tang, W.; Li, M.; Yan, X.; Ma, Y.; et al. Exploring Multi-Features in UAV Based Optical and Thermal Infrared Images to Estimate Disease Severity of Wheat Powdery Mildew. Comput. Electron. Agric. 2024, 225, 109285. [Google Scholar] [CrossRef]


Disclaimer/Publisher’s Note: The statements, opinions and data contained in all publications are solely those of the individual author(s) and contributor(s) and not of MDPI and/or the editor(s). MDPI and/or the editor(s) disclaim responsibility for any injury to people or property resulting from any ideas, methods, instructions or products referred to in the content. |
© 2025 by the authors. Licensee MDPI, Basel, Switzerland. This article is an open access article distributed under the terms and conditions of the Creative Commons Attribution (CC BY) license (https://creativecommons.org/licenses/by/4.0/).