Abstract
Fruit quality attributes interrelate with their dielectric properties, but such interrelationships in Ruaner pear during the post-ripening variable temperature frozen storage period remain uninvestigated. Five quality attributes and eight dielectric parameters were measured under two production modes. The results showed that fruit quality improved markedly, the TSS of farmer pears from 11.2% to 17.9%, while cooperative pears increased from 11.47% to 17.5%. The SSC of farmer pears increased from 8.55% to 32.51%, while cooperatives went from 14.61% to 30.14%, The WC of the farmer pears increased from 84.01% to 85.76%, while cooperative pears increased from 84.76% to 86.58%, an increase of 2.1% compared with the pears at 0 d, and farmer-stored pears exhibited better overall quality. Dielectric parameters (B and G) increased with time and showed strong correlations with quality attributes. Prediction models based on principal component analysis achieved high accuracy (R2 = 0.833). These results highlight the practical potential of using dielectric properties as a rapid, non-destructive method to evaluate fruit quality during post-ripening variable temperature frozen storage.
1. Introduction
Ruaner pear, is a cultivar belonging to the Pyrus ussuriensis Maxim system. During the post-ripening and frozen storage of Ruaner pears, fruit quality often varies considerably due to differences in production conditions, storage environments, and ripening behaviors. Conventional evaluation methods, such as sensory inspection or chemical analysis, are destructive, time-consuming, and unable to provide continuous monitoring. This variability highlights the urgent need for an objective, rapid, and non-destructive method to assess fruit quality [1]. Dielectric property analysis offers a promising solution, as it reflects internal structural and compositional changes associated with moisture, soluble solids, and other quality attributes. By establishing a correlation between dielectric parameters and physicochemical properties, this approach enables accurate and real-time prediction of quality variations during post-ripening and frozen storage, providing a scientific basis for quality control and optimization. The resulting flavor is a pleasant balance of sweetness and acidity, with a mellow aroma, and the fruit is widely appreciated for both its taste and its traditional medicinal benefits. As a processing-oriented fruit [2]. During the post-ripening variable temperature frozen storage period, has long been assessed empirically, leading to inconsistent product quality and low stability in commercial fruit [3]. Therefore, developing objective methods to determine the optimal timing of post-ripening and freezing processes is essential for improving production efficiency and reducing losses. Zhang Zhong et al. [4] demonstrated that post-harvest treatment with ethephon significantly increased ethylene emissions in Ruaner pear, advancing the respiration peak and accelerating ripening. During ripening, pears treated with ethephon exhibited less mass loss and superior color development compared to untreated pears. Li et al.’s [5] treatment with 1-MCP effectively prolonged the storage time and delayed the fruit firmness loss in pear fruit. The lower content of total volatiles and esters may be ascribed to the suppression of PuLOX s and PuAAT genes. In addition, numerous studies in food chemistry have revealed that ripening and freezing induce changes in enzymatic activity, membrane permeability, and cellular integrity, which in turn affect sugar–acid balance, pigment composition, and volatile compound formation [6,7]. For example, alterations in cell wall polysaccharides and membrane lipids contribute to softening and browning during storage, while oxidative and enzymatic reactions play key roles in determining flavor and texture stability [8,9].
Dielectric detection technology, renowned for its expeditious and non-destructive approach, is extensively utilized in the quality assessment of agricultural products [10]. Previous studies have demonstrated the potential of dielectric properties for assessing fruit quality. For instance, Bian et al. [11] developed physicochemical quality prediction models for bruised apples based on the principal components of dielectric parameters, while similar approaches have been applied to kiwifruit and sea buckthorn berries to explore correlations between dielectric behavior and key quality attributes [12,13]. However, despite these advances, the application of dielectric analysis to Ruaner pear has not yet been reported. The Ruaner pear exhibits unique post-ripening and variable temperature frozen storage characteristics that can significantly influence its internal structure and composition. Therefore, this study focuses specifically on Ruaner pear to investigate the relationship between its dielectric properties and quality attributes, aiming to establish a non-destructive, data-driven method for objective quality evaluation during post-ripening and frozen storage. Although the biological activity of internal tissues during post-ripening and variable temperature frozen storage generates bioelectric signals reflected in the fruit’s dielectric properties, the relationship between these dielectric signals and the quality attributes of Ruaner pear remains uninvestigated. This study addresses this gap by examining how dielectric properties can be used to predict fruit quality during storage [14,15]. Although previous studies have reported the changes and interrelationships between dielectric properties and quality indicators in fruits and vegetables during freezing, the specific dynamics and correlations during the post-ripening and variable temperature freezing period of Ruaner pear remain unexamined. The objective of this study was to establish predictive models of Ruaner pear quality attributes based on dielectric properties and to evaluate the feasibility of using dielectric analysis as a non-destructive method for monitoring fruit quality during post-ripening variable temperature frozen storage [16,17], in order to provide a theoretical basis and technical reference for quality control in the post-harvest processing of Ruaner pear.
2. Materials and Methods
2.1. Materials
The Ruaner pears used in this study were harvested on 4 October 2023, from a pear orchard in Shichuan Town, Gaolan County, Lanzhou City (36°9′39.0″ N, 104°0′34.5″ E). The selected fruits were uniform in size, color, maturity, and were free from mechanical damage and pest infestation (average weight 220 ± 5 g, diameter 50 ± 5 cm, maturity dark green). According to the experimental design, two groups of pears were collected from distinct sources: farmer-stored pears, which were processed and post-ripened using traditional household methods in Shichuan Town, and cooperative-stored pears, which were processed using a controlled post-ripening and variable temperature freezing technology in the agricultural cooperative’s workshop. Three hundred pears were sampled for farmer and cooperative baskets placed in the town of Shichuan processing Ruaner pears in the farmer’s home and agricultural cooperative, according to the experimental design of the sampling.
2.2. Ruaner Pear Processing
Ruaner pears were stored under two production modes: farmer storage and cooperative storage. Farmer storage: Pears were placed in the shaded area along the south wall under ambient conditions. During the post-ripening phase (0–42 d), the fruits underwent natural ripening with daily temperature fluctuations ranging from 2 °C to 15 °C. During the subsequent variable temperature frozen storage (43–77 d), the ambient temperature decreased below 0 °C at night and rose above 0 °C during the day, inducing daily freeze–thaw cycles. The total number of freezing–thaw cycles over the storage period was approximately 30. Once the flesh reached edible maturity, the pears were transferred to a freezer set at −18 °C for storage. Cooperative storage: Pears were ripened in a controlled ambient-temperature chamber at 20 ± 1 °C and 65 ± 5% relative humidity for 35 d. For variable temperature frozen storage, fruits were transferred to a programmable freezing chamber with the following conditions: initial temperature –5 °C, decreasing by 5 °C every 15 d until −15 °C, while relative humidity was maintained at 65 ± 5%. The refrigeration system was periodically shut down for 24–48 h every 3 d to simulate freeze–thaw cycles, producing approximately 15 cycles over the storage period [18]. For each storage mode, samples were collected every 7 d starting from day 0. Each sampling consisted of 20 fruits per group (5–6 fruits per replicate, 3 replicates). Samples were transported to the laboratory on the same day in insulated boxes with ice packs to maintain storage temperature during transfer. Various quality and dielectric attributes were measured immediately upon arrival.
2.3. Chemicals
All chemicals used were of analytical grade. Phenolphthalein, anthrone, concentrated sulfuric acid, and sodium hydroxide were purchased from Sinopharm Chemical Reagent Co., Ltd. (Shanghai, China). The quality attributes were measured repeatedly three times.
2.4. Determination of Quality Attribute for Ruaner Pear
2.4.1. Determination of Peel and Flesh Color
Referring to the method of Zhang Xianchuan et al. [19]. Take three evenly spaced spots from the peel along the equator of the fruit and measure them with an SP60 colorimeter (SP60, X-Rite, Grand Rapids, MI, USA). Subsequently, the peel at these three positions was carefully removed, and the exposed flesh was trimmed to a slightly larger area than the colorimeter’s measuring aperture to ensure accurate measurement of flesh color. The L* value represented the brightness of the peel, the a* value represented the red-greenness of the fruit, the b* value represented the blueness–yellowness of the fruit, with negative values indicating blue tones and positive values indicating yellow tones, and the ΔE represented the chromaticity angle.
where ΔL, Δa, and Δb denote the respective differences between the peel and flesh color parameters.
2.4.2. Determination of Total Soluble Solids, Soluble Sugar, Titratable Acids
The contents of total soluble solids (TSS), soluble sugar (SSC) and titratable acids (TA) were determined by the procedure of Cao et al. [20].
The content of total soluble solids (TSS) was determined by handheld refractometer (PALBXIACID2, ATAGO Co., Ltd., Tokyo, Japan) and expressed as (%). The content of soluble sugar (SSC) was determined spectrophotometrically (UV-1780, Shimadzu Instruments (Suzhou) Ltd., Suzhou, China) using the anthrone-sulfate method, with sucrose as standard. The absorbance of the mixture was measured at 625 nm and expressed as (%). The content of titratable acids (TA) was determined by the sodium hydroxide solution titration method titrating with 0.1 mol/L NaOH to pH 8.1 and expressed as (%).
2.4.3. Determination of Water Content
The water content (WC) on wet bases of Ruaner pear was determined using a rapid moisture meter (QL-100A, Xiamen Qunlong Instrument Co., Ltd., Xiamen, China, accuracy ± 0.1%), according to the method of Huang et al. [21], and expressed as (%).
2.4.4. Determination of Stone Cell Content
Referring to the method of Nie Jiyun et al. [22] with slight modifications. The fruit was peeled, quartered longitudinally, and the core and surrounding dense stone-cell regions were removed. The pulp was mixed, divided into three 100 g portions, frozen at –20 °C for 24 h, thawed, and crushed. The crushed pulp was suspended in 800 mL of water, stirred for 1 min, allowed to settle for 3 min, and the supernatant discarded. This rinsing was repeated 3–4 times. Stone cells were collected, filtered through coarse paper, and dried in an oven at 60–65 °C for 4 h. After cooling in a desiccator, stone cells were weighed to 1 mg accuracy, and the average weight was calculated.
2.5. Dielectric Properties of Ruaner Pear During Post-Ripening Variable Temperature Frozen Storage
As shown in Figure 1, dielectric properties of Ruaner pear were measured using a precision LCR meter [23] (HIOKI, IM3536, Shanghai, China). The instrument was connected to a custom-built parallel-plate electrode system consisting of two circular copper plates (3 mm thickness × 35 mm diameter). The electrode spacing was adjusted to fit the fruit size [10]. Prior to measurement, the LCR meter was preheated for 1 h to ensure operational stability. Calibration was conducted following the manufacturer’s protocol, including open-circuit and short-circuit compensation of the electrode plates, followed by dielectric measurements of air to verify calibration accuracy. If deviations exceeded ±0.5%, recalibration was performed. Measurements were conducted over a frequency range of 4 Hz to 1 MHz, covering 626 discrete frequency points. During testing, each pear was placed centrally between the electrodes, and readings were taken from two symmetrical positions along the equatorial plane. The upper spiral knob was adjusted to maintain consistent electrode–surface contact pressure. The LCR meter was interfaced with a laptop via USB for real-time acquisition and recording of dielectric parameters. A total of eight dielectric parameters were obtained: parallel equivalent capacitance (Cp), parallel equivalent resistance (Rp), impedance (Z), susceptance (B), conductance (G), quality factor (Q), reactance (X), and dielectric loss factor (D). For each sample, measurements were performed in duplicate. Three pears were tested per batch, resulting in six replicate measurements. Data were averaged across replicates, and variability was expressed as the mean ± standard deviation (SD). Ambient temperature (20 ± 1 °C) and relative humidity (60 ± 5%) were controlled throughout to ensure consistency.
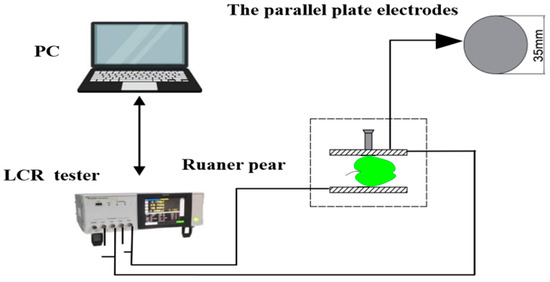
Figure 1.
Test device for dielectric parameter determination of the Ruaner pear.
2.6. Principal Component Analysis (PCA)
Principal component analysis (PCA) was conducted on the eight dielectric parameters of Ruaner pear measured at 626 frequencies to reduce dimensionality and extract dominant dielectric features. Prior to PCA, all data were standardized by Z-score normalization to eliminate the effects of differing units. The suitability of the dataset for PCA was verified using the Kaiser–Meyer–Olkin (KMO) test and Bartlett’s test of sphericity (p < 0.001). Principal components with eigenvalues greater than 1 and a cumulative variance contribution exceeding 80% were retained as dominant components [24].
2.7. Gray Relational Analysis
The comparative sequence (sub-sequence) consisted of comprehensive parameters that represented the dielectric properties derived from PCA. The reference sequence (mother sequence) consisted of five quality attributes of Ruaner pear. Using gray relational analysis, the correlation between the quality attributes of Ruaner pear during post-ripening variable temperature frozen storage and the principal components was evaluated at each detection frequency. The frequency with the highest correlation was selected as the characteristic frequency for evaluating the quality attributes [25].
2.8. Data Statistics and Analysis
All statistical analyses were performed using IBM SPSS Statistics 27.0 (Version 27.0, SPSS Inc., Chicago, IL, USA). The PCA was conducted using the “Dimension Reduction → Factor Analysis” module. Pearson’s correlation analysis (two-tailed) was used to determine relationships between characteristic dielectric frequencies and quality attributes, with statistical significance set at p < 0.05. GRA was carried out in MATLAB R2018b (The MathWorks Inc., Natick, MA, USA) using a custom script based on the “grayrel” function. Graphical visualization and predictive modeling of quality attributes were performed in Origin 2021b (Origin Lab Co., Northampton, MA, USA) using the “Linear Fit” and “Multiple Regression” functions. All results are expressed as mean ± standard deviation (SD).
3. Results and Discussion
3.1. Changes in TSS, SSC, WC, TA, SCC, and TT During the Post-Ripening Variable-Temperature Frozen Period
The main quality attributes and temperatures of Ruaner pear are shown in Figure 2 and Figure 3. Overall, both farmer- and cooperative-stored pears exhibited comparable quality evolution patterns, with differences primarily attributable to distinct storage temperature environments. TSS is a crucial attribute of fruit quality and storage performance [26]. The total soluble solids (TSS) of both groups increased progressively throughout the post-ripening and variable temperature stages (p < 0.05), reflecting the continuous conversion of polysaccharides into soluble sugars [27]. The sharp rise in TSS after 63 d coincided with the transition to variable temperature freezing storage, where reduced enzymatic activity and limited moisture diffusion slowed solute degradation, thereby increasing TSS accumulation. Despite this, the TSS difference between the two sources remained statistically insignificant (p > 0.05), suggesting a similar metabolic trend.
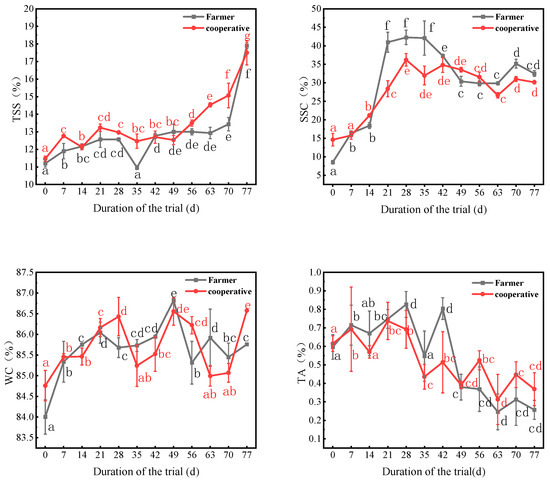
Figure 2.
Changes in TSS, SSC, MC and TA of Ruaner pear. Different letters (a–g) indicate significant differences (p < 0.05); letters farther from “a” represent greater differences.
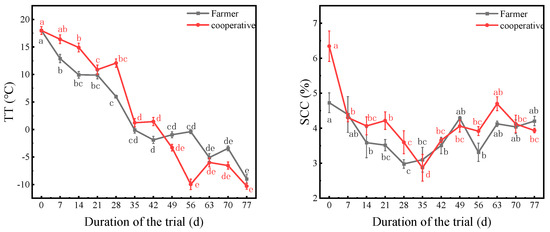
Figure 3.
Changes in TT and SCC of the Ruaner pear. Different letters (a–e) indicate significant differences (p < 0.05); letters farther from “a” represent greater differences.
Soluble sugars are key contributors to fruit flavor and serve as important physiological and quality attributes in fruit research. Soluble sugar content (SSC) also showed an initial rise followed by a slight decline, consistent with starch hydrolysis during ripening and subsequent sugar consumption through respiration [28]. Although both groups demonstrated significant increases compared with 0 d (p < 0.05), their differences were not statistically significant at later stages, indicating that temperature regime differences had limited impact on sugar metabolism during prolonged storage.
WC is a significant attribute of the texture of Ruaner pear [29]. Water content (WC) exhibited fluctuations but generally increased across storage, peaking at 49 d for both groups. The changes were not statistically significant (p > 0.05), suggesting that tissue hydration and cellular permeability were largely maintained despite temperature variations.
Acidity is an important flavor substance of fruits, and the TA is mainly malic acid in Ruaner pears. Titratable acidity (TA), dominated by malic acid, declined steadily over time (p < 0.05), which reflects the consumption of organic acids as respiratory substrates during ripening [30]. Cooperative-stored pears maintained slightly higher acidity than farmer-stored ones in the mid-storage stage, likely due to their lower respiration rate under more controlled temperature conditions.
Overall, the differences between farmer- and cooperative-stored pears were primarily driven by storage temperature profiles. Higher temperatures in the cooperative facility during post-ripening accelerated sugar accumulation and acid degradation, whereas the lower and fluctuating temperatures during variable temperature freezing slowed these processes. These findings indicate that temperature regulation plays a crucial role in balancing the metabolic activities that determine the flavor and texture quality of Ruaner pear during storage.
Temperature is a critical environmental factor regulating the postharvest physiology of Ruaner pear, as it directly affects enzymatic activity, respiration rate, and cellular membrane integrity. During the post-ripening period, cooperatively stored pears were maintained in a controlled chamber at relatively higher temperatures, which accelerated metabolic reactions such as starch hydrolysis and organic acid degradation, thereby promoting faster softening and soluble solid accumulation. In contrast, farmer-stored pears, exposed to naturally fluctuating ambient temperatures, underwent slower biochemical transformations and a delayed ripening process. During the subsequent variable temperature freezing storage, the cooperative pears experienced lower and more stable sub-zero temperatures compared with the farmer-stored pears, leading to reduced enzymatic activity and respiration intensity. Such low-temperature conditions effectively slowed down quality deterioration by maintaining cell membrane stability and minimizing moisture loss—a phenomenon consistent with reports on other pear cultivars and cold-stored fruits such as apples and kiwifruit.
SCC is a key determinant of the texture and mouthfeel of Ruaner pear [31]. Overall, both farmer- and cooperative-stored pears exhibited a decreasing trend in SCC during the post-ripening and variable temperature freezing periods, though minor fluctuations occurred at intermediate stages. This decline in SCC reflects structural and biochemical changes in the cell wall matrix associated with ripening and freeze–thaw cycling. During repeated freezing and thawing, intracellular water forms ice crystals that disrupt cell membranes and weaken the middle lamella, leading to partial disintegration of parenchyma tissue and reduced mechanical resistance. These physical changes promote the redistribution and loosening of stone cell clusters, contributing to a softer texture perceived by consumers [4]. Moreover, low-temperature stress alters lignin metabolism by suppressing phenylalanine ammonia-lyase (PAL) activity and downstream monolignol biosynthesis, thereby reducing lignin deposition within sclerenchyma cells. Similar reductions in lignin content and cell wall rigidity have been reported in other pear cultivars and freeze-stored fruits such as kiwifruit and loquat, where freeze–thaw cycles accelerate cell wall degradation and enhance juiciness. In the present study, cooperative-stored pears, subjected to controlled freeze–thaw conditions, showed a more pronounced reduction in SCC than farmer-stored pears, suggesting that regulated thermal cycling more effectively disrupts lignified tissues and improves palatability. These findings demonstrate that temperature-induced microstructural modification, rather than mere chemical composition, plays a crucial role in defining the textural attributes of Ruaner pear during storage.
3.2. Changes in Peel Color of Ruaner Pear During Post-Ripening Variable Temperature Frozen Storage
As shown in Figure 4, the peel color of Ruaner pear underwent a distinct transition from green to yellow and finally to brown during the post-ripening and variable temperature freezing periods. The overall decrease in L* values reflected the progressive loss of surface brightness, with both farmer- and cooperatively stored pears exhibiting a similar trend. However, cooperative-stored pears showed an earlier and more rapid decline after 42 d, coinciding with the onset of variable temperature freezing. This accelerated darkening can be attributed to enhanced enzymatic browning triggered by freeze–thaw stress, which disrupts cell membranes, allowing polyphenol oxidase (PPO) and phenolic substrates such as chlorogenic acid to interact more readily [32]. Upon thawing, oxidation reactions intensify, leading to pigment polymerization and the formation of brown melanin-like compounds on the peel surface.
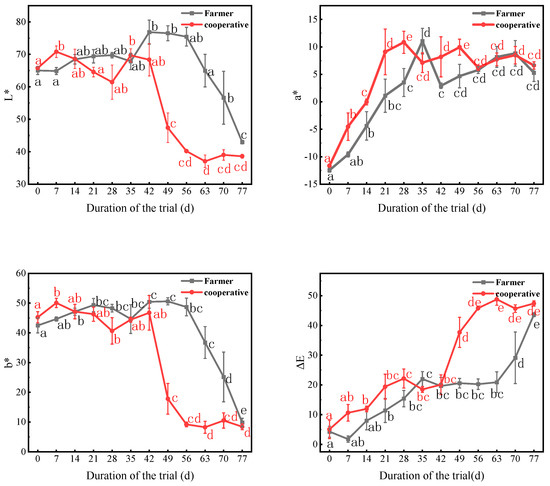
Figure 4.
Changes in L, a, b and ΔE values of the peel of the Ruaner pear. Different letters (a–e) indicate significant differences (p < 0.05); letters farther from “a” represent greater differences.
The a* and b* values further supported this progression. The increase in a* values from negative toward positive indicated chlorophyll degradation and accumulation of carotenoids and oxidized phenolics, while the transient rise and subsequent decline in b* values reflected the initial synthesis of yellow pigments followed by browning-induced color loss. Cooperatively stored pears consistently exhibited higher a* and lower b* values than farmer-stored pears after 49 d, confirming faster chlorophyll breakdown and pigment oxidation under controlled post-ripening and freezing conditions.
The ΔE value increased throughout storage, showing a steeper rise in cooperative-stored pears between 56 d and 63 d, suggesting that regulated thermal cycling intensified enzymatic and non-enzymatic browning. Similar patterns have been reported in other pear cultivars and fruits such as loquat and apple, where repeated freeze–thaw cycles promote phenolic oxidation and color darkening. These results indicate that differences in temperature management between traditional and controlled storage environments significantly influence the rate and extent of peel discoloration by modulating enzymatic activity and pigment stability.
3.3. Changes in Flesh Color of Ruaner Pear During Post-Ripening Variable Temperature Frozen Storage
The color variation in the pulp of the pear is shown in Figure 5. The pulp of the Ruaner pear changed from light yellow to white during post-ripening and variable temperature frozen storage. The increase in L* value during mid-storage reflected carotenoid degradation and tissue dehydration, while the later decline indicated browning caused by enzymatic oxidation. The a* and b* values increased in the late stage, corresponding to the formation of brown pigments and Maillard-type reactions under repeated freeze–thaw cycles. The ΔE value remained stable initially but rose sharply after 49 d (cooperative) and 63 d (farmer), suggesting accelerated pigment oxidation and cell wall damage. These results demonstrate that freeze–thaw stress altered pigment composition and tissue integrity, leading to distinct color evolution between the two storage modes.
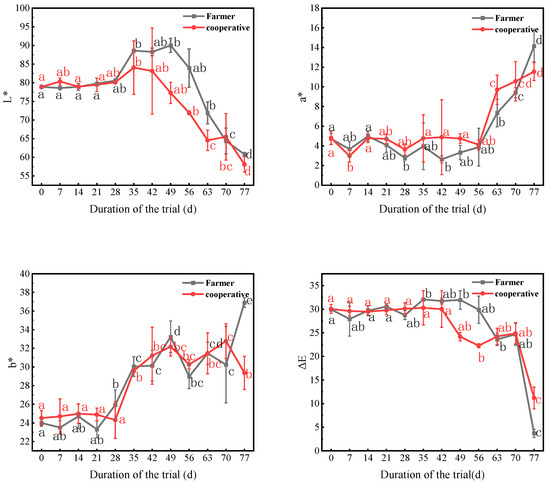
Figure 5.
Changes in L, a, b and ΔE values of the Ruaner pear pulp. Different letters (a–e) indicate significant differences (p < 0.05); letters farther from “a” represent greater differences.
3.4. Changes in Cp, Rp, and Z Values of Ruaner Pear During Post-Ripening Variable-Temperature Frozen Storage
During post-ripening variable temperature frozen storage, the Cp, Rp, and Z values of farmers’ Ruaner pears decreased gradually with increasing detection frequency, as shown in Figure 6A. A similar trend was observed in cooperative-stored pears, as shown in Figure 6B, a trend consistent with previous dielectric studies on apples, kiwifruits, and pears. The parallel equivalent capacitance (Cp) reflects the macroscopic polarization capacity of tissues; its higher values at low frequencies are attributed to interfacial polarization at the cell membrane and the reorientation of polar molecules [33]. As frequency increases, dipole polarization lags behind the alternating field, leading to reduced energy storage and decreased Cp, consistent with findings in banana and citrus tissues under similar conditions [34].
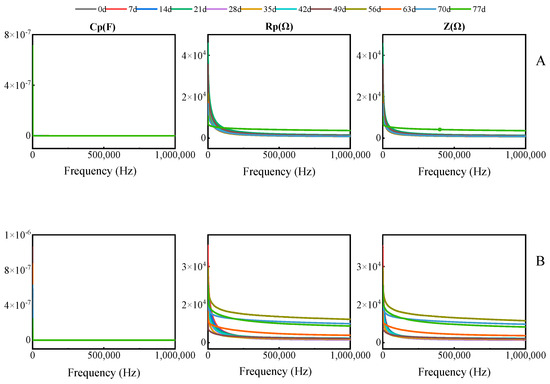
Figure 6.
Changes in Cp, Rp, and Z values of the Ruaner pear (A) farmer; (B) cooperative.
The decline of Rp and Z with frequency indicates reduced resistance and impedance to charge flow, driven by membrane breakdown and electrolyte leakage during freeze–thaw cycles [2]. Similar frequency-dependent impedance reductions were reported in mango and pear tissues subjected to cold storage [35]. As the detection frequency increased, the Z value gradually decreased, which was consistent with the research conclusion of Li et al. [13]. Taking the cooperative pears as an example, at 4 Hz, Cp increased up to 11-fold at 49 d and 2.5-fold at 77 d relative to 0 d, whereas Rp and Z declined by 3.9- and 1.5-fold, respectively. This nonlinear behavior aligns with the dielectric relaxation patterns observed in ripening fruits, where microstructural damage and increased ion mobility alter the polarization process. These results confirm that dielectric parameters sensitively capture tissue structural changes and ion migration during ripening and freeze–thaw transitions, supporting the potential of dielectric spectroscopy as a non-destructive tool for assessing pear quality evolution.
3.5. Changes in B, G, and Q Values of the Ruaner Pear During Post-Ripening Variable Temperature Frozen Storage
During post-ripening variable temperature frozen storage, B and G values of farmer Ruaner pears increased with increasing detection frequency, while the Q value exhibited a trend of initial increase followed by a decrease, as shown in Figure 7A. A similar pattern was observed in cooperative Ruaner, where both B and G values increased with frequency, and Q values first increased and then decreased with further increases in frequency, as shown in Figure 7B. These frequency-dependent patterns are consistent with observations in other fruits such as apples, mangoes, and kiwifruits [35]. The susceptance (B) reflects the dielectric material’s ability to undergo polarization when exposed to an alternating electric field, which in biological tissues is primarily governed by the integrity of cell membranes and the mobility of bound water molecules. The conductance (G), representing the ease of current flow through the tissue, is closely related to ion concentration and membrane permeability; higher G values generally indicate enhanced ionic conductivity due to cell wall degradation or membrane rupture. The quality factor (Q), defined as the ratio of stored to dissipated energy, characterizes the efficiency of the tissue’s dielectric response—higher Q values indicate greater energy storage efficiency and lower dielectric losses, which correspond to more intact cellular structures.
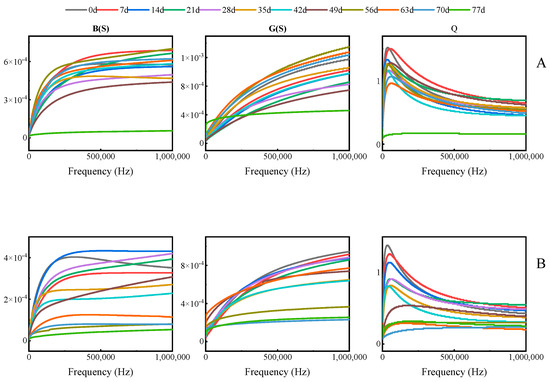
Figure 7.
Changes in B, G, and Q values of the Ruaner pear (A) farmer; (B) cooperative.
As ripening and freeze–thaw processes progressed, cooperatively stored pears exhibited pronounced declines in B, G, and Q values, suggesting increased electrolyte leakage, loss of membrane integrity, and higher energy dissipation due to microstructural damage. For instance, at 283,260 Hz, the B, G, and Q values decreased by 11.7-, 2.8-, and 2.4-fold at 77 d compared to 0 d, respectively. These findings align with those reported in frozen apples and citrus fruits, where repeated freeze–thaw cycles disrupted cell membranes and reduced dielectric polarization capacity. Overall, the dynamic changes in B, G, and Q values effectively reflect the progressive loss of cellular integrity and the accompanying physicochemical alterations in pear tissues during post-ripening and variable temperature frozen storage.
3.6. Changes in X and D Values of Ruaner Pear During Post-Ripening Variable Temperature Frozen Storage
During the post-ripening variable temperature frozen period, the X and D values of farmer Ruaner pears exhibited a tendency to decrease and subsequently increase with increasing detection frequency, as shown in Figure 8A. The X and D values of cooperative Ruaner pears displayed a pattern of decreasing and subsequently increasing with the increase in detection frequency, as shown in Figure 8B. The impedance (X) serves as a significant attribute reflecting the conductivity of the dielectric itself. The dielectric loss coefficient (D) refers to the energy loss coefficient caused by the hysteresis effect of the dielectric conductivity and dielectric polarization under the action of the electric field.
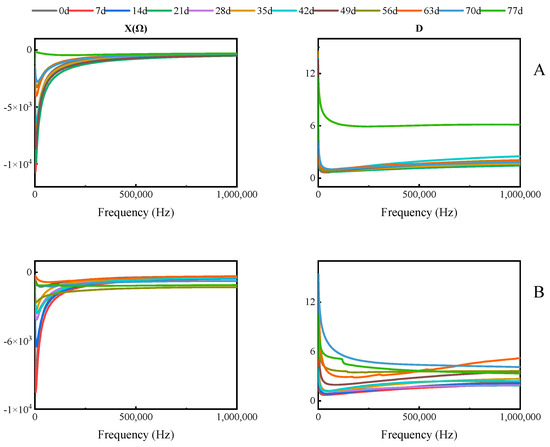
Figure 8.
Changes in X and D values of the Ruaner pear (A) farmer; (B) cooperative.
At specific detection frequencies, the X value of Ruaner pears exhibited a decrease followed by an increase with a prolonged post-ripening variable temperature frozen period, while the D value continuously increased over time. At 16,007 Hz, the X value of cooperative Ruaner pears at 7 d, 49 d, and 77 d was 16% lower, 10 times higher, and 5.7 times higher than those at 0 d, respectively; the D value of cooperative Ruaner pears at 70 d and 77 d was 11.7 times and 7.8 times higher than those at 0 d. At 150,430 Hz, the X value of the cooperative Ruaner pears at 7 d, 49 d, and 77 d was 26% lower, 1.8 times higher, and 13% higher than those at 7 d, 49 d, and 77 d, respectively; and the D value of the cooperative Ruaner pears at 70 d and 77 d was 5.2 and 4.4 times higher than those at 0 d.
3.7. Selection of Principal Components for Dielectric Parameters
Through principal component analysis of eight dielectric parameters from farmer-stored Ruaner pears during the post-ripening variable temperature frozen storage period, two principal components were identified based on eigenvalues greater than 1: the first principal component (PCA1) and the second principal component (PCA2), as shown in Figure 9. The variance contribution rate of PCA1 ranged from 60.17% to 83.99%, while that of PCA2 ranged from 13.33% to 31.30%. The cumulative variance contribution rates for PCA1 and PCA2 ranged from 90.79% to 97.32%, indicating that these components effectively represent the dielectric characteristics of Ruaner pears during the post-ripening variable temperature frozen storage period.
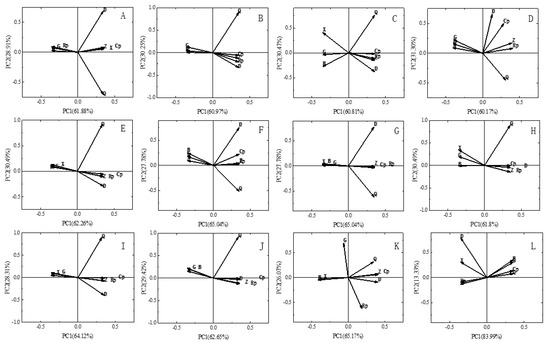
Figure 9.
Principal component diagram of farmer Ruaner pear, (A) 0 d; (B) 7 d; (C) 14 d; (D) 21 d; (E) 28 d; (F) 35 d; (G) 42 d; (H) 49 d; (I) 56 d; (J) 63 d; (K) 70 d; (L) 77 d.
Principal component analysis of eight dielectric parameters from cooperatively stored Ruaner pears during post-ripening variable temperature frozen storage identified two principal components with eigenvalues greater than 1, as shown in Figure 10: PCA1, the variance contribution of PCA1, ranged from 61.03% to 85.29%, while that of PCA2 ranged from 12.70% to 29.29%; the cumulative variance contribution of PCA1 and PCA2 ranged from 86.19% to 97.99%, indicating that these components effectively represent the dielectric properties of Ruaner pears throughout the storage period.

Figure 10.
Principal component diagram of the Ruaner pear in cooperative, (A) 0 d; (B) 7 d; (C) 14 d; (D) 21 d; (E) 28 d; (F) 35 d; (G) 42 d; (H) 49 d; (I) 56 d; (J) 63 d; (K) 70 d; (L) 77 d.
3.8. Selection of Characteristic Frequency Points for Dielectric Parameter Principal Components
The dielectric properties of Ruaner pear during post-ripening variable temperature frozen storage were not only closely related to its quality attributes, but also related to the detection frequency. Therefore, in order to use dielectric characteristics to evaluate its quality attribute, it is necessary to select the detection frequency that is sensitive to the quality attribute and determine the optimal dielectric parameters that match the quality attribute. By calculating and comparing the correlations between quality attributes and dielectric parameters at each frequency, the most significant detection frequency was chosen as the characteristic frequency for predicting Ruaner pear quality [36].
As shown in Table 1, the results of correlation analysis between the quality attributes and the principal components of dielectric parameters of farmer Ruaner pears are presented. The results of the correlation analysis between the quality attributes and the principal components of dielectric parameters of cooperative Ruaner pears are presented in Table 2. The findings indicated that different quality attributes correspond to distinct eigenfrequencies, and these eigenfrequencies were consistently in the low-frequency range. This observation aligns with the theoretical principle that low-frequency currents primarily traverse the extracellular fluid.

Table 1.
Correlation between quality attribute and dielectric parameters of the Ruaner pear in farmer.
Table 2.
Correlation between quality attribute and dielectric parameters of the Ruaner pears in cooperative.
3.9. Quality Attribute Prediction Models of Ruaner Pear
Different quality attributes correspond to different characteristic frequencies; the principal components PCA1 and PCA2 of dielectric properties can be used to evaluate the content of quality attributes in Ruaner pears. Table 1 and Table 2 present the evaluation models for quality attributes and their coefficients of determination (R2) for Ruaner pears from farmers and cooperatives, respectively.
As shown in Table 3, the evaluation model for SSC has an R2 greater than 0.8. The models for WC, TSS, and TA in farmer Ruaner pears have R2 values above 0.6, while the model for SCC had an R2 greater than 0.5. This demonstrated that the principal components of dielectric properties can effectively evaluate these five quality attributes in farmer Ruaner pears.
Table 3.
Evaluation model and determination coefficient of quality attribute of the Ruaner pear in farmer.
As shown in Table 4, the evaluation models for WC and SCC in cooperative Ruaner pears have R2 values greater than 0.7. The models for TA and SSC have R2 values above 0.6, and the model for SSC has an R2 greater than 0.5. This indicated that the principal components of dielectric properties can also effectively evaluate these five quality attributes in cooperative Ruaner pears.
Table 4.
Evaluation model and determination coefficient of quality attribute of the Ruaner pear in cooperative.
3.10. Validation of Quality Attribute Evaluation Models
To validate the effectiveness of dielectric properties in evaluating quality attributes, Ruaner pears from a farmer and cooperative at 77 d were used as the validation group, comparing the measured values with the predicted values of the quality attributes.
As shown in Table 5, the measured and predicted values of five quality attributes for Ruaner pears from the farmer and cooperative at 77 d are present. For farmer Ruaner pears, the average relative errors between the measured and predicted values for WC, TSS, TA, SSC, and SCC were 0.82%, 1.51%, 36.58%, 4.30%, and 24.61%, respectively. Notably, the average relative errors for TA and SCC exceeded 10%, indicating lower predictive accuracy. In contrast, the average relative errors for WC, TSS, and SSC were below 5%, indicating good predictive performance.
Table 5.
Measured and predicted values of quality attributes of the Ruaner pear in 77 d farmer and cooperative.
For cooperative Ruaner pears, the average relative errors between the measured and predicted values for WC, TSS, TA, SSC, and SCC were 0.11%, 7.70%, 8.77%, 35.30%, and 14.29%, respectively. The average relative errors for SSC and SCC exceeded 10%, indicating lower predictive accuracy. However, the errors for TSS and TA were below 10%, indicating better predictive performance, while the error for WC was less than 5%, indicating strong predictive capability.
4. Conclusions
This study demonstrates that post-ripening and variable temperature frozen storage significantly influenced the quality and dielectric behavior of Ruaner pears under different production modes. Cooperative-stored pears ripened approximately 7 days earlier than farmer-stored pears, exhibiting faster physicochemical and dielectric responses. These differences were closely associated with temperature-driven metabolic activity and tissue microstructural changes.
Principal component and gray relational analyses confirmed that dielectric parameters could effectively characterize variations in key quality attributes, including WC, TSS, SSC, and TA. The established predictive models achieved high accuracy, with average relative errors below 10%, demonstrating the reliability of dielectric measurements for non-destructive quality evaluation.
Overall, this work provides a novel framework for assessing pear quality during post-harvest storage through dielectric property analysis. The findings not only deepen the understanding of the electrical responses of fruits to ripening and freeze–thaw processes but also offer practical guidance for optimizing storage conditions and developing rapid, nondestructive quality monitoring systems for the pear industry.
Author Contributions
M.Y.: Conceptualization, methodology, data curation, supervision, writing—original draft, and writing—review and editing. H.Y.: Conceptualization, investigation, visualization, data curation, formal analysis, methodology, validation, and writing—original draft. W.Q.: Conceptualization, investigation, formal analysis, and methodology. J.H.: Conceptualization, methodology, data curation, supervision, writing—original draft, and writing—review and editing. Y.G.: Conceptualization, methodology, and data curation. F.Z.: Conceptualization and methodology. Z.Z.: Conceptualization and methodology. P.Z.: Conceptualization, visualization, and methodology. All authors have read and agreed to the published version of the manuscript.
Funding
This research was funded by the Natural Science Foundation of Gansu Province (23JRRA1419).
Institutional Review Board Statement
Not applicable.
Informed Consent Statement
Not applicable.
Data Availability Statement
The original contributions presented in this study are included in the article. Further inquiries can be directed to the corresponding author.
Conflicts of Interest
The authors declare no conflicts of interest.
References
- Shyamali, G.; Dhillon, W. Fruit development studies in Asian soft pear. Indian J. Hortic. 2009, 66, 43–47. [Google Scholar]
- Bauchot, A.D.; Harker, F.R.; Arnold, W.M. The use of electrical impedance spectroscopy to assess the physiological condition of kiwifruit. J. Postharvest Biol. Technol. 2000, 18, 9–18. [Google Scholar] [CrossRef]
- Liu, Y.; Wu, Y.; Che, F.; Zhang, Z.; Chen, B. Physical-Chemical Composition and Quality Related Changes in “Ruaner” Pear (Pyrus ussuriensis) During Freezing-Thawing Period. Molecules 2019, 24, 2611. [Google Scholar] [CrossRef] [PubMed]
- Zhong, Z.; Chaoling, M.; Ruojun, D.; Yang, B.; Yi, W.; Yongbo, W. Effect of Postharvest Ethephon Treatment on Physiological and Quality Attributes of Ripening Ruan’er Pear Fruits. Food Sci. 2017, 38, 252–258. [Google Scholar]
- Li, G.; Jia, H.; Li, J.; Li, H.; Teng, Y. Effects of 1-MCP on volatile production and transcription of ester biosynthesis related genes under cold storage in ‘Ruanerli’ pear fruit (Pyrus ussuriensis Maxim). Postharvest Biol. Technol. 2016, 111, 168–174. [Google Scholar] [CrossRef]
- Zhang, P.; Tian, R.; Hu, H.U.; Zhao, T.L.; Lei, J.; Wang, H.L. Effects of warming and precipitation changes on soil organic carbon and enzyme activities in semi-arid wheatland fields on the Loess Plateau of central Gansu Province, China. Ying Yong Sheng Tai Xue Bao = J. Appl. Ecol. 2024, 35, 3031–3042. [Google Scholar] [CrossRef]
- Liu, X.; Liu, X.; Qi, L.; Yang, F.; Han, M.; Yao, S. Subsurface irrigation with ceramic emitters: Optimal working water head improves yield, fruit quality and water productivity of greenhouse tomato. Sci. Hortic. 2023, 310, 111712. [Google Scholar] [CrossRef]
- Mitropoulos, D.; Lambrinos, G. “Delicious Pilafa” apple density changes as a quality index of mass loss degradation during storage. J. Food Qual. 2007, 30, 527–537. [Google Scholar] [CrossRef]
- Du, W.; Tian, S.; Zhao, J.; Deng, B. Drunken jujube: Ancient preservation unveils enhanced flavor and bioactives. LWT 2025, 233, 118507. [Google Scholar] [CrossRef]
- Bian, H.; Shi, P.; Tu, P. Determination of physicochemical quality of bruised apple using dielectric properties. J. Food Meas. Charact. 2020, 14, 2590–2599. [Google Scholar] [CrossRef]
- Bian, H.; Tu, P.; Li, X.; Shi, P. Quality predictions for bruised apples based on dielectric properties. J. Food Process. Preserv. 2019, 43, e14006. [Google Scholar] [CrossRef]
- Fazayeli, A.; Kamgar, S.; Nassiri, S.M.; Fazayeli, H.; de la Guardia, M. Dielectric spectroscopy as a potential technique for prediction of kiwifruit quality indices during storage. Inf. Process. Agric. 2019, 6, 479–486. [Google Scholar] [CrossRef]
- Li, M.; Hu, J.; Yang, M.; Yang, J.; Zhang, Q.; Zubarev, Y.A.; Zhao, W.; Bi, Y. Quality Attributes and Dielectric Properties of Sea Buckthorn Berries under Differing Freezing Regimes and Their Interrelationships. Foods 2022, 11, 3825. [Google Scholar] [CrossRef]
- Nelson, S.O.; Trabelsi, S. Use of material dielectric properties in agricultural applications. J. Microw. Power Electromagn. Energy 2016, 50, 237–268. [Google Scholar] [CrossRef]
- Cao, M.; Zeng, S.; Wang, J.; Guo, W. Dielectric properties of peaches with and without skin during storage and their relationship to internal quality. Postharvest Biol. Technol. 2023, 204, 112433. [Google Scholar] [CrossRef]
- Kaur, K.; Dhillon, W.S. Influence of maturity and storage period on physical and biochemical characteristics of pear during post cold storage at ambient conditions. J. Food Sci. Technol. Mysore 2015, 52, 5352–5356. [Google Scholar] [CrossRef]
- Tang, Y.; Zhang, H.; Liang, Q.; Xia, Y.; Che, J.; Liu, Y. Non-Destructive Testing of the Internal Quality of Korla Fragrant Pears Based on Dielectric Properties. Horticulturae 2024, 10, 572. [Google Scholar] [CrossRef]
- Zheng, J.; Kallio, H.; Linderborg, K.; Yang, B. Sugars, sugar alcohols, fruit acids, and ascorbic acid in wild Chinese sea buckthorn (Hippophaë rhamnoides ssp. sinensis) with special reference to influence of latitude and altitude. Food Res. Int. 2011, 44, 2018–2026. [Google Scholar]
- Zhang, X.; Gao, Z.; Shu, X. Theory of Fruit Chroma Research and the Application on Fuji Apple. Tianjin Agric. Sci. 2005, 22–24. [Google Scholar]
- Cao, J.K.; Zhao, Y.M.; Jiang, W.B. Postharvest Physiological and Biochemical Experiment Technology of Fruits and Vegetables. In Experimental Guidance of Postharvest Physiology and Biochemistry Experiment of Fruits and Vegetables; China Light Industry Press: Beijing, China, 2007; pp. 24–54. [Google Scholar]
- Huang, X.; Li, W.; Wang, Y.; Wan, F. Drying characteristics and quality of Stevia rebaudiana leaves by far-infrared radiation. J. LWT 2021, 140, 110638. [Google Scholar] [CrossRef]
- Nie, J.; Li, J.; Yang, Z.; Zhang, H.; Li, M. Study on the conditions for measur ing stone cell content in pear flesh by freezing method. J. Fruit. Sci. 2006, 39, 133–135. [Google Scholar]
- Serrano-Pallicer, E.; Muñoz-Albero, M.; Pérez-Fuster, C.; Masot Peris, R.; Laguarda-Miró, N. Early detection of freeze damage in navelate oranges with electrochemical impedance spectroscopy. J. Sens. 2018, 18, 4503. [Google Scholar] [CrossRef] [PubMed]
- Shah, A.; Ali, B.; Habib, M.; Frnda, J.; Ullah, I.; Anwar, M.S. An ensemble face recognition mechanism based on three-way decisions. J. King Saud. Univ. Comput. Inf. Sci. 2023, 35, 196–208. [Google Scholar] [CrossRef]
- Wen, J.; Mao, S.; Wu, C.; Xiao, X. The Grey Information Measurement in Grey Information Treated Space. J. Grey Syst. 2015, 27, 104–113. [Google Scholar]
- Fernandez-Novales, J.; Garde-Cerdan, T.; Tardaguila, J.; Gutierrez-Gamboa, G.; Pilar Perez-Alvarez, E.; Paz Diago, M. Assessment of amino acids and total soluble solids in intact grape berries using contactless Vis and NIR spectroscopy during ripening. Talanta 2019, 199, 244–253. [Google Scholar] [CrossRef]
- Jha, P.K.; Xanthakis, E.; Chevallier, S.; Jury, V.; Le-Bail, A. Assessment of freeze damage in fruits and vegetables. J. Food Res. Int. 2019, 121, 479–496. [Google Scholar] [CrossRef]
- Kami, D.; Muro, T.; Sugiyama, K. Changes in starch and soluble sugar concentrations in winter squash mesocarp during storage at different temperatures. Sci. Hortic. 2010, 127, 444–446. [Google Scholar] [CrossRef]
- Wang, K.; Xu, Z.; Liao, X. Bioactive compounds, health benefits and functional food products of sea buckthorn: A review. Crit. Rev. Food Sci. Nutr. 2022, 62, 6761–6782. [Google Scholar] [CrossRef]
- Dhillon, W.; Mahajan, B. Ethylene and ethephon induced fruit ripening in pear. J. Stored Prod. Postharvest Res. 2011, 2, 45–51. [Google Scholar]
- Jin, Q.; Yan, C.; Qiu, J.; Zhang, N.; Lin, Y.; Cai, Y. Structural characterization and deposition of stone cell lignin in Dangshan Su pear. Sci. Hortic. 2013, 155, 123–130. [Google Scholar] [CrossRef]
- Liang, Z. Review on Quality and Processing of Ruaner Pear Fruit. North. Hortic. 2018, 180–184. [Google Scholar]
- Guo, W.-C.; Nelson, S.O.; Trabelsi, S.; Kays, S.J. Dielectric properties of honeydew melons and correlation with quality. J. Microw. Power 2007, 41, 48–58. [Google Scholar] [CrossRef]
- Nelson, S.O.; Bartley, P. Measuring frequency-and temperature-dependent permittivities of food materials. IEEE Trans. Instrum. Meas. 2002, 51, 589–592. [Google Scholar] [CrossRef]
- Jha, S.N.; Narsaiah, K.; Basediya, A.L.; Sharma, R.; Jaiswal, P.; Kumar, R.; Bhardwaj, R. Measurement techniques and application of electrical properties for nondestructive quality evaluation of foods-a review. J. Food Sci. Technol. Mysore 2011, 48, 387–411. [Google Scholar] [CrossRef]
- Nelson, S.O.; Trabelsi, S. Factors Influencing the Dielectric Properties of Agricultural and Food Products. J. Microw. Power Electromagn. Energy 2012, 46, 93–107. [Google Scholar] [CrossRef] [PubMed]


Disclaimer/Publisher’s Note: The statements, opinions and data contained in all publications are solely those of the individual author(s) and contributor(s) and not of MDPI and/or the editor(s). MDPI and/or the editor(s) disclaim responsibility for any injury to people or property resulting from any ideas, methods, instructions or products referred to in the content. |
© 2025 by the authors. Licensee MDPI, Basel, Switzerland. This article is an open access article distributed under the terms and conditions of the Creative Commons Attribution (CC BY) license (https://creativecommons.org/licenses/by/4.0/).