Abstract
The low water and fertiliser utilisation efficiency and soil quality degradation caused by high water and fertiliser inputs are the primary challenges facing goji berry cultivation in arid regions. A two-year field experiment was conducted from 2021 to 2022. The experiment included three irrigation rates (I1, I2, I3) of 2160, 2565, and 2970 m3·hm−2 and three nitrogen application rates (N1, N2, N3) of 165, 225, and 285 kg·hm−2 to quantify their impacts on soil nutrients, enzyme activity, and goji berry yield in the root zone. Results indicate that the indicators of soil nutrients decrease with increasing soil depth, with depths of 0–20 cm accounting for 24.80–72.48% of total content. With fertility period progression, soil organic matter at depths of 0–80 cm exhibits a “folded-line” trend, while total nitrogen, nitrate nitrogen, and available phosphorus show an “M”-type trend. At depths of 0–40 cm, the proportions of urease, sucrase, and alkaline phosphatase activities all exceeded 70%. At I1 irrigation rate, enzyme activities gradually increased with rising nitrogen application rates. At I2 and I3 irrigation rates, enzyme activities first increased, then decreased with increasing nitrogen application. The highest yields of both fresh and dried fruits were achieved at I2N2 treatment, increasing by 14.17% and 14.78%, respectively, compared to conventional management (CK). Analysis of the random forest model indicates that the soil-driven factors influencing yield formation include SA, UA, APA, HPA, SOM, NH4+-N, and TP. Analysis of SQI and yield fitted data indicates that water–nitrogen coupling significantly influences wolfberry yield by regulating soil quality. Partial least squares (PLS-PM) showed that N application and irrigation of soil nutrients did not cause a significant indirect impact on goji berry yield, but a significant positive effect on goji berry yield occurred through enzyme activity.
1. Introduction
Goji berry fruit has high contents of polysaccharides, betaine, total sugars, and other nutrients and is used for medicinal purposes since it nourishes the kidneys and liver, clears heat, and moistens the lungs; other aspects of its efficacy are also extremely significant [1,2]. Goji berry is planted mainly in the northwestern arid and semiarid areas of China, and large day and night temperature differences and sufficient light conditions are important to ensure the growing and quality of goji berry fruit [3,4]. Moreover, goji berry crops have high demands for water and fertiliser [especially nitrogen (N) fertiliser]. For a long period, goji berry crops have been planted with high amounts of water and high fertiliser inputs to increase production and income [5,6]. In the long term, this inevitably leads to declining soil quality, posing serious challenges to the green, efficient, and sustainable development of the goji berry industry.
N and water represent the most vital aspects required for the growth and development of crops, and there is a significant interaction effect between them [7]. Appropriate moisture conditions increase plant root growth, thereby increasing the efficiency of N absorption and utilisation as well as the rate of morphological transformation in plants and the maintenance of soil quality at a relatively healthy level [8]. However, an insufficient supply of water can inhibit the effectiveness of N fertilisers and crop growth, whereas excessive water can decrease the efficiency of water and fertiliser utilisation, affect crop yield, and lead to the accumulation or leaching of substantial soil N into deeper soil layers, causing soil and groundwater pollution and degrading soil quality [9]. Therefore, understanding the mechanisms of irrigation, N application, and their interactions and achieving quantitative water and N application are highly important for the healthy cultivation of high water and N-demanding crops such as goji berry. While technology for coupling water and fertiliser is widely applied, it is concentrated on annual crops [10,11,12,13]. Very few studies on perennial crops such as goji berry have been conducted, and most related investigations have concentrated on the interaction impacts between irrigation and various fertilisers, such as N, phosphorus, and potassium, which makes it difficult to determine the interactive impacts of irrigation, the specific type of fertiliser, and its mechanism of action [14,15].
This study was run in a typical arid zone area in central Ningxia, China. Impacts of varying irrigation and degrees of application of N and their coupled effects on root zone soil nutrients, enzyme activities, and goji berry yields were investigated through a field experiment run over two years (2021–2022). The soil quality was comprehensively assessed through a minimum data set and structural equation modelling, the key soil driving factors affecting goji berry yield formation were identified, and the impacts of N and water coupling regulation on the soil quality of the root zone of goji berry and its yield increase mechanism were determined. The current study provided data and theoretical support for the wide application of water and N coupling technology in agriculture, synchronising increased quality of soil and yield of crop (goji berry), and promoting green, efficient, and sustainable agriculture.
2. Materials and Methods
2.1. Experimental Area
The experiments were run in Hexi Town, Tongxin County, a typical arid zone area in central Ningxia (105°42′23.05″ E, 37°10′36.98″ N, altitude 1328 m) (Figure 1). The region has a typical continental temperate arid and semiarid climate, with a multiyear mean precipitation of only 270 mm, which is scant and is mainly concentrated in the months of July–September (70%), and a multiyear mean evapotranspiration of 2300 mm; the amount of evapotranspiration is greater than the amount of rainfall. The yearly mean temperature of this region is 8.6 °C, with significant diurnal temperature variations. The multiyear mean duration of sunshine is 3024 h, and days free of frost are 154. Texture of soil in the test area consists of light loam within the 0–40 cm depth range, transitioning to sandy loam below 40 cm. The soil porosity is about 46%, and the capacity of the field to hold water ranges from 13.4% to 15.1%. Soil physical and chemical attributes are detailed in Table 1. The depth of groundwater in this area ranges from 20 to 25 m, with minimal and highly concentrated precipitation, which complicates the utilisation of groundwater and rainfall. Consequently, the only reliable water source is the water from the Yellow River. The goji berry strain used in the experiment was 8a-born Ningqi 7, and the critical period of fertility of the goji berry tree was sub-divided into five stages: Stage 1 (spring period) between late April and mid-May; Stage 2 (period of flowering) between May and mid-June; Stage 3 (fruiting period) from late June to late July; Stage 4 (late fruiting period) from early to mid-August; Stage 5 (defoliation period) between late August and early September (Figure 2).
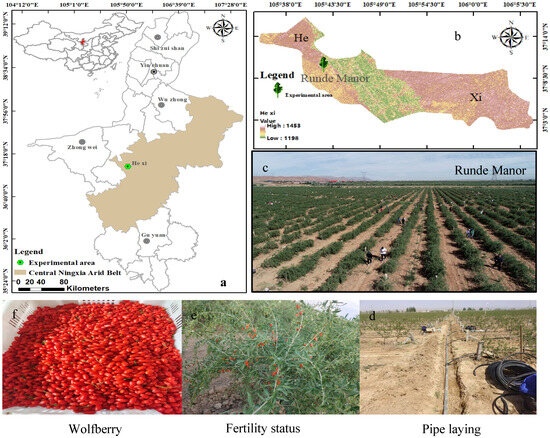
Figure 1.
Location of the study area and experimental overview map. (a) is the Ningxia Hui Autonomous Region; (b) is the town of Hexi; (c) is Rundé goji berry estate; (d) is the laying of drip irrigation tape; (e) represents the growth periods of goji berries; (f) is the fruit of the goji berry.

Table 1.
Physicochemical soil characteristics in the study area.
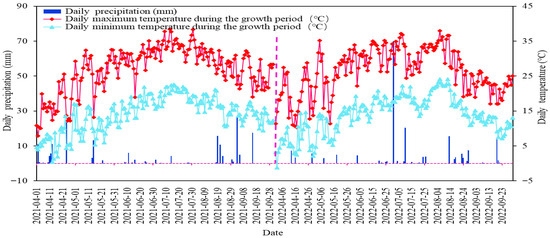
Figure 2.
Daily air temperature and rainfall during the fertility period of goji berry in the study area.
2.2. Design of the Experiment
The experiments were run in 2021 and 2022, from April to October (the fertility period of goji berry), and two factors, the depth of irrigation and the degree of N application, were considered. According to the regulations on drip irrigation planting technology, the recommended amount of irrigation water for goji berry growth during a normal water year is 2160 m3·hm–2, representing a 28% reduction (I1) in low water levels. In a dry water year, the medium water level is set at 2565 m3·hm–2, which is a 14% reduction (I2), whereas the local conventional irrigation level is set at 2970 m3·hm–2 (I3), which is the highwater benchmark. Three depths of irrigation and three rates of N application (based on pure nutrients) were defined: low N (N1) at 165 kg·hm–2, medium N (N2) at 225 kg·hm–2, and high N (N3) at 285 kg·hm–2. A two-factor, three-level completely randomised experimental design was used, and the water and fertiliser management methods used for the experiment are detailed in Table 2. The experimental treatments of phosphorus fertiliser (P2O5) and potash (K2O) were quantitatively applied based on the relevant research results in the study area and were set at 90 kg/hm2 and 150 kg/hm2, respectively, with urea (46% N), calcium superphosphate (12% P2O5), and potassium chloride (50% K2O) as the supply fertilisers. The test goji berry trees had a ground diameter of 30–45 mm, and at the beginning of the reproductive period, the plant height was 80–110 cm, with a 0.75 m spacing, a 3 m row spacing, 10 goji berry trees per plot, and a plot area of 22.5 m2 (Figure 3). Nine treatments were tested, with three replications per treatment, totalling 27 experimental plots, a buffer zone extending over 6 m, and a total test area of 607.5 m2. The water control was Gracilarian frame drip irrigation, and one drip tape was installed in each plot, with an inlaid patch type, 16 mm outer diameter, 0.6 mm wall thickness, and a drip head rate of flow of 3.0 L/h. A parallel laying pattern of one pipe and one row of drippers was adopted, laying along one side of the tree row and installing one drip head next to each tree for irrigation. Irrigation and fertilisation were synchronised throughout the reproductive period, with irrigation and N application at 20% and 15% (one time) in spring, 30% and 25% (two times) in the period of flowering, 30% and 40% (three times) in the fruiting period, and 10% (one time) in the periods of fruiting and defoliation, respectively. For fertilisation and irrigation, the management of fields was identical to that used locally.
Table 2.
Nitrogen and water management programme for drip-irrigated goji berry.
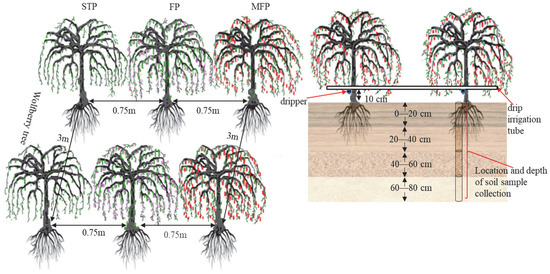
Figure 3.
Location of experiment setup and soil sample collection.
2.3. Collection of Soil Samples
Soil samples were collected from the 2nd day after irrigation during each growth period. Five soil sampling events were conducted during the spring (5 May), flowering (1 June), fruiting (10 July), post-fruiting (10 August), and defoliation (1 September) periods. The vertical sampling was conducted with an earth auger around 10 cm from the roots on one goji berry tree side, where the drip head was installed each time, with sampling depths ranging from 0 to 80 cm, and stratified every 20 cm, for four layers in total. Soil samples were collected in triplicate from each plot, and were rigorously combined, producing a fresh sample of soil (around 1 kg). Gravel, plant, and animal debris were removed, after which the soil sample was divided in two using the quartering approach. The first part was placed in a sterile plastic sealed bag and transported to the laboratory in a refrigerated container as soon as possible for determining soil enzyme activity and quantifying microbial community. The remaining portion was naturally air-dried in the dark, and the grains of sand >2 mm were removed. The sample was then filtered (2 mm and 0.149 mm soil sieves) for measuring soil nutrient indicators.
2.4. Indicator Methods and Measurements
2.4.1. Soil Indicator Determination and Methods
Soil organic matter (SOM) was measured according to the Walkley–Black approach [16]. Kjeldahl digestion was used to measure total nitrogen (TN) [17]. H2SO4-HClO4 digestion–molybdenum antimony blue colorimetry was applied to measure total phosphorus (TP) [18]. Total potassium (TK) was measured content using HF-HClO4 digestion–atomic absorption [19]. Measurement of ammonium N (NH4+-N) and nitrate N (NO3−-N) was conducted through a 1.0 mol/L KCl extraction–continuous flow analytical system (BRAN+LUEBBE AA3 flow analyser; Beijing Ziwu Ruide Technology Co., Ltd.; Beijing; China). Also, 0.5 mol/L NaHCO3 extraction–molybdenum blue was used to measure available phosphorus (AP) [20]. Next, 1.0 mol/L CH3COONH4 extraction by atomic absorption was applied to measure available potassium (AK) [21]. UA was measured using sodium-phenol hypochlorite colorimetric assay, SA by the 3,5-dinitrosalicylic acid colorimetric assay, APA by colorimetric assay (disodium phosphate), and HPA by titrimetric assay (potassium permanganate) [22].
2.4.2. Comprehensive Evaluation of the Quality of Soil
- (1)
- The minimum data set (MDS) method was used for evaluating soil quality, i.e., 12 indicators including SOM, TP, TN, TK, NH4+-N, NO3−-N, AP, UA, AK, SA, HPA, and APA of the soil in the bloom season were used to establish the total soil data set (TDS) [23]. The TDS was determined after running a one-way ANOVA for each indicator (one-way ANOVA). The TDS showing a significant difference (p < 0.05) was selected as the minimum data set (MDS) indicator [24].
- (2)
- Next, MDS was constructed through principal component analysis (PCA)—norm values—and Pearson’s correlation [25]. Norm value represents the vector norm length of the indicator in the multidimensional component space. With increasing length, the comprehensive load of the indicator across all principal components increases, and its ability to interpret comprehensive information also rises. The formula for calculating the norm value is as shown in Equation (1) [26].
Here, Nik is the combined loading of the ith indicator on the initial k principal components with eigenvalues exceeding or equal to 1, μik is the ith indicator loading on the kth principal component, and λk is the kth principal component’s eigenvalue.
- (3)
- The objective weighted coefficient of variation method was used to determine the indicator weights [8]. The indicator weights were determined using Equations (2) and (3).
Here, Vi is the coefficient of variation in indicator i, δi is i’s standard deviation, χi indicates the mean indicator i value, and Wi is the indicator’s weight.
- (4)
- The following equation was used to calculate the affiliation value or standardised score for each evaluation factor [27,28]. First, soil indicators were normalised to a dimensionless score (si) between 0 and 1 using Equation (2) more is better, si′ or Equation (3) less is better.
Here, si (including si′ and si′′) represents ith indicator’s score, and xmax, xi, and xmin represent the maximum, measured, and minimum values of the ith indicator, respectively.
- (5)
- The soil quality index (SQI) was calculated subsequently to scoring and weighting all the indicators in the MDS. This was achieved using the scoring function [29], which quantifies the criteria of each indicator on a 0–1 scale.
Here, SQI indicates the index of soil quality, Wi indicates the assigned weight to each index, Si indicates the score of each index, and n indicates the number of indices in the final MDS. The larger the SQI value, the greater the soil quality, and the SQI is divided into low, lower, medium, higher, and high quality according to the order of 0–0.2, 0.2–0.4, 0.4–0.6, 0.6–0.8, and 0.8–1.0, respectively.
2.4.3. Goji Berry Yield
The yield of goji berry was determined by the weighing method; all plots of ripe goji berry fruits were harvested via stubble, weighed on site to obtain the fresh fruits quality, the quality of the dried fruits after treatment was determined, the ratio of dry fruits to fresh fruits was calculated, four stubbles were harvested, and the yield was obtained by summing the yields of the four stubbles.
2.4.4. Statistical Methods Applied
The experimental data were examined via a normal distribution test using Microsoft Excel 2016 software. All statistical examinations were conducted using SPSS 22.0, and Duncan’s method was used to test treatments differences (p < 0.05). Analysis of variance (ANOVA) was applied to examine the impacts of irrigation (I), fertilisation (N), and their relationships on the soil quality and yield indices of goji berry. All data were expressed as means, and the error line evident in results indicated standard deviation (n = 3). Correlation analysis (Pearson) and principal component analysis were applied to identify correlations between yield indicators and soil indicators. The influences of the soil properties on yield were determined by conducting the Mantel test (R software version 3.6.1), and the most important soil factors affecting the yield of goji berry were predicted using the random forest model constructed with the “Random Forest” package. The impact of soil quality on yield formation in goji berry under coupled water and N regulation was revealed via partial least squares modelling (PLS-PM) [30]. Graphing was conducted using Microsoft Excel 2016, Origin 2021, and R software version 3.6.1.
3. Results
3.1. Characterisation of Total Soil Nutrients in the Root Zone of Goji Berry
The characteristics of total soil nutrient distribution in 2021 and 2022 with different water–nitrogen coupling regulations are shown in Figure 4. SOM ranged from 17.01 to 33.41 g·kg−1, decreasing significantly with increasing soil depth with the 0–20 cm layer percentage of SOM content ranging from 29.76 to 57.35%. With the progressing fertility period, the SOM showed a “folding line” trend; under the I1 and I2 irrigation conditions, the SOM showed a positive relationship with N application, but with the I3 irrigation conditions, SOM content showed an initial increase followed by a decrease with increasing N application. The effects of irrigation quotas, nitrogen application rates, and their interactions on SOM content of the 20–40 cm and 40–60 cm soil layers were more pronounced, and the most significant impact was from nitrogen application, followed by irrigation quotas, and the lowest impact was from the water–nitrogen interaction.
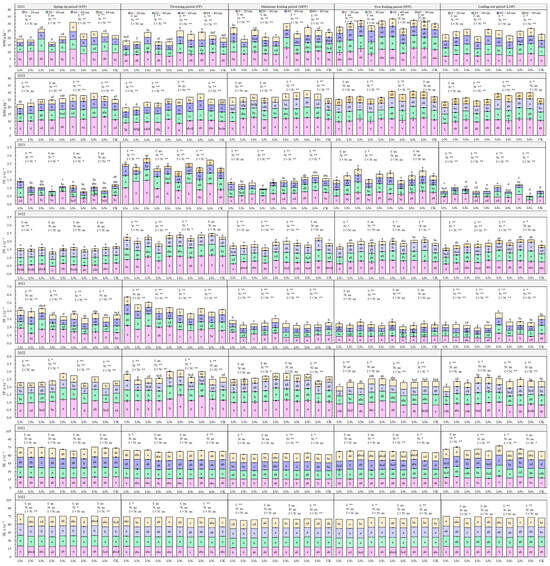
Figure 4.
Characteristics of soil total nutrient distribution in the root zone of goji berry. The different lowercase letters indicate significant differences, determined by Duncan’s multiple-range test (p < 0.05). ** indicates a highly significant effect (p < 0.01), * indicates a significant effect (p < 0.05), and ns indicates no significant effect (p > 0.05); I, irrigation quota; N, the amount of nitrogen applied.
The TN content in the soil ranged from 0.78 to 2.81 g·kg−1, primarily concentrated in the 0–60 cm soil layer, with a significant decrease in TN as soil depth increased. As the fertility period progressed, the TN content showed an “M”-shaped trend, and with increasing irrigation quota and application of N, some differences in the TN content between the two years were observed. TN content was more significantly influenced by irrigation quotas, nitrogen application rates, and their interactions during the flowering, fruiting, and defoliation periods.
The TP ranged from 1.84 to 5.73 g·kg−1, gradually decreasing with increasing soil depth. TP content showed an “inverse V-shaped” relationship to the fertility period. As the quota of irrigation and N application increased, the TP at the 0–80 cm depth did not change significantly. TP content was significantly influenced by irrigation quotas, nitrogen application rates, and their interactive effects during the spring, flowering, and fruiting periods, while the impact was relatively weaker during the post-fruiting and defoliation periods.
The TK content ranged from 61.36 to 79.25 g·kg−1 in the soil, with relatively uniform distribution across the 0–80 cm soil profile. TK content showed no significant variation with fertility period, irrigation quota, or nitrogen application rate.
3.2. Characteristics of Soil Nutrients in the Root Zone of Goji Berry
Available soil nutrient characteristics in 2021 and 2022 under different water–nitrogen coupling regulations are shown in Figure 5. The NH4+-N content ranged from 70.87 to 202.02 mg·kg−1, gradually decreasing with increasing soil depth. With progression of the fertility period, the NH4+-N content showed an initial increase and then a decrease. The trend of NH4+-N was not prominent with increasing N application during different fertility periods and under the same irrigation level. NH4+-N was impacted by the irrigation quota, N application, and their interaction effects to different degrees in different fertility periods; N application had the most prominent effect, followed by the effect of N and water interaction, and irrigation had the least effect.
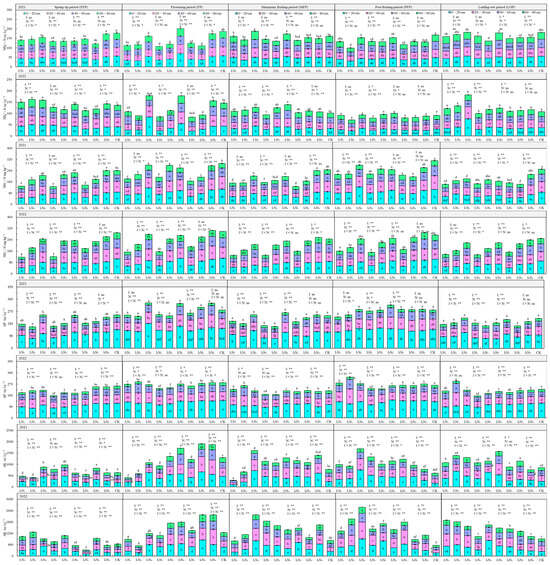
Figure 5.
Characteristics of soil quick-acting nutrient distribution in the root zone of goji berry. The different lowercase letters indicate significant differences, determined by Duncan’s multiple-range test (p < 0.05). ** indicates a highly significant effect (p < 0.01), * indicates a significant effect (p < 0.05), and ns indicates no significant effect (p > 0.05); I, irrigation quota; N, the amount of nitrogen applied.
NO3−-N content ranged from 118.10 to 311.96 mg·kg−1, gradually decreasing with increasing soil depth. With the change in the fertility period, NO3−-N showed an “M” type trend. Under different irrigation quotas, as N application increased, NO3−-N gradually increased, and with a constant level of N application, with increasing quantity of irrigation, NO3−-N also increased gradually, but the rate of increase gradually decreased. Aside from for the 40–80 cm layer of soil in the late fruiting period, NO3−-N of the 0–80 cm layer of soil in the other reproductive periods was significantly or highly significantly impacted by irrigation, application of N, and their interactions.
The AP content ranged from 156.83 to 332.67 mg·kg−1 and was primarily concentrated in the 0–60 cm soil layer. The AP also showed an “M”-shaped trend with the change in the fertility period, and it was lower in the fruiting and defoliation periods. The AP content in the 0–60 cm soil layer reached a significant or highly significant level in all fertility periods by irrigation, N application, and their combined effects.
The AK content ranged from 300.29 to 2582.19 mg kg–1, with increasing soil depth, there was no significant decrease in the 0–40 cm layer, whereas the 40–80 cm layer significantly decreased. As the fertility period progressed, the AK increased during the flowering period and then showed a steady or slightly decreasing trend. With increasing volume of irrigation and N application, available K increased or first increased but then decreased. The impacts of irrigation, N application, and the effects of their interaction on K in the 0–80 cm layer of soil were highly significant.
3.3. Characteristics of the Soil Enzyme Distribution in the Goji Berry Root Zone
3.3.1. Urease
In 2021 and 2022, UA in the 0–80 cm layer of soil showed an inverse relationship with soil depth, and the decreasing trend was more prominent in the 0–40 cm range. The UA activity was increased gradually with N application at I1 and I2 irrigation levels, and showed an initial increase followed by a decrease at the I3 irrigation level. The UA activity showed a “W”-shaped trend as the fertility period proceeded. The impacts of irrigation, N application, and the effects of their interactions on urease activity were significant (p < 0.05) or highly significant (p < 0.01) at different periods of fertility in the 0–60 cm layer of soil (Figure 6).
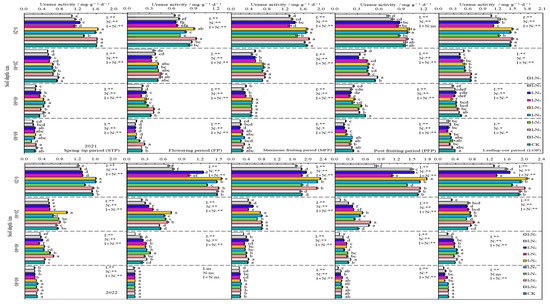
Figure 6.
Characteristics of soil urease activity. The different lowercase letters indicate significant differences, determined by Duncan’s multiple-range test (p < 0.05). ** indicates a highly significant effect (p < 0.01), * indicates a significant effect (p < 0.05), and ns indicates no significant effect (p > 0.05); I, irrigation quota; N, the amount of nitrogen applied.
3.3.2. Sucrase
In 2021 and 2022, SA in the 0–80 cm layer of soil also showed an inverse relationship with the depth of soil. It increased with N application in I1 irrigation conditions and showed a trend of first increase, then decrease with N application in I2 and I3 irrigation conditions. As fertility increased, SA activity showed a “folded-line” trend. Irrigation, N application, and their effects reached extremely significant levels (p < 0.01) in 0–20 cm soil at different fertility periods (Figure 7).
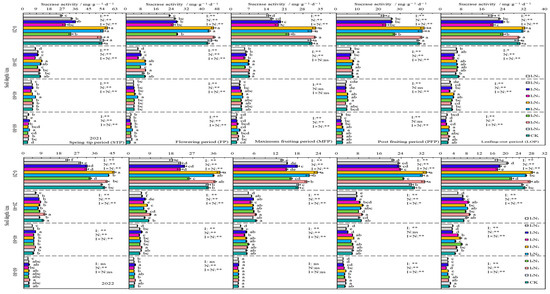
Figure 7.
Characteristics of soil sucrase activity. The different lowercase letters indicate significant differences, determined by Duncan’s multiple-range test (p < 0.05). ** indicates a highly significant effect (p < 0.01), * indicates a significant effect (p < 0.05), and ns indicates no significant effect (p > 0.05); I, irrigation quota; N, the amount of nitrogen applied.
3.3.3. Alkaline Phosphatase
In 2021 and 2022, the APA in the 0–80 cm layer of soil declined with increasing soil depth, and the APA showed an inverted V-shaped trend as fertility increased. During different fertility periods, the APA in the 0–60 cm layer of soil increased with increasing application of N at the I1 irrigation rate; next, it showed an initial increase followed by a decrease with increasing application of N at the I2 and I3 irrigation rates. The impacts of irrigation, application of nitrogen fertiliser, and the effects of their interactions on the APA were significant (p < 0.05) or highly significant (p < 0.01) at different fertility periods in the 0–20 cm layer of soil (Figure 8).
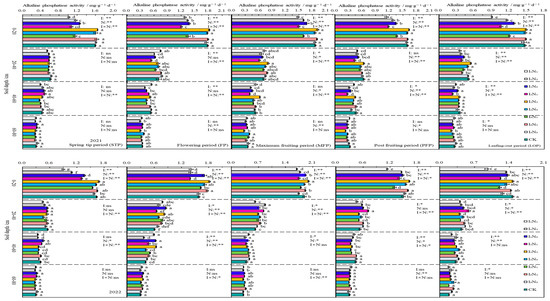
Figure 8.
Characteristics of soil alkaline phosphatase activity. The different lowercase letters indicate significant differences, determined by Duncan’s multiple-range test (p < 0.05). ** indicates a highly significant effect (p < 0.01), * indicates a significant effect (p < 0.05), and ns indicates no significant effect (p > 0.05); I, irrigation quota; N, the amount of nitrogen applied.
3.3.4. Hydrogen Peroxidase
In 2021 and 2022, the HPA distribution in the 0–80 cm layer of soil was relatively uniform, with a very small decrease with increasing depth of soil, and it was not significantly affected by changes in the fertility period. In the 0–40 cm layer of soil, the HPA showed an initial increase and then a decrease with increasing application of N under the different irrigation rates, but the magnitude of the change was small, and no significant change was detected in the 40–80 cm layer of soil (Figure 9).
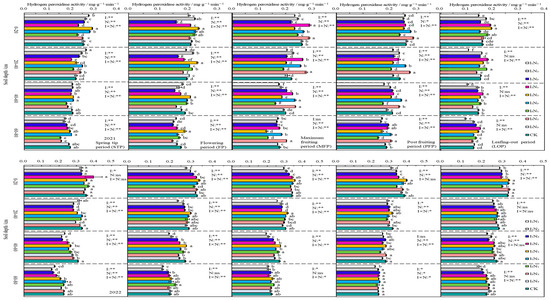
Figure 9.
Characteristics of soil hydrogen peroxidase activity. The different lowercase letters indicate significant differences, determined by Duncan’s multiple-range test (p < 0.05). ** indicates a highly significant effect (p < 0.01), * indicates a significant effect (p < 0.05), and ns indicates no significant effect (p > 0.05); I, irrigation quota; N, the amount of nitrogen applied.
3.4. Indicators of Production
The fresh and dried fruit yields of goji berry ranged from 7432.56 to 9376.17 kg/hm2 and 1745.38 to 2205 kg/hm2, respectively, under water–nitrogen coupling regulation, and the highest yields were achieved under the I2N2 treatment, which increased yields by 14.17% and 14.78% compared to the conventional control (CK). The dry-to-fresh ratio of goji berry ranged from 4.17 to 4.33, with I3N1 having the highest dry-to-fresh ratio. The impacts of irrigation, N application, and the effects of their interactions on both fresh and dried fruit yields and dry-to-fresh ratio of wolfberry were all significant (p < 0.05) (Figure 10).
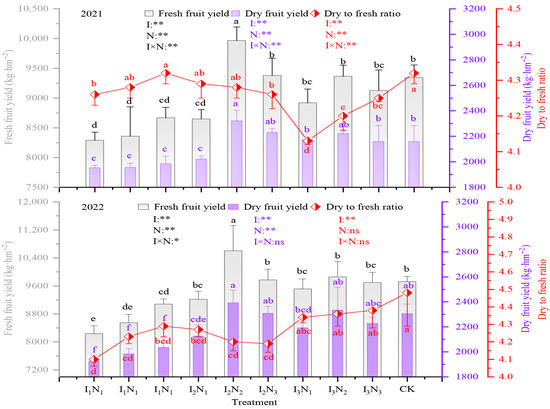
Figure 10.
Effect of coupled water and nitrogen regulation on the yield of goji berry from 2021 to 2022. The different lowercase letters indicate significant differences, determined by Duncan’s multiple-range test (p < 0.05). ** indicates a highly significant effect (p < 0.01), * indicates a significant effect (p < 0.05), and ns indicates no significant effect (p > 0.05); I, irrigation quota; N, the amount of nitrogen applied.
3.5. Comprehensive Analysis of Soil Traits and Yield Components
The Mantel test results for the soil indicators and yield indicators in 2021 and 2022 (Figure 11a,b) revealed that TK, NH3−-N, and AK overlapped poorly with the yield indicators (Mantel r < 0.4), whereas the SOM, TN, NH4+-N, UA, SA, APA, and HPA indicators overlapped better with goji berry yield (Mantel r ≥ 0.4) and had a stronger correlation with yield indicators (Mantel p ≤ 0.05), indicating that these indicators had a greater effect on yield.
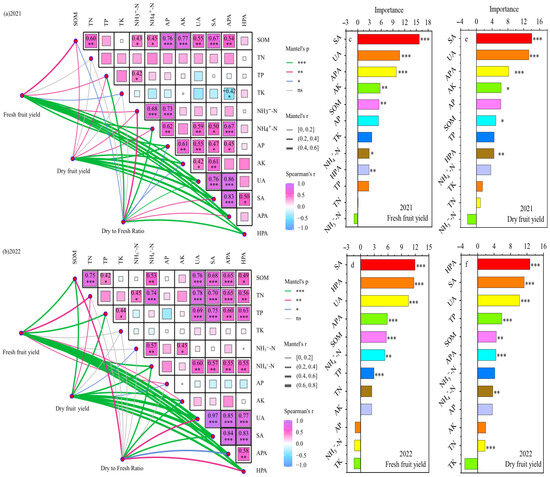
Figure 11.
Correlation analysis and Mantel test analysis of soil metrics and goji berry yield with water and nitrogen coupled regulation (a,b), and random forest model predicts the key soil drivers affecting goji berry yield from 2021 to 2022 (c–f). The R2 value represents the explained variation. *, ** and *** indicate the significance level at p < 0.05, p < 0.01 and p < 0.001.
The results of the correlation analysis revealed that, except for TK, AP, and AK, the other soil indicators showed strong positive relationships (p ≤ 0.05), indicating that the soil indicators interacted with each other and had a positive effect. Application of a random forest (RF) model revealed the factors of soil influencing the formation of fresh and dried fruit yields of goji berry (Figure 11c–f), and the main soil factors affecting the fresh and dried fruit yields of goji berry were SA, UA, APA, HPA, SOM, NH4+-N, and TP.
3.6. Evaluation of Quality of Soil and Its Relationship with Yield
Based on the correlations (p < 0.05) between the soil indicators and yield indicators, 11 indicators of soil SOM, TN, TP, NH4+-N, NH3−-N, AP, AK, UA, SA, APA, and HPA were chosen for PCA, and the absolute value of factor loadings within 10% of the greatest factor loading was retained as the smallest data set. Then, the scoring function was applied to quantify the soil indicators as dimensionless values on a scale of 0–1, and the SQI (Figure 12a,b) was calculated. The SQI ranged from 0.21 to 0.82 and from 0.14 to 0.73 under the different treatments in 2021 and 2022, respectively; the maximum and minimum values occurred under treatments I2N3 and I1N1. The soil quality increased significantly with increasing irrigation and N application, and all treatments reached medium or high levels, except for the I1 irrigation and I2 irrigation N1 treatments, which were at low levels.
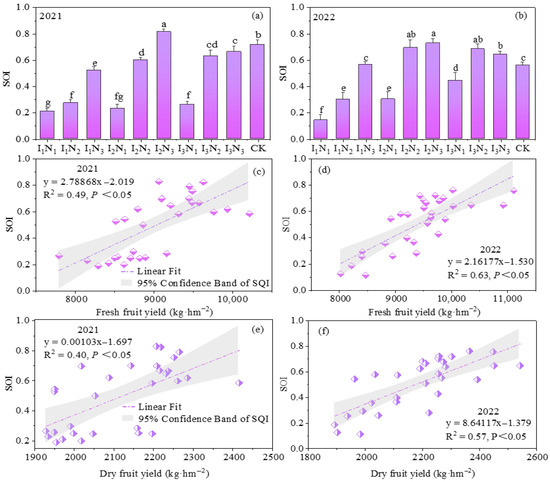
Figure 12.
The evaluation of soil quality based on the minimum data set and the correlation between soil quality and the yield of goji berry from 2021 to 2022. (a,b) represent soil quality indices in different treatments; (c,d) represent the linear fitting results of fresh fruit yield and soil quality index; (e,f) represent the linear fitting results of dry fruit yield and soil quality index. The values presented in the figures are given as mean ± SD (n = 3). Different lowercase letters indicate significant differences at p < 0.05.
The regression analysis of the SQI and yield fitting revealed that the SQI was linearly related to both fresh fruits and dried fruits, in which the R2 values of the fitted curves with fresh fruit yield were 0.49 and 0.63 (Figure 12c,d), and the R2 values of the fitted curves with dried fruit yield were 0.40 and 0.57 (Figure 12e,f), which were positively correlated. These findings indicated that water and N coupling can significantly affect goji berry yield by regulating soil quality.
Analysis by a partial least squares path model (PLS-PM) showed that irrigation and N application had direct positive impacts on soil nutrients and indices of activity of enzymes (p < 0.001), whereas the direct effects on goji berry yields were weak, and only the impact of N application on yields in 2021 was significant (p < 0.05). The indirect impacts of irrigation and N application on goji berry yield through soil nutrients were also not significant; however, enzyme activity had an indirect significant positive impact on goji berry yield (p < 0.001), (Figure 13).
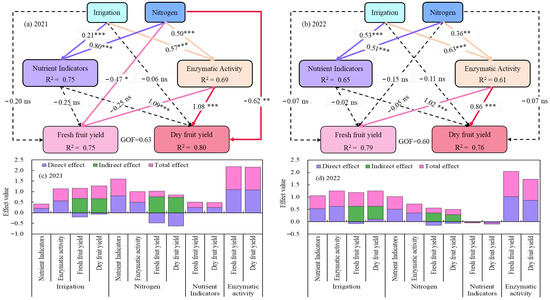
Figure 13.
Partial least squares path modelling (PLS-PM) revealed the direct and indirect effects of water and nitrogen coupling on soil nutrients, enzyme activities, and goji berry yields, as well as the total effect on yield formation from 2021 to 2022. The bold solid line represents a positive effect and the thin dashed line represents a negative or no significant effect. The bold solid line indicates a positive effect, the thin dashed line indicates a negative or no significant effect, and the number above the line indicate the standardised path coefficient. *, ** and *** next to the number indicate that the significance level at p < 0.05, p < 0.01, and p < 0.001, respectively. The R2 value represents the explained variation.
4. Discussion
4.1. Effects of Coupling of N and Water on Soil Nutrients in the Root Zone of Goji Berry
Soil nutrients are the main source and material basis of nutrients required for crop development and growth [31,32]. The fertilisers are not immediately absorbed by the crops after application but are stored in the soil and are gradually absorbed and used by the crop to meet the supply of nutrients required by the crop for its long growth process [33,34]. This study showed that SOM content decreased with soil depth and decreased initially, then increased, and finally decreased again with the period of fertility, and under different irrigation conditions, the SOM content increased with N application or showed an initial increase followed by a decrease. Past investigations have demonstrated that the combination of moderate irrigation with water and the application of fertiliser can significantly increase SOM, and under the same conditions of fertiliser application, there is a variable change in SOM with decreasing water irrigation [35,36]. This is mainly because the soil under low-water and medium-water conditions is not filled with water, and aeration and permeability are adequate, which favours the nourishment and reproduction of soil microorganisms, whereas N application provides the required nutrients and accelerates the transformation and decomposition of soil humus, which favours the generation of SOM [37,38,39].
TN is affected mainly by the bioaccumulation and hydrolysis of SOM [40]. It was shown that N application increased soil TN content, but it decreased with increased irrigation, and the soil TN content gradually decreased with decreased irrigation under the same fertiliser application, and similar conclusions were also observed in this study [41,42,43]. NH4+-N is a fast-acting nutrient, and under different water and nitrogen conditions, soil nutrient transformation and crop absorption rates are varied, which resulted in different fertility periods and the same irrigation level, with the increase in N application, trends of NH4+-N were not obvious [44,45,46]. Irrigation has a significant accumulation effect on NO3−-N, and this accumulation is more prominent at high water levels [47,48]. The same conclusion was reached in this study; i.e., NO3−-N accumulated with increasing application of N under a set quota of irrigation. At the same level of N application, NO3−-N also increased with increasing volume of irrigation, but the magnitude of the increase gradually decreased, which occurred mainly because excessive irrigation led to vertical and lateral migration and seepage of NO3−-N [49].
4.2. Effects of N and Water Coupling on Soil Enzymes in the Root Zone of Goji Berry
Enzymes are a general term for all kinds of enzymes present in the soil. The following are closely related to enzyme activity: the synthesis and decomposition of soil humus; the transformation and decomposition of organic matter, plants, and animals; withering material; microbial residues; and the oxidation–reduction process of organic and inorganic compounds [50,51,52]. In the present study, the soil UA showed a decreasing trend with increasing soil depth and a trend of gradually increasing or initially increasing followed by declining with N application at different irrigation conditions and showed a “W”-shaped variation trend with fertility period. This occurred mainly because nutrient sources such as soil litter and humus declined with increasing depth of soil; thus, the activities of enzymes were lower in the deeper layers. UA is a hydrolytic enzyme that is sensitive to water changes, and soil aeration and permeability under low-water and medium-water conditions are adequate. Supplementation with N fertiliser provides a sufficient nutrient base, which is conducive to the nourishment of UA. As irrigation increased, the spaces in soil were inundated with water, which decreased the soil respiration rate. As N concentration increased, further inhibiting enzyme activity, the activities of enzymes showed an increase and then a decrease [53]. The soil was well-aerated and permeable after deep ploughing in the spring period, which was conducive to UA breeding. The unstable temperature in the flowering period and the large-scale mechanical operation led to the deterioration of soil permeability, which was unsuitable for the growth of UA. An increase in the application of N and irrigation was implemented during the fruit ripening period, and the soil temperature stabilised so that the activity of UA gradually increased. With the replenishment of the withered material and tilling during the defoliation period, the permeability of the soil improved, and the activity of UA rebounded [54].
SA is secreted by the plant root system and has specificity, which makes it an important enzyme for characterising soil biochemical activity [55]. SA was the highest during the spring period and followed an M-shaped trend as the fertility period progressed. SA belongs to the hydrolysis enzyme family and is very sensitive to water changes. Suitable N and water conditions facilitate the enhancement of SA; in contrast, as water increases, the soil spaces are inundated with water, driving out air, which decreases the soil respiration rate, compressing the space for the survival of SA. With the further replenishment of N fertiliser, the N concentration increases, which further inhibits SA [56,57].
APA is linked to soil phosphorus conversion and utilisation and soil microbial activity [58]. In the results of the study, soil APA decreased as soil depth increased and showed an upside-down V-shaped trend for fertility periods. This was related mainly to the phosphorus fertiliser application pattern, which was quantitatively applied in the experiment, with 40%, 40%, and 20% applied in spring, during flowering, and during fruiting, respectively, and then not added, resulting in a lag in phosphorus fertiliser uptake, which resulted in a slow decline in APA after the fruiting period [59,60].
The HPA is relatively stable as fertility period progresses and is not significantly affected by fertility period variation, and this is consistent with the conclusions of related studies [61]. This finding is related mainly to the characteristics of HPA, which belongs to the oxidoreductase group and is the key enzyme that catalyses the breakdown of hydrogen peroxide into oxygen and water. During the transformation process, HPA can decompose oxygen and water to regulate the growth microenvironment and is therefore less affected by variations in the outside environment [62].
4.3. Influences of N and Water Coupling on Yield Formation
Reasonable irrigation and fertilisation are effective ways to raise yields of crops and income. The results of the current study showed that with increasing N application and irrigation water, the yields of fresh and dry fruits of goji berry showed an increase and then a decrease, indicating that insufficient or too much water and N decreased goji berry yield. The same conclusion was reached in another study in which crop yields showed an increase with increasing application of fertiliser and water, but neither too much nor enough irrigation or fertiliser application was conducive to crop yield formation [63,64]. These observations can be primarily attributed to too little irrigation having stressful effects on crops; too much irrigation results in poor soil aeration and permeability, affecting root respiration and thus leading to lower yields; insufficient application of N prevents plants from obtaining enough N, leading to substandard development and growth; and excessive N results in too much soil N, which leads to various challenges, including acidification and secondary soil salinisation, and ultimately decreases crop yield [65,66]. It is necessary for modern agricultural development to achieve increased crop yields and improved quality with soil quality guaranteed. With coupled water and N regulation, the low water and low N treatment resulted in a decline of soil quality, and all other treatments of soil quality maintained at a relatively high level, and the I2N2 treatment showed significant yield increase effect, so it could be recommended as the optimal irrigation and N management model for drip-irrigated goji berries in arid areas.
5. Conclusions
The results indicate that water–nitrogen coupling regulation exerts a more pronounced direct effect on the SOM and NH3−-N contents in the 0–80 cm layer of soil. The soil enzymes were mainly distributed in the 0–40 cm soil layer, of which UA, SA, and APA were significantly influenced by water–nitrogen coupling regulation, with increased nitrogen application under irrigation condition I1 enhancing the activity of these enzymes, but under irrigation conditions I2 and I3, excessive nitrogen application had an inhibitory effect. The highest goji berry yield was achieved under I2N2 treatment, with fresh fruit and dried fruit yields increasing by 14.17% and 14.78%, respectively, compared to conventional management (CK). The direct impact of irrigation and nitrogen application on goji berry yield is quite limited, which mainly influences yield by regulating soil quality, and the enzyme activity in soil quality is more important than nutrients in affecting yield. Therefore, the regulation of soil quality, especially enzyme activity and microbial abundance under water–nitrogen coupling, could serve as a key research direction for enhancing yields in perennial crops like goji berries.
Author Contributions
Resources, acquisition of funding, Conceptualization, P.J.; Review—writing & editing, Project administration, Supervision, Investigation, Funding acquisition, Formal analysis, Conceptualization, Y.M.; Writing–review & editing, Visualisation, Writing of original draft, Methodology, Resources, Formal analysis, Data curation, Z.M.; Editing and writing—review, Resources, Methodology, Investigation, Data curation, M.T.; Data curation, Q.F., T.H. and F.L.; Editing and writing—review, Data curation, Formal analysis, P.A. All authors have read and agreed to the published version of the manuscript.
Funding
Our work was funded by the “Key Laboratory of Northwest Oasis Water-saving Agriculture, Ministry of Agriculture and Rural Affairs of China” (Agreement number: xjnkywdzc-2024002-13-1), the “Xinjiang Key Laboratory of Hydraulic Engineering Security and Water Disasters Prevention”2024 Open Subjects (Agreement number: ZDSYS-JS-2024-11), the Major Science and Technology Special Projects of Xinjiang Uygur Autonomous Region (Agreement number: 2023A02002-5, 2024A03007-4). River and Lake Chief System-Guided Pilot Project Research on Scientific Dispatching Model V1.0 for Irrigation Districts (2524HXKT1).
Data Availability Statement
The data presented in this study are available on request from the corresponding author.
Conflicts of Interest
The authors declare no conflicts of interest.
References
- Wang, C.; Chang, S.; Inbaraj, B.S.; Chen, B. Isolation of carotenoids, flavon-oids and polysaccharides from Lycium barbarum L. and evaluation of anti-oxidant activity. Food Chem. 2010, 120, 184–192. [Google Scholar] [CrossRef]
- Amagase, H.; Farnsworth, N.R. A review of botanical characteristics, phytoc-hemistry, clinical relevance in efficacy and safety of Lycium barbarum frui-t (Goji). Food Res. Int. 2011, 44, 1702–1717. [Google Scholar] [CrossRef]
- Wang, L.; Wang, Y.; Zhou, P. Validation of reference genes for quantitative real-time PCR during Chinese wolfberry fruit development. Plant Physiol. Biochem. 2013, 70, 304–310. [Google Scholar] [CrossRef] [PubMed]
- Yin, W.; Zhang, C.; Zhu, H.; Zhao, Y.; He, Y. Application of near-infrared hyperspectral imaging to discriminate different geographical origins of Chinese wolfberries. PLoS ONE 2017, 12, e0180534. [Google Scholar] [CrossRef]
- Yin, J.; Ma, Z.; Yang, Y.; Du, B.; Sun, F.; Yang, Z. Water and Nitrogen Coupling on the Regulation of Soil Nutrient–Microbial Biomass Balance and Its Effect on the Yield of Wolfberry (Lycium barbarum L.). Plants 2023, 12, 2768. [Google Scholar] [CrossRef] [PubMed]
- Ma, Z.; Yin, J.; Yang, Y.; Sun, F.; Yang, Z. Effect of water and nitrogen coupling regulation on the growth, physiology, yield, and quality attributes and comprehensive evaluation of wolfberry (Lycium barbarum L.). Front. Plant Sci. 2023, 14, 1130109. [Google Scholar] [CrossRef] [PubMed]
- Su, Q.; Cang, B.; Ullah, R.; Song, Z.; Li, Y.; Cui, J.; Wei, X.; Yang, M.; Yang, X.; Wu, Z. Interaction of the coupled effects of irrigation mode and nitrogen fertilizer timing on rice yield in different regions. Irrig. Drain. 2023, 72, 999–1012. [Google Scholar] [CrossRef]
- Cabrera-Bosquet, L.; Molero, G.; Bort, J.; Nogués, S.; Araus, J.L. The combined effect of constant water deficit and nitrogen supply on WUE, NUE and Δ13C in durum wheat potted plants. Ann. Appl. Biol. 2007, 151, 277–289. [Google Scholar] [CrossRef]
- Huang, L.; Yang, W.P.; Hu, X.Q.; Tao, Y.; Yao, S.M.; Ou, X.Q. Effects of Irrigation and Nitrogen Interaction on Water Consumption Characteristics and Nitrogen Utilization of Winter Wheat. J. Soil Water Conserv. 2016, 30, 168–174. (In Chinese) [Google Scholar] [CrossRef]
- Li, Y.; Shao, X.; Li, D.; Xiao, M.; Hu, X.; He, J. Effects of water and nitrogen coupling on growth, physiology and yield of rice. Int. J. Agric. Biol. Eng. 2019, 12, 60–66. [Google Scholar] [CrossRef]
- Yang, Z.; Kong, T.; Xie, J.; Yang, T.; Jiang, Y.; Feng, Z.; Zhang, Z. Appropriate water and fertilizer supply can increase yield by promoting growth while ensuring the soil ecological environment in melon production. Agric. Water Manag. 2023, 289, 108561. [Google Scholar] [CrossRef]
- Zhong, T.; Zhang, J.; Du, L.; Ding, L.; Zhang, R.; Liu, X.; Ren, F.; Yin, M.; Yang, R.; Tian, P.; et al. Comprehensive evaluation of the water-fertilizer coupling effects on pumpkin under different irrigation volumes. Front. Plant Sci. 2024, 15, 6109. [Google Scholar] [CrossRef] [PubMed]
- Jin, Z.; Yue, R.; Ma, Z.; Cheng, S.; Khan, M.N.; Nie, L. Effect of water and nitrogen coupling on energy balance and production efficiency in rice production. Energy 2024, 288, 129739. [Google Scholar] [CrossRef]
- Shen, Y.; Li, S.; Shao, M. Effects of spatial coupling of water and fertilizer applications on root growth characteristics and water use of winter wheat. J. Plant Nutr. 2013, 36, 515–528. [Google Scholar] [CrossRef]
- Man, J.; Yu, J.; White, P.J.; Gu, S.; Zhang, Y.; Guo, Q.; Shi, Y.; Wang, D. Effects of supplemental irrigation with micro-sprinkling hoses on water distribution in soil and grain yield of winter wheat. Field Crops Res. 2014, 161, 26–37. [Google Scholar] [CrossRef]
- Sonko, E.; Tsado, D.N.; Yaffa, S.; Okhimamhe, A.A.; Eichie, J. Wet and Dry Season Effects on select soil nutrient contents of upland farms in North Bank region of the Gambia. Open J. Soil Sci. 2016, 6, 45. [Google Scholar] [CrossRef]
- Nozawa, S.; Hakoda, A.; Sakaida, K.; Suzuki, T.; Yasui, A. Method performance study of the determination of total nitrogen in soy sauce by the Kjeldahl method. Anal. Sci. 2005, 21, 1129–1132. [Google Scholar] [CrossRef]
- Ivanov, K.; Zaprjanova, P.; Petkova, M.; Stefanova, V.; Kmetov, V.; Georgieva, D.; Angelova, V. Comparison of inductively coupled plasma mass spectrometry and colorimetric determination of total and extractable phosphorus in soils. Spectrochim. Acta Part B At. Spectrosc. 2012, 71, 117–122. [Google Scholar] [CrossRef]
- Korda, T.M.; Petrova, N.I.; Beizel’, N.F.; Saprykin, A.I. Atomic-absorption spectrometric determination of catalytic components (Pd, Ti, and Cu) in mixtures based on phenol. J. Anal. Chem. 2008, 63, 151–156. [Google Scholar] [CrossRef]
- Song, S.-H.; Wen, Y.-J.; Zhang, J.-Y.; Wang, H. Rapid spectrophotometric measurement with a microplate reader for determining phosphorus in NaHCO3 soil extracts. Microchem. J. 2019, 146, 210–213. [Google Scholar] [CrossRef]
- Yang, E.; Zhao, X.; Qin, W.; Jiao, J.; Han, J.; Zhang, M. Temporal impacts of dryland-to-paddy conversion on soil quality in the typical black soil region of China: Establishing the minimum data set. Catena 2023, 231, 107303. [Google Scholar] [CrossRef]
- Ge, Y.; Wang, Q.; Wang, L.; Liu, W.; Liu, X.; Huang, Y.; Christie, P. Response of soil enzymes and microbial communities to root extracts of the alien Alternanthera philoxeroides. Arch. Agron. Soil Sci. 2018, 64, 708–717. [Google Scholar] [CrossRef]
- Yu, P.; Han, D.; Liu, S.; Wen, X.; Huang, Y.; Jia, H. Soil quality assessment under different land uses in an alpine grassland. Catena 2018, 171, 280–287. [Google Scholar] [CrossRef]
- Li, P.; Zhang, T.; Wang, X.; Yu, D. Development of biological soil quality indicator system for subtropical China. Soil Tillage Res. 2013, 126, 112–118. [Google Scholar] [CrossRef]
- Masto, R.E.; Chhonkar, P.K.; Singh, D.; Patra, A.K. Alternative soil quality indices for evaluating the effect of intensive crop**, fertilisation and manuring for 31 years in the semi-arid soils of India. Environ. Monit. Assess. 2008, 136, 419–435. [Google Scholar] [CrossRef]
- Guo, L.; Sun, Z.; Ouyang, Z.; Han, D.; Li, F. A comparison of soil quality evaluation methods for Fluvisol along the lower Yellow River. Catena 2017, 152, 135–143. [Google Scholar] [CrossRef]
- He, H.; Peng, M.; Lu, W.; Hou, Z.; Li, J. Commercial organic fertilizer substitution increases wheat yield by improving soil quality. Sci. Total Environ. 2022, 851, 158132. [Google Scholar] [CrossRef]
- Peng, M.; He, H.; Wang, Z.; Li, G.; Lv, X.; Pu, X.; Zhuang, L. Responses and comprehensive evaluation of growth characteristics of ephemeral plants in the desert–oasis ecotone to soil types. J. Environ. Manag. 2022, 316, 115288. [Google Scholar] [CrossRef]
- D’Hose, T.; Cougnon, M.; De Vliegher, A.; Vandecasteele, B.; Viaene, N.; Cornelis, W.; Van Bockstaele, E.; Reheul, D. The positive relationship between soil quality and crop production: A case study on the effect of farm compost application. Appl. Soil Ecol. 2014, 75, 189–198. [Google Scholar] [CrossRef]
- Yang, L.; Yang, Z.; Zhong, X.; Xu, C.; Lin, Y.; Fan, Y.; Wang, M.; Chen, G.; Yang, Y. Decreases in soil P availability are associated with soil organic P declines following forest conversion in subtropical China. Catena 2021, 205, 105459. [Google Scholar] [CrossRef]
- Vlek, P.L.G.; Kühne, R.F.; Denich, M. Nutrient resources for crop production in the tropics. Philos. Trans. R. Soc. London. Ser. B Biol. Sci. 1997, 352, 975–985. [Google Scholar] [CrossRef][Green Version]
- Shrivastav, P.; Prasad, M.; Singh, T.B.; Yadav, A.; Goyal, D.; Ali, A.; Dantu, P.K. Role of nutrients in plant growth and development. In Contaminants in Agriculture: Sources, Impacts and Management; Springer: Cham, Switzerland, 2020; pp. 43–59. [Google Scholar] [CrossRef]
- Bouwman, A.F.; Beusen, A.H.W.; Lassaletta, L.; van Apeldoorn, D.F.; van Grinsven, H.J.M.; Zhang, J.; van, M.K.I. Lessons from temporal and spatial patterns in global use of N and P fertilizer on cropland. Sci. Rep. 2017, 7, 40366. [Google Scholar] [CrossRef]
- Vejan, P.; Khadiran, T.; Abdullah, R.; Ahmad, N. Controlled release fertilizer: A review on developments, applications and potential in agriculture. J. Control. Release 2021, 339, 321–334. [Google Scholar] [CrossRef]
- Zhang, M.; Cheng, G.; Feng, H.; Sun, B.; Zhao, Y.; Chen, H.; Chen, J.; Dyck, M.; Wang, X.; Zhang, J.; et al. Effects of straw and biochar amendments on aggregate stability, soil organic carbon, and enzyme activities in the Loess Plateau, China. Environ. Sci. Pollut. Res. 2017, 24, 1–13. [Google Scholar] [CrossRef] [PubMed]
- Gou, Z.H.; Qin, Q.J.; Lv, J.; Che, X.S.; Luo, J.; Zhang, H.; Zhang, G.B. Effects of different water and fertilizer combinations on yield of purple cabbage and soil physical and chemical properties on plateau in summer. Agric. Res. Arid. Areas 2021, 39, 137–144. [Google Scholar]
- Biswas, T.; Kole, S.C. Soil organic matter and microbial role in plant productivity and soil fertility. In Advances in Soil Microbiology: Recent Trends and Future Prospects. Microorganisms for Sustainability; Springer: Singapore, 2017; Volume 4, pp. 219–238. [Google Scholar] [CrossRef]
- Ben-Noah, I.; Friedman, S.P. Review and evaluation of root respiration and of natural and agricultural processes of soil aeration. Vadose Zone J. 2018, 17, 1–47. [Google Scholar] [CrossRef]
- Lei, H.; Yu, J.; Zang, M.; Pan, H.; Liu, X.; Zhang, Z.; Du, J. Effects of water-fertilizer-air-coupling drip irrigation on soil health status: Soil aeration, enzyme activities and microbial biomass. Agronomy 2022, 12, 2674. [Google Scholar] [CrossRef]
- Wu, P.; Guo, Z.; Hua, K.; Wang, D. Long-term application of organic amendments changes heavy metals accumulation in wheat grains by affecting soil chemical properties and wheat yields. J. Soils Sediments 2023, 23, 2136–2147. [Google Scholar] [CrossRef]
- Badr, M.A.; El-Tohamy, W.A.; Zaghloul, A.M. Yield and water use efficiency of potato grown under different irrigation and nitrogen levels in an arid region. Agric. Water Manag. 2012, 110, 9–15. [Google Scholar] [CrossRef]
- Liu, S.; Lin, X.; Wang, W.; Zhang, B.; Wang, D. Supplemental irrigation increases grain yield, water productivity, and nitrogen utilization efficiency by improving nitrogen nutrition status in winter wheat. Agric. Water Manag. 2022, 264, 107505. [Google Scholar] [CrossRef]
- Si, Z.; Zain, M.; Mehmood, F.; Wang, G.; Gao, Y.; Duan, A. Effects of nitrogen application rate and irrigation regime on growth, yield, and water-nitrogen use efficiency of drip-irrigated winter wheat in the North China Plain. Agric. Water Manag. 2020, 231, 106002. [Google Scholar] [CrossRef]
- Hu, Y.; Zhang, F.; Javed, H.H.; Peng, X.; Chen, H.; Tang, W.; Lai, Y.; Wu, Y. Controlled-release nitrogen mixed with common nitrogen fertilizer can maintain high yield of rapeseed and improve nitrogen utilization efficiency. Plants 2023, 12, 4105. [Google Scholar] [CrossRef]
- Yi, Z.; Jeyakumar, P.; Yin, C.; Sun, H. Effects of biochar in combination with varied N inputs on grain yield, N uptake, NH3 volatilization, and N2O emission in paddy soil. Front. Microbiol. 2023, 14, 1174805. [Google Scholar] [CrossRef]
- Wang, N.; Zhan, J.; Feng, K.; Qi, J.; Nan, H. Higher yield sustainability and soil quality by reducing chemical fertilizer with organic fertilizer application under a single-cotton croping system. Front. Plant Sci. 2024, 15, 1494667. [Google Scholar] [CrossRef] [PubMed]
- Xu, J.; Wang, X.; Ding, Y.; Mu, Q.; Cai, H.; Ma, C.; Saddique, Q. Effects of irrigation and nitrogen fertilization management on crop yields and long-term dynamic characteristics of water and nitrogen transport at deep soil depths. Soil Tillage Res. 2020, 198, 104536. [Google Scholar] [CrossRef]
- Li, S.; Chen, Y.; Li, T.; Yu, F.; Zhang, Y.; Liu, K.; Zhang, H.; Gu, J.; Yang, J.; Liu, L. Alternate wetting and moderate soil drying irrigation counteracts the negative effects of lower nitrogen levels on rice yield. Plant Soil 2022, 481, 367–384. [Google Scholar] [CrossRef]
- Su, F.; Wu, J.; Wang, D.; Zhao, H.; Wang, Y.; He, X. Moisture movement, soil salt migration, and nitrogen transformation under different irrigation conditions: Field experimental research. Chemosphere 2022, 300, 134569. [Google Scholar] [CrossRef]
- Utobo, E.B.; Tewari, L. Soil enzymes as bioindicators of soil ecosystem status. Appl. Ecol. Environ. Res. 2015, 13, 147–169. [Google Scholar] [CrossRef]
- Nannipieri, P.; Trasar-Cepeda, C.; Dick, R.P. Soil enzyme activity: A brief history and biochemistry as a basis for appropriate interpretations and meta-analysis. Biol. Fertil. Soils 2018, 54, 11–19. [Google Scholar] [CrossRef]
- Sharma, S.; Sharma, N.; Gupta, N.; Angmo, P.; Siddiqui, M.H.; Rahman, A. Impact of chemically diverse organic residue amendment on soil enzymatic activities in a sandy loam soil. Agronomy 2023, 13, 1719. [Google Scholar] [CrossRef]
- Tfaij, A.L.; Al-Ansari, A.M.S.; Jaberi, M.M.A. Activity and Thermodynamic Parameters of Urease Enzymes in Soils Treated with Some Heavy Metals Under Different Temperatures and Moisture Levels. Basrah J. Agric. Sci. 2019, 32, 193–206. [Google Scholar] [CrossRef]
- Zhang, Y.; Cui, D.; Yang, H.; Kasim, N. Differences of soil enzyme activities and its influencing factors under different flooding conditions in Ili Valley, Xinjiang. PeerJ 2020, 8, e8531. [Google Scholar] [CrossRef]
- Hennion, N.; Durand, M.; Vriet, C.; Doidy, J.; Maurousset, L.; Lemoine, R.; Pourtau, N. Sugars en route to the roots. Transport, metabolism and storage within plant roots and towards microorganisms of the rhizosphere. Physiol. Plant. 2019, 165, 44–57. [Google Scholar] [CrossRef]
- Tang, B.; Xu, H.; Song, F.; Ge, H.; Chen, L.; Yue, S.; Yang, W. Effect of biochar on immobilization remediation of Cd⁃ contaminated soil and environmental quality. Environ. Res. 2022, 204, 111840. [Google Scholar] [CrossRef] [PubMed]
- Song, W.; Han, F.; Bao, Z.; Chai, Y.; Wang, L.; Huang, C.; Cheng, H.; Chang, L. Mulching practices improve soil moisture and enzyme activity in drylands, increasing potato yield. Agronomy 2024, 14, 1077. [Google Scholar] [CrossRef]
- Azene, B.; Zhu, R.; Pan, K.; Sun, X.; Nigussie, Y.; Gruba, P.; Raza, A.; Guadie, A.; Wu, X.; Zhang, L. Land use change alters phosphatase enzyme activity and phosphatase-harboring microbial abundance in the subalpine ecosystem of southeastern Qinghai-Tibet Plateau, China. Ecol. Indic. 2023, 153, 110416. [Google Scholar] [CrossRef]
- Basu, N.B.; Van Meter, K.J.; Byrnes, D.K.; Van Cappellen, P.; Brouwer, R.; Jacobsen, B.H.; Jarsjö, J.; Rudolph, D.L.; Cunha, M.C.; Nelson, N.; et al. Managing nitrogen legacies to accelerate water quality improvement. Nat. Geosci. 2022, 15, 97–105. [Google Scholar] [CrossRef]
- Khan, F.; Siddique, A.B.; Shabala, S.; Zhou, M.; Zhao, C. Phosphorus plays key roles in regulating plants’ physiological responses to abiotic stresses. Plants 2023, 12, 2861. [Google Scholar] [CrossRef]
- Yang, Y.; Zhang, S.; Wu, J.; Gao, C.; Lu, D.; Tang, D.W.S. Effect of longterm application of super absorbent polymer on soil structure, soil enzyme activity, photosynthetic characteristics, water and nitrogen use of winter wheat. Front. Plant Sci. 2022, 13, 998494. [Google Scholar] [CrossRef]
- Chen, Y.; Gong, M.; Liang, D.; Li, S.; Meng, D.; He, J.; Li, Y.; Kang, Z.; Li, H. Application of urea hydrogen peroxide: Degradation of glyphosate in soil and effect on ammonia nitrogen effectiveness and enzyme activity. J. Environ. Chem. Eng. 2023, 11, 110949. [Google Scholar] [CrossRef]
- Bélanger, G.; Walsh, J.R.; Richards, J.E.; Milburn, P.H.; Ziadi, N. Nitrogen fertilization and irrigation effects tuber characteristics of two potato cultivars. Am. J. Potato Res. 2002, 79, 269–279. [Google Scholar] [CrossRef]
- Ali, M.H.; Talukder, M.S.U. Increasing Water Productivity in Crop Production-A Synthesis. Agric. Water Manag. 2008, 95, 1201–1213. [Google Scholar] [CrossRef]
- Erdem, T.; Arın, L.; Erdem, Y.; Polat, S.; Deveci, M.; Okursoy, H.; Gültaş, H.T. Yield and quality response of drip irrigated broccoli (Brassica oleracea L. var. italica) under different irrigation regimes, nitrogen applications and cultivation periods. Agric. Water Manag. 2010, 97, 681–688. [Google Scholar] [CrossRef]
- Sun, Y.; Duan, L.; Zhong, H.; Cai, H.; Xu, J.; Li, Z. Effects of irrigation-fertilization-aeration coupling on yield and quality of greenhouse tomatoes. Agric. Water Manag. 2024, 299, 108893. [Google Scholar] [CrossRef]


Disclaimer/Publisher’s Note: The statements, opinions and data contained in all publications are solely those of the individual author(s) and contributor(s) and not of MDPI and/or the editor(s). MDPI and/or the editor(s) disclaim responsibility for any injury to people or property resulting from any ideas, methods, instructions or products referred to in the content. |
© 2025 by the authors. Licensee MDPI, Basel, Switzerland. This article is an open access article distributed under the terms and conditions of the Creative Commons Attribution (CC BY) license (https://creativecommons.org/licenses/by/4.0/).