Abstract
This study evaluated the growth characteristics and yield of rice under various water management strategies in an environmentally friendly paddy field in Korea from 2022 to 2024. The water management treatments included mid-season drainage (MD) lasting for 2, 3, or 4 weeks, followed by either low-level water management (maintaining a 4 cm water depth, denoted as “1”) or alternate wetting and drying irrigation (4 cm irrigation followed by drying, denoted as “2”) until harvest. The conventional treatment consisted of continuous flooding (CF). Treatments with poor yields (4MD1 and 4MD2) were discontinued in subsequent years. The rice cultivar Saecheongmu was transplanted in June, and water management began in July. Among the treatments, CF produced the highest number of mean panicles, whereas the 2MD2 treatment showed the most favorable yield components. The highest mean grain yield was recorded in 2MD2, with values of 5.85, 5.74-, and 5.38-tons ha−1 over the three years—representing a 7.8–15.0% increase compared to CF. Across all treatments, MD1 consistently produced higher yields than MD2. Water use was lowest in 2MD2, achieving a 61.8% reduction compared to CF. Overall, the 2MD2 treatment emerged as the most promising strategy, effectively reducing water use by 61.8% while maintaining high yields comparable to those under continuous flooding.
1. Introduction
Rice (Oryza sativa L.) is the crop that uses the most water in Asia, responsible for more than half of the region’s irrigation water [1]. Approximately 3000 L of water is required to produce 1 kg of rice, resulting in a water productivity index (WPI) of 0.3 kg grain/m3 water. Despite its high water consumption, rice demonstrates low water use efficiency [2]. Compounding this issue, climate change has triggered a global water crisis, marked by dwindling irrigation water supplies due to droughts, increased industrial demand, and water pollution [3]. Nevertheless, as a staple food in South Korea, rice cultivation occupies 50.2% (764,000 ha) of the total agricultural land [4], driving high demand for agricultural water. Recent climate-induced droughts and limited irrigation water supply forecast a looming agricultural water shortage [5], necessitating effective countermeasures.
Rice cultivation requires significant water for continuous flooding, and considerable water is lost to evaporation and soil permeability [6]. Freshwater is becoming increasingly scarce across many countries, posing considerable challenges to the productivity and sustainability of irrigation systems in paddy fields [2]. To tackle this challenge, it is crucial to enhance agricultural water use efficiency and develop intelligent water management technologies for paddy fields [7]. Research has focused on practices such as mid-season drainage during the effective rooting period of rice [8] and varying water levels during the growing season, rather than maintaining continuous flooding [9,10,11]. Furthermore, studies have investigated water management strategies to both mitigate crop damage from weather-related disasters and reduce water consumption while studying rice growth under these conditions [5,9,12,13].
During the early growth stages of rice and the meiosis stage, water stress can significantly impact yields [14,15]. Therefore, it is crucial to manage water carefully during these critical periods to prevent shortages. Although reductions in water usage were achieved through strategic water management during the rice growth period, yield reductions still occurred. To conserve water while minimizing yield losses, implementing effective water management practices is vital [16]. The alternate wetting and drying method reduced irrigation water usage by 13.0% compared to continuous flooding, increased yield by 22.9%, and enhanced water use efficiency by 41.6% [17].
Research has been conducted on various paddy water management methods, including extending the mid-season drainage period, to conserve agricultural water [18,19]. However, most studies focus on traditional agriculture that relies on chemical fertilizers and herbicides [18,20]. Recently, the adoption of environmentally friendly agricultural methods, designed to enhance productivity while preserving ecosystems, has gained attention due to the increasing focus on sustainability and environmental conservation [21]. Furthermore, products cultivated through environmentally friendly practices not only command higher market values but also offer the possibility of increased earnings through reduced input costs [22]. Although the number of farms adopting environmentally friendly practices has grown, comprehensive research on the growth characteristics, yield, and cultivation methods of rice under various paddy water management techniques in eco-friendly rice paddies has been limited. Consequently, this study seeks to identify an optimal water management strategy that reduces water consumption without compromising yield in an environmentally friendly rice cultivation system. A three-year study was conducted, using continuous flooding as the control method, with treatments focusing on mid-season drainage for 2, 3, and 4 weeks, low-level water management, and alternating water irrigation.
2. Materials and Methods
2.1. Experimental Design and Cultivation Methods
The experiment was conducted over three years, from 2022 to 2024, between May and October, at an environmentally friendly rice paddy located in Apgok-ri, Gungnyu-myeon, Uiryeong-gun, Gyeongsangnam-do (35.4336866N, 128.2652065E). The field had been treated with Multi Power Gold (Farmfriend, Geumga-myeon, Republic of Korea) organic fertilizer at a rate of 90 kg N ha−1 for the past decade. This fertilizer has an N-P-K composition of 12-3-6% (w/w), an organic matter content of 73.4% (w/w), and a carbon content of 50.2% (w/w), resulting in a carbon-to-nitrogen ratio (C/N) of approximately 4.2. During this period, winter crops such as barley were cultivated. Before sowing barley, 600 kg ha−1 of Multi Power Gold was applied. The soil was a loamy type with good drainage, and the chemical characteristics of the soil at the experimental site are shown in Table 1, Table 2 and Table 3. Prior to selecting the experimental field, soil chemistry and drainage conditions were assessed, selecting fields with a variance of less than 5%. The experiment was organized using a single-factor design, with each plot covering an area of over 400 m2 and three replications. To minimize errors, management practices across plots were standardized.

Table 1.
Soil chemical properties after the experiment on diurnal variation in methane emissions influenced by water management treatments in rice cultivation (2022).
Table 2.
Soil chemical properties after the experiment on diurnal variation in methane emissions influenced by water management treatments in rice cultivation (2023).
Table 3.
Soil chemical properties after the experiment on diurnal variation in methane emissions influenced by water management treatments in rice cultivation (2024).
The organic fertilizer used in this experiment was applied at a rate of 1200 kg ha−1 on 29 May 2022, 27 May 2023, and 29 May 2024, using a tractor-mounted fertilizer spreader (CH-600J, Cheong Song, Republic of Korea). It was incorporated into the soil with a rotary tiller. Before transplanting, the paddy fields were flooded to a depth of 5 cm on 30 May 2022, 5 June 2023, and 4 June 2024. The water level was then maintained at 5 to 7 cm until the mid-season drainage treatment.
2.2. Water Management Treatments
The water management treatments for 2022 were set as follows: ① Mid-season drainage for 2 weeks + low-level water management (2MD-1), ② Mid-season drainage for 2 weeks + alternate water irrigation (2MD-2), ③ Mid-season drainage for 3 weeks + low-level water management (3MD-1), ④ Mid-season drainage for 4 weeks + low-level water management (4MD-1), ⑤ Mid-season drainage for 4 weeks + alternate water irrigation (4MD-2), and ⑥ continuous flooding (CF). Following a yield evaluation in 2022, the 4MD-2 treatment, deemed impractical for farm use, was excluded. In its place, a new treatment was introduced: 3-week mid-season drainage with alternate water irrigation (3MD-2). The CF treatment remained unchanged, with two repetitions, leading to the following treatments: ① 2MD-1, ② 2MD-2, ③ 3MD-1, ④ 3MD-2, ⑤ 4MD-1, and ⑥ CF. In 2024, following the yield evaluation in 2023, the treatment with the lowest yield, 4MD-1, was excluded. The following treatments were adopted: ① 2MD-1, ② 2MD-2, ③ 3MD-1, ④ 3MD-2, and ⑤ CF (Table 4).
Table 4.
Mid-season drainage schedule and water management treatments (2022–2024).
Mid-season drainage treatment commenced on 13 July 2022, and was repeated on 8 July 2023, and 8 July 2024, prior to the average number of tillers per plant surpassing 15 and non-productive tillers emerging. Following mid-season drainage, irrigation for 2MD-1 and 2MD-2 was implemented on 27 July 2022 and 22 July 2023, respectively, as well as on 22 July 2024. Irrigation for 3MD-1 and 3MD-2 occurred on 3 August 2022 and 3 August 2023, respectively. Irrigation for 3MD-2 also occurred on July 29, 2024. The irrigation for 4MD-1 and 4MD-2 was conducted on 10 August 2022 and 2023 (Table 1). These irrigation treatments were executed using the JINONG Inc. app (JINONG Inc., Gwangju, Republic of Korea; version 1.0.19), synchronized with the Rural Development Administration. This system enabled the automated opening and closing of water gates via a video-controlled water gate system (TSWV-125ACF, Seoul, Republic of Korea) and a water level sensor (TSHD-UDWG, Seoul, Republic of Korea). Automatic irrigation was executed based on predetermined water levels for each water management treatment.
The low-level water management strategy entailed opening the automated water gate and calibrating the sensor to maintain a water level of 4 cm in the experimental field until complete drainage was achieved. Following mid-season drainage, alternate water irrigation treatment was initiated. From the commencement of irrigation to full drainage, the automated water gate was opened at weekly intervals, setting the sensor to 4 cm to sustain a water depth of 4 cm in the experimental field, whereupon the water gate was closed, allowing the field to dry naturally until the water level declined to below 0 cm. Water utilization was quantified by the volume applied to reach the specified depth, including both effective rainfall and irrigation. Complete drainage was executed post-ripening stage on 29 September 2022, 5 October 2023, and 25 September 2024, respectively. Harvesting of rice was performed using a combine (HJ6115, TYM, Gimhae, Republic of Korea) on 10 October 2022, 15 October 2023, and 5 October 2024.
2.3. Growth and Yield Parameter
2.3.1. Rice Growth
To investigate the growth characteristics and yield of rice across various water management methods, surveys were conducted three times in each plot, involving 20 plants per repetition, during the ineffective tillering stage, flowering stage, and just before harvest. In 2022, the surveys took place on July 13, August 27, and October 18; in 2023, on July 11, August 22, and October 10; and in 2024, on July 11, August 26, and October 5. Measurements of plant height, tiller number, and leaf color were recorded.
The measurement of plant height was taken from the soil surface to the tip of the longest leaf. Tiller number was counted, excluding the main stem, and was based on the number of tillers that had at least two leaves. Leaf color was assessed using a SPAD-502 (Konica Minolta, Osaka, Japan). The second fully developed leaf was evaluated at the two-thirds point of its length. Three measurements were taken, and the average was used to determine the value for each survey. All surveys adhered to the Agricultural Science and Technology Research and Analysis Standards [23].
2.3.2. Rice Yield Components and Yield
In the yield component survey, the number of panicles per plant was investigated using 20 plants per plot across 3 repetitions. The number of grains per panicle was manually threshed and counted using a seed counter (DC-1, OGAWA SEIKI, Tokyo, Japan) for 5 plants per plot with 3 repetitions each. The ripening rate was assessed by threshing 3 samples per plot, repeated 3 times, and sorting the grains based on a specific gravity of 1.03. Subsequently, the percentage of mature grains was calculated as a proportion of the total number of grains. The thousand-grain weight was determined by threshing 3 samples per plot, with each repeated 3 times, and weighing 1000 grains. For the yield measurement, rice from a 2 × 2 m area was harvested using a sickle, threshed using a thresher (BHD-1500, Buheng, Republic of Korea), and then separated into clean rice and empty grains. From each plot, 1 kg of clean rice was milled in three repetitions using a portable milling machine (BH-06, SSANGYONG, Seoul, Republic of Korea), with husks and broken grains removed. The final brown rice yield was calculated based on the yield per unit area, with moisture content standardized to 15%. These surveys on yield components and yield were conducted in accordance with the Agricultural Science and Technology Research and Analysis Standards [23].
2.3.3. Soil Chemistry and Moisture Content
Soil samples were collected using an auger (Ø 50.8 mm, Eijkelkamp, Giesbeek, The Netherlands), with each treatment undergoing three repetitions. Samples from six different points within each repetition were combined for analysis according to the Soil and Plant Analysis Methods of the Rural Development Administration [24].
Soil moisture content was measured at a depth of 10 cm around the chamber using a Teros12 sensor (METER, Pullman, WA, USA). Data were transmitted via the ZSC data receiver module (METER, USA) and processed using the ZENTRA Utility app (METER Group, Inc., Pullman, WA, USA; version 2.17.051, Sensor v.14.8.2025), with measurements repeated three times per treatment.
2.4. Statistical Analysis
Data were analyzed using the PROC ANOVA procedure in SAS software (V.9.4, Cary, NC, USA), with means compared at a 5% significance level via Duncan’s Multiple Range Test (DMRT). Additionally, to evaluate the effects of year and treatment on yield and its components, a two-way analysis of variance (two-way ANOVA) was performed using R software (version 4.0.5) [25]. The analysis, including the interaction effect (year × treatment), was carried out using the aov() function. Type II ANOVA was conducted with the Anova() function from the car package to obtain F-values and p-values. Significance levels were set at 0.05, 0.01, and 0.001. When significant differences among treatments were detected, multiple comparisons were performed using Tukey’s Honest Significant Difference (Tukey HSD) test implemented in the agricolae package.
We acknowledge that changes in treatments across years limit the interpretation of Year × Treatment interactions. Thus, the two-way ANOVA was used to evaluate treatment effects within each year, avoiding overgeneralization.
3. Results and Discussion
The experiment aimed to evaluate the growth and yield characteristics of rice under various water management techniques in an environmentally friendly paddy field. Initially, climate characteristics showed that the daily average temperature in June during the early growth stages was 2.06 °C higher in 2023 and 5.07 °C higher in 2024 compared to 2022. From the heading to the ripening stage, the temperature rose by 2.74 °C in 2023 and by 4.81 °C in 2024 relative to 2022 (Figure 1A). During the ripening stage, temperatures in 2024 were, on average, 2.09 °C higher than in 2023 and 4.65 °C higher than in 2022. The accumulated temperature from transplanting to harvest was 3086 °C in 2022, increasing to 3155 °C in 2023 (69.0 °C increase) and 3191 °C in 2024 (105 °C increase over 2022; 36 °C over 2023).
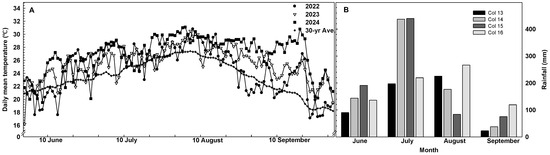
Figure 1.
Daily Mean Air Temperature (A) and Monthly Total Rainfall (B) in Rice Cultivation Fields (2022–2024). 30-yr Ave.: Normal Temperature and Rainfall (1991–2020).
During 2022 and 2023, the highest monthly total rainfall occurred from July to August, within the mid-drainage period. In contrast, in 2024, the peak occurred in September (Figure 1B). Over the three-year period, rainfall during this time exceeded the average annual rainfall, primarily due to the monsoon season. Nonetheless, through effective maintenance of drainage channels, proper drainage was maintained in the experimental plots, upholding the mid-drainage effect.
Soil chemical analyses were conducted before and after each cropping season. Prior to the 2022 experiment, the OM in the soil’s chemical characteristics ranged from 20.9 g kg−1 to 28.9 g kg−1 (Table 1). Following the experiment, the pH values of 2022 increased from prior levels, ranging between 5.23 and 5.90, whereas OM decreased to between 22.3 and 29.3 g kg−1 in the CF and 2MD treatments. In 2023, OM levels were observed to range from 21.7 to 28.7 g kg−1 (Table 2). By 2024, there was a reduction in T-C after the experiment compared to before, and OM levels in some treatments showed a tendency to decline post-experiment relative to pre-experiment levels (Table 3). No consistent trends were observed across all water management treatments over the three-year period.
The soil moisture content in 2022 ranged from 42.0% to 53.9% prior to the mid-season drainage treatment. The 2MD treatment did not show a significant decrease due to the rainy season; however, the 3MD-1, 4MD-1, and 4MD-2 treatments demonstrated a maximum reduction of 43.1% compared to CF on July 13 (Figure 2A). The alternate water irrigation treatment varied between 30.7% and 39.2% (excluding rainy days), indicating effective water management implementation. In 2023, the soil moisture content ranged from 43.9% to 51.4% until July 13 and then began to decline from July 28 (Figure 2B). The lowest value was 27.7% under the 3MD-2 non-irrigation condition, while 2MD exhibited no significant reduction during this period despite the rainy season. However, just before concluding the 3-week mid-season drainage, on August 1, the moisture content for 3MD-1, 3MD-2, and 4MD-1 fluctuated between 31.0% and 35.7%. Subsequently, 4MD-1 decreased to between 32.6% and 34.0%, reflecting the effectiveness of the mid-season drainage treatment. The alternate water irrigation treatment displayed lower moisture levels than the low-level water management treatment during the same period. In 2024, the soil moisture content ranged from 42.2% to 47.6% prior to the mid-season drainage treatment. Following the treatment, the 2MD decreased to below 38.1%, excluding the rainy day of July 12. For 3MD, the moisture content reduced to below 39.4%, omitting July 12 and July 19 (Figure 2C). The alternate water irrigation treatment decreased to between 35.1% and 39.8%, excluding rainfall impacts, showing consistently lower moisture than the low-level water management treatment. Over three years, in all water management treatments, soil moisture content decreased with mid-season drainage compared to continuous flooding. The alternate water irrigation treatment generally exhibited lower moisture levels than the low-level water management treatment.
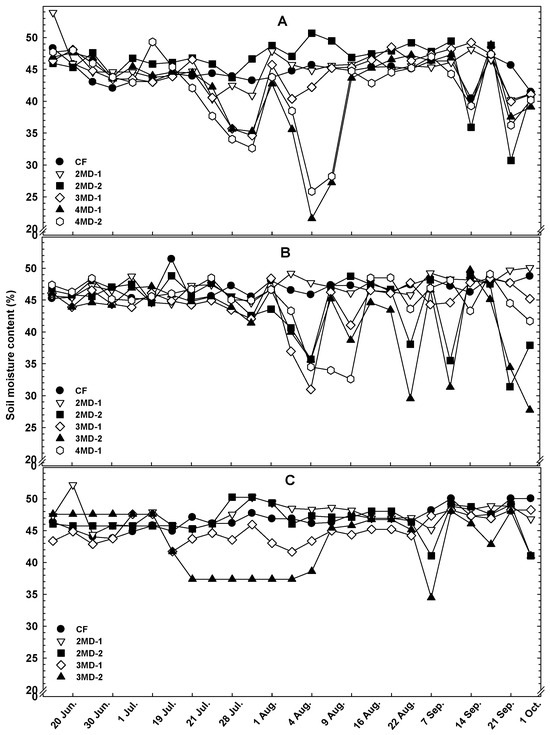
Figure 2.
Change in soil moisture contents by water management treatments (2022, (A); 2023, (B); 2024, (C)). CF, continuously flooded; MD, mid-season drainage (2, 3, 4 weeks); MD-1, low-level water management; MD-2, alternate water irrigation.
Water management practices such as mid-season drainage, low-level water management, and alternate water irrigation are effective not only in regulating soil moisture but also in creating aerobic conditions during drainage periods. These changes in soil redox potential can suppress the activity of methanogenic archaea, thereby contributing to reduced methane (CH4) emissions [26,27,28]. In the evaluation of daily methane emissions, the average daily methane emission was reduced by 31.3% to 71.8% through these water management practices. Methane emissions decreased as the duration of mid-season drainage increased, and alternate wetting and drying resulted in lower emissions compared to shallow intermittent irrigation [29]. The research team is currently conducting further studies on greenhouse gas emissions related to these water management methods. Although this study does not present direct measurements of greenhouse gas emissions, the application of mid-season drainage and alternate water irrigation offers significant environmental benefits by mitigating methane emissions, which is considered a sustainable rice cultivation practice.
In August 2022, during the heading stage after the mid-season drainage treatment, the plant height of rice subjected to different water management methods was measured. The tallest plant, recorded in the 2MD-1 treatment, reached 104 cm (Figure 3). Conversely, 4MD-1 and 4MD-2 measures showed the shortest heights at 84 cm and 87 cm, respectively, being 16.0% and 13.0% shorter than CF, and 19.2% and 16.3% shorter than 2MD-1. It was observed that plant heights under the alternate water irrigation treatment were shorter than those under the low-level water management treatment. By 2023, the tallest plant was in the 4MD-1 treatment at 88.0 cm, with 3MD-1 being the shortest at 80.1 cm. In 2024, the tallest plants were under the CF treatment, at 91.4 cm. In contrast, 2MD-2 and 3MD-2 were the shortest, standing at 88.1 cm and 82.8 cm, respectively, which are 3.30 cm and 8.60 cm shorter than the CF treatment. As mentioned earlier, the plant heights were generally lower in the alternate water irrigation treatment when compared to the low-level water management treatment. Over the course of three years, though plant heights varied by treatment, no consistent trends were discernible, suggesting that variations in water management had no significant effect on plant height. This conclusion is consistent with research indicating that deep-water irrigation has a minimal influence on plant height [30] and that flooding depth has no correlation with either plant height or panicle length [5]. Furthermore, a study on the effects of extending the mid-season drainage period on rice found no significant changes in panicle length, except during the fourth week [31], which reflects similar trends. However, other physiological responses or stress indicators not reflected in plant height could vary with different water management practices. Additionally, factors like environmental conditions or cultivar traits may also affect plant growth. Further studies over a longer period and with various cultivars are needed to fully understand the impacts of water management strategies.
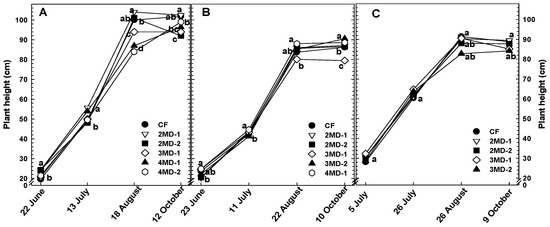
Figure 3.
Plant height of rice (measured from June to August as plant length and the sum of culm and panicle length in October) was influenced by various water management treatments between 2022 and 2024. (A): 2022; (B): 2023; (C): 2024. CF denotes continuously flooded conditions, whereas MD represents mid-season drainage (2, 3, 4 weeks), with MD-1 indicating low-level water management, and MD-2 indicating alternate water irrigation. Different letters signify significant differences (DMRT, p < 0.05).
The number of tillers per rice plant under different water management methods was assessed in August, during the heading stage, following the application of various treatments. In 2022, the CF treatment produced the most tillers, at 22.5, whereas 3MD-1 had the fewest, at 19.6 (Figure 4). In 2023, CF had the highest number, at 20.8, while 2MD-2 had the lowest, at 18.0. In 2024, CF had the highest number of tillers, at 23.2, whereas other water management treatments ranged from 17.1 to 17.5. Accordingly, the water management method significantly affects the number of tillers, corroborating studies that suggest mid-season drainage results in a higher tiller count compared to continuous flooding in eco-friendly rice systems. This effect of mid-season drainage on rice growth has been documented [21]. Additionally, tiller formation correlates with soil moisture levels [5]. Mid-season drainage mitigates the leaching of harmful substances in soils that are flooded, thereby enhancing root vitality and facilitating the conversion of ammonia nitrogen into nitrate nitrogen. This modification helps to curb excessive nitrogen absorption and decreases the formation of ineffective tillers [31,32,33]. Such results are deemed effective in preventing lodging, improving light interception by leaves, and promoting better aeration, all of which contribute to the diminished incidence of pests and diseases. Consequently, these adjustments are likely to improve the overall quality of the rice.
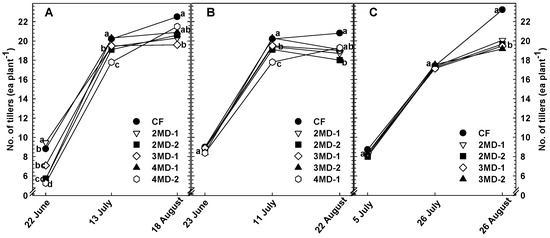
Figure 4.
Changes in the number of tillers of rice as affected by water management treatments (2022–2024). (A): 2022; (B): 2023; (C): 2024. CF, continuously flooded; MD, mid-season drainage (2, 3, 4 weeks); MD-1, low-level water management; MD-2, alternate water irrigation. Different letters indicate significant differences (DMRT, p < 0.05).
The leaf color (SPAD) values under different water management treatments did not exhibit significant differences throughout the three-year study (Figure 5). On 13 July 2022, both CF and 2MD-1 had the highest SPAD values of 44.3 and 44.5, respectively. By August 27, these values ranged between 37.9 and 39.0, without significant variation across the treatments. In 2023, the highest SPAD value was recorded for 4MD-1 on August 22, at 42.2. In 2024, CF displayed the highest SPAD value on October 5, yet no significant differences were observed on other sampling dates. Im et al. [31] found consistent SPAD values during the 2nd and 3rd weeks of the 2–5 week mid-season drainage treatments, aligning with this study’s findings. However, they noted a significant decline during the 4th week (with fatal outcomes in the 5th week), contrasting with this study’s results. This discrepancy could stem from variations in cultivation practices, such as differences in fertilization rates and timing. Moreover, this study involved a single measurement during the mid-season drainage treatment, which limited the accuracy of the findings relating to the mid-season drainage effects on leaf color. Further research should concentrate on the precise timing of mid-season drainage to enhance understanding.
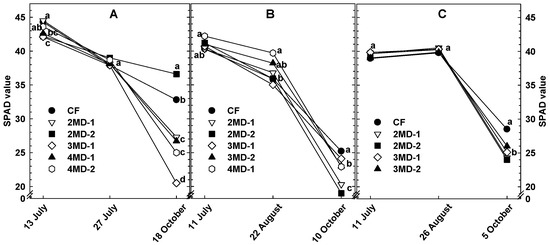
Figure 5.
Changes in SPAD values of rice under various water management treatments (2022–2024). (A): 2022; (B): 2023; (C): 2024. CF denotes continuous flooding; MD represents mid-season drainage (2, 3, 4 weeks); MD-1 indicates low-level water management; MD-2 refers to alternate water irrigation. Distinct letters denote significant differences (DMRT, p < 0.05).
In the investigation of yield components, the number of panicles was highest in the CF treatment in both 2022 and 2023, recording 22.1 and 22.6, respectively. However, in 2024, no significant differences were observed among the water management treatments (Table 5). While significant differences were absent between the water management treatments in 2022 and 2024 (except for CF in 2022), in 2023, the number of panicles followed the order: 2MD > 3MD > 4MD. Thus, as the mid-season drainage period was extended, the number of panicles decreased. This implies that inadequate nutrient and water absorption during the mid-season drainage period suppressed the growth of ineffective tillers across all water management treatments [31,32,33]. Consequently, the number of panicles formed from effective tillers during the flowering period increased. In contrast, CF maintained tillering during the ineffective tillering phase, which likely contributed to the higher number of panicles observed in this treatment. These findings underscore the need for further research to investigate the impact of water management practices and fertilization levels on nutrient distribution within different parts of the rice plant at various growth stages, as well as their influence on yield components and overall yield.
Table 5.
Yield components of rice under different water management treatments (2022–2024).
In 2022, the highest number of grains per panicle was recorded in 2MD-1 and 2MD-2, with 89.9 and 91.1 grains/panicle, respectively; these values were 8.56% and 7.34% higher compared to CF. In 2023, 2MD-2 achieved the highest yield with 90.0 grains/panicle, representing a 2.00% increase over CF. In 2024, 2MD-2 once again had the highest count at 85.7 grains/panicle, which was 16.0% higher than CF. Over the three years, 2MD-2 consistently recorded the highest numbers. Thus, water management practices impacted grain numbers per panicle, with amounts declining as the mid-season drainage period increased. Rice plants require the most nitrogen during their reproductive growth phase, particularly during the panicle differentiation period [34,35]. In this study, mid-season drainage occurred from July 20 to July 30, which coincided with the projected period for panicle differentiation. The lack of sufficient nutrients, such as nitrogen, during this crucial phase likely had an adverse effect on panicle and floret development, resulting in fewer grains per panicle. Previous research has shown that applying nitrogen fertilizer increases grain yields [36,37,38]. Conversely, Choi et al. [5] observed no variance in grain numbers depending on water depth, and Im et al. [31] discovered that during a large pot experiment, the lowest grain numbers occurred in the 4th week of extended mid-season drainage, with no significant changes subsequently. These observations contrast with our current findings and could be attributed to variations in soil characteristics, drainage, and nutrient retention capability.
In 2022, thousand-grain weights ranged from 21.9 to 23.0 g, from 20.9 to 22.9 g in 2023, and from 20.3 to 21.1 g in 2024, with no notable differences among water management treatments. The ripening rate in 2022 was highest for 2MD and 3MD, ranging from 89.9% to 90.4%, which was 5.69% higher than CF. The lowest ripening rate was noted in 4MD-1 at 80.3%. In 2023, 2MD-2 recorded the highest ripening rate at 89.6%, while CF had the lowest, a difference of 5.50%. In 2024, 2MD-1 had the highest ripening rate at 81.3%, with CF showing the lowest at 71.5%.
Over the three-year analysis period of yield components, both the number of grains per panicle and the ripening rate decreased as the duration of the mid-season drainage period increased. Furthermore, these components exhibited higher values in the water management treatments compared to CF, suggesting that water management practices significantly influence yield components. The 2MD-2 treatment, which displayed the highest number of grains per panicle, thousand-grain weight, and ripening rate, emerged as the most effective water management strategy for enhancing yield components. However, the mid-season drainage period coincides with the transition from the vegetative to the reproductive growth phase and overlaps with the rainy season, presenting potential challenges for water management. Consequently, it is crucial to conduct further research on water management methods, considering drainage classifications, soil types, and climate zones, to provide essential data for stable rice production in the face of climate change.
The annual yield variations by water management method are depicted in Figure 6. In 2022, 2MD-2 achieved the highest yield at 5.85 ton ha−1, which was 15.0% higher than CF. No significant differences were observed between the CF, 4MD-1, and 4MD-2 treatments. In response to the results from 2022, 4MD-2—which yielded poorly and was deemed unsuitable for agricultural use—was excluded from the 2023 experiment. To delineate the efficacy between low-level water management and alternate water irrigation, the 3MD-2 treatment was included in the 2023 study. The yield hierarchy in 2023 was 2MD-2 > 2MD-1 > 3MD-2 > 3MD-1 > CF > 4MD-1, with 2MD-2 yielding 5.74 ton ha−1, marking a 14.5% increase over CF. The 4MD-1 treatment, which performed the poorest in 2023, was excluded in 2024, leading to 2MD-2 again achieving the highest yield at 5.38 ton ha−1, 8.47% higher than continuous flooding (4.96 ton ha−1). The yield for 2MD-1 was the second highest, with no significant differences seen among 3MD-1, 3MD-2, and CF.
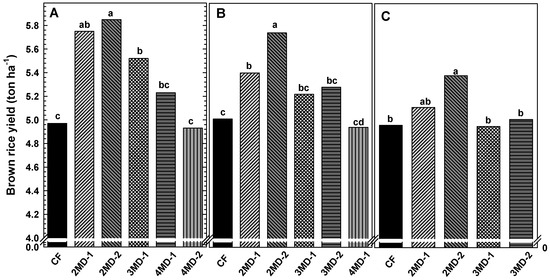
Figure 6.
Changes in brown rice yield as affected by water management treatments (2022–2024). (A): 2022; (B): 2023; (C): 2024. CF, continuously flooded; MD, mid-season drainage (2, 3, 4 weeks); MD-1, low-level water management; MD-2, alternate water irrigation. Different letters indicate significant differences (DMRT, p < 0.05).
Over the three years, 2MD-2 yielded the highest results, with alternate water irrigation leading to a yield increase of 1.19–5.90% compared to low-level water management. Throughout this period, all water management treatments, barring 4MD, resulted in yields that were equal to or surpassed those under CF. This enhancement is attributed to an increase in root growth, a higher ratio of deep-rooted distribution [39], enhanced main root and root length [40], and deeper root penetration into the soil, reaching 27 cm at maturity, which is deeper than that observed in CF [5]. Such improvements in root vitality likely influenced the rice yields during the ripening phase following mid-season drainage. However, yields in 4MD were comparable to or lower than those in CF, likely due to the extended mid-season drainage, which caused soil desiccation, induced stress, and led to declines in panicle number, grain number per panicle, and ripening rate (Table 5), consequently reducing yield. This pattern aligns with the findings of Im et al. [31], who reported that prolonged dry stress during the vegetative growth stage decreased panicle and grain numbers per panicle, as well as the ripening rate, ultimately resulting in diminished yields.
In environmentally friendly rice cultivation, mid-season drainage treatments have been shown to increase yields compared to continuous flooding [21]. In the rice–wheat cropping system of India, yields were higher with Saturated Soil Culture (SSC) irrigation [41]. Similar increases were noted, with yield improvements of 13.8% and 11.3% under simple irrigation and SRI water management, respectively, compared to continuous flooding [9]. When mid-season drainage ranged from 2 to 5 weeks, starting around 20 to 25 days post-rice transplanting (mid-July), significant stress was observed during the 2-week drainage phase; however, this did not impede growth. Prolonged mid-season drainage, on the other hand, might impair reproductive growth, such as fertilization [31]. Therefore, the most effective water management strategy for environmentally friendly rice cultivation appears to be 2-week mid-season drainage followed by weekly alternate water irrigation, which may potentially increase yields.
Two-way analysis of variance (ANOVA) results for yield components and yield by year and water management treatment (Table 6): The interaction between year and water management treatment was not significant for any of the measured variables, indicating that the effect of water management treatment was consistent across years. This suggests that water management had a stable and reproducible influence on yield and its components throughout the three-year experimental period.
Table 6.
ANOVA results for yield components and yield under year and water management treatments in rice cultivation.
Although the number of panicles per plant did not differ significantly by year (ns, F = 1.00, p = 0.375), other components, such as the number of grains per panicle, thousand-grain weight, and ripening percentage, showed highly significant differences (p < 0.001). Regarding water management treatments, significant differences were observed in the number of panicles per plant (), number of grains per panicle (), thousand-grain weight (), and ripening percentage (*). For grain yield, both year (*, p = 0.079) and water management treatment (*, p < 0.001) ** showed significant effects, indicating that environmental variation and management practices both influenced yield outcomes.
The average yield in 2022 was 2.26% higher than in 2023 and 4.29% higher than in 2024. Yield components, including the number of panicles and grains per panicle, were generally higher in 2023 compared to 2022, but decreased or remained stable in 2024. In contrast, thousand-grain weight and ripening percentage were higher in 2022 (Table 4, Figure 6).
These patterns may be explained by temperature variations. The average daily temperature during the effective tillering stage (early July) in 2023 was higher than in 2022, which may have contributed to the increased number of panicles and grains per panicle. However, elevated temperatures during the ripening period in both 2023 and 2024 likely increased respiration rates, thereby reducing yield potential [42].
Temperature is a crucial climatic factor that influences crop growth. As temperatures rise, respiration increases, reducing the net assimilation of carbohydrates. Studies have shown that high temperatures shorten the ripening period and reduce the grain filling rate [42,43], with similar trends observed in rice yield and its components [44].
The results of irrigation water usage by water management method revealed the following hierarchy of water usage: CF > 2MD-1 > 3MD-1 > 4MD-1 > 2MD-2 > 3MD-2 > 4MD-2 (Figure 7). CF, representing continuous flooding, registered the highest water usage at 304 mm, while 4MD-2, with the lowest, marked a 64.5% reduction in water usage compared to CF. Treatment 2MD-2, which yielded the highest amount, reduced water usage by 61.8% compared to CF. As the duration of mid-season drainage increased, there was a corresponding decrease in water usage, with low-level water management consuming, on average, 26.4% less water than alternate water irrigation. The substantial water usage in continuous flooding, as noted, is not required for raising rice yield [45,46], and it has been documented that flooded conditions are essential only during the establishment and flowering stages [47]. Moreover, research has indicated that during the rice growing phase, employing simple irrigation with two periods of drainage and SRI treatments involving 1~2 cm of standing water followed by natural evaporation led to reductions in agricultural water usage by 15.2% (simple irrigation) and 47.4% (SRI) compared to continuous flooding [9]. This study confirms similar trends. Thus, the efficacy of employing low-level water management and alternate water irrigation to reduce agricultural water usage is clear, as CF consumes over twice the average amount of water. Consequently, mid-season drainage, low-level water management, and alternate water irrigation techniques in rice cultivation may serve as viable strategies to mitigate global warming and address future water scarcities.
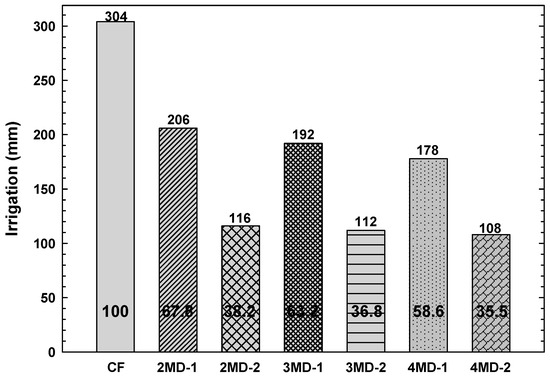
Figure 7.
Amount of water irrigation (+effective rainfall) as influenced by water management treatments (2022–2024). CF, continuously flooded; MD, mid-season drainage (2, 3, 4 weeks); MD-1, low-level water management; MD-2, alternate water irrigation.
4. Conclusions
This study aimed to assess the growth characteristics and yield of rice subjected to various water management strategies within an eco-friendly rice paddy in Apgok-ri, Gungnyu-myeon, Uiryeong-gun, from 2022 to 2024. The water management treatments included: mid-season drainage for 2 weeks followed by low-level water management (2MD-1), mid-season drainage for 2 weeks followed by alternate water irrigation (2MD-2), mid-season drainage for 3 weeks followed by low-level water management (3MD-1), mid-season drainage for 3 weeks followed by alternate water irrigation (3MD-2), mid-season drainage for 4 weeks followed by low-level water management (4MD-1), mid-season drainage for 4 weeks followed by alternate water irrigation (4MD-2), and constant flooding (CF). The Saechongmu variety was cultivated, utilizing 90 kg N ha−1 of organic fertilizer as the basal dressing. Rice was machine-transplanted on June 9–10 at a spacing of 30 × 20 cm. Water management interventions commenced on 13 July 2022, on 8 July 2023, and on 8 July 2024. Mid-season drainage lasted for 2, 3, and 4 weeks, followed by respective irrigation measures. Low-level water management maintained a depth of 4 cm, whereas alternate water irrigation alternated between watering to a depth of 4 cm for one week and allowing natural drying.
No significant differences were observed in plant height or SPAD values due to varying water management practices. The number of panicles per plant was higher in the CF treatment, with counts of 22.5, 20.8, and 23.2 in August of 2022, 2023, and 2024, respectively. Yield components such as the number of grains per panicle peaked in 2MD-2, with 91.1, 90.0, and 85.7 grains, respectively. The highest ripening percentages were also noted in 2MD-2 across the three years, with values of 90.2%, 89.6%, and 81.3%. No significant variation was found in the thousand-grain weight. In terms of yield, the hierarchy was observed as follows: 2MD-2 > 2MD-1 > 3MD-2 > 3MD-1 > CF ≥ 4MD-2 > 4MD-1. The highest yields came from 2MD-2—with 5.85, 5.74, and 5.38 ton ha−1 in 2022, 2023, and 2024, respectively—demonstrating increases of 15.0%, 14.5%, and 7.8% compared to CF. Low-level water management consistently yielded 1.19–5.90% more than alternate water irrigation over the years. The highest Water consumption was recorded in the CF treatment at 304 mm, while the 2MD-2 treatment reduced water usage by 61.8% compared to the CF treatment. Increased duration of mid-season drainage correspondingly reduced water usage by up to 64.5% compared to CF.
In conclusion, although the experimental design included variations in treatments across years, the water management strategy involving mid-season drainage for 2 weeks followed by alternate water irrigation (2MD-2) demonstrated consistent performance during the applied periods, with yield increases ranging from 7.8% to 15.0% and water use reductions exceeding 60% compared to continuous flooding.
These results demonstrate that 2MD-2 contributes not only to water conservation but also to stable yield increases, suggesting it as a promising and efficient cultivation strategy for sustainable rice production under real-world field conditions.
Therefore, 2MD-2 can be regarded as an effective and practical water management method in eco-friendly rice farming systems, though further research with balanced, multi-year experimental designs is needed to confirm its optimality among other methods.
Author Contributions
Conceptualization, Y.-S.C. and S.O.; methodology, Y.-S.C.; validation, Y.-S.C. and S.O.; formal analysis, S.O.; investigation, S.O.; resources, Y.-S.C.; data curation, S.O.; writing—original draft preparation, S.O.; writing—review and editing, Y.-S.C. and S.O.; visualization, S.O.; supervision, Y.-S.C.; project administration, Y.-S.C.; funding acquisition, Y.-S.C. All authors have read and agreed to the published version of the manuscript.
Funding
This research was funded by the Ministry of Agriculture, Food and Rural Affairs (MAFRA), grant number B0080514001781. The APC was partially supported by Gyeongsang National University. Additional financial support for the APC was provided by the Glocal Project Group, and Industry–University Cooperation Foundation of Gyeongsang National University, with the remaining costs borne by the authors.
Data Availability Statement
The datasets generated and analyzed during this study are not publicly available due to restrictions imposed by the funding agency, but can be accessed from the corresponding author upon reasonable request and with approval from the funding agency.
Conflicts of Interest
The authors declare no conflicts of interest.
References
- Akinbile, C.; El-Lat, A.K.; Abdullah, R.; Yusoff, M. Rice Production and Water use Efficiency for Self-Sufficiency in Malaysia: A Review. Trends Appl. Sci. Res. 2011, 6, 1127–1140. [Google Scholar] [CrossRef]
- Peng, S.B.; Tang, Q.Y.; Zou, Y.B. Current status and challenges of rice production in China. Plant Prod. Sci. 2009, 12, 3–8. [Google Scholar] [CrossRef]
- Sariam, O.; Anuar, A.R. Effects of irrigation regime on irrigated rice. J. Trop. Agric. Fd. Sc. 2010, 38, 1–9. [Google Scholar]
- Korea Statistical Information Service (KOSIS). Agricultural land Area Survey. 2024. Available online: https://kosis.kr/index/index.do (accessed on 27 August 2024).
- Choi, J.S.; Won, J.G.; Ahn, D.H.; Park, S.G.; Lee, S.P. Growth and Yield of Rice by Field Water Management for Water-Saving Irrigation. Korean J. Crop Sci. 2004, 49, 441–446. [Google Scholar]
- Dong, N.; Brandt, K.; Sørensen, J.; Hung, N.; Hach, C.; Tan, P.; Dalsgaard, T. Effects of alternating wetting and drying versus continuous flooding on fertilizer nitrogen fate in rice fields in the Mekong Delta, Vietnam. Soil Biol. Biochem. 2012, 47, 166–174. [Google Scholar] [CrossRef]
- Hong, E.; Choi, J.Y.; Nam, W.H.; Kim, J.T. Decision support system for the real-time operation and management of an agricultural water supply. Irrig. Drain. 2016, 65, 197–209. [Google Scholar] [CrossRef]
- Choi, M.G.; Kim, S.S.; Lee, S.Y. Influence of midsummer drainage on growth and lodging of rice in direct seeding on dry paddy. Korean J. Crop Sci. 1995, 40, 574–579. [Google Scholar]
- Kim, G.Y.; Lee, S.B.; Lee, J.S.; Choi, E.J.; Ryu, J.H.; Park, W.J.; Choi, J.D. Mitigation of greenhouse gases by water management of SRI (System of Rice Intensification) in rice paddy fields. Korean J. Soil Sci. Fert. 2012, 45, 1173–1178. [Google Scholar] [CrossRef]
- Ahn, J.H.; Choi, M.Y.; Kim, B.Y.; Lee, J.S.; Song, J.K.; Kim, G.Y.; Weon, H.Y. Effects of water-saving irrigation on emissions of greenhouse gases and prokaryotic communities in rice paddy soil. Microb. Ecol. 2014, 68, 271–283. [Google Scholar] [CrossRef] [PubMed]
- Ishfaq, M.; Akbar, N.; Anjum, S.A.; Anwar-Ijl-Haq, M. Growth, yield, and water productivity of dry direct seeded rice and transplanted aromatic rice under different irrigation management regimes. J. Inter. Agric. 2020, 19, 2656–2673. [Google Scholar] [CrossRef]
- Myeong, S. Impact of climate change-related natural disasters on rice production in South Korea. J. Korean Soc. Hazard Mitig. 2018, 18, 53–60. [Google Scholar] [CrossRef]
- Ju, Y.C.; Lim, G.J.; Han, S.W.; Park, J.S.; Cho, Y.C.; Kim, S.J. Yield response of rice affected by adverse weather conditions occurred in 1999. Korean J. Agric. For. Meteorol. 2000, 2, 1–8. [Google Scholar]
- Wopereis, M.C.S.; Kropff, M.J.; Maligaya, A.R.; Tuong, T.P. Drought-stress responses of two lowland rice cultivars to soil water status. Field Crops Res. 1996, 46, 21–39. [Google Scholar] [CrossRef]
- Choi, W.Y.; Park, H.K.; Kang, S.Y.; Kim, S.S.; Choi, S.Y. Effects of water stress on physiological traits at various growth stages of rice. Korean J. Crop Sci. 1999, 44, 282–287. [Google Scholar]
- Choi, W.Y.; Park, H.G.; Moon, S.H.; Choi, M.G.; Kim, S.S.; Kim, C.K. Grain Yield and Seed Quality of Rice Plants as Affected by Water-saving Irrigation. Korean J. Agric. For. Meteorol. 2006, 8, 141–144. [Google Scholar]
- Sujono, J.; Matsuo, N.; Hiramatsu, K.; Mochizuki, T. Improving the water productivity of paddy rice (Oryza sativa L.) cultivation through water-saving irrigation treatments. Agric. Sci. 2011, 2, 511. [Google Scholar] [CrossRef]
- Kim, G.Y.; Gutierrez, J.; Jeong, H.C.; Lee, J.S.; Haque, M.M.; Kim, P.J. Effect of intermittent drainage on methane and nitrous oxide emissions under different fertilization in a temperate paddy soil during rice cultivation. J. Korean Soc. Appl. Biol. Chem. 2014, 57, 229–236. [Google Scholar] [CrossRef]
- Haque, M.M.; Biswas, J.C.; Kim, S.Y.; Kim, P.J. Intermittent drainage in paddy soil: Ecosystem carbon budget and global warming potential. Paddy Water Environ. 2017, 15, 403–411. [Google Scholar] [CrossRef]
- Park, W.J.; Choi, Y.H.; Shin, M.H.; Won, C.H.; Park, K.W.; Choi, J.D. Evaluation on Feasibility of System of Rice Intensification (SRI) for Reduction of Irrigation Water in South Korea. J. Korean Soc. Agric. Eng. 2011, 53, 49–57. [Google Scholar] [CrossRef]
- Hwang, K.C.; Ahn, S.H.; Chung, N.J. Midsummer drainage effects on rice growth and golden apple snails in environment-friendly rice cultivation. Korean J. Organic Agri. 2013, 21, 403–411. [Google Scholar] [CrossRef]
- Jouzi, Z.; Azadi, H.; Taheri, F.; Zarafshani, K.; Gebrehiwot, K.; Van Passel, S.; Lebailly, P. Organic farming and small-scale farmers: Main opportunities and challenges. Ecol. Econ. 2017, 132, 144–154. [Google Scholar] [CrossRef]
- RDA. Research Design and Analysis Standards; Rural Development Administration: Jeonju, Republic of Korea, 2012.
- National Academy of Agricultural Sciences (NAAS). Soil Plant Analysis Methods; Rural Development Administration: Jeonju, Republic of Korea, 2000.
- R Core Team. R: A Language and Environment for Statistical Computing; R Foundation for Statistical Computing: Vienna, Austria, 2020. [Google Scholar]
- Choi, J.D.; Kim, G.Y.; Park, W.J.; Shin, M.H.; Choi, Y.H.; Lee, S.; Kim, S.J.; Yun, D.K. Effect SRI water management on water quality and greenhouse gas emission in Korea. Irrig Drain 2014, 63, 263–270. [Google Scholar] [CrossRef]
- Chu, G.; Wang, Z.; Zhang, H.; Liu, L.; Yang, J.; Zhang, J. Alternate wetting and moderate drying increases rice yield and reduces methane emission in paddy field with wheat straw residue incorporation. Food Energy Secur. 2015, 4, 238–254. [Google Scholar] [CrossRef]
- Jang, E.B.; Jeong, H.C.; Gwon, H.S.; Lee, H.S.; Park, H.R.; Lee, J.M.; Oh, T.K.; Lee, S.I. Effect of water management on greenhouse gas emissions from rice paddies using a slow-release fertilizer (in Korean with English abstract). Korean J. Environ. Agric. 2023, 42, 112–120. [Google Scholar] [CrossRef]
- Oh, S.K.; Cho, Y.S. Diurnal variations of methane emission as effected by water management methods in a rice cultivation paddy field. J. Clim. Change Res. 2024, 15, 665–677. [Google Scholar] [CrossRef]
- Ryu, H.Y.; Chang, K.R. Studies on the effects of various methods of rotation irrigation system affecting on the growth, yield of rice plants and its optimum facilities. J. Korea Soc. Agric. Eng. 1970, 12, 15. [Google Scholar]
- Im, W.J.; Kwon, D.W.; Bak, H.J.; Lee, J.H.; Chang, S.Y.; Sang, W.G.; Chung, N.J.; Cho, J.I.; Hwang, W.H. Changes in rice growth characteristics during intermittent drainage period using multiple sensing technology. Korean J. Crop Sci. 2024, 69, 78–87. [Google Scholar] [CrossRef]
- Yoshida, S. Fundamentals of Rice Crop Science; IRRI: Los Baños, Philippines, 1981. [Google Scholar]
- Bouman, B.A.M.; Toung, T.P. Field water management to save water and increase its productivity in irrigated lowland rice. Agric. Water Manag. 2001, 49, 11–30. [Google Scholar] [CrossRef]
- Diker, K.; Bausch, W.C. Radiometric field measurements of maize for estimating soil and plant nitrogen. Biosys. Engineer. 2003, 86, 411–420. [Google Scholar] [CrossRef]
- Kim, M.H.; Fu, J.D.; Lee, B.W. Yield response to nitrogen topdress rate at panicle initiation stage under different growth and nitrogen nutrition status of rice plant. Korean J. Crop Sci. 2006, 51, 571–583. [Google Scholar]
- Jiang, H.; Thobakgale, T.; Li, Y.; Liu, L.; Su, Q.; Cang, B.; Bai, C.; Li, J.; Song, Z.; Wu, M.; et al. Construction of dominant rice population under dry cultivation by seeding rate and nitrogen rate interaction. Sci. Rep. 2021, 11, 7189. [Google Scholar] [CrossRef] [PubMed]
- Ju, C.; Liu, T.; Sun, C. Panicle nitrogen strategies for nitrogen-efficient rice varieties at a moderate nitrogen application rate in the lower reaches of the Yangtze River. Agronomy 2021, 11, 192. [Google Scholar] [CrossRef]
- Wang, W.; Shen, C.; Xu, Q.; Zafar, S.; Du, B.; Xing, D. Grain yield, nitrogen use efficiency and antioxidant enzymes of rice under different fertilizer N inputs and planting density. Agronomy 2022, 12, 430. [Google Scholar] [CrossRef]
- Park, S.T.; Ehil, J.; Zhang, A.C.; Lee, S.H. Effects of different water depths on the yield of rice varieties. J. Korean Soc. Crop Sci. 1993, 38, 405–411. [Google Scholar]
- Lee, C.K.; Kim, C.H. A study on water-saving cultivation methods for rice. J. Korean Agric. Soc. 1966, 3, 11–16. [Google Scholar]
- Gupta, R.K.; Näresh, R.R.; Hobbs, P.R.; Ladha, J.K. Adopting Conservation Agriculture in the Rice-Wheat System of the Indo-Gangetic Plains: New Opportunities for Saving Water. In Water-Wise Rice Production; International Rice Research Institute: Los Banos, Philippines, 2002; pp. 207–222. [Google Scholar]
- Hiroshi, S.; Masahiro, A.; Katsuyuki, S. Impacts on agriculture, forestry, and fisheries. In Global Warming-The Potential Impact on Japan; Nishioka, S., Harasawa, H., Eds.; Springer: Berlin/Heidelberg, Germany, 1998; pp. 101–129. [Google Scholar]
- Horie, T. Predicting the effects of climatic variation and elevated CO2 on rice yield in Japan. J. Agric. Meteorol. 1993, 48, 567–574. [Google Scholar] [CrossRef]
- Lee, K.J.; Kim, D.J.; Ban, H.Y.; Lee, B.W. Genotypic differences in yield and yield-related elements of rice under elevated air temperature conditions. Korean J. Agric. For. Meteorol. 2015, 17, 306–316. [Google Scholar] [CrossRef]
- Sato, S.; Uphoff, N. A Review of on-Farm Evaluation of System of Rice Intensification (SRI) Methods in Eastern Indonesia. CAB Reviews; Commonwealth Agricultural Bureau International: Wallingford, UK, 2007; pp. 67–87. [Google Scholar]
- Suryavanshi, P.; Singh, Y.V.; Prasanna, R.; Bhatia, A.; Shivay, Y.S. Pattern of Methane Emission and Water Productivity under Different Methods of Rice Crop Establishment. Paddy Water Environ. 2013, 11, 321–329. [Google Scholar] [CrossRef]
- Van, D.H.H.; Sakthivadivel, R.; Renshaw, M.; Silver, J.B.; Birley, M.H.; Konradsen, F. Alternate Wet/dry Irrigation in Rice Cultivation: A Practical Way to Save Water and Control Malaria and Japanese Encephalitis (Research Report 47); International Water Management Institute: Colombo, Sri Lanka, 2002. [Google Scholar]
Disclaimer/Publisher’s Note: The statements, opinions and data contained in all publications are solely those of the individual author(s) and contributor(s) and not of MDPI and/or the editor(s). MDPI and/or the editor(s) disclaim responsibility for any injury to people or property resulting from any ideas, methods, instructions or products referred to in the content. |
© 2025 by the authors. Licensee MDPI, Basel, Switzerland. This article is an open access article distributed under the terms and conditions of the Creative Commons Attribution (CC BY) license (https://creativecommons.org/licenses/by/4.0/).