Article

Characterization and Evaluation of Biomass Waste Biochar for Turfgrass Growing Medium Enhancement in a Pot Experiment

by
Marija Koprivica
1,*,
Jelena Petrović
1,
Marija Simić
1,
Jelena Dimitrijević
1,
Marija Ercegović
1 and
Snežana Trifunović
2
1
Institute for Technology of Nuclear and Other Mineral Raw Materials, Franchet d’ Esperey 86, 11000 Belgrade, Serbia
2
Faculty of Chemistry, University of Belgrade, Studentski trg 12-16, 11000 Belgrade, Serbia
*
Author to whom correspondence should be addressed.
Agriculture 2025, 15(21), 2206; https://doi.org/10.3390/agriculture15212206
Submission received: 16 September 2025 / Revised: 17 October 2025 / Accepted: 22 October 2025 / Published: 23 October 2025
(This article belongs to the Section Agricultural Soils)

Abstract

The sustainable management of urban grasslands is crucial for resilient city ecosystems. With increasing urbanization, improving soil quality to support turfgrass growth has become a priority. This study evaluates biochar produced from Paulownia leaves (PLB), a low-cost byproduct of Paulownia cultivation, as a growing medium amendment. Raw leaves (PL) and PLB were characterized by SEM, FTIR, and elemental analysis to assess physicochemical changes. A three-month pot experiment under outdoor conditions was conducted with turfgrass plots exposed to different irrigation and fertilization regimes. Growing medium pH, moisture, electrical conductivity, cation exchange capacity, nutrient availability, grass chlorophyll content, and uptake were monitored. The application of PLB improved the growing medium structure, raised the pH by up to one unit, and enhanced pigment accumulation in turfgrass samples. When combined with nitrogen fertilizer, PLB significantly increased turfgrass visual quality, whereas under limited irrigation, PLB alone improved seedling establishment compared to controls. Statistical analysis confirmed significant treatment effects by ANOVA, and PCA provided a precise classification of treatment groups. These findings indicate that PLB can improve nutrient efficiency, turfgrass resilience, and organic waste management.

1. Introduction

Healthy grass systems are increasingly essential in urban planning, contributing to the ecological restoration of degraded areas, repurposing of former industrial zones, and development of new residential and commercial landscapes [1]. Turfgrass surfaces offer multifunctional benefits, including recreational use, aesthetic enhancement, erosion control, microclimate regulation, and improved soil structure and organic matter content [1,2]. However, maintaining high-quality turfgrass requires intensive management practices such as mowing, irrigation, fertilization, and pesticide application, which can have adverse environmental impacts if not properly balanced [1,3,4,5]. Seedling vigor and early grass establishment are critical for successful grass development. These factors largely depend on soil physical structure and nutrient availability [3]. While chemical fertilizers, particularly nitrogen (N) fertilizers, are commonly used to improve turfgrass performance, their excessive or improper use can result in soil acidification, nutrient loss due to volatilization and leaching [1,6], groundwater contamination, weakened plant resistance, and increased maintenance costs, which not only reduces fertilizer efficiency but also raises economic and environmental concerns [4,5]. To address these issues, combining organic soil amendments with mineral fertilizers has been proposed as a more sustainable management strategy [6,7].
Among emerging organic amendments, biochar, a carbon-rich product obtained via pyrolysis of biomass, has attracted increasing attention. Biochar enhances soil fertility by increasing porosity, cation exchange capacity, improving water retention, and promoting carbon sequestration, while simultaneously reducing soil acidity and nutrient losses [3,8,9]. Its effectiveness, however, depends on the type of feedstock and pyrolysis conditions such as temperature, heating rate, residence time, and the presence of catalysts [8]. Biochar’s porous structure and stable aromatic carbon composition contribute to long-term improvements in soil health and crop productivity. It also holds significant potential for reducing irrigation demands by increasing soil moisture retention, which is particularly relevant for turfgrass maintenance in drought-prone areas [9].
Despite growing interest in biochar for agricultural use, few studies have evaluated its application in turfgrass systems, especially under urban and recreational contexts [10]. Furthermore, the potential of underutilized biomass sources for biochar production remains largely untapped. One such source is Paulownia spp., a fast-growing tree cultivated for timber, which generates substantial amounts of large leaves as waste. These leaves are typically discarded, posing challenges for disposal and biomass management [11]. In previous studies, Paulownia leaves (PL) have been investigated for hydrothermal carbonization (HTC) and assessed for use as fuel and adsorbent materials [11,12]. Although these leaves have been studied for hydrothermal and industrial applications, their agronomic valorization via pyrolysis remains unexplored. The valorization of Paulownia leaf biomass into biochar may offer a sustainable pathway for waste reduction and soil enhancement.
This study aims to fill this gap by assessing the agronomic potential of biochar derived from Paulownia leaves (PLB) as a soil/growing medium amendment for turfgrass systems. Chemical characterization of raw PL and PLB was performed using SEM, FTIR, and elemental analysis to assess structural and compositional changes. The study aimed to assess the potential of biomass-derived biochar (PLB) to improve turfgrass growth and nutrient dynamics under varying irrigation and fertilization regimes. By integrating organic waste valorization with turfgrass management, this work contributes to sustainable land use practices and supports broader ecological and agricultural sustainability goals.

2. Materials and Methods

2.1. Preparation of Biochar Material

Waste biomass in the form of Paulownia tree leaves was collected from a public park in Belgrade, Serbia, in early October 2023, coinciding with the end of the tree’s vegetative period. The collected material was washed with distilled water and air-dried at ambient temperature for two weeks. Following drying, the petioles were cut into ~1 cm fragments, and the entire leaf mass was ground using a laboratory grinder to obtain a more homogeneous and finer particulate sample. The processed material was stored in airtight polypropylene zip-lock bags at room temperature until further use.
Based on literature reports, biochar produced at lower pyrolysis temperatures and slow heating rates exhibits properties favorable for soil amendment such as increased ash content, higher cation exchange capacity, and a larger specific surface area, while preserving a stable aromatic carbon structure [13,14]. The PL sample was converted to biochar via slow pyrolysis using a Nabertherm furnace (Nabertherm GmbH, Lilienthal, Germany). The reactor dimensions were approximately 225 mm × 170 mm × 130 mm. The process was carried out under an inert atmosphere (argon) at 400 °C for 2 h, with a heating rate of 10 °C/min. Paulownia leaves were used as the feedstock without additional components. Upon completion, the resulting biochar was cooled to room temperature and stored in airtight containers until further characterization and use in growing medium amendment experiments.

2.2. Analysis Methods Used for Characterization of PL and PLB

The raw Paulownia leaf biomass (PL) and the resulting biochar (PLB) were characterized using a range of physicochemical analyses. The technical characterization included determination of biochar yield, moisture content, ash content, volatile matter, and fixed carbon, following the ASTM D1762-84 standard [15] and methodologies reported by Petrović et al. [16]. The pH of both PL and PLB was measured using a laboratory pH meter equipped with a glass electrode (AMTAST AMT20, Amtast USA Inc., Lakeland, FL, USA), after suspension in deionized water at a solid-to-liquid ratio of 1:20 (w/v).
Elemental composition (C, H, N, S) was analyzed using a CHNS-O elemental analyzer (VARIO-EL III, Elementar, Hanau, Germany). Samples were combusted at 1150 °C in a helium atmosphere with oxygen injection and a catalyst, converting carbon to CO2, hydrogen to H2O, sulfur to SO2, and organic nitrogen to N2. Oxygen content was calculated by difference.
To determine the concentrations of inorganic elements, samples were digested using a microwave-assisted acid digestion system (Ethos UP, Milestone, Shelton, CT, USA) with concentrated nitric acid (HNO3) and hydrogen peroxide (H2O2). The digestion parameters were adjusted according to the sample matrix: plant tissue for PL and carbonaceous material for PLB. Although the applied procedures may not fully decompose silicate-bound mineral fractions, they are considered adequate for determining pseudo-total elemental concentrations, in accordance with standardized analytical methods (U.S. EPA Method 3052, 1996; ISO 11466:1995) [17,18]. The concentrations of macro- and micronutrients, and toxic metals were quantified using atomic emission spectrophotometry for K, Na, and Ca, and atomic absorption spectrophotometry for Mg, Fe, Pb, Cu, Cd, Ni, Zn, Mn, Al, Ti, and Si, also Hg and As were determined using the hydride generation technique on a PerkinElmer PinAAcle 900T (PerkinElmer, Inc., Shelton, CT, USA) atomic absorption spectrophotometer (AAS). The content of P was determined by UV-VIS spectrophotometry on a Jena Analytic, Spekol 1300 (Analytik Jena GmbH, Jena, Germany) spectrophotometer, according to the method proposed by Awwad et al. [19]. The analysis was performed via the vanadate-molybdate yellow color development method (orthophosphate forms a yellow complex) and absorbance was measured at 460 nm.
The point of zero charge (pHPZC) of the PLB biochar was determined by the modified pH drift method [12]. A series of 0.01 mol/L NaCl solutions (50 mL) was adjusted to initial pH values ranging from 2 to 12 using either HCl or NaOH. Then, 0.05 g of biochar was added to each solution and shaken at 150 rpm for 24 h at room temperature (25 ± 2 °C). The final pH was measured, and the pHPZC was determined as the point where pH_final = pH_initial (ΔpH = 0).
The liming potential (CaCO3eq) and pH-buffering properties of the PLB biochar were evaluated through its total alkalinity, expressed as Acid Neutralizing Capacity (ANC). The ANC was determined by back titration according to the procedure described by Yuan et al. and Singh et al. [20,21]. In a typical experiment, 0.5 g of biochar was mixed with 50.0 mL of standardized 0.5 mol/L HCl and shaken for 24 h at room temperature to ensure complete reaction between the acidic solution and the basic components of the biochar. The suspension was filtered, and the remaining acid was back titrated with 0.5 mol/L NaOH to an endpoint of pH 7.0 using a pH meter. The acid neutralizing capacity (mmol/g) was calculated from the difference between the added and residual acid and was additional converted to calcium carbonate equivalents (% CaCO3 eq) on a dry weight basis. Also, the short-term acid neutralization test for the determination of pH-buffering properties was performed. A 0.5 g portion of dried biochar was added to 25 mL of deionized water in a beaker. The initial pH of the suspension was measured and recorded. Subsequently, 0.1 M HCl was added in 0.2 mL increments under continuous stirring. After each addition, the pH was recorded. The titration continued until the pH of the suspension decreased below 4.5. The buffering capacity was calculated based on the total amount of H+ ions (mmol) required to lower the pH, expressed per gram of biochar [21].
All measurements were performed in triplicate, and mean values with standard deviations (<3%) were reported.

FTIR and SEM/EDX Analysis

Fourier-transform infrared spectroscopy (FTIR) was used to identify all IR-active functional groups of PL and PLB. Spectra were recorded using a Thermo Scientific Nicolet iS50 spectrometer in transmission mode. Each sample was mixed with potassium bromide (0.8 mg of sample with 80 mg of KBr) and pressed into transparent pellets. The spectral range was set from 4000 to 400 cm−1 with 64 scans per sample at a resolution of 2 cm−1.
The morphological characteristics and surface structure of PL and PLB were analyzed using scanning electron microscopy (SEM) on a JEOL JSM-6610 microscope equipped (JEOL’s Ltd, Akishima, Tokyo, Japan) with an energy-dispersive X-ray spectroscopy (EDX) detector for elemental surface mapping. Prior to analysis, the samples were sputter-coated with gold and mounted on adhesive carbon tape. Imaging was performed under high vacuum at an accelerating voltage of 20 kV.

2.3. Turfgrass Planting Experiment and Chemical Characterization of Grass and Growing Media Residue

The objective of this preliminary study was to assess the impact of biochar amendments on growing medium characteristics and turfgrass development. A controlled turfgrass pot experiment was conducted under outdoor conditions in Belgrade, Serbia, during September, October, and November 2023. For ease of handling and precise monitoring, smaller pots (approximately 10 × 10 cm) were used. Each pot was filled with 100 g of commercial growing medium (Floran, Belgrade, Serbia), and 0.5 g of turfgrass seed mixture was uniformly sown (Figure 1). The experimental design followed a Randomized Complete Block Design (RCBD), where each of the three sets represented the three independent blocks. Each block followed a factorial structure with the following factors (Figure S1):
-
Two watering regimes (Regular irrigation—Series 1 and Limited irrigation—Series 2);
-
Four different treatment groups by soil amendment composition (0—control without amendments; B—with biochar PLB; BF—Combined treatment with biochar PLB and nitrogen fertilizer; and F—with nitrogen fertilizer only);
-
Two replicates per treatment per watering regime.
Each experimental block was considered an independent replicate for statistical analysis, and additionally, each block comprised two technical replicates (3 sets × 2 replicates) to account for possible environmental micro-variability. Accordingly, the data presented in the results represent the average values from all six replicates along with standard deviations. The turfgrass seed mixture was identical across all treatments. It consisted of a standardized blend: 30% Lolium perenne ‘Esquire’, 30% L. perenne ‘Double’, 20% L. perenne ‘Troya’, and 20% L. perenne ‘Greensky’, coated with a seed-enhancing formulation (Greenfield Nachsaat-Mantelsaat®). The commercial potting growing medium (Floran, Belgrade, Serbia) consists of: 68.55% moisture, 10.21% mineral content, 89.79% organic content, 0.52% total N, 0.023% total P, 0.046% K, 0.16% Ca, 0.15% Mg, 0.29% Fe, 0.0033% Mn, 0.00052% Cu. A standardized growing medium was selected to reduce variability and ensure uniform substrate conditions across all treatments, enabling more precise observation of biochar effects in this preliminary study.
Biochar (3% w/w) was mixed into the topsoil layer after sowing. This biochar dose was selected based on commonly reported application rates in similar pot experiments, which range from 1% to 5% (w/w), to ensure a balance between efficacy and phytotoxicity [7]. The mineral fertilizer ammonium nitrate, NH4NO3, with 34.4 ± 0.6% w/w of N, was applied to the F and BF treatments, two weeks after sowing, after the establishment of a uniform turfgrass sod. Immediately following fertilization, all pots were watered thoroughly, and turfgrass was trimmed to a height of 1 cm above the soil surface. To ensure uniform exposure to natural light, all pots were placed on three movable cardboard platforms and rotated regularly. Soil pH and moisture were monitored weekly using a portable 2-in-1 soil pH and moisture meter (Hidroponika, Belgrade), with measurements conducted in the morning before irrigation (Figures S2 and S3). This device provides non-gravimetric, relative values on a unit-less scale ranging approximately from 0 (completely dry) to 10 (saturated), and does not express soil moisture as a percentage by weight or volume. These measurements were used to track relative differences in moisture levels between treatments over time, rather than to quantify absolute soil water content. In addition, visible plant symptoms (reduced growth, leaf discoloration) were qualitatively recorded to confirm the onset of water-deficit stress under the limited irrigation regime.
Irrigation was performed manually by applying approximately 50 mL of water per pot at each event. This amount was determined in preliminary tests as sufficient to restore the substrate to near field capacity after drainage. All pots were standard plastic containers (approximately 10 × 10 cm) with drainage holes and no trays, which allowing free drainage and preventing water accumulation. Due to the small pot volume, free drainage, and high daytime temperatures in September, the substrate dried rapidly; therefore, a relatively frequent irrigation schedule was required to maintain uniform moisture in the “regular irrigation” (Series 1) treatment.
Two irrigation regimes were implemented. “Regular irrigation” aimed to maintain soil moisture close to field capacity by frequent watering: in September, Series 1 received three waterings per day; in October, two waterings per day; and in November, watering was performed almost daily depending on rainfall. “Limited irrigation” (Series 2) involved the same amount of water per event but at a markedly lower frequency: once per day in September, every other day in October, and approximately every third day from November onward. This reduced frequency resulted in lower soil moisture and the onset of visible water-deficit stress at the beginning of October, manifested by reduced growth and discoloration of turfgrass.
Average climatic conditions during the experiment reflected a typical humid continental climate (Figure S4). Daytime temperatures in September reached up to 34 °C with nighttime lows around 7 °C. In October, average temperatures were about 19 °C (range: 3–27 °C), while in November they dropped to about 13 °C (range: −1–22 °C). Precipitation was moderate, with approximately 33 mm in September, 47 mm in October, and 43 mm in November, each distributed over 6–9 rainy days. These data provide context for the outdoor, non-controlled environment in which the preliminary experiment was conducted.
After three months of field cultivation, the turfgrass was harvested and transferred to the laboratory for further analysis. Above ground biomass was harvested monthly by cutting the grass at soil level. After the final harvest, roots were carefully removed, washed, and combined with the previously collected above ground biomass. This approach ensured accurate determination of carbon content in the total plant biomass. Residual growing medium samples from each pot were also collected and analyzed for pH, moisture content, electrical conductivity and macronutrient composition.
Following the turfgrass cultivation period, collected residual growing medium and plant samples were prepared for inorganic analysis using standardized acid digestion procedures. Residual growing medium samples (1.0S, 1.BS, 1.BFS, 1.FS, 2.0S, 2.BS, 2.BFS and 2.FS) were digested via wet mineralization using aqua regia (HCl:HNO3 = 3:1 v/v) under controlled heating to extract inorganic elements, in accordance with established protocols for soil elemental analysis [22]. Dried plant tissues (Grass-1.0G, 1.BG, 1.BFG, 1.FG, 2.0G, 2.BG, 2.BFG and 2.FG) were digested using microwave-assisted acid digestion (Ethos Up, Milestone) with concentrated nitric acid (HNO3) and hydrogen peroxide (H2O2), following the official protocol for agricultural plant material (Agriculture, Dried Plant Tissue). The prepared solutions were subsequently analyzed to determine the concentrations of macronutrients. Although the digestion procedures applied may not fully decompose silicate-bound fractions, they are sufficient for determining the pseudo-total concentrations of elements, in accordance with standardized protocols widely accepted for soil and plant analysis [17,18]. For soils and plant samples, the analysis of inorganic elements, pH value, and total elemental composition (C, H, N, S) was performed using the same analytical instruments and procedures previously described in Section 2.2. These included atomic absorption spectroscopy (AAS), atomic emission spectroscopy, UV-Vis spectrophotometry for phosphorus, and CHNS-O elemental analysis.

2.4. Electrical Conductivity (EC) and Cation Exchange Capacity (CEC) of Biochar and Residual Growing Medium

Electrical conductivity (EC) of the biochar and growing medium samples was measured using a 1:10 (w/v) biochar-to-deionized water extraction. The suspension was stirred continuously for 1 h and allowed to settle, and the supernatant was filtered before EC measurement using a portable EC meter, following the procedure described by Haq et al. [23]. The method used for the determination of Cation Exchange Capacity (CEC) was a modification of the BaCl2 method described by Nel et al. [24]. CEC was determined using the 1 M BaCl2 displacement method, in which 0.5 g of biochar and 2 g of residual soil from different treatments were shaken twice for one hour with a total of 60 mL BaCl2, and the displaced cations (Ca2+, Mg2+, K+, Na+) were quantified by atomic absorption spectrophotometry (AAS).
CEC (cmolc/kg) = Σ [Ca], [Mg], [K], [Na] (cmolc/kg)

2.5. Chlorophyll Content as Indicator of Biofertilizer Efficiency

The method used for extraction of Chlorophyl a (Chl. a) and Chlorophyll b (Chl. b) has been previously described by Ngcobo et al. 2024 [25]. The 0.5 g of dry plant residue of grass was added to 50 mL of acetone and mixed together at 45 °C for 30 min. After extraction the samples were filtered and the supernatant was sent for spectrophotometry at 663 nm and 645 nm for Chl. a and Chl. b absorbance measurements using Analytik Jena Specol 1300/1500. The content of Chl. a and Chl. b and Total Chl. a+b were obtained by Equations (1)–(3):
C a = 11.75   A 663 2.50 A 645
C b = 18.61   A 645 3.96 A 663
T o t a l   c h l o r o p h y l l = 17.90 A 645 + 8.08 A 663
where A was the absorption at 663 nm and 645 nm; Ca, Cb and total chlorophyll were concentrations [mg/L] of Chl a, Chl b and the summation of Chl a and Chl b, respectively.

2.6. Statistical Analysis

Data of pot experiment under outdoor conditions were analyzed separately for growing medium and grass variables. The two-way ANOVA was performed with fixed factors Treatment and Irrigation, including their interaction. When significant effects were detected (p < 0.05), one-way ANOVA followed by Tukey’s HSD post hoc test was applied within each irrigation regime to compare treatment means. In Figures, different letters indicate significant differences among treatments within the same irrigation regime (Tukey HSD, p < 0.05). Pairwise comparisons between irrigation regimes (1 vs. 2) for each treatment were assessed with Welch’s t-test and Holm correction. Statistical analysis was performed using a demo version of NCSS statistical software (version 12, demo version; Hintze. 2001. Number Cruncher Statistical Systems, Kaysville, UT, USA; www.ncss.com, accesed on 21 March 2025). Additionally, Principal component analysis (PCA) and graphing were carried out by a OriginPro 2019b (Northampton, MA, USA).

3. Results and Discussion

3.1. Characterization of Biochar

The pyrolysis of PL resulted in substantial structural and chemical modifications in the derived biochar, enhancing its potential as a soil/growing medium amendment. As shown in Table 1, the fixed carbon content increased markedly from 8.89% in PL to 40.06% in PLB, while the volatile matter content decreased from 77.01% to 35.81%. This transformation indicates improved material stability and resistance to degradation, key characteristics for biochar used in long-term soil conditioning under diverse environmental conditions [26,27,28]. These changes are in line with previous findings on lignocellulosic biomass pyrolysis, confirming that higher carbon stability correlates with improved soil amendment performance [27,28,29,30].
Elemental analysis revealed an increase in total carbon content from 45.71% to 63.38% and a reduction in oxygen from 38.22% to 8.86%, indicating the formation of a stable, aromatic, carbon-rich matrix [26]. Such a structure is characteristic of biochars formed under slow pyrolysis, and it supports long-term carbon sequestration in soils (Table 1). However, the atomic H/C ratio of the PLB biochar was approximately 0.90, indicating a moderate degree of carbonization and lower stability (Table 1). While this value is higher than the threshold for highly stable biochars (H/C < 0.7, according to the European Biochar Certificate-EBC), it provides a balance between stability and the presence of functional groups. Significantly, the nitrogen content increased from 3.79% in PL to 4.84% in PLB. The observed increase in nitrogen content from PL to PLB can be attributed to the concentration effect resulting from the loss of volatile organic compounds and water during the biochar production process. As pyrolysis progresses, organic matter decomposes, and volatiles are released, leading to a relative enrichment of nitrogen in the remaining solid biochar [31,32]. However, it is worth noting that nitrogen in biochar may not be readily available to plants unless mineralized or transformed by microbial activity, and further bioavailability studies would be required [33]. The PLB also showed enrichment in essential macronutrients, including potassium (K), calcium (Ca), and phosphorus (P), which are vital for root development, plant metabolism, and soil fertility (Table 1) [34]. Nevertheless, it should be emphasized that nutrient release from biochar is often slow and dependent on soil conditions such as microbial activity, moisture, and texture, which were not fully controlled in this study. Therefore, the observed chemical enrichment should be interpreted as potential nutrient availability, not immediate bioavailability [35]. The predominance of Ca, K, and P recognized as macronutrients under EU classification further supports the agronomic value of PLB for improving turfgrass establishment and growth [36].
The concentrations of heavy metals and arsenic in the produced biochar samples (PL and PLB) were determined and compared against the threshold values set by the EBC and the International Biochar Initiative (IBI) for materials intended as soil amendments. All measured values, including Pb, Cd, Cu, Ni, Hg, Zn, Cr, and As, were well below the permissible limits defined by both EBC (AgroBio and Agro categories) and IBI standards (Table 2). This confirms the environmental safety of the biochar for agricultural applications. Notably, elements such as As and Hg were below detection limits (<0.000001 mg/kg). These results indicate that the biochar complies with international quality and safety criteria for use in soil enhancement.
Additionally, the pH value increased markedly from 5.67 (PL) to 8.67 (PLB), confirming its alkaline character (Table 1). The acid-neutralizing capacity (ANC) and CaCO3 equivalent values (Table 3) further substantiate the strong liming potential of PLB, supporting its role in mitigating soil acidity and enhancing nutrient bioavailability. [21,37]. Together, these chemical characteristics confirm that PLB is a nutrient-rich and pH-buffering amendment with strong potential for enhancing soil fertility, especially in degraded or acidic urban soils. This statement is supported by the measured pH-buffering capacity (0.30 mmol/g) and acid neutralizing capacity (6.38 mmol/g) (Table 3), which verify the buffering function of PLB and its ability to counteract soil acidification [21,38].
The physicochemical characterization of PLB biochar revealed key surface properties relevant to its use as a soil/growing medium amendment in grass cultivation (Table 3). The point of zero charge (pHpzc ≈ 7.0) indicates a nearly neutral surface, enabling balanced interactions with both cationic and anionic species depending on soil pH (Figure S6). The high alkalinity (6.38 ± 0.09 mmol/g) confirms PLB’s substantial acid neutralization potential, which, together with measured pH buffering (~0.30 mmol g−1 in short-term test), underpins its ability to stabilize soil pH under acidic inputs. For turfgrass or pasture systems, these properties make PLB a promising amendment that can buffer soil acidification, retain nutrients, thereby improving plant--available nutrient retention and soil health. These results confirm the substantial proton-neutralizing ability of PLB, indicating that it can effectively resist acidification and stabilize soil pH. Similar effects have been documented for biochars derived from crop residues, which increase soil pH buffering capacity primarily through cation release from protonated functional groups and carbonate dissolution [39]. Moreover, biochar amendments enhance acid buffering capacity and reduce soil acidity via liming effects and complexation reactions, often surpassing conventional liming materials in efficacy [40]. Both values exceed the thresholds recommended by the IBI and EBC guidelines for biochars with effective liming and buffering capacity (ANC > 2 mmol/g; CaCO3eq > 10%). The Electrical conductivity (EC) of PLB was measured at 1.74 ± 0.02 mS/cm using a 1:10 (w/v) water extraction (Table 3). This value places PLB within a low-to-moderate salinity range. According to a recent meta-analysis, biochars with EC < 2 mS/cm are effective in reducing soil salinity, as their modest salt content allows for salt leaching rather than accumulation [41]. This occurs because low-EC biochars do not introduce significant additional salts into the soil system. Moreover, their structure enhances water retention and infiltration, which facilitates the downward movement of existing soluble salts beyond the root zone. As a result, salts are leached away rather than accumulating at the surface or within the rhizosphere [41]. The obtained CEC value of the produced biochar (74.42 ± 0.83 cmolc/kg) is well above the minimum thresholds recommended by the EBC and IBI, which define biochars with CEC > 10–60 cmolc/kg as materials of high surface functionality and maturity. As a result, PLB can not only counteract soil acidification but also stabilize growing medium pH, thereby improving nutrient retention and bioavailability. Similar relationships between liming potential, pH buffering, and nutrient accessibility have been reported in previous studies [21,38]. Together, these chemical characteristics confirm that PLB is a nutrient-rich, pH-buffering amendment with strong potential for enhancing soil fertility, especially in degraded or acidic urban soils. However, it is important to recognize that this study represents a preliminary evaluation under non-controlled conditions with limited replication, and therefore the reproducibility of these results may be affected by environmental variability. Future work should include controlled greenhouse or field trials with larger sample sizes and replicated treatments to confirm the observed trends.

3.1.1. FTIR Spectra of PL and PLB

The FTIR spectra for PL and PLB provided key insights into the chemical structure and functional groups present in the biomass before and after pyrolysis (Figure 2). The FTIR spectra of PL showed peaks corresponding to the functional groups present in typical biomass, which includes cellulose, hemicellulose, and lignin [11]. The FTIR spectrum of PL shows characteristic absorption bands related to the main biomass components. The bands at 2925 and 2852 cm−1 correspond to asymmetric and symmetric C–H stretching vibrations in cellulose and hemicellulose. The peak at 1653 cm−1 is attributed to C=O groups mainly from hemicellulose. The peak around 1263 cm−1 originates from O-CH3 vibrations from lignin, while vibrations in the region around 1070 cm−1 correspond to C–O and C–O–C stretching vibrations typical for cellulose and hemicellulose polysaccharides. The broad band at 3345 cm−1 corresponds to –OH groups present in cellulose, hemicellulose, and lignin [11]. The most intense bands in the spectrum of the obtained biochar product PLB were observed at the wavenumbers: 3415, 2923, 2854, 1604, 1437, 1320, 1058, 863, 781 and 699 cm−1.
Peaks at 3400–3300 cm−1 attributed to O-H stretching vibrations, which indicate the presence of hydroxyl groups primarily from alcohol, phenol and bound water [11,42]. The broad band near 3300 cm−1 is primarily assigned to O–H stretching vibrations of hydroxyl groups and adsorbed water, with a possible contribution from N–H stretching modes. Due to spectral overlap, a clear distinction between these two types of vibrations cannot be made. Peaks at 2900–2850 cm−1 represent C-H stretching vibrations, commonly associated with the aliphatic chains in cellulose and hemicellulose [42,43]. Peaks at 1600, 1437, and 1320 cm−1 represent aromatic skeletal vibrations C=C, C=O stretching of the cyclic and acyclic double bonds, O-H stretching vibrations and the presence of phenolic compounds from lignin, respectively [11,42,44]. The peak at wavenumber 1058 cm−1 shows the presence of –C-O bonds of alcohol, ester, and phenol [11,12]. After pyrolysis, PLB undergoes several chemical changes that are reflected in the FTIR spectrum (Figure 2). The broader signal from 3200 to 2000 cm−1 is likely due to the newly formed COOH [45]. The C=O in COOH shows at a lower wavenumber and thus overlaps with the aromatic peak at 1604 cm−1. These groups increase the cation exchange capacity (CEC), improve water retention, immobilize toxic metals, and promote beneficial microbial activity. As a result, the biochars rich with -COOH contribute significantly to nutrient availability, soil structure, and the overall fertility of agricultural soils [46,47]. The disappearance of the 1730 cm−1 peak (C=O stretching) indicates the breakdown of hemicellulose and the loss of esters during the pyrolysis process [42,44]. The appearance of new sharp peaks at 800–600 cm−1 can be attributed to aromatic =C-H out-of-plane bending, which suggests the formation of more stable aromatic structures due to carbonization [11,43]. These spectral changes confirm that pyrolysis enhances the structural stability of PLB, creating a carbon-rich, aromatic framework. Such a structure is highly favorable for soil conditioning, as it improves water retention, enhances cation exchange capacity, and contributes to a looser, more porous soil texture beneficial for turfgrass root development and resilience in dry periods.

3.1.2. SEM/EDX Analysis of PL and PLB

In order to confirm structural changes during pyrolysis, a SEM/EDX analysis of the samples was additionally performed on both the raw biomass (PL) and biochar (PLB) samples. As shown in Figure 3, the surface morphology of PLB exhibited a significant structural transformation compared to PL. The raw biomass exhibited a relatively smooth and compact surface, whereas the PLB surface revealed a heterogeneous architecture with newly formed pores, cracks, and irregular cavities. These features are characteristic of thermally decomposed lignocellulosic material and are commonly associated with enhanced porosity and increased surface area. Such porous and channel-rich structures are advantageous for various agronomic and environmental applications, including their use as soil conditioners, adsorbents, and nutrient carriers [48,49]. The enhanced surface topography of PLB facilitates water retention, improves soil aeration, and promotes nutrient exchange, thereby increasing the bioavailability of essential elements to plants and improving overall soil quality.
The EDX spectra (Figure 3) confirm that the dominant elements on the surface of PL are carbon (C) and oxygen (O), with notable presence of potassium (K), calcium (Ca), and magnesium (Mg). After pyrolysis, an increased concentration of carbon is evident, consistent with the results of elemental analysis. Furthermore, our chemical analysis showed that pyrolysis increased the nitrogen content of the biochar from 0.75% to 2.51%, and phosphorus from 0.20% to 0.27%. This is consistent with published studies which report that, under moderate pyrolysis conditions, the loss of volatile organic components leads to a relative concentration of mineral nutrients like P, while N may also be partially retained depending on feedstock and process parameters [31,32]. The presence of essential macro- and micronutrients further supports the potential of PLB to function as a sustainable soil amendment. Collectively, the SEM/EDX results confirmed that biochar derived from PL through slow pyrolysis at 400 °C exibited a favorable structure and elemental composition, which is beneficial for enhancing soil properties, particularly in turfgrass cultivation systems.

3.2. Grass Planting Experiment

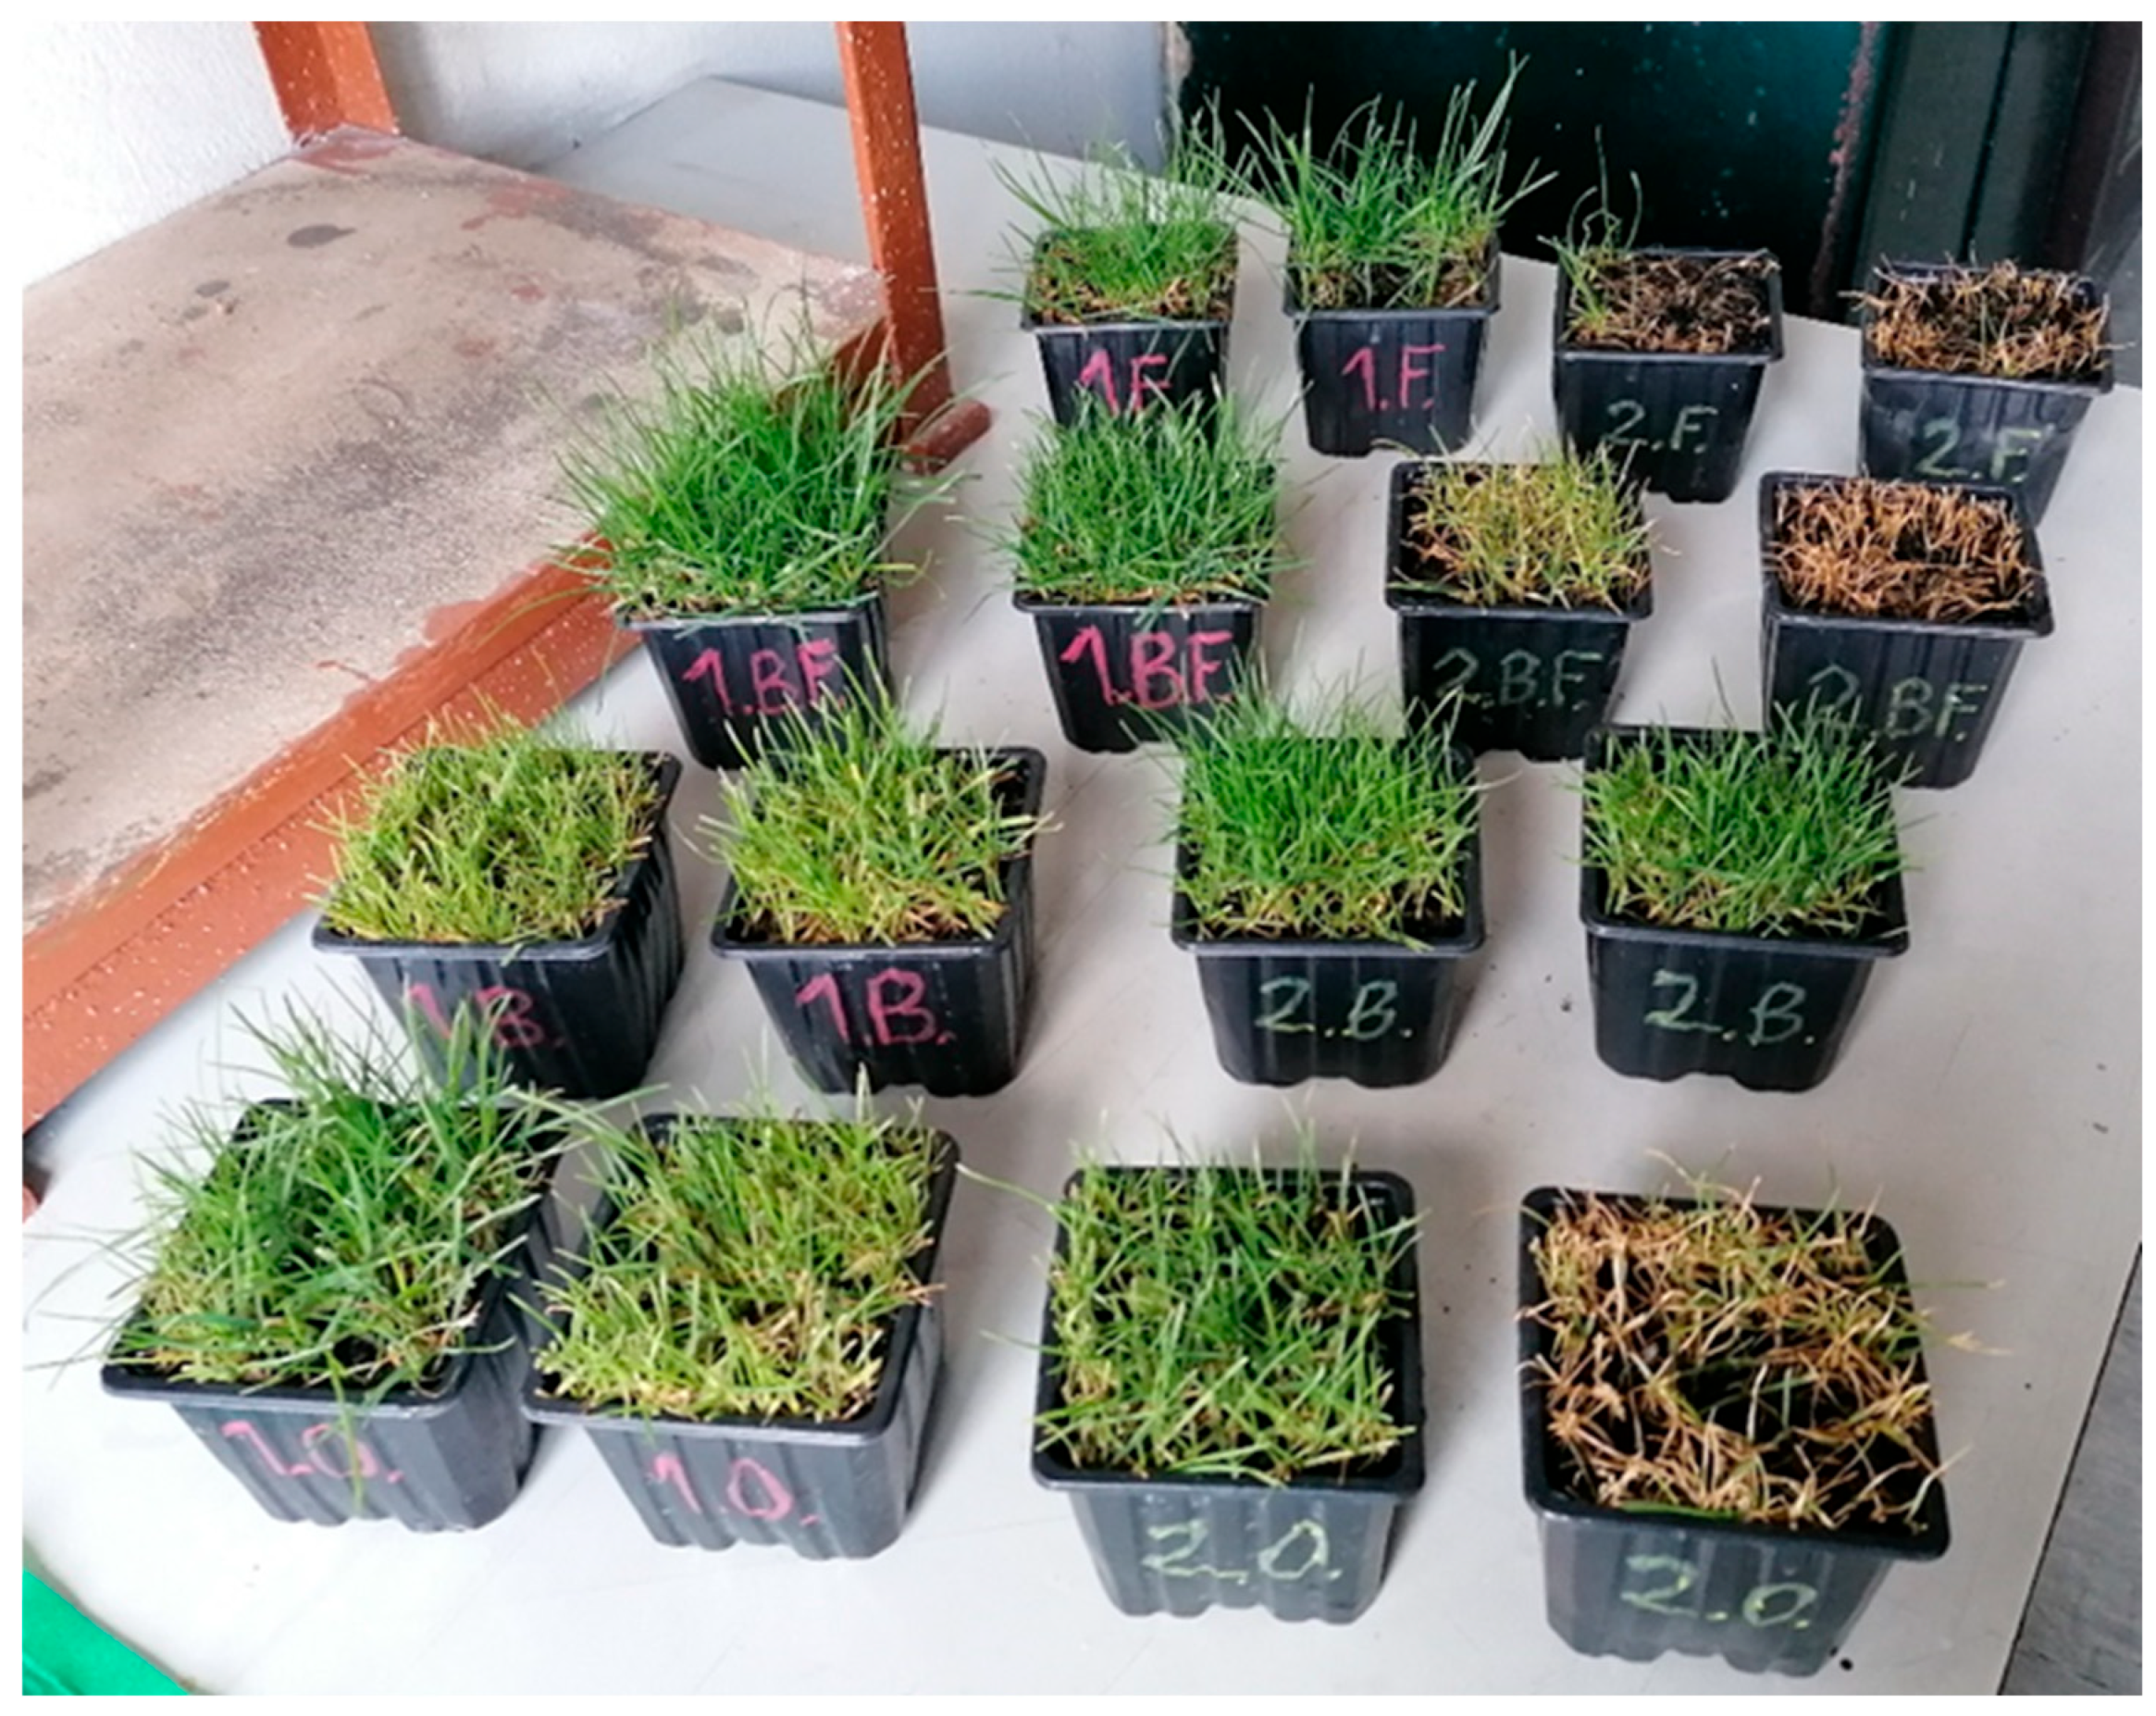
Visual assessments at the end of the month (Figure 4a) revealed noticeable differences in turfgrass development among treatments. Samples 1.0 (control), 1.B (biochar only), and 2.0 (control under limited irrigation) exhibited relatively dense growth with fine textured blades. In contrast, sample 2.F (fertilizer under limited irrigation) appeared sparser, with thinner and softer leaves, indicating signs of drought stress. This observation is consistent with previous findings where excessive nitrogen application under drought conditions was shown to exacerbate osmotic stress and reduce plant resilience, leading to visible symptoms such as thinner leaves and dry tips [45]. The combined treatment of biochar and fertilizer (1.BF) promoted vigorous growth, resulting in lush, dark green turf with elongated, healthy leaves. Although the 2.BF sample (biochar + fertilizer under reduced irrigation) showed a slightly reduced density compared to 1.BF, its turfgrass maintained a visibly healthier appearance than treatments with fertilizer alone. Notably, both fertilizer only treatments (1.F and 2.F) demonstrated signs of nutrient or moisture imbalance, such as shorter leaves and dry tips. These results suggest a potential antagonistic interaction between nitrogen fertilization and limited water availability when biochar is not present. Previous studies have shown that biochar can mitigate such imbalances by improving nutrient-use efficiency and reducing nitrogen leaching [50,51]. These visual symptoms suggest that biochar addition may have improved soil properties and nutrient availability for plant growth, particularly under conditions of limited irrigation.
As early as the beginning of October, one month after planting, differences in the appearance of grass seedlings were observed between those that were watered regularly and those subjected to a reduced irrigation regime. As shown in Figure 4b, distinct differences in turfgrass quality were observed among treatments after two months of cultivation. Although cooler temperatures were more favorable for turfgrass growth, regular irrigation remained essential, as evidenced by the superior turf quality in Series 1 compared to Series 2. Within Series 2, the presence of biochar (2.B and 2.BF) had a positive influence on turfgrass vitality, resulting in greener color, higher density, and overall freshness compared to treatments without biochar (2.0 and 2.F). Similar effects have been reported in previous studies, where biochar enhanced turf biomass, chlorophyll content, and overall plant vigor under suboptimal growing conditions [35,51]. The healthiest turfgrass appearance was again observed in treatment 1.BF, which combined biochar and fertilizer under optimal watering conditions. This sample exhibited thick, dark green, and elongated leaves, highlighting the synergistic effect of biochar and fertilizer. This synergy may result from the biochar’s ability to adsorb and gradually release nitrogen compounds such as ammonium and nitrate, thereby reducing nutrient losses through leaching and improving plant nitrogen uptake over time. The measured point of zero charge (pHPZC = 7.02 ± 0.06) indicates that under the predominantly alkaline conditions (pH > 7), PLB possesses a negatively charged surface, favoring NH4+ adsorption via cation exchange. At the same time, NO3 retention is limited to cation bridging or weak surface interactions. These results clarify the distinct mechanisms governing nitrogen retention and release by PLB biochar [38,50,51]. Fertilizer was reapplied to the BF and F treatments at this stage.
After three months of field cultivation, in November, all pots were transferred to the laboratory for chemical analysis of soil and plant material. As shown in Figure 5, the 1.BF samples retained a healthy, dense sod with long, vibrant leaves, while other treatments showed signs of decline. Remarkably, among the less frequently watered Series 2, sample 2.B demonstrated the best turf quality, indicating that biochar addition mitigated drought related stress and improved turfgrass resilience under suboptimal irrigation. For example, He et al. found that biochar improved plant growth and nitrogen cycling under drought conditions [50]. Similar improvements in drought tolerance have been observed in various crops including wheat and chickpea [51].

3.2.1. Measuring Moisture and pH Values of the Residual Growing Medium

Residual growing medium moisture and pH were monitored in situ using a 2-in-1 portable meter, with weekly readings taken before morning irrigation (Table 4, Figures S2 and S3). All samples remained within the optimal moisture range (scale 3–8, green zone, Figure S2). For 2.0.S (control), it was approximately 5, while with biochar only (2.B.S), the moisture level was 6–7. Additionally, for 2.BF.S (biochar + fertilizer) moisture level was approximately 7, and for 2.F.S (fertilizer only) was lower, approaching the red, dry zone. This data aligns with previous studies demonstrating biochar’s capacity to improve soil water retention by increasing porosity and reducing bulk density, thus enhancing water availability to plants [35,51]. The Table 4. also showed the measurement of pH values in the field with a 2-in-1 soil meter (lower scale on the meter, Figure S3). It can be seen from the figure that the samples containing biochar have a higher pH value compared to the samples in which there is no presence of PLB. Series 2 mirrored this trend, biochar treatments (2.B.S, 2.BF.S) maintained higher pH values compared to fertilizer only and control plots (Table 4).
Final laboratory measurements of growing medium moisture and pH underscore the positive impact of biochar on maintaining optimal growing medium conditions (Table 4, Figure S5). As expected, higher moisture levels were recorded in more frequently irrigated samples; however, samples amended with biochar (1.B.S and 1.B.F.S) also retained more moisture compared to controls (1.0.S and 1.F.S). Under reduced irrigation, turfgrass in the 2.B treatment (with biochar) showed the best visual quality. The addition of biochar also increased growing medium pH by nearly one unit in some cases (Table 4). This effect was significant in regularly fertilized and irrigated plots, where biochar mitigated soil acidification. In the less watered series, only the 2.B.S sample maintained a near neutral pH. This increase in pH can be attributed to negatively charged functional groups on the biochar surface (e.g., phenolic, carboxyl, and hydroxyl groups), which adsorb H+ ions and thus reduce soil acidity [35,51]. The observed pH increase is attributed to the dissociation of phenolic, carboxyl, and hydroxyl functional groups, which bind H+ ions and generate negatively charged sites. Considering the pHPZC of 7.02, the PLB surface is predominantly negative at measured pH, which favors retention of cationic nutrients such as Mg2+ while limiting the sorption of anionic species like phosphate due to electrostatic repulsion [38,49,52,53]. Therefore, while biochar demonstrates clear benefits in improving soil moisture and moderating acidity, this effect is quantitatively supported by its ANC (6.38 mmol/g) and CaCO3 equivalent (34.4%) (Table 3), confirming its alkalinity and liming potential. These properties enable PLB to maintain a near-neutral soil pH, which is crucial for optimal turfgrass growth and overall soil health.

3.2.2. Electrical Conductivity (EC) and Cation Exchange Capacity (CEC) of Residual Growing Medium (S)

Electrical conductivity (EC) was assessed in all growing medium treatments to evaluate the influence of PLB and fertilizer application under different irrigation regimes (Table 5). The EC values differed significantly among treatments (p < 0.05), with the highest conductivity observed in 2.F.S and 2.BF.S. In contrast, the lowest values were recorded in biochar-amended treatments under regular irrigation (1.B.S and 1.BF.S).
Under well-watered conditions, the control soil (1.0.S) exhibited an EC of 0.43 ± 0.05 mS/cm. The addition of PLB alone (1.B.S) slightly reduced EC to 0.39 ± 0.03 mS/cm, while the combination of PLB and fertilizer (1.BF.S) further decreased EC to 0.38 ± 0.04 mS/cm. In contrast, the fertilizer-only treatment (1.F.S) increased EC to 0.65 ± 0.01 mS/cm. This suggests that PLB may buffer salt accumulation when used with fertilizers. The buffering behavior likely results from the carbonate/bicarbonate system derived from mineral carbonates in the ash fraction, together with weak acid-base functional groups (–COOH, –OH, cofirmed with FTIR spectra) on the carbon surface, which regulate ion retention and charge balance. These combined mechanisms mitigate salinity buildup by adsorbing and redistributing soluble ions, thus maintaining a more stable EC and ionic environment in the soil [21,38]. Under limited irrigation, the control soil (2.0.S) showed elevated EC (0.98 ± 0.05 mS/cm), likely due to reduced leaching. The addition of PLB (2.B.S) markedly reduced EC (0.48 ± 0.02 mS/cm), supporting the concept that biochar aids in mitigating salinity under water stress by facilitating ion adsorption and retention. However, combining fertilizer with limited water (2.F.S and 2.BF.S) led to high EC values (2.66 ± 0.03 and 2.14 ± 0.02 mS/cm) probably due to insufficient water to facilitate leaching. Still, PLB attenuated this increase-consistent with literature reporting that low-EC biochars (<2 mS/cm) can moderate soil salinity even when salts are introduced through fertilizers [32]. Cation exchange capacity (CEC) values determined by the BaCl2 method varied across treatments, reflecting differences in ionic composition and the influence of soluble salts (Table 5). The biochar itself (PLB) exhibited a high CEC of 74.42 ± 0.91 cmolc/kg, confirming its strong ion-exchange potential derived from oxygen-containing functional groups and ash-associated minerals [40]. Interestingly, the highest CEC value (142.6 cmolc/kg) was recorded for the control soil under limited irrigation (2.0.S), i.e., without biochar or fertilizer addition. This can be attributed to ion concentration effects caused by restricted water availability, which likely resulted from overconcentration of soluble cations under water deficit rather than an actual structural increase in exchange sites [54]. Overall, PLB demonstrated the ability to modulate growing medium EC and CEC, especially under constrained irrigation, by reducing salinity buildup in both fertilized and non-fertilized conditions. These results underscore the function of PLB to improving mitigating salt stress, which are critical for sustainable turfgrass management in urban green spaces.

3.2.3. Chlorophyll Content as Indicator of Biofertilizer Efficiency

According to the results obtained in this study, the chlorophyll content in grass samples treated with biofertilizer either alone (B.G) or in combination with mineral fertilizer (BF.G) was relatively high and stable compared to untreated controls (Figure 6). The BF treatment consistently showed the highest total chlorophyll concentration, with sample 1.BF.G reaching 43.17 ± 0.43 mg/L and sample 2.BF.G reaching 31.79 ± 0.22 mg/L, indicating enhanced photosynthetic activity and improved plant vigor. This suggests that the synergistic effect of biofertilizer and mineral nutrients promotes pigment biosynthesis, likely through improved nutrient availability and microbial stimulation in the rhizosphere. In both series, biofertilizer alone (B) also positively influenced chlorophyll content (1.B.G: 29.41 ± 0.11 mg/L; 2.B.G: 30.41 ± 0.41 mg/L), performing significantly better than the fertilizer-only treatments (1.F.G: 25.05 ± 0.052 mg/L; 2.F.G: 19.23 ± 0.80 mg/L) and in some cases even outperforming the untreated control. Interestingly, F treatments (mineral fertilizer alone) yielded the lowest chlorophyll concentrations in both series most notably in 2.F.G, where total chlorophyll dropped below the level of the control (2.0.G), suggesting limited efficiency when used without biological supplementation. When comparing the two series, series 1 generally had higher chlorophyll values across all treatments, indicating that growth conditions or environmental factors in that series may have further supported pigment accumulation. However, the relative trends remained consistent across both series: BF > B > F > control, supporting the robustness of the biofertilizer effect.
Similar to the study on Moringa oleifera, where chlorophyll content remained high and stable even after prolonged postharvest storage (with maximum values reaching 65 mg/L under optimal extraction conditions), our findings demonstrate that biofertilizer-treated grass maintained chlorophyll levels comparable to known chlorophyll-rich plant sources [25]. While Moringa oleifera chlorophyll preservation depended on extraction solvent and time, in our study, biological input and treatment combination were the determining factors for chlorophyll retention and plant health [25].
Our results underline the potential of the tested biofertilizer to serve as an effective and sustainable amendment for grass cultivation. The consistent increase in chlorophyll content, particularly in BF treatments, highlights its role in promoting physiological quality and productivity. The parallel trends observed across both experimental series reinforce the reliability of the biofertilizer’s effect and its applicability under varying growth conditions. These findings align with prior studies demonstrating enhanced chlorophyll content following biofertilizer application in grasses. For instance, black soldier fly frass organic fertilizer significantly increased leaf chlorophyll in forage grasses such as Timothy and PRG, alongside improved shoot growth [55].

3.2.4. Chemical Characterization of Residual Growing Medium and Turfgrass Samples

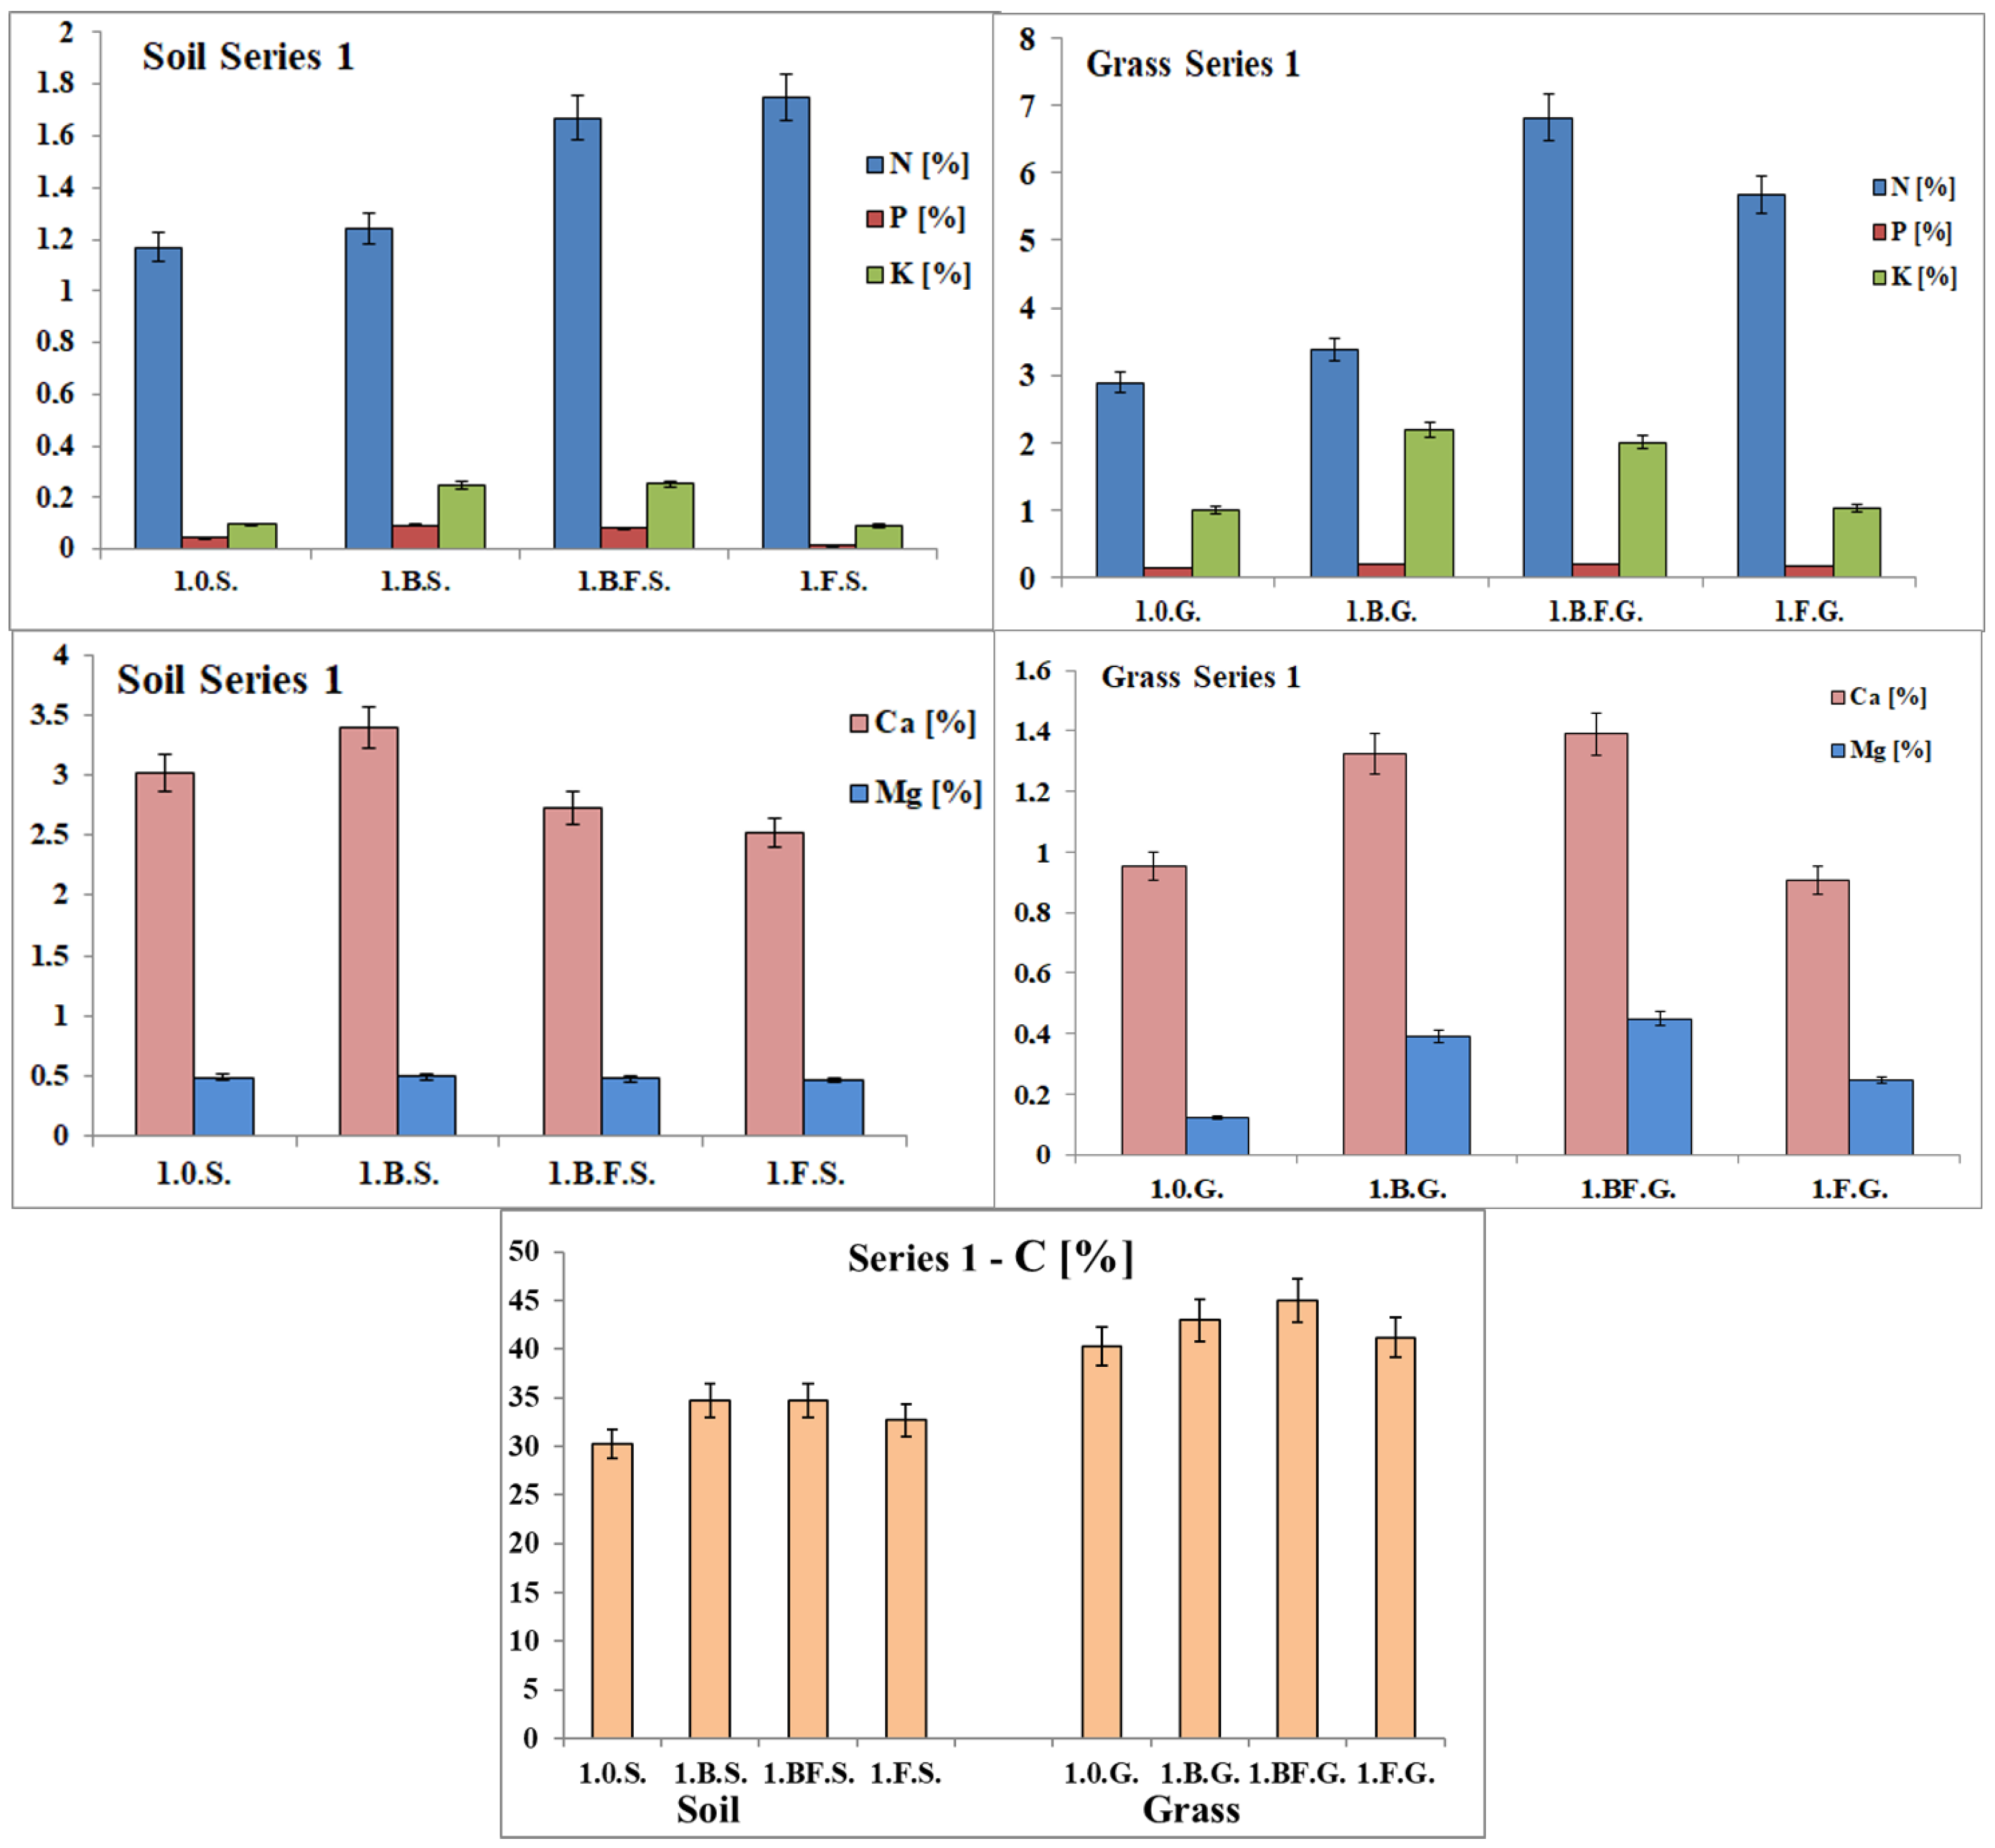
Elemental analysis of both residual growing medium (Soil) and turfgrass (Grass) samples (Figure 7) reveals that biochar application positively influences nutrient dynamics, particularly nitrogen (N) uptake. While growing medium N concentrations were similar between fertilized treatments with and without biochar (1.BF.S = 1.70% vs. 1.F.S = 1.79%), turfgrass grown with biochar exhibited noticeably higher N content (1.BF.G = 6.82%) compared to grass without biochar (1.F.G = 5.68%). This suggests that biochar enhances nitrogen availability and uptake efficiency, likely through improved root development, stimulation of microbial biomass, and better synchronization between nutrient supply and plant demand [56,57]. Combination biochar with fertilizer may improve synchronization between nitrogen supply and plant demand, optimizing nutrient use and minimizing losses [58].
The application of PLB biochar markedly influenced both the physicochemical parameters of the growing medium (S samples) and the nutrient status of turfgrass (G samples). In the growing medium, the incorporation of PLB (1.B.S) under regular irrigation (Figure 7) increased C, P, and K the contents of compared with the untreated control (1.0.S), while simultaneously maintaining higher Ca and Mg levels. The combination of PLB and fertilizer (1.BF.S) further enhanced soil P (0.082%) and K (0.176%), indicating improved nutrient retention and reduced leaching losses. These improvements are consistent with the pHPZC of PLB (Table 3), confirming that biochar contributed additional negatively charged sites that stabilized cations in exchangeable form. The presence of oxygenated surface functional groups (–COOH, –OH, confirmed with FTIR spectra) and mineral phases in the PLB biochar likely facilitated electrostatic binding and cation exchange with nutrient ions (NH4+, K+, Mg2+, Ca2+), thereby improving nutrient retention [59,60]. Furthermore, the pH increase from 6.45 to 7.30 (Table 4) enhanced the availability of base cations while minimizing potential P fixation under acidic conditions. This effect was particularly evident in the higher soil Ca and Mg contents in the PLB treatments compared with fertilizer-only (1.F.S) soils. The improved nutrient status of the growing medium was reflected in the turfgrass composition (G samples). Grass grown on PLB amended soils (1.B.G and 1.BF.G) exhibited higher tissue concentrations of N, K, Mg, and Ca compared with the control (1.0.G), along with a clear increase in total chlorophyll (Chl a + b = 29–43 mg/g, Figure 6). The co-application of fertilizer with PLB (1.BF.S) led to the highest nutrient uptake, with N = 6.82% and K = 1.19%, suggesting synergistic effects between biochar and fertilizer in maintaining nutrient availability in the rhizosphere.
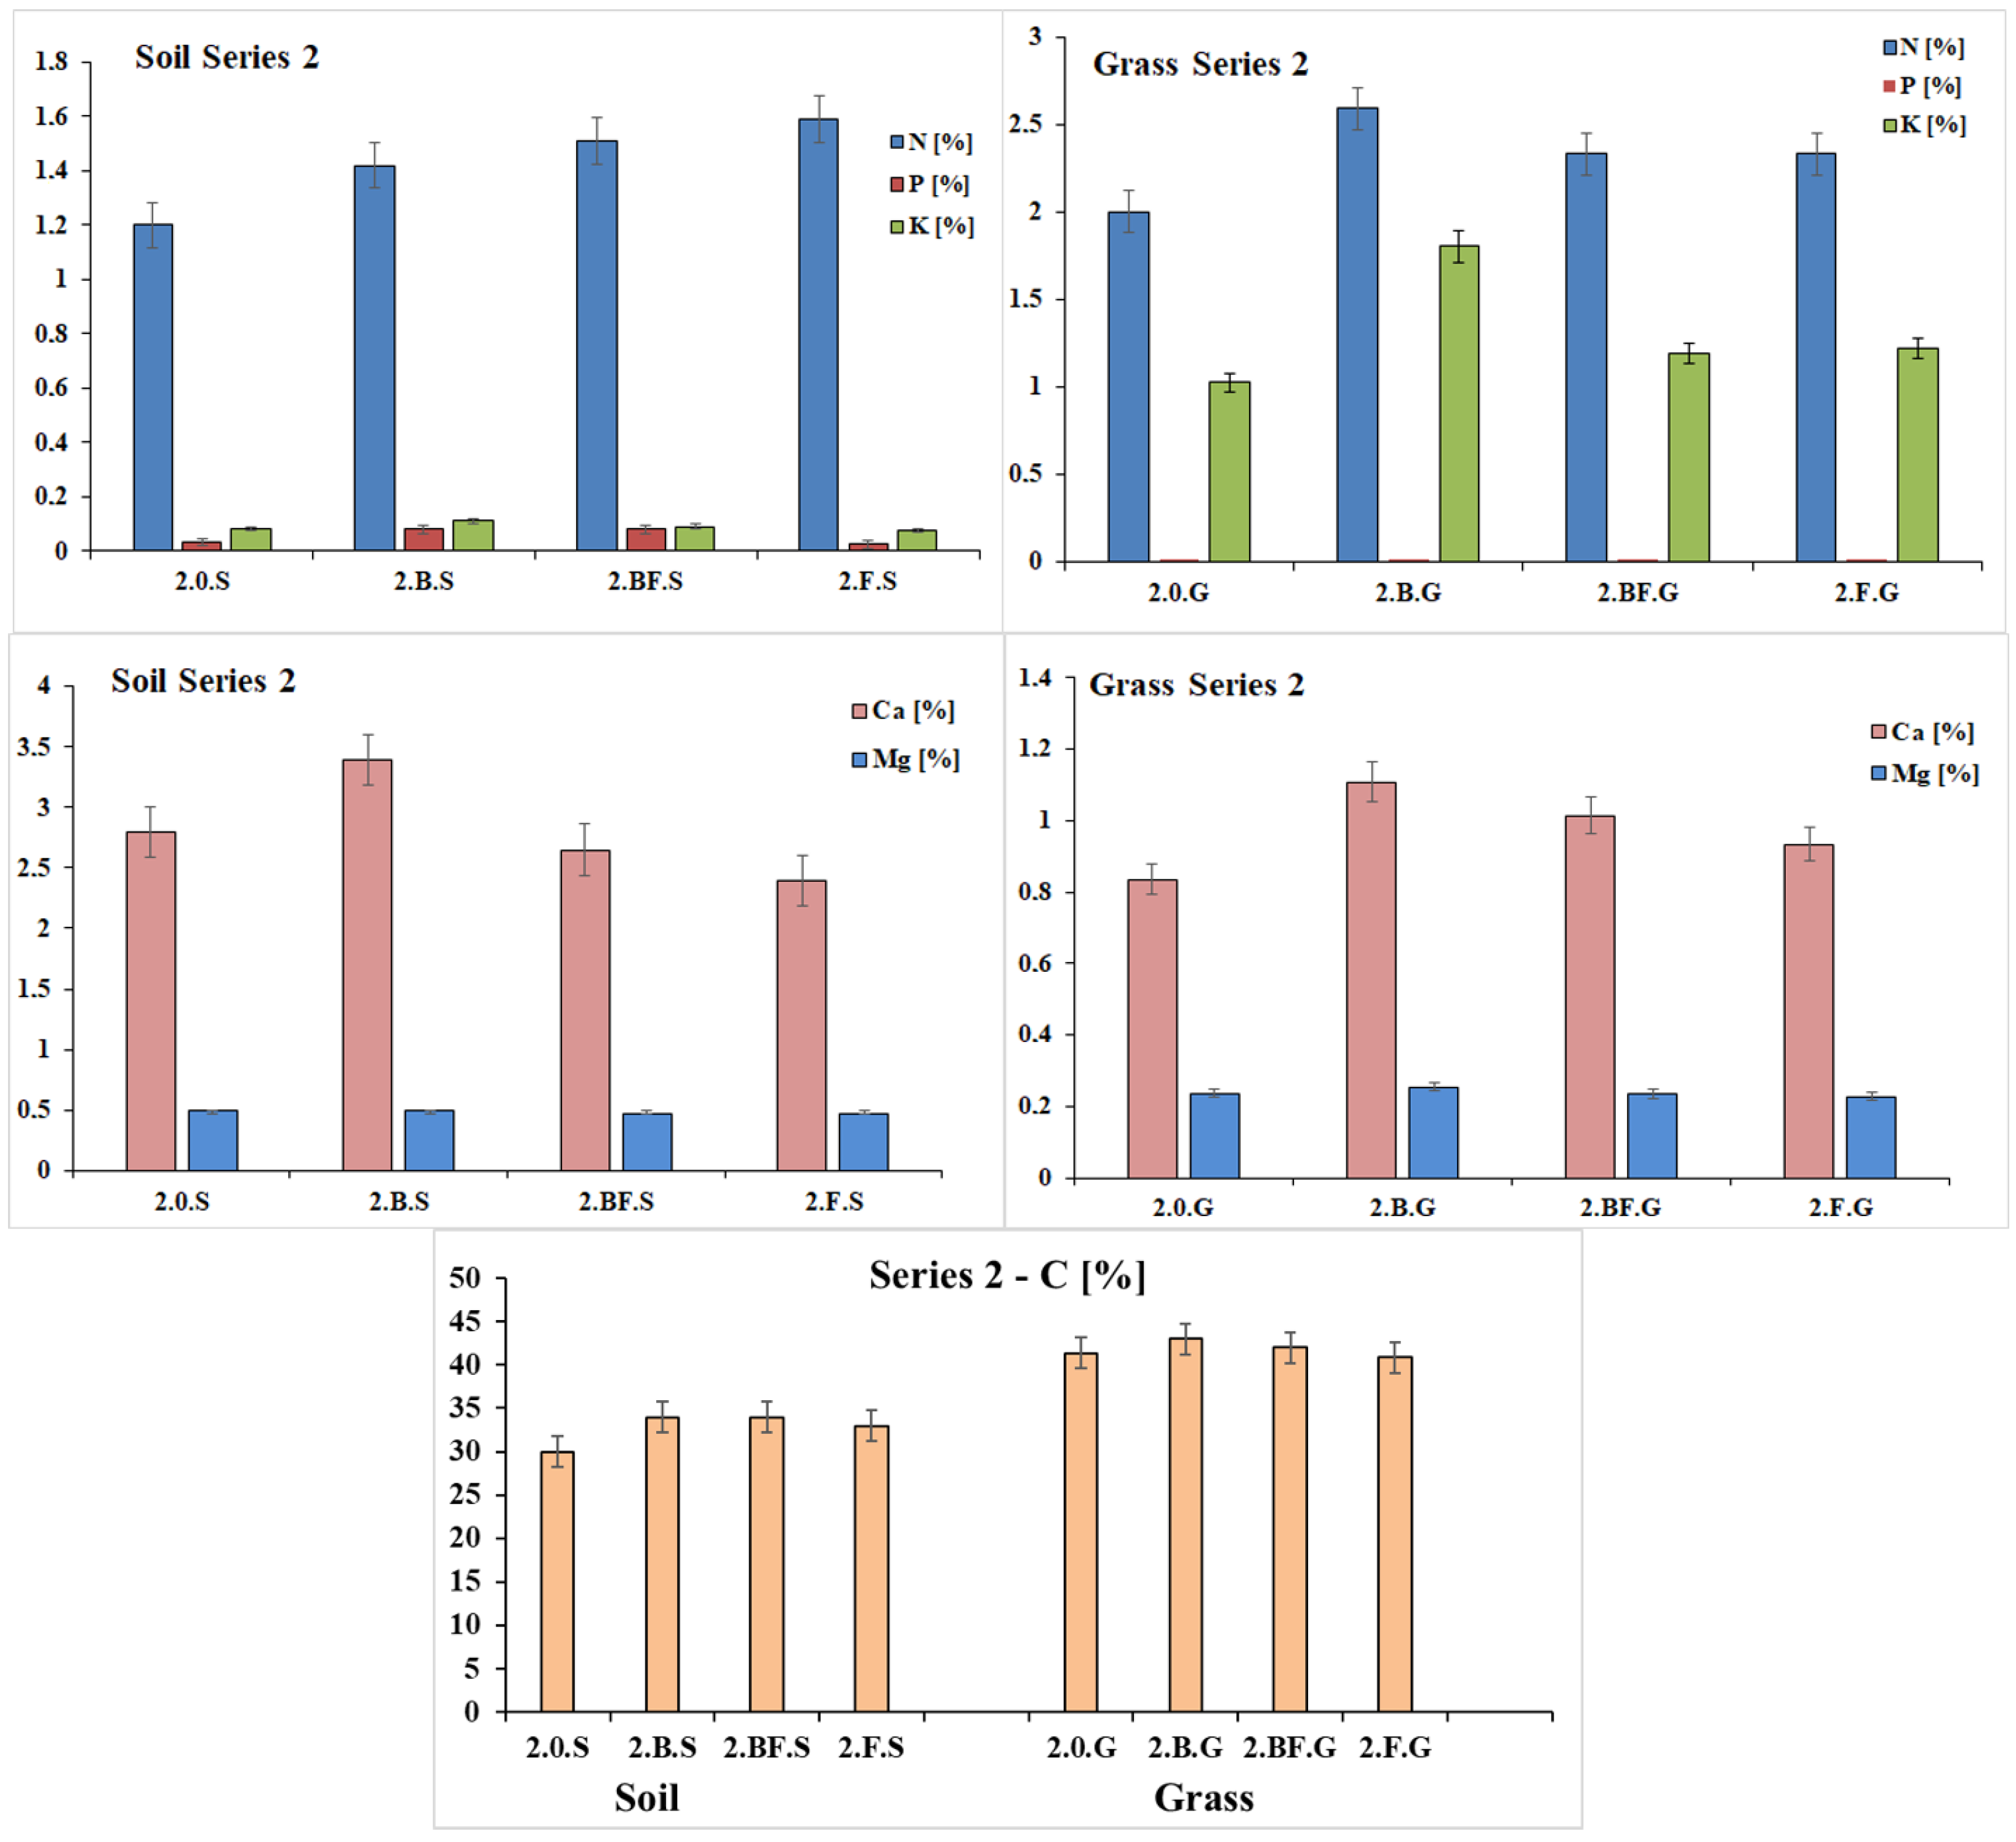
Under limited irrigation (Series 2, Figure 8), the PLB amended soils retained higher levels of Ca and K, even though total nutrient concentrations in the control (2.0.S) were reduced. The buffering and moisture-holding properties of PLB likely mitigated nutrient depletion during water reduction, preventing excessive ion loss and maintaining a balanced ionic environment in the root zone. These findings are consistent with previous reports showing that biochar can improve nutrient retention in drought-prone soils by stabilizing exchangeable cations and reducing nutrient mobility [59,60]. The turfgrass grown under limited irrigation (Series 2) showed overall lower nutrient contents, particularly for N and P, reflecting water limitation and reduced nutrient mobility. However, PLB-treated samples (2.B.G and 2.BF.G) still maintained higher K, Mg, and Ca concentrations than the fertilizer-only treatment, along with increased chlorophyll levels (Chl a + b = 30–32 mg g−1 vs. 19 mg g−1 in 2.F.G, Figure 6). These observations indicate that PLB biochar not only improved growing medium nutrient retention but also enhanced nutrient transfer to the plant, mitigating the adverse effects of drought stress on turfgrass nutrition and photosynthetic capacity. Overall, the chemical analysis supports the conclusion that biochar application, particularly in combination with fertilizer, enhances nutrient retention, improves plant uptake, and promotes the overall quality and sustainability of turfgrass cultivation.

3.2.5. Statistical Analysis of Pot Experiments Under Outdoor Conditions

The present study clearly demonstrates that the application of biochar (B and BF) has a notable impact on both growing medium quality and plant performance. Across nearly all analyzed parameters, B and BF consistently outperformed both the sole fertilizer treatment (F) and the control (0). This was statistically confirmed by two-way ANOVA and Tukey’s post hoc test, with B forming a distinct group, indicating superior efficiency. In residual growing medium samples, biochar increased total carbon content, essential nutrients (N, P, K), and moisture retention, while also slightly increasing pH. The applied treatment had a highly significant effect on total C and K content (p < 0.001), as well as a significant effect on EC, Ca, and N levels (p < 0.01). Additionally, significant differences were observed in soil Mg content and pH values (p < 0.05). Besides the treatment, differences in irrigation regimes also significantly contributed to variation in soil moisture, phosphorus content, and EC. The Figure 9 showed the effect of treatments and two different irrigation regime (Series 1 and Series 2) as the most important variables for soil samples.
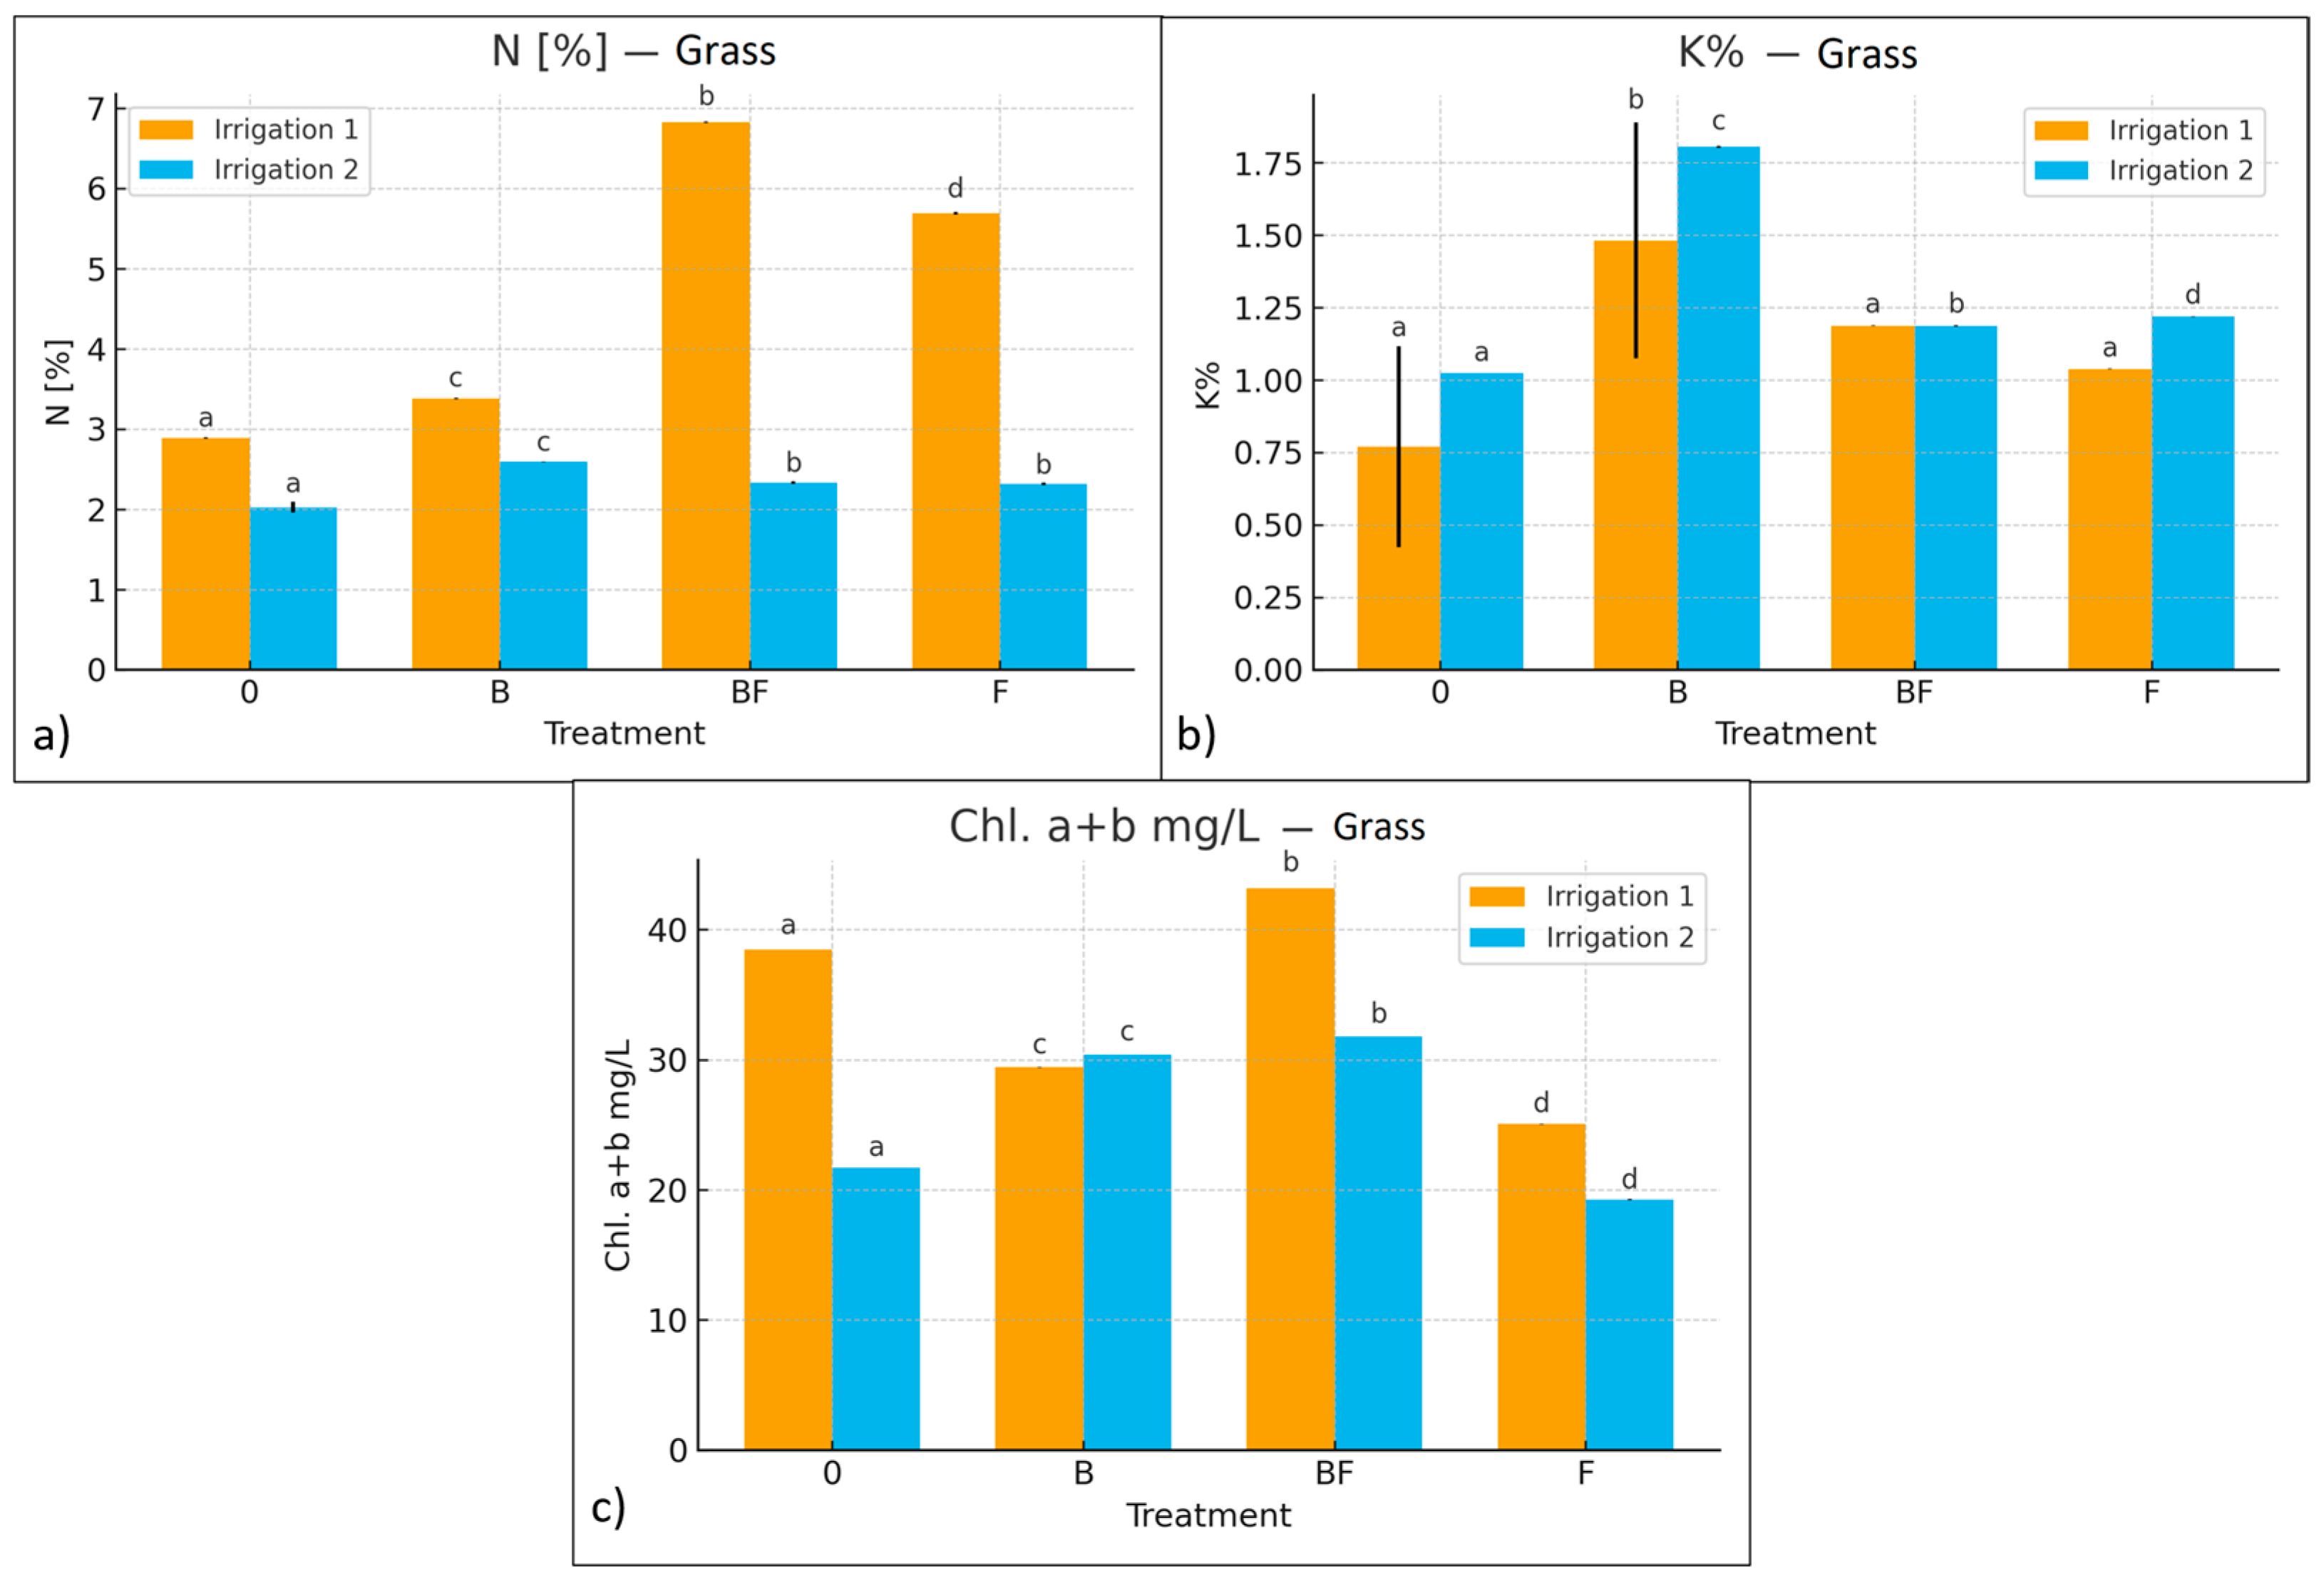
In grass samples, both biochar and BF treatments differed significantly from the control (Figure 10). Treatment effects were moderate but significant (p < 0.05) for the content of carbon (C), phosphorus (P), and magnesium (Mg), and highly significant for nitrogen (N) and calcium (Ca) (p < 0.01). The effects of the treatment were strongly significant for all chlorophyll fractions and potassium (K) content (p < 0.001). In addition to the treatment, differences in irrigation also had an impact on the differentiation of chlorophyll content, Ca, and N, with a minor effect observed on Mg content. Figure 10 shows the effects of the treatments and the two different irrigation regimes (Series 1 and Series 2) on the most important turfgrass plant parameters. The statistical analysis further emphasizes that B and BF treatments form a distinct group across most parameters, supporting their superior performance. These findings underline the potential of biochar/fertilizer combinations as sustainable soil amendments to improve crop productivity under variable water availability.
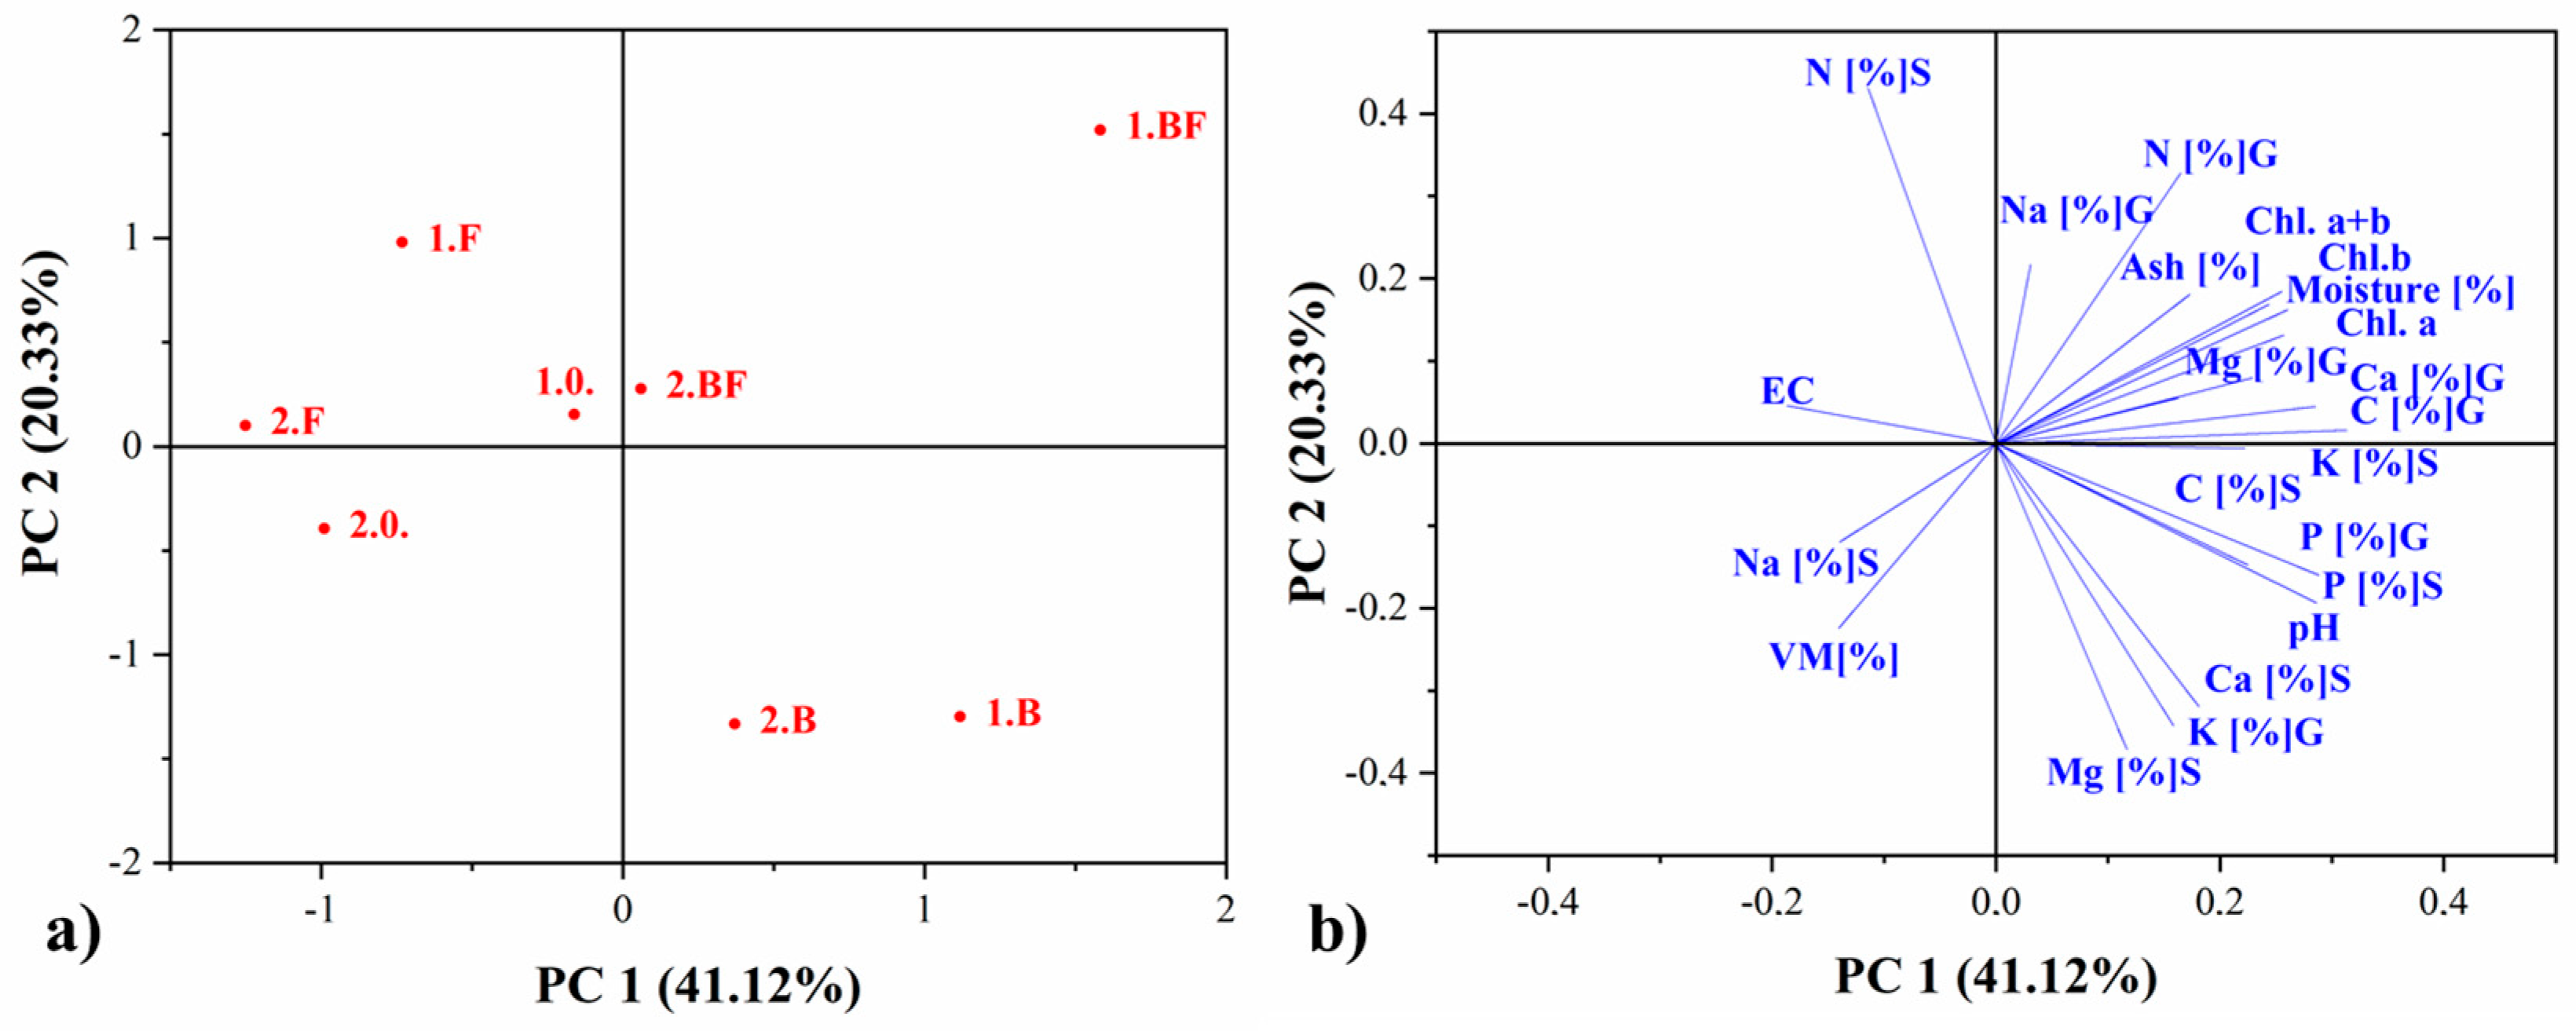
PCA analysis of growing medium and grass data revealed a clear separation of treatments according to biochar content (Figure 11). PC1 explained most of the variance, distinguishing biochar containing samples (B and BF) on the positive side from controls and fertilizer only treatments (1.0, 2.0, 1.F, and 2.F) on the negative side. PC2 reflected the effect of fertilizer application, with nitrogen enriched samples located on its positive side. In Figure 11b, biochar treatments were separated mainly by plant nutrient content, chlorophyll concentration, pH, moisture, and most soil nutrients. Other treatments were distinguished primarily by EC values and the contents of volatile matter, Na, and N in the soil. These results indicate that biochar application induced significant shifts in growing medium composition and plant nutrient uptake, as visualized by PCA.

4. Conclusions

The production of biochar (PLB) from Paulownia leaves (PL) via slow pyrolysis presents a fast, simple, and cost-effective approach for obtaining a stable, carbon-rich soil conditioner. Comprehensive characterization of the resulting PLB through proximate and elemental analysis; pH, pHPZC, EC, CEC, ANC, and pH buffering capacity measurement; FTIR spectroscopy; and SEM/EDX confirms its potential as a growing medium improver for turfgrass cultivation. In combination with nitrogen (N) fertilizer under regular irrigation, the biochar demonstrated the most excellent efficacy among all tested treatments. This approach resulted in visibly healthier, denser, and greener turfgrass. Moreover, biochar mitigated soil acidification associated with N fertilizer application and enhanced the availability of essential macronutrients including potassium (K), calcium (Ca), and magnesium (Mg). In addition to improved nutrient uptake, an increase in chlorophyll content was observed in turfgrass treated with biochar, underscoring its role in enhancing physiological quality and productivity. Also, under limited irrigation conditions, turfgrass grown in biochar-amended soil without fertilizer still exhibited superior vitality, neutral growing medium pH, and increased moisture content compared to untreated controls. Overall, ANOVA and PCA confirmed that biochar significantly influenced growing medium properties and plant nutrient uptake across treatments. In summary, the use of Paulownia leaf-derived biochar proved to be a low-cost, practical, and sustainable strategy for supporting turfgrass health. Future research should focus on optimizing application rates and exploring the influence of soil type, fertilizer composition, temperature, and long-term field conditions to improve the agronomic value of biochar further. These limitations do not diminish the potential utility of PLB, but they highlight the need for further studies using standardized protocols and monitoring to assess functional outcomes.

Supplementary Materials

The following supporting information can be downloaded at: https://www.mdpi.com/article/10.3390/agriculture15212206/s1, Figure S1. Division of samples in the block according to treatment (0, B, BF and F) and irrigation regimes (Series 1 and 2). Figure S2. Field measurement of soil moisture. Relative values on a unit less scale ranging approximately from 0 (completely dry) to 10 (saturated), and does not express soil moisture as a percentage by weight or volume. Figure S3. Field measurement of soil pH value. Figure S4. Average daily and nighttime air temperature, Precipitation and total monthly rainfall. Figure S5. Laboratory measument of Moisture [%] and pH value. Values are expressed as mean ± standard deviation (n = 6), (Tukey HSD, p < 0.05). Figure S6. The point of zero charges (pHpzc) of the PLB surface (mark with red line).

Author Contributions

Conceptualization, M.K. and J.P.; methodology, M.S.; software, J.D.; validation, J.P., M.S. and M.E.; formal analysis, S.T.; investigation, M.K.; resources, J.D.; data curation, S.T.; writing-original draft preparation, M.K.; writing-review and editing, J.P. and M.S.; visualization, M.E.; supervision, M.K. and J.P. All authors have read and agreed to the published version of the manuscript.

Funding

The authors are grateful to the Ministry of Science, Technological Development and Innovation of the Republic of Serbia for the financial support (contract no. 451-03-136/2025-03/200023 and 451-03-136/2025-03/200168).

Data Availability Statement

The data presented in this study are available on request from the corresponding author. The data are not publicly available because our institution does not have a dedicated data repository.

Conflicts of Interest

The authors declare no conflicts of interest.

References

  1. Bock, H.; Wickings, K. Collembola (Isotomidae) and mowing management practices control distinct aspects of thatch decomposition in a lawn mesocosm experiment. Pedobiologia 2023, 101, 150896. [Google Scholar] [CrossRef]
  2. Wang, R.; Mattox, C.M.; Phillips, C.L.; Kowalewski, A.R. Carbon Sequestration in Turfgrass-Soil Systems. Plants 2022, 11, 2478. [Google Scholar] [CrossRef]
  3. Ali, L.; Xiukang, W.; Naveed, M.; Ashraf, S.; Nadeem, S.M.; Haider, F.U.; Mustafa, A. Impact of Biochar Application on Germination Behavior and Early Growth of Maize Seedlings: Insights from a Growth Room Experiment. Appl. Sci. 2021, 11, 11666. [Google Scholar] [CrossRef]
  4. Sisay, A.; Girma, E. Biochar: Usage, Potential as Alternative to Chemical Fertilizer and Impact of Biochar on Soil-Microbial-Plant, Root Interaction. Ind. Eng. Manag. 2021, 10, 311. [Google Scholar] [CrossRef]
  5. Rombel, A.; Krasucka, P.; Oleszczuk, P. Sustainable biochar-based soil fertilizers and amendments as a new trend in biochar research. Sci. Total Environ. 2022, 816, 151588. [Google Scholar] [CrossRef]
  6. Hamidi, N.H.; Ahmed, O.H.; Omar, L.; Ch´ng, H.Y. Soil Nitrogen Sorption Using Charcoal and Wood Ash. Agronomy 2021, 11, 1801. [Google Scholar] [CrossRef]
  7. Wu, L.; Liu, X.; Yu, Y.; Ma, X. Biochar, grass, and cross-ridge reshaped the surface runoff nitrogen under consecutive rainstorms in loessial sloping lands. Agric. Water Manag. 2022, 261, 107354. [Google Scholar] [CrossRef]
  8. Shen, Y.; Yu, S.; Yuan, R.; Wang, P. Biomass pyrolysis with alkaline-earth-metal additive for co-production of bio-oil and biochar-based soil amendment. Sci. Total Environ. 2020, 743, 140760. [Google Scholar] [CrossRef]
  9. Hale, L.; Curtis, D.; Azeem, M.; Montgomery, J.; Crowley, D.; McGiffen, M., Jr. Influence of compost and biochar on soil biological properties under turfgrass supplied deficit irrigation. Appl. Soil Ecol. 2021, 168, 104134. [Google Scholar] [CrossRef]
  10. Wilson, R.; Suk Kim, H.; Bontchev, R.P.; Wahlgren, N.C.; Traxler, V.; Thompson, T.A.; Buege, B.; Jarand, M. Method for Application of Biochar in Turf Grass and Landscaping Environments. U.S. Patent No. 10,392,313, 25 February 2021. [Google Scholar]
  11. Koprivica, M.; Petrović, J.; Ercegović, M.; Simić, M.; Milojković, J.; Šoštarić, T.; Dimitrijević, J. Improvement of combustible characteristics of Paulownia leaves via hydrothermal carbonization. Biomass Conv. Bioref. 2024, 14, 3975–3985. [Google Scholar] [CrossRef]
  12. Koprivica, M.; Simić, M.; Petrović, J.; Ercegović, M.; Dimitrijević, J. Evaluation of Adsorption Efficiency on Pb(II) Ions Removal Using Alkali-Modified Hydrochar from Paulownia Leaves. Processes 2023, 11, 1327. [Google Scholar] [CrossRef]
  13. Domingues, R.; Trugilho, P.; Silva, C.; De Melo, I.C.; Melo, L.; Magriotis, Z.; Sánchez-Monedero, M. Properties of biochar derived from wood and high-nutrient biomasses with the aim of agronomic and environmental benefits. PLoS ONE 2017, 12, e0176884. [Google Scholar] [CrossRef]
  14. Chen, L.; Li, X.; Peng, Y.; Xiang, P.; Zhou, Y.; Yao, B.; Zhou, Y.; Sun, C. Co-application of biochar and organic fertilizer promotes the yield and quality of red pitaya (Hylocereus polyrhizus) by improving soil properties. Chemosphere 2022, 294, 133619. [Google Scholar] [CrossRef]
  15. ASTM D1762-84; Standard Test Method for Chemical Analysis of Wood Charcoal. ASTM International: West Conshohocken, PA, USA, 1984.
  16. Petrović, J.; Perišić, N.; Dragišić Maksimović, J.; Maksimović, V.; Kragović, M.; Stojanović, M.; Laušević, M.; Mihajlović, M. Hydrothermal conversion of grape pomace: Detailed characterization of obtained hydrochar and liquid phase. J. Anal. Appl. Pyrol. 2016, 118, 267–277. [Google Scholar] [CrossRef]
  17. U.S. EPA Method 3052. Microwave Assisted Acid Digestion of Siliceous and Organically Based Matrices. In Test Methods for Evaluating Solid Wastes: Physical/Chemical Methods, EPA SW-846; U.S. Environmental Protection Agency: Washington, DC, USA, 1996.
  18. ISO 11466:1995; Soil Quality—Extraction of Trace Elements Soluble in Aqua Regia. International Organization for Standardization: Geneva, Switzerland, 1995.
  19. Awwad, N.S.; El-Nadi, Y.A.; Hamed, M.M. Successive processes for purificationand extraction of phosphoric acid produced by wet process. Chem. Eng. Process. 2013, 74, 69–74. [Google Scholar] [CrossRef]
  20. Yuan, J.-H.; Xu, R.-K.; Zhang, H. The forms of alkalis in the biochar produced from crop residues at different temperatures. Bioresour. Technol. 2011, 102, 3488–3497. [Google Scholar] [CrossRef]
  21. Singh, B.; Dolk, M.M.; Shen, Q.; Camps-Arbestain, M. Biochar pH, electrical conductivity and liming potential. In Chapter 3. in Biochar: A Guide to Analytical Methods; Singh, B., Camps-Arbestain, M., Lehmann, J., Eds.; Csiro Publishing: Clayton, Australia, 2017; pp. 23–28. ISBN 1486305105/9781486305100. [Google Scholar]
  22. Milićević, T.; Relić, D.; Škrivanj, S.; Tešić, Ž.; Popović, A. Assessment of major and trace element bioavailability in vineyard soil applying different single extraction procedures and pseudo-total digestion. Chemosphere 2017, 171, 284–293. [Google Scholar] [CrossRef] [PubMed]
  23. Haq, N.; Farhan, A.; Waseem, A.; Junaid, A.; Zahid, M.; Hudood, U.; Noor, U.B. Soil Electrical conductivity as Affected by Biochar Under Summer Crops. Int. J. Environ. Sci. Nat. Res. 2018, 14, 555887. [Google Scholar]
  24. Nel, T.; Bruneel, Y.; Smolders, E. Comparison of five methods to determine the cation exchange capacity of soil. J. Plant Nutr. Soil Sci. 2023, 186, 311–320. [Google Scholar] [CrossRef]
  25. Ngcobo, S.; Bada, S.O.; Ukpong, A.M.; Risenga, I. Optimal chlorophyll extraction conditions and postharvest stability in Moringa (M. Oleifera) leaves. J. Food Meas. Charact 2024, 18, 1611–1626. [Google Scholar] [CrossRef]
  26. McBeath, A.; Wurster, C.; Bird, M. Influence of feedstock properties and pyrolysis conditions on biochar carbon stability as determined by hydrogen pyrolysis. Biomass Bioenergy 2015, 73, 155–173. [Google Scholar] [CrossRef]
  27. Murillo-Acevedo, Y.; Grande, C. Grass clippings to biochar: A promising soil amendment for sustainable agriculture under drip irrigation. Environ. Chem. Eng. 2024, 12, 114856. [Google Scholar] [CrossRef]
  28. Kalina, M.; Sovova, S.; Svec, J.; Trudicova, M.; Hajzler, J.; Kubikova, L.; Enev, V. The Effect of Pyrolysis Temperature and the Source Biomass on the Properties of Biochar Produced for the Agronomical Applications as the Soil Conditioner. Materials 2022, 15, 8855. [Google Scholar] [CrossRef]
  29. Shyam, S.; Ahmed, A.; Joshi, S.; Sarma, H. Biochar as a Soil amendment: Implications for soil health, carbon sequestration, and climate resilience. Discover Soil 2025, 2, 18. [Google Scholar] [CrossRef]
  30. Pandian, K.; Vijayakumar, S.; Mustafa, M.R.A.F.; Subramanian, P.; Chitraputhirapillai, S. Biochar—A sustainable soil conditioner for improving soil health, crop production and environment under changing climate: A review. Front. Soil Sci. 2024, 4, 1376159. [Google Scholar] [CrossRef]
  31. Li, S.; Barreto, V.; Li, R.; Chen, G.; Hsieh, Y. Nitrogen retention of biochar derived from different feedstocks at variable pyrolysis temperatures. J. Anal. Appl. Pyrol. 2018, 133, 136–146. [Google Scholar] [CrossRef]
  32. Jassal, R.; Johnson, M.; Molodovskaya, M.; Black, A.; Jollymore, A.; Sveinson, K. Nitrogen enrichment potential of biochar in relation to pyrolysis temperature and feedstock quality. J. Environ. Manag. 2015, 152, 140–144. [Google Scholar] [CrossRef]
  33. Clough, T.J.; Condron, L.M.; Kammann, C.; Müller, C. A Review of Biochar and Soil Nitrogen Dynamics. Agronomy 2013, 3, 275–293. [Google Scholar] [CrossRef]
  34. Li, J.; Song, M.; Yin, J.; Fenton, O.; Gao, L.; Tian, Y. The beneficial effects of biochar on overall soil quality and plant performance are dose-dependent and are closely associated with soil pH. Pedosphere 2025. [Google Scholar] [CrossRef]
  35. Jeffery, S.; Verheijen, F.G.A.; van der Velde, M.; Bastos, A.C. A quantitative review of the effects of biochar application to soils on crop productivity using meta-analysis. Agric. Ecosyst. Environ. 2011, 144, 175–187. [Google Scholar] [CrossRef]
  36. Regulation (EU) 2019/1009 of the European Parliament and of the Council of 5 June 2019 Laying Down Rules on the Making Available on the Market of EU Fertilizing Products and Amending Regulations (EC) No 1069/2009 and (EC) No 1107/2009 and Repealing Regulation (EC) No 2003/2003 (Text with EEA Relevance). Available online: https://www.lexaris.de/library/tableofcontents/2056005 (accessed on 26 May 2025).
  37. Liao, J.; Hao, G.; Guo, H.; Chen, H. Effects of biochar on plant and microbial communities in landfill soil. Appl. Soil Ecol. 2024, 204, 105749. [Google Scholar] [CrossRef]
  38. Bolan, N.; Sarmah, A.; Bordoloi, S.; Bolan, S.; Padhye, L.; Van Zwieten, L.; Sooriyakumar, P.; Khan, B.A.; Ahmad, M.; Solaiman, Z.; et al. Soil acidification and the liming potential of biochar. Environ. Pollut. 2023, 317, 120632. [Google Scholar] [CrossRef]
  39. Shi, R.-Y.; Hong, Z.-N.; Li, J.-Y.; Jiang, J.; Baquy, M.; Xu, R.-K.; Qian, W. Mechanisms for Increasing the pH Buffering Capacity of an Acidic Ultisol by Crop Residue-Derived Biochars. J. Agric. Food Chem. 2017, 65, 8111–8119. [Google Scholar] [CrossRef]
  40. Liu, S.; Cen, B.; Yu, Z.; Qiu, R.; Gao, T.; Long, X. The key role of biochar in amending acidic soil: Reducing soil acidity and improving soil acid buffering capacity. Biochar 2025, 7, 52. [Google Scholar] [CrossRef]
  41. Wu, B.; Yang, H.; Li, S.; Tao, J. The effect of biochar on crop productivity and soil salinity and its dependence on experimental conditions in salt-affected soils: A meta-analysis. Carbon Res. 2024, 3, 56. [Google Scholar] [CrossRef]
  42. Zhao, M.; Dai, Y.; Zhang, M.; Feng, C.; Qin, B.; Zhang, W.; Zhao, N.; Li, Y.; Ni, Z.; Xu, Z.; et al. Mechanisms of Pb and/or Zn adsorption by different biochars: Biochar characteristics, stability, and binding energies. Sci. Total Environ. 2020, 717, 136894. [Google Scholar] [CrossRef] [PubMed]
  43. Mihajlović, M.; Petrović, J.; Maletić, S.; Kragulj Isakovski, M.; Stojanović, M.; Lopičić, Z.; Trifunović, S. Hydrothermal carbonization of Miscanthus×giganteus: Structural and fuel properties of hydrochars and organic profile with the ecotoxicological assessment of the liquid phase. Energy Convers. Manag. 2018, 159, 254–263. [Google Scholar] [CrossRef]
  44. Lee, M.-E.; Park, J.H.; Chung, J.W. Adsorption of Pb(II) and Cu(II) by Ginkgo-Leaf-Derived Biochar Produced under Various Carbonization Temperatures and Times. Int. J. Environ. Res. Public Health 2017, 14, 1528. [Google Scholar] [CrossRef]
  45. Florio, G.; Zwier, T.; Myshakin, E.; Jordan, K.; Sibert, E. Theoretical modeling of the OH stretch infrared spectrum of carboxylic acid dimers based on first-principles anharmonic couplings. J. Chem. Phys. 2003, 118, 1735–1746. [Google Scholar] [CrossRef]
  46. Liang, B.; Lehmann, J.; Solomon, D.; Kinyangi, J.; Grossman, J.; O’Neill, B.; Skjemstad, J.O.; Thies, J.; Luizão, F.J.; Petersen, J.; et al. Black carbon increases cation exchange capacity in soils. Soil Sci. Soc. Am. J. 2006, 70, 1719–1730. [Google Scholar] [CrossRef]
  47. Chen, B.; Chen, Z.; Lv, S. A novel magnetic biochar efficiently sorbs organic pollutants and phosphate. Bioresour. Technol. 2011, 102, 716–723. [Google Scholar] [CrossRef]
  48. Wang, D.; Jiang, P.; Zhang, H.; Yuan, W. Biochar production and applications in agro and forestry systems: A review. Sci. Total Environ. 2020, 723, 137775. [Google Scholar] [CrossRef]
  49. Yan, L.; Gao, G.; Lu, M.; Riaz, M.; Zhang, M.; Tong, K.; Yu, H.; Yang, Y.; Hao, W.; Niu, Y. Insight into the Amelioration Effect of Nitric Acid-Modified Biochar on Saline Soil Physicochemical Properties and Plant Growth. Plants 2024, 13, 3434. [Google Scholar] [CrossRef]
  50. He, K.; Liu, Q.; Zhang, J.; Zhang, G.; Li, G. Biochar Enhances the Resistance of Legumes and Soil Microbes to Extreme Short-Term Drought. Plants 2023, 12, 4155. [Google Scholar] [CrossRef] [PubMed]
  51. Zhang, W.; Niu, W.; Luo, H. Effect of Biochar Amendment on the Growth and Photosynthetic Traits of Plants Under Drought Stress: A Meta-Analysis. Agronomy 2024, 14, 2952. [Google Scholar] [CrossRef]
  52. Premalatha, R.P.; Poorna Bindu, J.; Nivetha, E.; Malarvizhi, P.; Manorama, K.; Parameswari, E.; Davamani, V. A review on biochar’s effect on soil properties and crop growth. Front. Energy Res. 2023, 11, 1092637. [Google Scholar] [CrossRef]
  53. Jatav, H.S.; Rajput, V.D.; Minkina, T.; Singh, S.K.; Chejara, S.; Gorovtsov, A.; Barakhov, A.; Bauer, T.; Sushkova, S.; Mandzhieva, S.; et al. Sustainable Approach and Safe Use of Biochar and Its Possible Consequences. Sustainability 2021, 13, 10362. [Google Scholar] [CrossRef]
  54. Song, X.; Chen, C.; Arthur, E.; Tuller, M.; Zhou, H.; Shang, J.; Ren, T. Cation exchange capacity and soil pore system play key roles in water vapour sorption. Geoderma 2022, 424, 116017. [Google Scholar] [CrossRef]
  55. Rodgers, E.; Nicolson, E.; Lauder, S.; Hodge, S. Response of Pasture Grasses to Organic Fertilizer Produced from Black Soldier Fly Frass. Plants 2024, 13, 943. [Google Scholar] [CrossRef] [PubMed]
  56. Li, C.; Liang, H.; Gao, D.; Wang, Y.; Jin, K.; Liu, J.; Xue, D.; Chen, Y.; Li, Y.; Gao, T.; et al. Comparative study on the effects of soil quality improvement between urban spontaneous groundcover and lawn. Ecol. Indic. 2023, 148, 110056. [Google Scholar] [CrossRef]
  57. Yu, L.; Yu, M.; Lu, X.; Tang, C.; Liu, X.; Brookes, P.C.; Xu, J. Combined application of biochar and nitrogen fertilizer benefits nitrogen retention in the rhizosphere of soybean by increasing microbial biomass but not altering microbial community structure. Sci Total Environ. 2018, 640, 1221–1230. [Google Scholar] [CrossRef] [PubMed]
  58. Basalirwa, D.; Sudo, S.; Wacal, C.; Zaw, O.A.; Sasagawa, D.; Yamamoto, S.; Masunaga, T.; Nishihara, E. Impact of fresh and aged palm shell biochar on N2O emissions, soil properties, nutrient content and yield of Komatsuna (Brassica rapa var. perviridis) under sandy soil conditions. Soil Sci. Plant Nutr. 2020, 66, 328–343. [Google Scholar] [CrossRef]
  59. Jindo, K.; Audette, Y.; Higashikawa, F.S.; Silva, C.A.; Akashi, K.; Mastrolonardo, G.; Sánchez-Monedero, M.A.; Mondini, C. Role of biochar in promoting circular economy in the agriculture sector. Part 1: A review of the biochar roles in soil N, P and K cycles. Chem. Biol. Technol. Agric. 2020, 7, 15. [Google Scholar] [CrossRef]
  60. Zhu, Z.; Zhang, Y.; Tao, W.; Zhang, X.; Xu, Z.; Xu, C. The Biological Effects of Biochar on Soil’s Physical and Chemical Characteristics: A Review. Sustainability 2025, 17, 2214. [Google Scholar] [CrossRef]
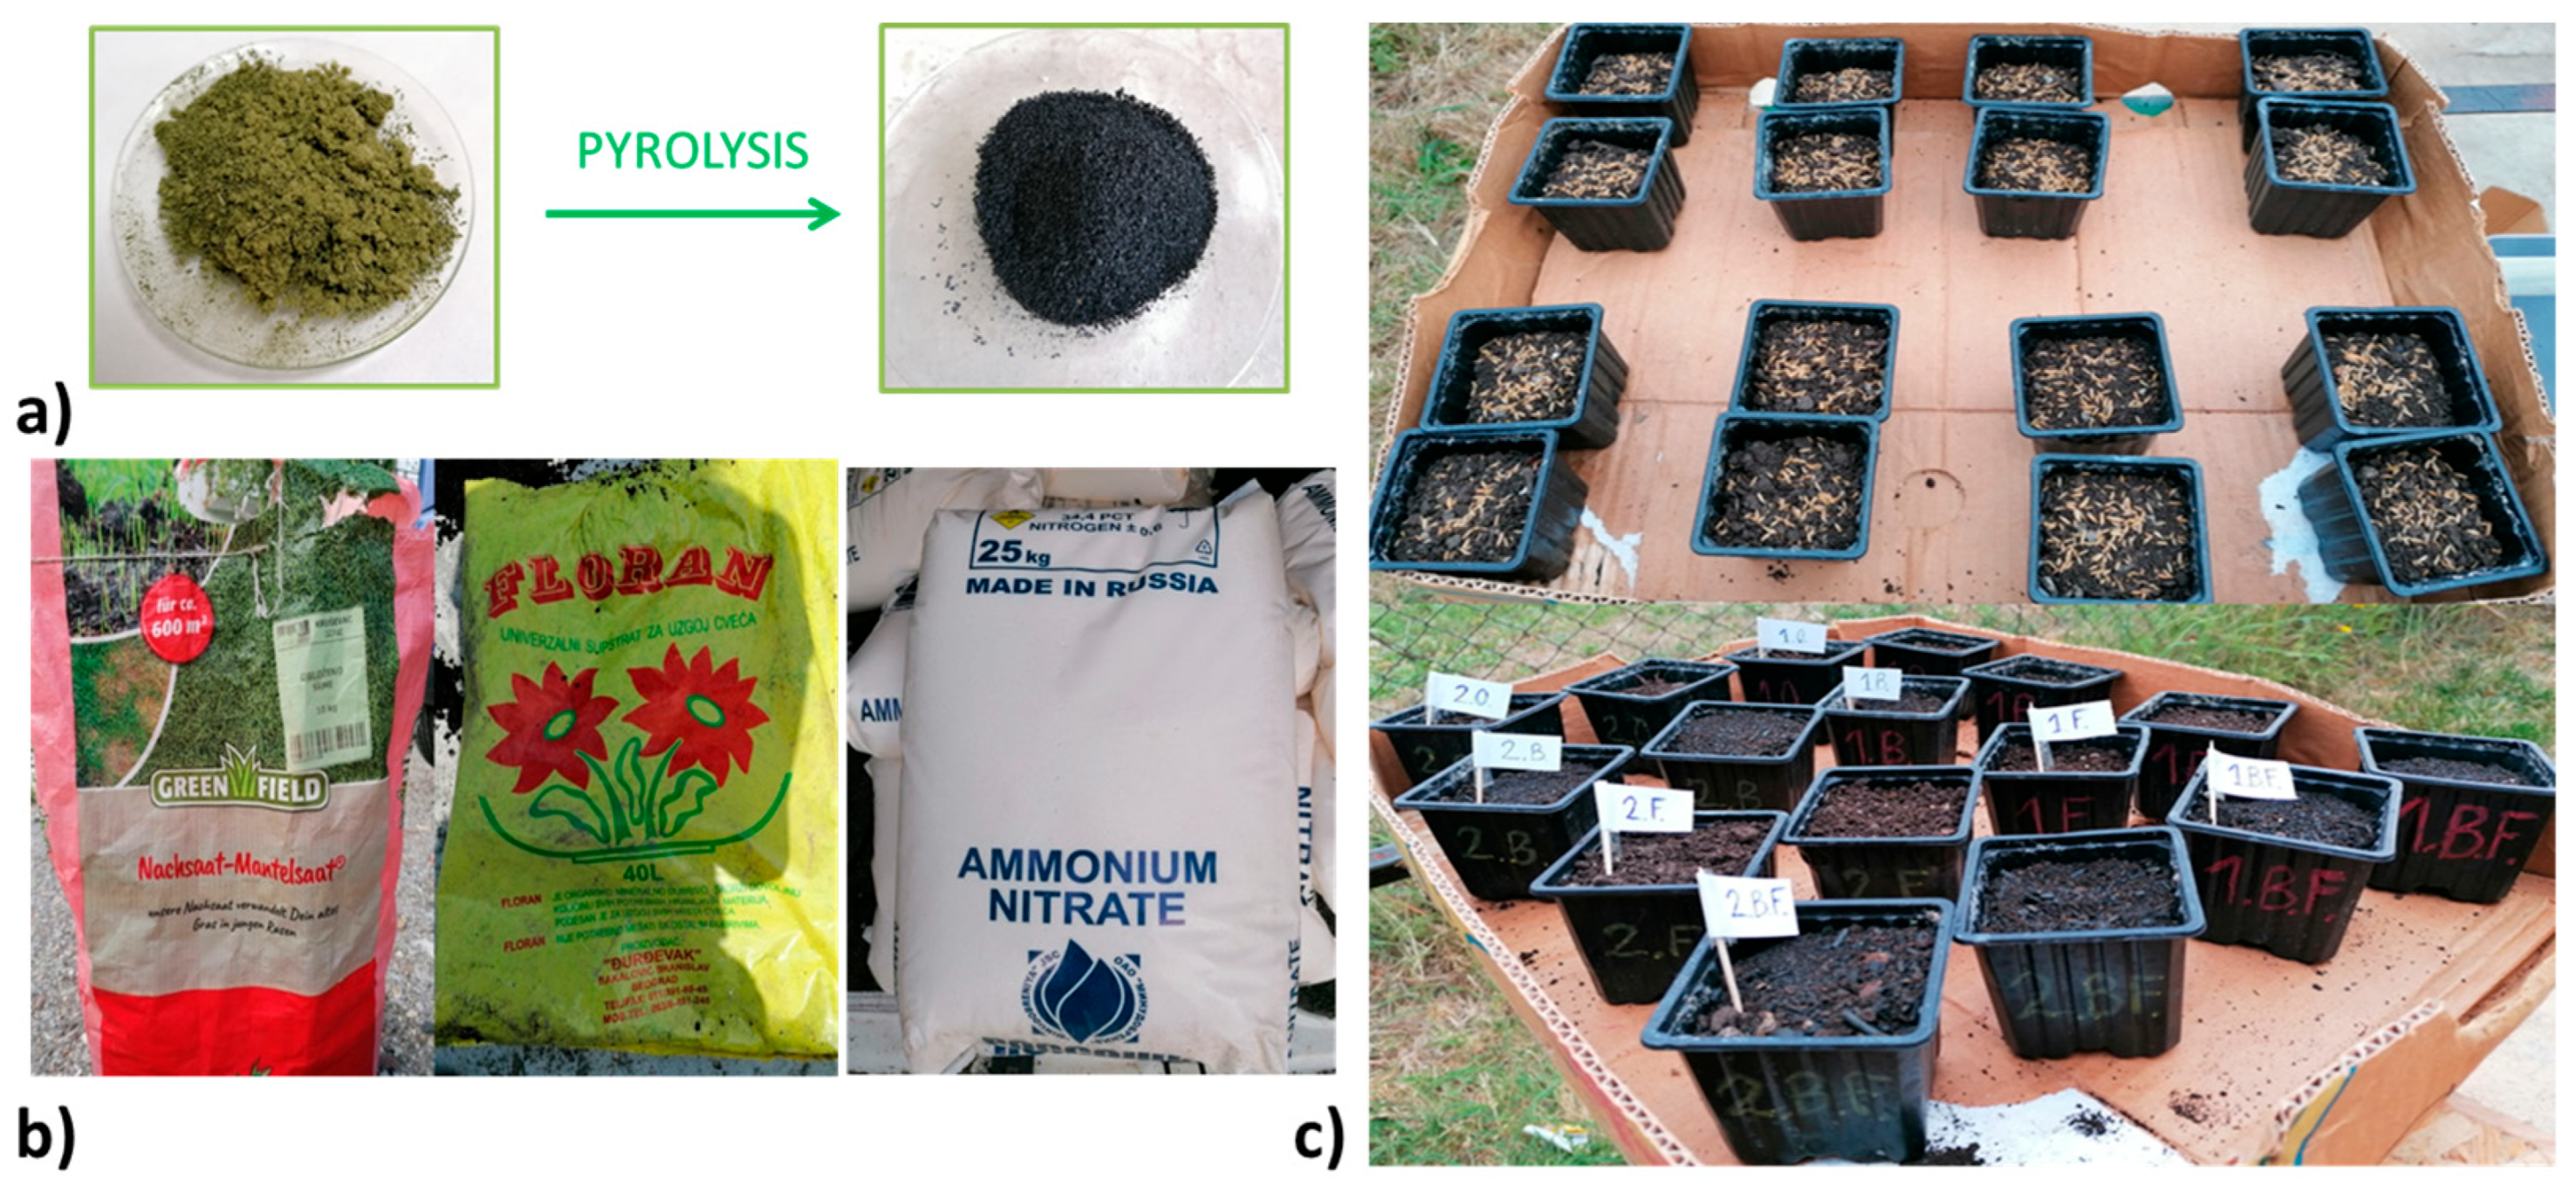
Figure 1. (a) Used biochar (PLB); (b) Turfgrass seed mix, growing medium and fertilizer used in the study; (c) The planting experiment.
Agriculture 15 02206 g001
Figure 2. Comparison of FTIR spectra of the PL and PLB samples.
Agriculture 15 02206 g002
Figure 3. SEM/EDX spectra of samples PL and PLB.
Agriculture 15 02206 g003
Figure 4. The appearance of the turfgrass after: (a) one month of planting and (b) two month of planting.
Agriculture 15 02206 g004
Figure 5. The appearance of the turfgrass at the end of the experiment.
Agriculture 15 02206 g005
Figure 6. Chlorophyll content in the grass samples. Error bars represent standard deviation (n = 6), p < 0.05.
Agriculture 15 02206 g006
Figure 7. Comparison of macronutrient content in residual growing medium (Soil) and turfgrass tissue (Grass) of regularly watered samples (Series 1). Error bars represent standard deviation (n = 6), p < 0.05.
Agriculture 15 02206 g007
Figure 8. Comparison of macronutrient content in residual growing media (Soil) and turfgrass tissue (Grass) of less watered samples (Series 2). Error bars represent standard deviation (n = 6), p < 0.05.
Agriculture 15 02206 g008
Figure 9. Effects of biochar (B), fertilizer (F), and their combination (BF) on residual growing medium parameters: (a) moisture content, (b) pH, and (c) electrical conductivity (EC), under two irrigation regimes (Irrigation 1 = regular; Irrigation 2 = reduced). Different letters indicate significant differences among treatments within the same irrigation regime (Tukey HSD, p < 0.05).
Agriculture 15 02206 g009
Figure 10. Effects of biochar (B), fertilizer (F), and their combination (BF) on (a) turfgrass nitrogen content, (b) turfgrass potassium content and (c) total chlorophyll (a + b), under two irrigation regimes (Irrigation 1 = regular; Irrigation 2 = reduced). Different letters indicate significant differences among treatments within the same irrigation regime (Tukey HSD, p < 0.05).
Agriculture 15 02206 g010
Figure 11. Principal component analysis (PCA) of soil/growing medium (S) and turfgrass (G) parameters under regular (Series 1) and limited irrigation (Series 2) for control (0), biochar (B), biochar + fertilizer (BF), and fertilizer-only (F) treatments. (a) Score plot showing the distribution of samples according to treatment and irrigation regime. (b) Loading plot illustrating the contribution of soil (S) and grass (G) variables to the principal components. S = soil/growing medium characteristics; G = grass tissue characteristics.
Agriculture 15 02206 g011
Table 1. The chemical composition of PL and PLB sample.
ParameterPLPLB
Proximate
Analysis (wt%)
MY a
(wt%)
-38.95 ± 0.22
Moisture8.71 ± 0.046.19 ± 0.07
Volatiles77.01 ± 0.6535.81 ± 0.71
Ash5.69 ± 0.2017.92 ± 0.31
Cfix b8.89 ± 0.1540.06 ± 0.35
Elemental
analysis (%)
Carbon45.71 ± 0.1963.38 ± 0.42
Hydrogen6.05 ± 0.024.77 ± 0.01
H/C atomic1.570.90
Oxygen b38.22 ± 0.148.86 ± 0.03
Nitrogen3.79 ± 0.01 4.84 ± 0.02
Sulfur0.53 ± 0.020.23 ± 0.03
K1.02 ± 0.03 1.57 ± 0.04
Na0.060 ± 0.020.02 ± 0.00
Ca1.74 ± 0.013.76 ± 0.03
Mg0.32 ± 0.000.55 ± 0.04
P0.22 ± 0.010.57 ± 0.01
Si0.32 ± 0.030.34 ± 0.02
Fe0.03 ± 0.010.10 ± 0.02
Al0.023 ± 0.0500.075 ± 0.032
Mn0.004 ± 0.0210.010 ± 0.001
Ti<0.01 <0.01
pH in water5.70 ± 0.018.67 ± 0.03
a MY (mass yields) = % weight of the biomass was measured before and after pyrolysis; b Content was calculated by difference. Three replicates of each sample were determined, and the average values along with standard deviations were reported, p < 0.05.
Table 2. The concentrations of heavy metals and arsenic of PL and PLB sample.
MetalPL (mg/kg)PLB (mg/kg)EBC AgroBio Limit (mg/kg)EBC Agro Limit (mg/kg)IBI Limit (mg/kg)
Pb<0.01<0.0145120150
Cd<0.011.13 ± 0.000.71.51.5
Cu<0.016.35 ± 0.0270100300
Ni1.12 ± 0.007.24 ± 0.002550100
Hg<0.000001<0.0000010.41.01.0
Zn7.38 ± 0.0014.41 ± 0.01200400500
Cr0.53 ± 0.021.92 ± 0.017090120
As<0.000001<0.000001131313
Values are expressed as mean ± standard deviation (n = 3), p < 0.05.
Table 3. The physicochemical characteristics of PLB sample.
pHpzc7.02 ± 0.06
pH buff. [mmol/g] 0.30 ± 0.01
ANC [mmol/g]6.38 ± 0.09
CaCO3eq [%]34.4 ± 0.91
EC [mS/cm]1.74 ± 0.02
CEC [cmolc/kg]74.42 ± 0.83
Values are expressed as mean ± standard deviation (n = 3), p < 0.05.
Table 4. Moisture and pH of the residual growing medium (S) after four different treatments and two watering regimes.
Field MeasurementsLaboratory Measurements
Moisture
[Unit on the Scale] *
pHMoisture [%]pH
1.0.S6.0 ± 0.16.0 ± 0.513.77 ± 0.22 d6.45 ± 0.14 b
1.B.S8.0 ± 0.17.0 ± 0.114.03 ± 0.61 c7.30 ± 0.27 a
1.BF.S7.5 ± 0.26.5 ± 0.215.40 ± 0.80 a6.90 ± 0.73 b
1.F.S6.0 ± 0.15.5 ± 0.611.54 ± 0.60 f5.92 ± 0.51 c
2.0.S5.0 ± 0.16.0 ± 0.510.51 ± 0.07 g6.31 ± 1.02 b
2.B.S6.0 ± 0.27.0 ± 0.112.87 ± 0.31 e7.05 ± 0.90 a
2.BF.S7.0 ± 0.26.5 ± 0.212.05 ± 0.83 e6.74 ± 0.04 b
2.F.S4.0 ± 0.16.0 ± 0.511.71 ± 0.70 f5.54 ± 0.08 c
* Relative values on a unit less scale ranging approximately from 0 (completely dry) to 10 (saturated), and does not express soil moisture as a percentage by weight or volume. Values are expressed as mean ± standard deviation (n = 6), Different letters indicate significant differences among treatments within the same irrigation regime (Tukey HSD, p < 0.05).
Table 5. The results of EC and CEC of residual growing medium (S) samples after four different treatments and two watering regimes.
Soil SamplesEC [mS/cm]CEC [cmolc/kg]
1.0.S0.43 ± 0.05 d115.43 ± 0.34 c
1.B.S0.39 ± 0.03 d120.76 ± 0.12 b
1.BF.S0.38 ± 0.04 d110.18 ± 0.28 e
1.F.S0.65 ± 0.01 c106.88 ± 0.51 e
2.0.S0.98 ± 0.05 b142.60 ± 0.43 a
2.B.S0.48 ± 0.02 d111.63 ± 0.55 d
2.BF.S2.14 ± 0.02 a114.13 ± 0.17 c
2.F.S2.66 ± 0.03 a114.94 ± 0.62 c
Values are expressed as mean ± standard deviation (n = 6), Different letters indicate significant differences among treatments within the same irrigation regime (Tukey HSD, p < 0.05).
Disclaimer/Publisher’s Note: The statements, opinions and data contained in all publications are solely those of the individual author(s) and contributor(s) and not of MDPI and/or the editor(s). MDPI and/or the editor(s) disclaim responsibility for any injury to people or property resulting from any ideas, methods, instructions or products referred to in the content.