Abstract
The distribution of grain particles within a silo influences heat and moisture transfer during stored grain ventilation, leading to grain quality losses. A study on porosity distribution analysis and ventilation tests was conducted in a pilot silo with a height of 3 m, a diameter of 1.5 m, and a conical dome height of 0.85 m. The E-B constitutive model was incorporated into the secondary development of FLAC3D 5.0 to analyze the vertical pressure distribution in the grain bulk. An anisotropic porosity distribution model for the maize bulk was developed, accounting for both vertical pressure and segregation mechanisms. The differences in airflow and heat transfer during ventilation between isotropic and anisotropic porosity distributions were quantified. A nonlinear model was innovatively proposed to predict the temperature front curve (TFC) during ventilation as affected by porosity variation. The results indicate that friction between the maize kernel and the silo wall led to vertical pressure at the center of the bottom that was 10.7% higher than that near the wall. The average surface porosity of the maize bulk was 2.8% higher than at the bottom. This led to a minimum porosity of 0.409 at the center of the silo bottom, due to the combined effect of impact during the loading process and vertical pressure. The numerical simulation demonstrated excellent consistency with the experimental data. At a supply vent air velocity of 0.126 m/s, an increase in the maize bulk height from 0.725 m to 2.9 m resulted in reductions in airflow rate and average relative humidity of 20.3% and 9.67%. The airflow velocity near the wall was 13.4% higher than that in the center, leading to a faster cooling rate in the peripheral region compared to the center of the maize bulk. The airflow velocity based on the isotropic porosity model was higher at the center than that predicted by the anisotropic model, whereas the opposite trend was observed near the wall. The temperature front during ventilation based on the anisotropic porosity model exhibited a concave curve. A nonlinear model was developed to predict this temperature front, showing strong agreement with computational data.
1. Introduction
The aggregate annual production of all corn varieties in China surpasses 280 million tons [1]. A significant portion of this yield requires safe and efficient storage to minimize post-harvest losses. During storage, ventilation is a critical operation for controlling temperature and moisture levels, thereby inhibiting mold growth and insect infestation. However, the inevitable presence of broken kernels and non-uniform kernel distribution during loading often leads to heterogeneous porosity within the grain bulk [2]. This results in localized areas with low airflow passage where heat and moisture accumulate, creating breeding grounds for pests and mold development that ultimately cause grain quality deterioration [3,4].
As a key parameter governing airflow and convective heat and mass transfer in porous media like grain bulks, porosity has been the focus of several studies [5]. During the loading process of maize kernels into silos, the segregation mechanism causes smaller broken kernels to accumulate directly beneath the feeding point, filling the voids and resulting in lower porosity [6]. The larger intact kernels with lower surface friction tend to flow toward the silo walls, and a skeletal framework formed by larger kernels leads to higher localized porosity in these regions [7]. Existing standard formulas typically express porosity or density as a function of geometric depth, assuming that the vertical pressure is uniform at the same depth within the grain bulk, with greater emphasis placed on the overall average compression effect induced by self-weight [8,9,10,11]. However, due to the presence of silo wall friction, the vertical pressure distribution inside the grain bulk becomes highly non-uniform. The pressure calculated using standard formulas deviates from the actual pressure within the bulk. Therefore, it is necessary to clarify the stress state inside the grain bulk and the constitutive relationships governing compressibility under different pressure levels. The anisotropic porosity distribution, varying in both radial and vertical directions, significantly influences airflow pathways and resistance during ventilation [12]. Understanding the non-uniform three-dimensional distribution of porosity is essential for revealing the heat and mass transfer mechanisms within the grain bulk during ventilation. Bartosik and Maier [13] analyzed the differences in airflow resistance between the central and peripheral regions of the silo. Lawrence and Maier [3,14] assumed that the porosity of the maize bulk varied linearly in the radial direction and remained uniform along the vertical direction, employing the finite volume method to simulate airflow and temperature changes during ventilation. Building on this, Panigrahi et al. [15] measured porosity at only two points on the bulk surface, at the center and at a location 4.5 m from the center, obtaining values of 0.3907 and 0.4088, respectively. They then assumed that porosity increased linearly from 0.3907 at the center to a higher value in the peripheral region, while maintaining the same uniform vertical distribution with depth as assumed by Lawrence and Maier [3,14]. Although both studies accounted for variations in porosity along the radial and vertical directions, their analyses of the ventilation process were based on assumed porosity distributions and failed to accurately represent the actual porosity distribution within the grain bulk using models. In summary, existing models exhibit significant limitations in predicting heat and mass transfer during grain bulk ventilation. Most overlook the radial pressure variations caused by silo wall friction and do not integrate the radial segregation effects occurring during grain loading. As a result, they fall short of precisely characterizing the anisotropic distribution of porosity.
To address these limitations, building upon previous analysis of segregation mechanisms during central-fill maize loading [16], this study incorporates a grain stress–strain relationship model into the FLAC3D 5.0 finite difference software platform through secondary development to analyze the vertical pressure distribution within the grain bulk. An anisotropic porosity distribution model for maize was subsequently developed, taking into account the combined effects of vertical pressure and segregation mechanisms. Based on this foundation, a comparative analysis was conducted on the differences in airflow and heat and moisture transfer during the ventilation process of maize bulk with isotropic and anisotropic porosity distributions. Furthermore, a nonlinear model was innovatively proposed to predict the temperature front curve (TFC) during ventilation, accounting for the effects of porosity distribution variations to forecast temperature evolution within the ventilated grain bulk.
2. Materials and Methods
2.1. Experimental Materials and Porosity Measurement
The moisture content M of the maize used in the experiment was 12.7 ± 0.13% w.b. after drying at 103 °C for 72 h [17]. The kernel density ρs was 1256.7 kg/m3 according to GB/T 5518-2008 [18]. To establish the connection between the grain bulk pressure and the subsequent heat and moisture transfer analysis based on COMSOL Multiphysics 6.3, a standard geotechnical consolidation ring (inner diameter: 61.8 mm) was modified into a rectangular test box with a side length of 120 mm and a height of 55 mm. 450 g maize sample was placed in the test box for uniaxial compression testing. The specific procedure was as follows: A conventional geotechnical lever-loading device was employed [19], where counterweights drove a loading frame connected to the lever, as shown in Figure 1. This action applied force through a loading screw to the top plate of the maize bulk, following a sequence of predetermined load levels of 3, 13, 34, 76, 117, 159, and 200 kPa. The compressive deformation of the maize bulk during testing was recorded by measuring the vertical displacement with a dial indicator. Finally, a mapping relationship between the porosity of the grain bulk and the vertical pressure was established at each load level based on the grain mass, the dimensions of the test box, the measured sample height, and the kernel density:
where is the porosity of the grain bulk at each load level; mb is the mass of maize used in the uniaxial compression test, kg; hi is the height of the grain bulk at each load level, m.
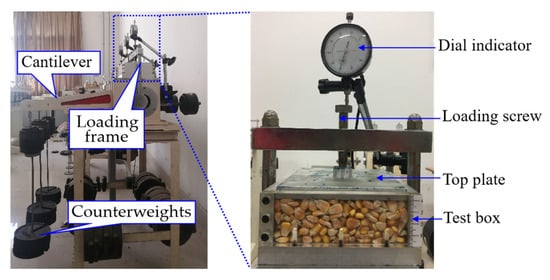
Figure 1.
Uniaxial compression test.
2.2. Analysis of Vertical Pressure in the Maize Bulk
Conventional methods for measuring spatial pressure in grain bulk using earth pressure cells often result in significant measurement errors [20] due to the non-uniform point contacts between grain kernels and the sensing membrane of the pressure sensor. The vertical pressure in the pilot silo is calculated using a combined approach of the standard and numerical simulation. According to the GB 50077-2017 [21], the vertical pressure ph at depth s within the grain bulk is given as follows:
where Cv is the stored material pressure correction coefficient for the silo, taken as 1.3; γ represents the unit weight of the maize grain maize bulk, kN/m3; ξ is the hydraulic radius of the horizontal net cross-section of the silo, m; μ is the friction coefficient between maize and the steel silo wall; k is the lateral pressure coefficient, calculated as k = tan2(45° − φ/2); s is the vertical distance from the top surface of the grain bulk to the calculated cross-section, m.
The E-B constitutive model well captures the stress–strain behavior of granular materials. The tangent deformation modulus Et and bulk deformation modulus B are calculated as follows [22]:
where K is the baseline value of the initial deformation modulus; Pa denotes atmospheric pressure; σ1 represents the axial stress in triaxial tests of maize; Kb is the baseline value of the bulk deformation modulus; Rf is the failure ratio; n characterizes the dependence of the deformation modulus on the confining pressure σ3; m reflects the relationship between the bulk modulus and σ3; c and φ denote the cohesion and internal friction angle, respectively. The relevant parameter values are shown in Table 1.

Table 1.
Parameters of maize [22].
FLAC3D employs an explicit Lagrangian algorithm and a mixed-discretization zoning technique to discretize the continuum into a mesh. Based on the velocities of all nodes at the current time step, the strain rate tensor of each element is calculated via spatial differencing. Multiplying the strain rate by the time step yields the strain increment. The stress increment is then computed according to the E-B constitutive model for maize bulk. This stress increment is added to the stress from the previous time step to obtain the updated stress at the current time step. Using the updated stresses of all elements, the contribution force of each element to its nodes is recalculated through spatial differencing. The gravitational force from the overlying grain is applied to the nodes, and vector summation is performed to determine the resultant forces.
2.3. Experimental Setup and Methods
Maize kernels were centrally loaded into a pilot silo until full. The silo structure consists of a 3 m high cylindrical body with a diameter of 1.5 m, topped by a conical dome 0.85 m in height and with a 45° slope (Figure 2a). A 0.025 m thick stainless steel wind-distribution plate was installed at the bottom edge of the silo, forming a plenum chamber. The surface was covered with ventilation steel grating to prevent kernels from falling into the air ducts and to ensure uniform airflow distribution through the grain bulk. An opening at the center of the floor plate served as the air inlet during ventilation, connected to a centrifugal fan (Model 4-72-2.8A, Foshan Xing Chen Zhao Ye Environmental Technology Co., Ltd., Foshan, China) of the ventilation system. The centrifugal fan was externally coupled to a small refrigeration air conditioner (Cooling capacity: 3650 W; Air flow: 590 m3/h, Dongguan Jinhongsheng Electric Appliance Co., Ltd., Dongguan, China) to achieve controlled climate ventilation tests. The ventilation system delivered air at a set velocity into the grain bulk from the bottom of the silo, allowing heat exchange with the kernels to achieve cooling. Both the cylindrical body and the conical dome were lined with thermal insulation layers to mitigate the impact of ambient temperature fluctuations on the internal temperature of the silo.
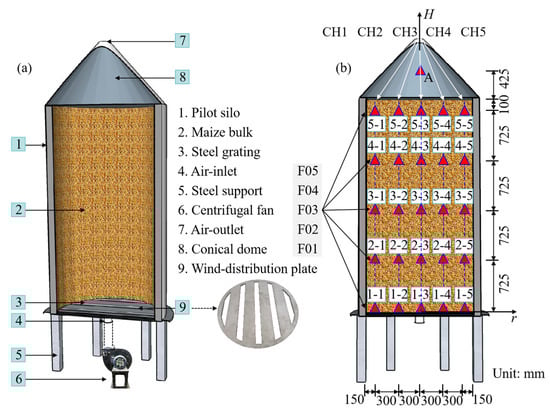
Figure 2.
Pilot silo experimental setup (a) and sensor layout inside the silo (b).
2.4. Data Monitoring and Recording
Temperature (Model PT100, Ningbo Keshun Instrument Co., Ltd., Ningbo, China) and humidity sensing (Model KS-SHTE15T, Ningbo Keshun Instrument Co., Ltd., Ningbo, China) cables were installed inside the grain bulk. Hooks were welded to the grating at the bottom of the silo at the center of each air duct opening to secure the base of these cables. Along the radial direction of the silo, cables were positioned at 0 m, 0.3 m, and 0.6 m from the center, with vertical spacing of 0.725 m along the silo height (Figure 2b). At the midpoint of the conical dome, the air inlet at the bottom of the silo, and outside the silo, one temperature sensor and one humidity sensor were installed at each location. These sensors were connected to a paperless recorder (Model KSF60A0R, Ningbo Keshun Instrument Co., Ltd., Ningbo, China) to monitor the temperature and humidity changes in the upper air layer of the grain bulk during ventilation, as well as the temperature and humidity of the grain bulk, supplied air, and ambient climate conditions during the experiment. The ventilation airflow rate was measured using a turbine flow meter installed at the silo’s air inlet.
2.5. Governing Equations for Ventilation in Heterogeneous Porosity Media
Based on the theory of heat and mass transfer in porous media and the principle of local thermal equilibrium, a coupled heat and moisture transfer model was established for the ventilation process of stored grain. Neglecting heat conduction between impurities and maize kernels during ventilation and assuming interconnected pore channels within the grain bulk allow uniform gas flow; the grain volume fraction term was incorporated into the fluid continuity equation [3].
The maize bulk represents a typical porous medium. During ventilation, as gas flows through the internal structure of the bulk, the kernels exert resistance to the airflow. Thus, a resistance term attributable to the grain bulk is incorporated into the momentum equation of fluid flow [3,23].
In the above equation, the term on the left side represents momentum transfer due to convection. The first term on the right side denotes the pressure gradient within the control volume, the second term signifies momentum diffusion caused by viscous effects, and the third term represents the momentum source term. is the velocity vector, m/s; ρa is the density of air, kg/m3; μa is the dynamic viscosity of air, Pa∙s; ▽p is the pressure gradiet, Pa. The flow resistance momentum source term in porous media is commonly modeled using the Ergun equation, in which the viscous and inertial effects are represented by the viscous loss coefficient (1/α) and the inertial loss coefficient (C2), respectively. dp is the average maize kernel diameter, m; ϕ is the porosity of maize bulk [3,23].
When the grain bulk system undergoes energy exchange, it adheres to the principle of energy conservation. The convective heat transfer process during grain bulk ventilation can be described by the following equation [24,25]:
where ca, cb, and cw are the specific heat capacities of air, maize, and water, respectively, J/(kg∙°C); T is the temperature of maize, °C; kb is the thermal conductivity of the grain bulk in W/(m∙°C); t is the ventilation time, h; hs is the hygroscopic heat of sorption/desorption for hygroscopic porous media, J/kg; W is the dry basis moisture content of the grain bulk, defined as W = M/(100 − M).
During the ventilation process, the moisture variation within the grain bulk is governed by the following equation [24,25]:
where w is the absolute humidity ratio in the air between maize kernels; Dv is a dimensionless rate coefficient for moisture exchange between air and kernels, m2/s.
When modeling the ventilation process of the grain bulk based on anisotropic porosity distribution, the anisotropic porosity model, resulting from breakage, segregation, and compression deformation during loading, is incorporated into the governing equations. The continuous variation of porosity is described using an interpolation function, while the density of maize bulk ρb is calculated as ρb = ρs(1 − ϕ), and the thermal conductivity varies as a function of density [26]. Parameters related to the ventilation process are listed in Table 2.
Table 2.
Parameters related to the ventilation process.
2.6. Physical Model and Mesh Generation
To ensure comparability with experimental results, a full-scale numerical model replicating the actual geometry of the pilot silo was created within the COMSOL Multiphysics finite element analysis environment. As shown in Figure 3, with appropriate simplifications, the simulation objects included the silo structure, the maize bulk, the wind-distribution plate, the air layer between the distribution plate and the silo floor, and the air layer above the grain bulk. A tetrahedral mesh scheme was applied to the optimized geometric model of the simulated silo, resulting in a total of 380,000 elements for the numerical simulation.
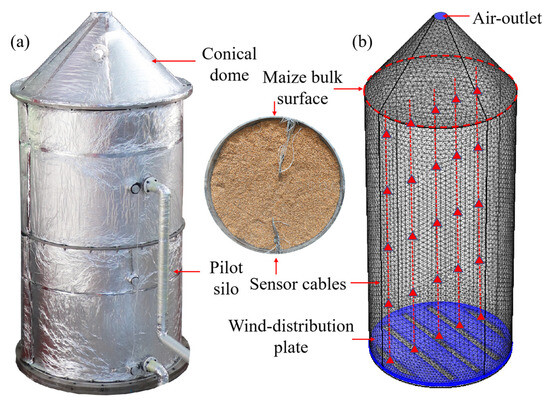
Figure 3.
Physical model of the silo; (a) the silo; (b) meshed model.
During the simulation of the ventilation process, the air was assumed to be an incompressible fluid. The air inlet was set to normal inflow, with the inlet temperature corresponding to the monitored air supply temperature from the experiment. The air enters the bottom of the silo and rapidly flows through the plenum formed between the wind-distribution plate and the silo floor. It then passes through the vents of the distribution plate into the computational domain of the maize bulk. The air-outlet boundary was defined as a pressure outlet condition. Since it is open to the atmospheric environment, the outlet pressure was set to 0. All boundary conditions and computational parameters were consistent with the experimental setup. An anisotropic porosity model of the maize bulk was incorporated into the porous media computational model. To compare the impact of porosity distribution on heat transfer within the maize bulk, the porosity was also assumed to be uniformly distributed isotropically. The overall average porosity value was used for this homogeneous distribution scenario, enabling a comparative study on the effects of different porosity models on the coupled heat and moisture transfer during ventilation. The overall average porosity of the grain bulk is 0.442, with an average density of 702.5 kg/m3.
2.7. Data Processing
In order to compare the temperature and humidity differences between different floors and cables, one-way analysis of variance (ANOVA) and Tukey’s post hoc mean separation test were used to analyze the temperature and relative humidity data. Data variability is represented by the standard error of the mean, with p < 0.05 considered statistically significant.
3. Results
3.1. Relationship Between Vertical Pressure and Porosity
Due to the potential for kernel breakage from the spiral grain suction machine and possible moisture changes during the extended loading process [16], samples were randomly taken from the pilot silo. Uniaxial compression tests were then conducted on these samples to establish the correspondence between vertical pressure and porosity, as shown in Figure 4. As the applied load increased, the deformation of the maize sample increased, resulting in a decrease in porosity. The relationship between pressure and porosity was fitted using a power function, yielding a correlation coefficient R2 of 0.989, which validates the strong predictive capability of this model.
where σ is the vertical pressure applied in the uniaxial compression test, kPa; is the initial porosity of the grain bulk when the load is 0 in the uniaxial compression test.
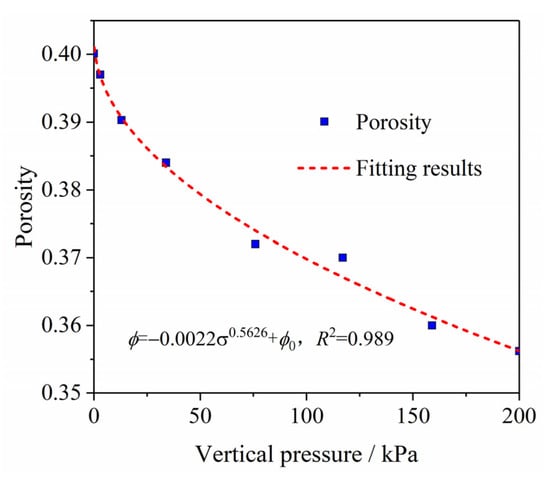
Figure 4.
Relationship between vertical pressure and porosity.
3.2. Vertical Pressure Distribution
Figure 5a shows the vertical pressure distribution within the grain bulk in the pilot silo. The vertical pressure increased with greater grain depth. At depths between 0 and 2.5 m, the calculated values based on GB 50077-2017 were higher than those obtained from numerical simulation. This discrepancy occurs because the standard assumes uniform vertical pressure at the same depth, whereas the finite difference method accounts for the vertical upward friction exerted by the silo wall on the maize kernels. As a result, the vertical pressure is higher near the center and lower near the silo wall (Figure 5b), leading to lower values in the numerical simulation compared to theoretical calculations. The vertical pressure at different depths of the grain bulk is generally symmetrically distributed along the central axis of the silo. At shallower depths, the frictional effect of the walls on the grain bulk was not significant, and the pressure near the walls is essentially the same as that at the center. As the depth of the grain bulk increased, the non-uniformity in vertical pressure became more pronounced. The maximum pressure at the center of the silo reached 18.7 kPa, while the pressure near the silo wall was 16.7 kPa.
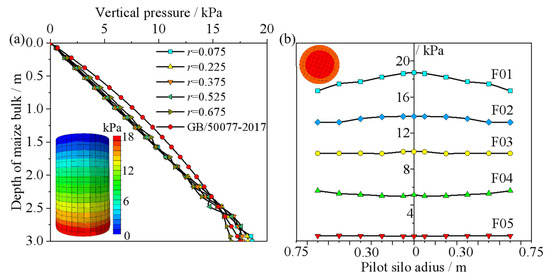
Figure 5.
Pressure distribution in the pilot silo: (a) different radii; (b) different depths.
3.3. Anisotropic Porosity Distribution
In previous studies, the porosity at specific locations within the grain bulk was measured using point-sampling methods [16], which overlooked the influence of compressive deformation on porosity changes in actual storage environments. Building upon the earlier centrally loaded pilot silo tests and the resulting maize porosity distribution model that accounted for kernel breakage and segregation, the present study introduces the effect of compressive deformation on porosity. By incorporating this additional factor, an anisotropic porosity distribution model for maize grain bulk is developed.
where is the porosity of the sample when the broken kernels, dust, and fragments content are 0; a and b are the correlation coefficients; Constants a1 to a5 are given in Table 3.
Table 3.
Constants of the distribution for porosity.
Figure 6 shows the anisotropic porosity distribution of the maize bulk in the pilot silo, accounting for the influence of vertical pressure. The porosity within the silo exhibits non-uniform distribution along both radial and vertical directions. As the depth of the grain bulk increases, the vertical pressure rises, resulting in a reduction in porosity. The average porosity at the surface is 2.8% higher than that at the bottom. Under the combined effects of impact load and vertical pressure, the minimum porosity of 0.409 occurs at the center of the bottom region. In comparison, the porosity at the corresponding location when considering only breakage and segregation effects is 0.421 [16]. By comprehensively incorporating the influences of kernel breakage, segregation, and compressive deformation, the model more accurately reflects the internal porosity distribution of the grain bulk.
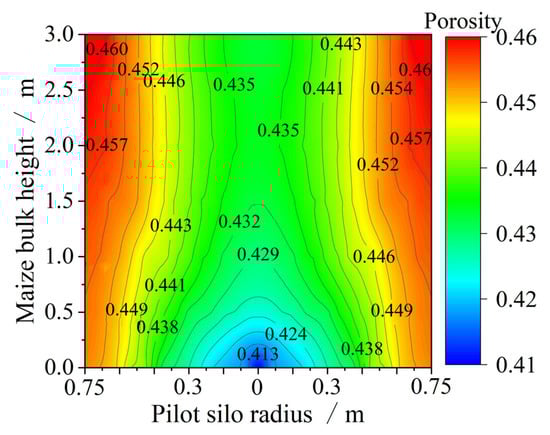
Figure 6.
Anisotropic porosity distribution in the pilot silo maize bulk.
3.4. Temperature Variation
Following the loading of maize into the silo, a vertical ventilation test was conducted. Figure 7a shows the initial grain temperature. Due to the prolonged duration of the loading process and sensor cable connection, coupled with fan debugging, the grain temperature within the bulk exhibited an uneven distribution, influenced by diurnal room temperature variations in summer and the fan adjustment process. In the initial state, the average temperature at the center of the silo (r = 0, H = 0.725 m~3 m) was 0.85 °C higher than that near the sidewalls (r = 0.6 m, H = 0.725 m~3 m). The top conical air layer was most significantly affected by ambient temperature, with a recorded temperature of 26.2 °C at the top measurement point A. During fan debugging, cold air was introduced, reducing the temperature near the bottom of the grain bulk to an average of 22.9 °C.
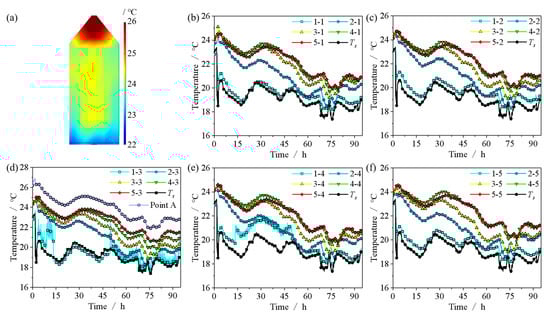
Figure 7.
The temperature changes in different temperature measurement cables during the ventilation process: (a) the initial temperature of the maize bulk; (b) CH1; (c) CH2; (d) CH3; (e) CH4; (f) CH5.
Figure 7b–e display the temperature variations recorded by the five sensor cables. Cooling ventilation was achieved using the centrifugal fan connected to a portable air conditioner. Influenced by diurnal fluctuations in room temperature, the cooling effect of the air conditioner varied, but overall showed a descending trend. After 94.25 h of ventilation, the average supplied air temperature (Ts) was 19.12 °C. Although measurement points 1–3, located near the air inlet center, exhibited undesirable fluctuations, their overall trend remained consistent with the supplied air temperature. No significant difference in temperature was observed among the five sensor cables (Figure 8a). Owing to the thermal inertia of the grain bulk, temperature decreases in different grain layers lagged behind changes in the supplied air temperature. This lag became more pronounced with increasing maize bulk height, and the magnitude of temperature decrease diminished compared to the initial temperature drop. No significant difference in temperature was observed between F05 and F04, whereas significant differences (p < 0.05) were identified among the supply air temperature, Point A, and F01~F04 (Figure 8b). The average temperatures of F02 to F05 were higher than the temperature of F01 by 6.59%, 10.67%, 13.44%, and 13.61%, respectively. The temperature of the top air layer was jointly influenced by room temperature variations and ventilation. After 94.25 h of ventilation, the average temperature in this region was 2.24 °C lower than the initial temperature.
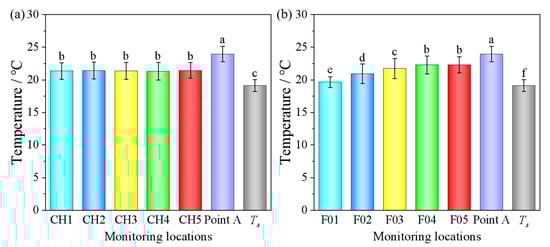
Figure 8.
Comparison of temperature differences between cables and between different grain bulk heights: (a) cables; (b) grain bulk heights. Note: Different lowercase letters above the bar charts indicate significant differences in temperature among monitoring locations at the 0.05 level; the error bars represent the standard error of the mean.
After 94.25 h of ventilation, the average temperature gradient within the grain bulk was 0.37 °C/m. To further compare the influence of porosity distribution differences caused by kernel breakage and segregation on heat transfer during ventilation, Figure 9 presents a comparison of temperatures at measurement points located at different radial distances from the silo center but at the same maize bulk height. For points at the same radius, the average temperature was used. The sensor located at the center of the silo in the first layer, being directly above the air inlet, experienced a greater temperature decrease during ventilation compared to those at r = 0.3 m and r = 0.6 m. The lower porosity at the silo center, resulting from a higher concentration of imperfect kernels, led to greater airflow resistance, which in turn slowed the cooling rate at the center. Between 6 h and 60 h of ventilation, at a grain height of H = 0.725 m, the cooling rate at the silo center was 1.37% and 1.4% lower than at r = 0.3 m and r = 0.6 m, respectively.
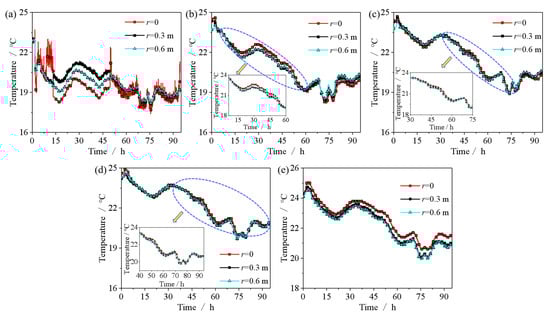
Figure 9.
The temperature changes in different grain bulk heights during the ventilation process: (a) H = 0; (b) H = 0.725 m; (c) H = 1.45 m; (d) H = 2.175 m; (e) H = 2.9 m.
Due to the thermal inertia of maize and the significant airflow resistance during ventilation, the impact of porosity distribution on heat transfer became more pronounced over longer ventilation durations at greater grain heights. The differences in porosity distribution caused by kernel segregation were smaller at higher grain heights, resulting in a diminished effect on variations in heat transfer. From 30 h to 75 h of ventilation, at a grain height of H = 1.45 m, the cooling rate at the silo center was 0.751% and 0.752% lower than at r = 0.3 m and r = 0.6 m, respectively. Between 40 h and 94 h, at H = 2.175 m, the cooling rates at the center were 0.741% and 0.703% lower than at the respective radii. Near the top of the silo, the temperature at the central measurement point was more significantly influenced by the upper air layer, leading to a higher cooling rate at the center compared to the points at r = 0.3 m and r = 0.6 m.
3.5. Relative Humidity
Figure 10 shows the relative humidity variation at different grain heights during ventilation. The newly acquired maize bulk had a relatively low initial average relative humidity of 61.1%. The relative humidity of the supplied air was higher than the average relative humidity of the maize bulk and exhibited irregular fluctuations, with an average value of 74.3% during ventilation. This experimental setup simulated the cooling and conditioning effects of ventilation using low-temperature, high-humidity air. The internal relative humidity of the maize bulk was influenced by the moisture content of the supplied air. Moisture sorption and desorption by the maize kernels led to the redistribution of moisture within the bulk. The relative humidity change at the bottom layer was most significantly affected by the humidity of the incoming air. Under the influence of relatively high ventilation humidity, the relative humidity inside the maize bulk increased to varying degrees. The extent of this increase diminished with increasing grain bulk height. Statistically significant differences in relative humidity were observed among different layers (Figure 10b). After 94.25 h of ventilation, the highest average humidity was observed at the bottom of the maize bulk, reaching 71.0%. The average relative humidity at H = 0.725 m, H = 1.45 m, H = 2.175 m, and H = 2.9 m was lower than that of the bottom layer by 9.82%, 15.16%, 17.48%, and 18.53%, respectively.
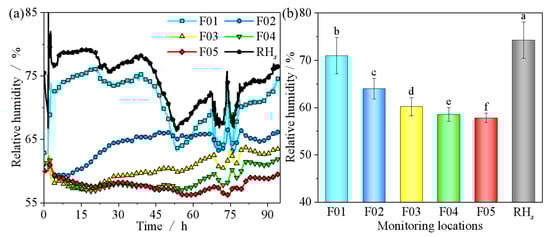
Figure 10.
Average relative humidity at different grain bulk heights during the ventilation process: (a) relative humidity; (b) relative humidity differences. Note: Different lowercase letters above the bar charts indicate significant differences in relative humidity among monitoring locations at the 0.05 level; the error bars represent the standard error of the mean.
3.6. Numerical Model Validation
To validate the effectiveness of the established COMSOL numerical model, the linear declining segment of both air temperature and grain temperature during the 22 h ventilation process was selected for comparison. The differences between the simulated heat transfer based on the anisotropic porosity distribution and the experimental results for the maize bulk ventilation are shown in Figure 11. As ventilation time increased, the internal temperature of the maize bulk decreased. The simulated cooling process based on the anisotropic porosity model showed good agreement with the experimental measurements. The accuracy of the simulation was evaluated using the mean relative error (MRE), calculated as the ratio of the difference between numerical and experimental values to the experimental value. CH3 exhibited a relatively large error, with a maximum relative error of 4.16%. This discrepancy may be attributed to the accumulation of fine particles and soil impurities directly below the filling port during the loading process, resulting in locally reduced porosity. In both the porosity definition and simulation, the material properties were defined as those of maize, thereby neglecting the effect of soil impurities on local porosity and heat transfer. The mean relative errors for CH1 to CH5 were 0.85%, 0.99%, 1.63%, 1.23%, and 0.59%, respectively, confirming the validity of the predictive model.
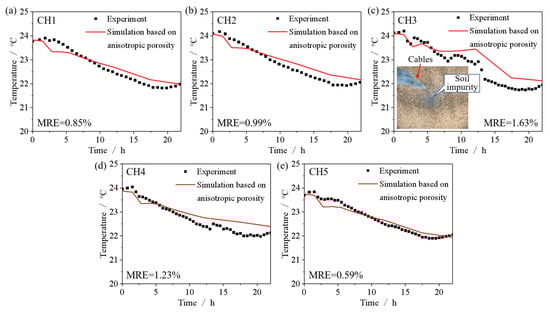
Figure 11.
Comparison of simulation and experimental results of different cables: (a) CH1; (b) CH2; (c) CH3; (d) CH4; (e) CH5.
3.7. Effect of Porosity Distribution on Airflow Velocity
Results from the anisotropic porosity distribution indicate significant radial variations in porosity due to kernel breakage and segregation. From the center to the wall of the silo, the porosity varies radially between 0.428 and 0.457, with analysis based on the average values from five measurement points along each cable. Figure 11 compares the airflow velocity during ventilation based on two porosity distribution models. The airflow rate is higher at the vent openings, with an average velocity of 0.126 m/s. Air enters the maize bulk through the vents of the wind-distribution plate and exits through the conical roof outlet. The streamlines in Figure 12a,b were plotted at equal time intervals. Figure 12c indicates that in the ventilation process of the maize bulk based on the isotropic porosity distribution model, the airflow velocities at heights F02 to F05 are essentially identical. In contrast, under the anisotropic porosity distribution model, the airflow velocity gradually decreased with increasing maize bulk height. The velocities at F03, F04, and F05 were lower than that at F02 by 10.8%, 19.2%, and 20.3%, respectively. The anisotropic porosity model resulting from kernel breakage and segregation during filling led to a gradual decrease in airflow velocity from the silo wall toward the center at the same grain height. Figure 12d presents the average airflow velocities along five cables during ventilation. Based on the anisotropic porosity distribution model, the airflow velocity ranged from 0.0653 m/s near the silo wall to 0.0576 m/s at the center, with the velocity near the wall being 13.4% higher than that at the center. Under the isotropic model, the average velocity across all cables was 0.0628 m/s, which falls within the range of velocities predicted by the anisotropic model and corresponds well with the porosity distribution results shown in Figure 5.
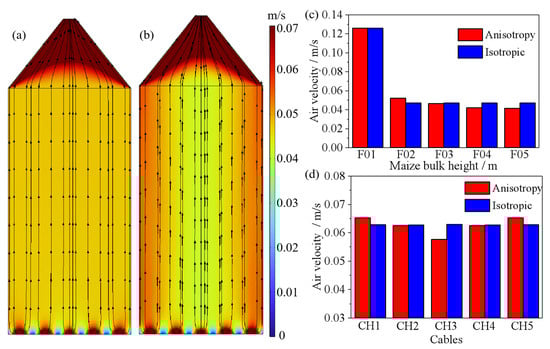
Figure 12.
Comparison of airflow rates during the ventilation process of grain bulk based on two porosity distribution models: (a) the isotropic porosity; (b) the anisotropic porosity; (c) different heights; (d) different cables.
3.8. Effect of Porosity Distribution on Temperature and Relative Humidity
Figure 13 presents a comparison of the temperature distribution during the ventilation of the grain bulk based on two porosity distribution models. At the same time point, the temperature front based on the anisotropic porosity model exhibits a concave frontal curve, whereas that based on the isotropic porosity model appears approximately linear (Figure 13a). Due to the segregation mechanism, the accumulation of smaller particles at the center of the pilot silo (r = 0) resulted in a lower porosity than the overall average porosity of the maize bulk (Figure 5). During ventilation, the maximum differences in temperature at the silo center between the anisotropic and isotropic porosity models for layers F02 to F05 were 0.25 °C, 0.38 °C, 0.41 °C, and 0.44 °C, respectively. The average temperatures were higher by 0.005 °C, 0.08 °C, 0.1 °C, and 0.17 °C, respectively. Conversely, near the pilot silo wall, the average porosity was higher than the overall average due to the upward frictional force exerted by the wall and the accumulation of larger particles in this region. At the same time and location near the wall, the maximum temperature differences between the isotropic and anisotropic porosity models for layers F02 to F05 were 0.22 °C, 0.32 °C, 0.41 °C, and 0.35 °C, respectively, with average temperatures higher by 0.05 °C, 0.1 °C, 0.17 °C, and 0.17 °C. This indicates that the higher porosity provides additional pathways for airflow during ventilation, reducing flow resistance and resulting in a faster cooling rate near the bin wall.
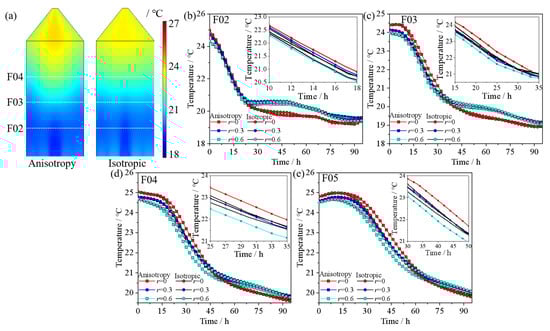
Figure 13.
Comparison of temperature during the ventilation process of grain bulk based on two porosity distribution models: (a) temperature distribution after 30 h of ventilation; (b) F02; (c) F03; (d) F04; (e) F05.
3.9. TFC
As observed in Figure 14a, the temperature front based on the anisotropic porosity model exhibits a curved shape, demonstrating that the porosity distribution resulting from grain segregation influences heat transfer during ventilation of the grain bulk. To accurately characterize the temperature front curve during ventilation, given that the temperature distribution after ventilation is a prerequisite for evaluating whether safe storage conditions have been achieved, the average temperature of 21.38 °C within the grain bulk after ventilation was used as the reference value defining the temperature front. The results of the TFC at different time intervals, shown in Figure 13a, indicate that after 5 h of ventilation, a continuous nonlinear curve of the temperature front had not yet fully developed. This is due to the ongoing heat exchange between the introduced cool air and the maize kernels at the bottom. By 45 h of ventilation, the temperature front reached the top of the pilot silo and formed temperature contours around the conical dome wall. To quantitatively describe the propagation of the temperature front within the maize bulk, and to comprehensively account for the combined effects of radial position and ventilation time, a predictive model for the TFC was developed through regression analysis and data fitting, as follows:
where H is the height of the TFC within the maize bulk, m; r is the radius of the pilot silo, m.
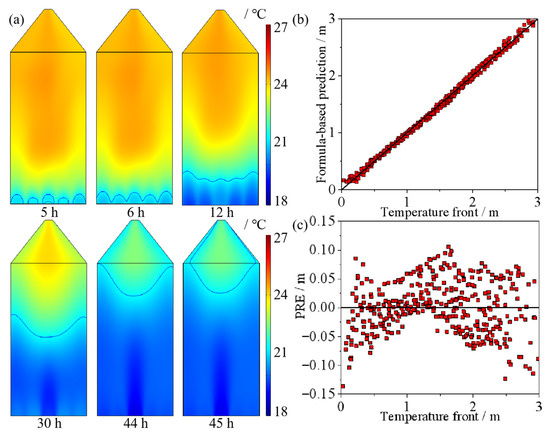
Figure 14.
Temperature front curves during ventilation: (a) TFC at different times; (b) comparison between prediction of the developed model and calculated data; (c) prediction residual errors.
The model achieved an R2 value of 0.997, demonstrating excellent predictive performance. Although the inclusion of additional complex terms increases model complexity, the quality of the model improved significantly by incorporating the combined effect of time and radius (t·r2) as well as an implicit function of radius with the logarithm of time (r·lnt). Figure 14b,c illustrates the model’s strong capability in predicting the TFC and the distribution of prediction residual errors (PREs). The PRE values are randomly scattered without showing any distinct trend or systematic sensitivity. A one-way analysis of variance (ANOVA) coupled with Tukey’s post hoc test was applied to the TFC data, yielding a p-value of less than 0.05, indicating that the results are statistically significant. The analysis confirmed that ventilation time had a significant effect on the behavior of the temperature front curve.
4. Discussion
4.1. Effects of Compaction and Segregation on Porosity Distribution
We propose that the two primary causes of non-uniform porosity and density distribution within maize bulk are the segregation mechanism, including impact and sifting during the loading process, and the combined effect of vertical pressure and wall friction inside the maize bulk. As illustrated in Figure 15, when maize containing broken kernels is loaded into the silo through the central filling inlet, the impact of the grain flow increases the density and reduces the porosity directly beneath the filling point. Meanwhile, as the maize kernels flow along the surface of the piled bulk, smaller broken kernels tend to be trapped by larger pores and accumulate preferentially near the center of the silo. Nourmohamadi-Moghadami et al. [7] demonstrated through maize loading experiments that the fine material content, including broken maize kernels, near the center of the silo was approximately 8–16 percentage points higher than that near the wall at various grain bulk heights.
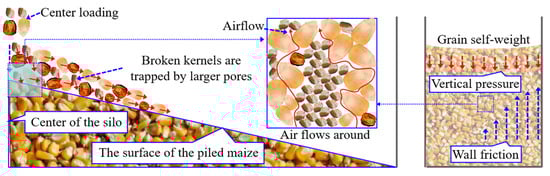
Figure 15.
The non-uniform airflow distribution during ventilation caused by the segregation mechanism and pressure within the maize bulk.
Due to the self-weight of the grain, the density and porosity within the maize bulk are not constant but vary with the depth of the grain in the silo, i.e., the pressure it bears. Haque [28] previously pointed out that the assumption of constant density in the classic Janssen’s pressure equation can lead to an underestimation of the loads in storage silos. The downward compressive deformation caused by the self-weight of the grain induces upward wall friction, and the influence of this friction on the internal force distribution decreases gradually from the silo wall toward the center [29,30]. When the effect of grain pressure on porosity is not considered, the average porosity at the center of the silo is 0.435. In contrast, when vertical pressure is taken into account, the average porosity at the center decreases by 1.6% [16]. This effect is even more pronounced in deep silos under practical storage conditions [31,32,33].
4.2. Effects of Porosity Distribution on Airflow
The grain bulk is composed of billions of kernels piled together. Rather than fitting tightly, these kernels leave numerous interconnected pores between them, forming a complex and three-dimensional continuous network known as “pore channels”. During ventilation, fluids automatically follow the path of least resistance [34,35]. Because airflow tends to seek the path with minimal resistance, it can lead to issues such as airflow “short-circuiting” and ventilation “dead zones” within the grain bulk. Near the silo wall, the contact between kernels and the wall creates larger and better-connected pore channels. As a result, the majority of the airflow preferentially passes through these “high-speed channels”, causing a “short-circuiting” effect. Although this rapidly removes heat and moisture from these areas, other regions may not receive adequate ventilation [36]. In contrast, directly below the filling inlet, the accumulation of broken kernels, shriveled kernels, and dust introduced during loading, coupled with the impact and compaction from the grain flow, results in fine, tortuous, or even disconnected pores near the center of the silo. These areas exhibit extremely high flow resistance, making it difficult for airflow to penetrate. Instead, the air bypasses these zones through surrounding connected channels with lower flow resistance, as illustrated in Figure 15. This leads to the formation of “dead zones” where warm and humid air accumulates, creating conditions highly susceptible to mold growth and spoilage.
As shown in Figure 12, airflow velocities at different layers confirm that the energy (total pressure) supplied by the centrifugal fan is fixed. As air moves upward from the bottom of the maize bulk, it must overcome both the frictional resistance from the kernels and the local resistance caused by the bending and constriction of the pore channels. During this process, the energy of the air is continuously consumed in overcoming these resistances [37], resulting in a gradual decrease in airflow velocity as the height of the grain bulk increases.
4.3. Effects of Airflow Distribution on Temperature and Relative Humidity
Acting as a “carrier” of heat and moisture transfer, the air supplied by the centrifugal fan absorbs or releases heat through contact with grain kernels. Depending on its own relative humidity and the moisture content of the grain, the air either evaporates and removes moisture from the grain [38] or adds moisture to it, thereby regulating the temperature and humidity conditions of the grain. As indicated in Figure 13 and Figure 14, the higher airflow velocity near the silo wall under real storage conditions leads to more rapid cooling of the grain in that area. However, since the temperature in other regions, especially the center of the maize bulk, has not yet equilibrated, this effect can actually intensify the internal temperature gradient [39]. In areas where airflow is stagnant, heat generated by grain respiration accumulates without being dissipated in a timely manner, causing abnormal localized temperature increases and the formation of hot spots. This significantly raises the risk of mold development. This experiment was conducted in summer, and influenced by environmental conditions, the supplied air had a high moisture content (Figure 9). The prevention of substantial economic loss is the rationale for this approach, as excessively low moisture levels in commercial grain storage often degrade value. Given the relatively short ventilation period in this trial and based on the principle of moisture adsorption equilibrium, although the relative humidity in the pores was high, the supplied air was at a lower temperature than the grain. In addition, the respirable heat was not considered in the model, as its impact on the temperature field was negligible due to the relatively low initial moisture content of the corn and the short duration of ventilation. While maize kernels may absorb a certain amount of moisture from the humid air during ventilation, this process is not expected to cause a sharp increase in local moisture content to a critical level. Furthermore, after ventilation, the relative humidity within the maize bulk showed a graded distribution along the height. Moisture and temperature continued to equilibrate and diffuse after ventilation ended. Throughout the subsequent static storage period, the humidity was consistently monitored and maintained within safe levels.
5. Conclusions
This study conducted ventilation experiments using maize in a pilot silo and developed an anisotropic porosity distribution model for the grain bulk that accounts for the effects of both pressure and segregation mechanisms. The differences in airflow and heat and moisture transfer during ventilation between isotropic and anisotropic porosity distributions were analyzed. A nonlinear model was innovatively proposed to predict the TFC during ventilation as affected by variations in porosity distribution. The main conclusions are as follows:
- The vertical pressure within the maize bulk decreases nonlinearly from the silo wall toward the center, and this non-uniformity becomes more pronounced with increasing depth. The self-weight of the grain compacts the lower layers, resulting in a 2.8% higher average porosity at the surface compared to the bottom of the silo.
- Porosity distribution affects airflow and heat and moisture transfer during the ventilation process. The flow velocities of F03, F04, and F05 are 10.8%, 19.2%, and 20.3% lower than that of F02, respectively. Relative humidity exhibits a gradient variation along the depth of the grain bulk. Compared to the center of the silo, the porosity near the wall is higher, and the airflow velocity near the wall is 13.4% higher than that at the center. The cooling rate is also higher near the wall compared to the center of the maize bulk.
- The airflow velocity based on the isotropic porosity model is higher at the center than that predicted by the anisotropic model, while the opposite trend is observed near the silo wall. Local temperature within the maize bulk shows a strong correlation with airflow velocity.
- The temperature front during ventilation based on the anisotropic porosity model exhibits a concave curve. A nonlinear model was developed to predict this temperature front during maize bulk ventilation, which shows strong agreement with computational data. The findings are positioned to provide theoretical insight and technical guidance for optimizing grain storage ventilation strategies and predicting cooling front dynamics.
Author Contributions
Conceptualization, C.L. and J.W.; data curation, C.L. and H.Z.; formal analysis, C.L. and B.Z.; funding acquisition, C.L.; investigation, C.L. and H.Z.; methodology, C.L. and J.W.; software, C.L., H.Z. and B.Z.; supervision, J.W. and T.S.; writing—original draft, C.L.; writing—review and editing, C.L., J.W. and T.S.; validation, C.L. and B.Z. All authors have read and agreed to the published version of the manuscript.
Funding
The research was funded by the Scientific and Technological Project of Henan Province (grant number 252102110345); the Key R&D projects in Henan Province (grant number 241111322600); Henan Province Science and Technology R&D Program Joint Fund (grant number 232103810078); Henan Key Laboratory of Grain and Oil Storage Facility & Safety (grant number 2022KF04).
Institutional Review Board Statement
Not applicable.
Informed Consent Statement
Not applicable.
Data Availability Statement
The original contributions presented in this study are included in the article. Further inquiries can be directed to the corresponding author.
Conflicts of Interest
The authors declare no conflicts of interest.
References
- National Bureau of Statistics. China Statistical Yearbook; China Statistics Press: Beijing, China, 2020. Available online: https://www.stats.gov.cn/sj/ndsj/2024/indexch.htm (accessed on 15 August 2025).
- Jian, F.J.; Narendran, R.B.; Jayas, D.S. Segregation in stored grain bulks: Kinematics, dynamics, mechanisms, and minimization—A review. J. Stored Prod. Res. 2019, 81, 11–21. [Google Scholar] [CrossRef]
- Lawrence, J.; Maier, D.E. Three-dimensional airflow distribution in a maize silo with peaked, levelled and cored grain mass configurations. Biosyst. Eng. 2011, 110, 321–329. [Google Scholar] [CrossRef]
- Ziegler, V.; Paraginski, R.T.; Ferreira, C.D. Grain storage systems and effects of moisture, temperature and time on grain quality—A review. J. Stored Prod. Res. 2021, 91, 101770. [Google Scholar] [CrossRef]
- Ge, M.M.; Chen, G.X.; Liu, W.L.; Liu, C.S.; Zheng, D.Q. Study on the pore structure characteristics of maize grain piles and their effects on air flow distribution. Comput. Electron. Agric. 2024, 224, 109136. [Google Scholar] [CrossRef]
- Fan, Y.; Jacob, K.V.; Freireich, B.; Lueptow, R.M. Segregation of granular materials in bounded heap flow: A review. Powder Technol. 2017, 312, 67–88. [Google Scholar] [CrossRef]
- Nourmohamadi-Moghadami, A.; Zare, D.; Singh, C.B.; Stroshine, R.L. Filling of a grain silo. part 1: Investigation of fine material distribution in a small scale centre-filled silo. Biosyst. Eng. 2020, 191, 145–156. [Google Scholar] [CrossRef]
- Ramaj, I.; Schock, S.; Karaj, S.; Müller, J. Influence of self-compaction on the airflow resistance of aerated wheat bulks (Triticum aestivum L., cv. ‘Pionier’). Appl. Sci. 2022, 12, 8909. [Google Scholar] [CrossRef]
- Bhadra, R.; Casada, M.E.; Turner, A.P.; Montross, M.D.; Thompson, S.A.; McNeill, S.G.; Maghirang, R.G.; Boac, J.M. Stored grain pack factor measurements for soybeans, grain sorghum, oats, barley, and wheat. Trans. ASABE 2018, 61, 747–757. [Google Scholar] [CrossRef]
- Bhadra, R.; Turner, A.P.; Casada, M.E.; Montross, M.D.; Thompson, S.A.; Boac, J.M.; McNeill, S.G.; Maghirang, R.G. Pack factor measurements for corn in grain storage bins. Trans. ASABE 2015, 58, 879–890. [Google Scholar] [CrossRef][Green Version]
- Turner, A.P.; Montross, M.D.; McNeill, S.G.; Sama, M.P.; Casada, M.E.; Boac, J.M.; Bhadra, R.; Maghirang, R.G.; Thompson, S.A. Modeling the compressibility behavior of hard red wheat varieties. Trans. ASABE 2016, 59, 1029–1038. [Google Scholar] [CrossRef]
- Molenda, M.; Montross, D.M.; McNeill, G.S.; Horabik, J. Airflow resistance of seeds at different bulk densities using Ergun’s equation. Trans. ASAE 2005, 48, 1137–1145. [Google Scholar] [CrossRef]
- Bartosik, R.E.; Maier, D.E. Effect of airflow distribution on the performance of NA/Lt in-bin drying of corn. Trans. ASABE 2006, 49, 1095–1104. [Google Scholar] [CrossRef]
- Lawrence, J.; Maier, D.E. Prediction of temperature distributions in peaked, leveled and inverted cone grain mass configurations during aeration of corn. Appl. Eng. Agric. 2012, 28, 685–692. [Google Scholar] [CrossRef]
- Panigrahi, S.S.; Singh, C.B.; Fielke, J. CFD modelling of physical velocity and anisotropic resistance components in a peaked stored grain with aeration ducting systems. Comput. Electron. Agric. 2020, 179, 105820. [Google Scholar] [CrossRef]
- Chen, G.X.; Liu, C.S.; Zheng, D.Q.; Wang, D.X. Segregation of particles during maize loading process in a center loaded silo. Sci. Rep. 2025, 15, 9090. [Google Scholar] [CrossRef]
- ASAE S352.2 APR1988 (R2017); Moisture Measurement—Unground Grain and Seeds. ASAE: St. Joseph, MI, USA, 2017.
- GB/T 5518-2008; Inspection of Grain and Oil–Determination of Relatively Density of Grain and Oilseeds. National Standardization Administration: Beijing, China, 2008.
- GB/T 4935.1-2008; Instrument for Soil Test–Oedometer–Part 1: Single Level Arm Oedometer. National Standardization Administration: Beijing, China, 2008.
- Chen, G.X.; Liu, C.S.; Jiang, M.M.; Zheng, D.Q.; Chen, J.H.; Ge, M.M.; Yin, J. Experimental study on measurement of interfacial pressure in granular materials. Geotech. Test. J. 2022, 45, 674–688. [Google Scholar] [CrossRef]
- GB 50077-2017; Standard for Design of Reinforced Concrete Silos. Ministry of Housing and Urban-Rural Development of the People’s Republic of China: Beijing, China, 2017.
- Zhang, D.; Zheng, D.Q.; Chen, G.X.; Jiang, M.M.; Chen, J.H. Numerical simulation on pressure field of bulk grain pile in large warehouse by Flac3D. J. Henan Univ. Technol. (Nat. Sci. Ed.) 2017, 38, 98–103. [Google Scholar] [CrossRef]
- Ergun, S. Fluid flow through packed columns. Chem. Eng. Prog. 1952, 48, 89–94. [Google Scholar]
- De Mattos, R.; Garreiro, J.M.; Meghirditchian, G.; Ferrari, A.; Zecchi, B. Effect of modeling simplifications on behavior and computational cost for simulation of fixed bed wheat drying process. Dry. Technol. 2022, 40, 1338–1355. [Google Scholar] [CrossRef]
- Ge, M.M.; Chen, G.X.; Liu, W.L.; Liu, C.S. Study of heat and mass transfer during drying process of maize grain pile based on computed tomography. Biosyst. Eng. 2024, 248, 82–96. [Google Scholar] [CrossRef]
- Chang, C.; Lai, F.; Miller, B. Thermal conductivity and specific heat of grain dust. Trans. ASAE 1980, 23, 1303–1306. [Google Scholar] [CrossRef]
- Liu, C.S.; Chen, G.X.; Zhou, Y.; Yue, L.F.; Liu, W.L. Investigation on compression and mildew of mixed and separated maize. Food Sci. Nutr. 2023, 11, 2118–2129. [Google Scholar] [CrossRef]
- Haque, E. Estimating bulk density of compacted grains in storage bins and modifications of Janssen’s load equations as affected by bulk density. Food Sci. Nutr. 2013, 1, 150–156. [Google Scholar] [CrossRef]
- Neto, J.P.L.; de Nascimento, J.W.B.; Silva, R.C. Friction forces in vertical silos with smooth walls in different height/diameter ratios. Eng. Agríc. 2014, 34, 8–17. [Google Scholar] [CrossRef]
- Wang, X.W.; Yang, Z.J.; Shu, X.F.; Feng, J.L. The static contact statuses between granular materials and flat-bottomed steel silos. Powder Technol. 2013, 235, 1053–1059. [Google Scholar] [CrossRef]
- Dornelas, K.C.; Rodrigues, H.C.S.; Cheung, A.B.; Calil, C., Jr.; do Nascimento, J.W.B. Pressures in squat steel silo with flat bottom storing maize grain. J. Stored Prod. Res. 2024, 109, 102424. [Google Scholar] [CrossRef]
- Salarikia, A.; Jian, F.J.; Jayas, D.S.; Zhang, Q. Segregation of dockage and foreign materials in wheat during loading into a 10-m diameter corrugated steel bin. J. Stored Prod. Res. 2021, 93, 101837. [Google Scholar] [CrossRef]
- Cheng, X.D.; Zhang, Q.; Shi, C.X.; Yan, X.J. Model for the prediction of grain density and pressure distribution in hopper-bottom silos. Biosyst. Eng. 2017, 163, 159–166. [Google Scholar] [CrossRef]
- Liu, W.L.; Chen, G.X.; Zheng, D.Q.; Ge, M.M.; Liu, C.S. Numerical and experimental investigation of flow and heat transfer in a fixed bed of non-spherical grains using the DEM-CFD method. J. Food Process Eng. 2023, 46, e14362. [Google Scholar] [CrossRef]
- Yue, R.; Zhang, Q. A pore-scale model for predicting resistance to airflow in bulk grain. Biosyst. Eng. 2017, 155, 142–151. [Google Scholar] [CrossRef]
- Chen, P.X.; Wang, X.W.; Fan, M.K.; Tian, G.S.; Zhu, W.X.; Zhu, Y.G.; Jin, Y.Z. Simulation study of moisture and heat migration during hot air drying of corn with stacked structures based on CFD-DEM. J. Stored Prod. Res. 2025, 112, 102627. [Google Scholar] [CrossRef]
- Olatunde, G.; Atungulu, G.G.; Sadaka, S. CFD modeling of air flow distribution in rice bin storage system with different grain mass configurations. Biosyst. Eng. 2017, 151, 286–297. [Google Scholar] [CrossRef]
- Hammami, F.; Mabrouk, S.; Mami, A. Modelling and simulation of heat exchange and moisture content in a cereal storage silo. Math. Comp. Model. Dyn. 2016, 22, 207–220. [Google Scholar] [CrossRef]
- Panigrahi, S.S.; Singh, C.B.; Fielke, J.; Zare, D. Modeling of heat and mass transfer within the grain storage ecosystem using numerical methods: A review. Dry. Technol. 2020, 38, 1677–1697. [Google Scholar] [CrossRef]
Disclaimer/Publisher’s Note: The statements, opinions and data contained in all publications are solely those of the individual author(s) and contributor(s) and not of MDPI and/or the editor(s). MDPI and/or the editor(s) disclaim responsibility for any injury to people or property resulting from any ideas, methods, instructions or products referred to in the content. |
© 2025 by the authors. Licensee MDPI, Basel, Switzerland. This article is an open access article distributed under the terms and conditions of the Creative Commons Attribution (CC BY) license (https://creativecommons.org/licenses/by/4.0/).