Article

Biogas Production from Olive Oil Mill Byproducts: A Comparative Study of Two Treatments for Pursuing a Biorefinery Approach

1
Department of Civil and Environmental Engineering, University of Perugia, Via G. Duranti 93, 06125 Perugia, Italy
2
Consorzio Interuniversitario Nazionale per la Scienza e Tecnologia dei Materiali (INSTM)—University of Perugia Research Unit (UdR Perugia), Department of Civil and Environmental Engineering, University of Perugia, Strada di Pentima 4, 05100 Terni, Italy
3
Department of Agricultural, Food and Environmental Sciences, University of Perugia, Borgo XX Giugno 74, 06121 Perugia, Italy
4
Department of Sciences, University of Basilicata, Via dell’Ateneo Lucano 10, 85100 Potenza, Italy
*
Author to whom correspondence should be addressed.
Agriculture 2025, 15(21), 2204; https://doi.org/10.3390/agriculture15212204
Submission received: 25 August 2025 / Revised: 19 October 2025 / Accepted: 21 October 2025 / Published: 23 October 2025

Abstract

Olive cultivation is one of the most widespread agro-industrial activities in the Mediterranean area. However, required pretreatments often affect the anaerobic digestion process, promoting or inhibiting the overall yield. Therefore, the efficiency of Anaerobic Digestion (AD) processes cannot be established in advance but needs to be experimentally validated for each biomass-pretreatment combination. Following the present purpose, these biomasses were firstly treated: the olive pomace (OP) with a procedure based on the use of an ionic liquid (IL) composed of triethylamine and sulfuric acid [Et3N][HSO4] to remove hemicellulose and lignin and recover the insolubilized OP, while olive mill wastewater (OW) was processed via freeze-drying. The resulting materials, the pulp from olive pomace (POP) and freeze-dried OW (FDOW), were then digested using lab-scale anaerobic reactors. The biogas production was then compared with the quantity obtained by digesting the same untreated biomasses (OW and OP). The FDOW showed the highest biogas production due to the freeze-drying treatment that led to some morphological and structural surface modifications of OW (respectively, 658 mL vs. 79 mL/g for the two matrices), prompting microorganism activity. Conversely, the method based on the use of IL significantly reduced the nitrogen content of POP, thus resulting in the lowest biogas production, which ceased by the second day. To address this issue, we co-digested POP with the brewery’s spent grain, a biomass rich in nitrogen. This step enhanced the biogas yield of POP, resulting in an extended anaerobic digestion period and the production of 466 mL/g. Additionally, we tested FDOW in co-digestion with BSG to evaluate improvements in production. The codigestion of the two matrices increased the biogas yield of FDOW from 944 to 1131 mL/g.

1. Introduction

Today, the overall area for olive crop cultivation reaches about 11.5 Mha globally, covering 58 nations [1]. According to the International Oil Council (IOC), 97% of worldwide olive oil production occurs around the Mediterranean lands. As evidence of this, Spain, Italy, Greece, and Portugal account for 69% of the olives produced on a planetary scale [1].
Regarding the manufacturing processes, olive oil is extracted from olives mechanically. As the first step, olives undergo air blowing and washing with water to remove impurities, then a grinding process to crush the olives and a malaxation process for recovering oil droplets from the aqueous and solid parts [2]. After that, olive oil extraction is carried out by a three-phase centrifugation system that produces olive mill wastewater (OW) (38–48%) and olive pomace (OP) (35–45%) as waste. Another extractive technique is based on a two-phase centrifugation system that produces a wetter olive pomace as a waste [3].
In the OW, the main component is water, and it generally shows an acidic pH (4.2–5.9), a high content of phenolic compounds (0.5 to 25 g L−1), and the presence of other organic compounds, such as protein, fats, and the fibrous fraction (cellulose, hemicellulose, and lignin). OW can substantially negatively affect the environment due to the high content of some phenolic compounds, which, in some cases, can be highly toxic. As such, inappropriate and irresponsible disposal of OW can lead to environmental issues like soil deterioration in terms of physical and chemical attributes, microbiome alterations, and plant phytotoxicity. This has more than one effect of concern; for instance, the impairment of the ecosystem services of the soil, poses, in addition, more than one risk to biodiversity [4,5]. The conventional disposal of this kind of waste provides treatment with calcium oxide for neutralization and a coagulation process, followed by storing it in waterproof lagoons. However, this method has some drawbacks, including creating unpleasant odors and high transfer costs [6].
As far as the OP is concerned, this waste usually shows a pH in the range of 4.8–5.2 and a high organic matter content, mainly due to the remarkable content of phenolic compounds (200–300 mg/100 g), which, as already mentioned above, can create more than one environmental hazard. Furthermore, it should be pointed out that this waste also contains significant amounts of copper, zinc, and manganese [7].
Conversely, if adequately treated, wastes from the olive oil supply chain can be a promising source of valuable and interesting compounds. Indeed, biomass can undergo some treatment methods with the scope of achieving high market-value compounds and materials under a biorefinery and green chemistry approach. As an example, the OP has an oily component (8–12% w/w), which can be exploited to recover the oil by chemical solvent extraction (e.g., hexane), producing olive pomace oil [8]. Furthermore, these biomasses are rich in bioactive compounds; for instance, it is possible to recover and purify the phenolic fraction for applications as antioxidants in food, cosmetics, and medicine [9,10]. For instance, the OP treatment by pressurized liquid extraction allows for obtaining and recovering molecules not found in the maceration process [11]. In addition, El-Abassi et al. [12] claim that a good phenolic compound extraction yield (66.5 ± 3.2%) was achieved from OW by ultrafiltration, which permitted the removal of a remarkable amount of total suspended solids, and then proceeded to cloud point extraction.
Applying a biorefinery approach to the wastes of the olive oil production chain can allow us to convert them into high-value-added products and biogas. One recent and promising option consists of using these residuals (especially OP) for the production of protein hydrolysates, which can then be used as soil improvers and bio-stimulants [13]. Given the abundance of organic matter shown by this biomass, the anaerobic digestion (AD) process is exploited [14]. However, OP and OW are rich in substances that can slow down AD. In particular, lignin, among the most abundant components of agro-industrial waste, can be an obstacle to AD due to its recalcitrant nature. From a biological point of view, lignin is one of the components of the plant cell walls, thus conferring mechanical support, strength, and protection against pathogens, among others [15]. In addition, this biopolymer is also involved in controlling plant nutrients and water transport [16]. From a structural and chemical point of view, lignin is an amorphous biopolymer composed of some phenolic units: hydroxycinnamoyl, coniferyl, sinapyl, and coumaryl alcohols. These molecules are linked by covalent carbon-carbon and carbon-oxygen bonds, which determine a very complex and articulated three-dimensional structure [17]. As already pointed out, during the AD process, lignin is nearly non-degradable because of its structural complexity and plenty of strong covalent bonds that cover hemicellulose and cellulose. This requires hydrolytic enzymes, which need oxygen to depolymerize lignin [18,19]. As a result, lignin limits the hydrolysis step, which is one of the four main stages of AD (hydrolysis, acidogenesis, acetogenesis, and methanogenesis), thereby restricting enzymatic activity during this phase and reducing the efficiency of the entire AD.
In OP, lignin constitutes approximately 25–30% of the dry weight [20]. The removal of lignin from OP can be considered a crucial pretreatment, as it helps maximize biogas production by mitigating its inhibitory effects. In a study evaluating the impact of ultrasound treatment on OP for biogas production, pretreated OP showed a significant increase in biogas yield compared to the untreated sample, rising from 300 mL to approximately 450 mL of biogas per 5 g of OP [21]. This highlights the effectiveness of pretreatments in enhancing OP’s biogas potential. Another study [22] investigated the co-digestion of OP with manure, demonstrating that the inclusion of OP led to a higher biogas yield in co-digested samples. These findings confirm that OP is a valuable biomass for biogas production. Therefore, in this study, we evaluated the potential methane production of OP and OP after lignin extraction (OP-Pulp, referred to as POP in the text). This is essential to understanding the effect of lignin removal and fully utilizing the pomace.
In addition, OW was considered for our AD experiments [23], taking into account its capacity to limit bacterial growth and inhibit their activity [24], ascribable to its high content of phenolic compounds [25]. There is a threshold concentration below which inhibition caused by polyphenols begins: polyphenol concentrations above 2 g L−1 have been shown to completely inhibit microbial activity in AD, with impairments already starting below 1 g L−1 [26]. In previous studies [27], the biogas production of olive mill wastewater (OW) was assessed after ultrasound pretreatment, which positively increased the biogas yield. The increase was even more significant when OW was also diluted, confirming that polyphenol concentration plays a crucial role. For this reason, in this work, biogas production was tested for both unmodified and freeze-dried OW. The freeze-dried OW was studied to evaluate the effects of this pretreatment, as freeze-drying can stabilize the substrate, enhance the physical characteristics of the matrix by creating a more porous structure, and mitigate the negative impacts associated with traditional thermal drying. In addition, freeze-drying can be considered a more environmentally friendly technique compared to alkaline pre-treatment, as it does not require the use of any chemicals.
Summarizing the above, this work evaluated and compared biomethane production from different treated waste materials—POP and freeze-dried OW—with untreated biomasses, OP and OW. The main aim was to enhance the biogas yield of these olive mill by-products. In one case, lignin was extracted, a component that can be reused for various purposes. For olive mill wastewater (OW), a pretreatment was tested to improve the morphological characteristics of the substrate and assess its impact on biogas production. In addition, co-digestion was tested by using the brewery’s spent grain (BSG), the main waste material from beer production, to increase biogas production in treatments with low yields. In addition, co-digestion was tested using brewery spent grain (BSG), the main by-product of beer production, to enhance biogas yields in treatments with low methane production. Organic wastes, such as food waste and food-industry residues, are commonly used for anaerobic digestion. Llanos-Lizcano et al. (2024) [28] investigated the chemical biomethane potential of various organic wastes, including canteen leftovers, dairy industry residues, brewery by-products, and cardboard from eggs. Their results showed that waste from the beer industry achieved the highest biomethane yield as well as the greatest degree of biodegradability.

2. Materials and Methods

Experiments described in this study were carried out in order to accurately determine the production of biogas and the corresponding biomethane content, to ensure the reliability of results and their comparability with the current literature. For the scope, the experimental procedure was also defined, considering the methodology widely recognized and documented in the literature [29,30,31].

2.1. Materials, Procedures, and Analysis

This study was carried out with the same digestate previously used and described in Montegiove et al. (2024) [32]. The corresponding biogas/biomethane production was therefore already evaluated and detracted from the results here described.
The main characteristics of the digestate employed in this study are shown in Table 1.

2.1.1. Analytic Methods for Biomass Characterization

Sample humidity and volatile solids were determined according to the official protocol with some modifications [31]. To this end, two grams of each biomass were dried in an oven (TCN 50 Plus, Argolab, Modena, Italy) at 105 °C. When the weight was constant, the moisture content was calculated as the difference between the initial wet weight and the dried weight. The final value is expressed as a percentage. The humidity content for each biomass was measured in triplicate. For vs. content, two grams of each previously dried sample were weighed in ceramic crucibles in triplicate. The samples were then placed in a muffle (FM13, Falc, Bergamo, Italy) where the temperature was gradually increased to 550 °C and maintained for 24 h. That time period refers to the whole process, while the samples were kept at the target temperature only for 5 h. Subsequently, the crucibles were placed in a desiccator with silica gel to cool the sample before weighing. The volatile solids content was estimated as the difference between the initial and incinerated weight.
The pH was measured following the protocol [33] after water extraction of samples (1:2.5 w/v) and using a glass electrode (60 VioLab, XS, Modena, Italy). WEOC and WEN have been analyzed using an elemental analyzer (multi N/C 2100, Analytik Jena GmbH, Überligen, Germany). Total organic C was analyzed by the Walkley-Black method using an HT1300 (Analytik Jena GmbH, Überligen, Germany), while total N was measured after Kjeldahl digestion followed by ammonia distillation (UDK 129, Velp, Monza Brianza, Italy) and titration with 0.0357 N sulfuric acid [34]. WEOC and WEN were extracted from samples with deionized water (1:2 w/v) for 24 h × 200 rpm at room temperature. After filtration, water extracts were analyzed using multi N/C 2100S® (Analytik Jena GmbH, Überligen, Germany) [35]. Total P was analyzed following the Olsen method [34]; total K was quantified by means of ICP-OES (Optima 2100 DV, PerkinElmer, Springfield, IL, USA).
All measurements were carried out in triplicate, and average values are reported.

2.1.2. Production of Pomace Pulp

An ionic liquid (IL) composed of triethylamine and sulfuric acid [Et3N][HSO4] was synthesized according to Cequier et al. [36] and then used to treat PO to solubilize and then remove hemicellulose and lignin, leaving as much cellulose as possible in the pulp (solid fraction after the treatment). To this end, 2 g of pomace were treated with a solution containing 90% of [Et3N][HSO4] and 10% water by weight and an additional 0.009 mol of H2SO4 to remove as much lignin and hemicellulose as possible [37]. All the reagents were provided by Merck Life Science S.r.l. (Milan, Italy) and used as received without additional purification. The mixture obtained was left to react at 120 °C for 4 h, then cooled to room temperature, and EtOH was added to solubilize lignin and hemicellulose [37]. Finally, the solid fractions (the cellulose-enriched portion) were recovered by vacuum filtration and washed repeatedly with ethanol, followed by water.

2.1.3. Characterization of Produced Pulp

The resulting pulps were characterized by Fourier transform infrared (FT-IR) analyses carried out using a Jasco FT-IR 615 spectrometer (Jasco Corporation, Tokyo, Japan) in the 4000–600 cm−1 range in ATR mode. Powdered raw pomace and the pulp obtained as described above were tested using KBr powder to prepare disks.
The materials’ morphological characteristics were investigated using a Field Emission Scanning Electron Microscope (FESEM, Supra 25-Zeiss, Oberkochen, Germany), gold coating the powders with an ion sputter coater, and observing the samples with the gun operating at 5 kV. Thermal stability was assessed by heating the samples from 30 to 900 °C at a rate of 10 °C per minute under a nitrogen atmosphere (250 mL/min), using a TGA Seiko Exstar 6300 (Seiko Instruments Inc., Chiba, Japan).

2.1.4. Production of Freeze-Dried Olive Mill Wastewater

The freeze-drying process is divided into three different steps. The first is the so-called “pre-freezing” phase, where the biomass is frozen at low-temperature conditions. The freezing step is carried out at temperatures within −20/−80 °C; it is crucial to immobilize the various components and prevent foaming during the vacuum step. The second step consists of the “primary drying” and mainly depends on the sublimation of ice [32]. Finally, “secondary drying” occurs after the temperature moves below the critical temperature of solid-to-gas transition; liquid water is obtained via condensation and is transferred to a cold trap. Freeze-dried OW (FDOW in the text) was previously tested after polyphenol extraction [32]; for completeness, the achieved results, which motivated the testing criteria adopted in this study, were briefly discussed in Section 3.4.
Prior to the extraction of polyphenols, the samples of OW were defatted with n-hexane (1:2).
A mixture of MeOH/H2O/MeOH-HCOOH 0.1%/MeCN (1:1:8:5) was used at the ratio sample/solvent 1:1 for 1 h in an ultrasonic bath at room temperature. The chemicals used were provided by Merck KGaA (Darmstadt, Germany). The procedure was repeated three times. After centrifugation, the supernatants were collected, and the solvent was evaporated under vacuum.

2.2. Anaerobic Bioreactors

Biogas production was carried out in small-scale batch and unstirred bioreactors, where 50 mL of internal volume was filled with the mixture consisting of inoculum + substrate. The temperature was kept at 37 °C throughout the production period. The volume of biogas and biomethane produced was measured using the volumetric method, and for the determination of biomethane production, an alkaline trap (0.5 M NaOH with thymolphthalein as a pH indicator) was employed [29,38]. As shown in Figure 1, the volumetric method involves a vessel where the biomass is placed, a bottle with water, and a beaker for water collection for biogas measurement. For biomethane determination, an additional bottle containing the NaOH solution is required to separate CO2 from the biogas mixture. In the first vessel, the inoculum and the biomass to be tested are mixed, and the atmosphere is saturated by introducing nitrogen. This vessel is connected via a tube to a second container, which contains either water (for biogas measurement) or the alkaline trap (for biomethane determination). In the biogas measurement setup, the produced gas displaces water into the collecting beaker, with the displaced volume corresponding to the volume of biogas generated. In the biomethane determination setup, CO2 in the biogas reacts with NaOH (as illustrated in Figure 1), forming sodium carbonate and leaving methane as the remaining gas. The methane, and also the other components included in the gas mixture, for instance, nitrogen [39], then pass through the water bottle, and the displaced water volume corresponds to the methane volume produced. It should be noted that the alkaline trap and the following vessel filled with water also allow the capture of the other liquid and water-soluble species normally contained (at low concentrations or in traces) in biogas mixtures. Therefore, the role of these species in the determination of the final volume of gas produced can be considered negligible for the scope of this study.
Throughout the entire period of biogas production, the pH of the digestate was periodically measured to ensure that it was within the optimal pH range for AD (6.5–7.5) [40].
Each sample consisted of 75% of the dry weight from the inoculum and the remaining 25% from the dry biomass tested. The control consisted solely of the inoculum, and the corresponding results are not reported in the dedicated section, as they were consistent with those obtained in previous experiments [32]. The following are the treatments investigated in terms of the composition of the biomass introduced into the reactors:
-
Control consisting of sole inoculum;
-
Sample OW: composed of 3/4 (dw) inoculum and 1/4 (dw) OW;
-
Sample FDOW: composed of 3/4 (dw) inoculum and 1/4 (dw) freeze-dried OW (referred as FDOW);
-
Sample OP: composed of 3/4 (dw) inoculum and 1/4 (dw) OP;
-
Sample POP: composed of 3/4 (dw) inoculum and 1/4 (dw) POP;
-
Sample BSG: composed of 3/4 (dw) inoculum and 1/4 (dw) BSG;
-
Sample POP+BSG: composed of 3/4 (dw) inoculum and 1/4 (dw) POP+BSG.
-
Sample FDOW+BSG: composed of 3/4 (dw) inoculum and 1/4 (dw) FDOW+BSG.
The relative weight of the inoculum and the added biomass corresponds to 1.8 g for the 3/4 in dry weight and 0.6 g for the 1/4 in dry weight for the other biomass. In the case of codigestion, such as POP+BSG and FDOW+BSG, the dry weight was 0.3 g for each biomass for a total of 0.6 g.
All treatments were run in triplicate.

2.3. Statistical Analysis

In order to ensure the reliability and repeatability of results, each experiment was carried out in triplicate. In the experimental section, for each sample, the cumulative production of biogas was defined as the mean of the quantities measured in the three corresponding tests. The error bars allow us to identify the region where the three related tests fall within.
Differences among treatments were evaluated using one-way analysis of variance (ANOVA), considering biomass type as a fixed factor and biogas production as the dependent variable. When the ANOVA indicated significant effects, mean comparisons were performed using Tukey’s post hoc test at a significance level of p < 0.05. Statistical analyses were carried out in R (R version 4.4.3 (28 February 2025 ucrt)). Results of Tukey’s test are reported in Supplementary Materials (Table S1 and Figure S1).

3. Results and Discussion

3.1. Characterization of Biomasses

Freeze-drying and IL treatment were selected as pretreatment procedures for raw OW and OP, respectively. The related biomasses were characterized, and the main results are summarized in Table 2.
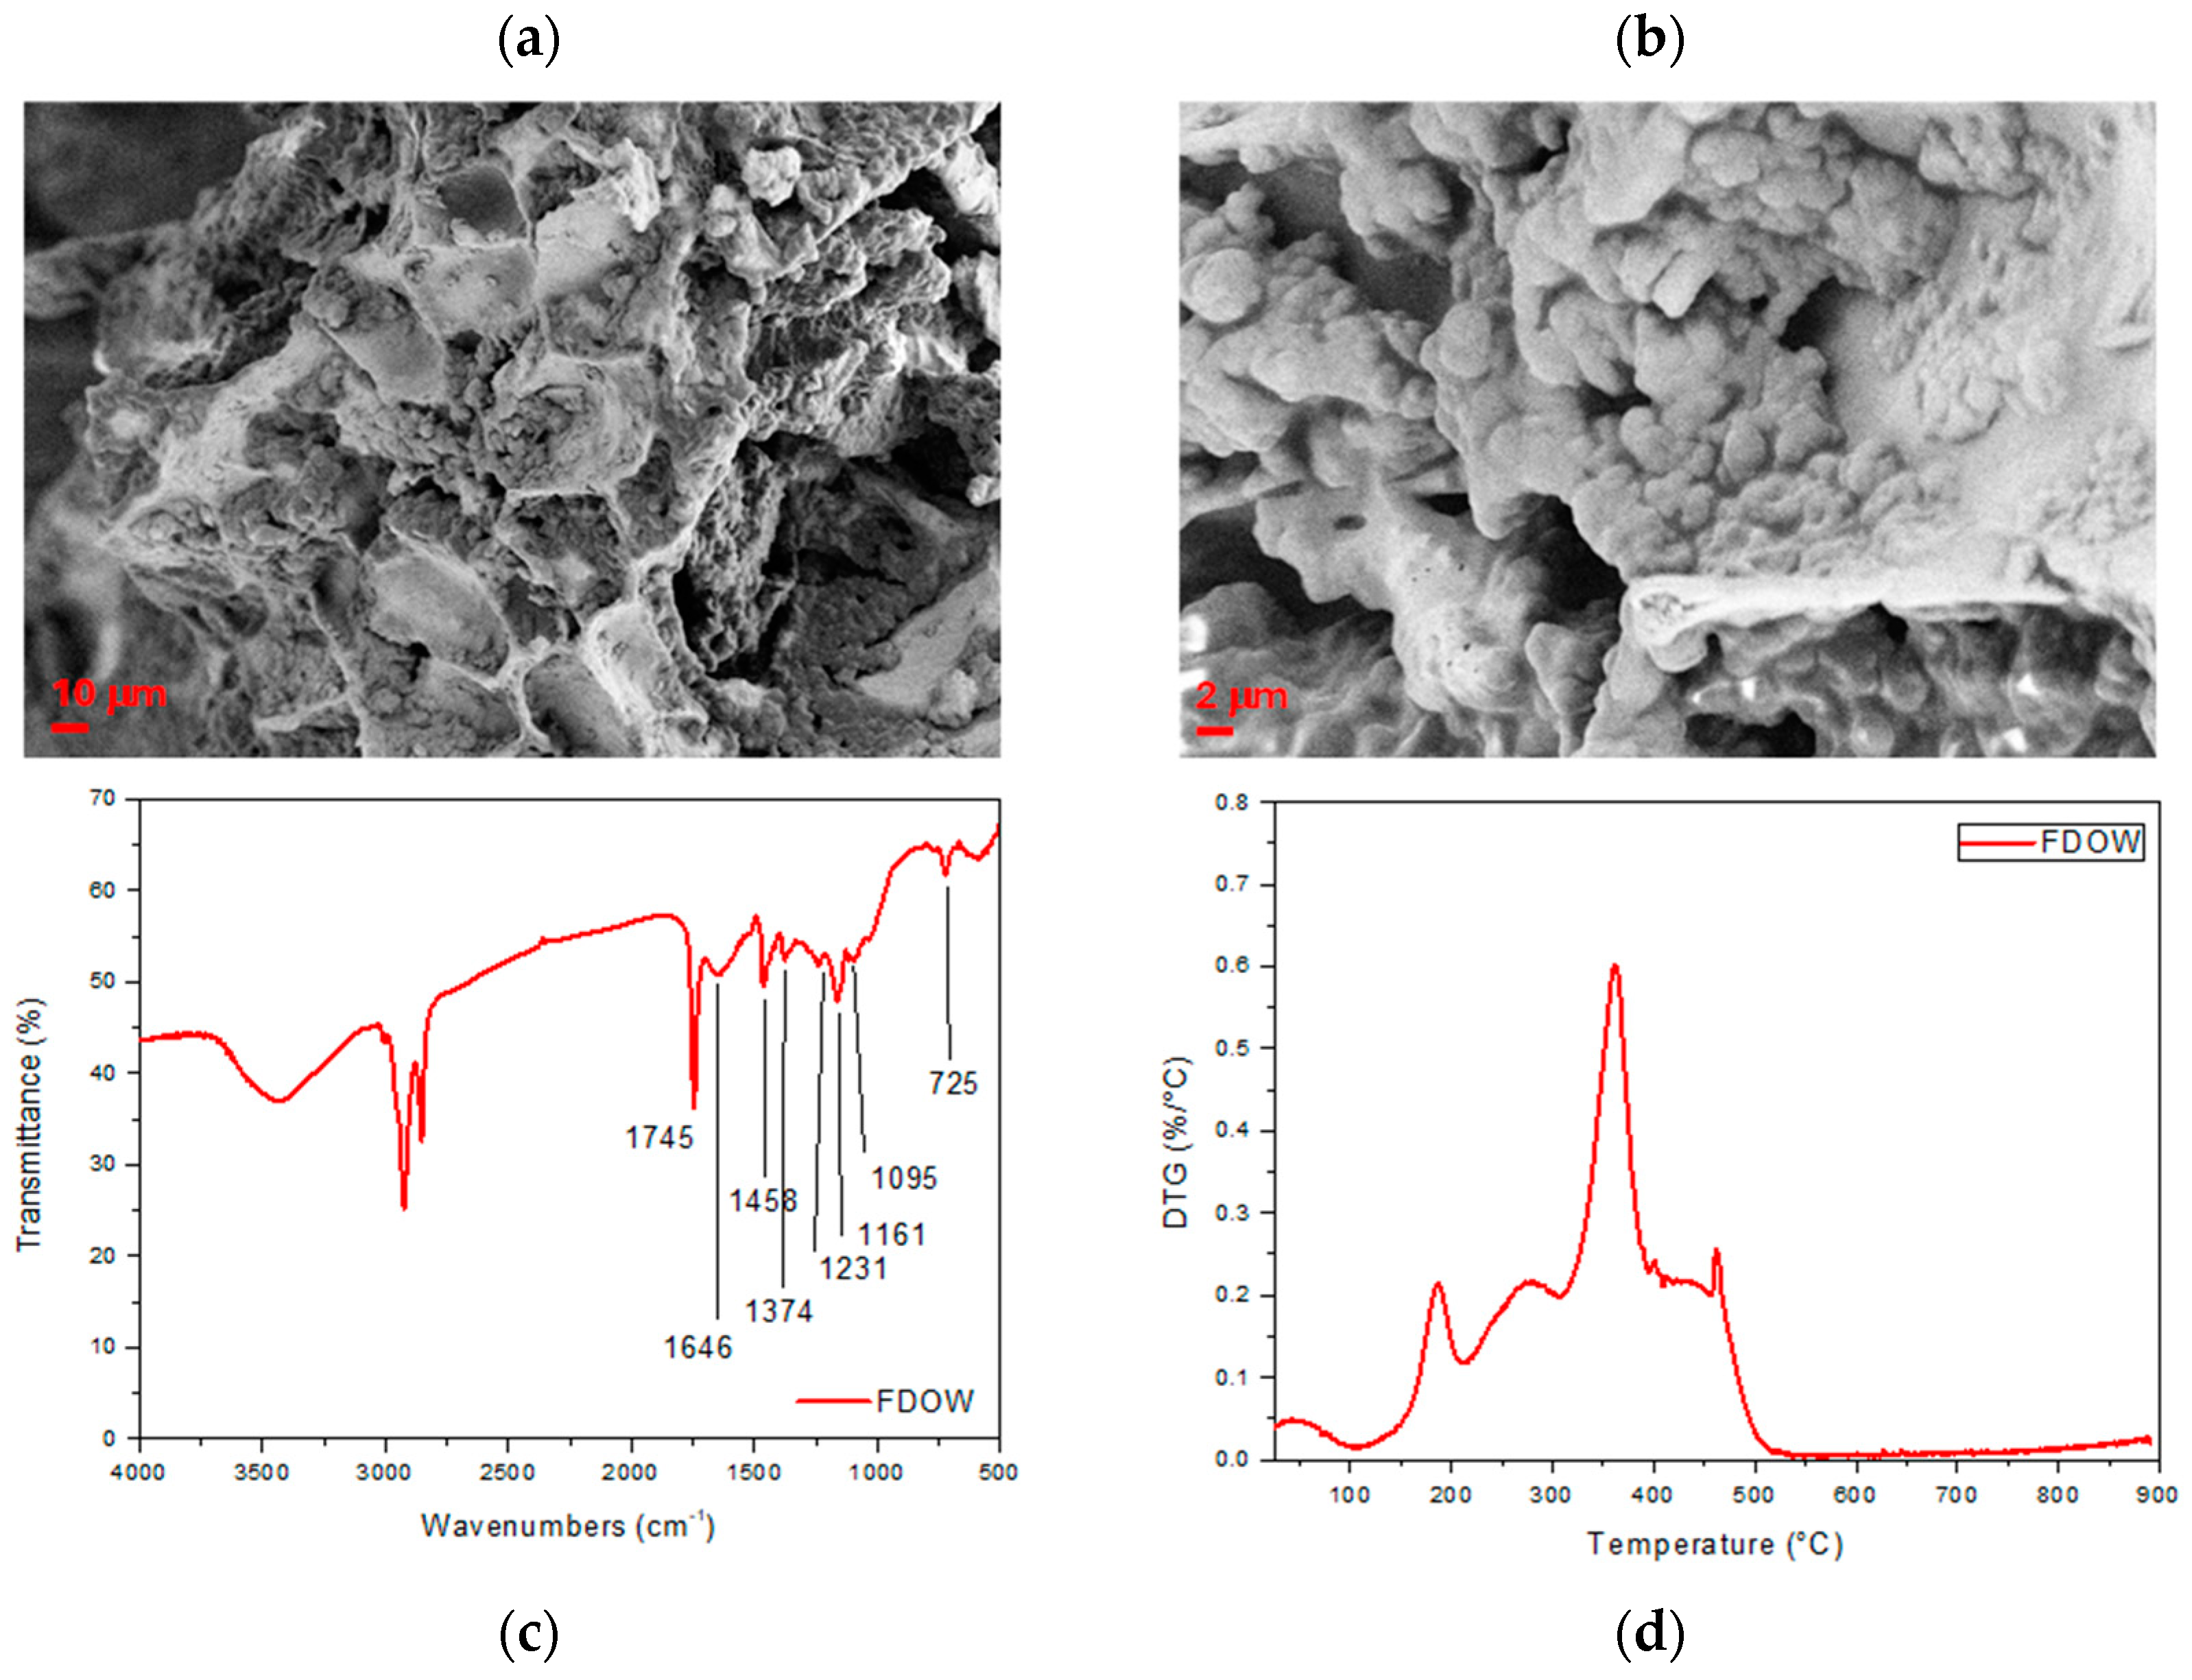
The SEM images (Figure 2a,b) show that FDOW presents a heterogeneous surface with small embedded particles [40,41] and a spongy appearance with numerous hollows. OW contains high concentrations of organic substances, including carbohydrates, pectins, mucilage, lignin, tannins, lipids, and inorganic substances. Several factors affect this composition, including olive cultivar, degree of ripeness, harvest time, climate, farming practices, and extraction technique [42,43]. The FTIR spectrum analysis (Figure 2c) of FDOW revealed an absorption band in the range of 3700–3000 cm−1, corresponding to the O–H stretching vibrations of alcohols, phenolic compounds, and carboxylic groups. The peaks observed at 2900 and 2800 cm−1 correspond to long-chain aliphatic methylene groups (–CH, –CH2, and –CH3), indicative of the presence of long-chain lipids in the OW. The main peak assignments in the FDOW in the fingerprint region show the presence of a sharp peak at 1745 cm−1, related to the stretching vibration C=O of the ketones, aldehydes, and carboxylic acid groups and ester functional groups (acidic nature of the OMSW). The signal at 1646 cm−1 is assigned to C=C (ν) (aromatics) and C=O stretching [44]. The signal at 1458 cm−1 is due to CH2 asymmetric bending (scissoring), which is strong in cellulose I, while the CH2 bending mode in cellulose can be found at 1374 cm−1. At 1231 cm−1, we can find C-O syringyl nuclei in lignin. The signal at 1161 cm−1 is related to the C–O–C asymmetric stretch vibration in cellulose. The band at 1117 cm−1 is indicative of CH and CO deformation or stretching vibrations in different groups of lignin and carbohydrates. The signals at 1095 cm−1 and 725 cm−1 are due, respectively, to C–O–C skeletal vibration of the polysaccharide ring and rocking vibration of the –CH2 group in cellulose [45]. In Figure 2d, a minor mass reduction due to moisture evaporation was observed up to around 150 °C, while in stage II, the volatilization of solid residues took place [46]. The second and third zones were ranged between 150 °C and 300 °C and 300 °C and 600 °C, respectively. The degradation of hemicellulose and cellulose is responsible for the first two peaks, while the third peak may stem from the rapid decomposition of lignin or soluble organic compounds like alcohols and aromatic substances.
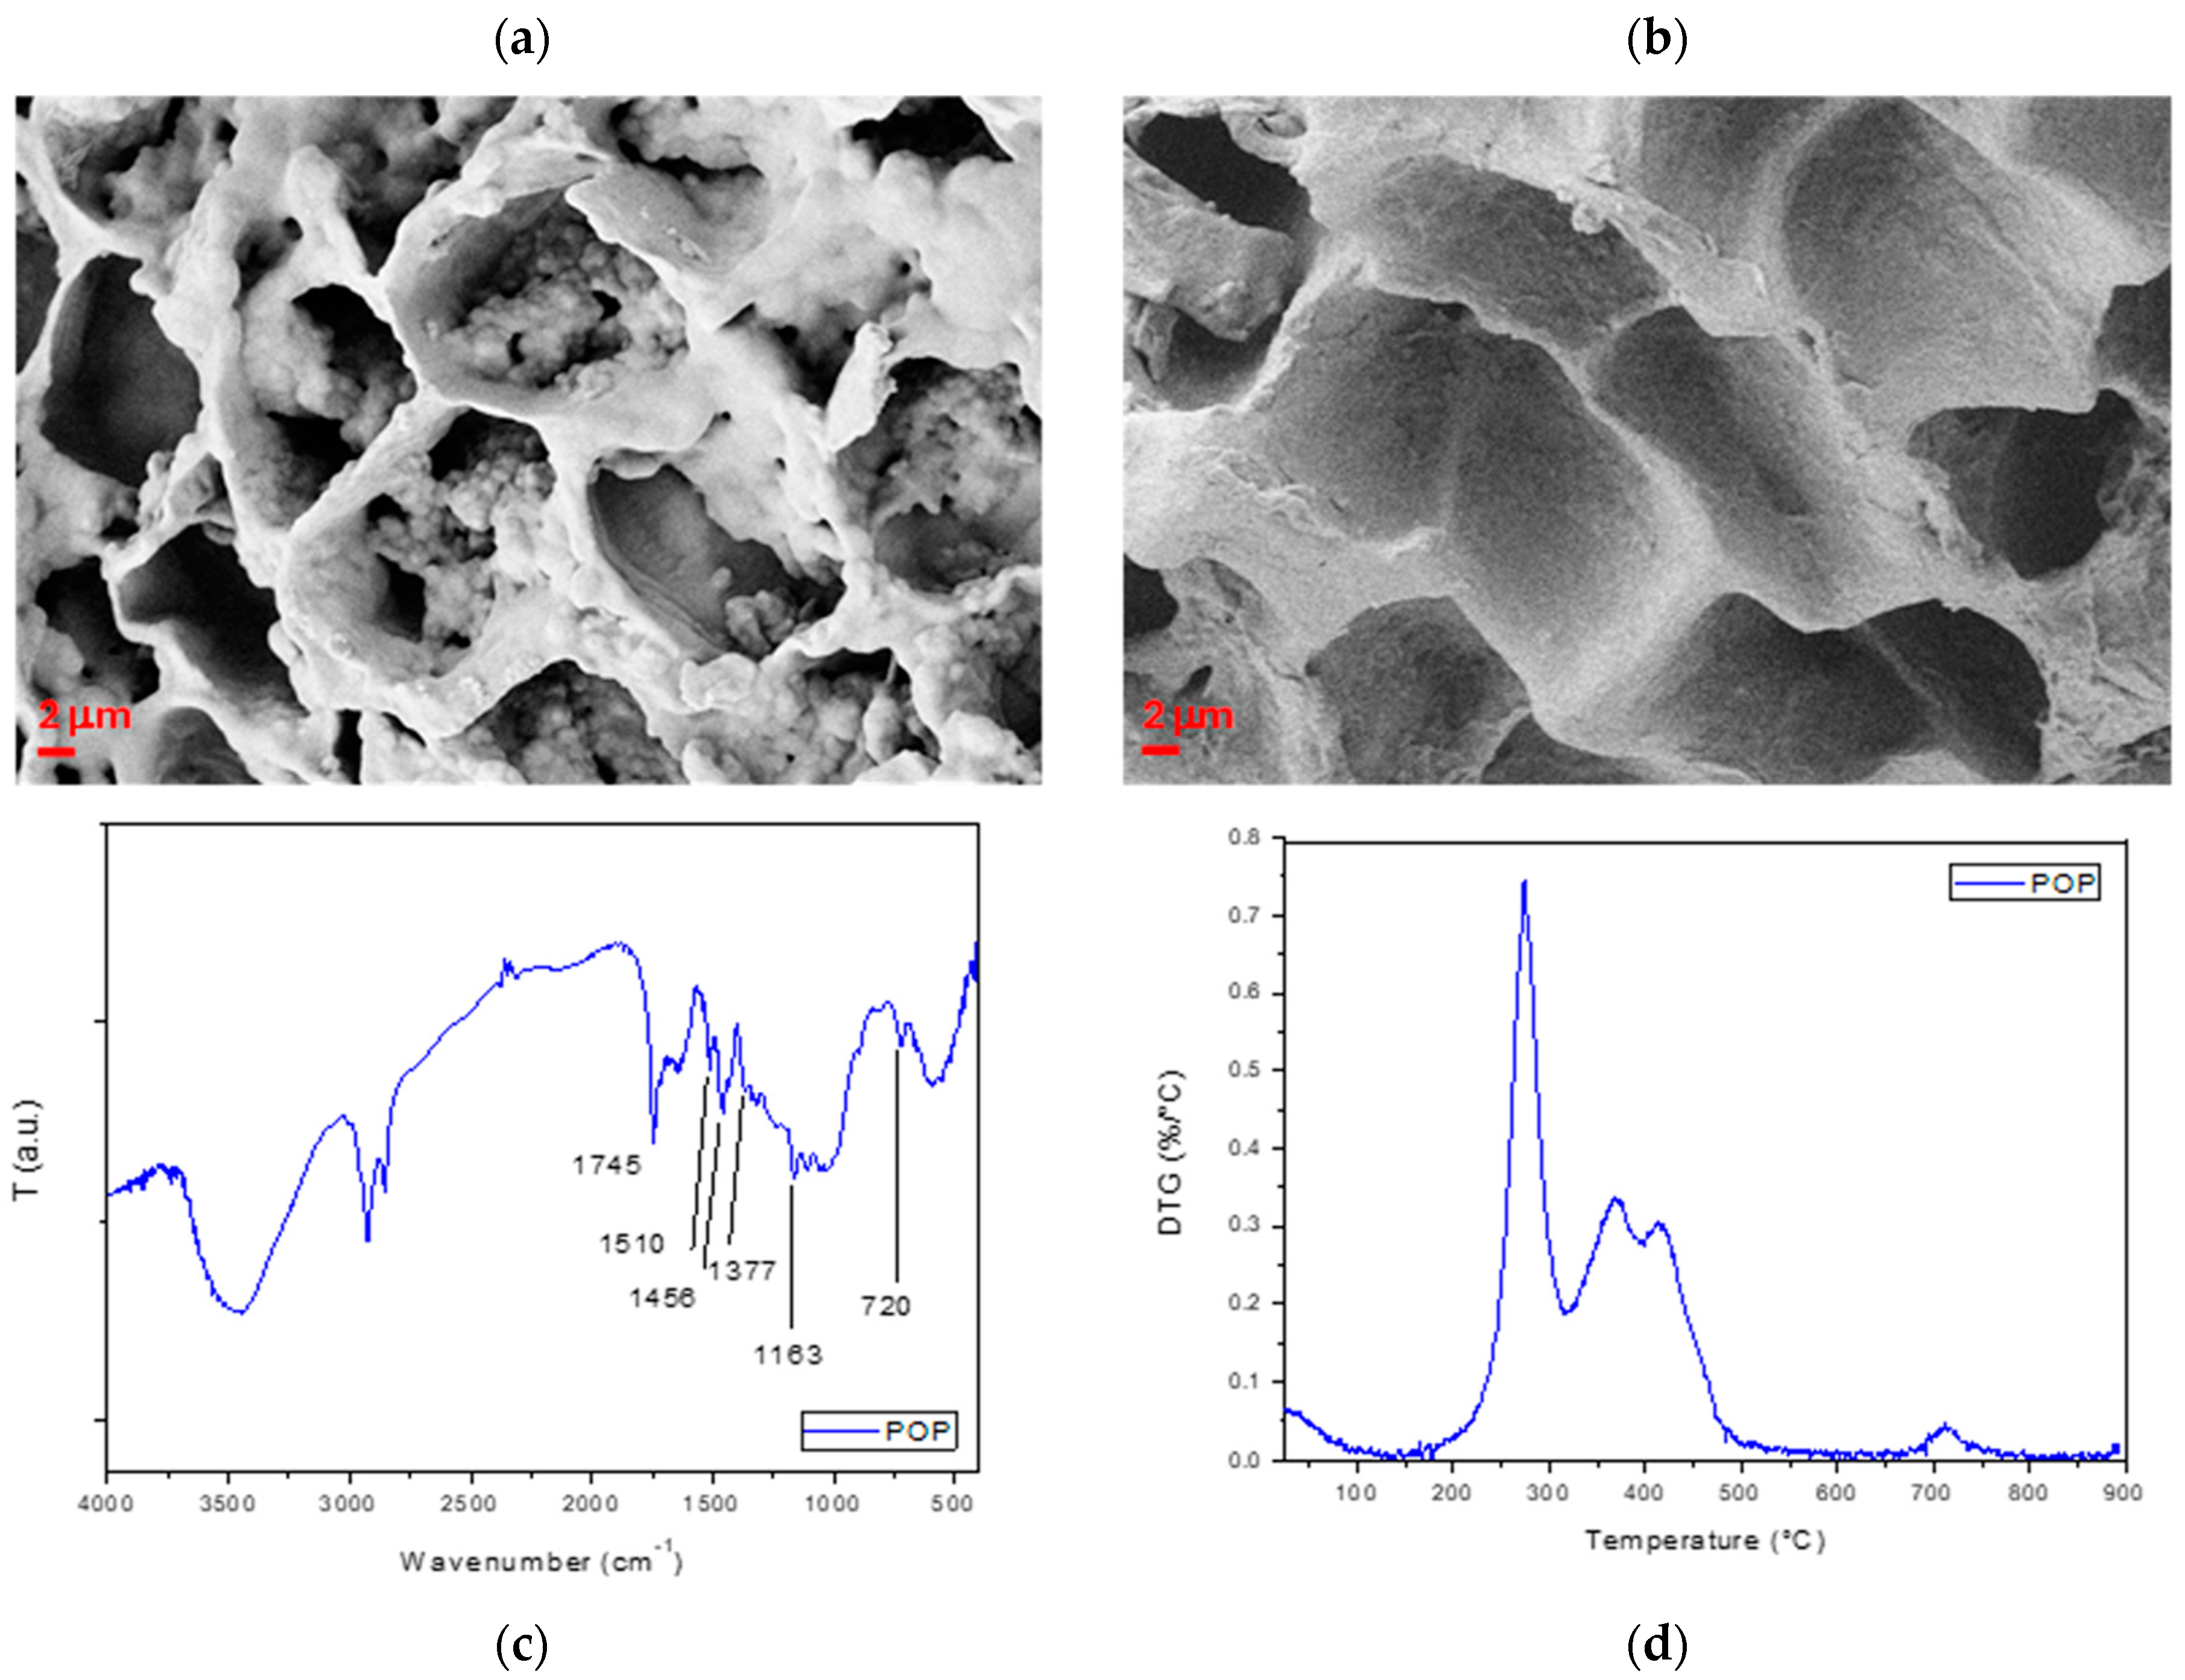
The results of the morphological, chemical, and thermal characterization of POP are included in Figure 3.
Untreated OP (Figure 3a) showed a rough and heterogeneous surface similar to most biomass structures. After the IL treatment (Figure 3b), the compactness of the surface of POP diminished, compared to OP, making the cell structure more evident due to the removal of hemicellulose and lignin. Both microstructures (FDOW and POP) evidenced the typical biomass morphology, composed of cells and walls. However, FDOW showed less clear pores, slightly thicker and denser cell walls, and a less smooth surface than POP, which, on the contrary, presents a sharper and more structured porous morphology.
As shown in the FTIR spectrum (Figure 3c), a broad absorption band between 3600 and 3000 cm−1 is linked to O–H stretching in alcohols and phenols. Peaks between 3000 and 2700 cm−1 are related to C–H stretching [47]. In the fingerprint region of POP, the distinct peak at 1745 cm−1 indicates the presence of carbonyl groups from cellulose and lignin. C=C vibrations of aromatic rings in lignin were recorded at 1509 cm−1, confirming the possible presence of residual lignin in the IL-treated OP [48]. The signals at 1456 cm−1 and 1377 cm−1 are due to CH2 bending in cellulose I. The signals at 1163 cm−1 and 720 cm−1 can be assigned to C–O–C asymmetric stretching and rocking vibration of the –CH2 group in cellulose, respectively. While the cellulosic component is present in both fractions, the main differences in the FTIR spectra of the two biomasses can be found in the fingerprint region and, specifically, in the presence of more visible peaks related to pectin, heteromannans, and heteroxylans at 1740 cm−1 and 1015 cm−1, proteins at 1231 cm−1 in FDOW, while the bands at 1456 and 1520 cm−1, attributed to lignin, are more intense in the POP spectrum.
The DTG curve (Figure 3d) for POP revealed three typical degradation stages, attributed to moisture evaporation, the main pyrolysis stage, and char formation (>500 °C). In the second step, three shoulders appear, likely corresponding to the distinct decomposition of the main cellulose components (first two peaks) and a considerably smaller fraction of lignin, which begins to degrade above 400 °C [49]. Finally, as supported by numerous studies, the IL-treated biomass can show decreased thermal stability compared to raw biomass.

3.2. Biogas Yield for the Different Biomasses

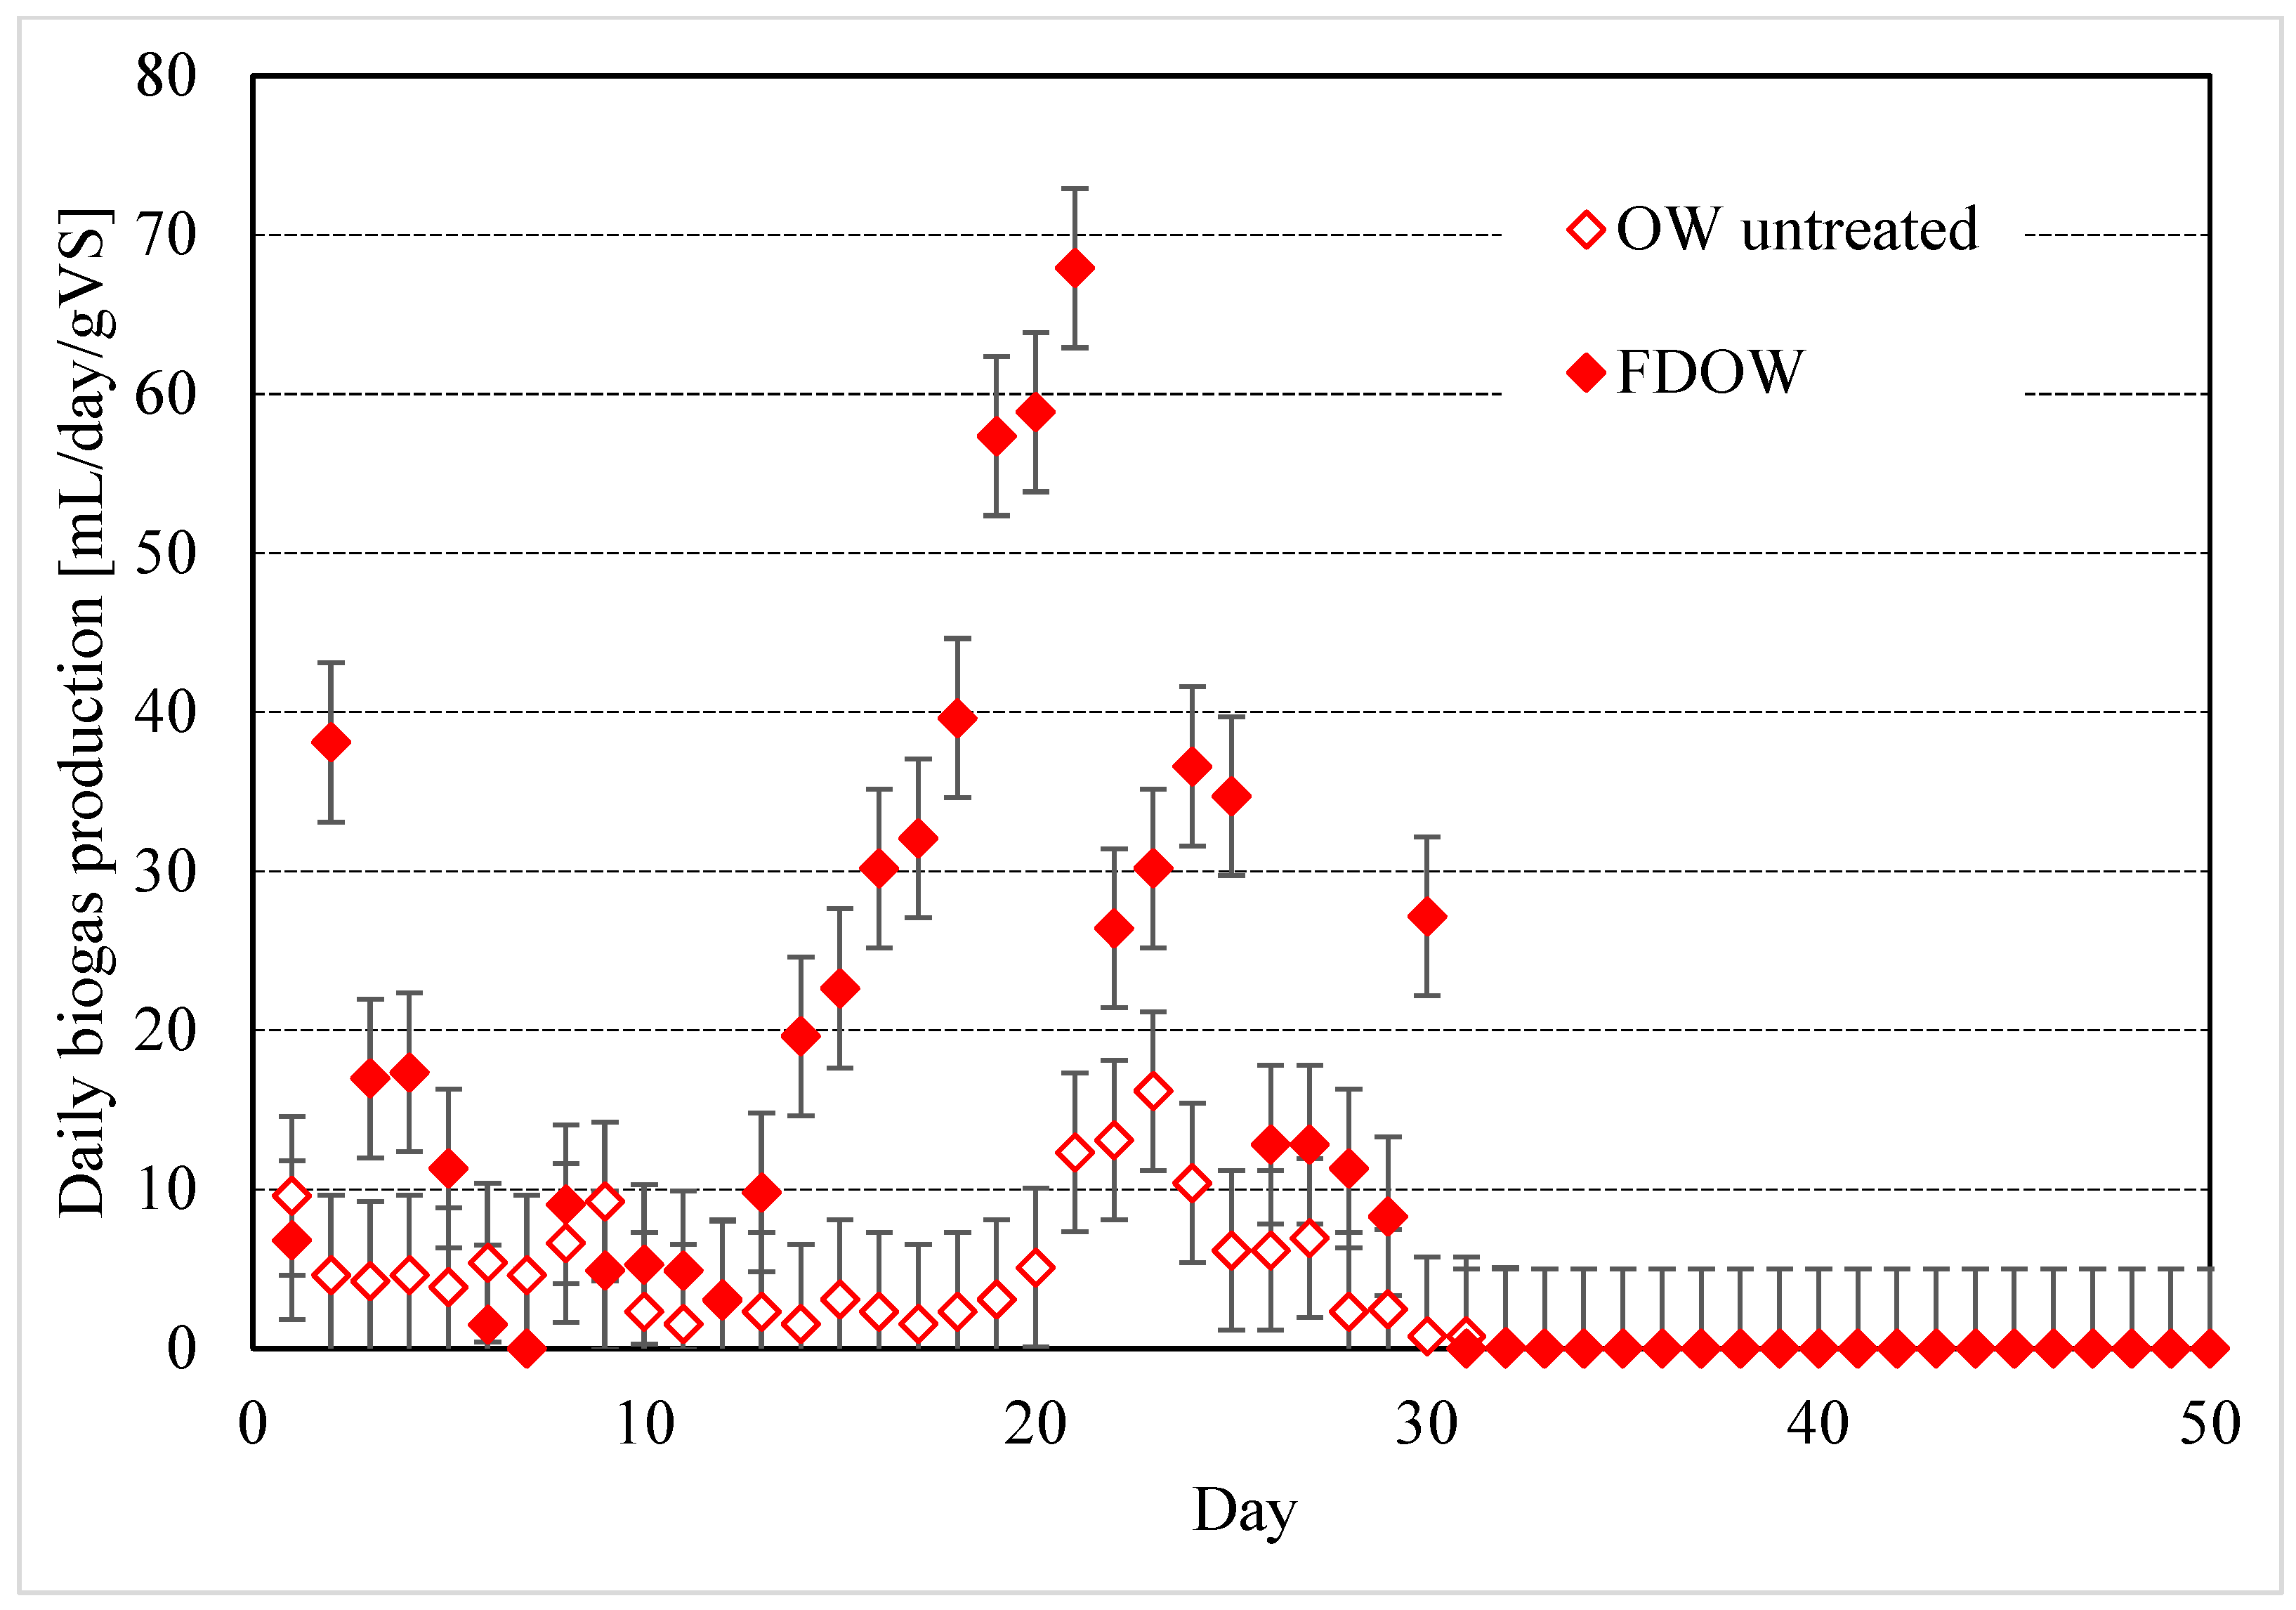
Figure 4 and Figure 5 describe the daily biogas production for the four samples in Table 2.
The daily production curves are referred to a single test for each sample and allow for easy determination of the process evolution for each different matrix investigated. For each value, the maximum error possible is equal to the accuracy of the graduated scale of vessels containing water and is equal to ±5 mL.
Biogas production from FDOW and OW, occurred in 30 and 32 days, respectively. No differences in production time were observed in the treated and untreated biomass. Conversely, untreated OP required 43 days to complete the process, while POP produced biogas only for 2 days. Nonetheless, the production of this matrix cannot be effectively compared with the other samples since the process ended prematurely, and the reasons behind this behavior will be discussed later in the text.
OP and OW showed low biogas production, 451 mL and 79 mL, respectively. In contrast, the production period differed: 43 days for OP and 32 days for OW. The pulp production process based on the use of IL drastically hindered the anaerobic bio-digestion, significantly reducing the biogas yield. Conversely, the freeze-drying process significantly enhanced the biogas yield, and the total production increased from 79 mL (untreated OW) to 658 mL. Even for this kind of treatment, a specific section is dedicated to deepening the reasons behind such a promoting action.
The production trend widely differed between the two different biomasses. For both OW and FDOW, an initial production peak was observed, which immediately dropped. Finally, a second peak was observed, which was responsible for almost the whole quantity of biogas produced. Then, production decreased again, and the process ended. The consistent difference in biogas production between OW and FDOW may be attributed to the effects of the freeze-drying process. This process reduces the moisture content of the biomass and enhances its preservation [50]. Freeze-drying is an effective procedure for dehydrating labile products via vacuum desiccation [50]. With this procedure, water is completely removed, and the remaining dry substance maintains most of the viable microbes and active substances present in the untreated biomass [51]. The high level of preservation of the initial microbial content and the ensured long shelf life make freeze-drying a widely applied procedure [52,53]. Additionally, the C/N ratio of FDOW (25.29) falls within the optimal range for anaerobic digestion, which is 20–30:1 [54]. This could further explain its higher production compared to other biomasses. In contrast, the C/N ratio of POP is 101, which could account for its lack of biogas production.
Also, the bioreactors containing OP and POP showed an initial peak, which immediately decreased. Then, OP assumed a constant production trend, which continued until day 43 and then definitively stopped. Based on the results of analyses carried out in this study, this latter trend can be associated with the low content of nitrogen in these two matrices (respectively, 0.70% and 0.31% on DM), which immediately acted as a limiting factor.
Table 3 shows the methane content of the biogas mixtures produced by the different samples. The results were calculated by considering the total biogas and biomethane production.
Table 3 indicates the total biogas production, the associated methane content, and the production period for four samples. Results are normalized as a function of VS.
The following average methane concentrations were measured:
(1)
OP: 66.30 vol%;
(2)
POP: 49.75 vol%;
(3)
OW: 56.99 vol%;
(4)
FDOW: 69.31 vol%.

3.3. Co-Digestion of Biomasses to Improve Nutrient Composition

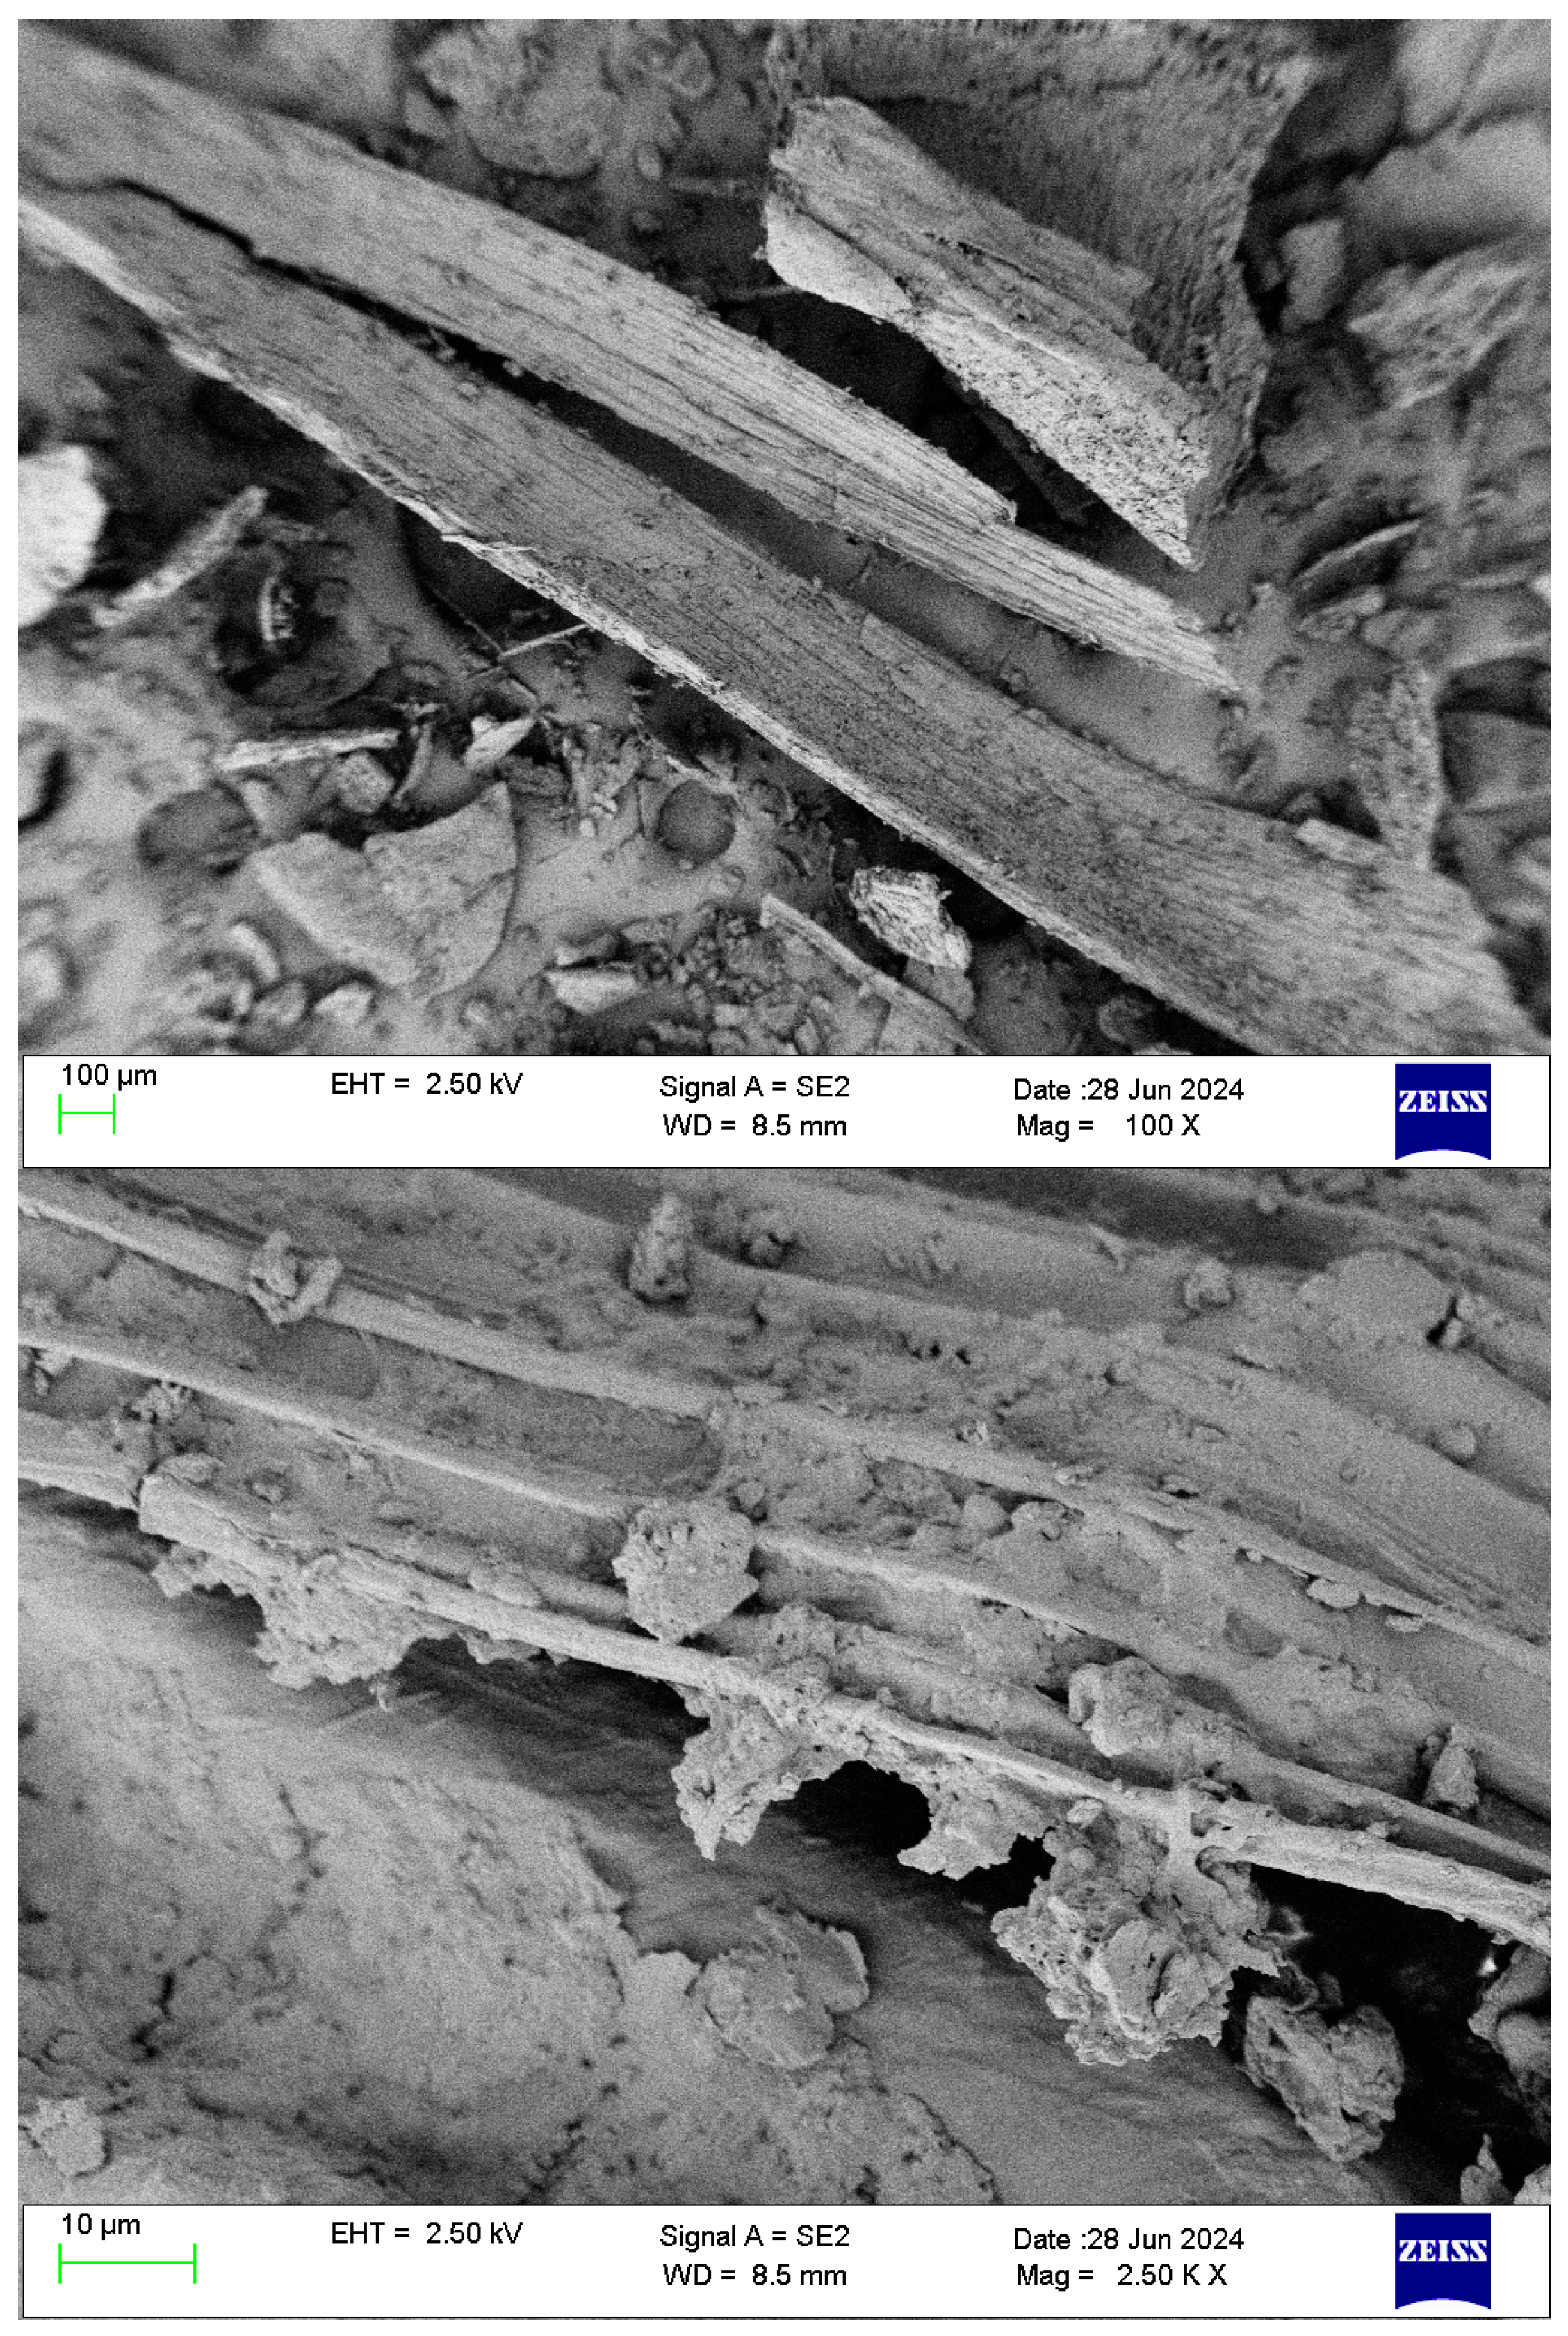
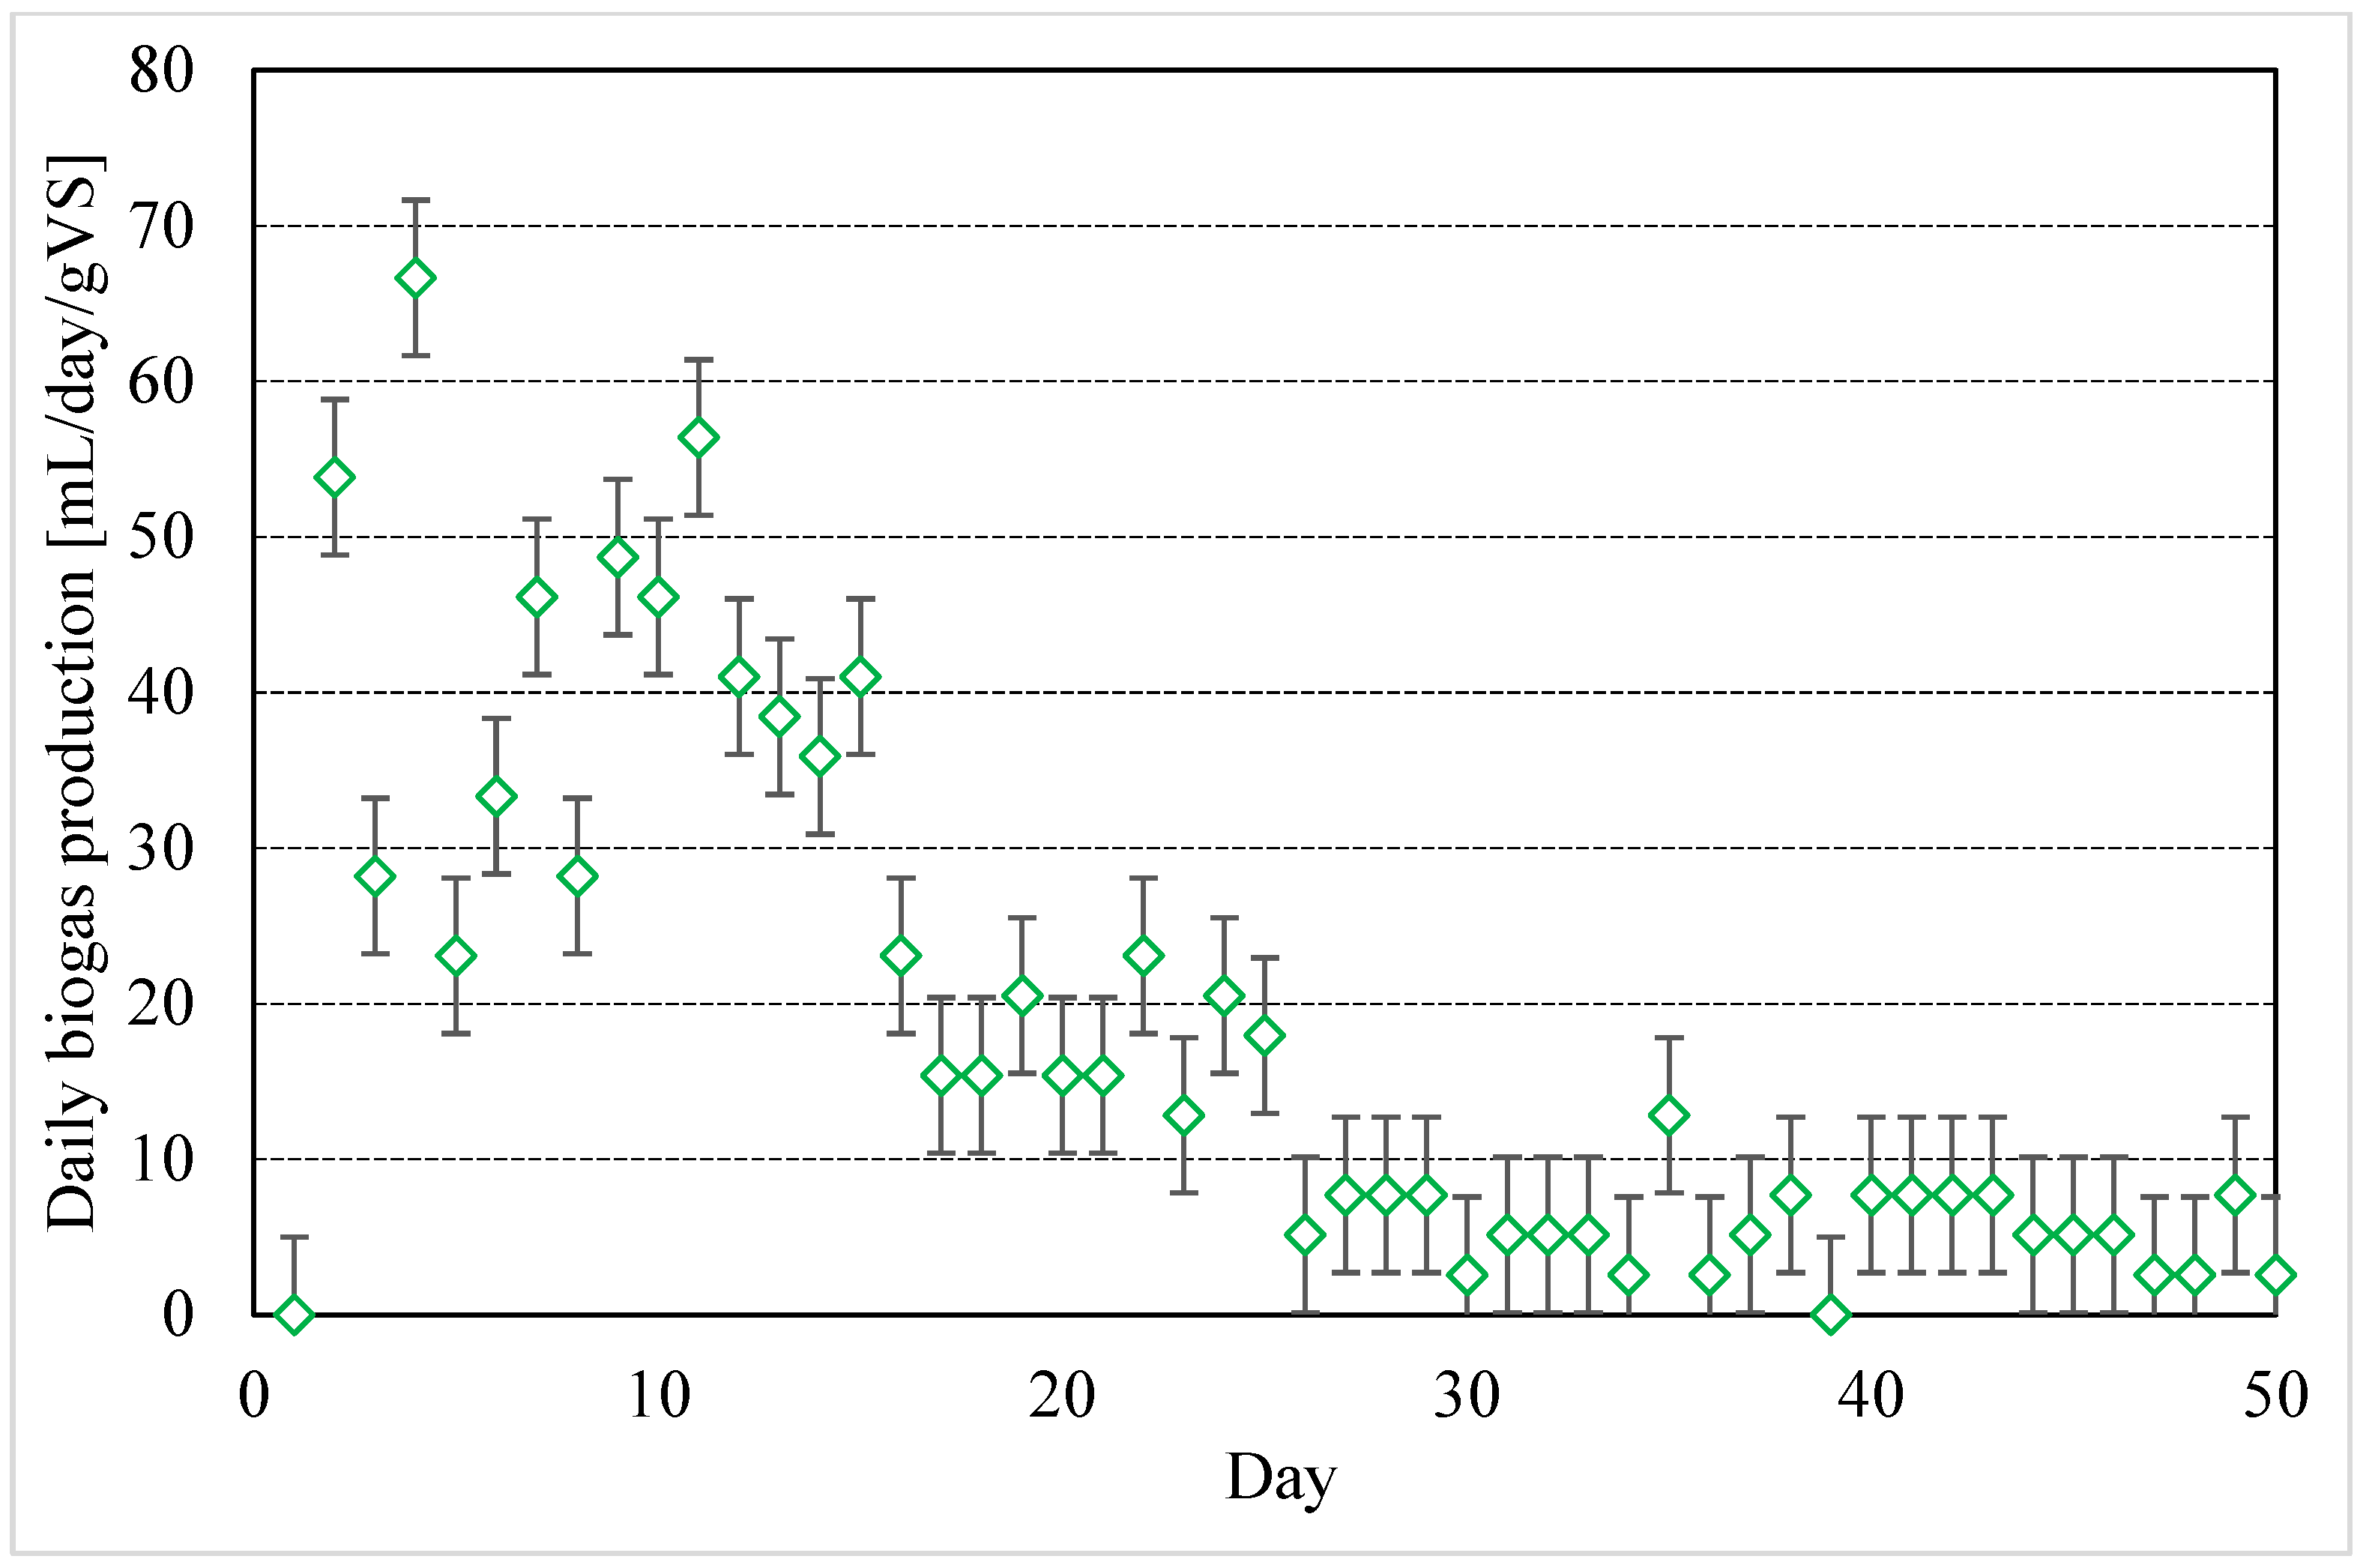
To better understand the reason behind such a difference, biogas was produced again from a matrix containing the same biomasses previously studied but mixed with a third typology of biomass, consisting of a brewery’s spent grain resulting from beer production waste (in this text referred to as BGS). BGS biomass was selected since it is capable of abundant biogas production and shows acceptable moisture and high nitrogen content. The main characteristics of this latter biomass are indicated in Table 4, together with the corresponding biogas and biomethane yields and the production time. Similar to the matrices previously described, the structural characterization of BSG was performed and is provided in Figure 6. The daily biogas production, obtained with the sole BGS and with the same procedure previously adopted for the other matrices, is described in Figure 7. The quantities of biogas shown in these diagrams and, more in general, in the whole experimental section of this study, together with the corresponding amounts of biomethane, are referred to standard conditions for gases.
In addition to the data reported in Table 2 and Table 4, fibers were measured for OP and BSG. Expressed as a percentage of the total composition, OP showed 30.9% lignin, 21.3% cellulose, and 15.6% hemicellulose. Similarly, the following percentages were measured for BSG: 18.2% lignin, 22.5% cellulose, and 59.9% hemicellulose.
By comparing the data shown in Table 2 and Table 4, there is a clear link between the ability of biomass to produce biogas and nitrogen content. Compared to OP and OW, those with a higher nitrogen load performed better, as in the case of BSG. The same can be asserted when comparing FDOW, OW, OP, and POP. This allowed us to postulate a clear need to provide nitrogen to the deficient biomass as an essential nutrient to support microbial activity. BSG was considered a suitable biomass to ascertain the need for nitrogen in biomass and to increase its biogas yield.
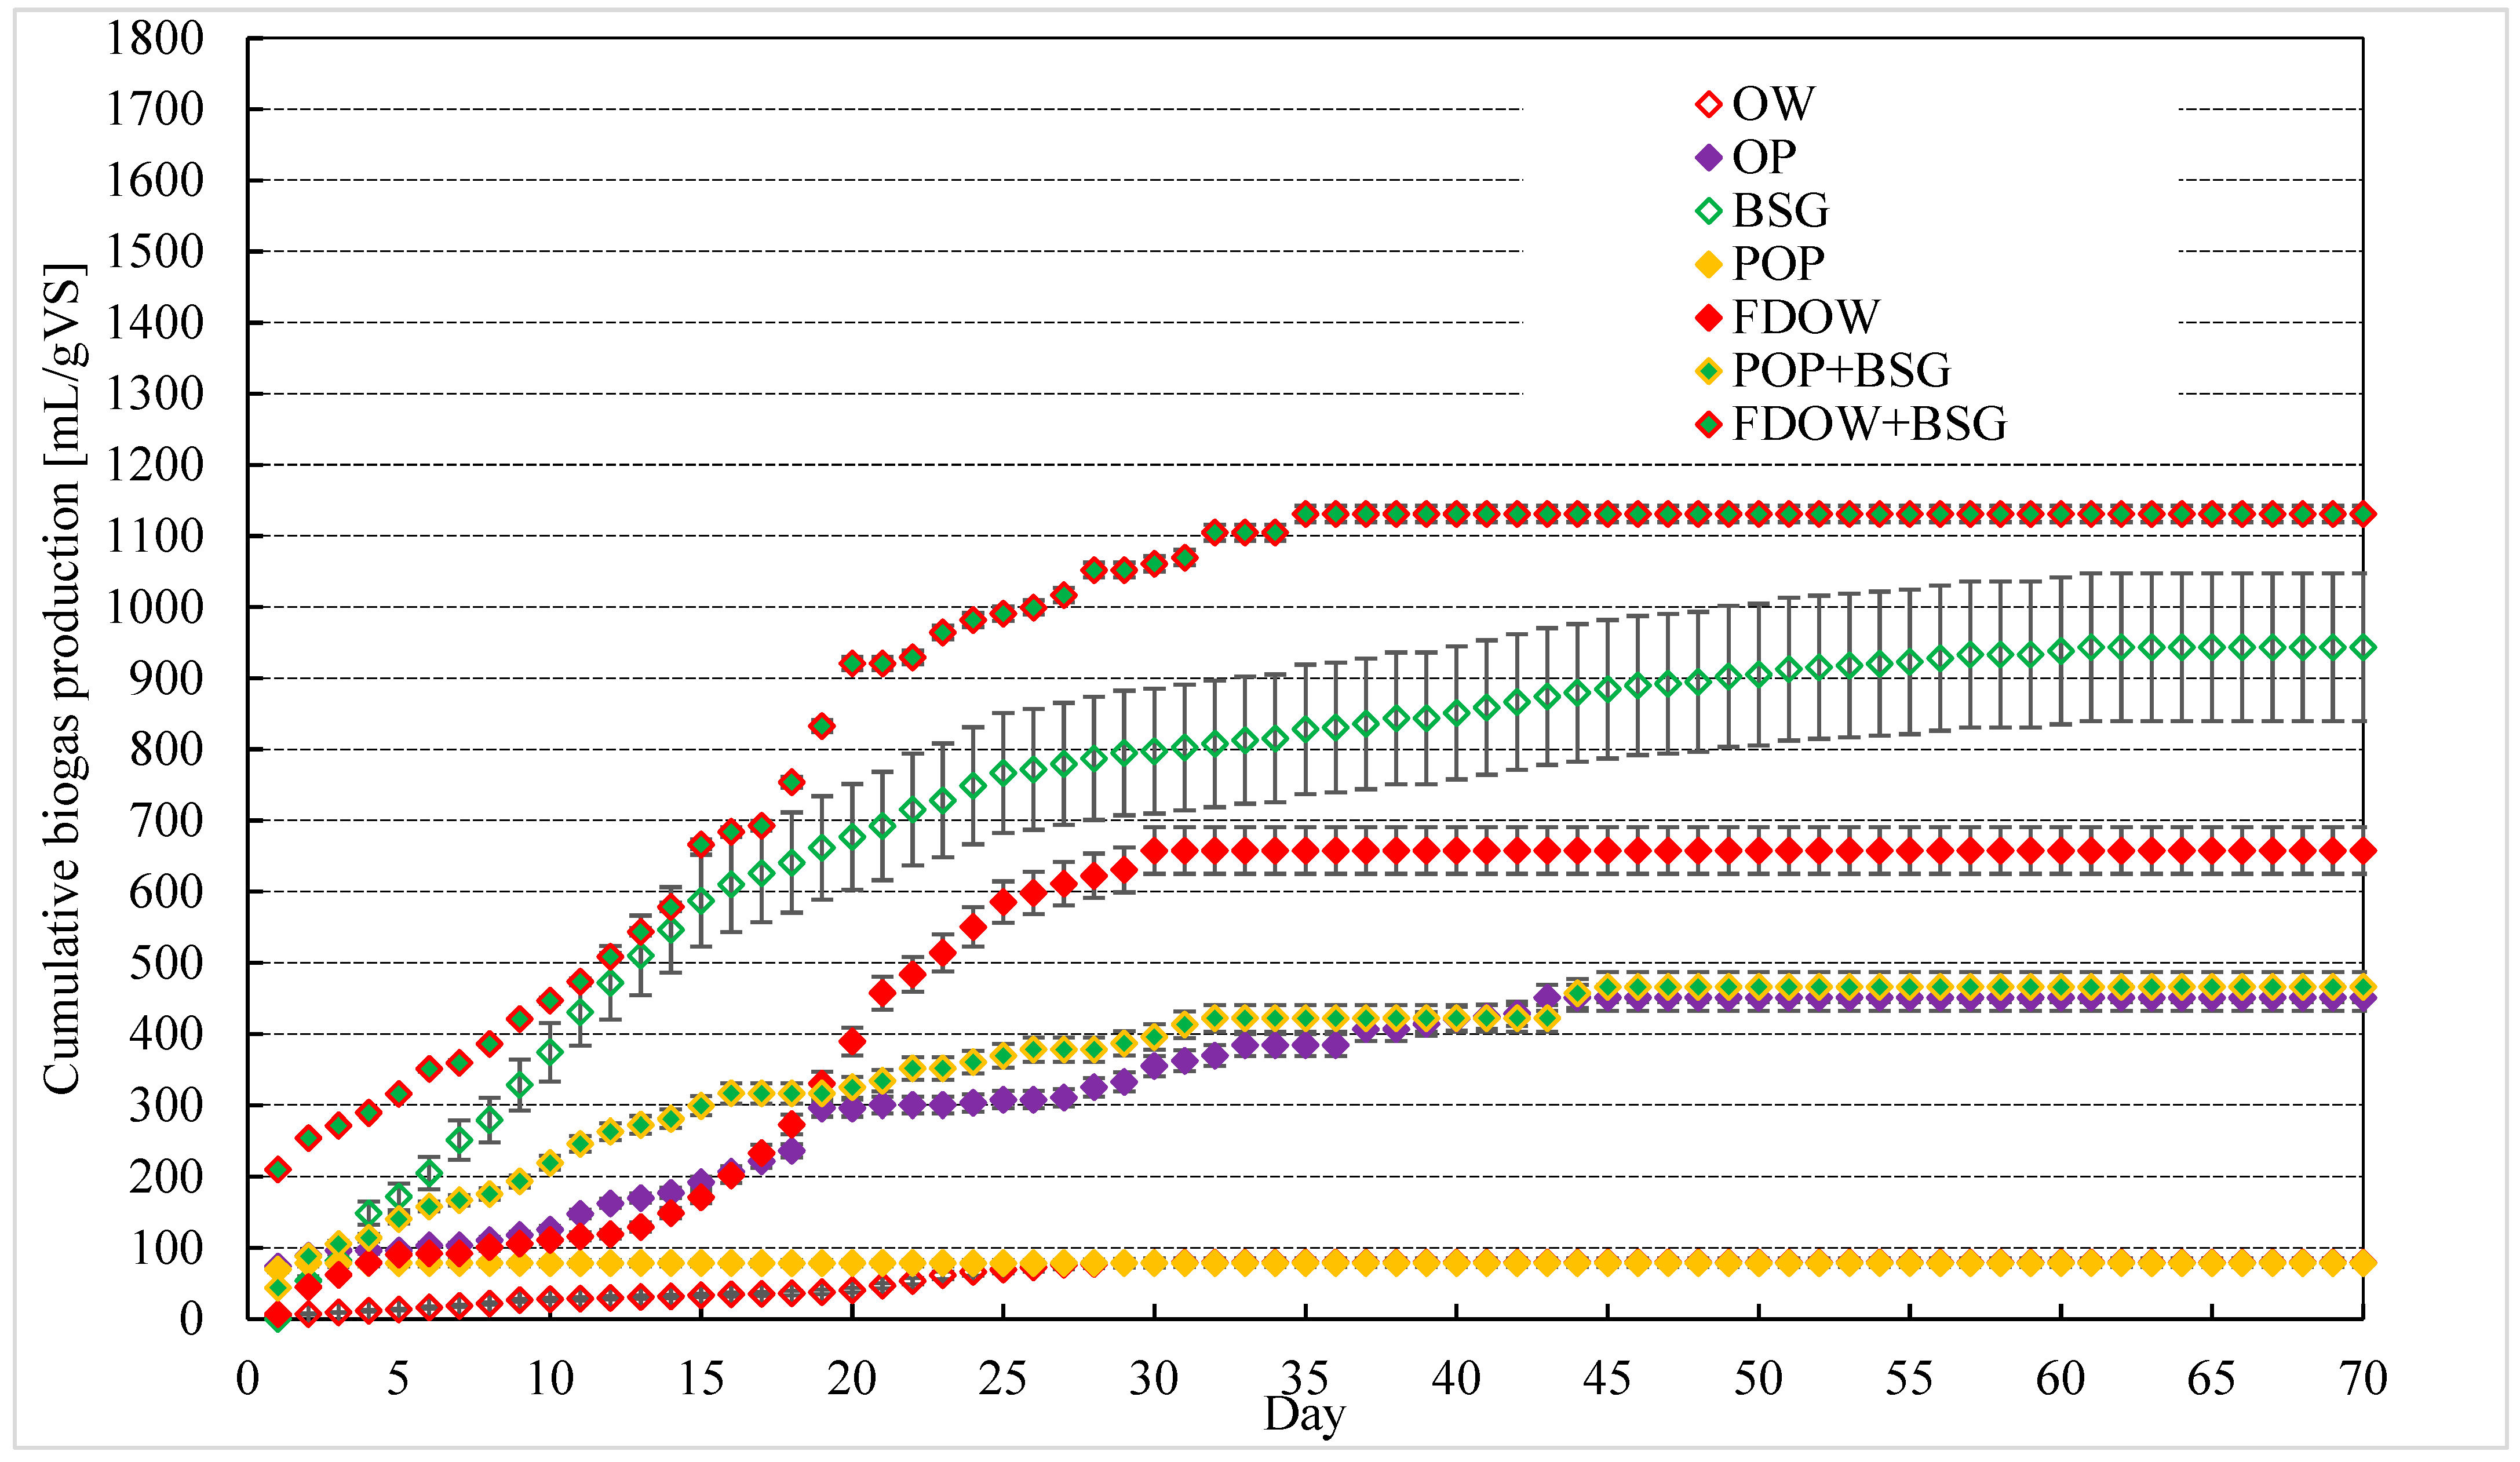
The following diagram (Figure 8) describes the cumulative biogas production of all the matrices tested in this work, reporting those already discussed for some biomasses in the previous sections. The diagram shows the cumulative trends for the following:
(i)
Untreated olive pomace (OP);
(ii)
Untreated olive mill wastewater (OW);
(iii)
Untreated brewery’s spent grain (BSG);
(iv)
Pulp from olive pomace (POP);
(v)
Freeze-dried olive mill wastewater (FDOW);
(vi)
POP+BSG;
(vii)
FDOW+BSG.
As specified in Section 2, one curve for each sample is here plotted and discussed. AD experiments conducted in triplicate yielded mean values for each sample, which were used to plot the subsequent curves. The error bars denote the region where the three curves, obtained for each typology of matrix, fall within.
The results indicate that biogas production due to the FDOW+BSG combination was significantly more performant than the singles of OW and FDOW (In Section 3.4, these results are compared with those of all the other OW-based matrices). The production period of 34 days was intermediate between that of FDOW (30 days) and that of BSG (61 days). The reason can be found in the TKN value: the freeze-drying process increased such a value from 0.53 (untreated OW) to 1.22 in FDOW, with the consequent more massive biogas production. From the data, it emerges that, when producing biogas from BSG, the addition of smaller amounts of FDOW significantly shortens production time, resulting in reduced operational costs.
A similar trend was observed for POP+BSG, which showed a biogas production of 46 mL in 44 days. The production fell between those related to BSG (920 mL) and POP (75 mL). Also, the production period was intermediate: 44 vs. 62 days for BSG and 2 days for POP. The addition of BSG significantly improved the process due to its high nitrogen content. The following two sections provide more details about the biogas production from OW and OW-based samples (Section 3.4) and OP and OP-based samples (Section 3.5).
Finally, it should be noted that raw materials having a C/N ratio within the 20–30 range reached the highest production observed in this study.

3.4. Biogas Production from OW and OW-Based Matrices

The production of biogas from untreated olive mill wastewater was not comparable with that of freeze-dried OW. By themselves, OWs are not used for biogas production; however, it is widely established that their addition to other matrices is often capable of enhancing the anaerobic digestion of biomass [55]. Several issues must be overcome before using exclusively untreated OW, such as the low pH and nitrogen content and the excessive presence of inhibiting compounds [56]. The main reason behind such low production was often attributed to polyphenols. However, recent studies revealed that these compounds, together with other substances such as flavonoids, are helpful for the process and assume the role of inhibitors only when their concentration is too elevated [57,58]. That explains why OW is an effective additive but cannot be used for high-efficiency biogas production [32,59]. Moreover, the humidity content of OW must often be reduced to achieve acceptable biogas production per mass unit of used biomass.
The freeze-drying process solved most of the previously mentioned problems. In addition to the complete removal of moisture, it increased the nitrogen content and acted on the morphology of the whole matrix, providing it with the ideal porosity for bacterial activity [51,52,53]. Moreover, the process also damages the microbial entities present in OW. Ice crystals can disrupt the permeability, integrity, and fluidity of cell membranes. Also, part of metabolism-related enzymes is inevitably eliminated, with the consequent reduction in the number of viable microbes [60]. These effects could help keep the concentration of these substances below the threshold required to achieve high-efficiency biogas production.
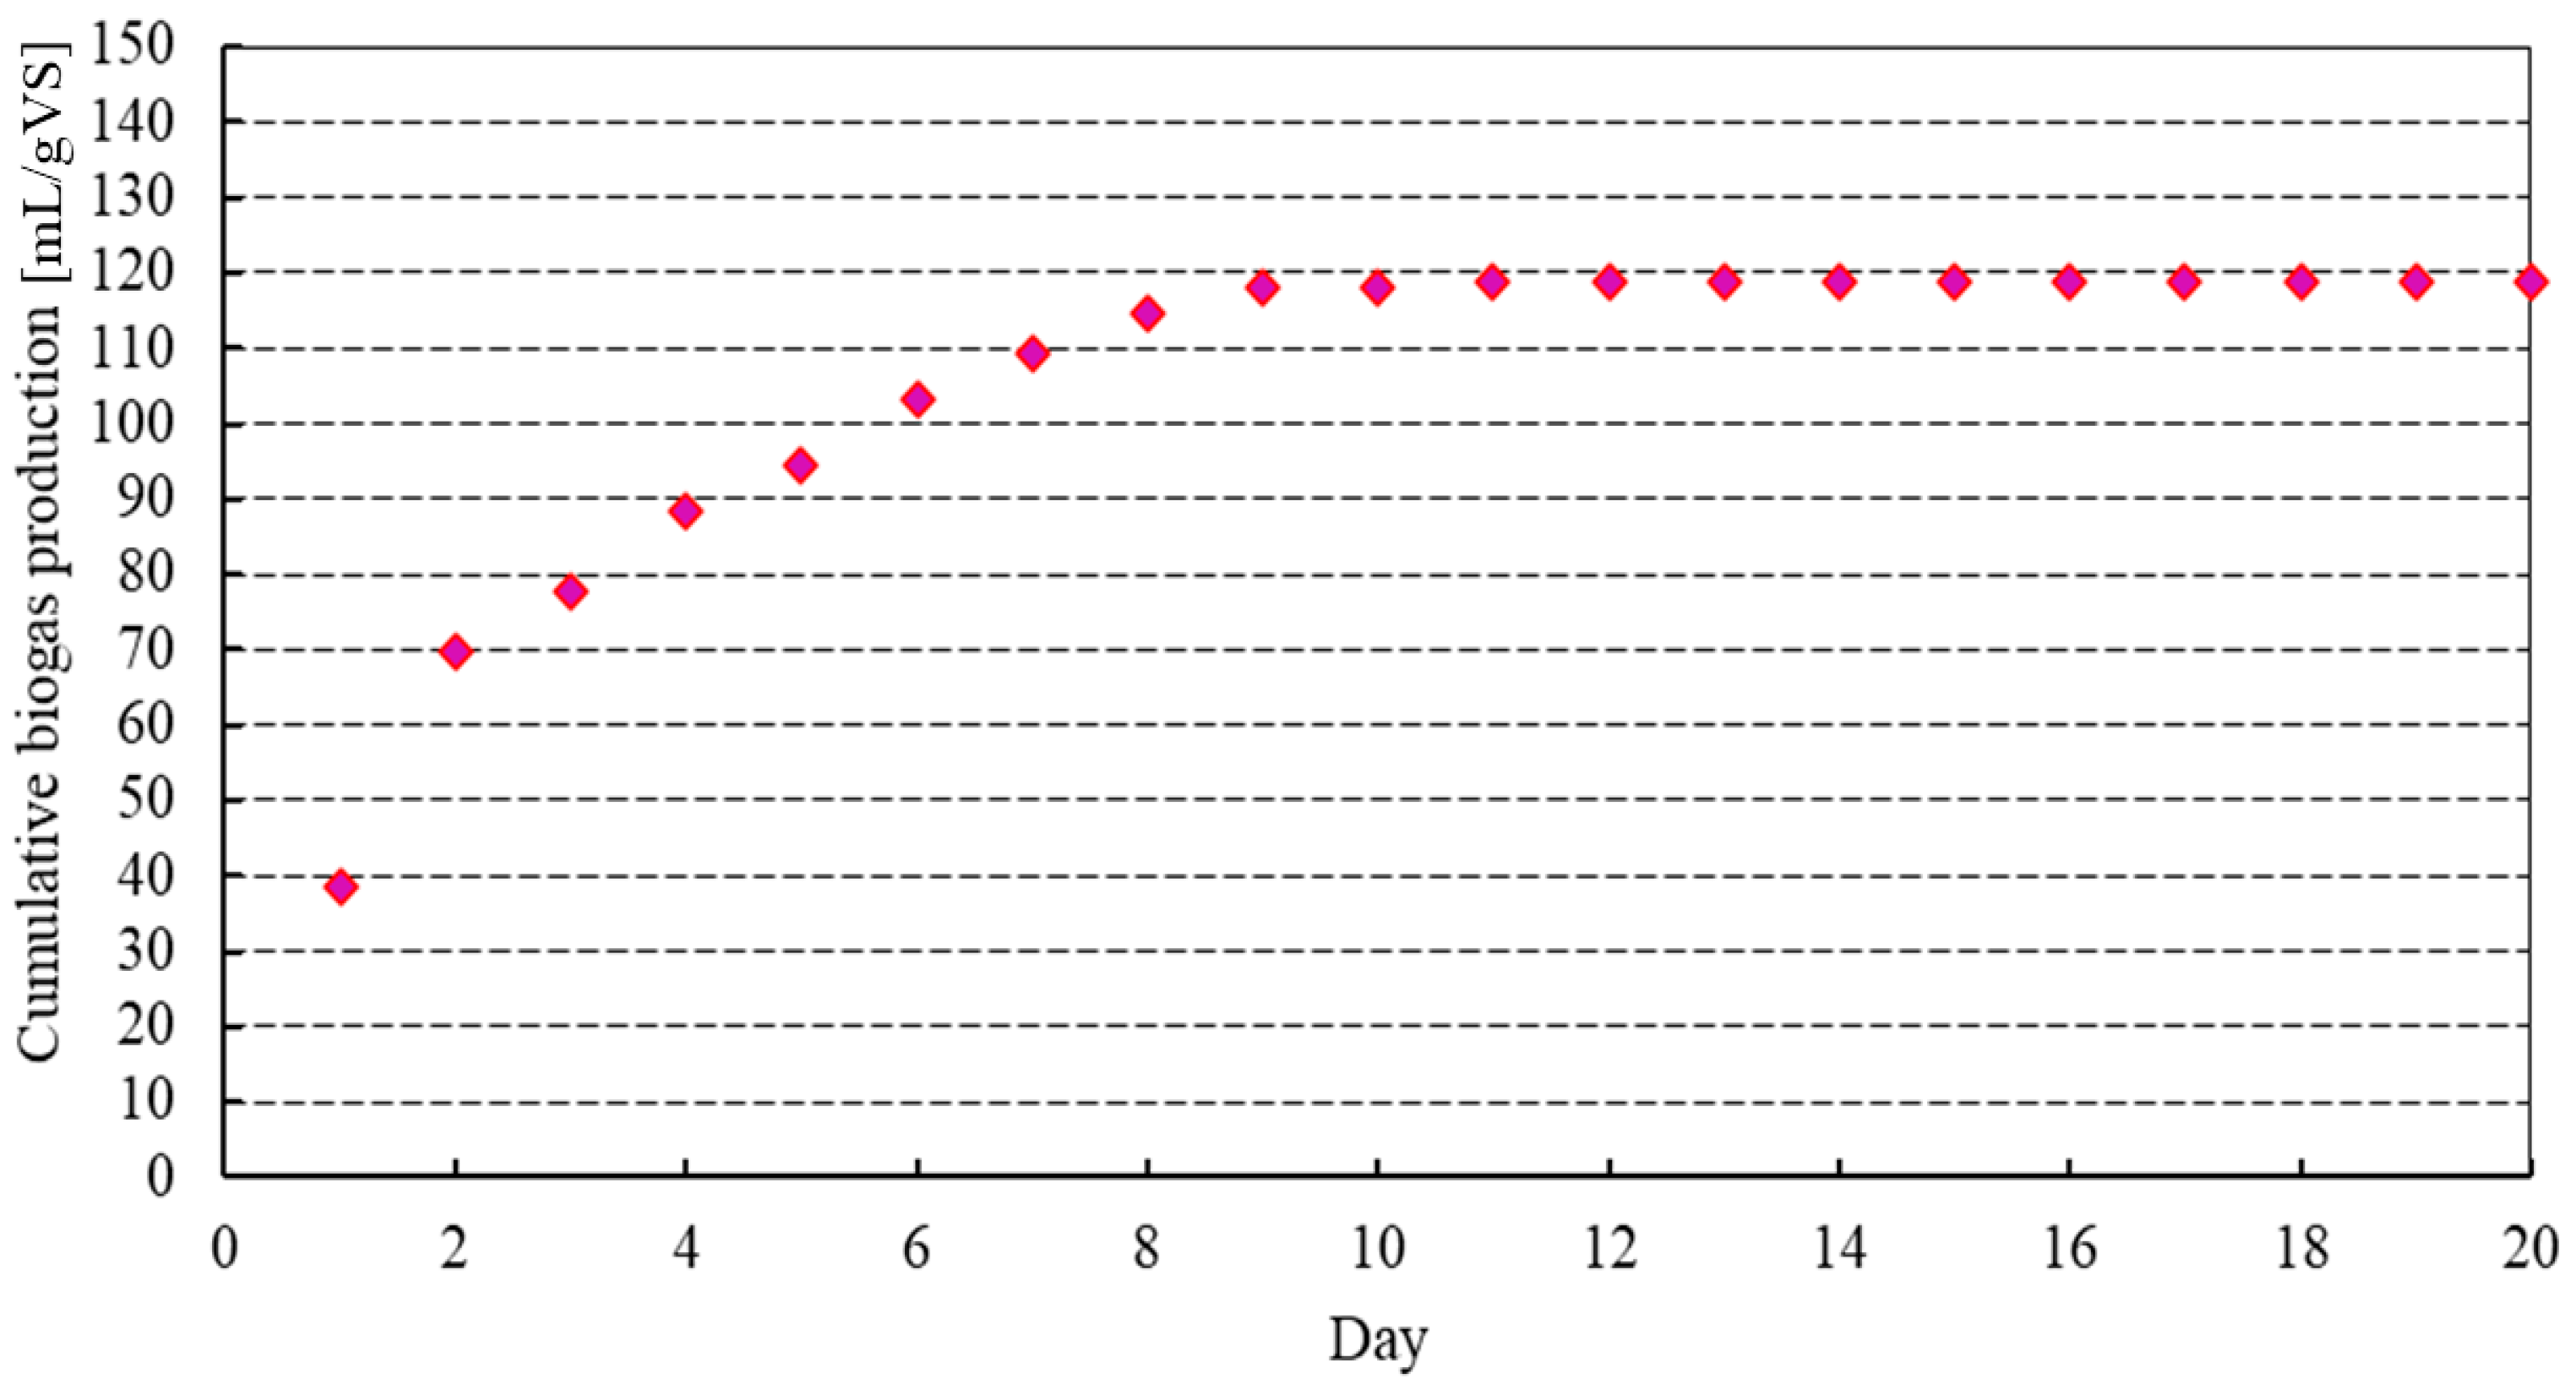
The following diagram (see Figure 9) shows the cumulative quantity of biogas produced from FDOW after the extraction of polyphenols and flavonoids (FDOW-PF) previously obtained with the same apparatus by Montegiove and colleagues [32].
Comparing the results of this study with those obtained in [32], it is evident that freeze-drying the biomass before anaerobic digestion enhances biogas production. In contrast, the extraction of polyphenols and flavonoids can significantly hinder the process. The total quantity of biogas produced was equal to 119 mL/gVS, while the same quantity of FDOW, but without the extraction of high-added-value products, led to the production of 658 mL/gVS of biogas.
Typical concentrations of polyphenols in OW range from 0.5 to 24 g L−1 [61,62], and concentrations varying from 0.5 to 2 g/L are enough to reduce the biogas production [63] significantly and consequently, to provide a meaningful contribution, OW should be co-digested with other substrates.
Based on the results discussed in this section, the freeze-drying process could lower the concentration of those species without removing them completely, thus enhancing the biogas yield.

3.5. Biogas Production from OP and OP-Based Matrices

The production of biogas from olive pomace (OP) was markedly higher than what was obtained with the untreated OW: 451 mL of biogas were produced in 43 days. The main difference with OW was the methane content. In addition, the methane content of biogas produced with OP was higher than that measured for OW: 66.3 vol% for OP and 56.99 vol% for OW. Differences in biomethane concentration are closely related to the chemical composition of the biomass, which influences all stages of anaerobic digestion (AD), resulting in different biogas composition [64]. The process ended after two days, suggesting the exhaustion of a required ingredient. Based on the TKN analyses, the lack of nitrogen (TKN equal to 0.31% on DM) caused the premature interruption of the process. The addition of BSG (having TKN equal to 3.9% on dry matter) significantly increased the production: 442 mL of biogas were produced in 44 days. It should be noted that once a source of nitrogen was provided to the OP-based substrate, the production period became equal to the one observed for OP, thus further confirming the lack of nitrogen as the main drawback for biogas production from POP. This reduction of nitrogen ascertained for POP can be considered the consequence of a typical feature of many ionic liquids, which can solubilize the protein from the treated biomass. In particular, ILs can increase the solubility of these biomolecules by directly interacting through their ions with the functional groups of the proteins [59]. The solubilizing effect may alternatively result from the interfacial interactions of strongly hydrated IL anions close to protein surfaces, whereas the intensely hydrated cations tend to bind with protein amide groups [65].
Finally, as previously indicated, the POP+BSG samples produced 466 mL of biogas and contained 0.3 g (dry matter) of BSG.
The following Table 5 summarizes the overall quantity of biogas produced for each substrate, associated with the corresponding volatile solids (VS) quantity. The results were calculated according to Section 2.1.1. The quantities of biogas produced per unit mass of VS were reported with the corresponding standard deviations.
Regarding OW and OW-based substrates, Table 5 and Figure 8 results confirmed the promoting effect due to the freeze-drying process: FDOW produced 658 mL/g of biogas, while untreated OW produced 79 mL/g. Similarly, the low production of FDOW-PF (32 mL/g) proved that the complete extraction of polyphenols and flavonoids can reduce biogas production [66]. Also, the results obtained for OP and OP-based substrates confirmed what was previously asserted. OP produced 451 mL/g of biogas, while only 79 mL/g were obtained with POP. Adding BSG to POP improved biogas production.
The normalization of biogas produced as a function of vs. revealed the synergistic effect obtained by coupling FDOW with BGS. This substrate led to the highest production reached in this work, equal to 1131 mL/g, and can consequently be considered, among the samples tested, the most viable pretreated mixture for biogas production.

4. Conclusions

The present research dealt with the reuse of agro-industrial residuals, derived from the oil and beer production sectors, aimed at favoring the environmental and economic suitability of the whole supply chains. By itself, crop production could not reach the standard fixed to carry out the biorefinery approach; the reuse of residuals and, mostly, the research aimed at optimizing their exploitation are therefore mandatory.
Based on their properties and chemical composition, OW and OP were first treated by applying two different procedures (IL treatment for OP and freeze-drying for OW, respectively) and then mixed with the same typology of digestate in lab-scale batch anaerobic reactors. FESEM images revealed that IL treatment reduced the compactness of the OP surface due to the removal of hemicellulose and lignin fraction; partial removal of lignin was also detected by FTIR, while typical peaks for the cellulose component were found unaltered after IL treatment. The DTG curve showed a reduction in thermal stability after the IL treatment in comparison with the raw biomass.
The IL treatment significantly reduced the biogas production of OP, which decreased from 451 mL of biogas per gram of VS to 79 mL in the treated OP. Based on TKN analyses, the main reason for this drop was ascribed to a very low nitrogen content shown by POP. Further experiments were conducted by mixing POP with a different kind of biomass, the BSG, with a high TKN, to ascertain the above hypothesis. This combination decisively improved the biogas yield of POP, demonstrating the importance of nitrogen in biogas production. In addition, it is important to consider that mixing different biomasses can alter microbial communities, including species involved in the methanogenesis process. Therefore, further studies should focus on investigating these microbial communities to understand their changes and their relationship with biogas and biomethane yields.
Conversely, the freeze-drying process strongly enhanced the OW biogas production. Indeed, FDOW yields 658 mL of biogas per gram of VS, compared to the untreated OW, which produced only 79 mL of biogas per gram of VS. Additionally, in the co-digestion of FDOW with BSG, the biogas production of BSG was enhanced, increasing from 944 mL/g of vs. to 1131 mL in the co-digested BSG. Based on the results achieved in this work and the state of the art, the freeze-drying process made the raw biomass more attachable by microorganisms. In addition, the freeze-drying also inevitably reduced the content of active biomolecules of OW, making their concentrations closer to the optimal ranges defined in the literature.

Supplementary Materials

The following supporting information can be downloaded at: https://www.mdpi.com/article/10.3390/agriculture15212204/s1.

Author Contributions

All authors contributed to the study conceptualization and design. Experimental data were produced by J.D.M., A.R. and D.P. (Dario Priolo). Analyses were performed by M.R., D.P. (Dario Priolo), D.D.B. and D.P. (Debora Puglia). G.G. validated and supervised the whole study. The first draft was written by J.D.M., A.M.G. and D.D.B. All authors have read and agreed to the published version of the manuscript.

Funding

This work was funded by the European Union—NextGenerationEU as part of the National Innovation Ecosystem grant ECS00000041—VITALITY promoted by the Ministero dell’Università e della Ricerca (MUR). We thank the University of Perugia and the MUR for their support within the VITALITY project.

Institutional Review Board Statement

Not applicable.

Data Availability Statement

The datasets generated and analyzed during the current study are available from the corresponding author on reasonable request.

Conflicts of Interest

The authors declare no conflicts of interest.

References

  1. IOC [International Olive Council]. Olive Oil Production by Country. 2019. Available online: https://www.internationaloliveoil.org/olive-oil-estimates-2019-20-crop-year/ (accessed on 20 October 2025).
  2. Di Giacomo, G.; Romano, P. Evolution of the Olive Oil Industry along the Entire Production Chain and Related Waste Management. Energies 2022, 15, 465. [Google Scholar] [CrossRef]
  3. Rapa, M.; Ciano, S. A Review on Life Cycle Assessment of the Olive Oil Production. Sustainability 2022, 14, 654. [Google Scholar] [CrossRef]
  4. Abu-Lafi, S.; Al-Natsheh, M.S.; Yaghmoor, R.; Al-Rimawi, F. Enrichment of Phenolic Compounds from Olive Mill Wastewater and In Vitro Evaluation of Their Antimicrobial Activities. J. Evid. Based Complement. Altern. Med. 2017, 2017, 3706915. [Google Scholar] [CrossRef] [PubMed]
  5. Albalasmeh, A.A.; Alajlouni, M.A.; Ghariabeh, M.A.; Rusan, M.J. Short-Term Effects of Olive Mill Wastewater Land Spreading on Soil Physical and Hydraulic Properties. Water Air Soil Pollut. 2019, 230, 208. [Google Scholar] [CrossRef]
  6. Galloni, M.G.; Ferrara, E.; Falletta, E.; Bianchi, C.L. Olive Mill Wastewater Remediation: From Conventional Approaches to Photocatalytic Processes by Easily Recoverable Materials. Catalysts 2022, 12, 923. [Google Scholar] [CrossRef]
  7. Antónia Nunes, M.; Pawlowski, S.; Costa, A.S.G.; Alves, R.C.; Oliveira, M.B.P.P.; Velizarov, S. Valorization of Olive Pomace by a Green Integrated Approach Applying Sustainable Extraction and Membrane-Assisted Concentration. Sci. Total Environ. 2019, 652, 40–47. [Google Scholar] [CrossRef] [PubMed]
  8. Chanioti, S.; Tzia, C. Processing Parameters on the Extraction of Olive Pomace Oil and Its Bioactive Compounds: A Kinetic and Thermodynamic Study. J. Am. Oil Chem. Soc. 2018, 95, 371–382. [Google Scholar] [CrossRef]
  9. Gullón, P.; Gullón, B.; Astray, G.; Carpena, M.; Fraga-Corral, M.; Prieto, M.A.; Simal-Gandara, J. Valorization of By-Products from Olive Oil Industry and Added-Value Applications for Innovative Functional Foods. Food Res. Int. 2020, 137, 109683. [Google Scholar] [CrossRef]
  10. Caporaso, N.; Formisano, D.; Genovese, A. Use of Phenolic Compounds from Olive Mill Wastewater as Valuable Ingredients for Functional Foods. Crit. Rev. Food Sci. Nutr. 2018, 58, 2829–2841. [Google Scholar] [CrossRef]
  11. Cea Pavez, I.; Lozano-Sánchez, J.; Borrás-Linares, I.; Nuñez, H.; Robert, P.; Segura-Carretero, A. Obtaining an Extract Rich in Phenolic Compounds from Olive Pomace by Pressurized Liquid Extraction. Molecules 2019, 24, 3108. [Google Scholar] [CrossRef]
  12. El-Abbassi, A.; Kiai, H.; Raiti, J.; Hafidi, A. Cloud Point Extraction of Phenolic Compounds from Pretreated Olive Mill Wastewater. J. Environ. Chem. Eng. 2014, 2, 1480–1486. [Google Scholar] [CrossRef]
  13. Di Mario, J.; Bertoldi, A.; Priolo, D.; Calzoni, E.; Gambelli, A.M.; Dominici, F.; Rallini, M.; Del Buono, D.; Puglia, D.; Emiliani, C.; et al. Characterization of processes aimed at maximizing the reuse of Brewery’s Spent Grain: Novel biocomposite materials, high-added-value molecule extraction, codigestion and composting. Recycling 2025, 10, 124. [Google Scholar] [CrossRef]
  14. Del Mar Contreras, M.; Romero, I.; Moya, M.; Castro, E. Olive-Derived Biomass as a Renewable Source of Value-Added Products. Process Biochem. 2020, 97, 43–56. [Google Scholar] [CrossRef]
  15. Poletto, M. Lignin: Trends and Applications; BoD—Books on Demand: Norderstedt, Germany, 2018. [Google Scholar]
  16. Laurichesse, S.; Avérous, L. Chemical Modification of Lignins: Towards Biobased Polymers. Prog. Polym. Sci. 2014, 39, 1266–1290. [Google Scholar] [CrossRef]
  17. Munk, L.; Sitarz, A.K.; Kalyani, D.C.; Mikkelsen, J.D.; Meyer, A.S. Can Laccases Catalyze Bond Cleavage in Lignin? Biotechnol. Adv. 2015, 33, 13–24. [Google Scholar] [CrossRef]
  18. Ruiz-Dueñas, F.J.; Martínez, Á.T. Microbial Degradation of Lignin: How a Bulky Recalcitrant Polymer Is Efficiently Recycled in Nature and How We Can Take Advantage of This. Microb. Biotechnol. 2009, 2, 164–177. [Google Scholar] [CrossRef]
  19. Fan, Y.; Van Klemeš, J.J.; Perry, S.; Lee, C.T. Anaerobic Digestion of Lignocellulosic Waste: Environmental Impact and Economic Assessment. J. Environ. Manag. 2019, 231, 352–363. [Google Scholar] [CrossRef]
  20. Di Mario, J.; Gambelli, A.M.; Gigliotti, G. Biomethane production from untreated and treated Brewery’s Spent Grain: Feasibility of anaerobic digestion after pretreatments according to biogas yield and energy efficiency. Agronomy 2024, 14, 2980. [Google Scholar] [CrossRef]
  21. Amirante, R.; Demastro, G.; Distaso, E.; Hassaan, M.A.; Mormando, A.; Pantaleo, A.M.; Tamburrano, P.; Tedone, L.; Clodoveo, M.L. Effects of Ultrasound and Green Synthesis ZnO Nanoparticles on Biogas Production from Olive Pomace. Energy Procedia 2018, 148, 940–947. [Google Scholar] [CrossRef]
  22. Sözer, S. A research on biogas production from a mixture of olive pomace and cattle manure. Biomass Convers. Biorefin. 2024, 14, 10651–10659. [Google Scholar] [CrossRef]
  23. Turano, E.; Curcio, S.; De Paola, M.G.; Calabrò, V.; Iorio, G. An Integrated Centrifugation–Ultrafiltration System in the Treatment of Olive Mill Wastewater. J. Membr. Sci. 2002, 209, 519–531. [Google Scholar] [CrossRef]
  24. Pereira, J.A.; Pereira, A.P.G.; Ferreira, I.C.F.R.; Valentão, P.; Andrade, P.B.; Seabra, R.; Estevinho, L.; Bento, A. Table Olives from Portugal: Phenolic Compounds, Antioxidant Potential, and Antimicrobial Activity. J. Agric. Food Chem. 2006, 54, 8425–8431. [Google Scholar] [CrossRef] [PubMed]
  25. Didry, N.; Seidel, V.; Dubreuil, L.; Tillequin, F.; Bailleul, F. Isolation and Antibacterial Activity of Phenylpropanoid Derivatives from Ballota Nigra. J. Ethnopharmacol. 1999, 67, 197–202. [Google Scholar] [CrossRef]
  26. Calabrò, P.S.; Fòlino, A.; Tamburino, V.; Zappia, G.; Zema, D.A. Increasing the Tolerance to Polyphenols of the Anaerobic Digestion of Olive Wastewater through Microbial Adaptation. Biosyst. Eng. 2018, 172, 19–28. [Google Scholar] [CrossRef]
  27. Oz, N.A.; Uzun, A.C. Ultrasound pretreatment for enhanced biogas production from olive mill wastewater. Ultrason. Sonochem. 2015, 22, 565–572. [Google Scholar] [CrossRef]
  28. Llanos-Lizcano, R.; Senila, L.; Modoi, O.C. Evaluation of Biochemical Methane Potential and Kinetics of Organic Waste Streams for Enhanced Biogas Production. Agronomy 2024, 14, 2546. [Google Scholar] [CrossRef]
  29. Raposo, F.; Fernández-Cegrì, V.; De la Rubia, M.A.; Borja, R.; Béline, F.; Cavinato, C.; Demirer, G.; Fernández, B.; Fernández-Polanco, M.; Frigon, J.C.; et al. Biochemical methane potential (BMP) of solid organic substrates: Evaluation of anaerobic biodegradability using data from an international interlaboratory study. J. Chem. Technol. Biotechnol. 2011, 86, 1088–1098. [Google Scholar] [CrossRef]
  30. Porqueddu, I.; Ficara, E.; Alibardi, L.; Bona, D.; Brina, A.; Calabrò, P.S.; Casaletta, E.; Cavinato, C.; Daffonchio, D.; De Gioannis, G.; et al. Results of an Italian inter-laboratory study on biochemical methane potential. In Proceedings of the 13th World Congress on Anaerobic Digestion-Recovering (bio) Resources for the World, Santiago de Compostela, Spain, 25–28 June 2013. [Google Scholar]
  31. Hafner, S.D.; de Laclos, H.F.; Koch, K.; Hollinger, C. Improving inter-laboratory reproducibility in measurement of Biochemical Methane Potential (BMP). Water 2020, 12, 1752. [Google Scholar] [CrossRef]
  32. Montegiove, N.; Gambelli, A.M.; Calzoni, E.; Bertoldi, A.; Puglia, D.; Zadra, C.; Emiliani, C.; Gigliotti, G. Biogas production with residual deriving from olive mill wastewater and olive pomace wastes: Quantification of produced energy, spent energy, and process efficiency. Agronomy 2024, 14, 531. [Google Scholar] [CrossRef]
  33. Carter Martin, R.; Gregorich, E.G. Soil Sampling and Methods of Analysis; CRC Press: Boca Raton, FL, USA, 2007. [Google Scholar]
  34. Barili, S.; Bernetti, A.; Sannino, C.; Montegiove, N.; Calzoni, E.; Cesaretti, A.; Pinchuk, I.; Pezzolla, D.; Turchetti, B.; Buzzini, P.; et al. Impact of PVC microplastics on soil chemical and microbiological parameters. Environ. Res. 2023, 229, 115891. [Google Scholar] [CrossRef] [PubMed]
  35. Olsen, S.R. Estimation of Available Phosphorus in Soils by Extraction with Sodium Bicarbonate; No. 939; US Department of Agriculture: Washington, DC, USA, 1954. [Google Scholar]
  36. Cequier, E.; Aguilera, J.; Balcells, M.; Canela-Garayoa, R. Extraction and characterization of lignin from olive pomace: A comparison study among ionic liquid, sulfuric acid, and alkaline treatments. Biomass Convers. Biorefinery 2019, 9, 241–252. [Google Scholar] [CrossRef]
  37. Tolisano, C.; Luzi, F.; Regni, L.; Proietti, P.; Puglia, D.; Gigliotti, G.; Di Michele, A.; Priolo, D.; Del Buono, D. A way to valorize pomace from olive oil production: Lignin nanoparticles to biostimulate maize plants. Environ. Technol. Innov. 2023, 31, 103216. [Google Scholar] [CrossRef]
  38. Holder, N.; Mota-Meira, M.; Born, J.; Sutrina, S.L. New Small Scale Bioreactor System for the Determination of the Biochemical Methane Potential. Waste Biomass Valoriz. 2019, 10, 1083–1090. [Google Scholar] [CrossRef]
  39. Paz, L.; Gentil, S.; Fierro, V.; Celzard, A. Activated carbons outperform other sorbents for biogas desulfurization. Chem. Eng. J. 2025, 506, 160304. [Google Scholar] [CrossRef]
  40. Liu, C.; Yuan, X.; Zeng, G.; Li, W.; Li, J. Prediction of methane yield at optimum pH for anaerobic digestion of organic fraction of municipal solid waste. Bioresour. Technol. 2008, 99, 882–888. [Google Scholar] [CrossRef]
  41. Ge, S.; Han, J.; Sun, Q.; Zhou, Q.; Ye, Z.; Li, P.; Gu, Q. Research progress on improving the freeze-drying resistance of probiotics. Trends Food Sci. 2024, 147, 104425. [Google Scholar] [CrossRef]
  42. Azzaz, A.A.; Jeguirim, M.; Kinigopoulou, V.; Doulgeris, C.; Goddard, M.L.; Jellali, S.; Ghimbeu, C.M. Olive mill wastewater: From a pollutant to green fuels, agricultural and water source and bio-fertilizer—Hydrotermal carbonization. Sci. Total Environ. 2020, 733, 139314. [Google Scholar] [CrossRef] [PubMed]
  43. Solomakou, N.; Goula, A.M. Treatment of olive mill wastewater by adsorption of phenolic compounds. Rev. Environ. Sci. BioTechnol. 2021, 20, 839–863. [Google Scholar] [CrossRef]
  44. Dali, I.; Aydi, A.; Stamenic, M.; Kolsi, L.; Grachem, K.; Zizovic, I.; Manef, A.; Delgado, D.R. Extraction of lyophilized olive mill wastewater using supercritical CO2 processes. Alex. Eng. J. 2022, 61, 237–246. [Google Scholar] [CrossRef]
  45. Mekersi, N.; Addad, D.; Kadi, K.; Casini, S.; Hackenberger, D.K.; Boumazaa, A.; Lekmine, S. Effects of olive mill wastewater and olive mill pomace on soil physicochemical properties and soil polyphenols. J. Mater. Cycles Waste Manag. 2023, 25, 1404–1416. [Google Scholar] [CrossRef]
  46. El Hajjouji, H.; Bailly, J.R.; Winterton, P.; Merlina, G.; Revel, J.C.; Hafidi, M. Chemical and spectroscopic analysis of olive mill waste water during a biological treatment. Bioresour. Technol. 2008, 99, 4958–4965. [Google Scholar] [CrossRef]
  47. Wzorek, M.; Junga, R.; Yilmaz, E.; Bozhenko, B. Thermal decomposition of olive-mill byproducts: A TG-FTIR approach. Energies 2021, 14, 4123. [Google Scholar] [CrossRef]
  48. Dorado, F.; Sanchez, P.; Alcazar-Ruiz, A.; Sanchez-Silva, L. Fast pyrolysis as an alternative to the valorization of olive mill wastes. J. Sci. Food Agric. 2021, 101, 2650–2658. [Google Scholar] [CrossRef] [PubMed]
  49. Khan, A.S.; Man, Z.; Bustam, M.A.; Kait, C.F.; Nasrullah, A.; Ullah, Z.; Muhammad, N. Dicationic ionic liquids as sustainable approach for direct conversion of cellulose to levulinic acid. J. Clean. Prod. 2018, 170, 591–600. [Google Scholar] [CrossRef]
  50. Ward, K.R.; Matejtschuk, P. The principles of freeze-drying and application of analytical technologies. In Cryopreservation and Freeze-Drying Protocols; Wolkers, W.F., Oldenhof, H., Eds.; Springer: New York, NY, USA, 2015; pp. 99–127. [Google Scholar]
  51. Liu, Y.W.; Pu, H.B.; Sun, D.W. Hyperspectral imaging technique for evaluating food quality and safety during various processes: A review of recent applications. Trends Food Sci. 2017, 69, 25–35. [Google Scholar] [CrossRef]
  52. Buahom, J.; Siripornadulsil, S.; Sukon, P.; Sooksawat, T.; Siripornadulsil, W. Survivability of freeze- and spray-dried probiotics and their effect on the growth and health performance of broilers. Vet. World 2023, 16, 1849–1865. [Google Scholar] [CrossRef]
  53. Tian, Y.; He, Z.; He, L.; Li, C.; Qiao, S.; Tao, H.; Wang, X.; Zeng, X.; Tian, Y. Effect of freeze-dried protectants on the survival rate and fermentation performance of fermented milk’s directed vat set starters. Cryobiology 2024, 114, 104811. [Google Scholar] [CrossRef]
  54. Khanal, S.K.; Nindhia, T.G.T.; Nitayavardhana, S. Chapter 11—Biogas from Wastes: Processes and Applications. In Sustainable Resource Recovery and Zero Waste Approaches; Elsevier: Amsterdam, The Netherlands, 2016; pp. 165–174. [Google Scholar]
  55. Siciliano, A.; Stillitano, M.A.; De Rosa, S. Biogas production from wet olive mill wastes pretreated with hydrogen peroxide in alkaline conditions. Renew. Energy 2016, 85, 903–916. [Google Scholar] [CrossRef]
  56. Orive, M.; Cebrian, M.; Zufia, J. Techno-economic anaerobic co-digestion feasibility study for two-phase olive oil mill pomace and pig slurry. Renew. Energy 2020, 97, 532–540. [Google Scholar] [CrossRef]
  57. Chapleur, O.; Madigou, C.; Civade, R.; Rodolphe, Y.; Mazeas, L.; Bouchez, T. Increasing concentrations of phenol progressively affect anaerobic digestion of cellulose microbial communities. Biodegradation 2016, 27, 15–27. [Google Scholar] [CrossRef]
  58. Wang, Y.T.; Gabbard, H.D.; Pai, P.G. Inhibition of acetate methanogenesis by phenols. J. Environ. Eng. 1991, 117, 487–500. [Google Scholar] [CrossRef]
  59. Field, J.A.; Lettinga, G. The methanogenic toxicity and anaerobic degradability of a hydrolysable tannin. Water Res. 1987, 20, 367–374. [Google Scholar] [CrossRef]
  60. Sang, Y.; Wang, J.; Zhang, Y.X.; Gao, H.N.; Ge, S.Y.; Feng, H.; Zhang, Y.; Ren, F.; Wen, P.; Wang, R. Influence of temperature during freeze-drying process on the viability of Bifidobacterium Longum BB68S. Microorganisms 2023, 11, 181. [Google Scholar] [CrossRef]
  61. Borja, R.; Pelillo, M.; Rincon, B.; Raposo, F.; Martin, A. Mathematical modelling of the aerobic degradation of two-phase olive mill effluents in a batch reactor. Biochem. Eng. J. 2006, 30, 308–315. [Google Scholar] [CrossRef]
  62. Gonzalez-Gonzalez, A.; Cuadros, F. Effect of aerobic pretreatment on anaerobic digestion of olive mill wastewater (OMWW): An ecoefficient treatment. J. Environ. Sci. Health 1994, 29, 851–865. [Google Scholar] [CrossRef]
  63. Borja, R.; Banks, J.C.; Albe, J.; Maestro, R. The effect of the most important phenolic constituents of OMW on batch anaerobic methanogenis. Environ. Technol. 1996, 17, 167–174. [Google Scholar] [CrossRef]
  64. Rasi, S. Biogas Composition and Upgrading to Biomethane. Ph.D. Thesis, University of Jyväskylä, Jyväskylä, Finland, 2009. No. 202. [Google Scholar]
  65. Tarannum, A.; Rao, J.R.; Fathima, N.N. Insights into protein-ionic liquid interaction: A comprehensive overview on theoretical and experimental approaches. Int. J. Biol. Macromol. 2022, 209, 498–505. [Google Scholar] [CrossRef] [PubMed]
  66. Di Mario, J.; Montegiove, N.; Gambelli, A.M.; Brienza, M.; Zadra, C.; Gigliotti, G. Waste biomass pretreatments for biogas yield optimization and for the extraction of valuable high-added-value products: Possible combinations of the two processes toward a biorefinery purpose. Biomass 2024, 4, 865–885. [Google Scholar] [CrossRef]
Figure 1. A batch bioreactor used in the experiment. (A) A bioreactor used in this study for biogas production. (B) A bioreactor used for the bio-methane determination. The reaction that allows the separation of CO2 from the biogas is shown.
Agriculture 15 02204 g001
Figure 2. FESEM images at different magnifications (a,b), FT-IR spectrum (c), and DTG curve (d) for the FDOW sample.
Agriculture 15 02204 g002
Figure 3. FESEM images of untreated olive pomace (OP) (a), treated olive pomace (POP) (b), FTIR spectrum (c), and DTG curve (d) for the POP sample.
Agriculture 15 02204 g003
Figure 4. Daily biogas production (expressed in mL/day/gVS) measured for OW and FDOW.
Agriculture 15 02204 g004
Figure 5. Daily biogas production (expressed in mL/day/gVS) measured for OP and POP.
Agriculture 15 02204 g005
Figure 6. FESEM images of the brewery’s spent grain (BSG) [13].
Agriculture 15 02204 g006
Figure 7. Daily biogas production (expressed in mL/day/gVS) was measured for BSG.
Agriculture 15 02204 g007
Figure 8. Cumulative biogas production (expressed in mL/gVS) for the following samples: untreated olive pomace (OP), untreated olive mill wastewater (OW), untreated brewery’s spent grain (BSG), pulp from olive pomace (POP), freeze-dried olive mill wastewater (FDOW), POP+BSG, FDOW+BSG.
Agriculture 15 02204 g008
Figure 9. Cumulative biogas production (expressed in mL/day) for FDOW after the extraction of polyphenols and flavonoids (FDOW-PF).
Agriculture 15 02204 g009
Table 1. Main characteristics of the inoculum used to prepare the various samples.
ParameterDigestate
Moisture [%]88.08 ± 0.05
VS [%]72.34 ± 0.05
pH8.08 ± 0.05
TOC [% of DM]53.05 ± 0.01
TKN [% of DM]5.47 ± 0.01
Total P [g kg−1 DM]3.11 ± 0.01
Total K [g kg−1 DM]75.62 ± 0.01
WEOC [g kg−1 DM]110.51 ± 0.01
WEN [g kg−1 DM]67.86 ± 0.01
DM = dry matter; TOC = Total Organic Carbon; TKN = Total Kjeldahl Nitrogen; WEOC = Water-Extractable Organic Carbon; WEN = Water-Extractable Nitrogen.
Table 2. Main characteristics of the biomasses considered in the present study (TS = Total Solids; VS = Volatile Solids).
BiomassMoisture (%)TS (%)VS (%)pHTKN (% on DM)TOC (% on DM)
OW88.08 ± 0.0511.92 ± 0.0590.80 ± 0.055.10 ± 0.050.53 ± 0.0161.20 ± 0.01
FDOW8.08 ± 0.0591.92 ± 0.0592.60 ± 0.055.40 ± 0.051.22 ± 0.0130.86 ± 0.01
OP53.05 ± 0.0546.95 ± 0.0597.00 ± 0.055.50 ± 0.050.70 ± 0.0147.70 ± 0.01
POP5.47 ± 0.0594.53 ± 0.0595.39 ± 0.053.01 ± 0.050.31 ± 0.0131.28 ± 0.01
Table 3. Total production of biogas, corresponding methane content, and days of production for untreated and treated OP and OW.
Biomass TestedTotal Biogas [mL]Total CH4 [mL]Production Time [Days]
OP451 ± 18299 ± 1243
POP79 ± 539 ± 22
OW79 ± 645 ± 432
FDOW658 ± 33458 ± 2330
Table 4. Main characteristics measured for BGS, together with the corresponding total production of biogas, the corresponding methane content, and the days of production.
Brewery’s Spent Grain
Moisture [%]78.25 ± 0.05
pH5.06 ± 0.05
TOC [% on dry matter]26.66 ± 0.01
TKN [% on dry matter]3.89 ± 0.01
Total biogas [mL/gVS]944 ± 156.4
Total CH4 [mL/gVS]519 ± 57
Production time [days]61
TOC = Total Organic Carbon; TKN = Total Kjeldahl Nitrogen.
Table 5. For each substrate tested in this work, the table shows (from left to right) the total dry matter inserted in the bioreactor, the volatile solids, both as a percentage and in grams, and the quantity of biogas produced per unit of mass of VS.
SubstrateDry Matter [g]VS [%]VS [g]Biogas/VS [mL/g]
FDOW+BSG1.000 ± 0.0050.950 ± 0.0050.950 ± 0.0051131 ± 14.1
BSG1.005 ± 0.0050.975 ± 0.0050.980 ± 0.005944 ± 156.4
FDOW2.860 ± 0.0050.926 ± 0.0052.648 ± 0.005658 ± 15.8
POP+BSG1.000 ± 0.0050.948 ± 0.0050.948 ± 0.005466 ± 23.9
OP1.000 ± 0.0050.970 ± 0.0050.970 ± 0.005451 ± 8.3
OW5.720 ± 0.0050.908 ± 0.0055.194 ± 0.00579 ± 2.1
POP1.000 ± 0.0050.954 ± 0.0050.954 ± 0.00579 ± 1.5
FDOW-PF5.720 ± 0.0050.920 ± 0.0055.262 ± 0.00532 ± 8.8
Disclaimer/Publisher’s Note: The statements, opinions and data contained in all publications are solely those of the individual author(s) and contributor(s) and not of MDPI and/or the editor(s). MDPI and/or the editor(s) disclaim responsibility for any injury to people or property resulting from any ideas, methods, instructions or products referred to in the content.