Article

Synergistic Evolution of Soil and Vegetation in Reclamation Areas with Different Developmental Years on Hengsha Island

1
Eco-Environment Protection Research Institute, Shanghai Academy of Agricultural Sciences, Shanghai 201403, China
2
School of Ecological Technology and Engineering, Shanghai Institute of Technology, Shanghai 201418, China
3
National Agricultural Experimental Station for Agricultural Environment, Shanghai 201403, China
4
College of Science and Technology, Wenzhou-Kean University, Wenzhou 325060, China
5
Key Laboratory of Low-Carbon Green Agriculture in Southeastern China, Ministry of Agriculture and Rural Affairs, Shanghai 201403, China
*
Authors to whom correspondence should be addressed.
These authors contributed equally to this work.
Agriculture 2025, 15(21), 2196; https://doi.org/10.3390/agriculture15212196
Submission received: 12 September 2025 / Revised: 18 October 2025 / Accepted: 20 October 2025 / Published: 23 October 2025
(This article belongs to the Section Agricultural Soils)

Abstract

Coastal reclamation reshapes both soils and vegetation, yet their coupled trajectories remain poorly understood. Here we investigated soil–vegetation co-evolution across a 15-year chronosequence on Hengsha Island in the Yangtze River estuary. The reclaimed soils were formed primarily from dredged estuarine silt and clay slurry deposited during hydraulic filling. Four representative sites were studied, spanning 3 (Y3), 7 (Y7), 10 (Y10), and 15 (Y15) years since reclamation. Soil physicochemical properties (pH, electrical conductivity, salinity, nitrogen, phosphorus, potassium) were measured, while vegetation cover was quantified using NDVI and fractional vegetation cover (FVC) derived from satellite data. Soil conditions improved markedly with reclamation age: pH, conductivity, and salinity declined, whereas nitrogen, phosphorus, and potassium accumulated significantly (p < 0.001). Vegetation shifted from salt-tolerant pioneers (e.g., Suaeda salsa, Phragmites australis) to mixed communities and cultivated rice fields (Oryza sativa), reflecting progressive improvements in soil quality. Vegetation cover increased in parallel, with NDVI rising from 0.12 ± 0.05 (Y3) to 0.35 ± 0.09 (Y15), reflecting a shift from salt-tolerant pioneers to structurally complex communities. Mantel tests revealed strong positive associations of NDVI with organic matter, nitrogen, and phosphorus, and negative associations with pH, conductivity, and salinity. Structural equation modeling identified organic matter and nitrogen enrichment, along with declining pH and dissolved salts, as dominant drivers of vegetation recovery. These results highlight a co-evolutionary process in which soil improvement and vegetation succession reinforce one another, offering insights for ecological restoration and sustainable management in coastal reclamation landscapes.

1. Introduction

Rapid urbanization and population growth have intensified the tension between land supply and demand [1,2]. Since the reform and opening up, China’s urban population has increased sharply, with the national urbanization rate rising from less than 20% in 1980 to 57.35% in 2016, and the average urban population density in major coastal regions such as the Yangtze River Delta exceeding 1000 people per km2 [3,4]. This rapid demographic concentration and spatial expansion have significantly reduced available arable land, leading to pronounced land–population conflicts and ecological stress in densely developed estuarine zones. Coastal land reclamation has therefore become a widely adopted strategy to alleviate land shortages in China [5,6,7]. Over the past two decades, more than 7546.97 km2 of land has been reclaimed along China’s coast. In Shanghai alone, large-scale reclamation projects have added about 677.2 km2 of new land over the past 50 years, expanding the municipal territory by nearly 10% [8]. Hengsha Island, located in the Yangtze River estuary, exemplifies this trajectory: sequential diking, sediment infill, and ecological succession have created a dynamic interface where coastal wetlands transition to terrestrial ecosystems [9,10]. Yet newly reclaimed zones are often constrained by soil salinization and low fertility, which severely limit vegetation recovery and ecosystem functioning, underscoring the need to better understand the trajectories of soil and vegetation co-development in these systems [11,12,13].
Soils, as the foundation for material cycling and energy flow in terrestrial ecosystems, develop in close concert with vegetation communities [14,15]. In estuarine island environments, vegetation establishment improves soil structure, organic matter inputs, and nutrient cycling, while soil development in turn shapes species composition and successional trajectories [16,17]. For example, Zheng et al. reported that vegetation cover in coastal wetlands not only reduced soil salinity and bulk density but also enriched soil organic matter, total nitrogen, and microbial diversity, thereby creating more favorable conditions for subsequent plant establishment [18]. In Korea’s Saemangeum system, soil electrical conductivity (a proxy for salinity) declines progressively with time since enclosure, accompanied by marked shifts in vegetation cover and composition, underscoring the tight coupling between soil desalination and vegetation recovery trajectories [19,20]. In Singapore, newly reclaimed shores initially support sparse pioneer communities; over time, spontaneous vegetation establishes as soils ameliorate, although early development can be limited by propagule availability and substrate constraints [21,22]. In the Yellow River Delta of China, satellite observations reveal rapid expansion of vegetation greenness in recent years, driven by both species turnover and changing hydrosedimentary regimes, underscoring the sensitivity of cover metrics to abiotic controls in young deltaic plains [23]. In North America’s Lower Mississippi River Delta, vegetation structure (notably Phragmites australis) modulates marsh stability and greenness patterns, linking canopy traits to geomorphic resilience [24]. Beyond coastal systems, studies in karst landscapes have highlighted that natural vegetation recovery reduces soil bulk density and regulates pH, underscoring the universal role of vegetation in driving soil development [25]. At broader scales, Biederman et al. found that vegetation cover feeds back on soil hydrology and nutrient retention, with clear differences in water-holding capacity, nutrient availability, and aeration across plant communities [26].
However, most existing studies have been constrained by narrow temporal or ecological scopes—often restricted to single sampling years or to specific vegetation types such as halophytes or pioneer grasses [27,28,29]. As a result, the long-term trajectories of soil–vegetation coevolution across successional gradients remain poorly characterized. This gap is particularly evident in highly disturbed estuarine systems such as the Yangtze River delta. Critical questions remain unresolved: (i) how soil physicochemical properties evolve with reclamation age; (ii) how vegetation cover responds across successional stages; and (iii) how reciprocal soil–vegetation feedbacks regulate these dynamics through time. Addressing these questions is fundamental to predicting the resilience and ecological potential of newly formed coastal land.
Here, we investigated a chronosequence of reclamation zones (1–15 years) on Hengsha Island, Yangtze Estuary, to disentangle the co-evolution of soils and vegetation. Using reclamation age as a proxy for soil development, we quantified key soil properties (pH, salinity, and nutrient contents) and vegetation indices (NDVI, FVC) to capture their spatial–temporal trajectories. We further applied network and structural equation modeling to identify dominant pathways linking soil and vegetation processes. We hypothesize that soil and vegetation coevolve through reciprocal feedback during the reclamation process—that is, improvements in soil physicochemical properties (e.g., desalination and nutrient enrichment) facilitate vegetation establishment. Among these properties, pH, salinity, and nutrient contents (OM, TN, TP) were prioritized because they are fundamental indicators of soil formation and fertility evolution in coastal reclaimed ecosystems. Soil pH and salinity directly regulate plant colonization and microbial activity, while organic matter and nutrient accumulation reflect biogeochemical development and are key drivers of vegetation succession. Our specific objectives are to
(1)
Characterize soil physicochemical and vegetation patterns across reclamation ages;
(2)
Quantify soil–vegetation correlations and their directional interactions;
(3)
Provide mechanistic insights to inform nature-based restoration and sustainable management of coastal reclamation ecosystems.

2. Materials and Methods

2.1. Study Area

Hengsha Island originated as a sandbar formed by sediment deposition from the Yangtze River near its mouth. Continuous accretion eventually brought it above sea level, creating one of the youngest alluvial islands in the estuary. The island lies at the easternmost tip of Chongming District, Shanghai, south of Chongming Island (121°02′ E, 31°35′ N), bounded on three sides by the Yangtze River and on the east by the East China Sea [30]. Shaped like a spiral shell, it extends roughly 12 km from north to south and 8 km from east to west, covering an area of about 106 km2. The island has an average elevation of 2.8 m, a shoreline exceeding 30 km, and a mean annual temperature of 15.2 °C. The climate of Hengsha Island is characterized by a typical subtropical monsoon regime, with abundant rainfall averaging around 1100 mm annually. Precipitation varies considerably from year to year but is predominantly concentrated between June and October. The tidal range is pronounced, with the highest tide reaching approximately 5.9 m and the lowest dropping to −0.27 m. Owing to the relatively short history of wetland formation, the soils remain young and weakly developed, consisting mainly of saline–alkaline clay and sandy loam.
To make effective use of dredged sediments from the Yangtze River Estuary’s deep-water navigation channel and to reserve land for Shanghai’s long-term development, an extensive reclamation project was undertaken along the eastern coast of Hengsha Island between 2003 and 2020. This large-scale coastal engineering effort expanded the island’s area by approximately 146 km2. The reclamation process involved first constructing embankments to enclose the planned sites, followed by hydraulic filling—pumping dredged silt and sand from the estuarine channel into the enclosed zones to accelerate land formation. The main reclamation works were completed in four major phases, known as the third, sixth, seventh, and eighth enclosures, finalized in 2008, 2015, 2017, and 2020, respectively. Other intermediate phases mainly focused on embankment construction and sediment accretion enhancement. From 2003 to 2020, the reclaimed areas were managed by the Shanghai Agricultural Investment Corporation (Shanghai Agricultural Investment Co., Ltd., Shanghai, China), remaining closed to the public and minimally affected by human activities. These newly reclaimed coastal zones were initially barren and highly saline, making them unsuitable for immediate use. Zones 8 (1–5 years), 7 (6–8 years), and 6 (approximately 10 years) represent areas undergoing natural recovery. Over time, as soil salinity decreased and fertility improved, these zones gradually transitioned to afforestation and agricultural use through natural succession and soil amelioration. Zone 3 (approximately 15 years) is a managed rice cultivation area, where Medicago sativa (alfalfa) is planted as green manure to improve soil structure and enhance nutrient utilization. To capture the successional trajectory of soil and vegetation development, we selected four representative reclamation zones on Hengsha Island, corresponding to 3, 7, 10, and 15 years of development (Zones 8, 7, 6, and 3, respectively, Table 1). These zones collectively represent a 1–15-year reclamation chronosequence, encompassing a gradient from newly formed saline soils to mature paddy soils. All four sites share similar geomorphological and hydrological settings, providing a coherent natural experiment to trace the co-evolution of soil properties and vegetation cover during coastal reclamation.
This study focused on four representative zones on Hengsha Island that differ in the number of years since vegetation establishment. Zone 8 (1–5 years) represents the early stage of post-reclamation ecological recovery. The soil in this area is still influenced by seawater, and vegetation is dominated by salt-tolerant pioneer species such as Phragmites communis, Suaeda glauca, and Tamarix chinensis, with a total plant cover of less than 10%. Zone 7 (6–8 years) reflects the short- to mid-term recovery phase, characterized by well-developed Tamarix chinensis shrubs reaching about 1.5 m in height and covering 60–75% of the area. The herbaceous layer is relatively sparse, mainly composed of Phragmites australis, Polypogon fugax, Tripolium vulgare, and Suaeda glauca, with a cover of 10–15% and height ranging from 0.3 to 0.5 m. Zone 6 (approximately 10 years) represents a more advanced stage of recovery, where herbaceous plant diversity has markedly increased. This zone supports a dense assemblage of adaptable species, including Phragmites australis, Solidago canadensis, Equisetum ramosissimum, Erigeron annuus, and Plantago depressa, forming nearly continuous vegetation cover (95–100%) with plant heights between 0.4 and 0.9 m. Zone 3 (~15 years since reclamation) represents the stage of long-term recovery, where soil properties have approached those of mature wetlands. The area is primarily used for agricultural cultivation, with paddy fields dominated by rice (Oryza sativa).

2.2. Soil Sampling and Analysis

Fieldwork was carried out between 24 and 26 August 2022. To account for ecological heterogeneity across reclamation zones of different ages, we adopted a stratified grid sampling design based on vegetation structure, landform position, and reclamation age. Specifically, each zone was divided into subareas representing distinct vegetation types (e.g., grassland, shrub, or paddy field) and microtopographic features (elevated, intermediate, and low-lying positions), ensuring representative coverage of soil and vegetation variability. In the Mid-term reclamation areas, Zone 6 (10 years)—where vegetation communities are structurally complex and soil properties are highly variable, grids of 120 × 120 m and 90 × 90 m were established, yielding 21 and 20 sampling points, respectively. By contrast, in the younger reclamation areas—Zone 7 (6–8 years) and Zone 8 (3 years)—where early succession creates greater homogeneity, smaller grids of 60 × 60 m and 35 × 35 m were used, with 8 and 20 sampling points, respectively (Figure 1). All points were georeferenced using a Trimble Geo7X GPS (Trimble Inc., Version Geo 7X, Sunnyvale, CA, USA) with a horizontal accuracy of 0.3 m. At each site, surface soils (0–20 cm) were collected using a five-point composite method, homogenized, and a 2 kg sub-sample was retained. Samples were air-dried indoors, sieved through a 2 mm mesh to remove gravel and plant residues, and stored for analysis.
Soil physicochemical properties were determined using standard protocols. Soil pH was measured with the potentiometric method, and electrical conductivity (EC) with the glass electrode method [31]. Soil total salinity was quantified gravimetrically. Organic matter was measured using the dichromate oxidation–ferrous sulfate titration method. Total nitrogen was analyzed with the semi-micro Kjeldahl method (soil: H2SO4 = 1:10), while nitrate nitrogen was determined by Kjeldahl digestion (soil: H2SO4 = 1:8). Available phosphorus was extracted with sodium bicarbonate and measured by molybdenum–antimony colorimetry, and available potassium was determined by ammonium acetate extraction followed by flame photometry [32]. All measurements were conducted in triplicate, and mean values were used for subsequent analyses.

2.3. Remote Sensing Data Acquisition and Processing

The remote sensing data used in this study were obtained from the Copernicus Data Hub of the European Space Agency (ESA). This study utilized Sentinel-2 imagery acquired in August 2022 for analysis, with a spatial resolution of 10 m. Geometric correction was applied using the Sentinel-2 ground control points and rational polynomial coefficients (RPCs) provided in the metadata to ensure accurate image registration to the WGS-84/UTM Zone 51N coordinate system. Atmospheric correction was conducted using the Sen2Cor processor (version 2.9, European Space Agency, ESA, Paris, France) to convert top-of-atmosphere (TOA) reflectance to bottom-of-atmosphere (BOA) reflectance. Sen2Cor performs radiometric calibration, terrain correction, and cirrus removal based on a look-up-table approach derived from MODTRAN radiative transfer modeling. Resampling of spectral bands to 10 m resolution was carried out using bilinear interpolation to preserve spatial continuity [33]. The corrected images were then cropped to the study area, and subsequent image processing and NDVI derivation were performed in ENVI software (version 5.0, Harris Geospatial Solutions, Boulder, CO, USA) [34].
NDVI = (NIR-R)/(NIR + R)
where NIR denotes reflectance in the near-infrared band, and R denotes reflectance in the red band [35].
Fractional vegetation cover (FVC) was estimated using the pixel dichotomy model [36], which assumes that each pixel is composed of vegetated and non-vegetated components, with the proportion of vegetation cover within a pixel defined as its FVC.
F V C = R v e g R m i n R m a x R m i n
where Rveg is the vegetation reflectance of the pixel (NDVI in this study), Rmax is the maximum reflectance of pure vegetation pixels, and Rmin is the minimum reflectance of water pixels.

2.4. Statistical Analysis

All statistical analyses were conducted in R software (version 4.2.2, R Core Team, Vienna, Austria)and SPSS Statistics (version 26.0, IBM Corp., Armonk, NY, USA).. Differences in soil physicochemical properties and vegetation indices (NDVI, FVC) among reclamation stages were tested using one-way analysis of variance (ANOVA), followed by Tukey’s (Honestly Significant Difference) HSD for post hoc comparisons. Spatial distribution maps of soil physicochemical properties, NDVI, and FVC were produced in ArcGIS (version 10.8, Esri, Redlands, CA, USA), with interpolation methods applied to capture and illustrate the spatial heterogeneity of soil attributes. Co-occurrence networks were constructed using the MENA platform (http://ieg4.rccc.ou.edu/mena, accessed on 12 July 2025) based on Pearson correlations among standardized soil and vegetation variables, with similarity thresholds determined by random matrix theory (RMT). Network topology was visualized in Cytoscape (version 3.9.1, Cytoscape Consortium, San Diego, CA, USA), and changes in connectivity and modularity across reclamation stages were used to infer shifts in ecosystem complexity and stability. Correlation analysis and Mantel tests were applied to quantify associations between soil attributes and vegetation metrics. To disentangle direct and indirect pathways linking reclamation age, soil properties, and vegetation cover, we constructed a structural equation model (SEM) using AMOS 7.0 software (version 7.0, IBM Corp., Armonk, NY, USA). Model fit was evaluated with χ2/df, root mean square error of approximation (RMSEA), comparative fit index (CFI), and goodness-of-fit index (GFI). All statistical tests were two-tailed, and significance thresholds were set at p < 0.05, p < 0.01, and p < 0.001.

3. Results

3.1. Soil Physicochemical Differences Across Reclamation Stages

The soil physicochemical properties of the reclamation areas on Hengsha Island in the Yangtze River estuary exhibited a clear temporal evolutionary pattern. Substantial differences were observed among soils with different developmental years, and their properties followed a consistent trajectory with reclamation time. During reclamation, hydraulic filling using dredged silt and sand from the Yangtze River Estuary’s deep-water navigation channel was carried out to raise the surface elevation and accelerate land formation. The Y3, Y7, and Y10 zones represent naturally recovering areas with minimal human disturbance, where soil development primarily depended on desalination and vegetation succession. In contrast, the 15-year reclamation zone (Y15) underwent intensive management, including freshwater irrigation, mechanical tillage, and the cultivation of Medicago sativa as a green manure to enhance aeration, promote desalination, and improve soil fertility.
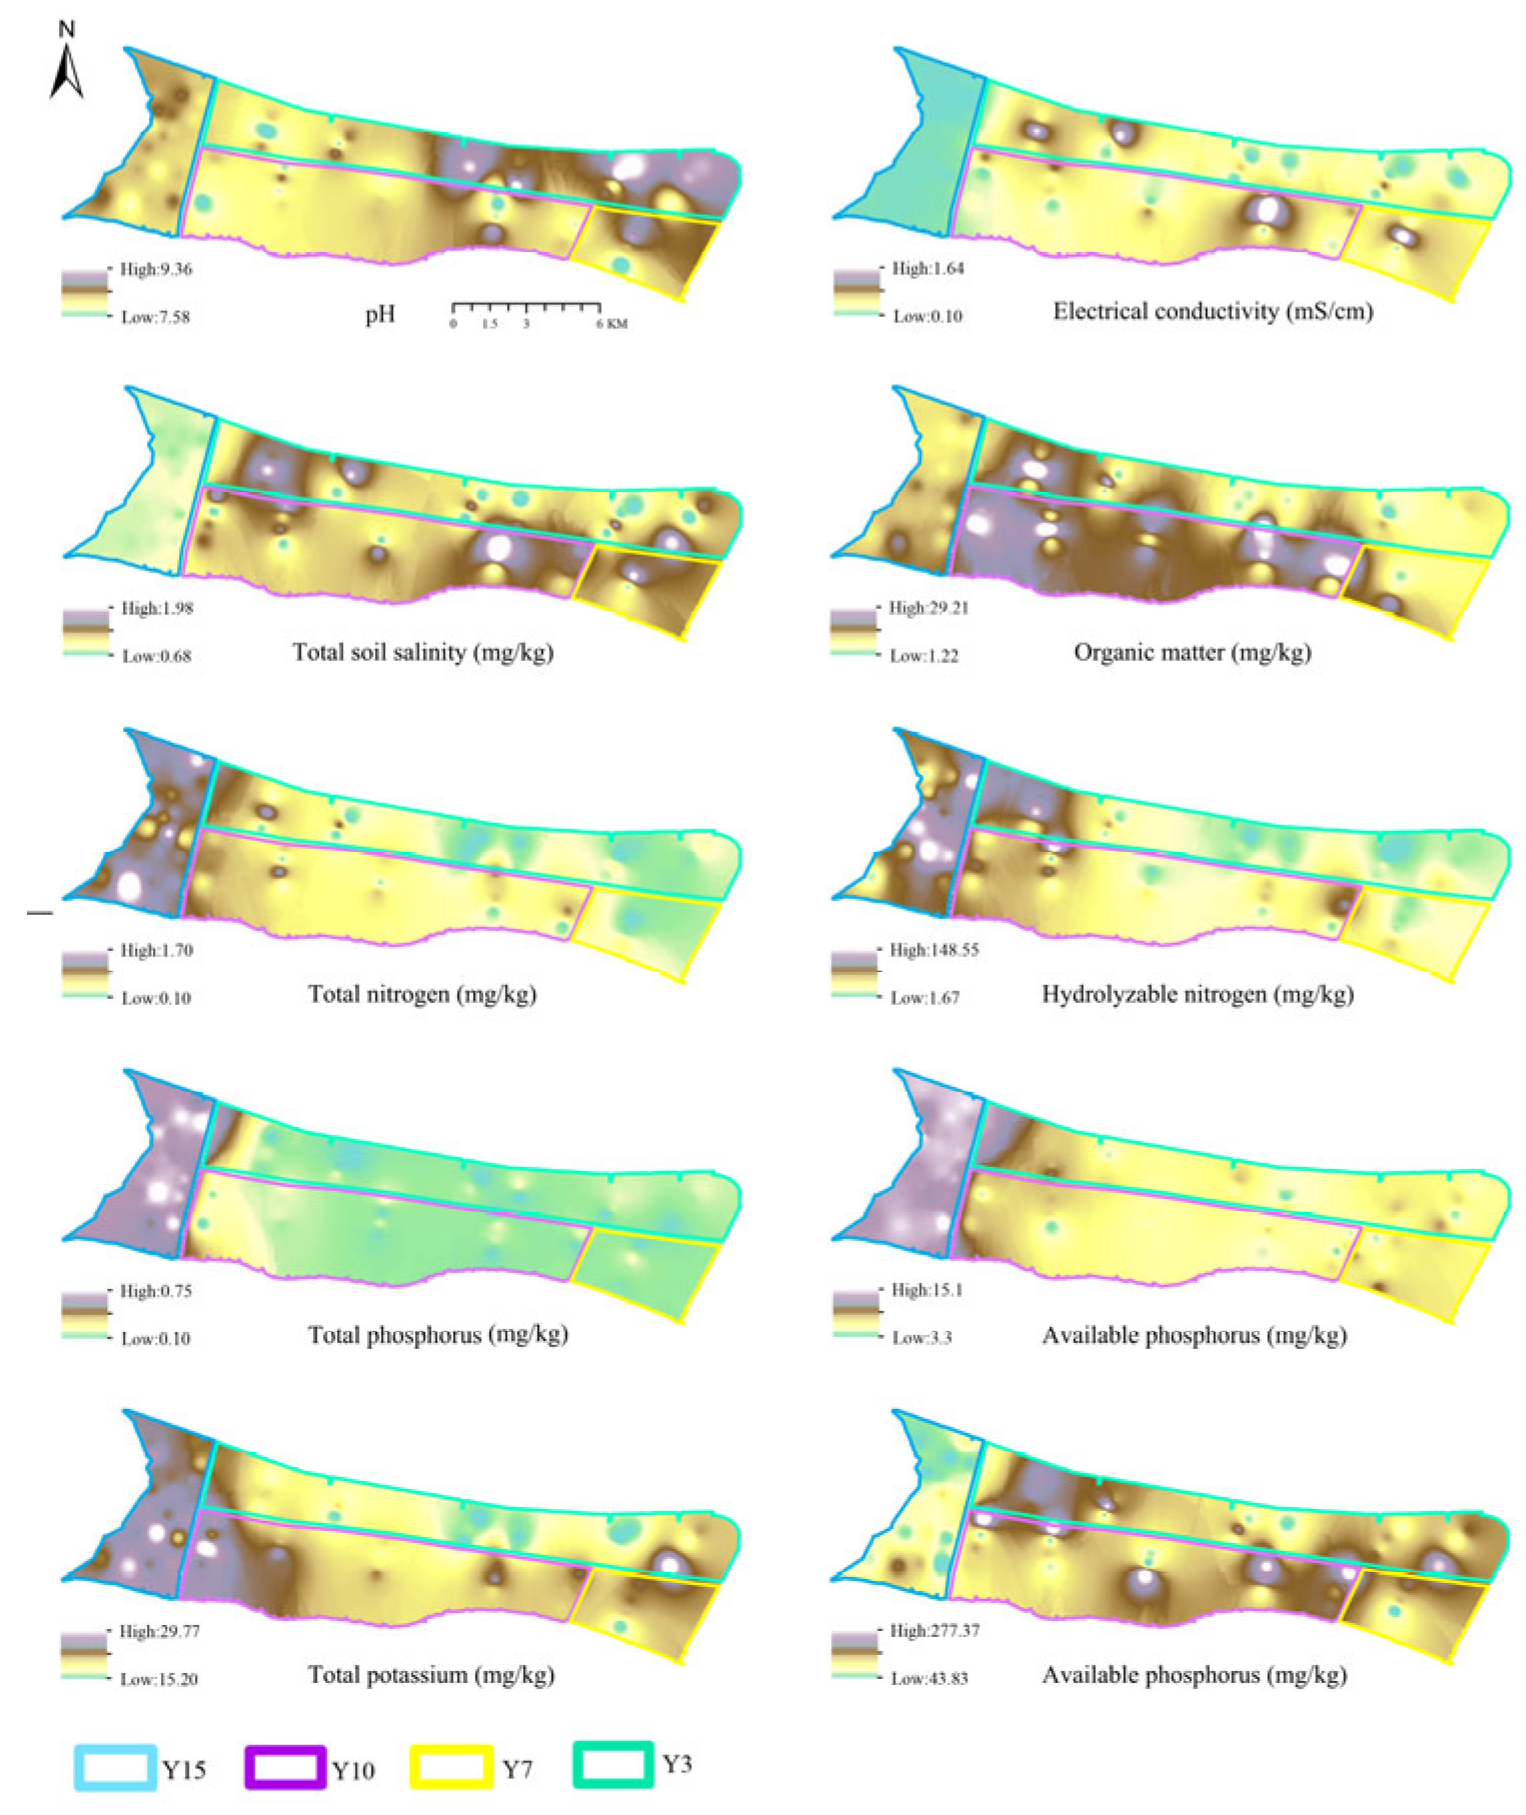
Overall, the soils were alkaline, with relatively high pH values, but pH gradually declined with increasing reclamation years (Y3 > Y7 > Y10 > Y15), consistent with the amelioration characteristics of alkaline soils (Figure 2, Table A1). As shown in Figure 3, Soil fertility indicators significantly improved (p < 0.001). For example, organic matter content increased from 6.44 ± 2.15 g·kg−1 in the 3-year zone to 16.90 ± 6.73 g·kg−1 in the 10-year zone. Total nitrogen, total phosphorus, and total potassium contents also differed significantly across reclamation stages (p < 0.001, Figure 3). Total nitrogen rose steadily from 0.25 ± 0.19 g·kg−1 at Y3 to 0.99 ± 0.23 g·kg−1 at Y15. Total phosphorus reached its maximum at Y15 (0.61 ± 0.07 g·kg−1), while variation at other stages was relatively minor (Figure 3). Total potassium was lowest at Y3 (18.47 ± 2.85 g·kg−1), but increased annually to 23.87 ± 1.92 g·kg−1 at Y15. Available phosphorus exhibited a nonlinear increase, rising slowly at early stages and more rapidly later, from 6.59 ± 1.72 mg·kg−1 at Y3 to 13.28 ± 0.83 mg·kg−1 at Y15 (p < 0.001, Figure 3). In contrast, electrical conductivity and total soil salinity significantly decreased with reclamation time (p < 0.001), dropping from 0.67 ± 0.48 mS·cm−1 and 1.44 ± 0.14 g·kg−1 at Y3 to 0.14 ± 0.02 mS·cm−1 and 0.91 ± 0.02 g·kg−1 at Y15, respectively (Figure 3).

3.2. Differences in Vegetation Cover Across Reclamation Stages

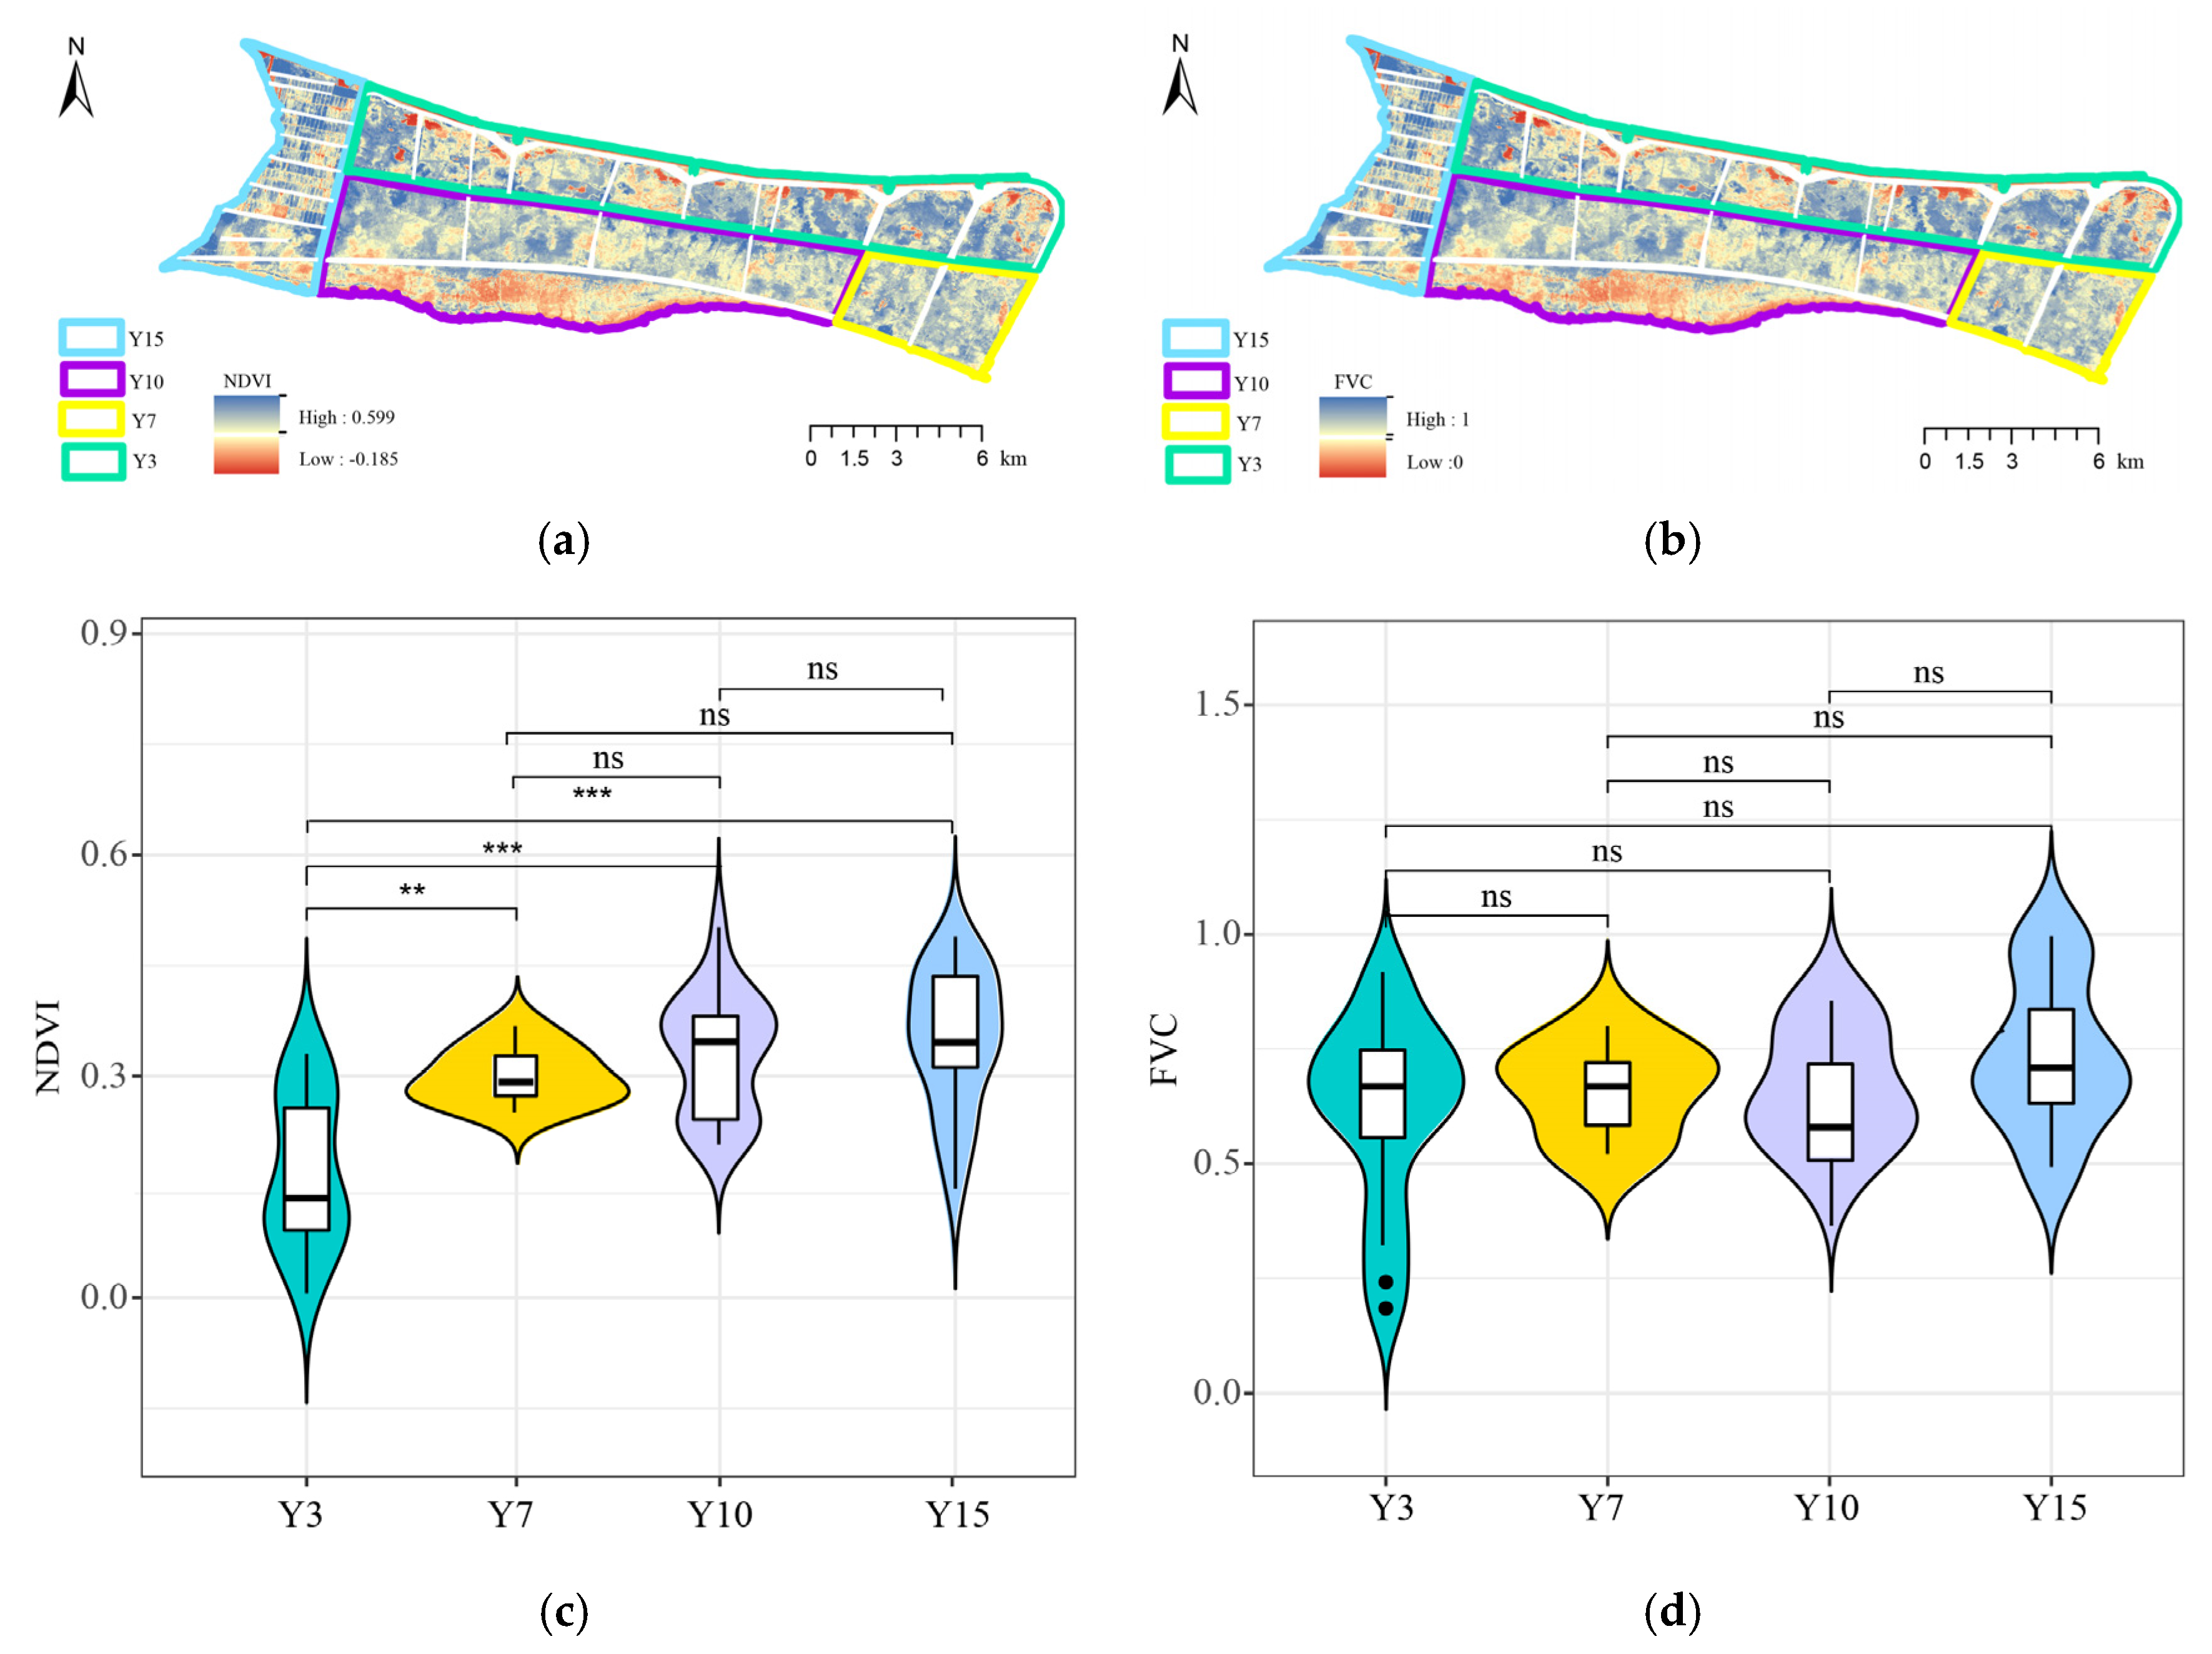
Figure 4a,b illustrate the spatial distribution of NDVI and FVC, with higher vegetation cover observed in the Y10 and Y15 regions. As shown in Figure 4c, by comparing NDVI across reclamation areas with different developmental years on Hengsha Island, significant differences were observed among regions (p < 0.001). The 15-year reclamation zone exhibited the highest NDVI value (0.35 ± 0.09), followed by the 10-year (0.33 ± 0.08), 7-year (0.30 ± 0.04), and 3-year (0.17 ± 0.10) zones. The FVC values also showed no significant differences among the different reclamation stages (Figure 4d). With the extension of soil development time, both vegetation coverage and NDVI increased, reflecting the gradual improvement of soil quality and the ecological environment.

3.3. Relationships Between Soil Physicochemical Properties and Vegetation Cover

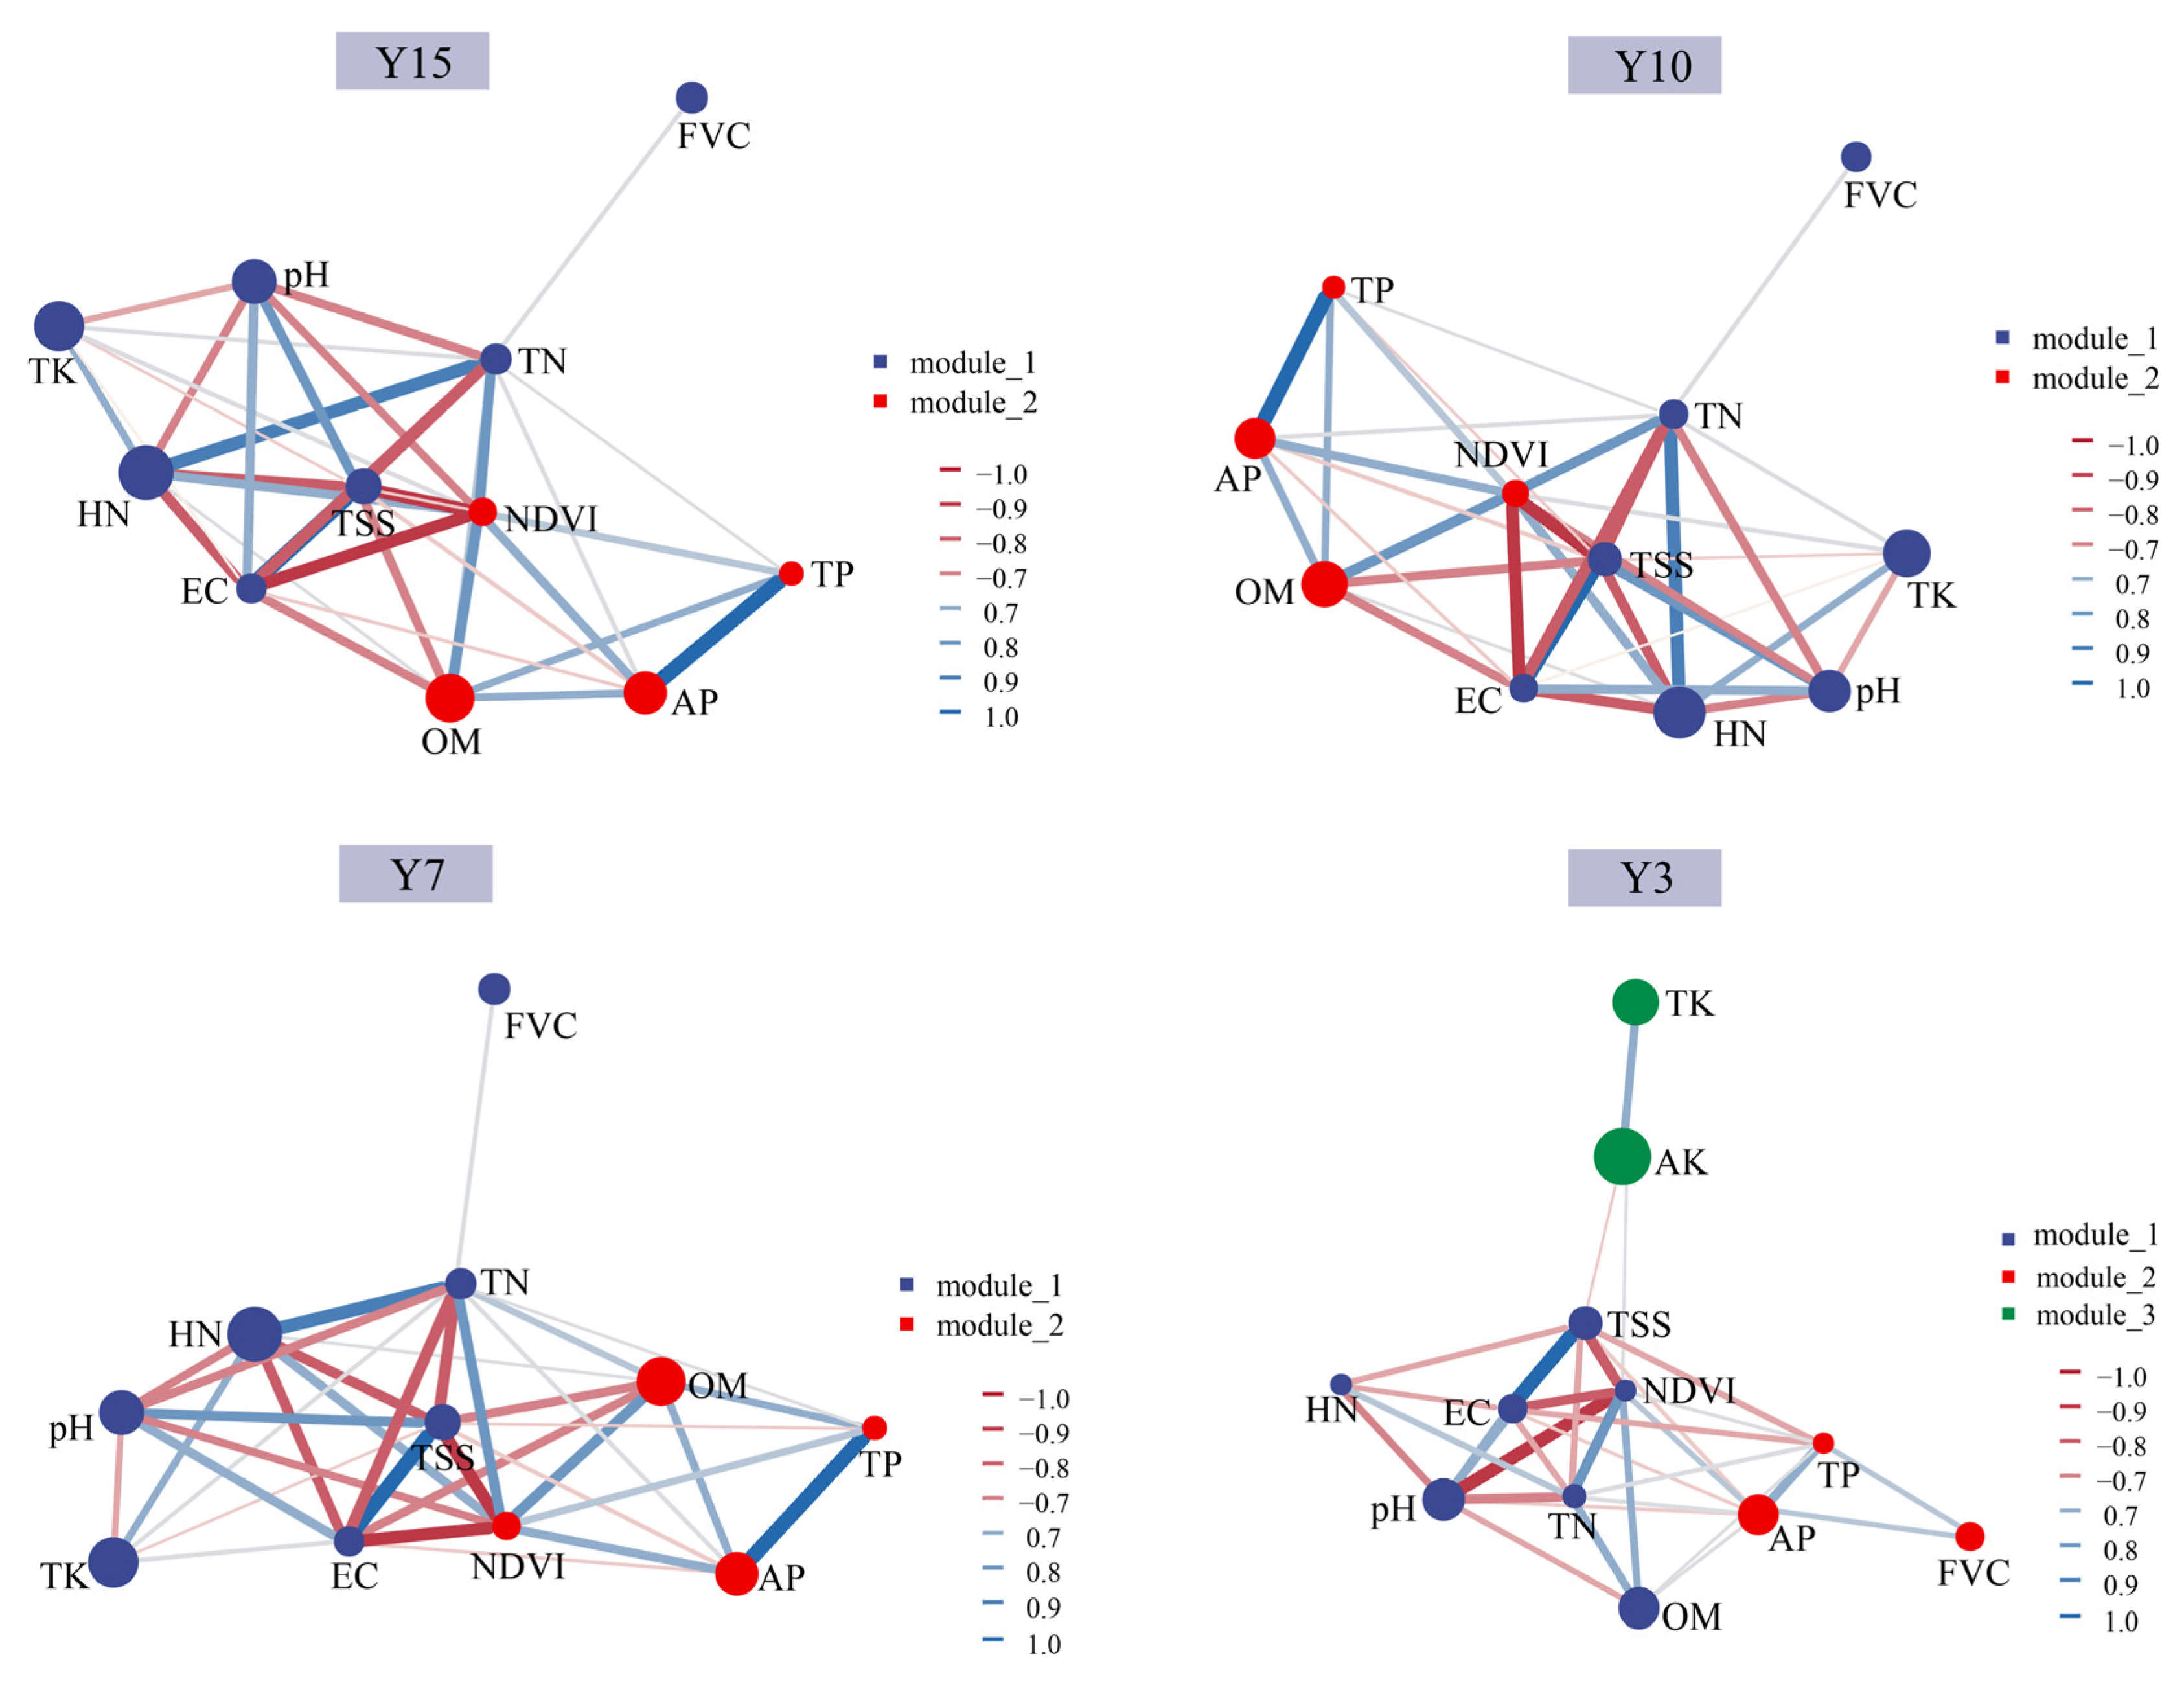
The co-occurrence networks, shown in Figure 5, were constructed using Pearson correlation matrices of standardized soil and vegetation variables, with adjacency thresholds determined by random matrix theory (RMT) to ensure statistically robust associations. Each node represents an individual soil or vegetation variable, and edges indicate statistically significant (p < 0.05) positive or negative correlations. Within each network, nodes with dense internal connections were grouped into modules, representing clusters of variables that co-vary strongly—i.e., they share direct edges and exhibit high pairwise correlations. Across reclamation stages, these network modules revealed both shared and stage-specific interaction patterns. In the early stages (Y3–Y7), vegetation indices were weakly connected to nutrient pools but strongly linked to salinity-related parameters (pH, EC, TSS), indicating that abiotic stress dominated community assembly. In later stages (Y10–Y15), networks became more integrated, with NDVI and FVC forming tightly connected modules with fertility indicators (OM, TN, TP), reflecting a shift toward nutrient-regulated vegetation development. Increasing node connectivity and modular complexity with reclamation age, as depicted in Figure 5, indicate enhanced ecosystem stability and soil–vegetation coevolution during reclamation.
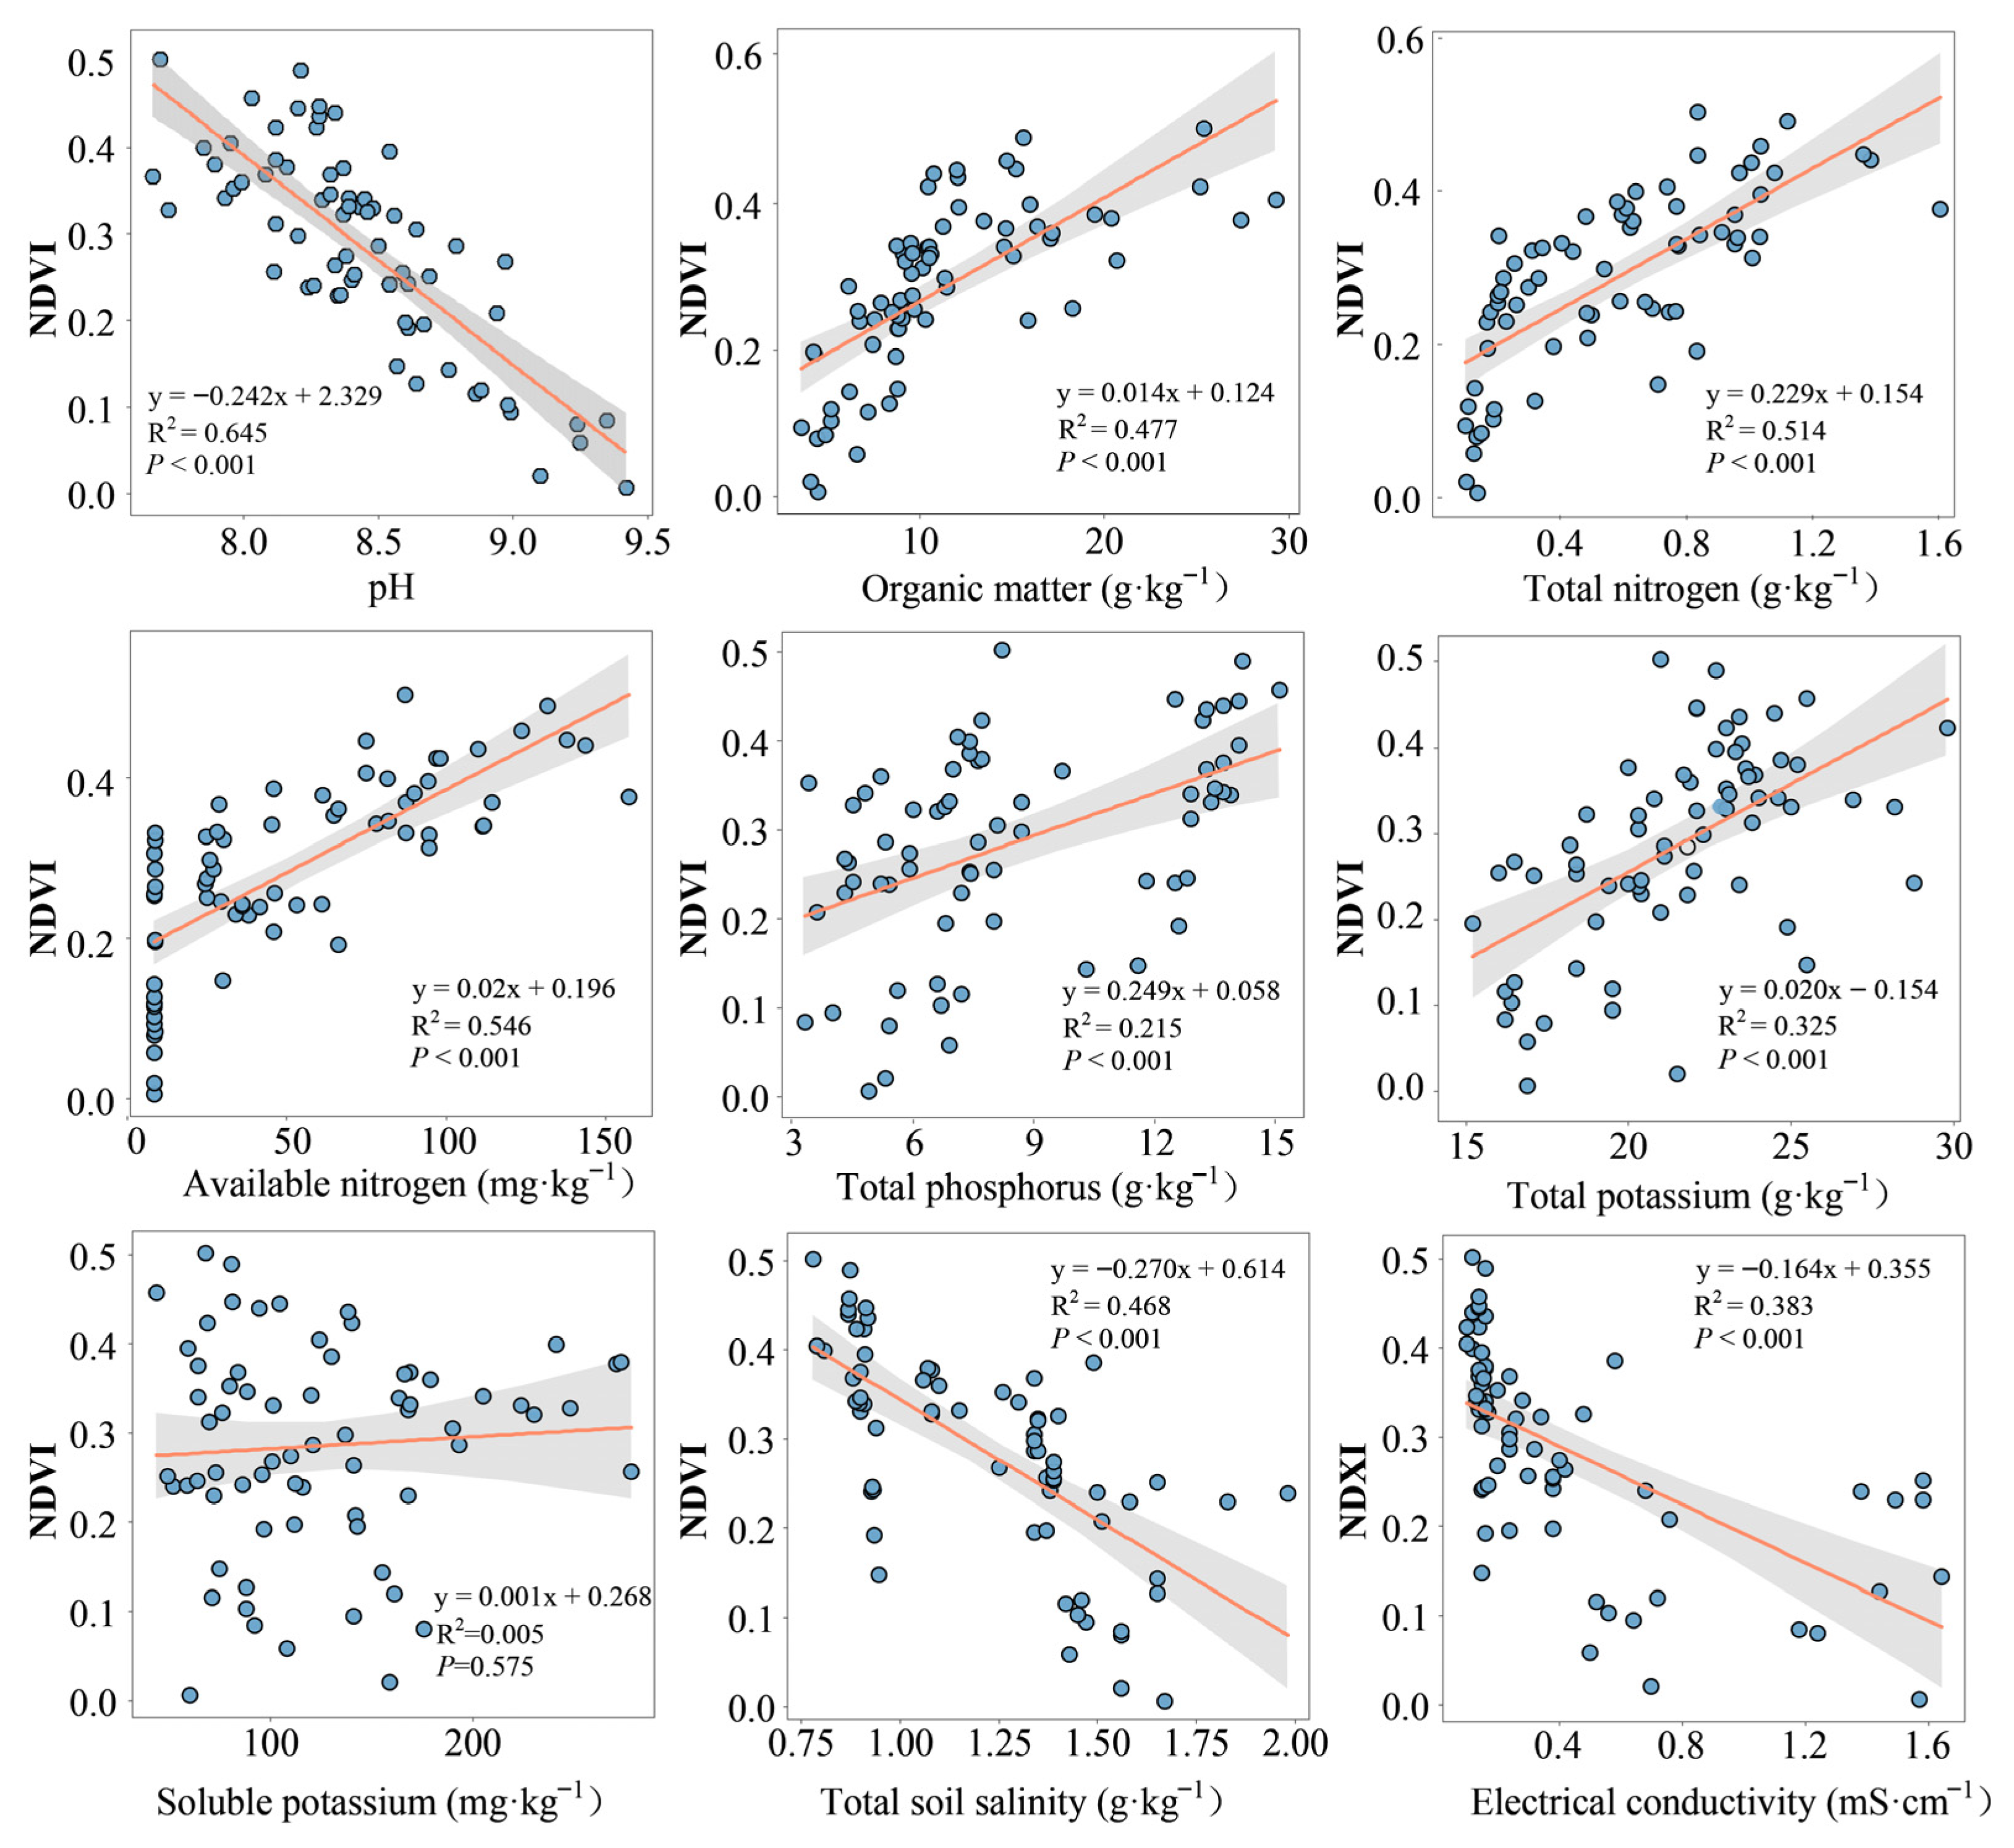
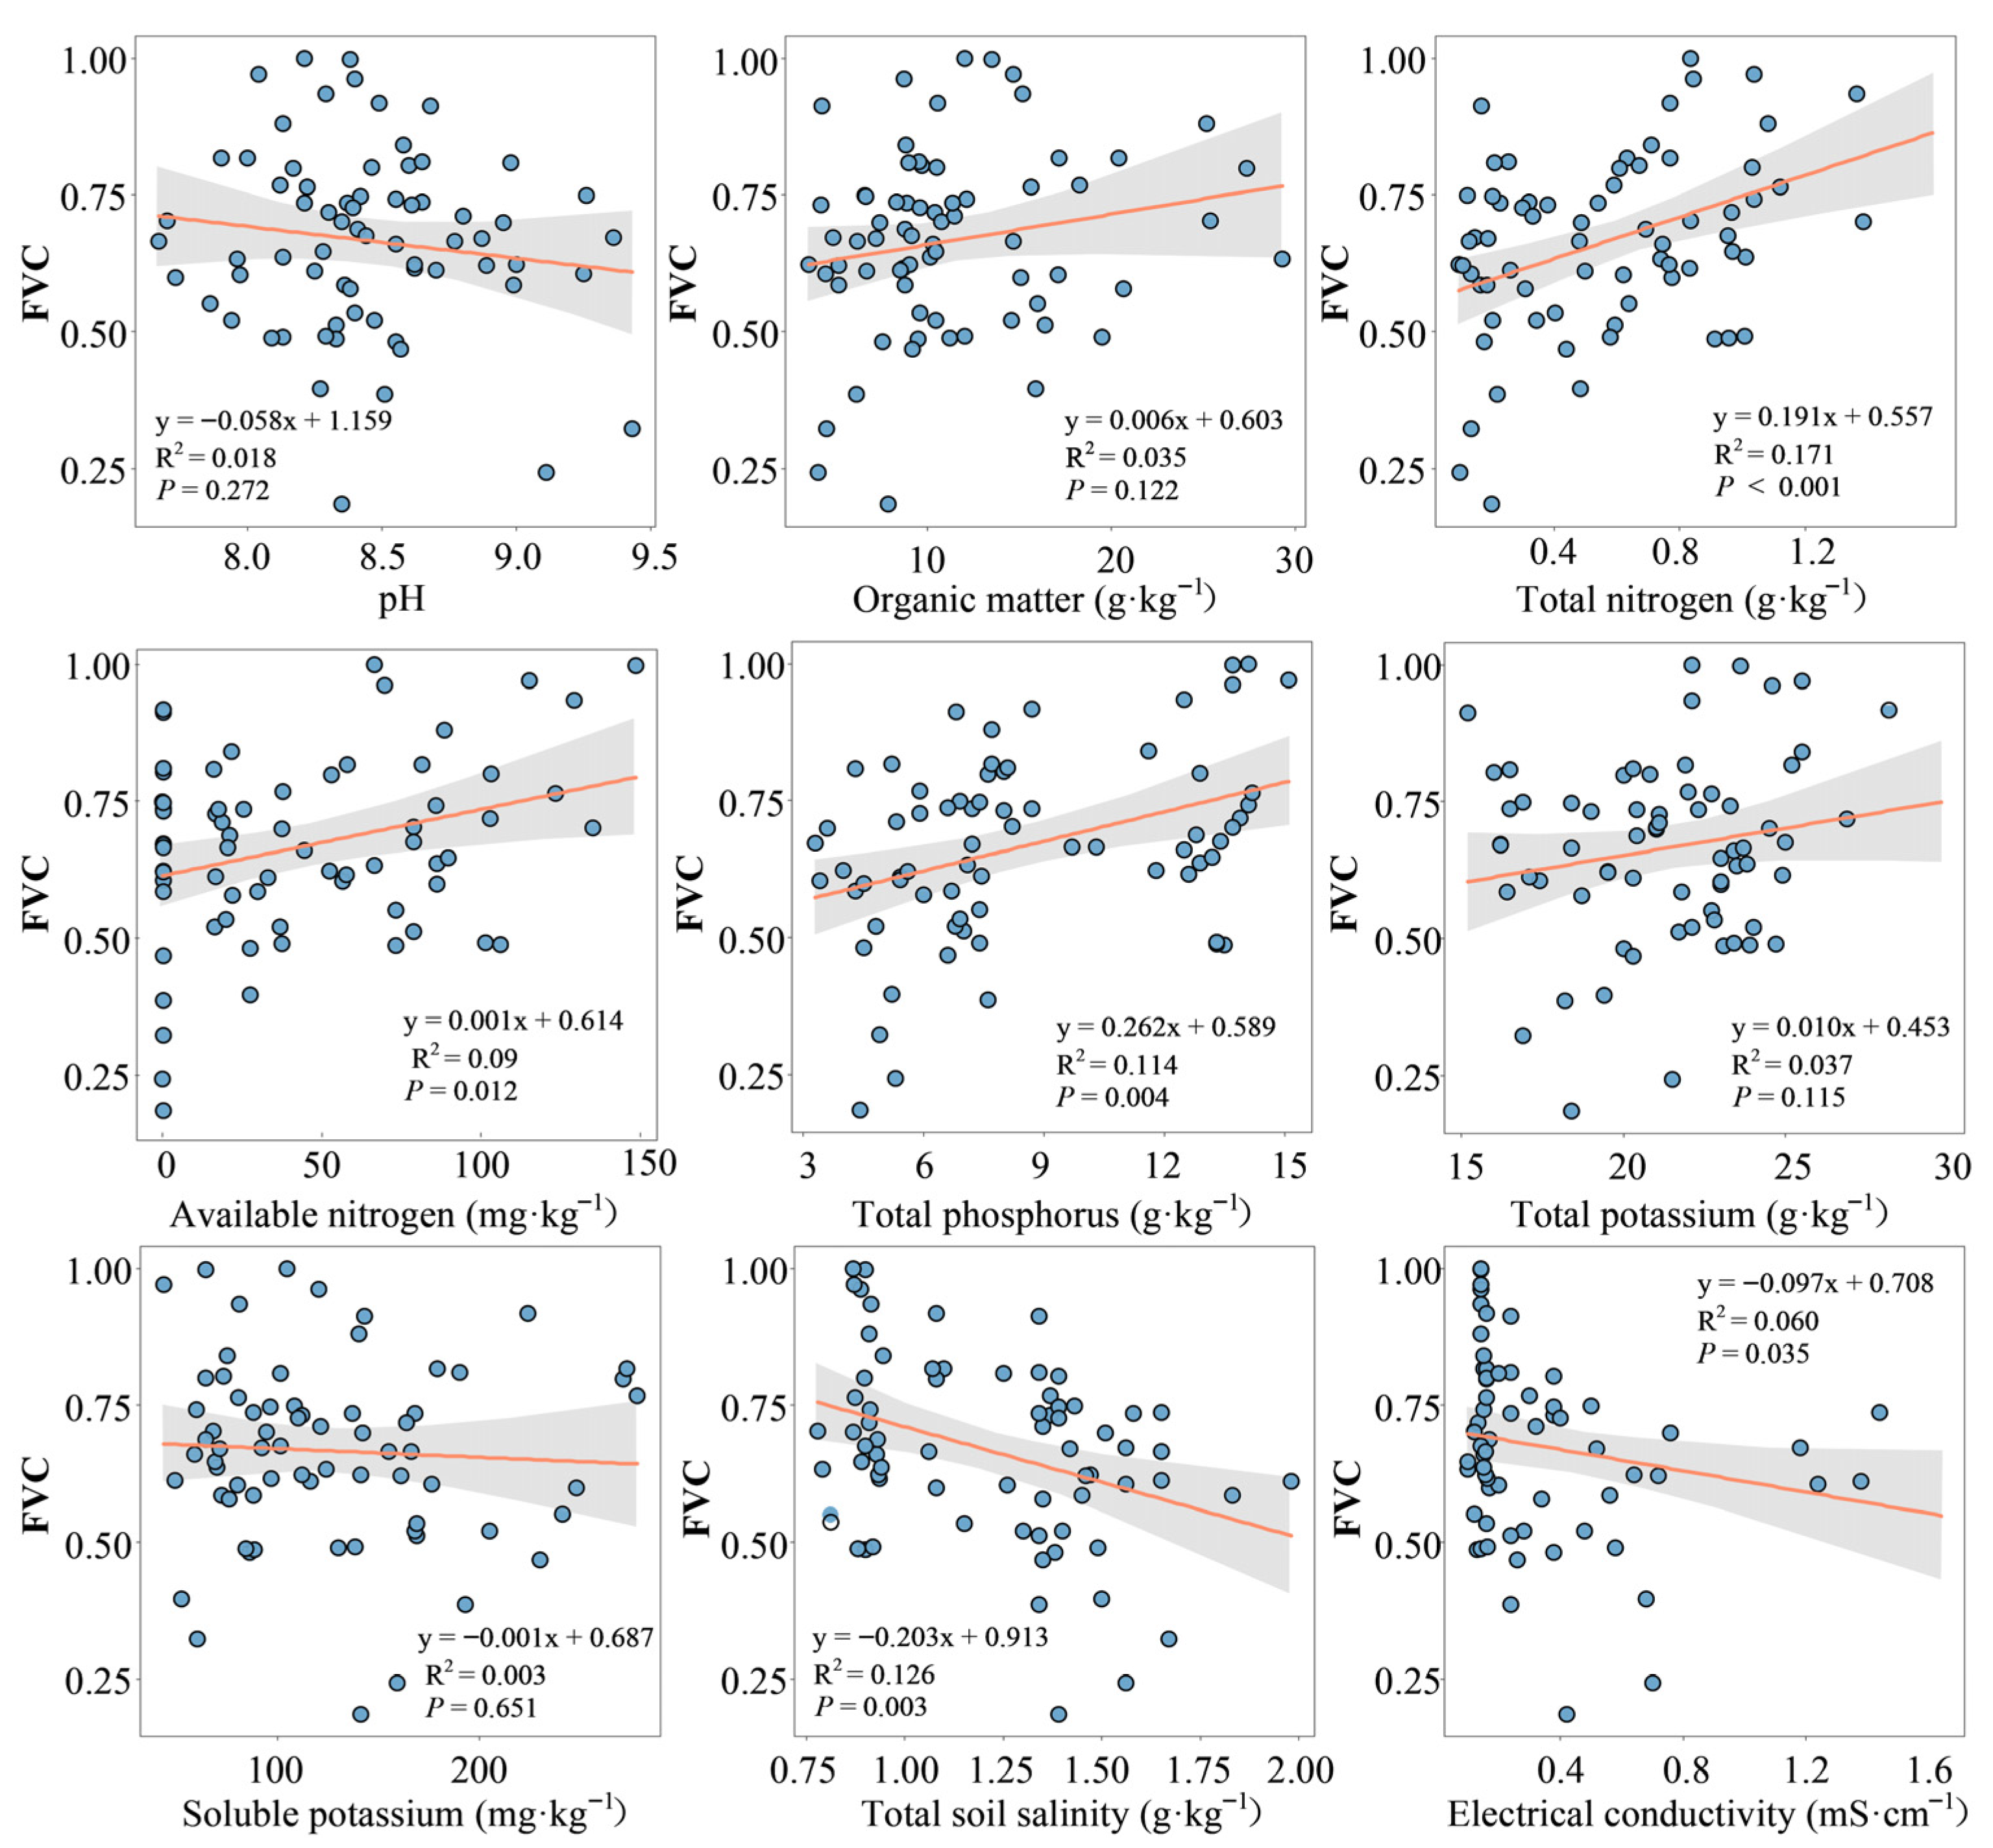
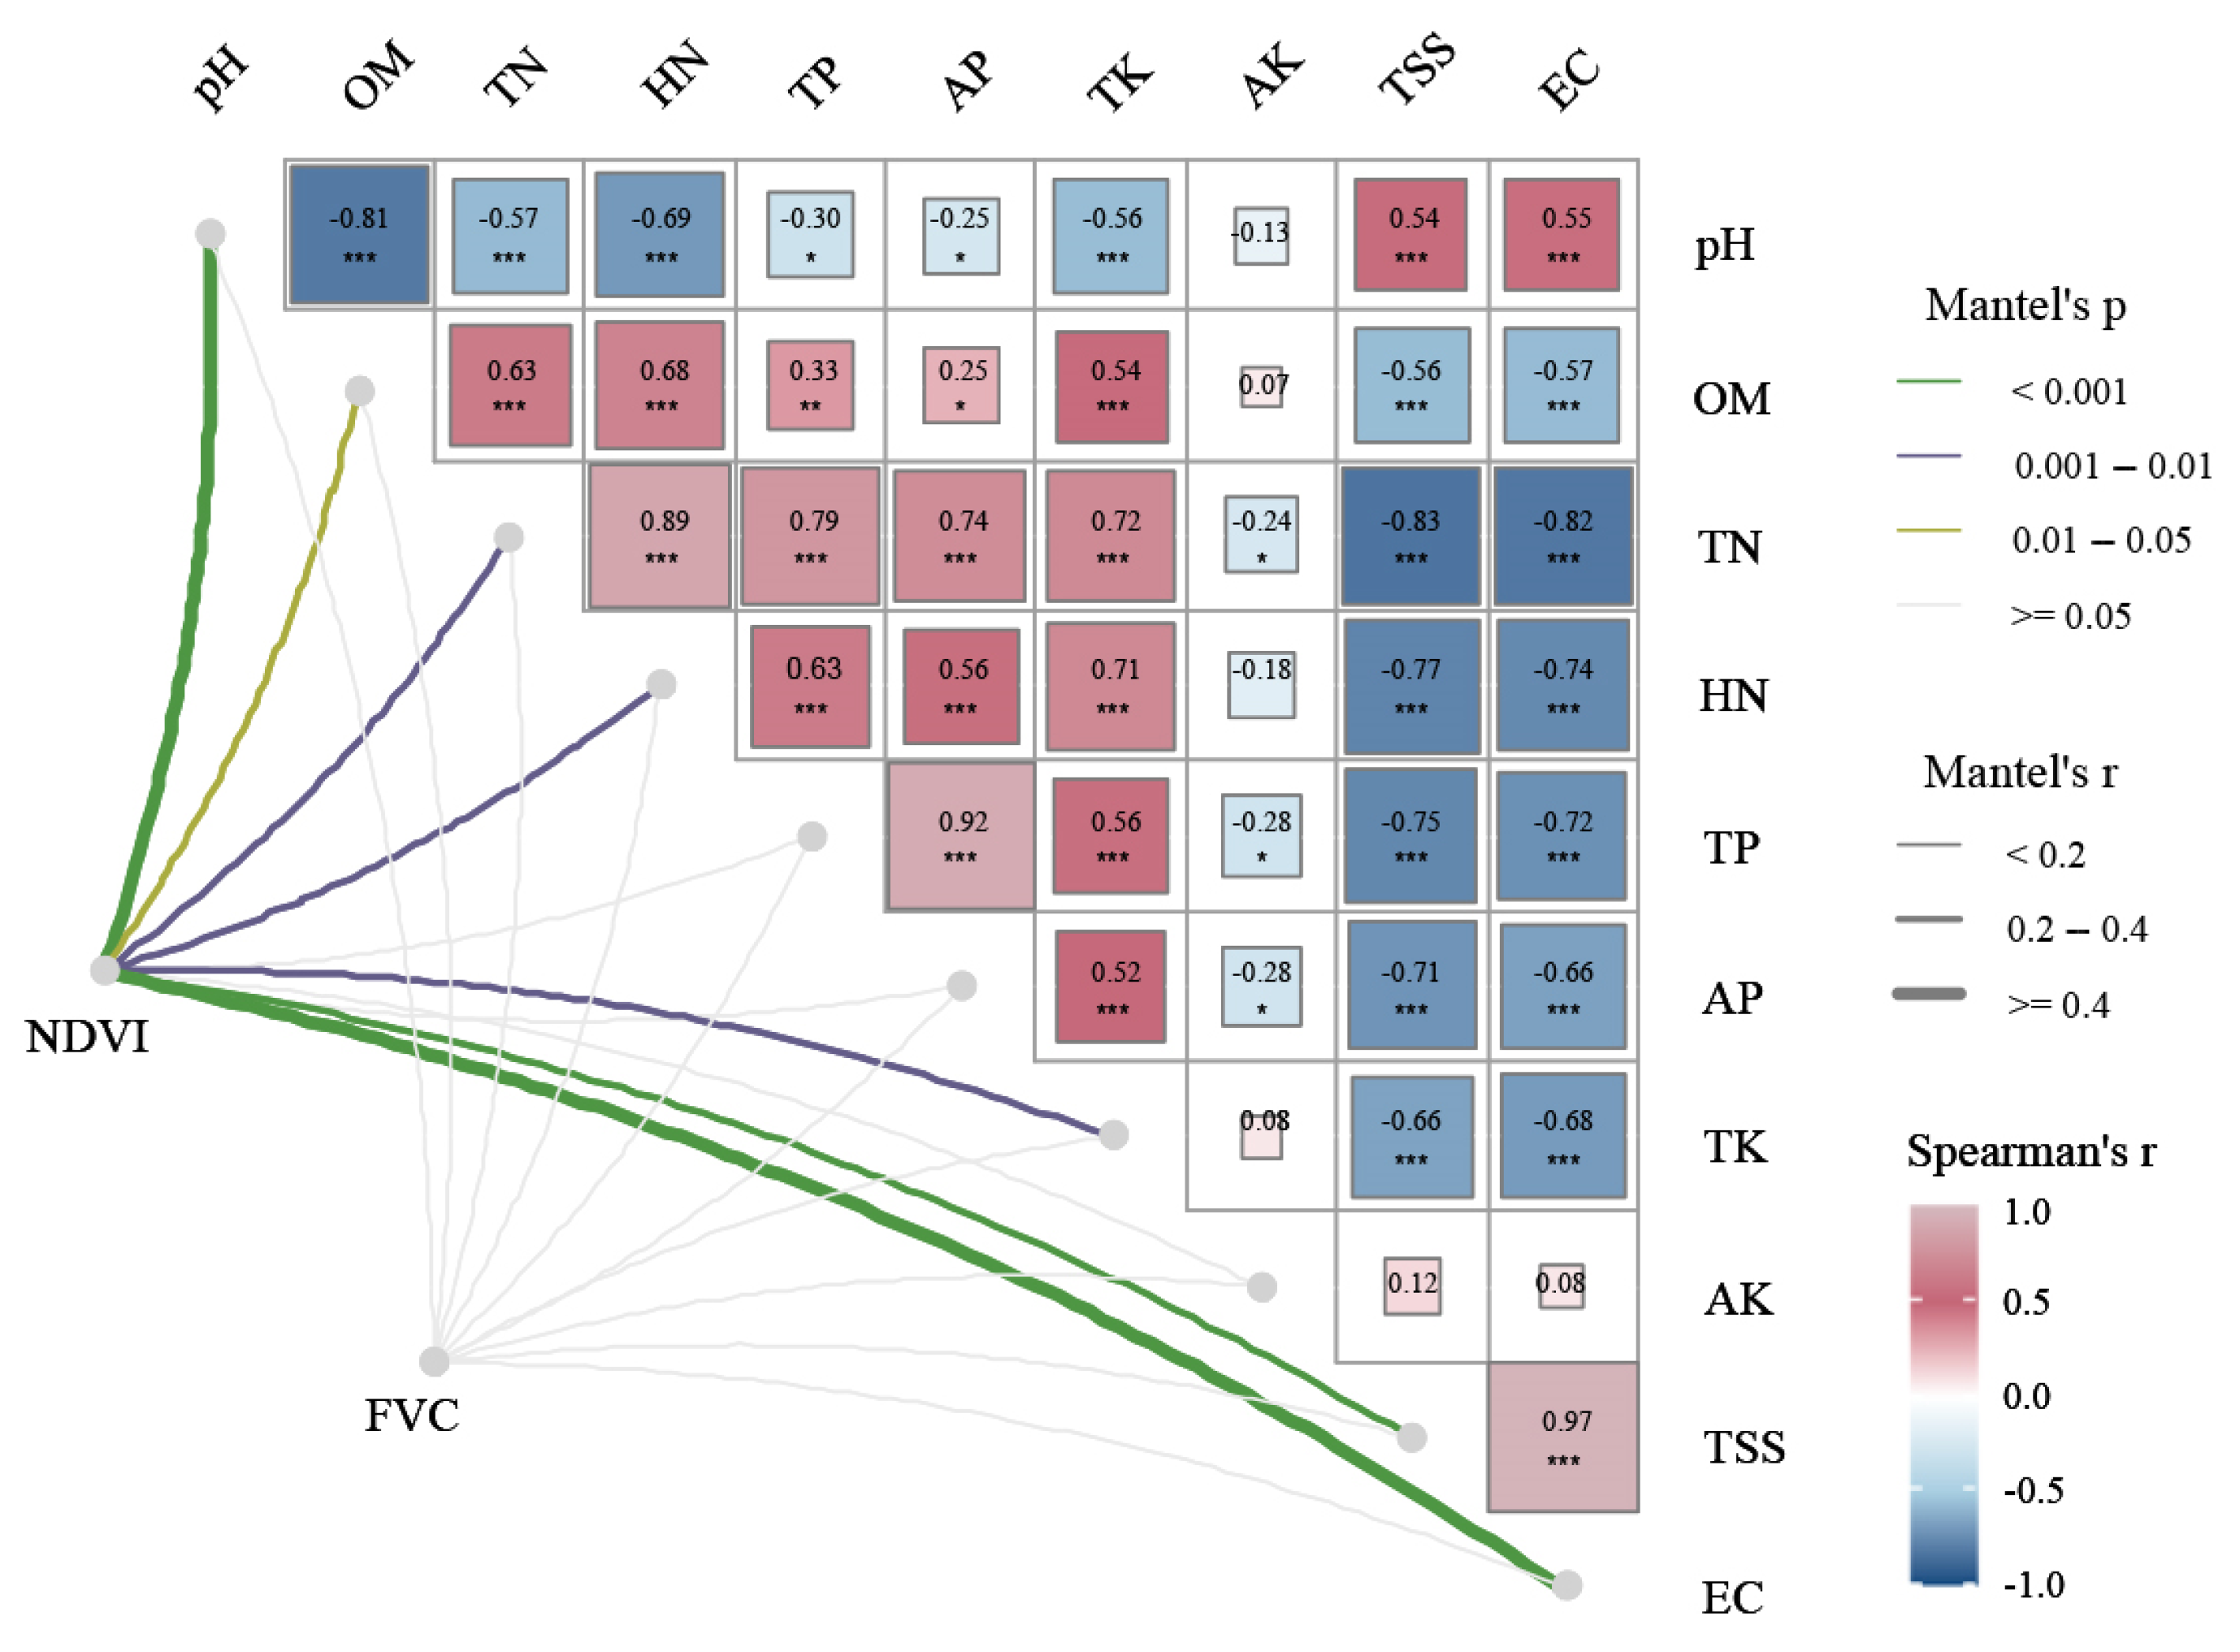
Mantel test analysis (Figure 6) further confirmed strong coupling between soil properties and vegetation indices. Organic matter was positively correlated with total potassium, TN, and hydrolyzable nitrogen, but negatively correlated with pH. Similarly, TN was positively linked with hydrolyzable nitrogen, TP, and TK, while showing negative correlations with total salinity, EC, and pH. These relationships reveal the complex interactions that structure soil development. Among vegetation metrics, NDVI was significantly correlated with pH, organic matter, and EC, whereas FVC showed no significant association with any soil property (p > 0.05).
The structural equation model clarified the relationships among developmental time, soil physicochemical properties, and vegetation indices on Hengsha Island (Figure 7). Developmental time had a significant positive effect on OM and TN, while it negatively influenced pH and TSS, reflecting the progressive improvement of soil quality during reclamation. In turn, soil properties strongly shaped vegetation dynamics. Both OM and TN exerted significant positive effects on NDVI, suggesting that nutrient enrichment directly promoted vegetation cover and growth. By contrast, TSS and pH showed significant negative effects on NDVI, indicating that soil salinity and alkalinity impose strong constraints on vegetation establishment. The relative strength of these pathways suggests that, while fertility improvement enhances vegetation recovery, excessive salinity–alkalinity remains a dominant limiting factor. These findings collectively demonstrate that soil development during reclamation is the fundamental driver of vegetation establishment, but the inhibitory effects of salinity and alkalinity remain key obstacles to sustainable vegetation succession.

4. Discussion

4.1. Effects of Reclamation Stages on Soil Physicochemical Properties

Hengsha Island was constructed using uniform hydraulic filling materials—dredged estuarine silt and sand—and identical engineering procedures. Soil development in the Hengsha Island reclamation area of the Yangtze River estuary follows a clear temporal trajectory, characterized by gradual salt leaching and nutrient accumulation driven by the combined influence of natural pedogenesis and human intervention. In new reclamation (Y3), soils are still strongly shaped by seawater intrusion and exhibit characteristic features of coastal salinization, including elevated pH and high concentrations of base ions, consistent with early-stage soil formation observed in other coastal reclamation areas [37,38,39]. By the mid-reclamation stage (Y7–Y10), vegetation succession enhances biogeochemical cycling and promotes organic matter accumulation, leading to improved soil fertility and the establishment of mixed tree–shrub–herb communities. While the long-term reclamation zone (Y15) exhibits markedly improved soil fertility and reduced salinity, these trends primarily reflect intensive agricultural management rather than natural succession alone. The Y15 site is under active cultivation, and practices such as fertilization, green manure incorporation, irrigation, and tillage contribute substantially to nitrogen and phosphorus enrichment and to the decline in soil electrical conductivity. Similar practices have been documented in the Dongtai (Jiangsu) [40] and Cixi (Zhejiang) [41] reclamation projects, where coordinated engineering and agricultural activities—such as soil amendment, irrigation–drainage systems, and organic fertilization—accelerated desalinization and fertility restoration [42]. These anthropogenic interventions disrupt compacted soil layers, improve aeration and permeability, and promote the leaching of soluble salts (e.g., NaCl, Na2SO4), leading to substantial declines in electrical conductivity and enhanced nitrogen and phosphorus accumulation [43]. Overall, our findings highlight that while natural succession (Y3–Y10) facilitates gradual soil development, targeted agricultural management (Y15) significantly accelerates soil desalinization and nutrient enrichment, underscoring the pivotal role of human activities and material inputs in steering the pedogenic and ecological evolution of newly reclaimed coastal ecosystems [44,45].
Three main pathways underlie these changes. First, physical leaching, whereby prolonged freshwater flushing drives a rapid initial decline in soil salinity, which gradually stabilizes over time [46]. This trajectory reflects the classical desalinization pattern widely observed in coastal reclamation landscapes [47]. Second, biotic accumulation, as pioneer plants ameliorate initial conditions while subsequent diverse communities further enhance fertility and reduce salinity through litter input, root activity, and microbial interactions [48]. Third, anthropogenic disturbance, with cultivation altering soil structure, water flow, and nutrient input. Earlier studies suggest that the direction of reclamation soil development hinges on the balance between natural recovery and human management [49,50]. The rapid transformation observed in Y15 confirms that intensive agriculture can override natural successional constraints. Compared with European reclamation areas, soils in the Yangtze estuary exhibit more pronounced reductions in conductivity and phosphorus accumulation [51], likely driven by sediment characteristics and intensive farming practices. Future multi-site comparative studies are needed to disentangle region-specific mechanisms of soil development in reclaimed coastal zones.

4.2. Effects of Reclamation Stages on Vegetation Cover

Vegetation cover across Hengsha Island displays pronounced spatial and temporal variation, shaped jointly by reclamation age, successional stage, and proximity to seawater. NDVI increased significantly with reclamation time (Figure 4). In the initial stage (Y3), high salinity stress limited NDVI (0.17 ± 0.10), and vegetation consisted mainly of annual salt-tolerant pioneers such as Suaeda salsa and Aeluropus littoralis, which colonize harsh environments and facilitate subsequent succession. By Y7, the community shifted from annual halophytes to perennial grasses such as Puccinellia distans and Cynodon dactylon, with occasional shrub invasion (Tamarix chinensis seedlings). This transition boosted NDVI (0.30 ± 0.04). In the mid-stage (Y10), vegetation was dominated by perennial tree–shrub–herb assemblages including reed, sedges, and early successional trees, with vertical stratification that further enhanced NDVI (0.33 ± 0.08). Similar temporal increases in NDVI along reclamation chronosequences have been documented in other coastal ecosystems, such as the Yellow River Delta, China [52], the Saemangeum reclamation area in Korea [19], and coastal wetlands of the southeastern United States [53]. These consistent patterns suggest that the recovery of vegetation greenness represents a common trajectory of wetland rehabilitation driven by declining salinity and gradual improvement in soil fertility.
Land-use type further modulated vegetation cover across the reclamation sequence [54]. Extensive evidence shows that land-use conversion strongly influences vegetation indices, with agriculture frequently acting as a dominant driver of greenness variability [55,56]. In this study, the cultivated croplands at Y15 exhibited higher canopy cover than natural shrublands at Y7 and Y10, largely due to management practices such as irrigation, crop rotation, and green manure application. Although forested ecosystems typically maintain greater cover than croplands or grasslands [57], the Y15 croplands even surpassed natural shrublands. This pattern likely reflects the larger proportion of bare soil and greater structural heterogeneity characteristic of younger shrub communities [21]. Comparable findings have been reported in reclaimed coastal croplands in Singapore [58] and post-mining revegetation sites [59], where managed areas exhibited higher NDVI than naturally recovering areas during the early stages of restoration. Such a contrast suggests that cropland reclamation—supported by irrigation and fertilization—can temporarily produce higher vegetation greenness than naturally regenerating shrublands [60].
NDVI and FVC exhibited divergent responses to soil properties, reflecting differences in their ecological sensitivity. NDVI correlated positively with soil organic matter, total nitrogen, and available potassium, whereas FVC showed weaker associations. This divergence arises from their contrasting biophysical bases: NDVI, derived from canopy reflectance, integrates vegetation greenness and photosynthetic activity that respond to soil fertility and salinity stress, whereas FVC primarily represents surface coverage during early succession [61,62]. Although NDVI effectively captures large-scale patterns of canopy greenness, it cannot fully resolve the compositional and structural dimensions of vegetation succession. Future work integrating field-based vegetation surveys—encompassing species composition, biomass, and community structure—with remote sensing will enable a more comprehensive understanding of soil–vegetation coevolution in reclaimed coastal wetlands.

4.3. Synergistic Evolution of Soil and Vegetation in Coastal Reclamation Zones

Our results demonstrate that the co-evolution of soil and vegetation in reclaimed coastal zones follows a clear stage-dependent trajectory governed by the interplay between abiotic constraints and biogeochemical feedbacks (Figure A1 and Figure A2). Mantel tests and network analyses showed that soil total nitrogen, organic matter, potassium, and phosphorus were all strongly and positively correlated with NDVI (p < 0.001). These patterns echo previous findings that vegetation expansion enhances organic matter and nutrient pools in salt marsh soils through litter deposition and rhizosphere processes [63]. In the early reclamation stages (Y3–Y7), vegetation indices were weakly linked to nutrients but strongly connected with salinity factors, suggesting that ionic toxicity and osmotic stress dominated community assembly [64,65]. As reclamation progressed, the co-occurrence network exhibited higher modularity and node connectivity, and vegetation indices became increasingly integrated with fertility-related variables, indicating a shift from stress-driven to nutrient-regulated ecosystem development. Variables with high centrality—such as OM, TN, and pH—functioned as regulatory hubs connecting physicochemical and biological subsystems. This enhanced network complexity signals increased ecological stability and feedback strength, consistent with the idea that nutrient enrichment and desalinization jointly drive vegetation succession in developing coastal soils [66,67,68].
These relationships reflect co-evolutionary feedback rather than simple unidirectional causation (Figure A3). While our study primarily addressed how soil properties influence vegetation growth, vegetation can also modify soil attributes by altering microclimate, exuding root metabolites, and contributing litter inputs that accelerate nutrient cycling and organic matter stabilization [69]. Over time, these reciprocal processes reinforce soil–vegetation coupling and contribute to the resilience of reclaimed ecosystems. From a restoration standpoint, this coregulated dynamic highlights the need to synchronize soil amelioration and vegetation succession. Early-stage management should prioritize halophytic pioneers (e.g., Suaeda salsa, Phragmites australis) to initiate desalinization and organic matter accumulation, while mid- to late-stage reclamation should focus on nutrient enhancement (e.g., green manure, organic fertilization) and structural stabilization through mixed community establishment [70,71]. In future work, we aim to leverage long-term monitoring data to quantify bidirectional soil–vegetation feedbacks and to elucidate how vegetation dynamics and soil development co-evolve in reclaimed coastal ecosystems.

5. Conclusions

This study systematically examined soil and vegetation development along a reclamation chronosequence on Hengsha Island to elucidate soil–vegetation coevolution in newly reclaimed coastal ecosystems. Reclamation age exerted a strong influence on soil physicochemical properties: soil pH declined from 8.3 to 7.5, electrical conductivity decreased by approximately 45%, and total salinity was reduced by nearly half. In contrast, soil organic matter, total nitrogen, and total phosphorus increased by 1.8- to 2.5-fold, reflecting continuous pedogenic improvement and nutrient accumulation. Concurrently, NDVI increased with reclamation time, reflecting vegetation succession from salt-tolerant pioneers to mixed and mature communities. Correlation and structural equation analyses revealed that soil nutrients (OM, TN, TP) positively, and salinity indices negatively, influenced NDVI. pH, TSS, TN, and OM were identified as the dominant factors regulating vegetation recovery. Together, these findings demonstrate that nutrient enrichment and desalinization jointly drive soil–vegetation coupling during coastal reclamation. The results provide practical insights for optimizing soil management and vegetation restoration in the Yangtze River Delta and offer a theoretical framework for sustainable, nature-based coastal rehabilitation under accelerating environmental change.

Author Contributions

Conceptualization, X.L. and Y.Z.; methodology, X.L. and Y.Z.; software, D.L.; validation, W.L., X.Z., and K.S.; formal analysis, X.L. and Y.Z.; investigation, D.L.; resources, X.L. and Y.Z.; data curation, X.Z.; writing—original draft preparation, X.L. and Y.Z.; writing—review and editing, X.L. and Y.Z.; visualization, M.K.; supervision, K.S.; project administration, K.S.; funding acquisition, W.L. All authors have read and agreed to the published version of the manuscript.

Funding

This research is funded by Shanghai Agricultural Science and Technology Innovation Project (T2024315), National Agricultural Experimental Station for Agricultural Environment, Fengxian (Grant number: NAES035AE03) and Institute Go-Sailing Program (QA 2025-1).

Institutional Review Board Statement

Not applicable.

Data Availability Statement

The raw data supporting the conclusions of this article will be made available by the authors on request.

Conflicts of Interest

The authors declare no conflicts of interest.

Abbreviations

The following abbreviations are used in this manuscript:
NDVINormalized difference vegetation index
FVCFractional vegetation cover
ECElectrical conductivity
TSSTotal soil salinity
OMOrganic matter
TNTotal nitrogen
HNHydrolyzable nitrogen
TPAvailable phosphorus
APAvailable phosphorus
TKTotal potassium
AKAvailable potassium

Appendix A

Table A1. Changes in soil physicochemical properties across reclamation stages and their trends.
Soil Physicochemical PropertiesY3Y7Y10Y15Changing Trends
pH8.82 ± 0.328.45 ± 0.388.15 ± 0.298.36 ± 0.16Decrease
Electrical conductivity (mS/cm)0.67 ± 0.460.44 ± 0.440.47 ± 0.460.14 ± 0.02Decrease
Total soil salinity (mg/kg)1.44 ± 0.141.32 ± 0.171.28 ± 0.320.91 ± 0.02Decrease
Organic matter (mg/kg)6442.50 ± 2097.8810605.00 ± 1841.2016899.00 ± 6557.7911053.39 ± 2116.29Increase
Hydrolyzable nitrogen (mg/kg)250.03 ± 180.76358.96 ± 103.44551.64 ± 234.4989.09 ± 223.75Increase
Total nitrogen (mg/kg)250.03 ± 180.76358.96 ± 103.44551.64 ± 234.40989.09 ± 223.75Increase
Available phosphorus (mg/kg)6.59 ± 1.676.88 ± 1.656.01 ± 1.4813.28 ± 0.81Increase
Total potassium (mg/kg)160.00 ± 30.00160.00 ± 20.00160.00 ± 30.00610.00 ± 70.00Increase
Total potassium (mg/kg)18.47 ± 2.7820.84 ± 2.4722.21 ± 2.4423.87 ± 1.87Increase
Available potassium (mg/kg)135.05 ± 49.71127.63 ± 38.97155.90 ± 73.2087.22 ± 28.25Increased initially and then declined
Figure A1. The relationship between NDVI and soil properties.
Agriculture 15 02196 g0a1
Figure A2. The relationship between FVC and soil properties.
Agriculture 15 02196 g0a2
Figure A3. Geographically Weighted Regression (GWR) distribution map of NDVI influencing factors. (a) pH, (b) Organic Matter.
Agriculture 15 02196 g0a3
Note: The GWR (Geographically Weighted Regression) model was applied to explore the spatial non-stationarity between NDVI and pH, as well as NDVI and organic matter. The maps reflect the variation in regression coefficients across different spatial locations.

References

  1. Li, S.; Shao, Y.; Hong, M.; Zhu, C.; Dong, B.; Li, Y.; Lin, Y.; Wang, K.; Gan, M.; Zhu, J.; et al. Impact mechanisms of urbanization processes on supply-demand matches of cultivated land multifunction in rapid urbanization areas. Habitat Int. 2023, 131, 102726. [Google Scholar] [CrossRef]
  2. Wang, J.; Zhang, X. Land-based urbanization in China: Mismatched land development in the post-financial crisis era. Habitat Int. 2022, 125, 102598. [Google Scholar] [CrossRef]
  3. Zhang, Y.; Xie, H. Interactive relationship among urban expansion, economic development, and population growth since the reform and opening up in China: An analysis based on a vector error correction model. Land 2019, 8, 153. [Google Scholar] [CrossRef]
  4. Shi, K.; Chen, Y.; Yu, B.; Xu, T.; Li, L.; Huang, C.; Liu, R.; Chen, Z.; Wu, J. Urban expansion and agricultural land loss in China: A multiscale perspective. Sustainability 2016, 8, 790. [Google Scholar] [CrossRef]
  5. Yan, F.; Wang, X.; Huang, C.; Zhang, J.; Su, F.; Zhao, Y.; Lyne, V. Sea reclamation in mainland China: Process, pattern, and management. Land Use Policy 2023, 127, 106555. [Google Scholar] [CrossRef]
  6. Sengupta, D.; Chen, R.; Meadows, M.E. Building beyond land: An overview of coastal land reclamation in 16 global megacities. Appl. Geogr. 2018, 90, 229–238. [Google Scholar] [CrossRef]
  7. Xie, J.; Yuan, Y.; Wang, X.; Zhang, R.; Zhong, R.; Zhai, J.; Lu, Y.; Tao, J.; Pu, L.; Huang, S. Impact of Coastal Beach Reclamation on Seasonal Greenhouse Gas Emissions: A Study of Diversified Saline–Alkaline Land Use Patterns. Agriculture 2025, 15, 1403. [Google Scholar] [CrossRef]
  8. Zhang, Y.; Chen, R.; Wang, Y. Tendency of land reclamation in coastal areas of Shanghai from 1998 to 2015. Land Use Policy 2020, 91, 104370. [Google Scholar] [CrossRef]
  9. Wu, T.; Zhu, J.; Ma, R.; Qiu, W.; Yuan, R. Freshwater resources around the reclaimed new land on the Eastern Hengsha Shoal in the Changjiang estuary. Front. Mar. Sci. 2023, 10, 1302091. [Google Scholar] [CrossRef]
  10. Zhang, J.; Sha, C.; Li, S.; Wang, M.; Wang, Q.; Wang, Q.; Su, J.; Shen, C.; Huang, S. Chronosequence Changes of Soil Organic Carbon in Salt Marshes under Artificial Intervention: A Case Study of Hengsha Island in the Yangtze Estuary. Sustainability 2024, 16, 4553. [Google Scholar] [CrossRef]
  11. Ma, R.; Zhu, J. Water and Salt Transports in the Hengsha Channel of Changjiang Estuary. J. Mar. Sci. Eng. 2022, 10, 72. [Google Scholar] [CrossRef]
  12. Yu, W.; Zhang, D.; Liao, J.; Ma, L.; Zhu, X.; Zhang, W.; Hu, W.; Ma, Z.; Chen, B. Linking ecosystem services to a coastal bay ecosystem health assessment: A comparative case study between Jiaozhou Bay and Daya Bay, China. Ecol. Indic. 2022, 135, 108530. [Google Scholar] [CrossRef]
  13. Kumar, R.; Singh, A.; Bhardwaj, A.K.; Kumar, A.; Yadav, R.K.; Sharma, P.C. Reclamation of salt-affected soils in India: Progress, emerging challenges, and future strategies. Land Degrad. Dev. 2022, 33, 2169–2180. [Google Scholar] [CrossRef]
  14. Wang, C.; Kuzyakov, Y. Energy use efficiency of soil microorganisms: Driven by carbon recycling and reduction. Glob. Change Biol. 2023, 29, 6170–6187. [Google Scholar] [CrossRef]
  15. Reithmaier, G.M.; Cabral, A.; Akhand, A.; Bogard, M.J.; Borges, A.V.; Bouillon, S.; Burdige, D.J.; Call, M.; Chen, N.; Chen, X.; et al. Carbonate chemistry and carbon sequestration driven by inorganic carbon outwelling from mangroves and saltmarshes. Nat. Commun. 2023, 14, 8196. [Google Scholar] [CrossRef]
  16. Osland, M.J.; Gabler, C.A.; Grace, J.B.; Day, R.H.; McCoy, M.L.; McLeod, J.L.; From, A.S.; Enwright, N.M.; Feher, L.C.; Stagg, C.L.; et al. Climate and plant controls on soil organic matter in coastal wetlands. Glob. Change Biol. 2018, 24, 5361–5379. [Google Scholar] [CrossRef] [PubMed]
  17. Gong, J.; Liu, W.; Li, W.; Cui, L. Sediment organic carbon dynamics and accumulation in estuarine mangrove wetlands. Catena 2025, 259, 109317. [Google Scholar] [CrossRef]
  18. Zheng, Y.; Cao, X.; Zhou, Y.; Li, Z.; Yang, Y.; Zhao, D.; Li, Y.; Xu, Z.; Zhang, C.-S. Effect of planting salt-tolerant legumes on coastal saline soil nutrient availability and microbial communities. J. Environ. Manag. 2023, 345, 118574. [Google Scholar] [CrossRef] [PubMed]
  19. Cho, K.H.; Beon, M.-S.; Jeong, J.-C. Dynamics of soil salinity and vegetation in a reclaimed area in Saemangeum, Republic of Korea. Geoderma 2018, 321, 42–51. [Google Scholar] [CrossRef]
  20. Beon, M.-S.; Cho, K.H.; Kim, H.O.; Oh, H.-K.; Jeong, J.-C. Mapping of vegetation using multi-temporal downscaled satellite images of a reclaimed area in Saemangeum, Republic of Korea. Remote Sens. 2017, 9, 272. [Google Scholar] [CrossRef]
  21. Caldwell, T.G.; Young, M.H.; McDonald, E.V.; Zhu, J. Soil heterogeneity in Mojave Desert shrublands: Biotic and abiotic processes. Water Resour. Res. 2012, 48, W09551. [Google Scholar] [CrossRef]
  22. Chua, S.; Switzer, A.D.; Gouramanis, C.; Dixit, Y.; Bird, M.I.; Horton, B.P. Coastal response to Holocene Sea-level change: A case study from Singapore. Mar. Geol. 2023, 465, 107146. [Google Scholar] [CrossRef]
  23. Ba, Q.; Wang, B.; Zhu, L.; Fu, Z.; Wu, X.; Wang, H.; Bi, N. Rapid change of vegetation cover in the Huanghe (Yellow River) mouth wetland and its biogeomorphological feedbacks. Catena 2024, 238, 107875. [Google Scholar] [CrossRef]
  24. Suir, G.M.; Saltus, C.L.; Reif, M.K. Remote sensing-based structural and functional assessments of Phragmites australis diebacks in the Mississippi River Delta. Ecol. Indic. 2022, 135, 108549. [Google Scholar] [CrossRef]
  25. Zhang, B.; Hu, G.; Xu, C.; Hu, C.; Zhong, C.; Chen, S.; Zhang, Z. Effects of Natural Vegetation Restoration on Soil Physicochemical Properties in Tropical Karst Areas, Southwestern China. Forests 2024, 15, 1270. [Google Scholar] [CrossRef]
  26. Biederman, L.A.; Whisenant, S.G. Using Mounds to Create Microtopography Alters Plant Community Development Early in Restoration. Restor. Ecol. 2011, 19, 53–61. [Google Scholar] [CrossRef]
  27. Li, J.; Wang, S.; Tang, Y.; Du, Y.; Xu, L.; Hu, J.; Zhu, C. Coastal reclamation alters soil organic carbon dynamics: A meta-analysis in China. Catena 2024, 240, 107975. [Google Scholar] [CrossRef]
  28. Wang, F.; Wang, T.; Gustave, W.; Wang, J.; Zhou, Y.; Chen, J. Spatial-temporal patterns of organic carbon sequestration capacity after long-term coastal wetland reclamation. Agric. Ecosyst. Environ. 2023, 341, 108209. [Google Scholar] [CrossRef]
  29. Maynard, J.J.; Levi, M.R. Hyper-temporal remote sensing for digital soil mapping: Characterizing soil-vegetation response to climatic variability. Geoderma 2017, 285, 94–109. [Google Scholar] [CrossRef]
  30. Xu, N.; Jia, D.; Ding, L.; Wu, Y. Continuously tracking the annual changes of the Hengsha and Changxing islands at the Yangtze River estuary from 1987 to 2016 using Landsat imagery. Water 2018, 10, 171. [Google Scholar] [CrossRef]
  31. Li, X.; Qi, X.; Liu, X.; Khalid, M.; Ye, J.; Romantschuk, M.; Chen, F.; Hua, Y.; Hui, N. PET addition delays the composting mature process and promotes microbiota associated with plastic degradation in plastisphere. J. Clean. Prod. 2023, 389, 136066. [Google Scholar] [CrossRef]
  32. Li, X.; Ma, J.; Yang, Y.; Hou, H.; Liu, G.-J.; Chen, F. Short-term response of soil microbial community to field conversion from dryland to paddy under the land consolidation process in North China. Agriculture 2019, 9, 216. [Google Scholar] [CrossRef]
  33. Moravec, D.; Komárek, J.; Medina, S.L.-C.; Molina, I. Effect of atmospheric corrections on NDVI: Intercomparability of Landsat 8, Sentinel-2, and UAV sensors. Remote Sens. 2021, 13, 3550. [Google Scholar] [CrossRef]
  34. Li, X.; Yu, M.; Ma, J.; Luo, Z.; Chen, F.; Yang, Y. Identifying the relationship between soil properties and rice growth for improving consolidated land in the Yangtze River Delta, China. Sustainability 2018, 10, 3072. [Google Scholar] [CrossRef]
  35. Mu, X.; Yang, Y.; Xu, H.; Guo, Y.; Lai, Y.; McVicar, T.R.; Xie, D.; Yan, G. Improvement of NDVI mixture model for fractional vegetation cover estimation with consideration of shaded vegetation and soil components. Remote Sens. Environ. 2024, 314, 114409. [Google Scholar] [CrossRef]
  36. Mu, X.; Song, W.; Gao, Z.; McVicar, T.R.; Donohue, R.J.; Yan, G. Fractional vegetation cover estimation by using multi-angle vegetation index. Remote Sens. Environ. 2018, 216, 44–56. [Google Scholar] [CrossRef]
  37. Wan, D.; Yu, P.; Kong, L.; Zhang, J.; Chen, Y.; Zhao, D.; Liu, J. Effects of inland salt marsh wetland degradation on plant community characteristics and soil properties. Ecol. Indic. 2024, 159, 111582. [Google Scholar] [CrossRef]
  38. Zhang, K.; Xia, J.; Su, L.; Gao, F.; Cui, Q.; Xing, X.; Dong, M.; Li, C. Effects of microtopographic patterns on plant growth and soil improvement in coastal wetlands of the Yellow River Delta. Front. Plant Sci. 2023, 14, 1162013. [Google Scholar] [CrossRef] [PubMed]
  39. Ma, H.; Thompson, A.; Hall, S.J.; Wang, J.; Xiao, Y.; Liu, C.-Q.; Chen, C. Enrichment of metastable iron minerals in global coastal wetlands. Nat. Geosci. 2025, 18, 885–892. [Google Scholar] [CrossRef]
  40. Hua, J.; Feng, Y.; Jiang, Q.; Bao, X.; Yin, Y. Shift of bacterial community structure along different coastal reclamation histories in Jiangsu, Eastern China. Sci. Rep. 2017, 7, 10096. [Google Scholar] [CrossRef]
  41. Sun, B.; Gao, C.; Zhang, Y. Soil quality evaluation in typical coastal reclamation zones based on weighted Topsis method. Chin. J. Eco-Agric. 2018, 26, 284–293. [Google Scholar] [CrossRef]
  42. Xu, Y.; Pu, L.; Zhang, R.; Zhu, M.; Zhang, M.; Bu, X.; Xie, X.; Wang, Y. Effects of Agricultural Reclamation on Soil Physicochemical Properties in the Mid-Eastern Coastal Area of China. Land 2021, 10, 142. [Google Scholar] [CrossRef]
  43. Graham, N.T.; Hejazi, M.I.; Chen, M.; Davies, E.G.; Edmonds, J.A.; Kim, S.H.; Turner, S.W.; Li, X.; Vernon, C.R.; Calvin, K.; et al. Humans drive future water scarcity changes across all Shared Socioeconomic Pathways. Environ. Res. Lett. 2020, 15, 014007. [Google Scholar] [CrossRef]
  44. Imbrenda, V.; Coluzzi, R.; Lanfredi, M.; Loperte, A.; Satriani, A.; Simoniello, T. Analysis of landscape evolution in a vulnerable coastal area under natural and human pressure. Geomat. Nat. Haz. Risk 2018, 9, 1249–1279. [Google Scholar] [CrossRef]
  45. Zhang, Y.; Hartemink, A.E.; Vanwalleghem, T.; Bonfatti, B.R.; Moen, S. Climate and land use changes explain variation in the A horizon and soil thickness in the United States. Commun. Earth Environ. 2024, 5, 129. [Google Scholar] [CrossRef]
  46. Cui, J.; Liu, C.; Li, Z.; Wang, L.; Chen, X.; Ye, Z.; Fang, C. Long-term changes in topsoil chemical properties under centuries of cultivation after reclamation of coastal wetlands in the Yangtze Estuary, China. Soil Tillage Res. 2012, 123, 50–60. [Google Scholar] [CrossRef]
  47. Li, J.; Pu, L.; Zhu, M.; Zhang, J.; Li, P.; Dai, X.; Xu, Y.; Liu, L. Evolution of soil properties following reclamation in coastal areas: A review. Geoderma 2014, 226, 130–139. [Google Scholar] [CrossRef]
  48. Yang, R.; Song, S.; Chen, S.; Du, Z.; Kong, J. Adaptive evaluation of green manure rotation for a low fertility farmland system: Impacts on crop yield, soil nutrients, and soil microbial community. Catena 2023, 222, 106873. [Google Scholar] [CrossRef]
  49. Liu, H.; Deng, Y.; Liu, X. The contribution of forest and grassland change was greater than that of cropland in human-induced vegetation greening in China, especially in regions with high climate variability. Sci. Total Environ. 2021, 792, 148408. [Google Scholar] [CrossRef] [PubMed]
  50. Bununu, Y.; Bello, A.; Ahmed, A. Land cover, land use, climate change and food security. Sustain. Earth Rev. 2023, 6, 16. [Google Scholar] [CrossRef]
  51. Burden, A.; Garbutt, A.; Evans, C.D. Effect of restoration on saltmarsh carbon accumulation in Eastern England. Biol. Lett. 2019, 15, 20180773. [Google Scholar] [CrossRef]
  52. Wang, Z.; Liu, K. Effect of Intertidal Vegetation (Suaeda salsa) Restoration on Microbial Diversity in the Offshore Areas of the Yellow River Delta. Plants 2024, 13, 213. [Google Scholar] [CrossRef]
  53. Wen, Y.; Bernhardt, E.S.; Deng, W.; Liu, W.; Yan, J.; Baruch, E.M.; Bergemann, C.M. Salt effects on carbon mineralization in southeastern coastal wetland soils of the United States. Geoderma 2019, 339, 31–39. [Google Scholar] [CrossRef]
  54. Cai, Y.; Zhang, F.; Duan, P.; Jim, C.Y.; Chan, N.W.; Shi, J.; Liu, C.; Wang, J.; Bahtebay, J.; Ma, X. Vegetation cover changes in China induced by ecological restoration-protection projects and land-use changes from 2000 to 2020. Catena 2022, 217, 106530. [Google Scholar] [CrossRef]
  55. Radočaj, D.; Šiljeg, A.; Marinović, R.; Jurišić, M. State of major vegetation indices in precision agriculture studies indexed in web of science: A review. Agriculture 2023, 13, 707. [Google Scholar] [CrossRef]
  56. Brown, J.C.; Kastens, J.H.; Coutinho, A.C.; Victoria, D.d.C.; Bishop, C.R. Classifying multiyear agricultural land use data from Mato Grosso using time-series MODIS vegetation index data. Remote Sens. Environ. 2013, 130, 39–50. [Google Scholar] [CrossRef]
  57. Li, G.; Zhang, F.; Jing, Y.; Liu, Y.; Sun, G. Response of evapotranspiration to changes in land use and land cover and climate in China during 2001–2013. Sci. Total Environ. 2017, 596, 256–265. [Google Scholar] [CrossRef] [PubMed]
  58. Gaw, L.Y.-F.; Richards, D.R. Development of spontaneous vegetation on reclaimed land in Singapore measured by NDVI. PLoS ONE 2021, 16, e0245220. [Google Scholar] [CrossRef]
  59. Smith, H.W.; Ashworth, A.J.; King, S.; Kreman, C.; Miller, D.M.; Nalley, L.L.; Owens, P.R. Remote sensing reveals trends in vegetative recovery and land cover transformation post-reclamation at tar creek superfund site. Discov. Geosci. 2024, 2, 53. [Google Scholar] [CrossRef]
  60. Van Asselen, S.; Verburg, P.H. Land cover change or land-use intensification: Simulating land system change with a global-scale land change model. Glob. Change Biol. 2013, 19, 3648–3667. [Google Scholar] [CrossRef]
  61. Huete, A.; Didan, K.; Miura, T.; Rodriguez, E.P.; Gao, X.; Ferreira, L.G. Overview of the radiometric and biophysical performance of the MODIS vegetation indices. Remote Sens. Environ. 2002, 83, 195–213. [Google Scholar] [CrossRef]
  62. Pettorelli, N.; Vik, J.O.; Mysterud, A.; Gaillard, J.-M.; Tucker, C.J.; Stenseth, N.C. Using the satellite-derived NDVI to assess ecological responses to environmental change. Trends Ecol. Evol. 2005, 20, 503–510. [Google Scholar] [CrossRef] [PubMed]
  63. Wang, G.; Wang, M.; Xue, Z.; Ren, Z.; Jiang, M.; Otte, M. Vegetation regulates element composition of soils by enhancing organic matter accumulation in the salt marshes of liao river delta, China. Front. Mar. Sci. 2022, 9, 888605. [Google Scholar] [CrossRef]
  64. Arif, Y.; Singh, P.; Siddiqui, H.; Bajguz, A.; Hayat, S. Salinity induced physiological and biochemical changes in plants: An omic approach towards salt stress tolerance. Plant Physiol. Biochem. 2020, 156, 64–77. [Google Scholar] [CrossRef]
  65. Xie, W.; Yang, J.; Yao, R.; Wang, X. Spatial and temporal variability of soil salinity in the Yangtze River estuary using electromagnetic induction. Remote Sens. 2021, 13, 1875. [Google Scholar] [CrossRef]
  66. Rengel, Z.; Marschner, P. Nutrient availability and management in the rhizosphere: Exploiting genotypic differences. New Phytol. 2005, 168, 305–312. [Google Scholar] [CrossRef]
  67. Córdova, S.C.; Olk, D.C.; Dietzel, R.N.; Mueller, K.E.; Archontouilis, S.V.; Castellano, M.J. Plant litter quality affects the accumulation rate, composition, and stability of mineral-associated soil organic matter. Soil Biol. Biochem. 2018, 125, 115–124. [Google Scholar] [CrossRef]
  68. Kumawat, K.C.; Nagpal, S.; Sharma, P. Potential of plant growth-promoting rhizobacteria-plant interactions in mitigating salt stress for sustainable agriculture: A review. Pedosphere 2022, 32, 223–245. [Google Scholar] [CrossRef]
  69. Liu, S.; Zhang, Q.; Li, Z.; Tian, C.; Qiao, Y.; Du, K.; Cheng, H.; Chen, G.; Li, X.; Li, F. Soil salinity weakening and soil quality enhancement after long-term reclamation of different croplands in the Yellow River Delta. Sustainability 2023, 15, 1173. [Google Scholar] [CrossRef]
  70. Zhang, X.; Zhang, Z.; Wang, W.; Fang, W.-T.; Chiang, Y.-T.; Liu, X.; Ju, H. Vegetation successions of coastal wetlands in southern Laizhou Bay, Bohai Sea, northern China, influenced by the changes in relative surface elevation and soil salinity. J. Environ. Manag. 2021, 293, 112964. [Google Scholar] [CrossRef]
  71. Yu, Y.; Zhu, R.; Liu, D.; Gao, Z.; Zhao, J.; Ma, D.; Wang, L.; Rodrigo-Comino, J. Understanding the balance between soil conservation and soil water storage capacity during the process of vegetation restoration in semi-arid watersheds in the Loess Plateau, China. Land Degrad. Dev. 2023, 34, 5805–5815. [Google Scholar] [CrossRef]
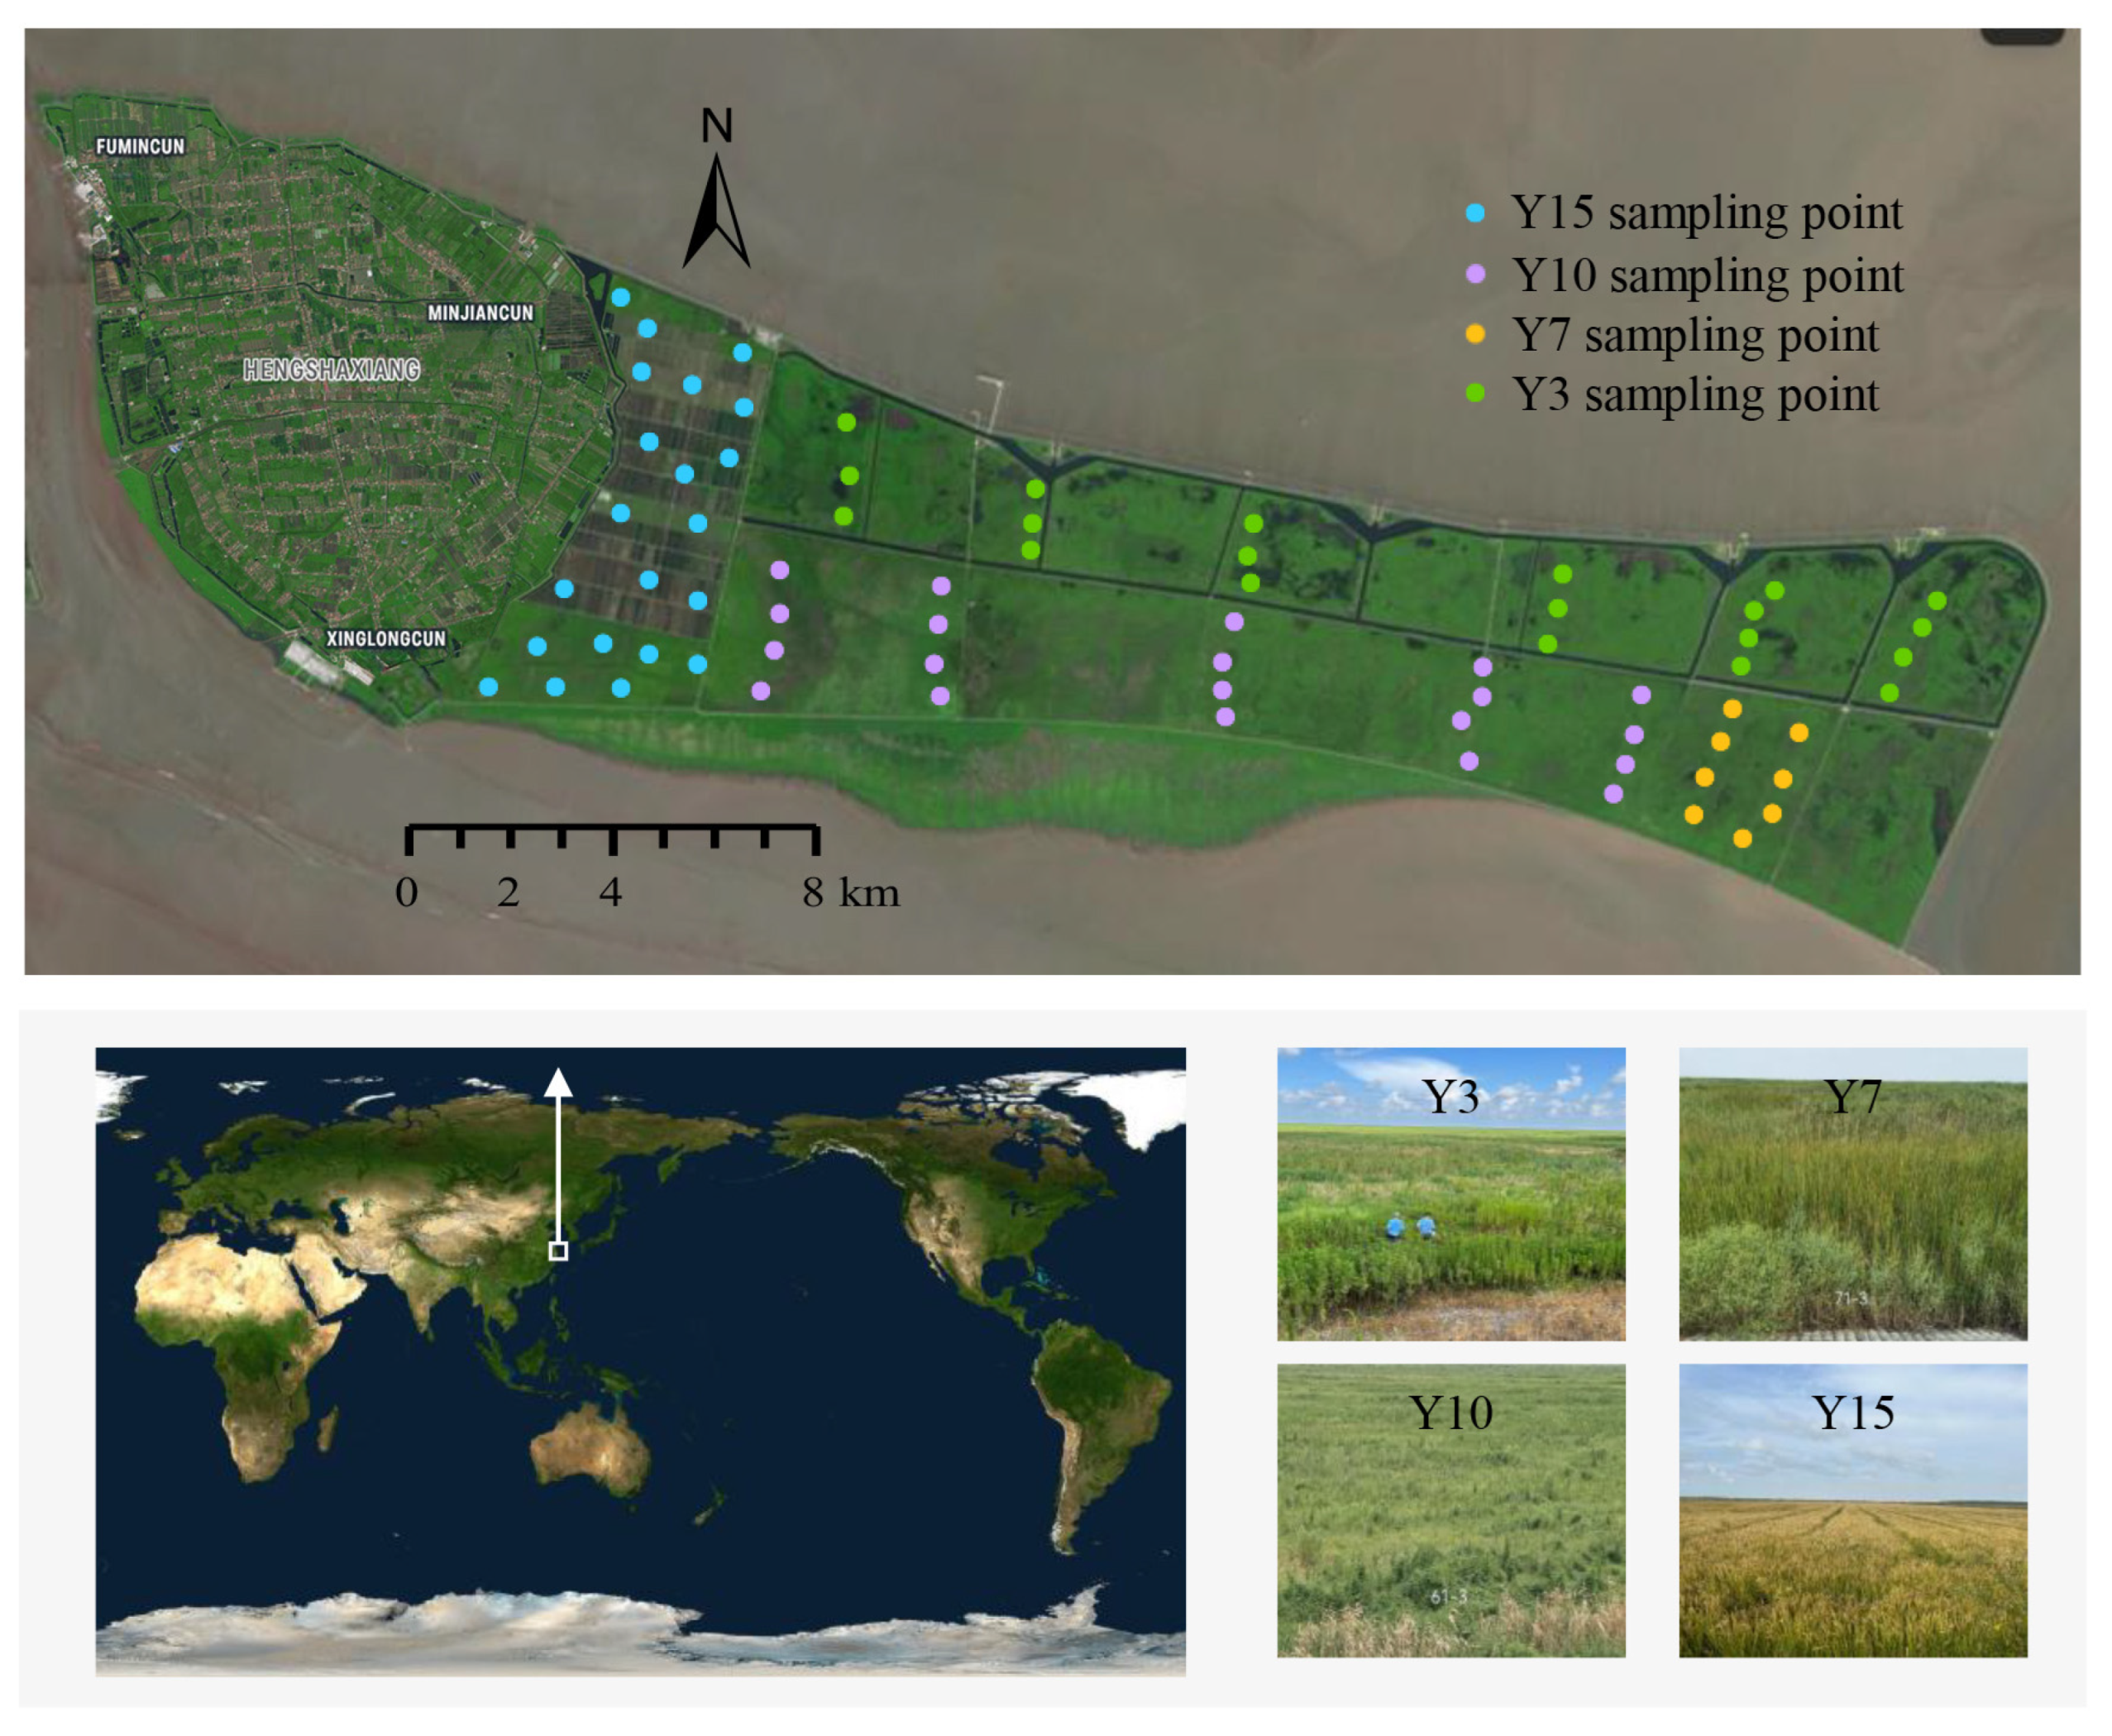
Figure 1. Map showing the spatial distribution of sampling sites.
Agriculture 15 02196 g001
Figure 2. Spatial distribution maps of soil physicochemical properties.
Agriculture 15 02196 g002
Figure 3. Soil physicochemical properties under different developmental ages of Hengsha Island. Note: Y15, Y10, Y7, and Y3 represent the reclamation for 15, 10, 7, and 3, respectively. Data were analyzed by one-way ANOVA to test the differences among groups, and the significance levels of each predictor are * p < 0.05, ** p < 0.01, and *** p < 0.001;“ns” indicates no significant difference. The boxes show the interquartile range (IQR, 25th–75th percentile), the horizontal line inside each box represents the median, and the whiskers indicate the minimum and maximum values within 1.5 × IQR. Dots beyond the whiskers represent outliers. EC: electrical conductivity; TSS: Total soil salinity; OM: organic matter; HN: hydrolyzable nitrogen; TN: total nitrogen; TP: total phosphorus; AP: available phosphorus; TK: total potassium; AK: available potassium. The same below.
Agriculture 15 02196 g003
Figure 4. Spatial distribution of NDVI (a) and FVC (b) in Hengsha Island in August 2022. Box plot of the NDVI (c) and FVC (d) of the sampling points. Data were analyzed by one-way ANOVA to test the differences among groups, and the significance levels of each predictor are ** p < 0.01, and *** p < 0.001;“ns” indicates no significant difference. The boxes show the interquartile range (IQR, 25th–75th percentile), the horizontal line inside each box represents the median, and the whiskers indicate the minimum and maximum values within 1.5 × IQR. Dots beyond the whiskers represent outliers.
Agriculture 15 02196 g004
Figure 5. Co-occurrence networks of NDVI, FVC, and soil properties across reclamation stages.
Agriculture 15 02196 g005
Figure 6. Mantel-test results showing correlations between NDVI, FVC, and properties. Data were analyzed by spearman correlation to test the differences among groups, and the significance levels of each predictor are * p < 0.05, ** p < 0.01, and *** p < 0.001.
Agriculture 15 02196 g006
Figure 7. Structural equation model (SEM) showing the influence of soil physicochemical properties on NDVI. The significance levels of each predictor are * p < 0.05, ** p < 0.01, and *** p < 0.001.
Agriculture 15 02196 g007
Table 1. Construction time, formation time, and soil characteristics of different areas on Hengsha Island.
AreaReclamation ProjectConstruction TimeDevelopment TimeNumber of Sample PointsSoil GroupSoil Characteristics
Long-term recoveryZone 32005–201015 years (Y15)21Paddy soilTopsoil induced through rice cultivation
Mid-term recoveryZone 62011–201510 years (Y10)20Coastal solonchaksNative topsoil, transitioning towards more fertile soils with reduced
Short-term recoveryZone 72015–20177 years (Y7)8Coastal solonchaksNative topsoil, saline, undergoing natural recovery
New reclamationZone 82016–20213 years (Y3)20Coastal solonchaksNewly formed soils, highly saline and barren
Disclaimer/Publisher’s Note: The statements, opinions and data contained in all publications are solely those of the individual author(s) and contributor(s) and not of MDPI and/or the editor(s). MDPI and/or the editor(s) disclaim responsibility for any injury to people or property resulting from any ideas, methods, instructions or products referred to in the content.