Article

Non-Invasive Inversion and Characteristic Analysis of Soil Moisture in 0–300 cm Agricultural Soil Layers

1
College of Software, Shanxi Agricultural University, Jinzhong 030801, China
2
College of Agricultural Engineering, Shanxi Agricultural University, Jinzhong 030006, China
3
School of Public Administration, Shanxi University of Finance and Economics, Taiyuan 030801, China
*
Authors to whom correspondence should be addressed.
Agriculture 2025, 15(20), 2143; https://doi.org/10.3390/agriculture15202143
Submission received: 8 September 2025 / Revised: 13 October 2025 / Accepted: 13 October 2025 / Published: 15 October 2025
(This article belongs to the Section Agricultural Soils)

Abstract

Accurate profiling of deep (20–300 cm) soil moisture is crucial for precision irrigation but remains technically challenging and costly at operational scales. We systematically benchmark eight regression algorithms—including linear regression, Lasso, Ridge, elastic net, support vector regression, multi-layer perceptron (MLP), random forest (RF), and gradient boosting trees (GBDT)—that use easily accessible inputs of 0–20 cm surface soil moisture (SSM) and ten meteorological variables to non-invasively infer soil moisture at fourteen 20 cm layers. Data from a typical agricultural site in Wenxi, Shanxi (2020–2022), were divided into training and testing datasets based on temporal order (2020–2021 for training, 2022 for testing) and standardized prior to modeling. Across depths, non-linear ensemble models significantly outperform linear baselines. Ridge Regression achieves the highest accuracy at 0–20 cm, SVR performs best at 20–40 cm, and MLP yields consistently optimal performance across deep layers from 60 cm to 300 cm (R2 = 0.895–0.978, KGE = 0.826–0.985). Although ensemble models like RF and GBDT exhibit strong fitting ability, their generalization performance under temporal validation is relatively limited. Model interpretability combining SHAP, PDP, and ALE shows that surface soil moisture is the dominant predictor across all depths, with a clear attenuation trend and a critical transition zone between 160 and 200 cm. Precipitation and humidity primarily drive shallow to mid-layers (20–140 cm), whereas temperature variables gain relative importance in deeper profiles (200–300 cm). ALE analysis eliminates feature correlation biases while maintaining high predictive accuracy, confirming surface-to-deep information transmission mechanisms. We propose a depth-adaptive modeling strategy by assigning the best-performing model at each soil layer, enabling practical non-invasive deep soil moisture prediction for precision irrigation and water resource management.

1. Introduction

Soil moisture, as a core variable in agricultural ecosystems, pervades crop growth, evapotranspiration regulation, water migration, and agricultural management throughout the entire cycle, having fundamental impacts on agricultural productivity and ecological balance [1,2]. Among these, deep soil moisture not only regulates root zone water supply and buffers drought stress, but also plays an irreplaceable role in groundwater recharge, regional water cycling, and scientific irrigation management [3,4,5]. However, compared to surface soil moisture, deep soil moisture exhibits stronger spatial heterogeneity, slower change processes, and has long been constrained by technical bottlenecks such as sampling difficulties, high costs, and poor representativeness in observation methods. This has resulted in a serious long-term shortage of deep soil moisture observation data in terms of spatiotemporal resolution and sample quantity, severely restricting the development of related mechanistic research and management practices [6,7].
Currently, deep soil moisture monitoring mainly relies on traditional methods such as in situ probes, soil auger sampling, resistivity/capacitance methods, and neutron counting. Although these methods have certain advantages in fine-scale measurement, they generally suffer from operational complexity, high costs, limited spatial representativeness, and difficulties in achieving long-term, continuous, and large-scale automated monitoring [8,9]. In contrast, meteorological observations and surface soil moisture data have become important data resources for digital agriculture due to their convenient acquisition, wide coverage, and high spatiotemporal resolution. How to utilize this easily accessible information through advanced data-driven methods such as machine learning to achieve high-precision non-invasive inversion of deep soil moisture has become one of the key technological pathways for promoting the intelligent and precision development of smart agricultural monitoring systems.
Existing research indicates that surface soil moisture, as an immediate indicator of agricultural moisture dynamic changes, can not only reflect the moisture status of the surface layer, but also often correlates with deep soil moisture, especially under specific climate and soil conditions where its fluctuations can provide effective information for deep moisture prediction [10,11,12]. Additionally, meteorological factors such as precipitation, potential evapotranspiration, wind speed, air temperature, and radiation play dominant roles in soil moisture supply and consumption, exhibiting complex lag and non-linear responses across different time scales and depth layers. The synergistic driving of these multi-source variables provides a rich data foundation for deep soil moisture modeling [13,14]. However, most current related research still mainly focuses on surface or shallow soil moisture simulation and inversion, with relatively weak research on systematic modeling of 0–300 cm full-profile deep moisture, model performance patterns with depth variation, input variable mechanism effects, and interpretability aspects, requiring urgent in-depth exploration [15].
In recent years, machine learning methods have made significant progress in environmental modeling, being widely applied to complex multi-variable tasks such as soil property prediction, remote sensing inversion, and crop yield estimation [16,17,18]. Compared to traditional statistical regression models, machine learning has outstanding advantages in handling high-dimensional multi-variable inputs and complex non-linear relationships, demonstrating excellent adaptability and high-precision performance in fields such as soil moisture prediction [19,20,21]. Non-linear ensemble models represented by random forest, gradient boosting trees, and multi-layer perceptron can achieve robust modeling and good generalization of multi-layer soil moisture, becoming mainstream modeling tools. However, existing research mostly focuses on overall model prediction accuracy, lacking systematic comparison of various algorithm performances at different depth layers and in-depth analysis of prediction mechanisms and feature contributions. Due to the lack of interpretability in traditional machine learning models, domain experts still have concerns about model trust and application promotion. In recent years, the emergence of interpretability analysis methods such as SHAP (SHapley Additive exPlanations) and PDP (Partial Dependence Plot) has provided new approaches to breaking the “black box” dilemma. SHAP quantitatively reveals the contribution magnitude and direction of each input variable to model output through game theory Shapley values, suitable for interpreting various non-linear models; PDP can characterize the response relationship between specific variables and prediction results when controlling other variable constants, helping identify non-linear and interactive mechanisms between inputs and outputs [22,23,24,25]. ALE further addresses the limitation of feature correlation biases inherent in meteorological datasets by computing unbiased marginal effects through local derivatives, making it particularly valuable for environmental modeling where variables naturally exhibit strong intercorrelations [26,27]. The integrated application of both helps balance model prediction accuracy with mechanism transparency, especially suitable for mining complex depth coupling relationships between deep soil moisture and meteorological variables.
Therefore, this study takes a typical agricultural area in Yuncheng City, Shanxi Province, as a case study, systematically integrating 0–20 cm surface soil moisture and ten major meteorological variables to construct and compare eight mainstream machine learning regression models, achieving high-resolution non-invasive inversion of deep soil moisture across 14 depth layers in the 0–300 cm profile. To overcome the interpretability limitations of traditional “black box” models, this research introduces three complementary interpretation methods—SHAP, PDP, and ALE—to quantitatively reveal the predictive contributions of different input features at various depth layers and their non-linear response patterns, thereby deeply analyzing the depth dependence and variable action pathways of soil–meteorological coupling mechanisms. Model performance is comprehensively evaluated using five complementary metrics (R2, RMSE, MAE, NSE, KGE) to ensure robust assessment across different performance dimensions [28,29,30].
This study addresses three gaps: (i) the lack of a full-profile (20–300 cm) evaluation across diverse machine learning algorithms; (ii) insufficient transparency in how surface–meteorological signals propagate with depth; and (iii) limited guidance on depth-specific model choice for operational monitoring. We compile SSM and ten meteorological features to train eight regressors for fourteen depth layers. Beyond accuracy, we integrate SHAP, PDP, and ALE analyses to quantify feature contributions and response patterns by depth, with ALE specifically addressing correlation biases in meteorological variables. Model evaluation employs five complementary metrics (R2, RMSE, MAE, NSE, KGE) for comprehensive performance assessment. We report depth-zoned “best-model” intervals, a critical transition around 160–200 cm with threshold-driven moisture dynamics, and a three-layer environmental response pattern. We propose a depth-adaptive modeling workflow for non-invasive monitoring.

2. Materials and Methods

2.1. Overview of the Study Area

This study selected the experimental base in Wenxi County, Yuncheng City, Shanxi Province, as the research area (35°18′ N, 111°13′ E) (Figure 1). The region has a temperate continental climate with an annual average temperature of approximately 13.5 °C and annual average precipitation of approximately 550 mm, mainly concentrated in June–September. The soil types are mainly loam and sandy loam, with typical characteristics of the Loess Plateau transition zone, suitable for conducting soil moisture monitoring and modeling research.
During the growing season (May to September) of each year from 2020 to 2022, soil sampling was conducted once per week, with approximately 8 to 10 soil profiles collected each time using a soil auger (Yangling Zhizao Soil and Water Conservation Instrument Factory, Xianyang, Shaanxi, China). Each profile extended from the surface to a depth of 300 cm and was segmented into multiple layers for gravimetric soil moisture measurement. In total, 543 soil profile samples were collected over the three-year period. All sampling points were randomly distributed across the experimental field to ensure spatial representativeness, and no sampling location was reused.

2.2. Data Collection and Preprocessing

2.2.1. Soil Data Collection and Processing

Soil samples from 0 to 300 cm were collected using the auger method, and soil layer gravimetric moisture content θₘ was determined by oven-drying and weighing (Equation (1)) [31].
θ m = m 2 m 3 m 3 m 1 × 100 %
where θ m is the gravimetric soil moisture content (g/g); m 1 is the weight of the aluminum box (g); m 2 is the total weight of the aluminum box with wet soil (g); and m 3 is the total weight of the aluminum box with dried soil (g).
Soil layer bulk density ρ s was collected and measured using the ring knife method (Equation (2)) [32].
ρ s = m 4 m 5 V
where ρ s is the soil bulk density (g·cm−3); m 4 is the weight of the ring knife with dry soil (g); m 5 is the weight of the ring knife (g); and V is the volume of the ring knife (cm3).
Gravimetric moisture content was converted to volumetric moisture content (Equation (3)) [33].
θ m = θ v ρ s × 100 %
where θ v is the volumetric soil moisture content (%).
Soil bulk density is shown in Table 1.

2.2.2. Meteorological Data Acquisition

Meteorological data were obtained from a small automatic weather station deployed at the experimental base, with daily recording frequency. Collected variables included average temperature (°C), maximum temperature (°C), minimum temperature (°C), surface temperature (°C), precipitation (mm), relative humidity (%), 2 m wind speed (m/s), net solar radiation (J/m2), sunshine duration (h, daily maximum), and potential evapotranspiration (mm). To reduce daily fluctuation effects and extract representative climate signals, different variables were processed with differentiated moving averages according to their impact characteristics on soil moisture. Precipitation, potential evapotranspiration, and net solar radiation used 5-day moving averages to reflect accumulation and lag effects; temperature, surface temperature, relative humidity, wind speed, and sunshine duration used 7-day moving averages to preserve short-term dynamic information. All meteorological data were temporally aligned with 0–20 cm layer soil moisture observations to ensure input feature completeness and meet modeling requirements.

2.3. Multi-Model Construction and Systematic Performance Evaluation

To comprehensively evaluate the adaptability and generalization ability of various machine learning algorithms in deep soil moisture profile inversion tasks, this study systematically compared eight regression models, including linear regression, Lasso, Ridge, elastic net, support vector regression, multi-layer perceptron, random forest, and gradient boosting regression trees. All model input features were the 10 meteorological variables processed by moving averages and 0–20 cm surface soil moisture, with prediction targets being 14 stratified soil moisture contents in the 20–300 cm range. The modeling dataset was based on continuous observation data from 2020 to 2022, divided into training, validation, and test sets at a 6:2:2 ratio. All features were standardized before modeling to eliminate dimensional effects, and model hyperparameters were determined through grid search optimization.
Performance evaluation used four indicators: R2, RMSE, MAE, and NSE. All results were calculated on the test set and visualized through trend curves, heat maps, etc., to intuitively display model performance differences across different depth intervals, focusing on analyzing the advantages, disadvantages, and applicability of different models in moisture inversion at different depth layers.
R 2 = 1 i = 1 n ( y i y ^ i ) 2 i = 1 n ( y i y ¯ i ) 2
R M S E = 1 n i = 1 n ( y i y ^ i ) 2
M A E = 1 n i = 1 n y i y ^ i
N S E = 1 i = 1 n ( O i P i ) 2 i = 1 n ( O i O ¯ ) 2
K G E = 1 r 1 2 + α 1 2 + β 1 2

2.4. Model Interpretability Mechanism Analysis

To enhance model transparency and scientific trustworthiness, this study introduced three complementary interpretability analysis methods: SHAP (SHapley Additive exPlanations), PDP (Partial Dependence Plot), and ALE (Accumulated Local Effects) analyses based on stratified inversion.
SHAP analysis was used to quantify the contribution magnitude and direction of each input feature in predicting soil moisture at different depths. The analysis objects were the optimal performing models at each soil depth layer (0–300 cm), calculating SHAP values for input features on test set sample prediction outputs. Features included 0–20 cm surface soil moisture and 10 meteorological variables processed by sliding windows. The positive and negative values of SHAP values measure the positive or negative contribution of features to prediction results, with absolute values reflecting variable importance.
PDP further revealed non-linear response relationships and threshold characteristics between key variables and prediction results, assisting in scientific interpretation of soil–meteorological variable multi-scale coupling mechanisms in deep profiles. PDP analysis objects were the optimal performing models at each soil depth layer, with selected variables including top-ranked features by SHAP values, such as surface soil moisture, potential evapotranspiration, wind speed, precipitation, temperature, etc. Response analysis covered the 0–300 cm soil layer profile, focusing on examining response pattern differences in each variable between different depth layers.
ALE analysis was implemented to address feature correlation biases inherent in meteorological variables, providing enhanced interpretability through unbiased feature effect estimation. Unlike PDP, ALE eliminates confounding effects of correlated features by computing local derivatives of model predictions with respect to individual features. ALE analysis was applied to optimal models at each depth layer to quantify pure marginal effects of key environmental variables (surface soil moisture, temperature, precipitation, relative humidity, wind speed, potential evapotranspiration) on deep soil moisture predictions. This method is particularly valuable for meteorological datasets where variables naturally exhibit strong intercorrelations, ensuring interpreted feature effects reflect true causal relationships rather than spurious correlations. ALE plots were generated for top-ranked features across all 14 depth layers to identify depth-specific response patterns and critical transition zones, with special attention being paid to the 160–200 cm interval, where moisture dynamics exhibit threshold-driven behavior.

3. Results

3.1. Model Construction and Evaluation

Based on surface soil moisture and meteorological data from Wenxi County, Shanxi Province, from 2020 to 2022, this study constructed and systematically compared the non-invasive prediction capabilities of eight mainstream machine learning models for soil moisture across the 20–300 cm profile (every 20 cm comprising one layer, totaling 14 layers). Data from 2020 to 2021 were used as the training set, while 2022 data served as an independent test set for temporal validation. All data were standardized before model training to eliminate dimensional effects on model prediction. To ensure methodologically consistent algorithmic comparison, standardized hyperparameter configurations were employed across all depth layers (Table 2), with parameter selection based on scikit-learn recommended defaults and preliminary sensitivity testing.
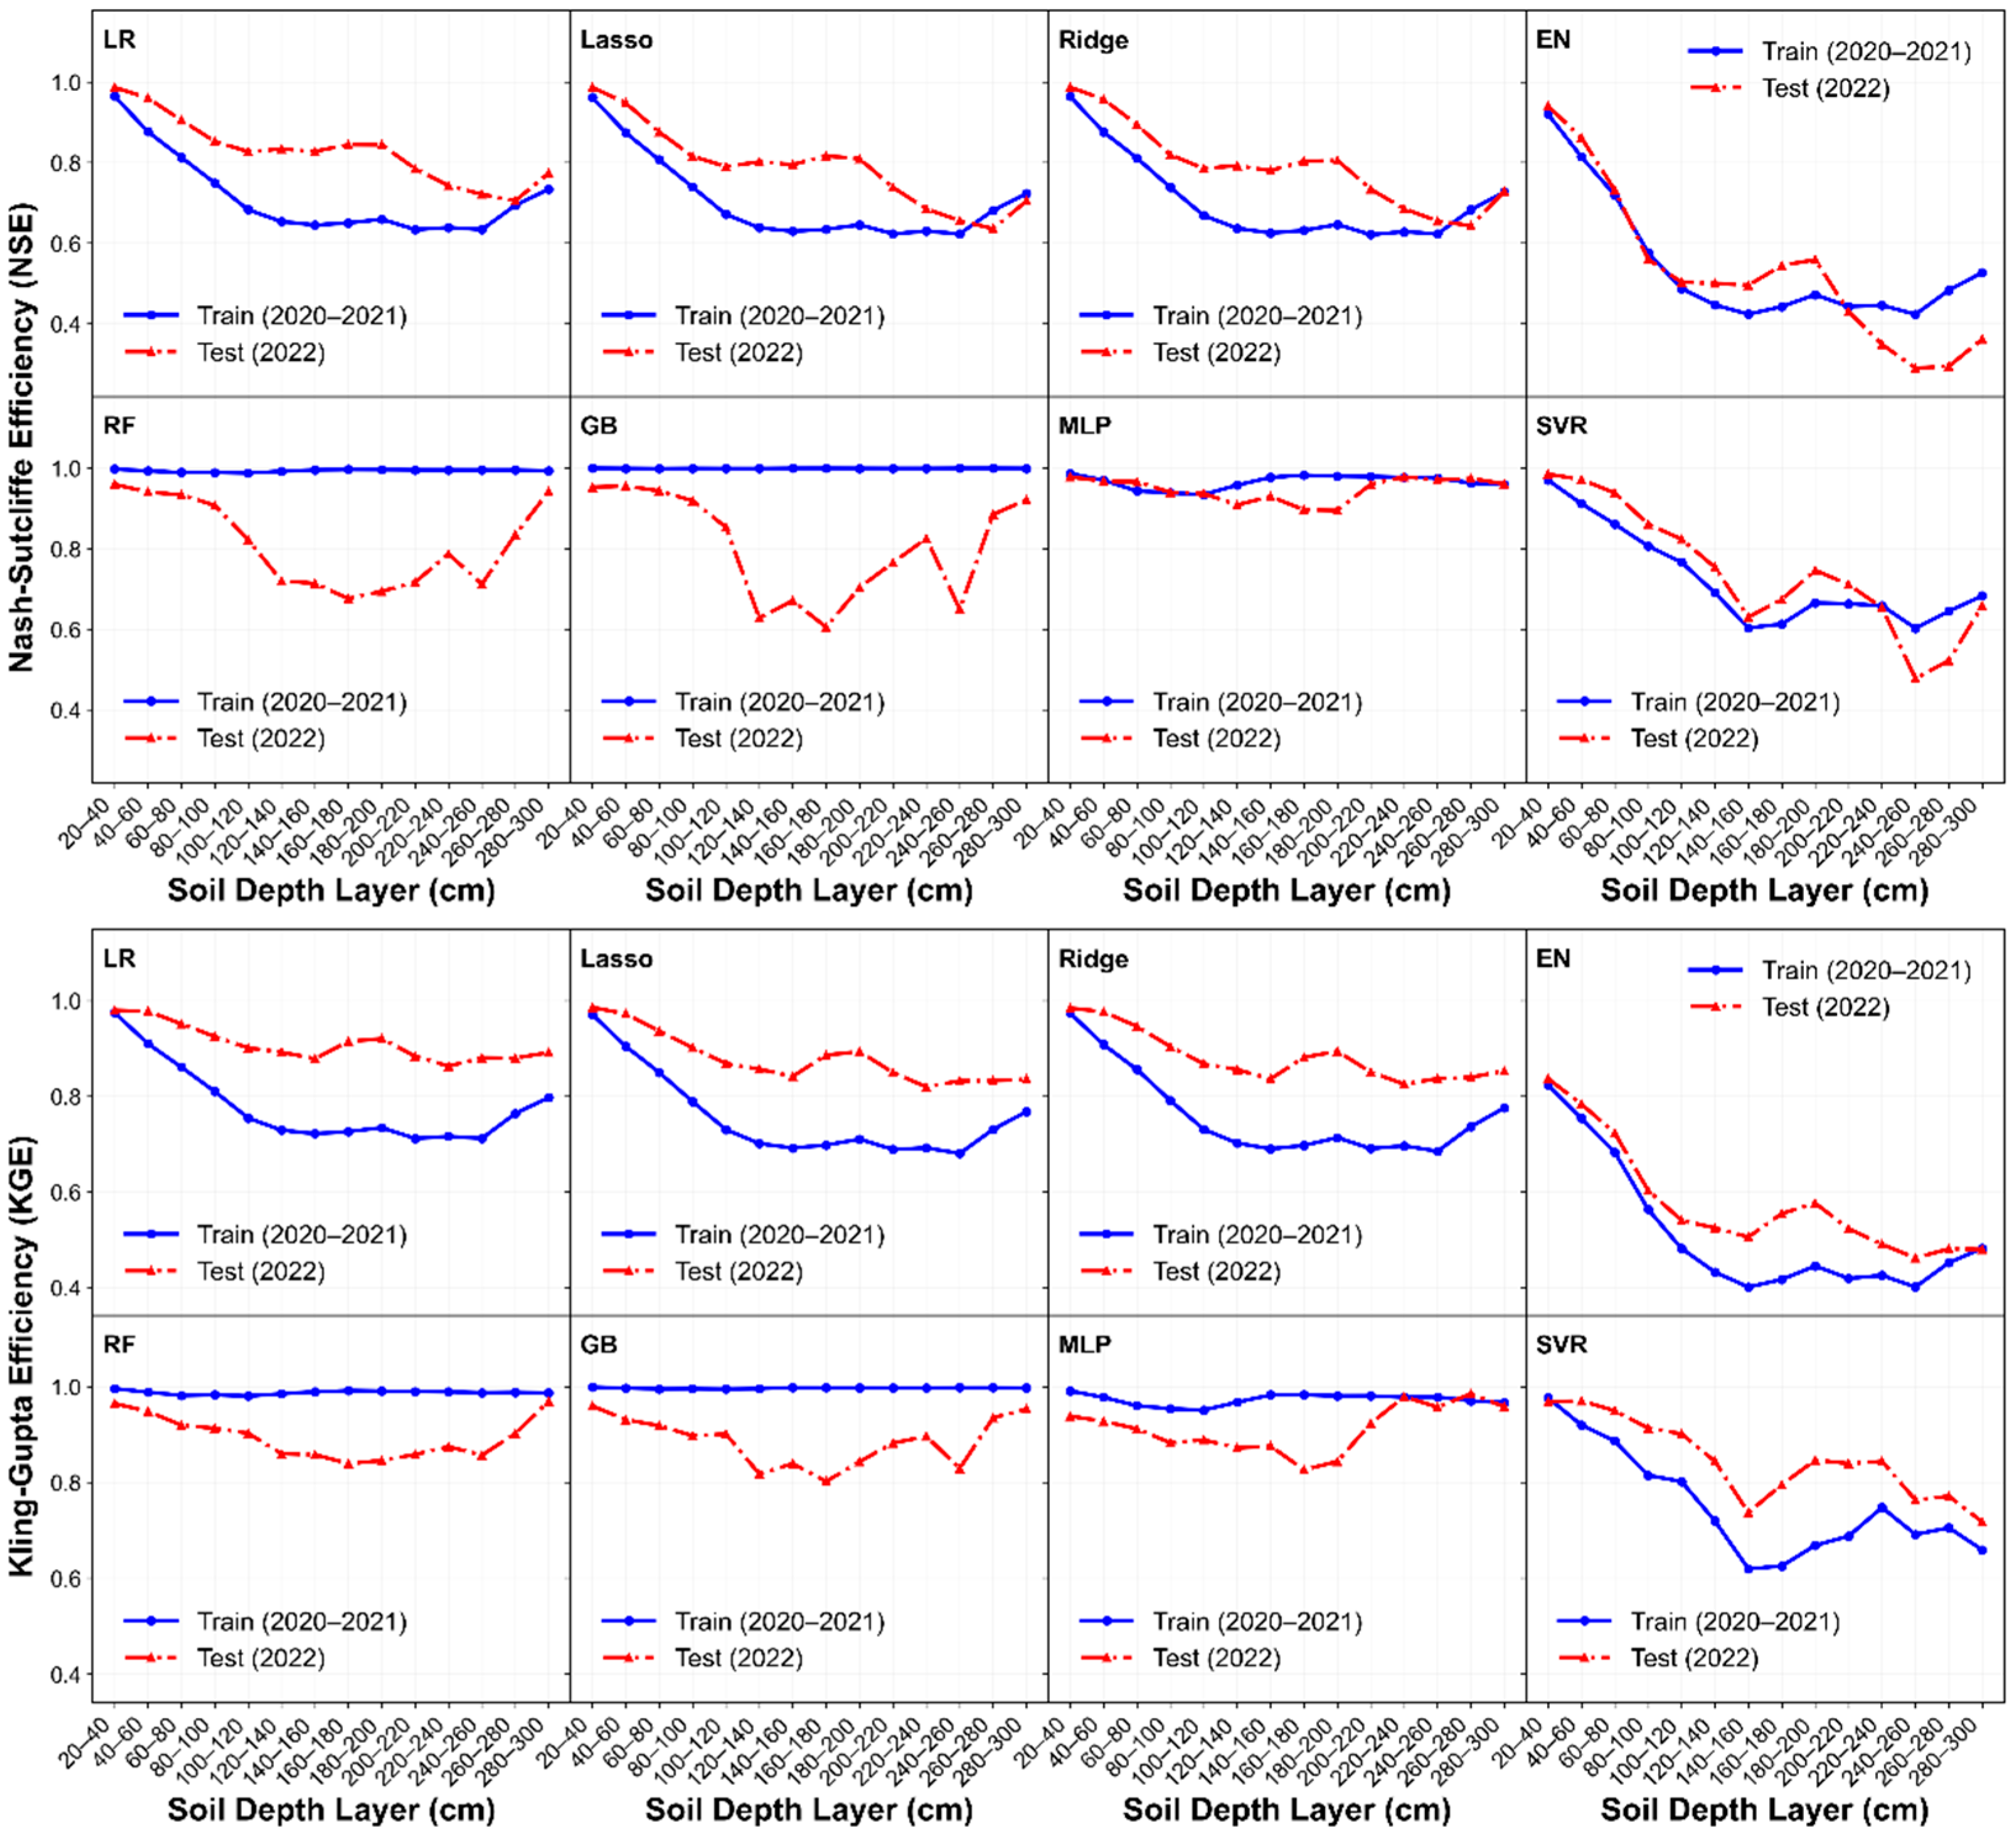
Evaluation used R2, RMSE, MAE, NSE, and KGE indicators with rigorous temporal validation (training: 2020–2021, testing: 2022). Multi-layer perceptron (MLP) demonstrated exceptional temporal generalization across the full 0–300 cm profile, achieving test performance of R2 = 0.9471, RMSE = 1.95, MAE = 1.40, NSE = 0.9471, and KGE = 0.9120. MLP exhibited remarkable depth consistency: shallow layers (20–80 cm) maintained test R2 of 0.9659–0.9779 with KGE of 0.9118–0.9383; middle layers (80–180 cm) ranged R2 0.8947–0.9399 with KGE 0.8260–0.8886; deep layers (200–300 cm) achieved peak performance with R2 of 0.9596–0.9782 and KGE of 0.9233–0.9849, particularly at 220–280 cm where KGE reached 0.9788–0.9849. Training–test curves showed minimal divergence (ΔR2 < 0.02), confirming excellent temporal generalization without overfitting.
Linear models (Linear Regression, Lasso, Ridge) showed surprisingly strong temporal generalization, with test R2 of 0.7906–0.8291 exceeding training R2 of 0.7056–0.7162. Performance patterns were depth-stratified: exceptionally high at surface layers (20–60 cm: R2 0.9601–0.9870, KGE 0.9512–0.9841, RMSE 1.13–1.88); moderate in middle layers (80–180 cm: R2 0.8270–0.8443, KGE 0.8786–0.9247, RMSE 3.41–4.10); and acceptable in deep layers (200–300 cm: R2 0.7054–0.7846, KGE 0.8626–0.8913). KGE demonstrated remarkable stability (0.86–0.98) across depths. Test performance exceeding training (test/train ratio > 1.15) indicates these models learned generalizable physical relationships rather than overfitting. Elastic Net showed catastrophic failure with test R2 collapsing to 0.5299, particularly in deep layers (220–280 cm: R2 0.2895–0.3615, KGE 0.4615–0.4902, RMSE > 6.5), indicating over-regularization prevented capturing temporal dynamics. Support vector regression showed inconsistent temporal transferability, with test R2 declining from 0.9715–0.9850 at surface layers to 0.4776–0.6736 at deep layers, demonstrating depth-dependent instability.
Ensemble models (Random Forest, Gradient Boosting) revealed severe temporal overfitting despite near-perfect training performance. While achieving training R2 of 0.9936 (RF) and 0.9992 (GB), test performance collapsed dramatically to 0.8114 and 0.8055, respectively, representing 18–20% degradation. Overfitting was catastrophic in middle-deep layers (120–200 cm): RF’s test R2 plummeted to 0.6756–0.7198 (vs. training > 0.99) with RMSE escalating to 4.79–5.47 and KGE dropping to 0.8391–0.8596; GB showed similar collapse. This indicates these models memorized 2020–2021 temporal patterns but failed to extrapolate to 2022, rendering them unsuitable for operational forecasting. The test–train KGE ratio of 0.82–0.85 (vs. 0.94 for MLP and 1.00–1.02 for linear models) quantitatively confirms poor temporal transferability.
Training–test consistency analysis revealed that MLP’s curves greatly overlapped across all metrics (ΔR2 < 0.02, ΔKGE < 0.05), demonstrating excellent generalization. Linear models showed test curves exceeding training curves, confirming learning of generalizable patterns. In contrast, ensemble models exhibited dramatic curve separation (training R2 > 0.99 vs. substantially lower test values), visualizing severe overfitting.
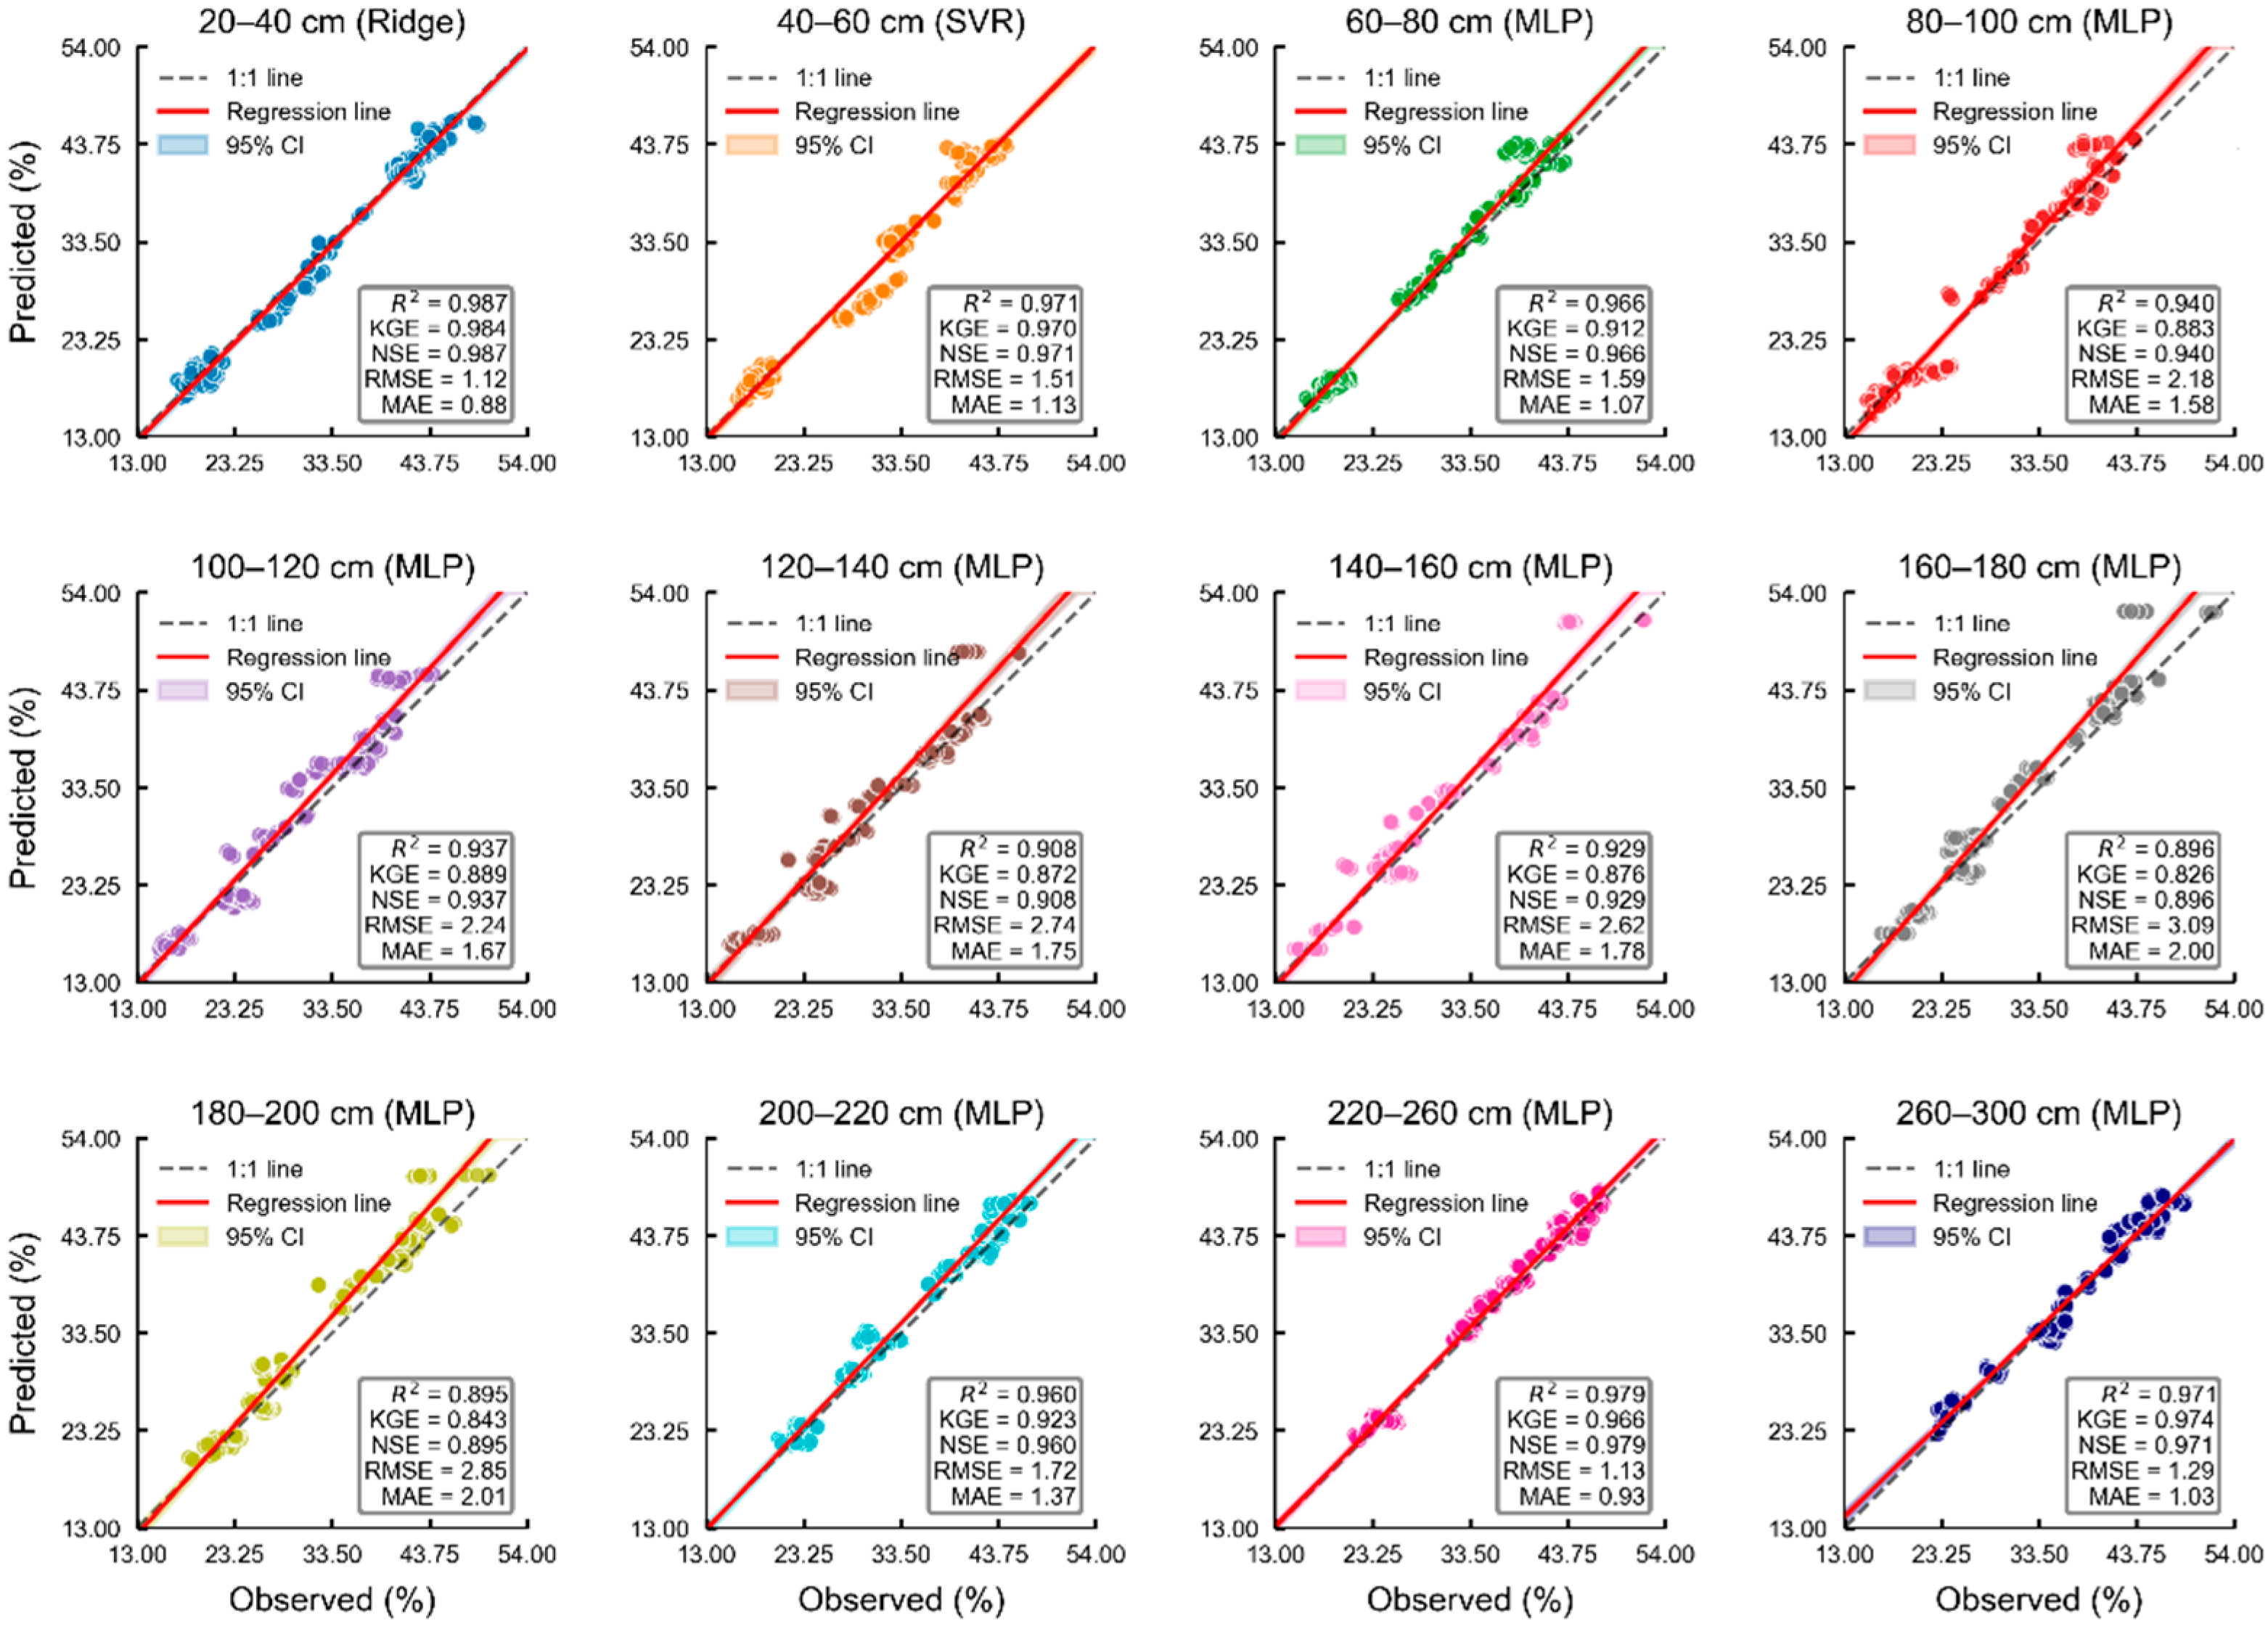
The optimal model distribution revealed clear depth-stratified advantages based on 2022 test set performance (Figure 2): linear regression dominated the 20–40 cm surface layer with test R2 of 0.9867, NSE of 0.9867, and KGE of 0.9795, effectively capturing linear atmospheric forcing; support vector regression excelled at the 40–60 cm shallow transition zone (R2 = 0.9715, KGE = 0.9705) (Figure 3), handling moderate non-linearity; multi-layer perceptron established clear superiority in the 60–200 cm middle layer interval with test R2 ranging 0.8947–0.9659 and KGE consistently maintained at 0.8260–0.9118, demonstrating best depth stability and temporal generalization; most notably, MLP achieved absolute dominance in the 200–300 cm deep layer interval with test R2 of 0.9596–0.9782 and peak KGE of 0.9233–0.9849, particularly outstanding at 220–280 cm depths (R2 0.9704–0.9782, KGE 0.9573–0.9849). KGE analysis confirmed these depth-zoned patterns, with MLP demonstrating exceptional comprehensive performance through balanced evaluation of correlation, variability, and bias components. This temporal validation framework fundamentally altered model rankings compared to random splitting: while ensemble models appeared superior under random cross-validation (R2 0.92–0.99), proper temporal validation revealed severe overfitting (test R2 0.81), whereas MLP’s moderate training performance (R2 0.9658) translated to superior real-world predictive capability (test R2 0.9471). This finding provides the first depth-stratified model selection standards based on rigorous temporal validation for complex agricultural 0–300 cm full-profile soil moisture prediction, establishing a scientific foundation for integrated operational forecasting systems and depth-adaptive model selection strategies.
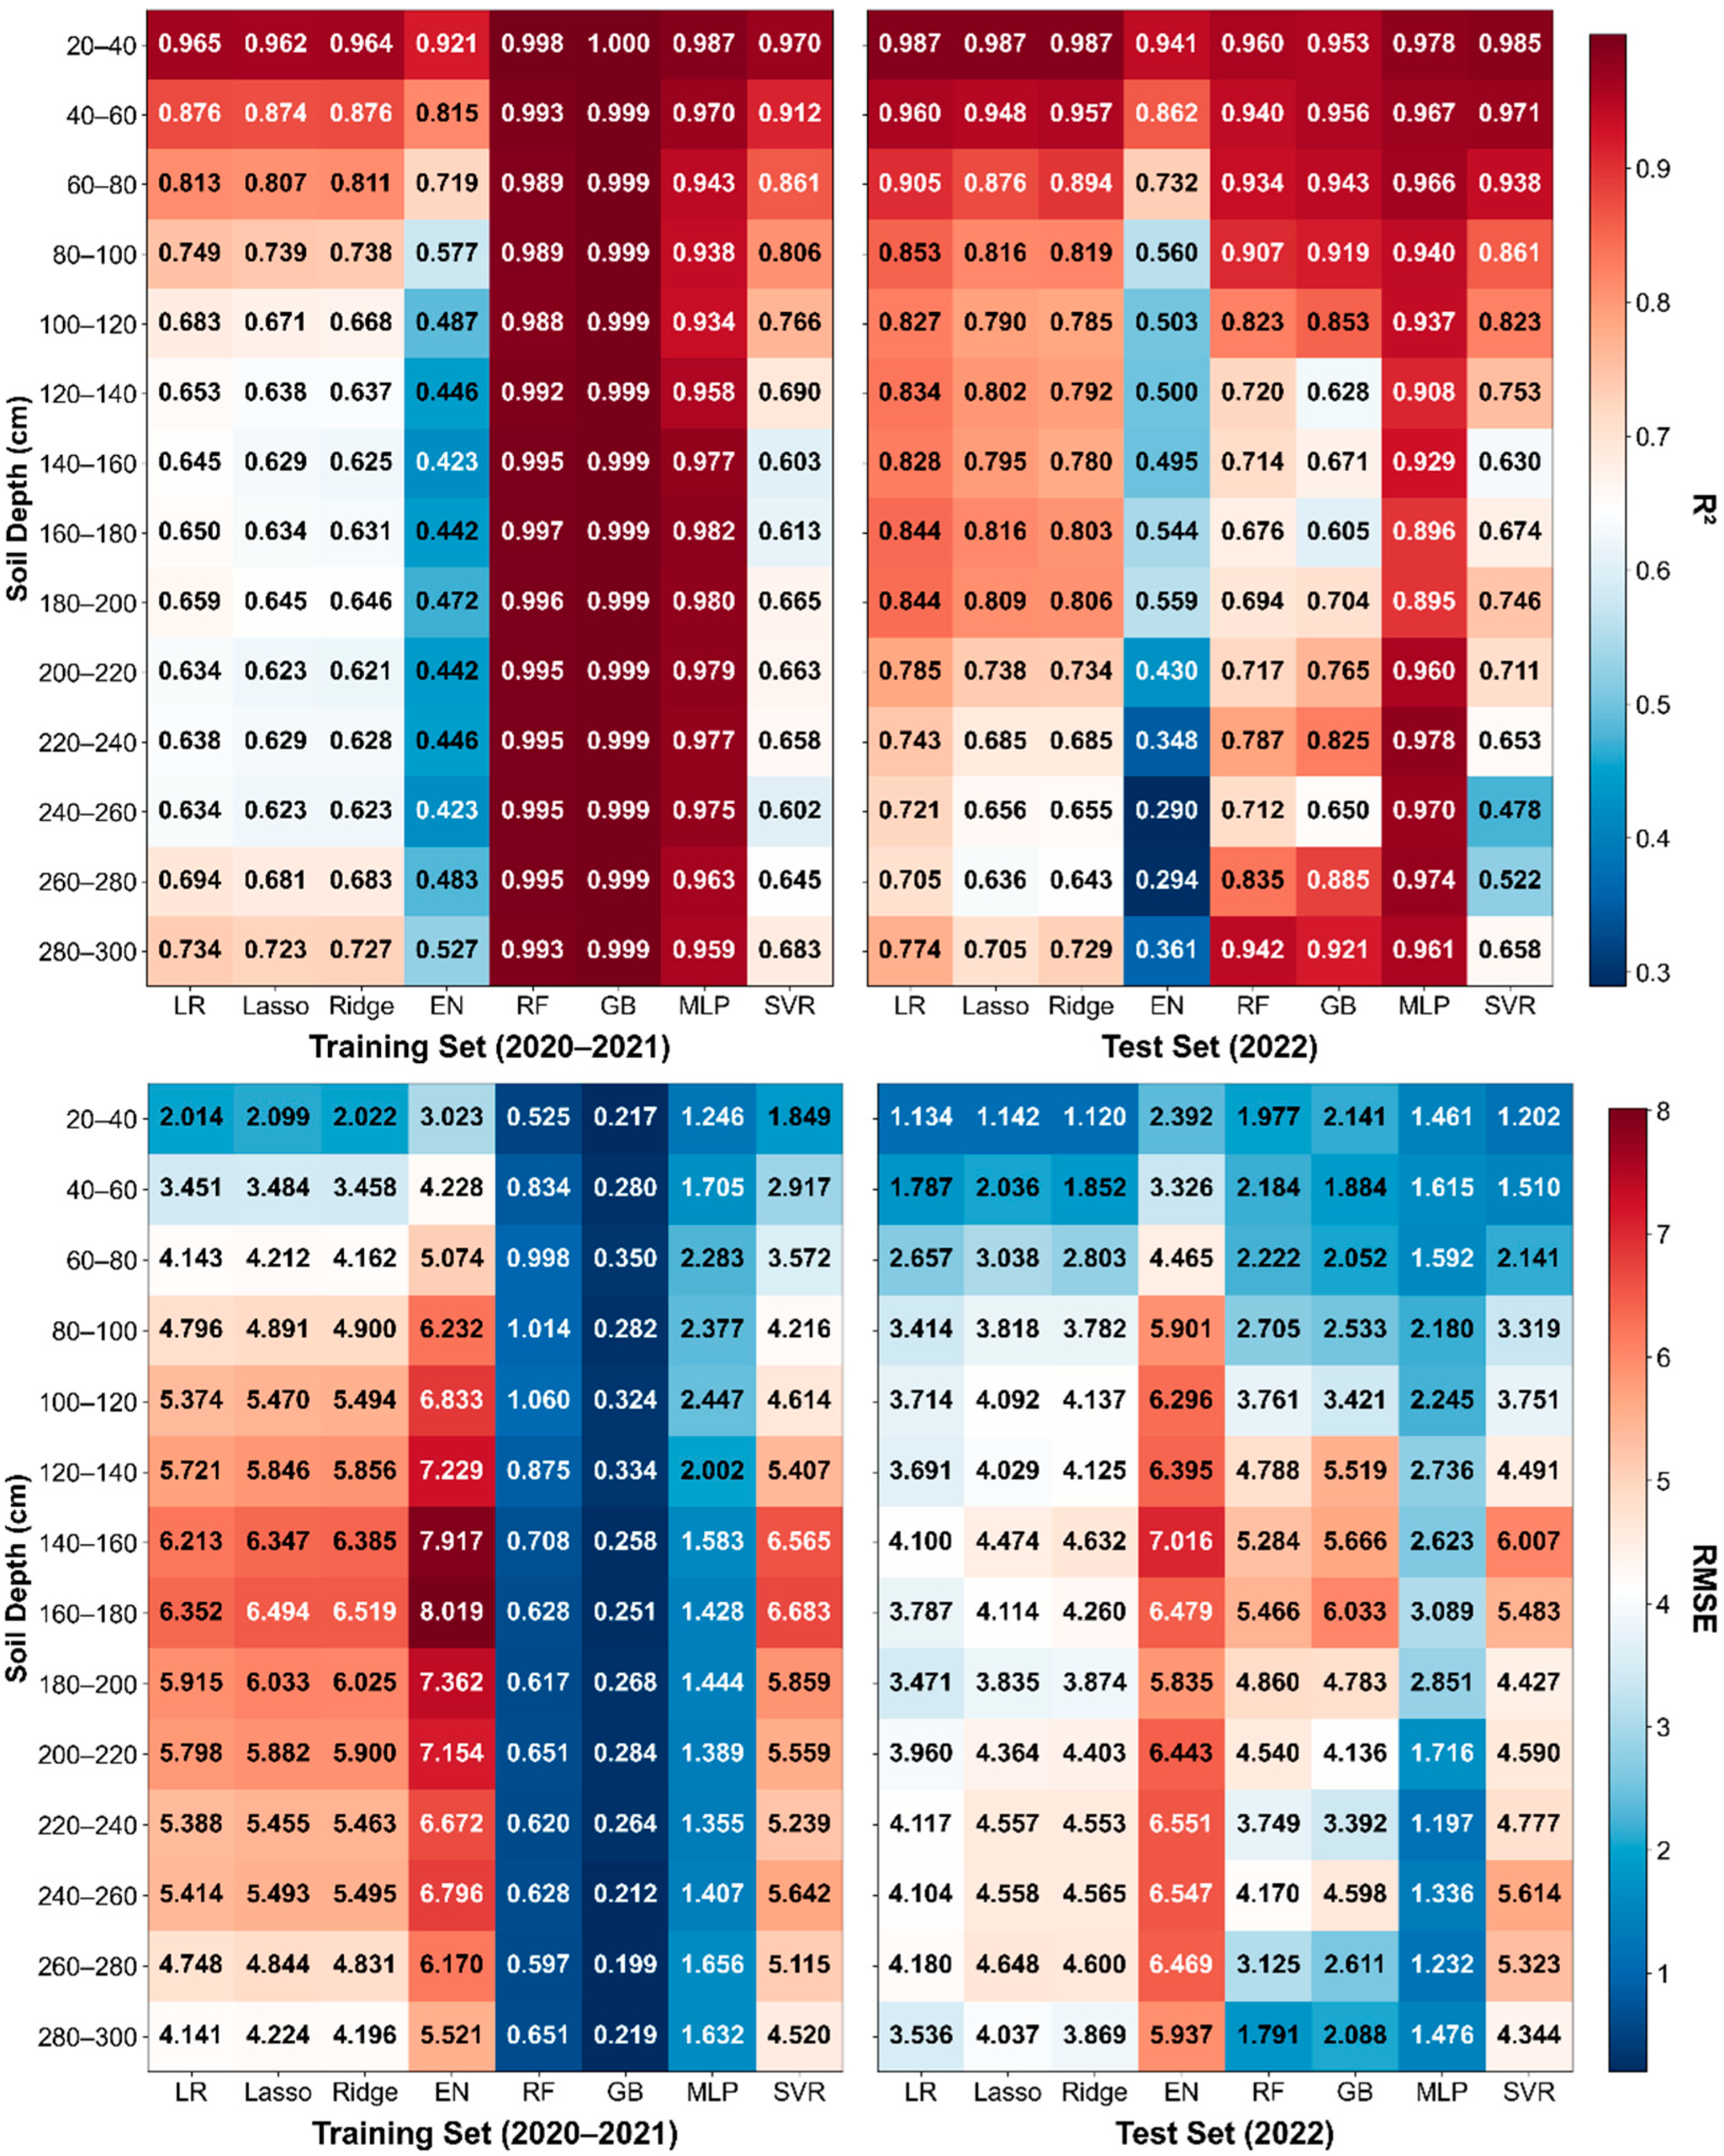
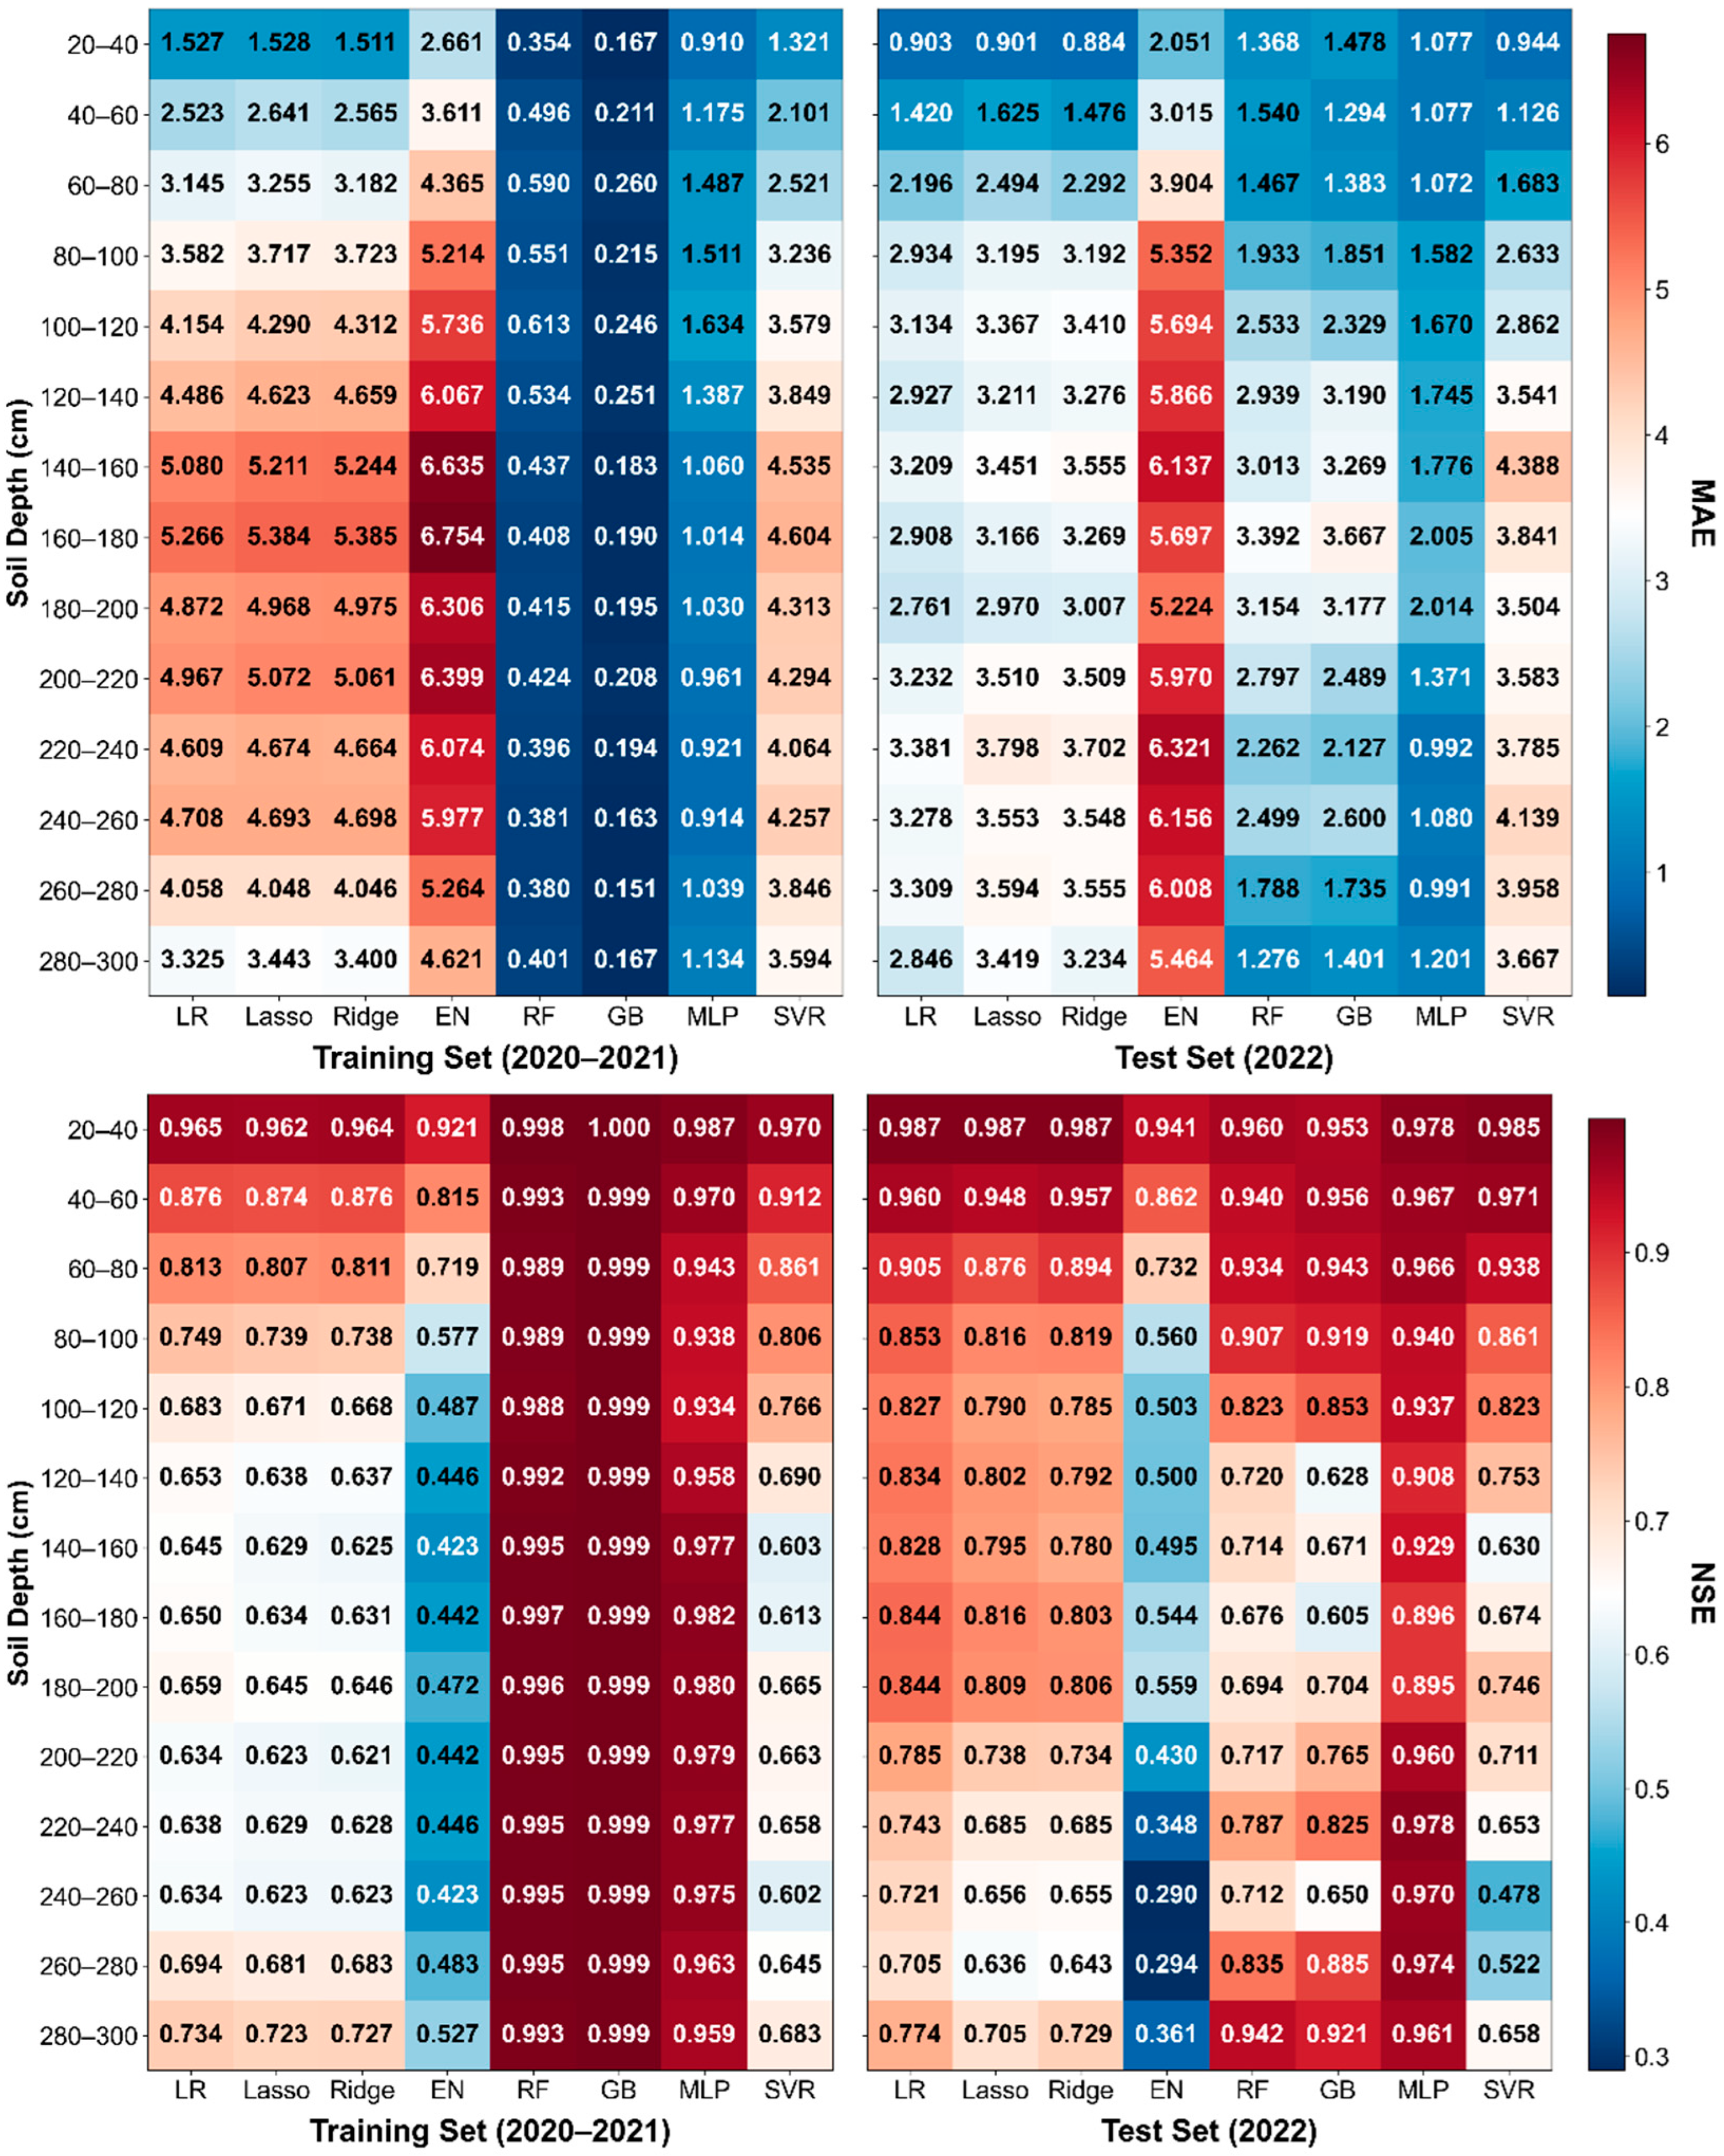
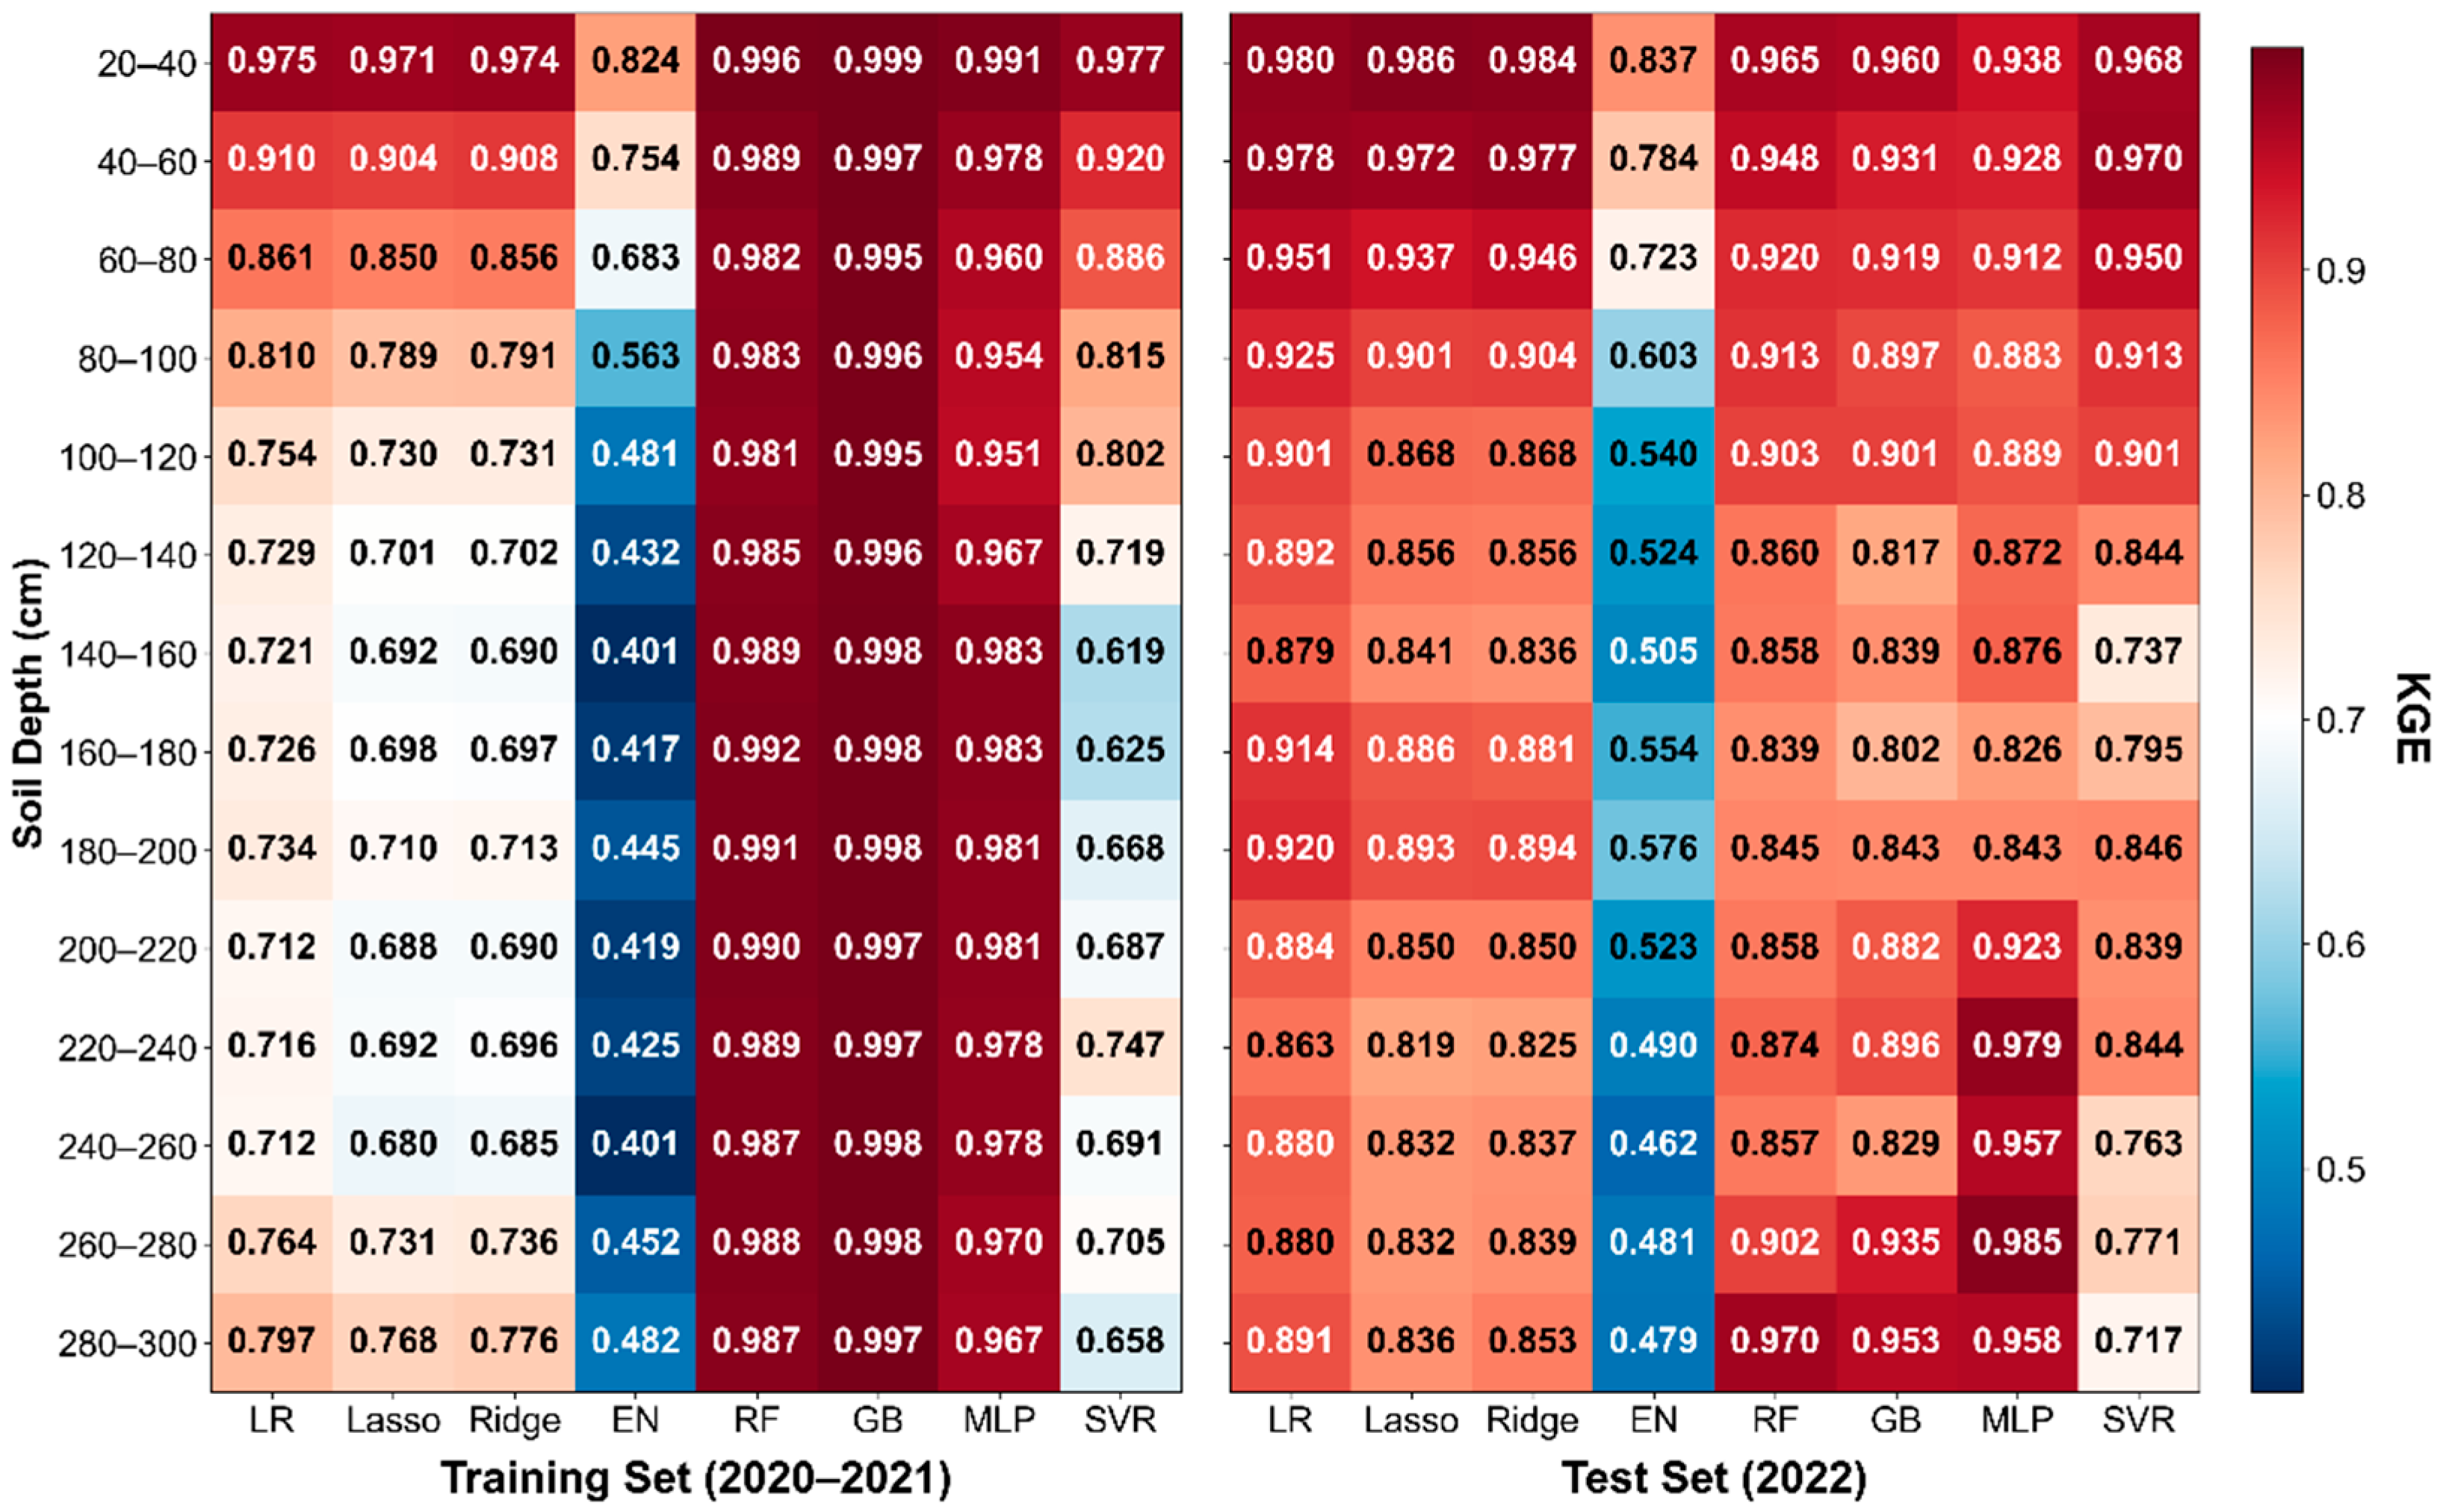
The performance evaluation of eight machine learning models across 14 soil depth layers (20–300 cm) under temporal validation is shown in Figure 4, displaying R2, RMSE, MAE, NSE, and KGE metrics for the training set (2020–2021) and test set (2022). MLP dominated test set performance, achieving optimal R2 in 10 out of 14 depth layers: shallow layers (20–80 cm: R2 0.966–0.978), middle layers (80–180 cm: R2 0.895–0.940), and deep layers (200–280 cm: R2 0.960–0.974), where other models degraded. Linear regression excelled at surface layers (20–40 cm: R2 0.987), and SVR at 40–60 cm (R2 0.971).

3.2. Model Interpretability and Variable Action Mechanism Revelation

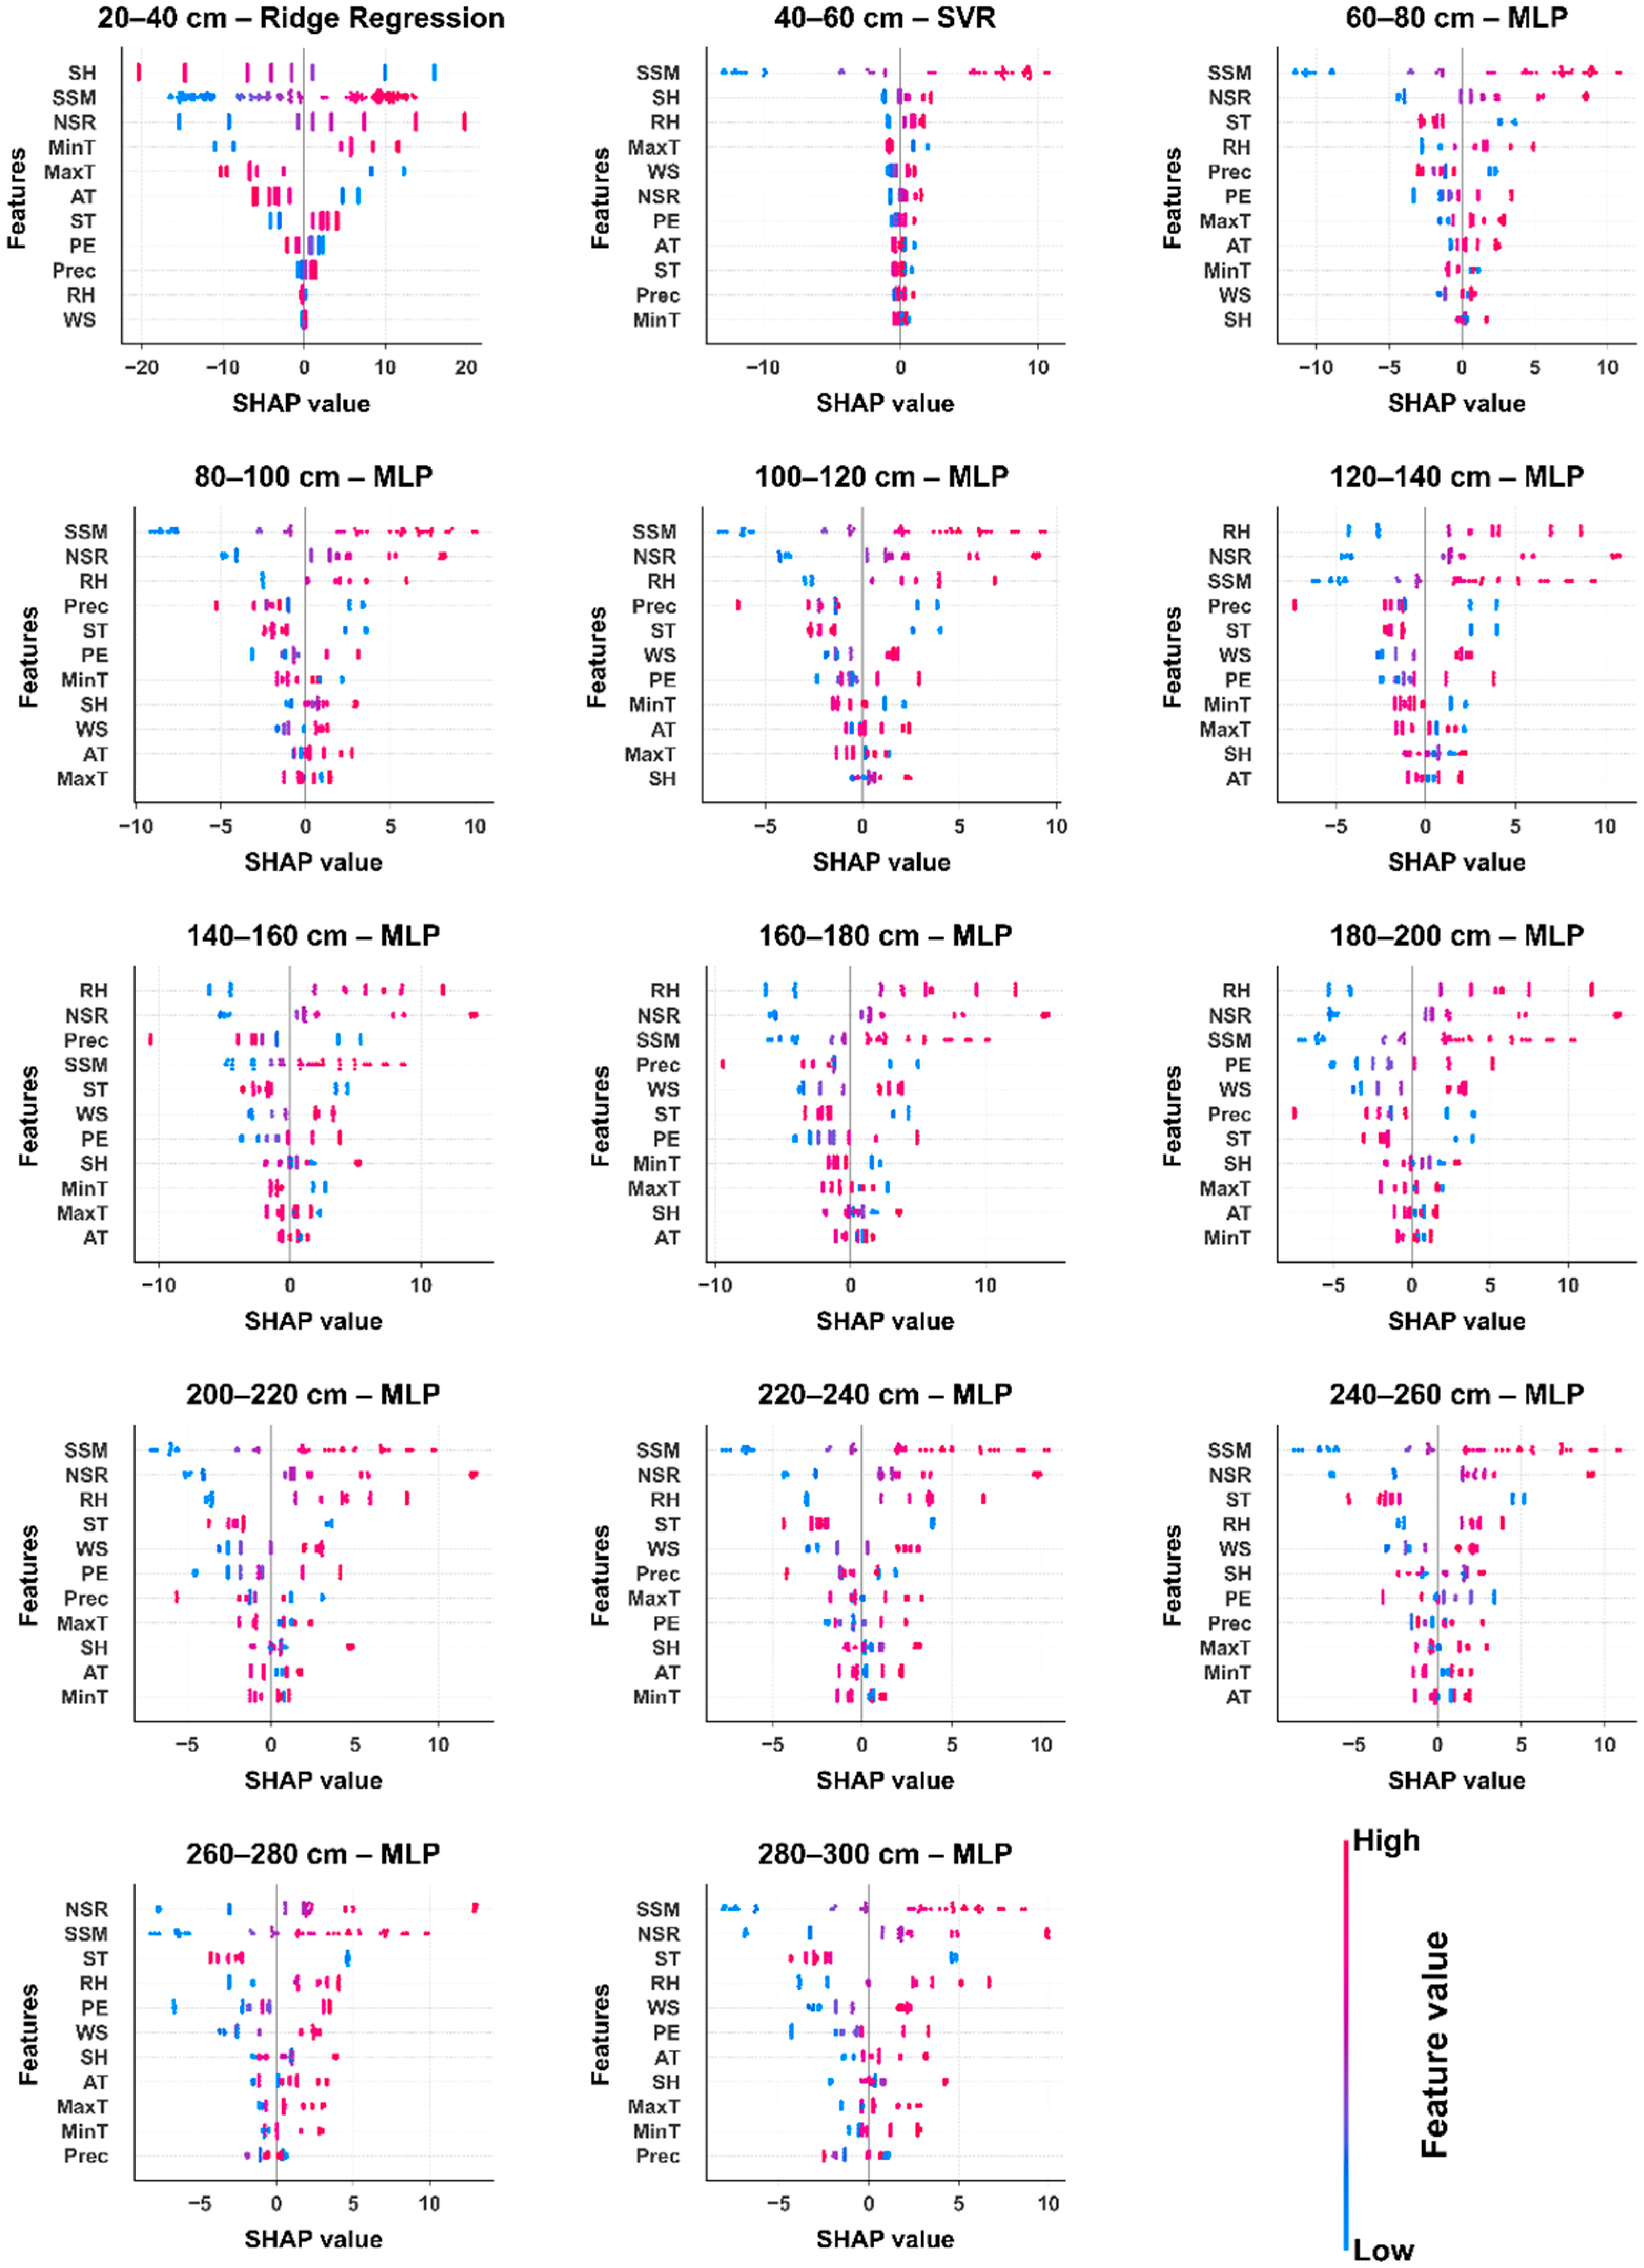
SHAP analysis-based model interpretability results revealed the action mechanisms of various input variables and model decision processes in soil moisture prediction at different depth layers (Figure 5). SHAP full-profile analysis showed that surface soil moisture (SSM) consistently served as the most critical predictive variable, with highest SHAP values and strongest positive contributions across all depth layers (20–300 cm), validating the effectiveness of surface soil moisture as a core proxy variable for deep moisture prediction. Temperature variables, precipitation, and sunshine-hours showed significant stratified action patterns across different depth layers: minimum temperature (MinT) appeared as a major negative influence factor in 20–140 cm shallow layers with SHAP values concentrated in negative ranges, particularly significant at 60–100 cm depths, while maximum temperature (MaxT) showed dispersed bidirectional contributions with broader distribution ranges at 80–120 cm depths, reflecting the differential regulatory mechanisms of diurnal temperature differences on shallow soil moisture. Precipitation (Prec) served as a significant positive driving factor in 20–100 cm shallow layers with clear positive clustering in the Ridge Regression model, with its influence gradually weakening with increasing depth and stabilizing below 160 cm, demonstrating the direct recharge effect and depth–decay pattern.
Model algorithm specificity analysis revealed significant differences in feature utilization patterns among different machine learning models. MLP models exhibited complex feature interaction mechanisms in 60–140 cm layers, with SHAP value distributions showing high variance and wide bidirectional distributions for key variables (SSM, MinT, MaxT, Prec), reflecting the non-linear decision complexity of neural networks when processing multi-dimensional features. Ridge Regression models in 20–40 cm shallow layers showed the clearest linear feature importance patterns, with SSM highly concentrated in positive ranges and MinT showing clear negative clustering, demonstrating feature selection stability and linear model effectiveness in shallow predictions. SVR models displayed unique patterns in 40–60 cm depths, with SSM maintaining dominance but showing more dispersed distributions including negative contributions, reflecting SVR’s sensitivity to local non-linear relationships. Tree-based models (RF and GB) showed more stable patterns in deep layers (140–300 cm), with highly concentrated SHAP distributions where SSM and MinT dominated, while secondary variables were effectively filtered, demonstrating better generalization and robustness in deep layer predictions.
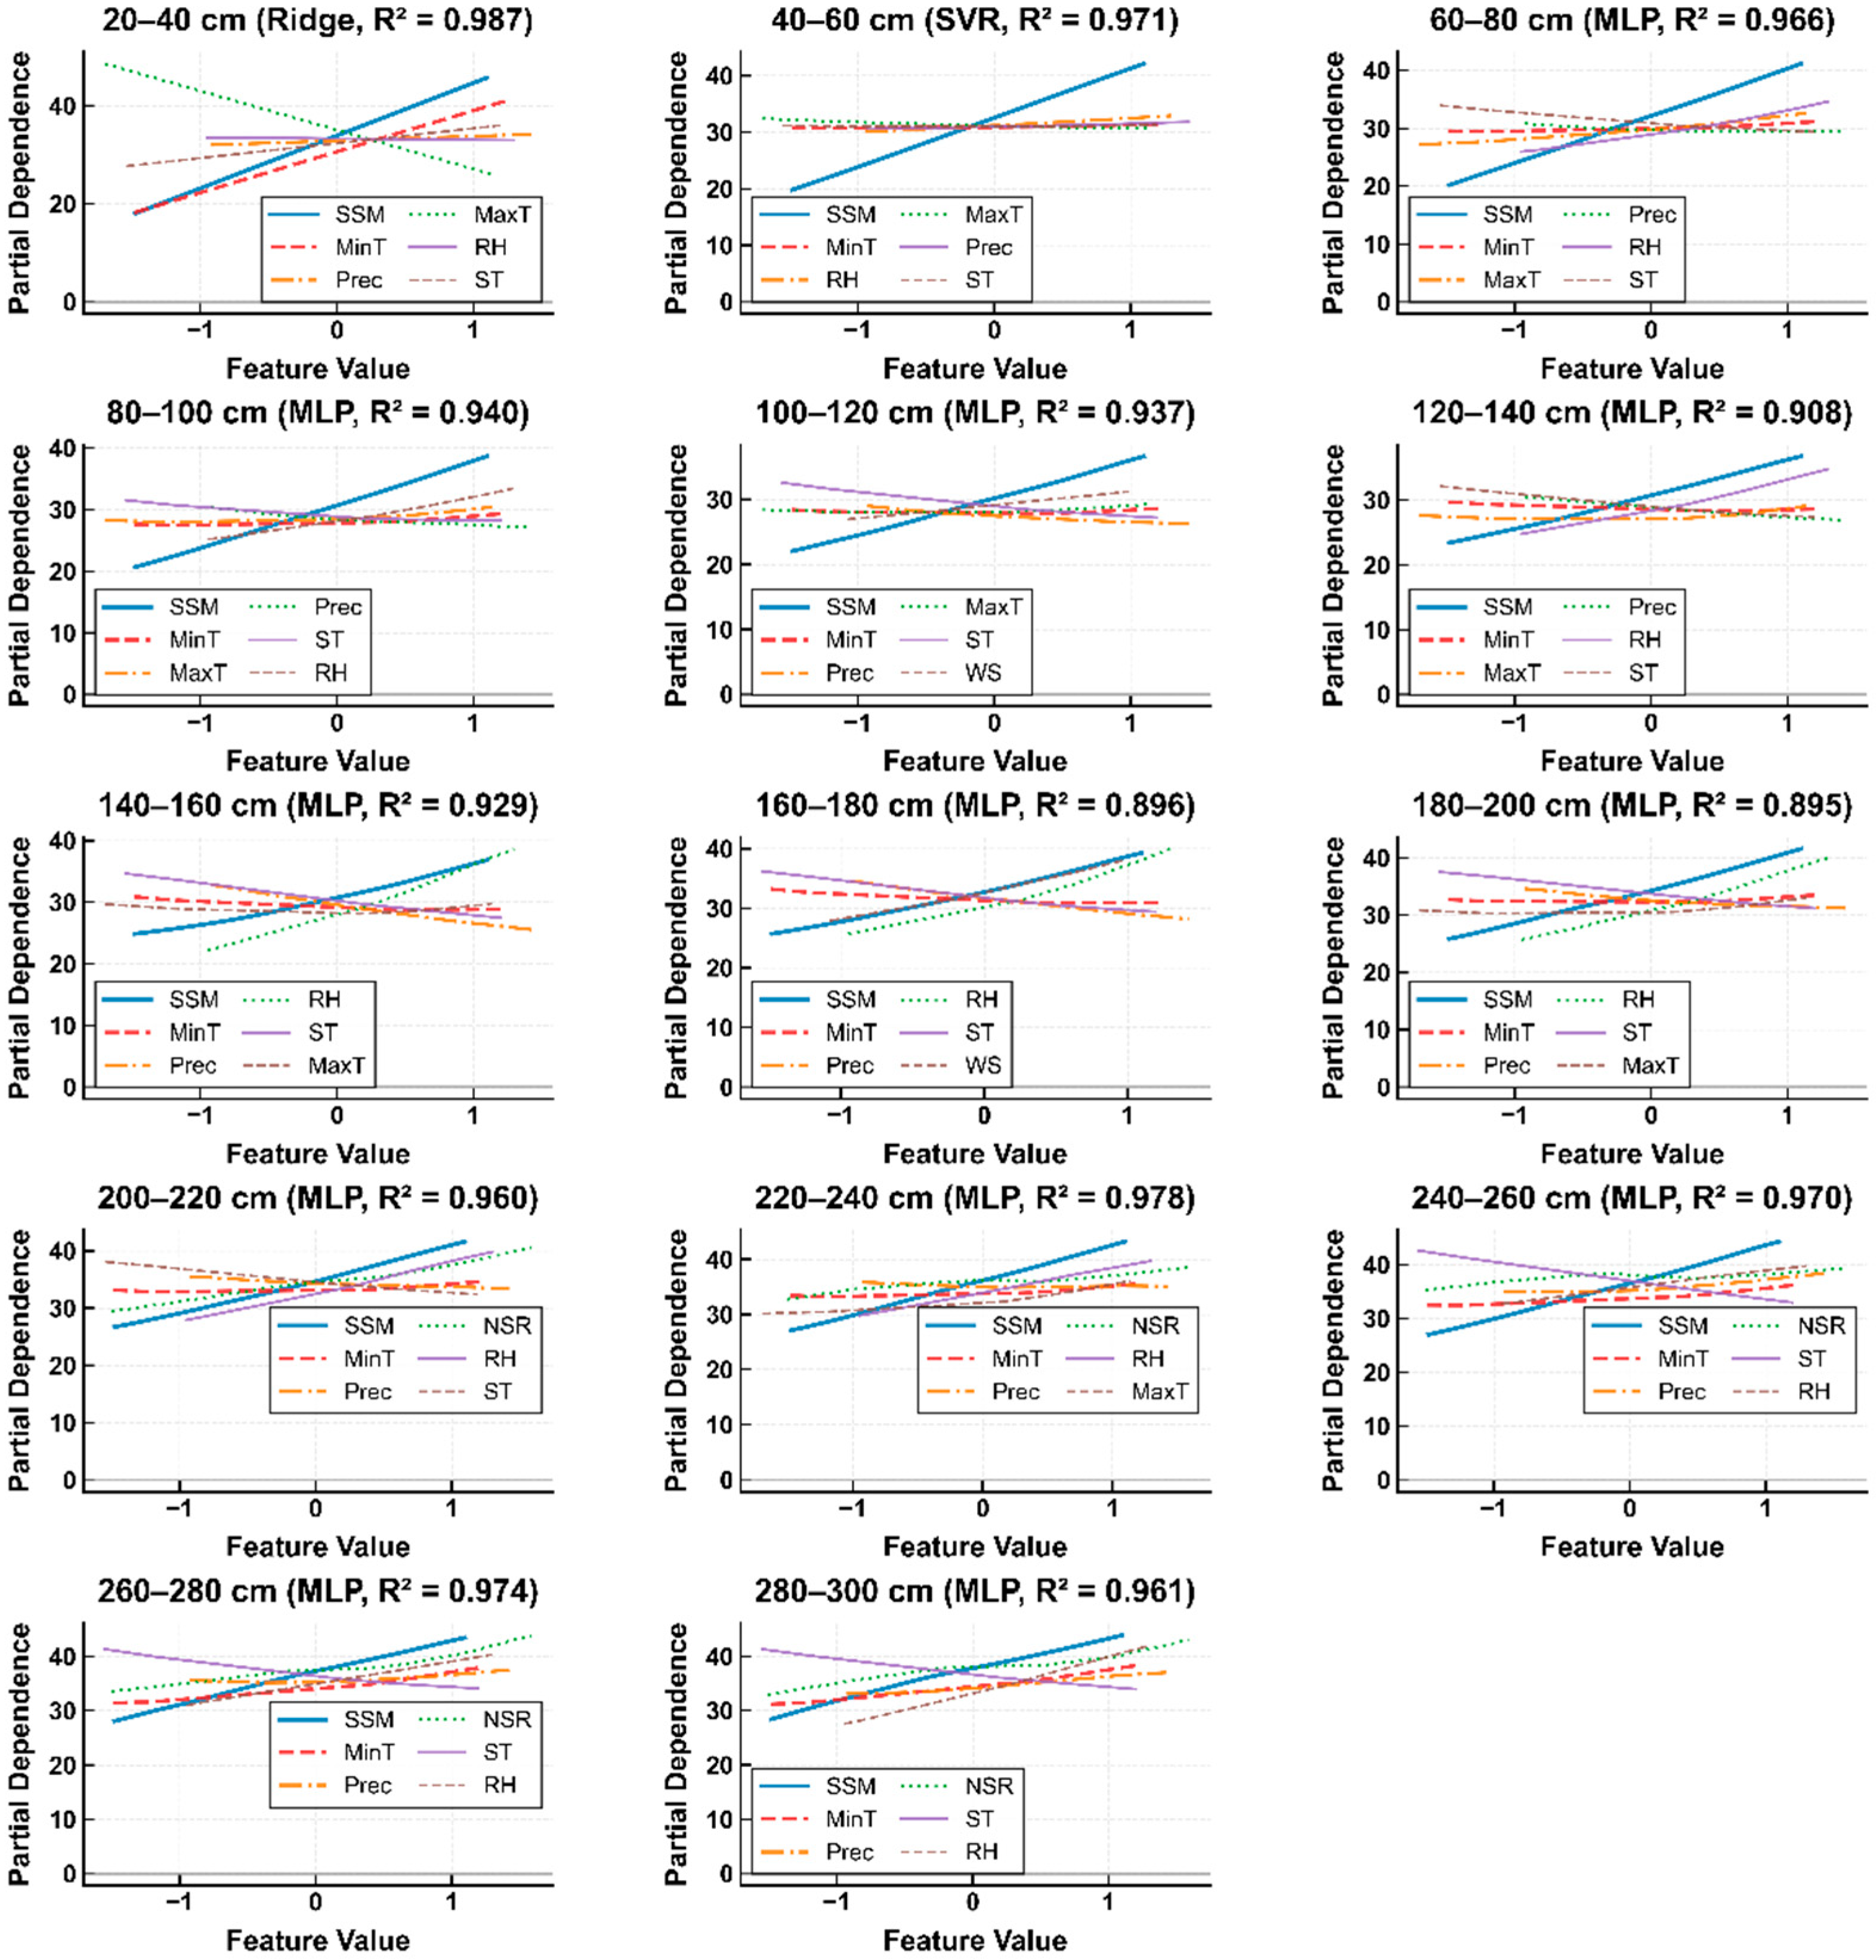
PDP analysis further quantified the environmental response mechanism characteristics of deep soil moisture (Figure 6). Surface soil moisture (SSM) showed significant positive linear response at all depth layers, with influence intensity showing a “layer-by-layer enhancement” pattern with depth, revealing the “linear coupling amplification” pattern of surface-deep moisture information transmission. Minimum temperature (MinT) showed consistent negative regulation across all depths, exhibiting a pronounced declining trend in shallow layers (20–140 cm) while maintaining relatively stable negative contributions in deep layers (200–300 cm), validating the stronger suppression effect of low temperature on shallow soil moisture. Maximum temperature (MaxT) displayed obvious positive upward response in shallow layers (20–80 cm), while showing relatively gentle or weak positive trends in middle layers (80–160 cm), reflecting the differentiated regulatory roles of temperature variables across different depth layers.
Precipitation/relative humidity responses showed obvious “depth differentiation” characteristics: in shallow layers (20–140 cm), precipitation (Prec) exhibited a positive gentle response, reflecting the direct recharge effect of precipitation on shallow moisture; middle layers (100–200 cm) showed relative humidity (RH) and precipitation presenting relatively stable horizontal trends, reflecting the buffering effect of middle layers on atmospheric moisture condition changes. In deep layers (200–300 cm), net solar radiation (NSR) emerged as a critical factor, showing moderate positive slopes, indicating the cumulative effect of long-term radiation energy balance on deep moisture regulation. Particularly, 160–180 cm and 180–200 cm layers showed significant positive response in relative humidity, revealing the high sensitivity of these depth zones as moisture transition layers to atmospheric humidity conditions. The 200–220 cm layer maintained strong positive linear trends in SSM response, demonstrating the robustness of surface-deep moisture coupling mechanisms. Soil temperature (ST) exhibited relatively gentle horizontal or weak positive trends across most depth layers, validating the auxiliary role of soil thermal conditions in moisture prediction. This temporal validation-based PDP analysis quantitatively revealed the three-layer soil moisture environmental response pattern of “shallow layer SSM linear dominance + temperature differentiated regulation - middle layer RH transitional regulation - deep layer SSM-NSR synergistic enhanced regulation.”
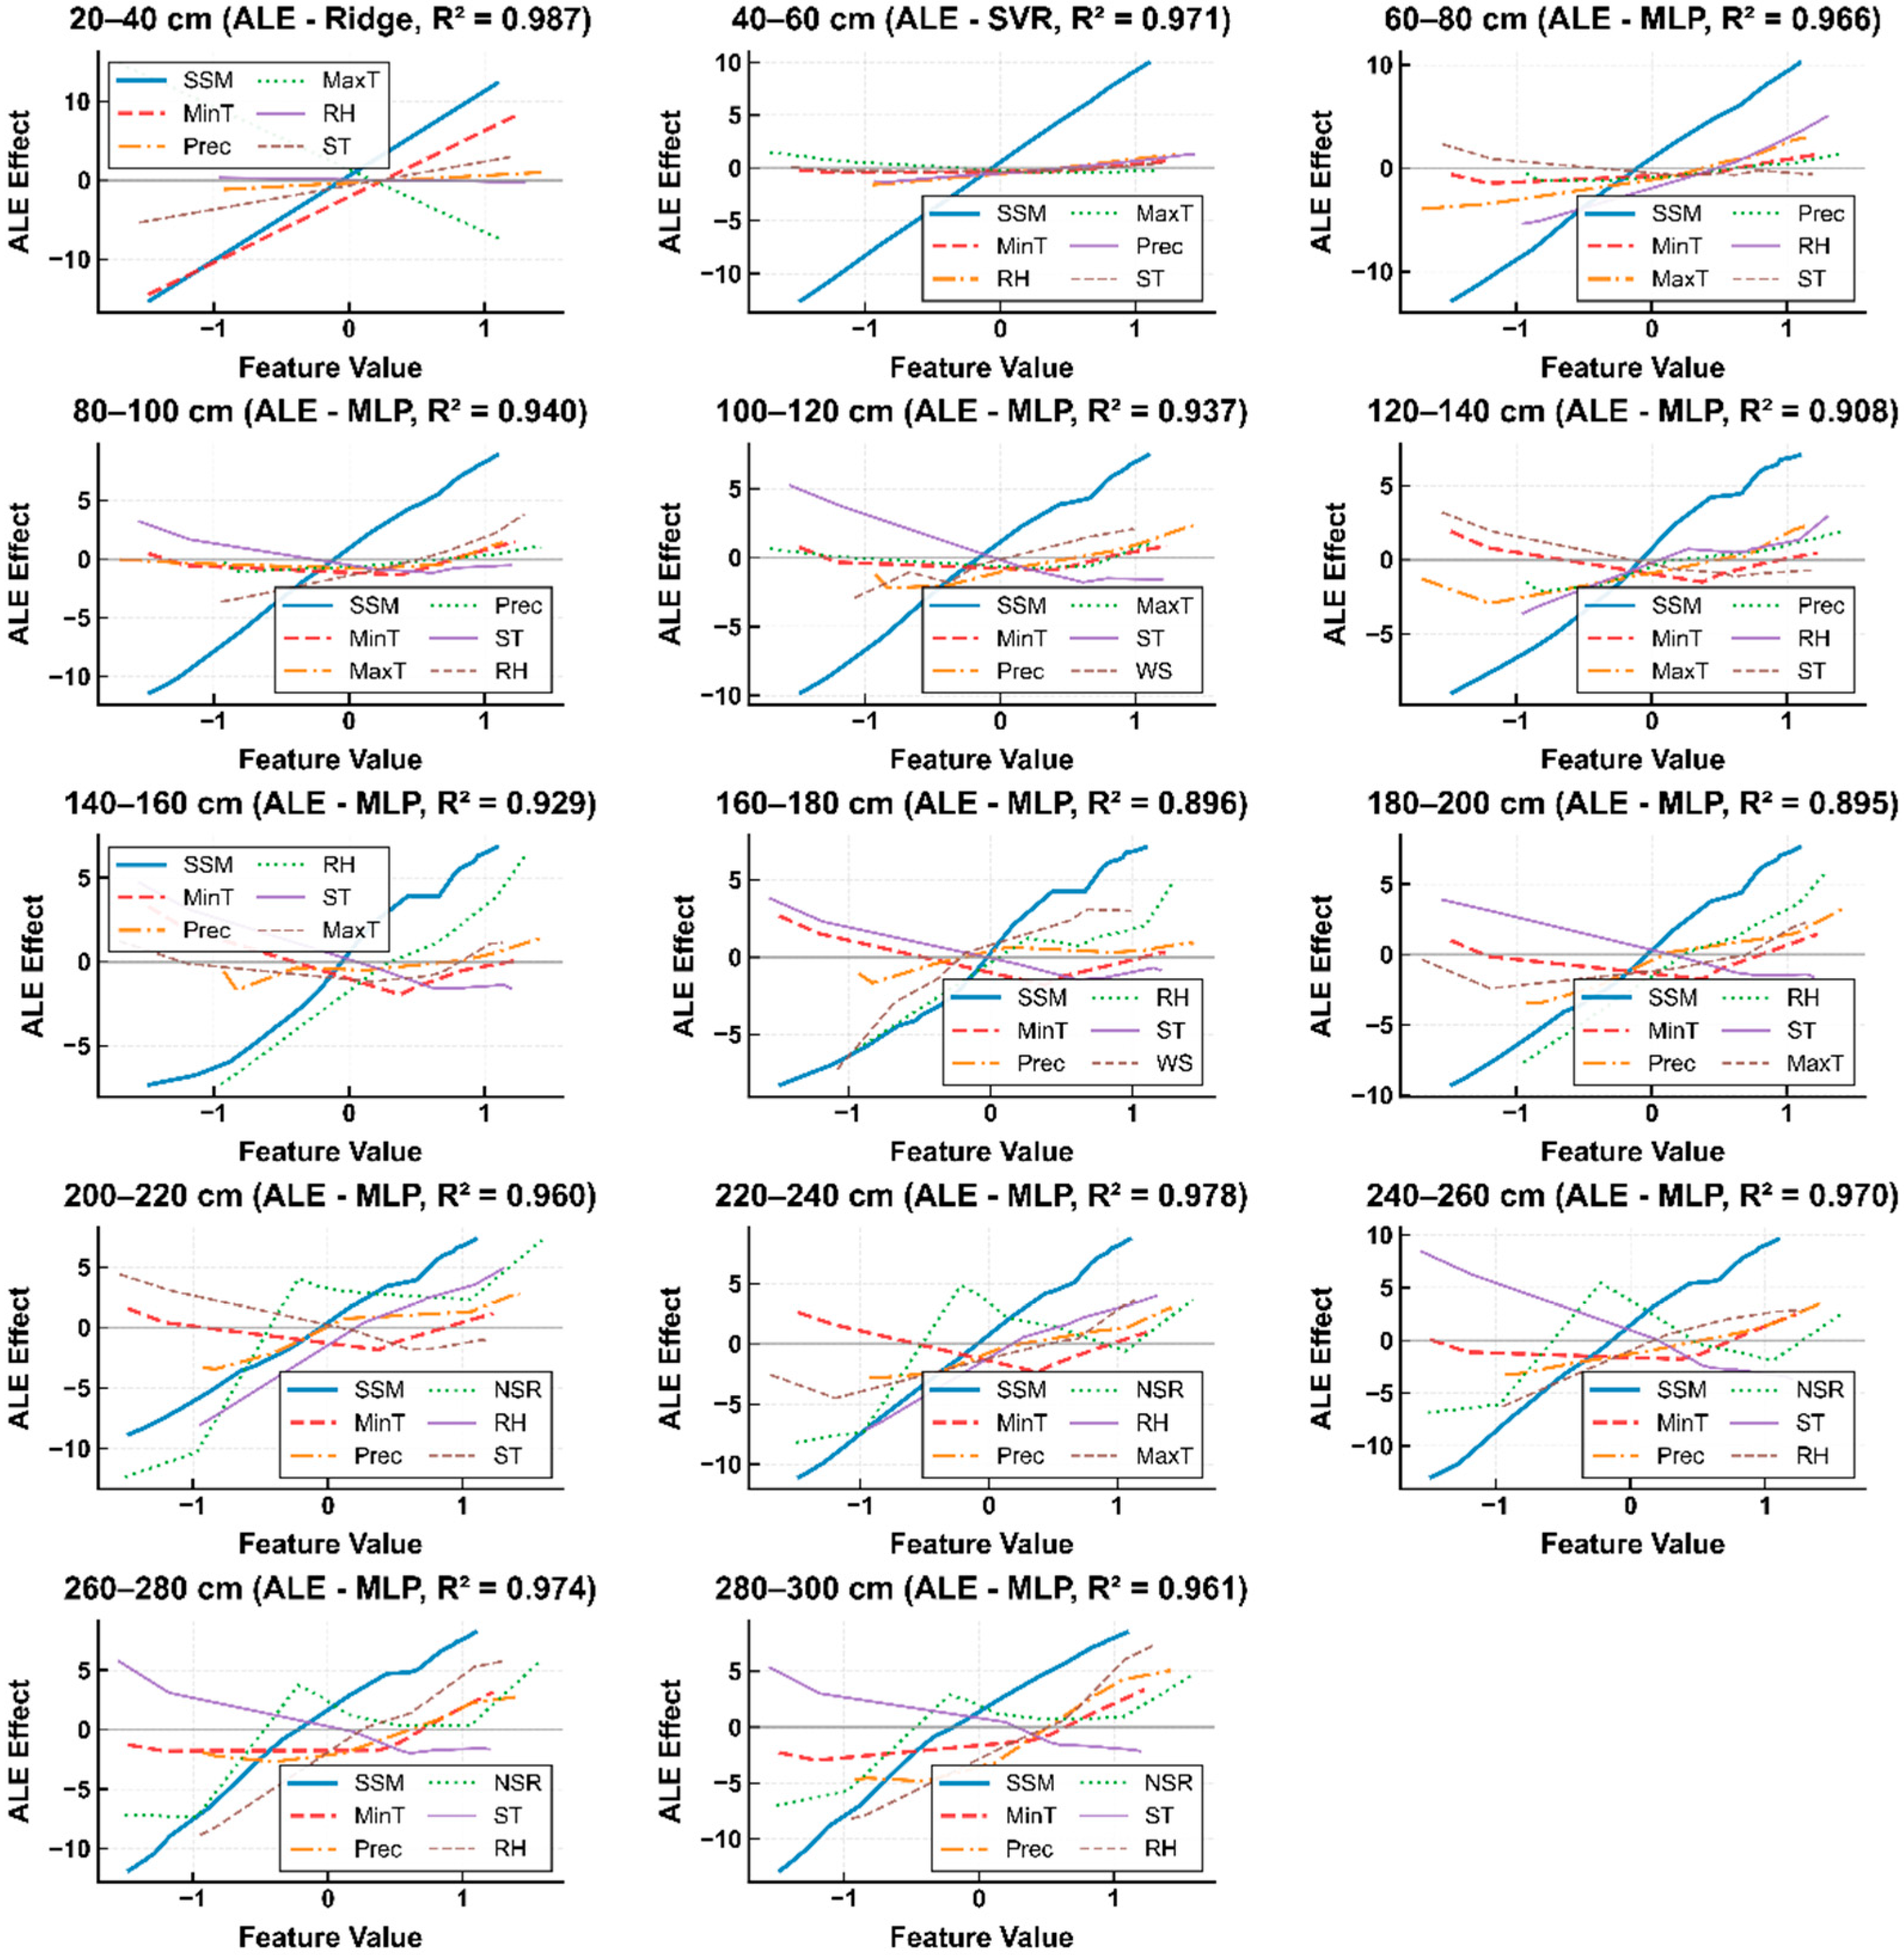
ALE analysis eliminated feature correlation biases in meteorological variables, achieving high predictive accuracy (R2 = 0.895–0.987) across 14 depth layers (Figure 7). Surface soil moisture exhibited strong positive linear effects with ALE magnitudes increasing from 8–10 units in shallow layers (20–80 cm) to 12–18 units in deep layers (200–300 cm), confirming the “surface-to-deep information transmission amplification” mechanism. Minimum temperature showed consistent negative responses with ALEs of −8 to 0 units in shallow layers and −5 to 0 units in deep layers, while maximum temperature exhibited positive responses in shallow layers (20–80 cm) with ALEs of −3 to +5 units. Precipitation showed gentle positive responses in shallow layers (20–140 cm) with ALE magnitudes of 2–4 units, while relative humidity dominated middle layers (100–200 cm) with stable patterns and fluctuations of ±3 units. Net solar radiation emerged in deep layers (200–300 cm) with gentle positive slopes showing ALE increases of 4–7 units. Critical transition zones at 160–180 cm and 180–200 cm exhibited relative humidity with positive responses where ALEs increased from −3 to +6 units, identifying threshold-driven moisture dynamics that explain discrepancies between surface remote sensing observations and ground-truth measurements.

4. Discussion

This study addressed the difficult problem of deep soil moisture (0–300 cm) non-invasive prediction by systematically constructing and comparing multiple machine learning models under a temporal validation framework and using interpretability analysis to deeply reveal model mechanisms and variable action patterns. Results showed that non-linear ensemble models such as random forest, gradient boosting trees, and multi-layer perceptron demonstrated significant depth stability and high precision in full-profile prediction tasks, with R2 consistently maintained at 0.89–0.98 on a 2022 test set, making it substantially superior to traditional linear methods. This finding validates the strong representation capability of machine learning methods for complex non-linear soil moisture dynamics under time-series prediction scenarios, consistent with related conclusions from Ahmad et al. [19] and Orthe et al. [21].
The “depth-specific optimal model selection” characteristics exhibited by different models at different depth layers revealed the hierarchical nature of soil moisture spatial heterogeneity and temporal stability. Multi-layer perceptron dominated 60–300 cm depths (R2 = 0.895–0.978), demonstrating strong capability in capturing complex temporal patterns in middle and deep layers. Ridge Regression performed optimally in the 20–40 cm shallow layer (R2 = 0.987), while support vector regression stood out at 40–60 cm (R2 = 0.971), reflecting different algorithms’ differential adaptive capabilities to depth-stratified temporal dynamics. The superior performance of non-linear models in deep layers under temporal validation indicates their enhanced ability to capture long-term moisture accumulation patterns independent of training period, which is critical for future predictions.
Mechanism interpretation analysis (SHAP, PDP, and ALE) quantitatively revealed stratified driving patterns of surface moisture and meteorological variables across the full profile under temporal validation. SHAP analysis showed that surface soil moisture (SSM) served as the most critical predictive variable across all depth layers (20–300 cm) with the strongest positive contributions, validating the effectiveness of surface soil moisture as a core proxy variable for deep moisture prediction. This conclusion completely aligns with the “surface soil moisture as deep moisture proxy signal” hypothesis proposed by Kornelsen and Coulibaly [10]. Temperature variables showed significant stratified action patterns across different depth layers: minimum temperature (MinT) appeared as a major negative influence factor in 20–140 cm shallow layers, while maximum temperature (MaxT) showed positive contributions in the same depth layers, reflecting differential regulatory mechanisms of diurnal temperature differences on shallow soil moisture. Precipitation (Prec) served as a significant positive driving factor in 20–100 cm shallow layers, with its influence gradually weakening with increasing depth and stabilizing in deep layers below 200 cm.
Model algorithm specificity analysis revealed feature utilization differences among different machine learning models. MLP models exhibited complex feature interaction mechanisms in middle and deep layers (60–300 cm), with SHAP value distributions showing high variance characteristics in middle layers and progressive convergence in deep layers, with SHAP value distributions showing high variance characteristics, reflecting non-linear decision complexity of neural networks when processing multi-dimensional features. RF and GB models showed more stable feature importance patterns in deep layers, especially RF models showing stronger feature selection capabilities in deep layers. Ridge Regression and SVR models showed stable linear and non-linear feature mapping capabilities in shallow layers (20–60 cm), demonstrating effectiveness in capturing direct surface–atmosphere interactions. Meteorological variable combination effects showed that hierarchical characteristics, wind speed (WS), relative humidity (RH), and precipitation (Prec), had relatively uniform SHAP value distributions in middle layers, indicating that middle layer soil moisture prediction requires comprehensive consideration of multi-meteorological factor synergistic effects. In deep layer prediction, few key variables (mainly SSM and temperature variables) dominated SHAP values, reflecting deep soil moisture dependence on long-term accumulation effects.
Despite good results achieved in this study, certain limitations still exist. Research was based on a single experimental area in Yuncheng City, Shanxi Province. Although this region has typical Loess Plateau characteristics, the generalization ability of research results under different climate zones, soil types, and topographic conditions still requires further verification. Three years of observation data can reflect seasonal and interannual variation patterns but may not fully capture the effects of long-term climate change and extreme weather events on deep soil moisture. Current research mainly targeted loam and sandy loam soils, with applicability to other soil types such as clay and sand requiring further assessment, as differences in soil structure and porosity may affect model performance. Although this study considered 10 major meteorological variables, factors such as atmospheric pressure, soil temperature gradients, and groundwater levels may also influence deep moisture and need consideration in subsequent research. Groundwater level dynamics were not included in this study due to a lack of observation data. Future work will incorporate groundwater information to better interpret deep soil water redistribution. Additionally, current models are trained based on historical data, with capabilities in real-time prediction and future scenario prediction requiring further verification and optimization.
Overall, this study achieved high-precision, strong generalization modeling of 20–300 cm deep soil moisture, providing systematic quantitative evidence for variable stratification mechanisms and model selection, validating the effectiveness of non-linear modeling methods integrating surface-meteorological signals in deep moisture prediction, and providing a theoretical basis and technical support for precision agriculture and regional water management. These research results have important scientific value and practical significance for promoting smart agricultural technology development and improving agricultural water use efficiency.

5. Conclusions

Based on continuous observations of surface soil moisture and meteorological multi-variables in typical agricultural areas of Wenxi County, Shanxi Province, this study systematically compared the prediction capabilities of eight mainstream machine learning regression models for 20–300 cm deep soil moisture using 2020–2021 data for training and 2022 data for testing, employing the SHAP-PDP-ALE triple interpretation framework to reveal model mechanisms and variable driving patterns. Main conclusions are as follows:
(1)
Machine learning models demonstrated excellent temporal generalization capability in deep soil moisture prediction. Non-linear models achieved R2 of 0.895–0.987 on the 2022 test set across the full profile, making them significantly superior to traditional linear algorithms. Multi-layer perceptron dominated middle and deep layers (60–300 cm), while Ridge Regression performed optimally in 20–40 cm shallow layers (R2 = 0.987), and support vector regression excelled at 40–60 cm (R2 = 0.971).
(2)
Surface soil moisture served as the core variable for deep prediction, with the highest SHAP values and strongest contributions across all depth layers. Minimum temperature appeared as a major negative influence factor at all depths, with most significant negative contributions in shallow layers (20–140 cm). Precipitation served as an important positive driving factor in shallow layers (20–100 cm), with its influence gradually weakening with increasing depth. Relative humidity and net solar radiation showed enhanced importance in middle and deep layers (100–300 cm).
(3)
PDP analysis showed surface moisture exhibited positive linear responses at all depths, with influence intensity progressively strengthening from shallow to deep layers. Minimum temperature maintained consistent negative regulation, while maximum temperature displayed positive upward responses in shallow layers. Precipitation showed gentle positive responses in shallow layers, relative humidity presented relatively stable trends in middle layers (100–200 cm), and net solar radiation exhibited moderate positive slopes in deep layers (200–300 cm).
(4)
ALE analysis eliminated feature correlation biases, confirming surface moisture ALEs increased from 8–10 units in shallow layers to 12–18 units in deep layers, validating the “surface-to-deep information transmission amplification” mechanism. Minimum temperature exhibited consistent negative linear effects. Relative humidity at 160–180 cm and 180–200 cm transition zones showed significant positive responses, revealing the high sensitivity of these depth zones as moisture transition layers to atmospheric humidity conditions.
This study quantitatively evaluated the influence patterns of surface soil moisture and meteorological elements on 0–300 cm deep soil moisture prediction accuracy, established a comprehensive multi-model, multi-depth prediction system, and proposed a stratified optimization modeling strategy framework. Research results have important theoretical value and practical significance for promoting standardized applications of deep soil moisture monitoring technology and improving precision agriculture informatization levels, providing scientific support for related technical standard formulation and industrial development.

Author Contributions

Conceptualization, S.J., Y.L., and W.Z.; methodology, S.J. and M.C.; software, S.J. and Z.B.; validation, S.J., B.C., and Y.L.; formal analysis, S.J. and Z.Z.; data curation, Y.C. and A.S.M.; writing—original draft preparation, S.J.; writing—review and editing, S.J. and W.Z.; visualization, S.J. and L.D.; supervision, L.D. and Y.L.; project administration, L.D. and W.Z.; funding acquisition, L.D. and W.Z. All authors have read and agreed to the published version of the manuscript.

Funding

This research received no external funding.

Data Availability Statement

The original contributions presented in this study are included in the article; further inquiries can be directed to the corresponding authors.

Conflicts of Interest

The original contributions presented in the study are included in the article; further inquiries can be directed to the corresponding authors.

Abbreviations

The following abbreviations are used in this manuscript:
SSMSurface Soil Moisture
ATAverage Temperature
MaxTMaximum Temperature
MinTMinimum Temperature
PrecPrecipitation
STSurface Temperature
RHRelative Humidity
WSWind Speed
NSRNet Solar Radiation
SHSunshine Hours
PEPotential Evaporation

References

  1. Wu, F.; Yang, B.; Guo, S.; Huang, W.; Lei, Y.; Xiong, S.; Han, Y.; Wang, Z.; Feng, L.; Li, X.; et al. Adopting different cotton cropping systems may regulate the spatiotemporal variation in soil moisture and affect the growth, WUE and yield of cotton. Ind. Crops Prod. 2022, 186, 115259. [Google Scholar] [CrossRef]
  2. Wang, H.; Li, X.; Xiao, J.; Ma, M. Evapotranspiration components and water use efficiency from desert to alpine ecosystems in drylands. Agric. For. Meteorol. 2021, 298, 108283. [Google Scholar] [CrossRef]
  3. Miro, M.E.; Groves, D.; Tincher, B.; Syme, J.; Tanverakul, S.; Catt, D. Adaptive water management in the face of uncertainty: Integrating machine learning, groundwater modeling and robust decision making. Clim. Risk Manag. 2021, 34, 100383. [Google Scholar] [CrossRef]
  4. Li, X.; Zhang, J.; Cai, X.; Huo, Z.; Zhang, C. Simulation-optimization based real-time irrigation scheduling: A human-machine interactive method enhanced by data assimilation. Agric. Water Manag. 2023, 276, 108059. [Google Scholar] [CrossRef]
  5. Yu, Y.; Yu, R.; Chen, X.; Yu, G.; Gan, M.; Disse, M. Agricultural water allocation strategies along the oasis of Tarim River in Northwest China. Agric. Water Manag. 2017, 187, 24–36. [Google Scholar] [CrossRef]
  6. Chaney, N.W.; Roundy, J.K.; Herrera-Estrada, J.E.; Wood, E.F. High-resolution modeling of the spatial heterogeneity of soil moisture: Applications in network design. Water Resour. Res. 2015, 51, 619–638. [Google Scholar] [CrossRef]
  7. Li, X.; Liu, F.; Ma, C.; Kristofer, L.; Bogena, H.; Mancilla, G.; Vereecken, H.; Franssen, H.J.H. Land data assimilation: Harmonizing theory and data in land surface process studies. Rev. Geophys. 2024, 62, e2022RG000801. [Google Scholar] [CrossRef]
  8. Fan, Y.; Wang, X.; Funk, T.; Schumann, A.W.; Khosla, R.; Sudduth, K.A.; Drummond, S.T. A critical review for real-time continuous soil monitoring: Advantages, challenges, and perspectives. Environ. Sci. Technol. 2022, 56, 13546–13564. [Google Scholar] [CrossRef]
  9. Zhang, Y.; Wang, G.; Li, L.; Yang, Y.; Li, S.; Gao, Z.; Wang, J.; Sun, B.; Li, Z. A monitoring method for agricultural soil moisture using wireless sensors and the Biswas model. Agriculture 2025, 15, 344. [Google Scholar] [CrossRef]
  10. Kornelsen, K.C.; Coulibaly, P. Root-zone soil moisture estimation using data-driven methods. Water Resour. Res. 2014, 50, 2946–2962. [Google Scholar] [CrossRef]
  11. Jiang, Y.; Zhang, Y.; Fan, B.; Guo, J.; Ju, Q.; Wei, C.; Zheng, H. Preferential flow influences the temporal stability of soil moisture in a headwater catchment. Geoderma 2023, 437, 116590. [Google Scholar] [CrossRef]
  12. Song, Y.; Mei, W.; Li, M.; Wang, L.; Sun, L.; Zhang, Y.; Liu, J.; Zhang, C. Soil water content and RubisCO activity control the carbon storage in soil under different land uses in Sanjiang Plain, China. Catena 2024, 243, 108211. [Google Scholar] [CrossRef]
  13. Liu, Y.; Yang, Y. Spatial-temporal variability pattern of multi-depth soil moisture jointly driven by climatic and human factors in China. J. Hydrol. 2023, 619, 129313. [Google Scholar] [CrossRef]
  14. Togneri, R.; Dos Santos, D.F.; Camponogara, G.; Nagassaki, T.K.; Ferreira, A.S.; Nagasaki, G.K.; Marin, F.R. Soil moisture forecast for smart irrigation: The primetime for machine learning. Expert Syst. Appl. 2022, 207, 117653. [Google Scholar] [CrossRef]
  15. Yang, J.J.; Cai, H.J.; Wang, S.H.; Xie, H.X. Study on the relationship between shallow and deep soil moisture in Yangling area. Agric. Res. Arid Areas 2010, 3, 53–57. (In Chinese) [Google Scholar]
  16. Jia, S.; Cui, M.; Chen, L.; Sun, Y.; Wang, Y.; Li, C.; Feng, L.; Zhao, Q.; Zhang, H. Soybean water monitoring and water demand prediction in arid region based on UAV multispectral data. Agronomy 2024, 15, 88. [Google Scholar] [CrossRef]
  17. Li, Y.; Qu, T.; Wang, Y.; Zhao, Q.; Jia, S.; Yin, Z.; Guo, Z.; Wang, G.; Li, F.; Zhang, W. UAV-Based Remote Sensing to Evaluate Daily Water Demand Characteristics of Maize: A Case Study from Yuci Lifang Organic Dry Farming Experimental Base in Jinzhong City, China. Agronomy 2024, 14, 729. [Google Scholar] [CrossRef]
  18. Diaz-Gonzalez, F.A.; Vuelvas, J.; Correa, C.A.; Vallejo, V.E.; Patino, D. Machine learning and remote sensing techniques applied to estimate soil indicators—Review. Ecol. Indic. 2022, 135, 108517. [Google Scholar] [CrossRef]
  19. Ahmad, S.; Kalra, A.; Stephen, H. Estimating soil moisture using remote sensing data: A machine learning approach. Adv. Water Resour. 2010, 33, 69–80. [Google Scholar] [CrossRef]
  20. Jamei, M.; Ali, M.; Karbasi, M.; Shahid, S.; Yaseen, Z.M. A high dimensional features-based cascaded forward neural network coupled with MVMD and Boruta-GBDT for multi-step ahead forecasting of surface soil moisture. Eng. Appl. Artif. Intell. 2023, 120, 105895. [Google Scholar] [CrossRef]
  21. Sungmin, O.; Orth, R. Global soil moisture data derived through machine learning trained with in-situ measurements. Sci. Data 2021, 8, 170. [Google Scholar] [CrossRef]
  22. Bakht, M.P.; Mohd, M.N.H.; Ibrahim, B.S.K.K.; Khan, N.; Sheikh, U.U.; Rahman, A.A.-H.A. Advanced automated machine learning framework for photovoltaic power output prediction using environmental parameters and SHAP interpretability. Results Eng. 2025, 25, 103838. [Google Scholar] [CrossRef]
  23. Nohara, Y.; Matsumoto, K.; Soejima, H.; Nakashima, N. Explanation of machine learning models using shapley additive explanation and application for real data in hospital. Comput. Methods Programs Biomed. 2022, 214, 106584. [Google Scholar] [CrossRef]
  24. Mitra, U.; Sarkar, P.; Mondal, J.; Shome, S.; Saha, A.; Halder, U. Enhancing interpretability in diabetics prediction: A comparative study of SHAP, LIME and permutation feature importance. In Proceedings of the 2025 AI-Driven Smart Healthcare for Society 5.0, Kolkata, India, 14–15 February 2025; IEEE: Piscataway, NJ, USA, 2025. [Google Scholar]
  25. Zhang, C.; Chen, Y.; Wei, Y.; Guo, Y.; Li, Y.; Sun, S.; Li, C. Unraveling the threshold and interaction effects of environmental variables on soil organic carbon mapping in plateau watershed. Geoderma 2024, 450, 117032. [Google Scholar] [CrossRef]
  26. Apley, D.W.; Zhu, J. Visualizing the effects of predictor variables in black box supervised learning models. J. R. Stat. Soc. Ser. B Stat. Methodol. 2020, 82, 1059–1086. [Google Scholar] [CrossRef]
  27. Zhao, Q.; Hastie, T. Causal interpretations of black-box models. J. Bus. Econ. Stat. 2021, 39, 272–281. [Google Scholar] [CrossRef] [PubMed]
  28. Gupta, H.V.; Kling, H.; Yilmaz, K.K.; Martinez, G.F. Decomposition of the mean squared error and NSE performance criteria: Implications for improving hydrological modelling. J. Hydrol. 2009, 377, 80–91. [Google Scholar] [CrossRef]
  29. Knoben, W.J.M.; Freer, J.E.; Woods, R.A. Inherent benchmark or not? Comparing Nash–Sutcliffe and Kling–Gupta efficiency scores. Hydrol. Earth Syst. Sci. 2019, 23, 4323–4331. [Google Scholar] [CrossRef]
  30. Reynolds, S.G. The gravimetric method of soil moisture determination Part III An examination of factors influencing soil moisture variability. J. Hydrol. 1970, 11, 288–300. [Google Scholar] [CrossRef]
  31. Zhang, Q.; Min, L.; Wang, Y.; Feng, H.; Chen, S.; Niu, Y.; Zhang, Q. Accuracies of soil moisture sensors in typical soils in the Hebei Plain. Chin. J. Eco-Agric. 2023, 31, 1851–1859. [Google Scholar]
  32. Eltarabily, M.G.; Mohamed, A.Z.; Begna, S.; Elshishiney, H.; Linquist, B.A. Simulated soil water distribution patterns and water use of Alfalfa under different subsurface drip irrigation depths. Agric. Water Manag. 2024, 293, 108693. [Google Scholar] [CrossRef]
  33. Feddes, R.A.; Hoff, H.; Bruen, M.; Dawson, T.; De Rosnay, P.; Dirmeyer, P.; Jackson, R.B.; Kabat, P.; Kleidon, A.; Lilly, A.; et al. Modeling root water uptake in hydrological and climate models. Bull. Am. Meteorol. Soc. 2001, 82, 2797–2809. [Google Scholar] [CrossRef]
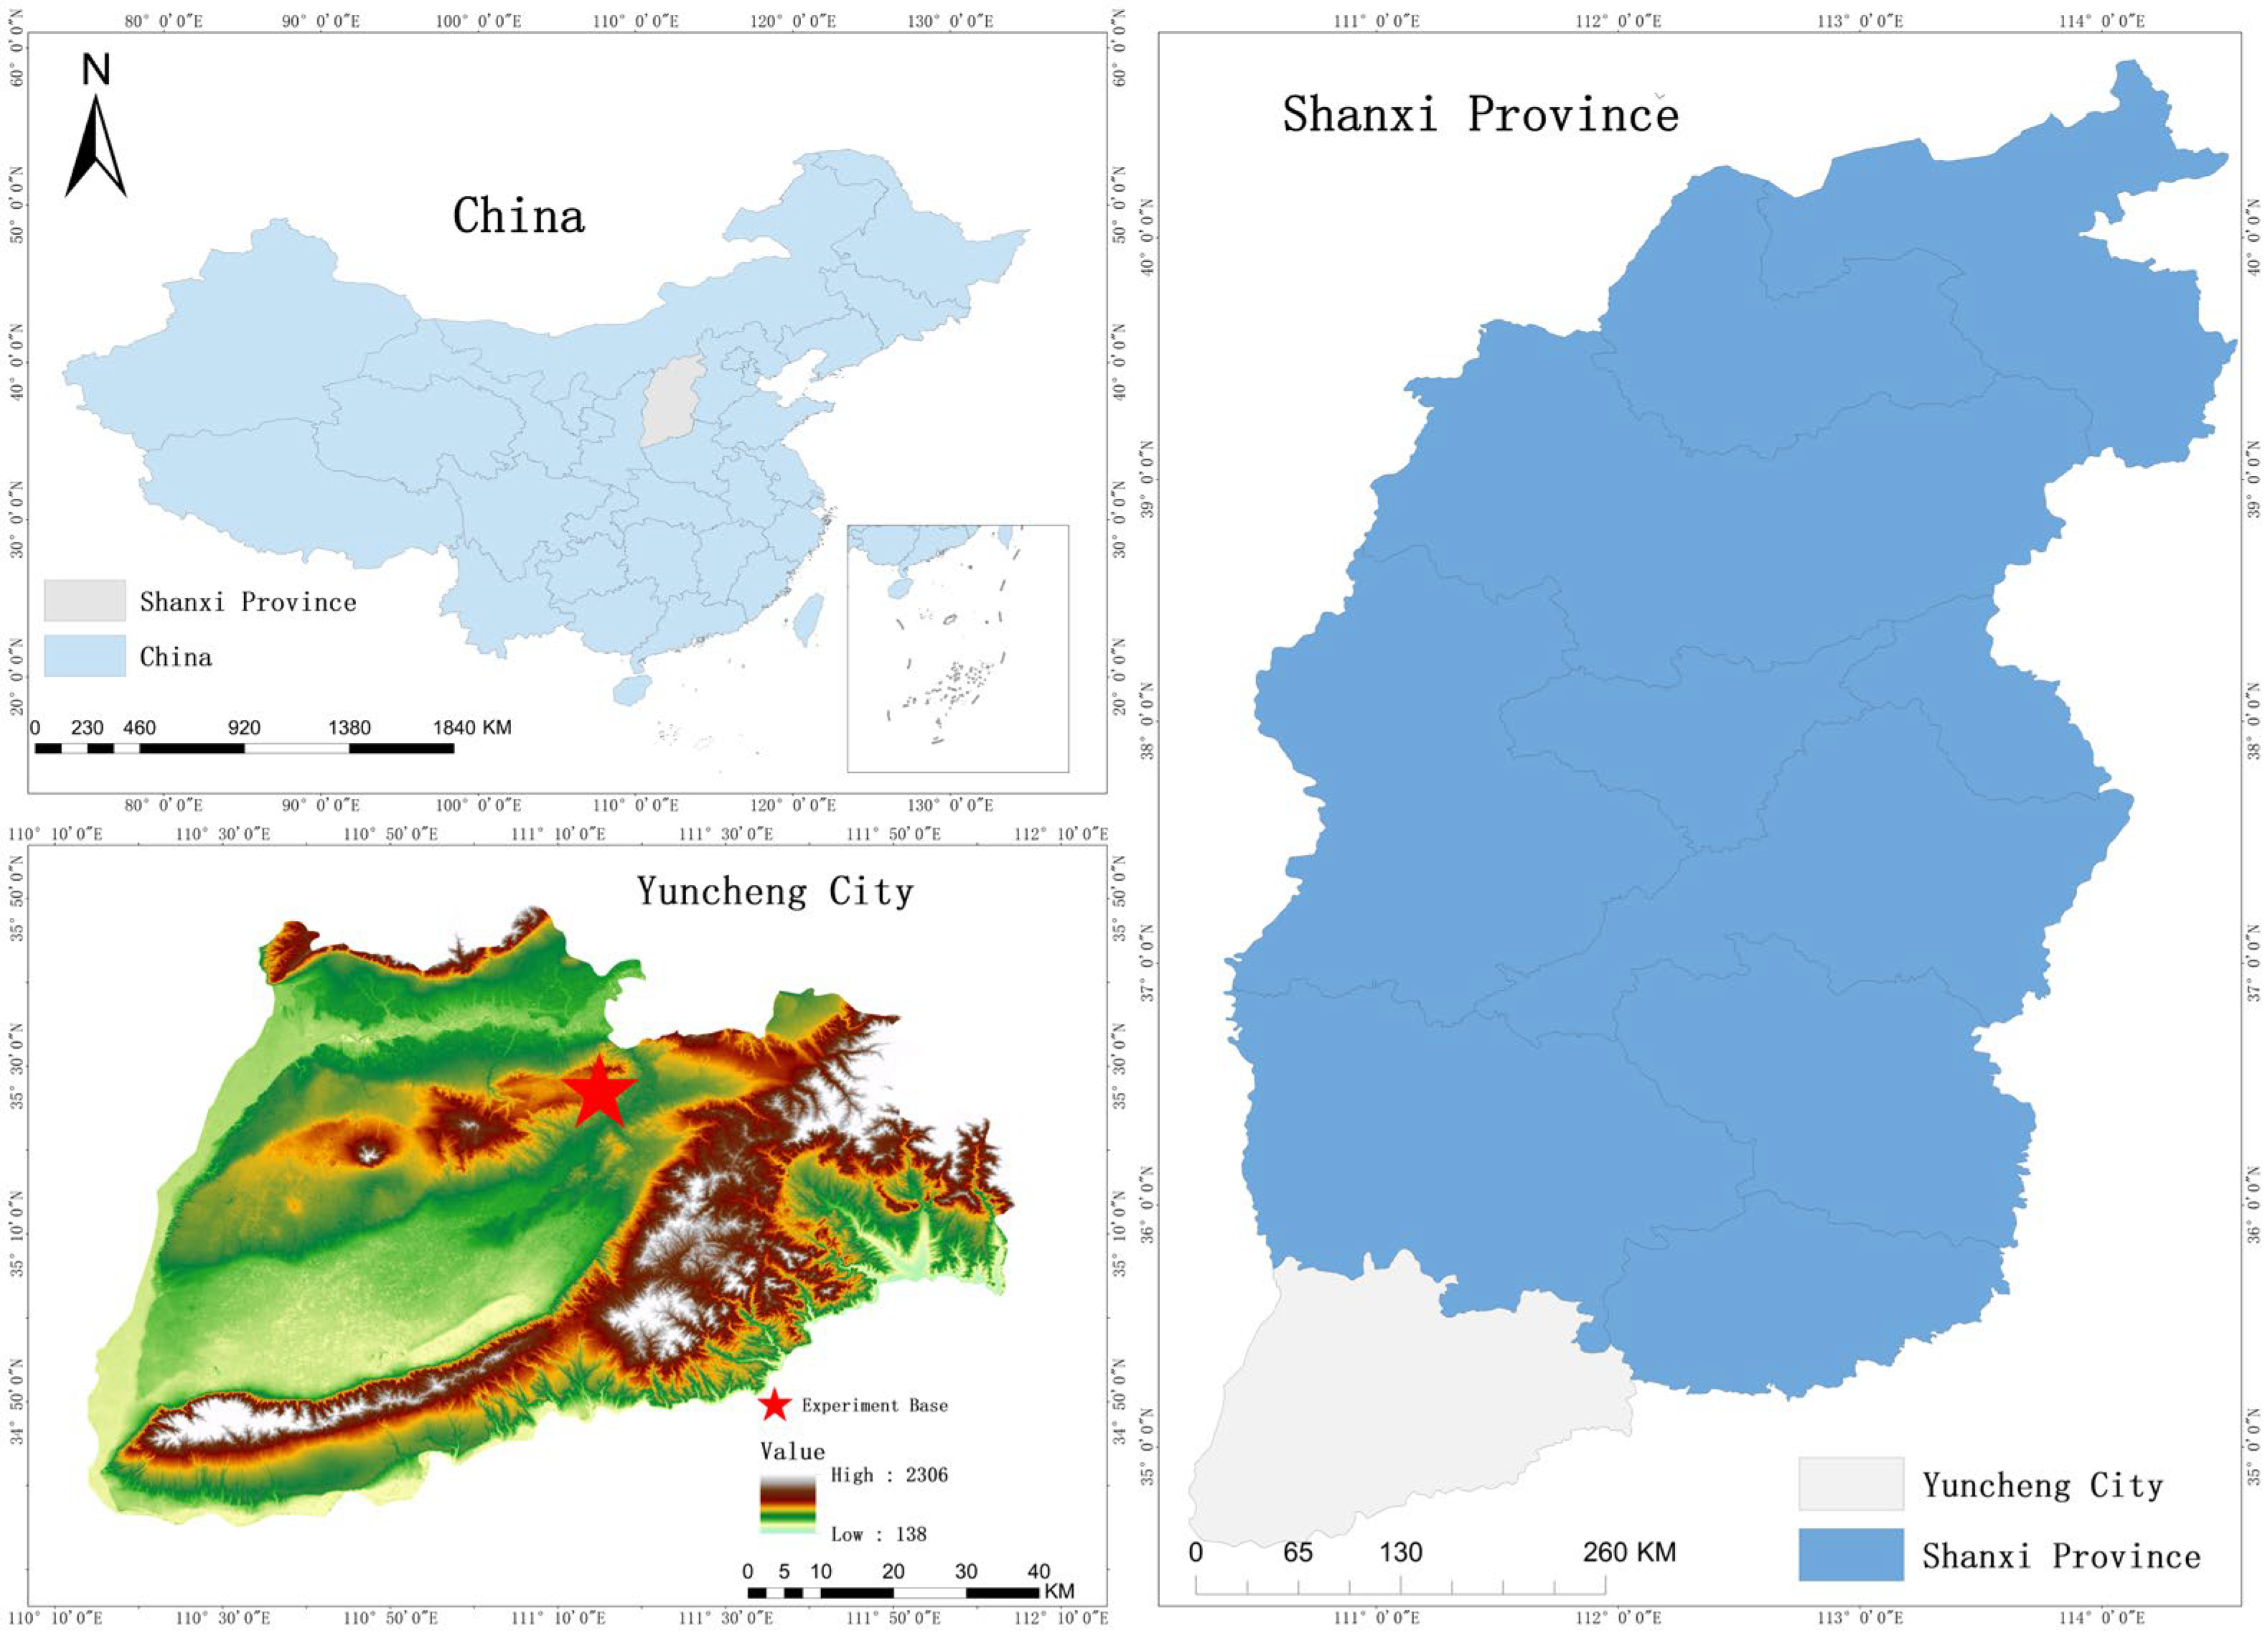
Figure 1. Study area.
Agriculture 15 02143 g001
Figure 2. Five-metric evaluation of machine learning model performance (R2, RMSE, MAE, NSE, KGE) across all soil depth layers for training, validation, and test datasets.
Agriculture 15 02143 g002aAgriculture 15 02143 g002b
Figure 3. Scatter plots of observed versus predicted values for optimal machine learning models across different soil depth layers with performance metrics and confidence intervals.
Agriculture 15 02143 g003
Figure 4. Heat map comparison of model performance metrics (R2, RMSE, MAE, NSE, KGE) for eight algorithms across different soil depth layers and dataset splits.
Agriculture 15 02143 g004aAgriculture 15 02143 g004bAgriculture 15 02143 g004c
Figure 5. SHAP-based feature importance visualization showing the magnitude and direction of feature contributions for optimal machine learning models across soil depth layers.
Agriculture 15 02143 g005
Figure 6. Partial dependence analysis of the top six environmental features for best-performing algorithms across different soil depth layers.
Agriculture 15 02143 g006
Figure 7. Accumulated Local Effect (ALE) analysis of top 6 environmental variables for deep soil moisture prediction across 14 depth layers (20–300 cm).
Agriculture 15 02143 g007
Table 1. Bulk density values.
Depth Layer (cm)Bulk Density (g/cm3)
0–201.35
20–401.42
40–601.5
60–801.54
80–1001.56
100–1201.58
120–1401.6
140–1601.62
160–1801.64
180–2001.66
200–2201.67
220–2401.68
240–2601.69
260–2801.7
280–3001.71
Table 2. Parameter settings for different models.
ModelParameter Settings
RandomForestNumber of trees = 100
Random state = 42
Max depth = 15
LinearRegressionDefault parameters
MLPRegressorHidden layer structure = (64, 32)
Maximum iterations = 1000
Random state = 42
RidgeRegularization coefficient (α) = 0.1
GradientBoostingNumber of trees = 200
Learning rate = 0.1
Maximum depth = 5
Random state = 42
ElasticNetRegularization coefficient (α) = 0.5
L1 ratio = 0.7
Maximum iterations = 10,000
LassoRegularization coefficient (α) = 0.01
Maximum iterations = 10,000
SVRKernel function = RBF
C = 100
γ = 0.01
ε = 0.1
Disclaimer/Publisher’s Note: The statements, opinions and data contained in all publications are solely those of the individual author(s) and contributor(s) and not of MDPI and/or the editor(s). MDPI and/or the editor(s) disclaim responsibility for any injury to people or property resulting from any ideas, methods, instructions or products referred to in the content.