3.2.1. Optimization Results
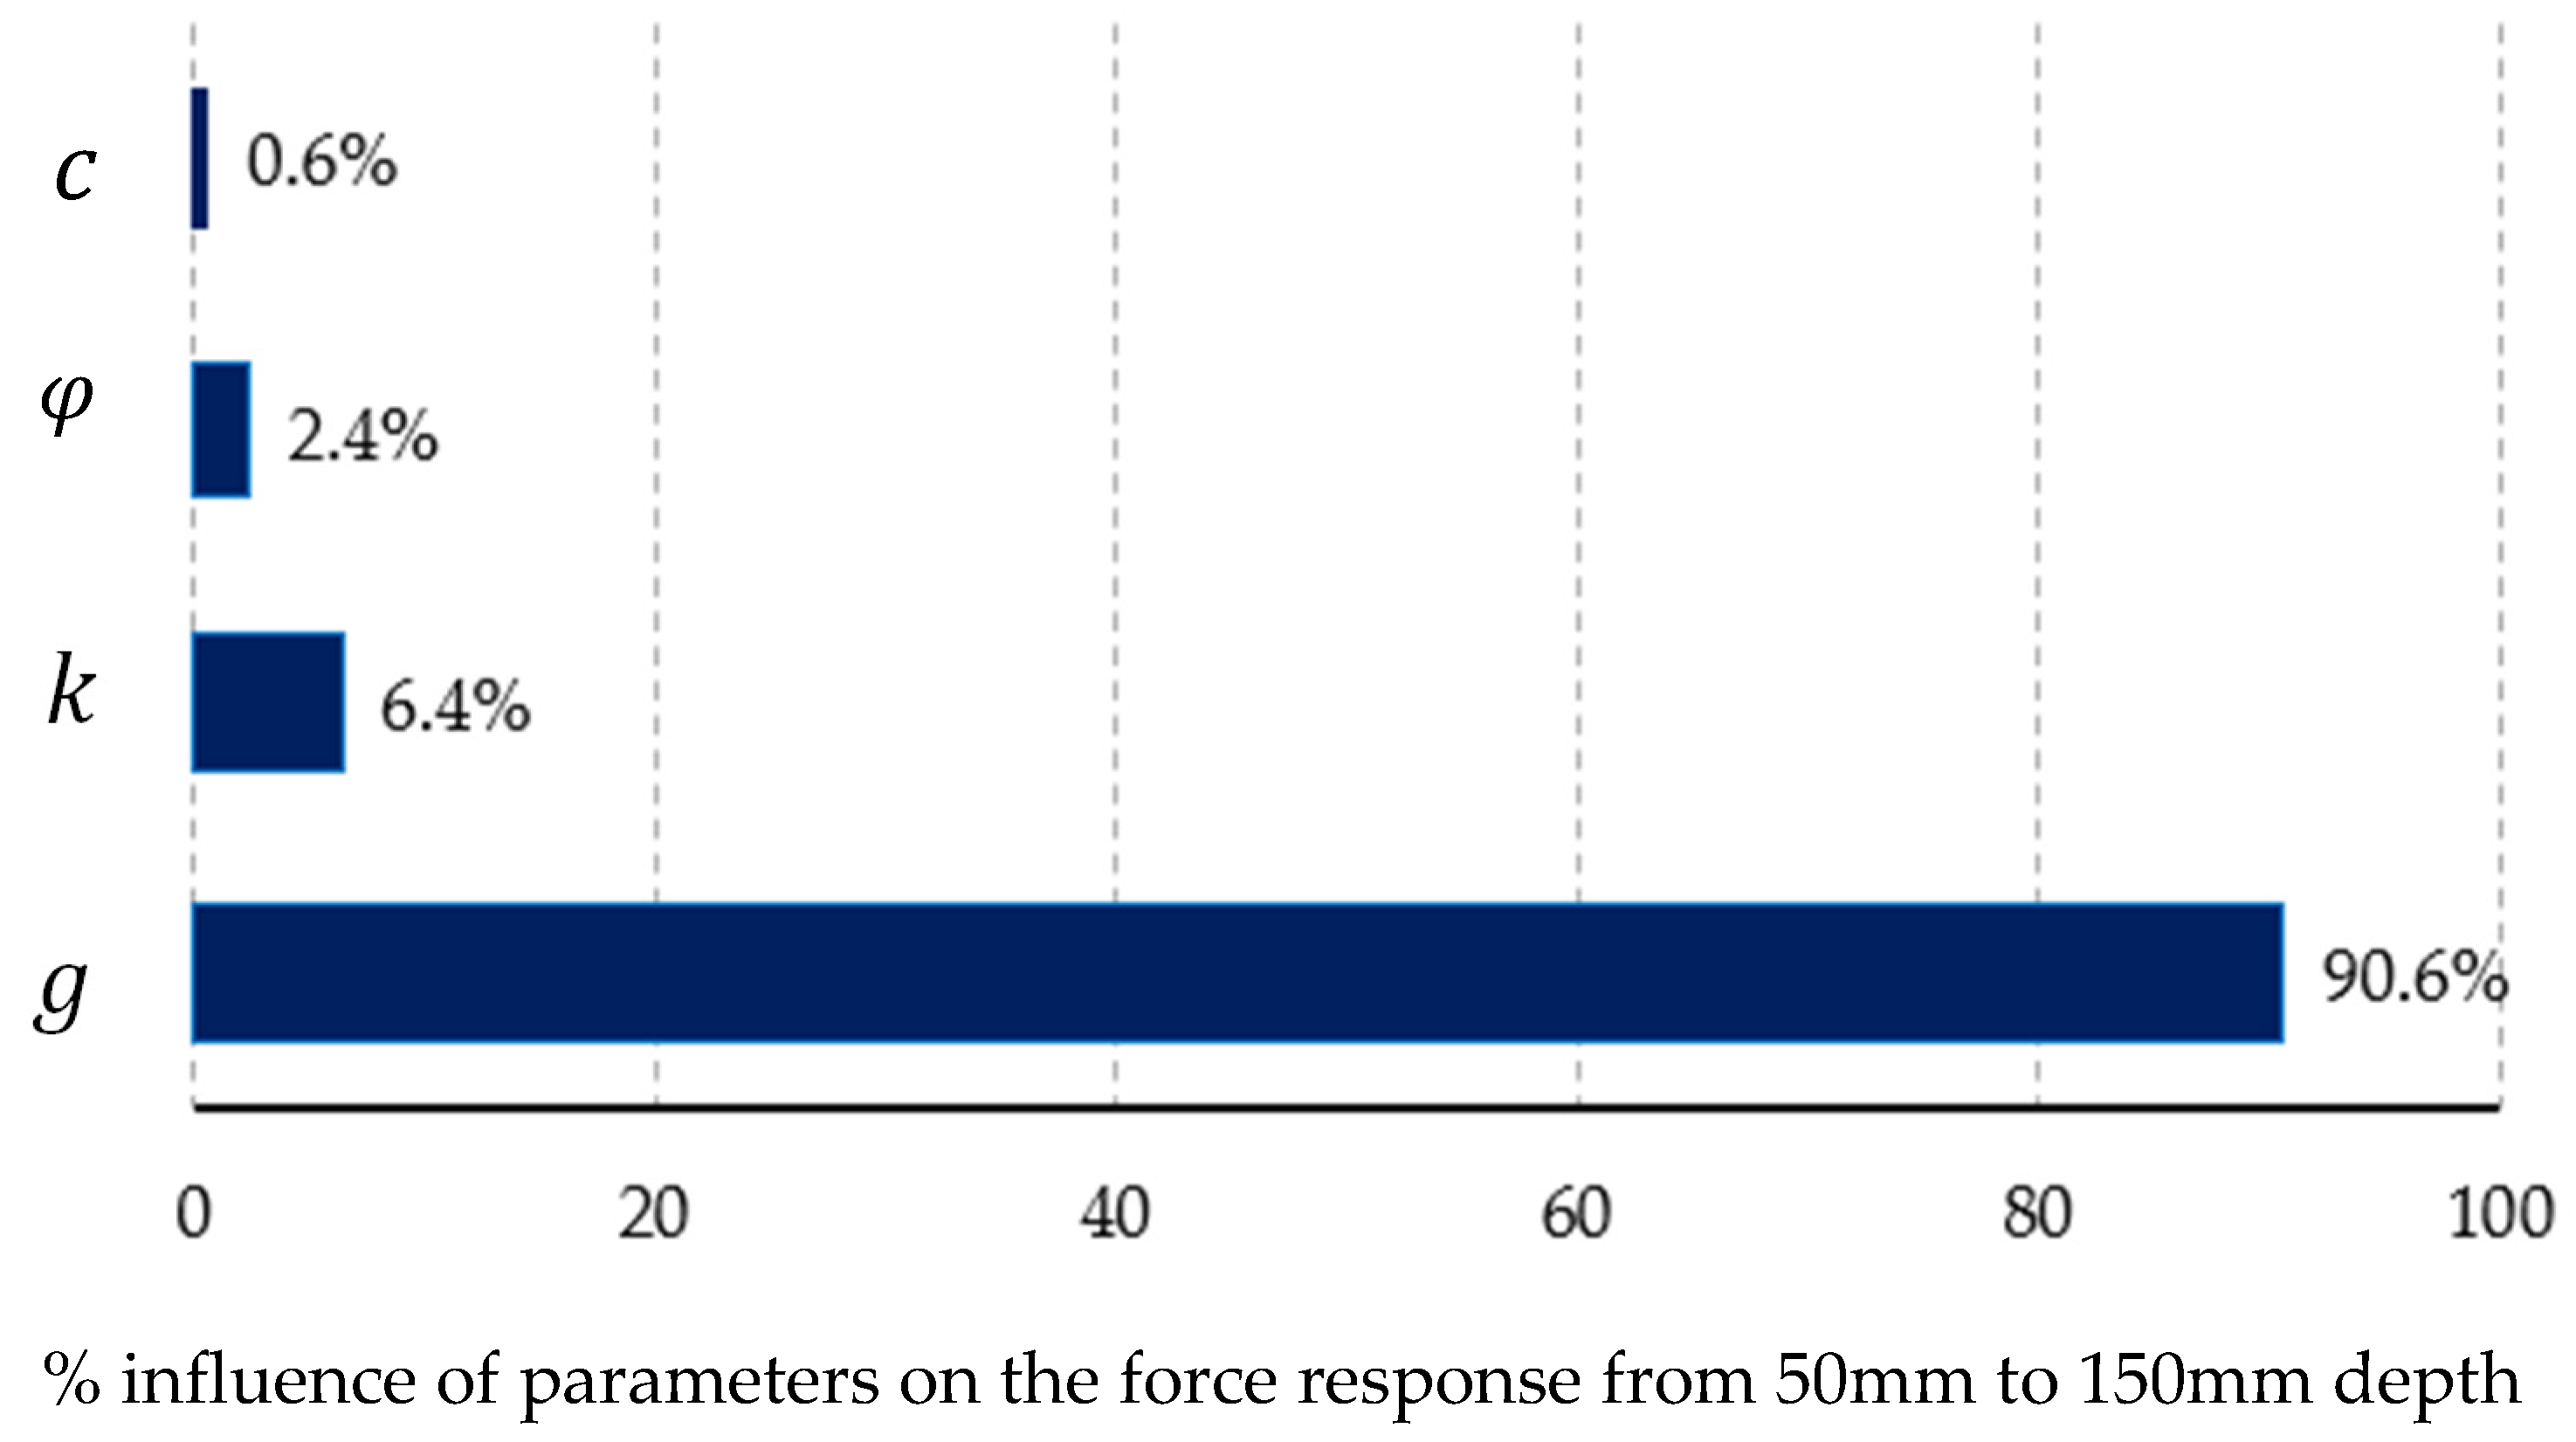
The sensitivity analysis (
Figure 16) revealed that the shear modulus (G) was the most influential parameter on the composite output (force—penetration response described in
Section 2.2.2), contributing 90.6% to the variation in the cone resistance force. This was followed by bulk modulus (K) with 6.4% influence, the angle of friction parameter (
) with 2.4%, and cohesion (c) with a minimal impact of 0.6%.
The optimized parameters (
Table 9) included a 0.057% increment in A
1, a 0.168% reduction in A
0, a 1.229% increase in G, and a 0.065% reduction in K. Additionally, φ was reduced by 8.017%, c by 12.8%, and A
2 by 11.916%. These parameter adjustments significantly improved the model’s ability to capture the peak cone resistance force, enhancing the agreement between the finite element simulation and the experimental force corridor across the 150 mm penetration depth. As a result, the FEM—SPH simulation error decreased from 5% to 2%, as detailed in
Section 3.2. The optimization results demonstrated a significantly improved fit to the experimental force corridor, with the optimized cone resistance force consistently lying within the corridor across the 150 mm penetration depth. These results validated the sensitivity analysis for sandy loam soil at 0.4% moisture content, accurately reflecting in situ behavior, particularly for granular soils where localized effects drive penetration resistance (
Section 3.1.3) The optimized soil parameters, also listed in the table below, will be used for the final part of the paper’s objective, involving a comprehensive CPT simulation employing MM—ALE, SPH, and Hybrid FEM—SPH methods to compare their performance and ensure high-fidelity representation of the soil behavior.
3.2.2. Final CPT Simulation Results with Optimized Parameters
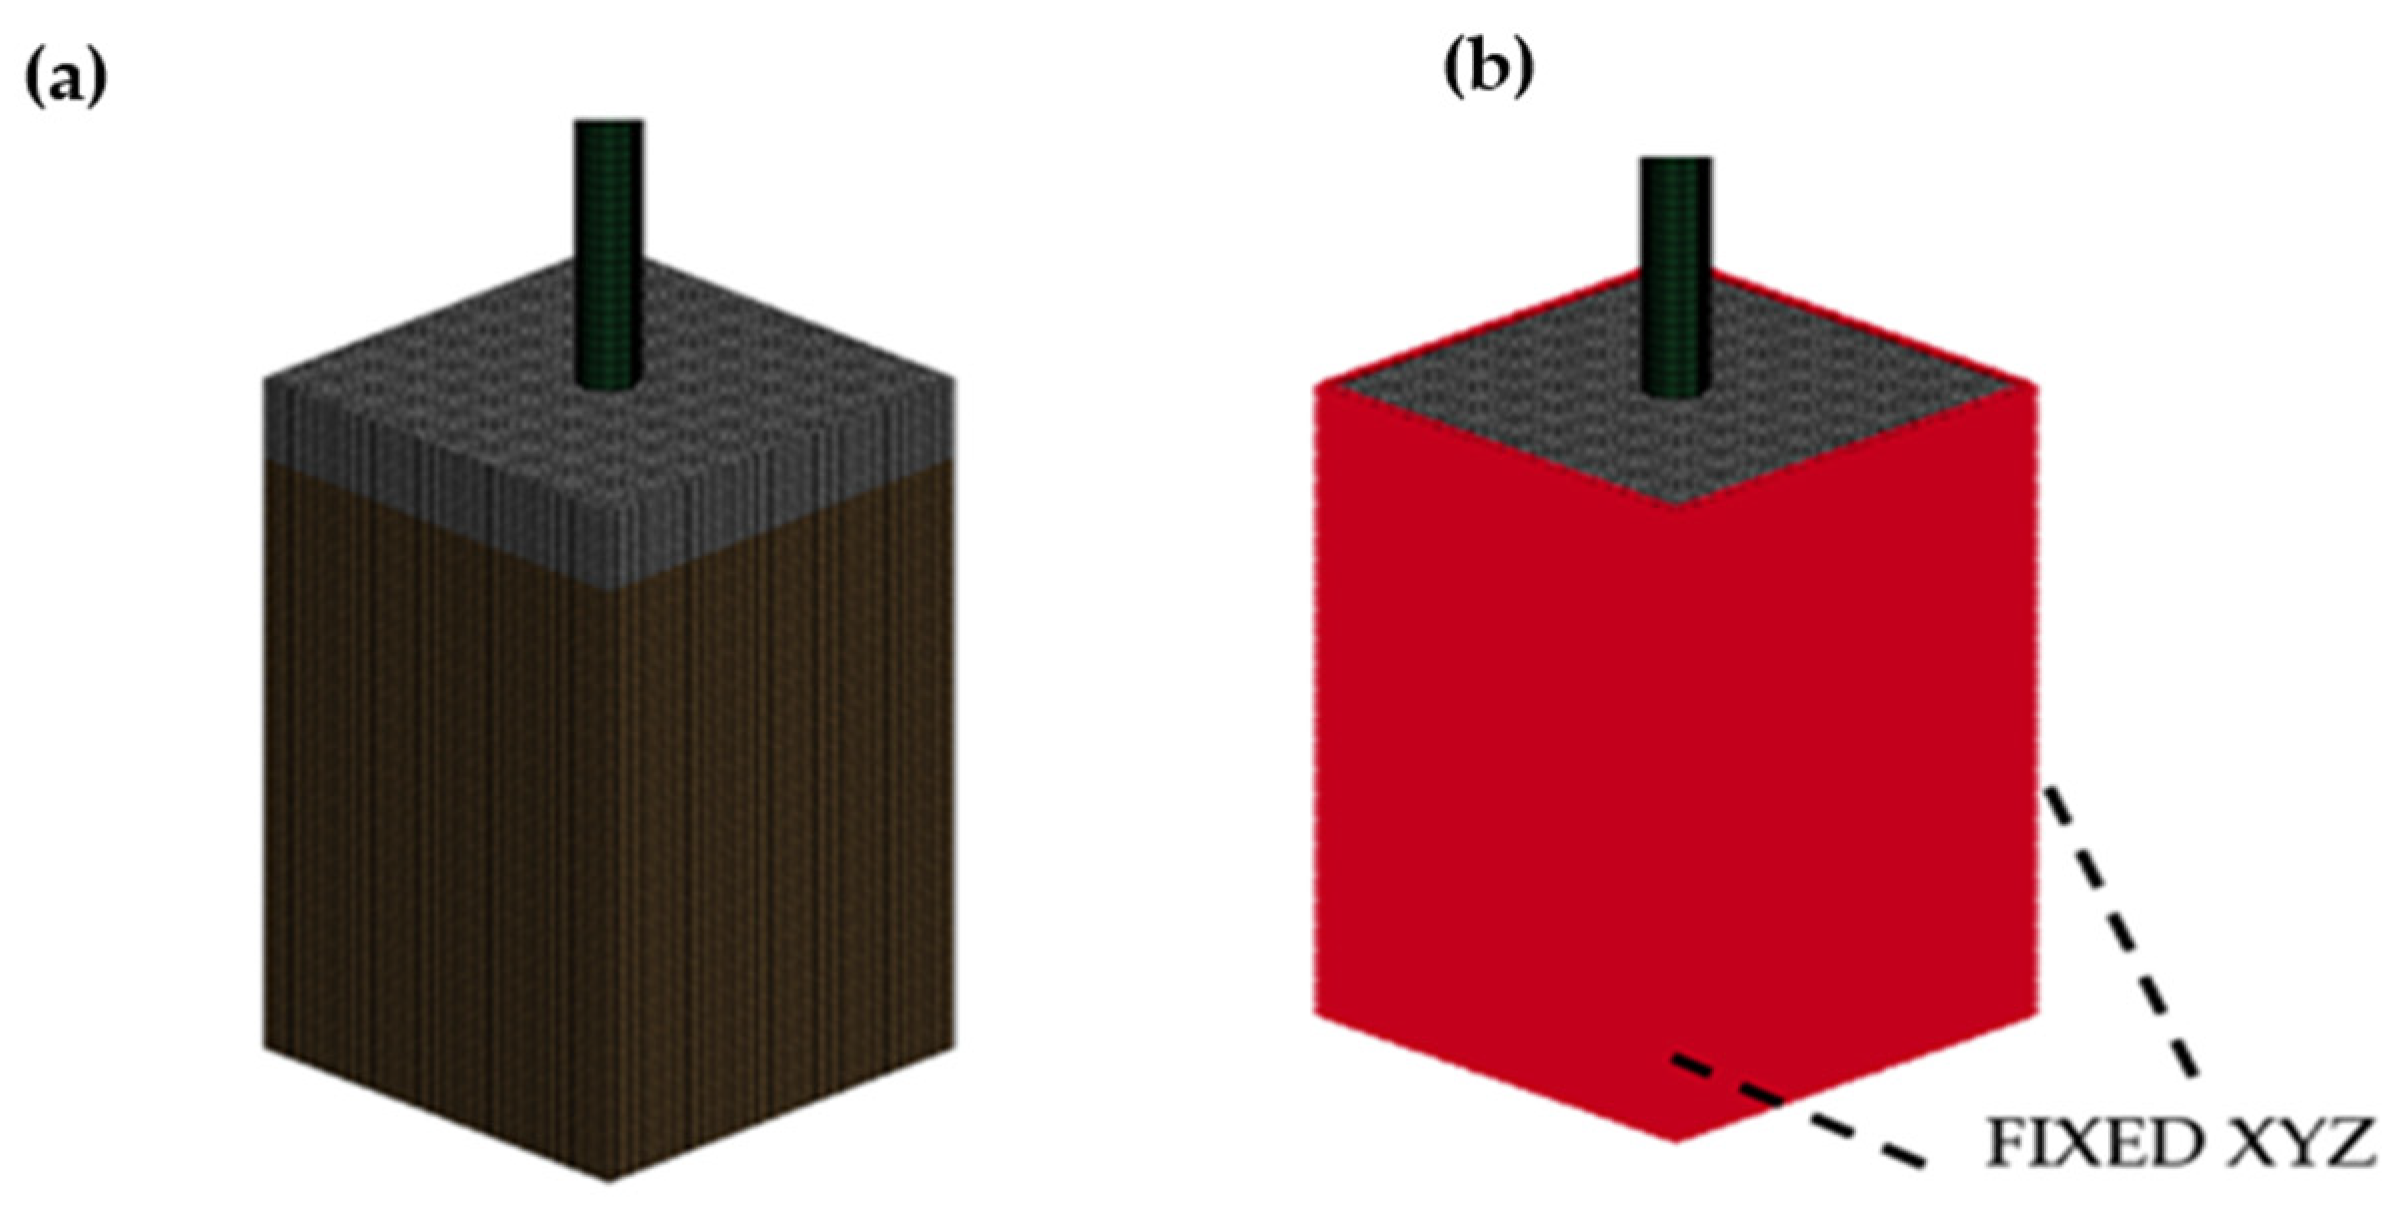
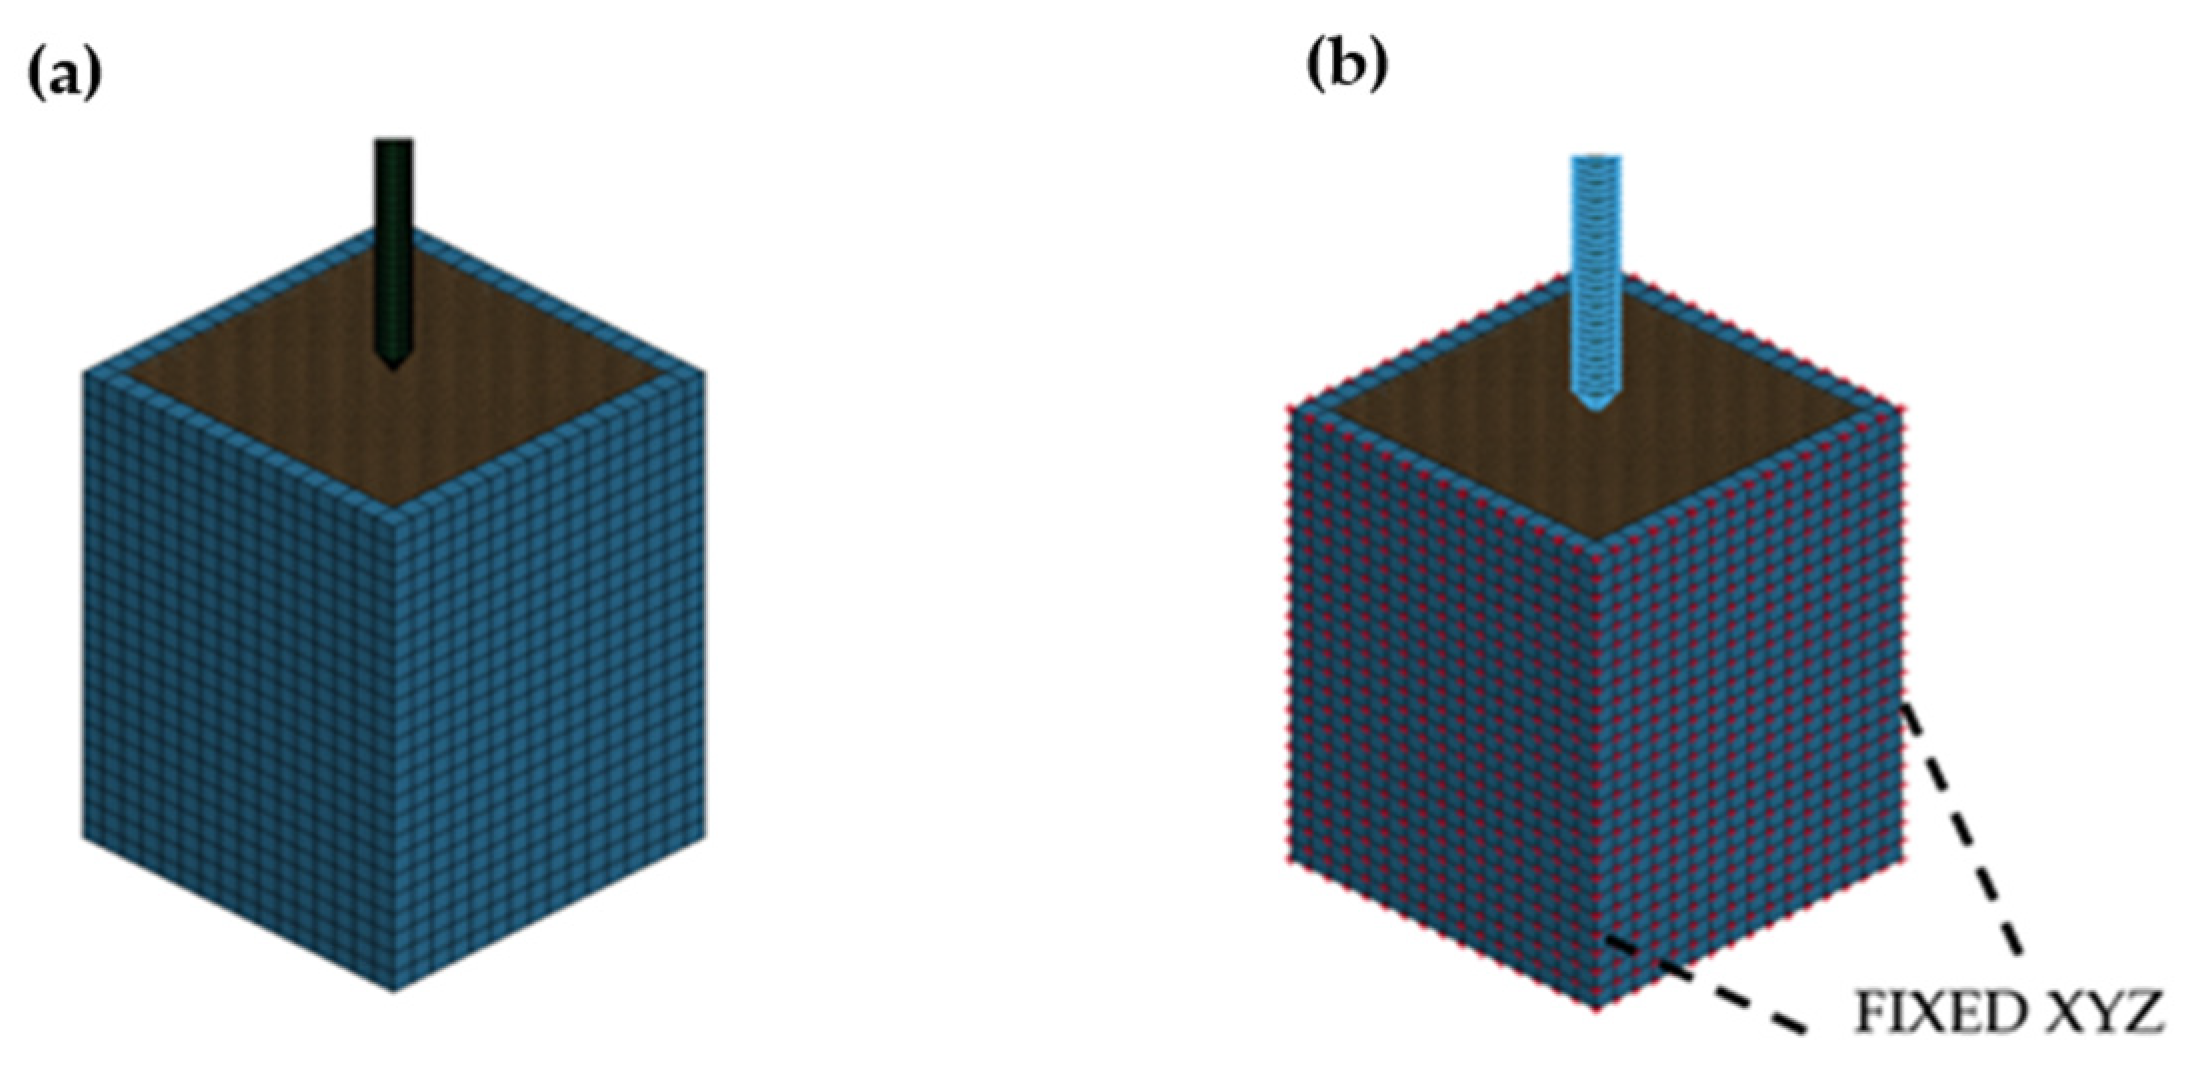
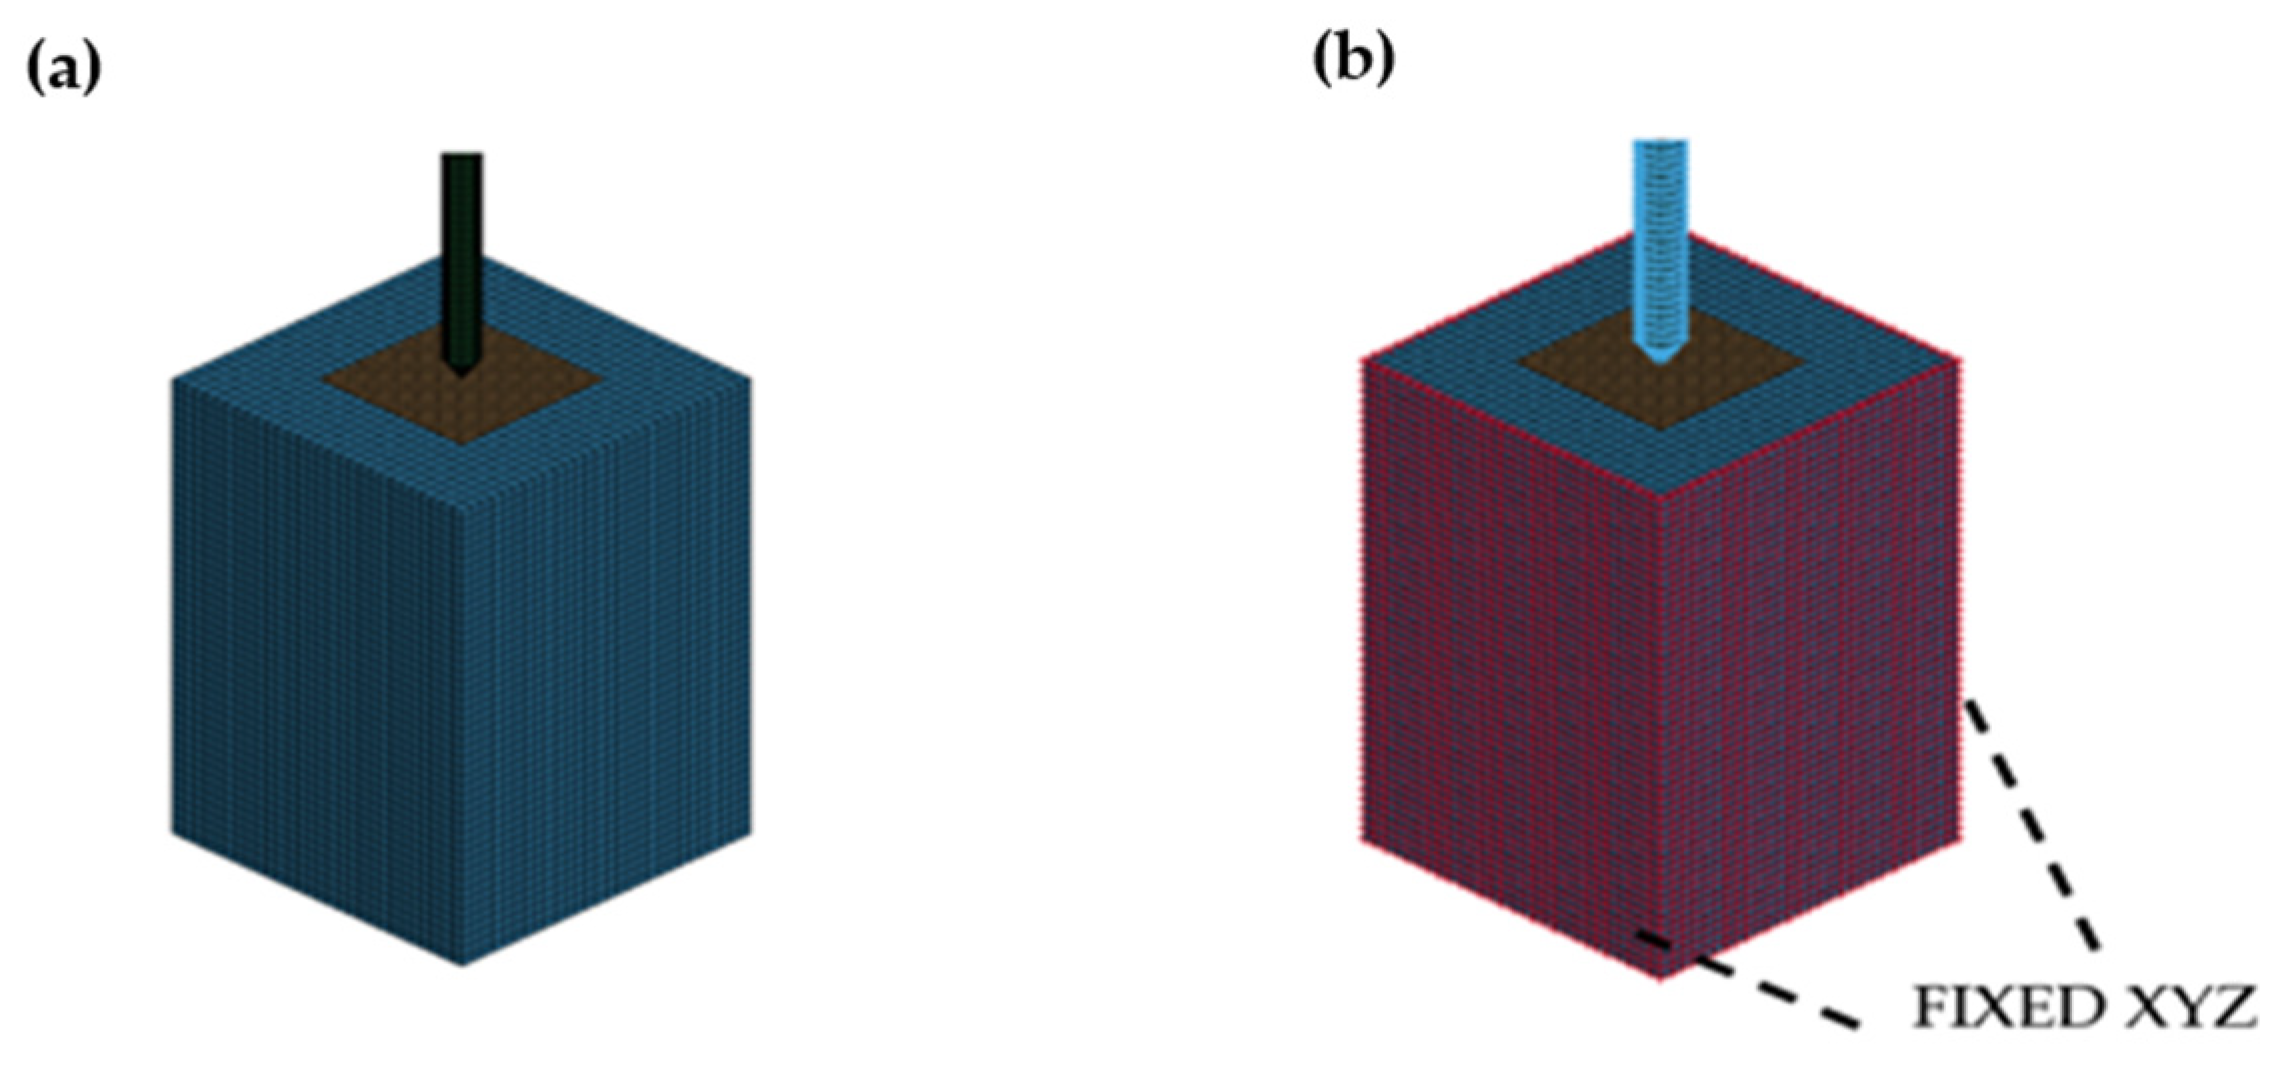
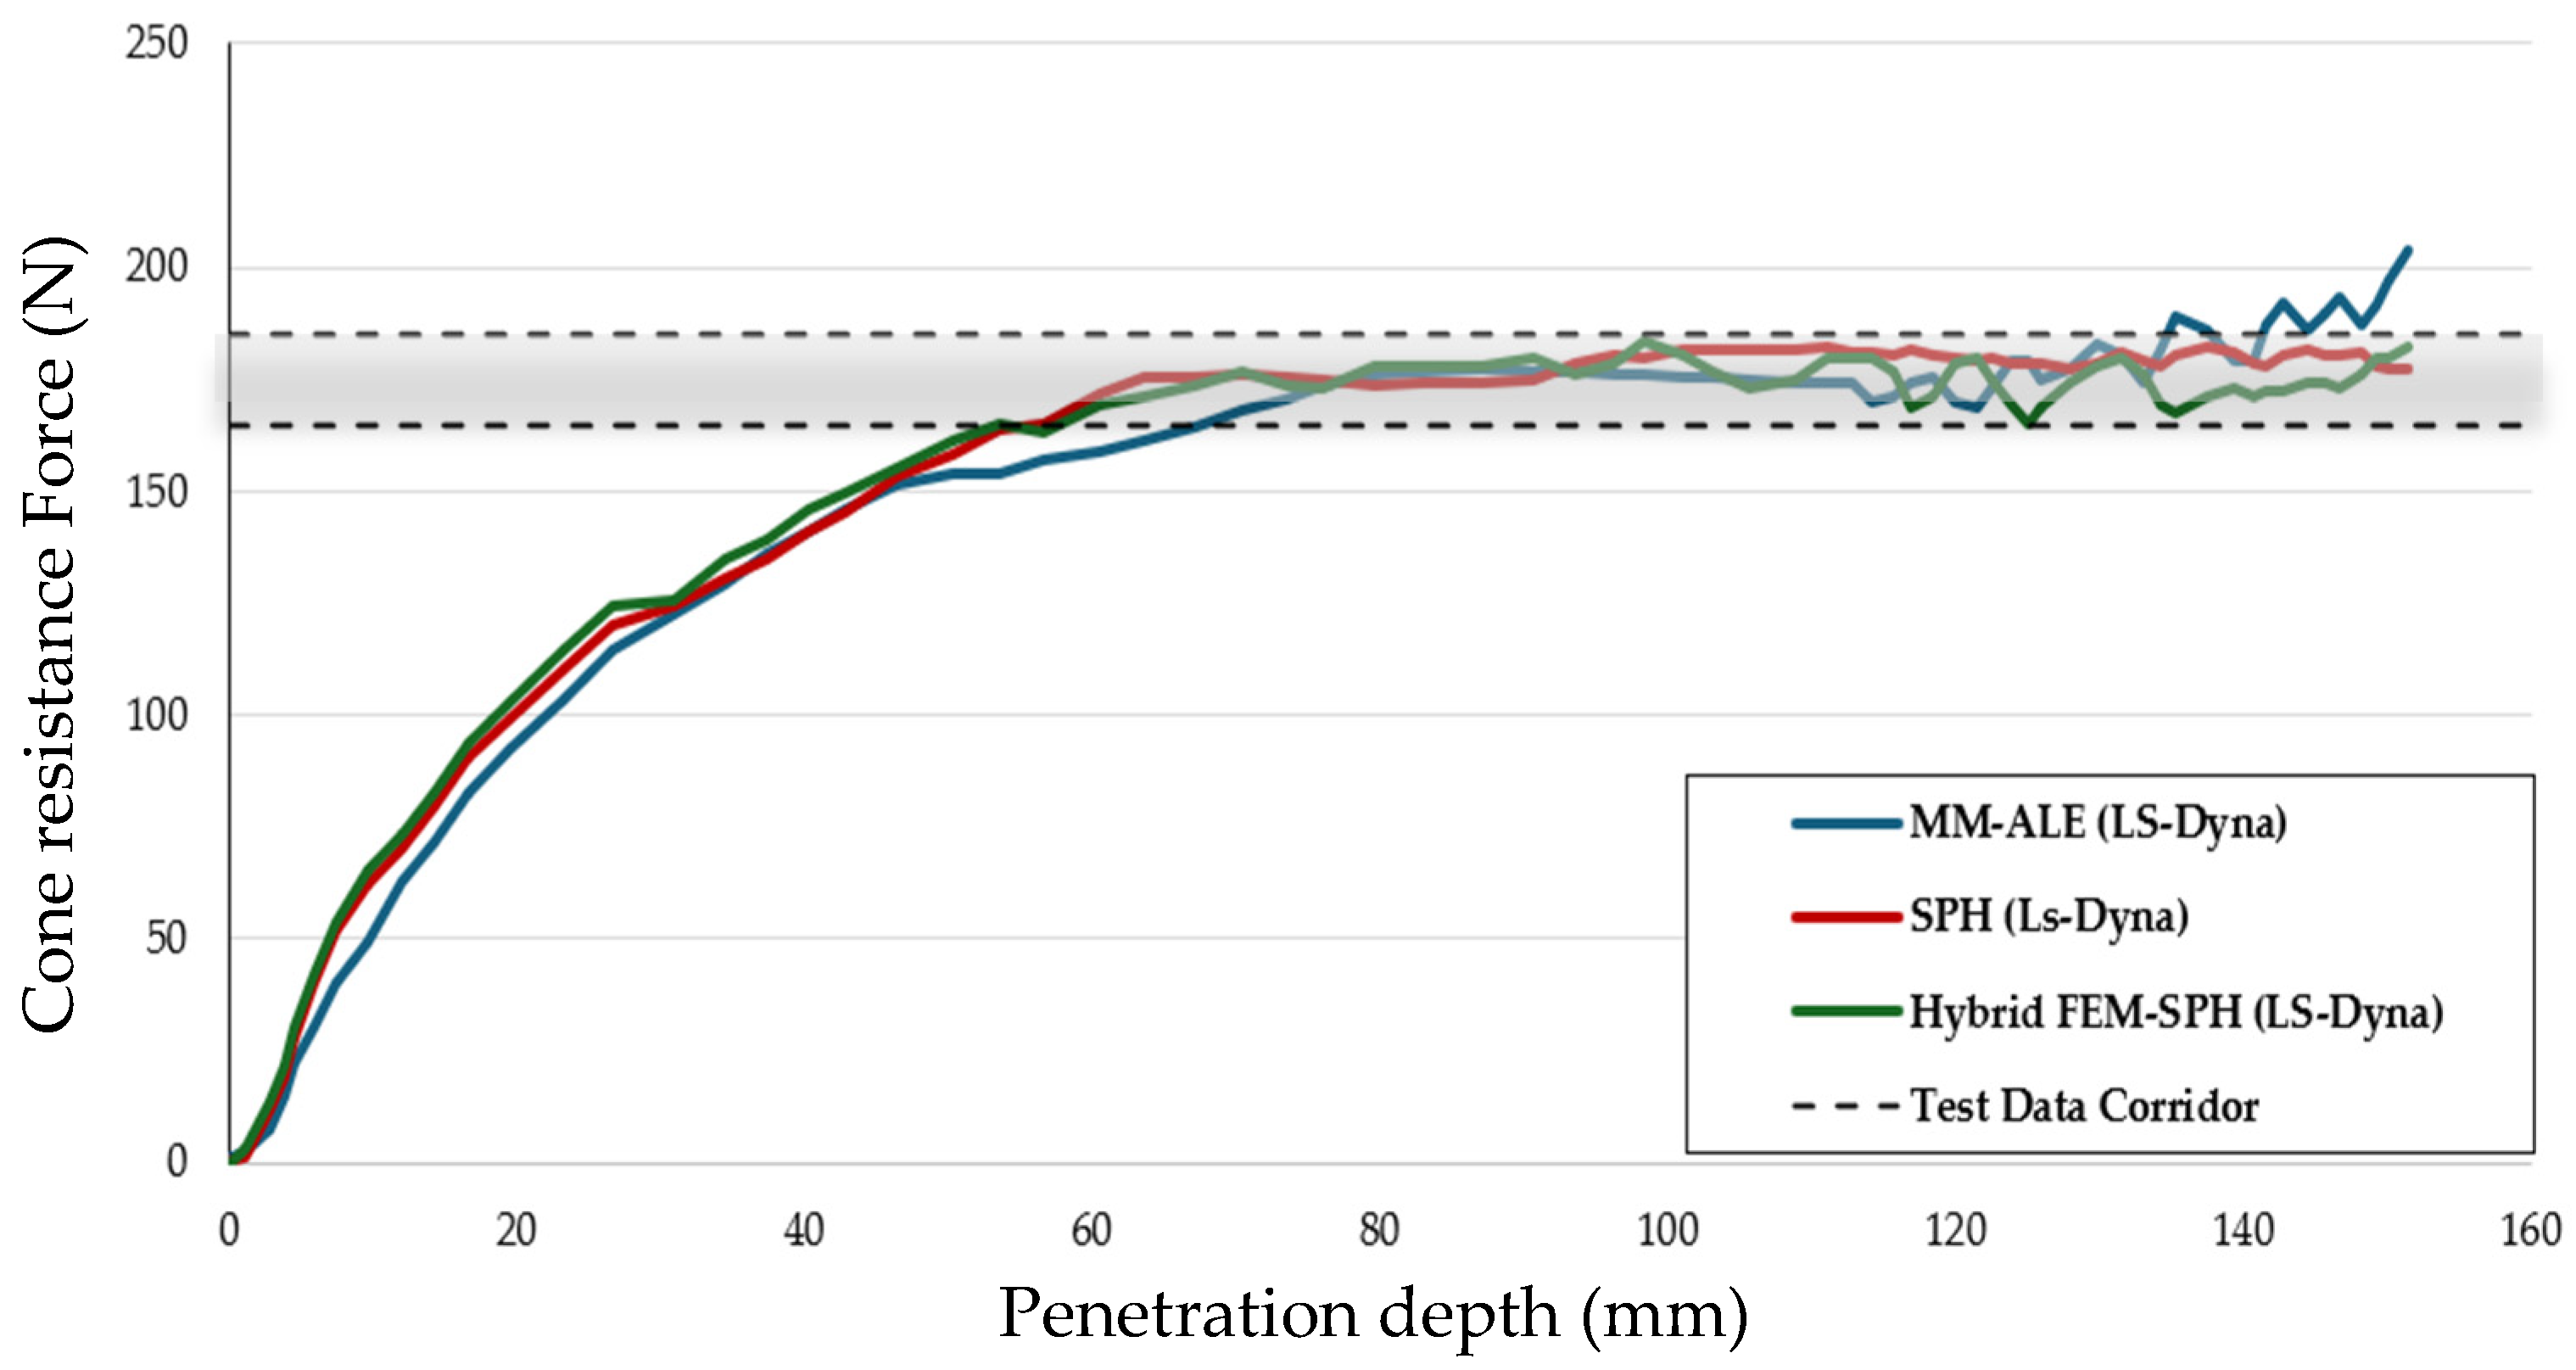
Final CPT simulations were conducted with the optimized MAT_005 parameters using MM—ALE, SPH, and Hybrid FEM—SPH methods. Force penetration curves for all three methods using optimized parameters align with the experimental corridor across the 150 mm penetration depth (
Figure 17). The Hybrid FEM—SPH method achieved the highest accuracy, with an error of only 2% compared to the experimental corridor, significantly improving from the initial 4% error as shown in (
Figure 18). This result was expected because this method was used in the optimization process. The SPH method followed with a 3% error, improved from the initial 5% error, aligning closely with the CP model [
6], which achieved a 2–3% error range [
3]. The MM—ALE method showed an error of 8%, a notable improvement from the initial 15% error (
Section 3.1.3), yet it still underperformed compared to the CEL method (20% error) and lagged the SPH-based approaches due to their mesh-based limitations in modeling localized deformations, as discussed in
Section 3.1.3.
To further highlight the impact of parameter optimization, the percentage errors of the cone resistance force for the initial and optimized simulations across all three methods were compared (
Figure 18) alongside the experimental average error range. Comparing the initial and optimized parameter simulations, the optimization process significantly enhanced accuracy across all methods. The MM—ALE method’s error decreased from 15% to 8%, the SPH method’s error reduced from 5% to 3%, and the Hybrid FEM—SPH method’s error improved from 4% to 2%. The optimized curves for SPH and Hybrid FEM—SPH now lie almost entirely within the experimental corridor (
Figure 18), showing a tighter fit than the initial simulations, where the curves occasionally deviated at higher penetration depths (beyond 100 mm). The MM—ALE method, while improved, still tends to overpredict the force, especially at deeper penetration depths, consistent with its initial behavior but with a reduced magnitude of error. The experimental average error, ranging between 2% and 3%, serves as a benchmark, confirming that the optimized Hybrid FEM—SPH and SPH methods now match or exceed this accuracy level. This visual comparison underscores the effectiveness of the optimization process in refining the MAT_005 model parameters, particularly for the meshless methods, which now exhibit errors within or below the experimental benchmark.
These results validate the proposed methodology and highlight the potential of LS-DYNA for high-fidelity soil–tire/tool interaction simulations in agricultural applications. The findings align with previous observations. on the advantages of meshless methods, especially the Hybrid FEM-SPH approach, which showed a good balance of precision and computational efficiency, making it a promising method for future studies.
3.2.3. Soil-Tire Interaction Simulation Results
The traction response of the tire–soil system across slip ratios from −10% to 30% is shown in
Figure 19. The experimental data demonstrate traction increasing from −600 N at −10% slip to approximately 800 N at 30% slip. Soil-A consistently underpredicts traction, reaching 800 N at 30% slip, while Soil-B closely follows the experimental curve, predicting ~724 N at the same slip level.
Quantitative error analysis highlights the advantage of Soil-B over Soil-A. Across the full slip range, Soil-A exhibited a root-mean-square deviation (RMSE) of 60 N and a MAPE of 10%, while Soil-B achieved significantly lower errors, with an RMSE of 20 N and a MAPE of 4.2% relative to experimental values.
This reduction in error demonstrates that the optimized Soil-B parameters better capture the nonlinear traction–slip behavior and prevent underestimation of drawbar pull, particularly at higher slip ratios. Accurate traction prediction is critical for agricultural applications, as it directly affects fuel efficiency, soil disturbance, and the development of optimized tire designs for sustainable field operations [
46].
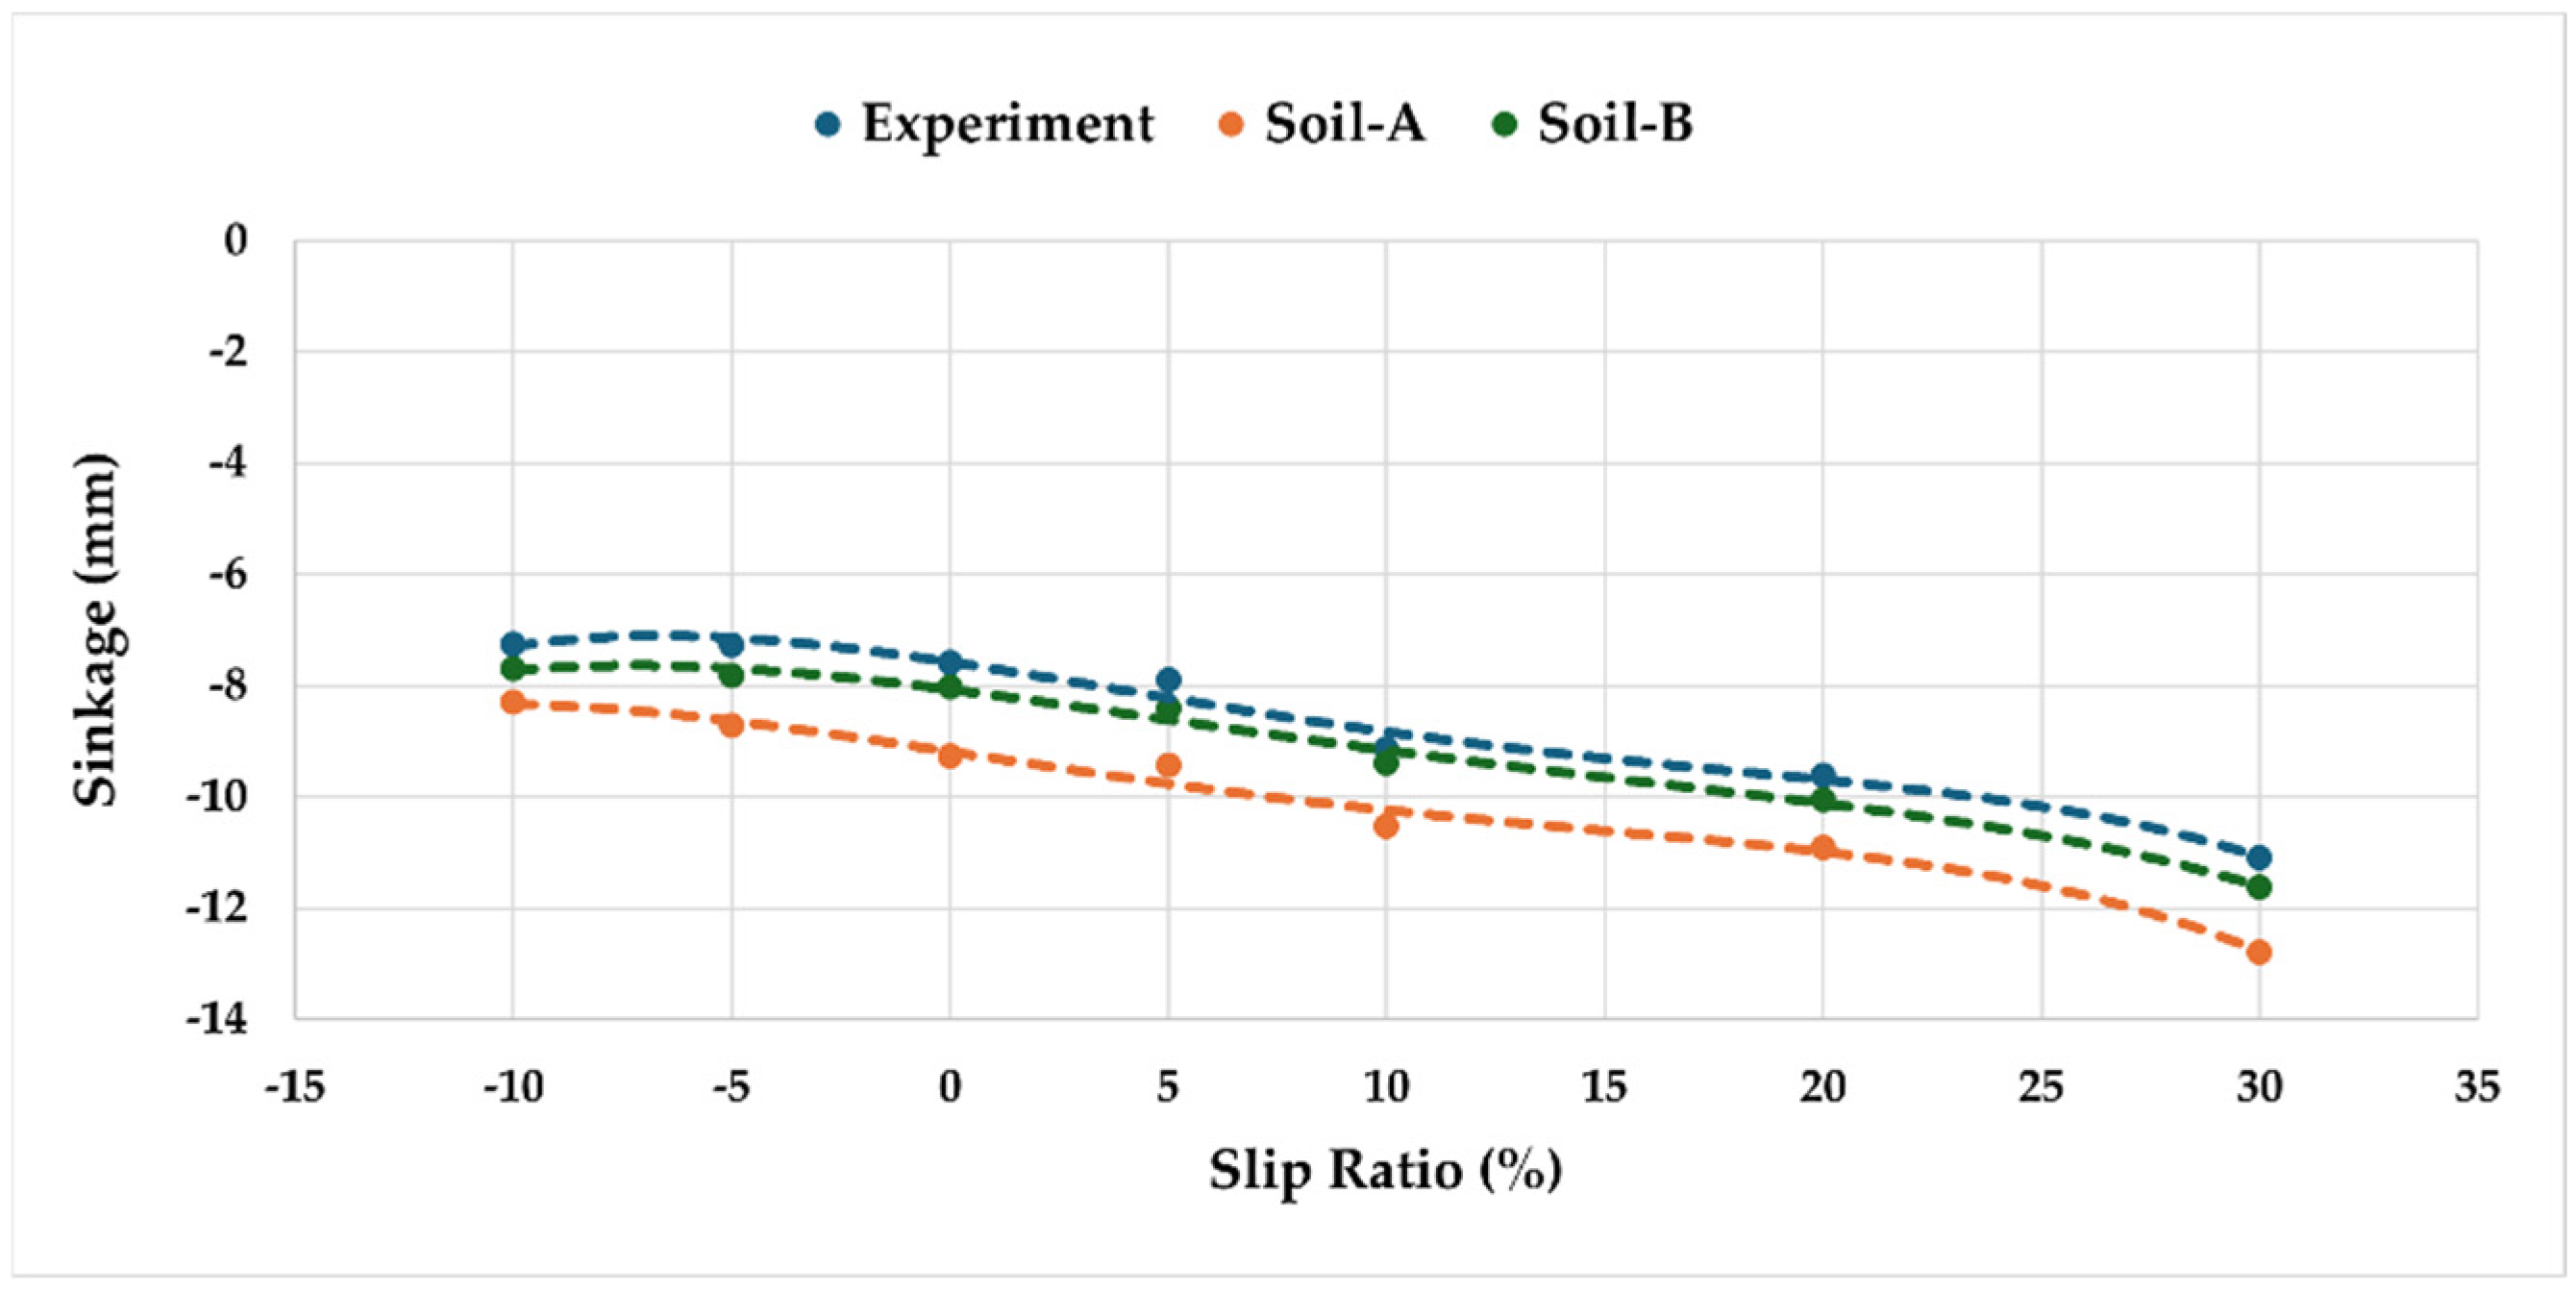
The tire sinkage response across slip ratios from −10% to 30% is shown in
Figure 20. All three datasets Experiment, Soil-A, and Soil-B—capture the initial compaction phase followed by progressive rut deepening as slip increases. The experimental results indicate sinkage increasing from −7.5 mm at −10% slip to −12.5 mm at 30% slip. Soil-A consistently underestimates sinkage, predicting a final depth of −13.5 mm, while Soil-B provides a closer match with −12.5 mm at 30% slip.
Error analysis further confirms the improved accuracy of the optimized Soil-B parameters. Across the slip ratio range, Soil-A exhibited an RMSE of 0.9 mm and a MAPE of 10%, whereas Soil-B achieved substantially lower errors, with an RMSE of 0.3 mm and a MAPE of 3.5% relative to experimental data.
The improved predictive performance of Soil-B demonstrates its capability to capture soil deformation trends more reliably under operational loading. This is critical in agricultural applications, as excessive rut depth directly correlates with soil compaction, reduced porosity, impaired water infiltration, and potential yield losses of 20–50% depending on soil type and severity [
17,
38]. By more accurately representing soil deformation, Soil-B supports better evaluation of field traffic impacts and enables tire design and load management strategies that protect long-term soil productivity.
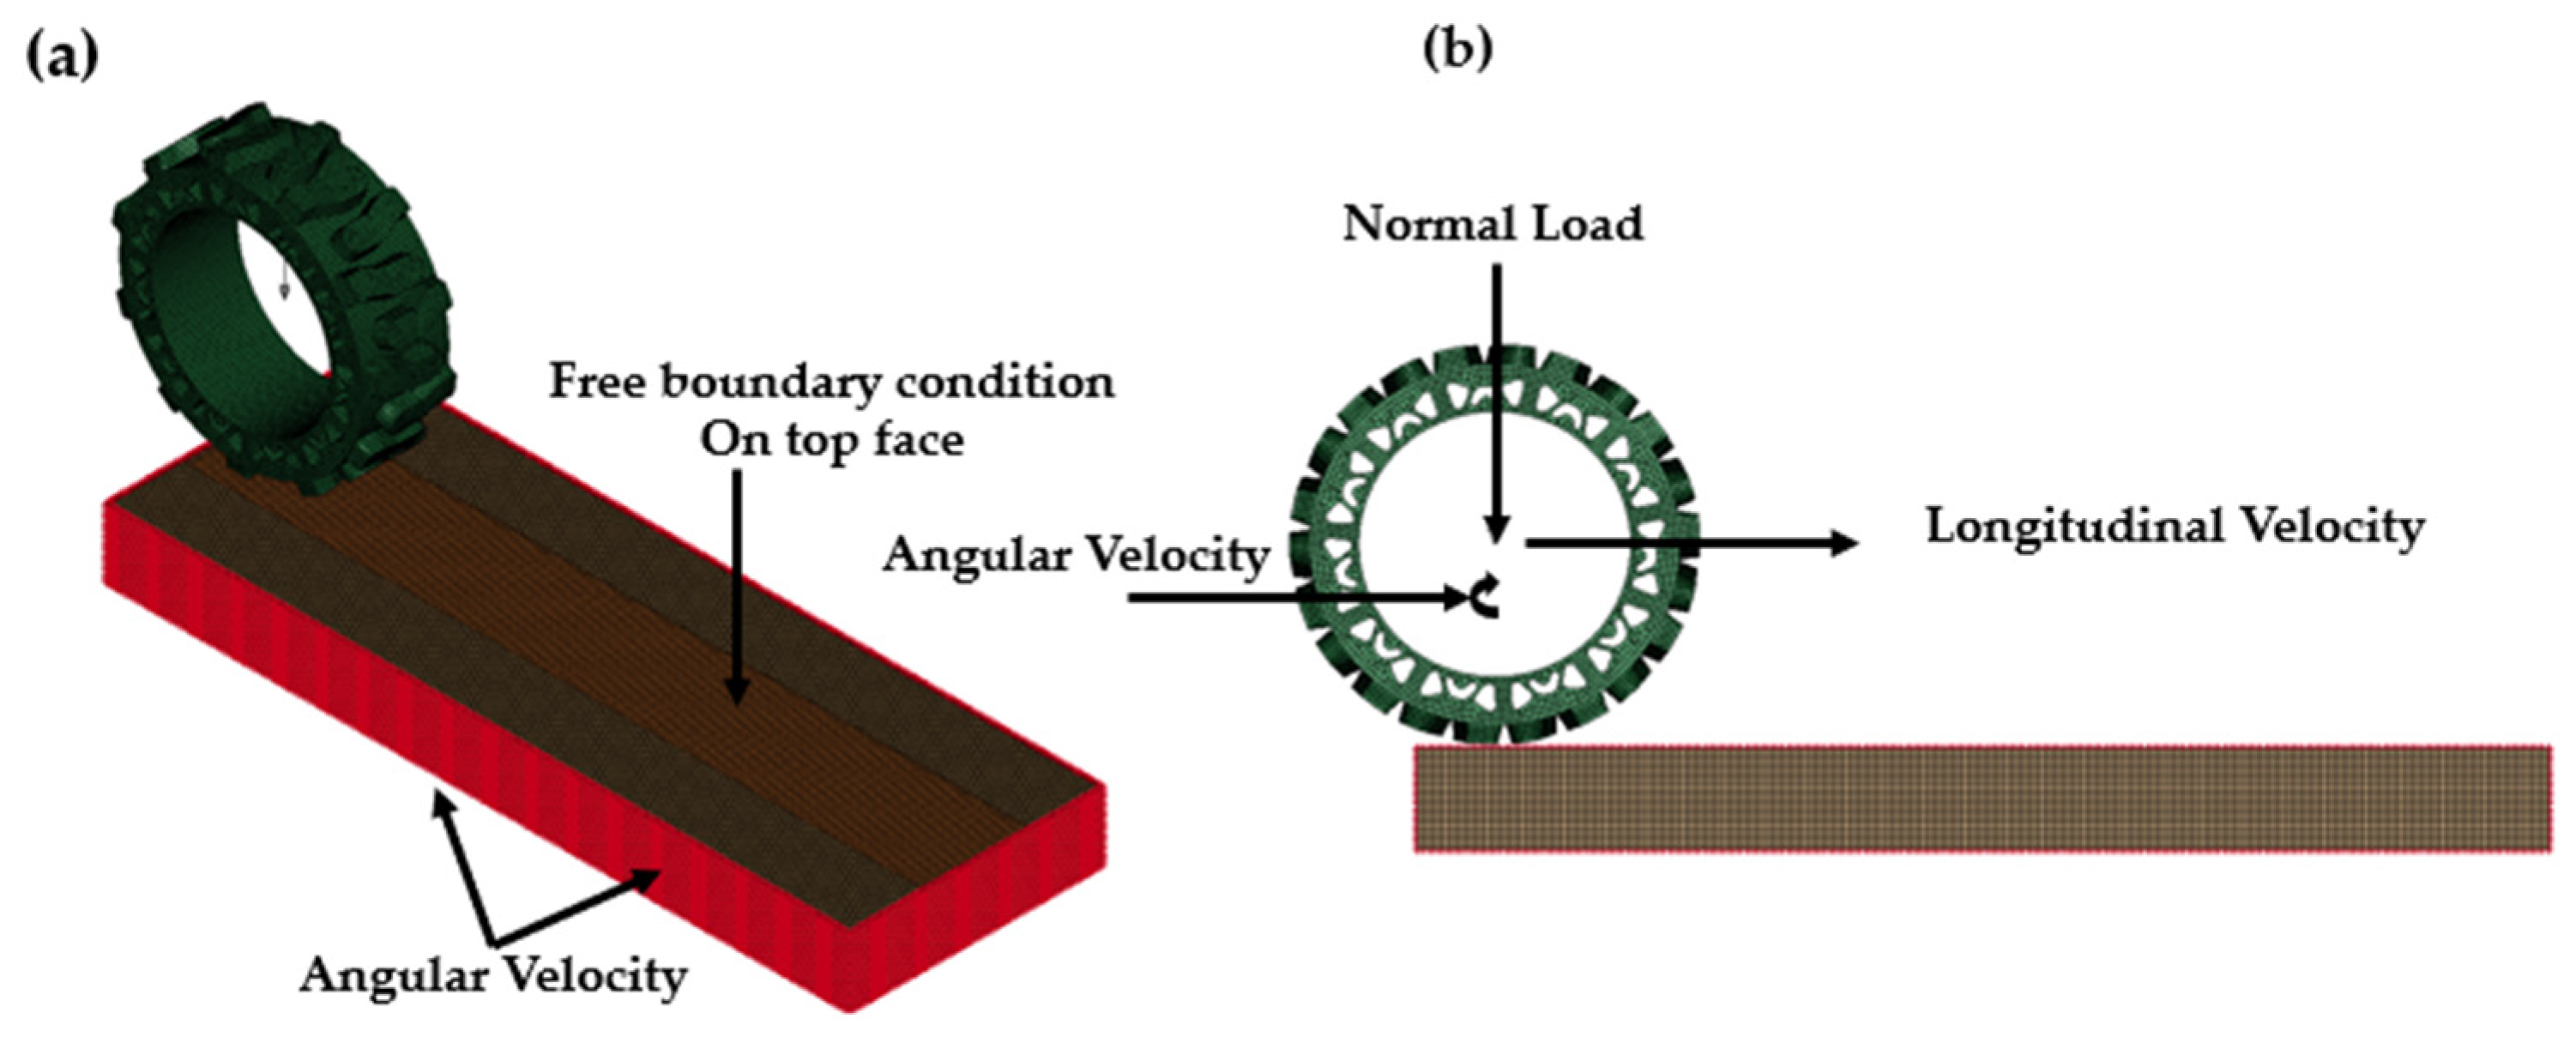
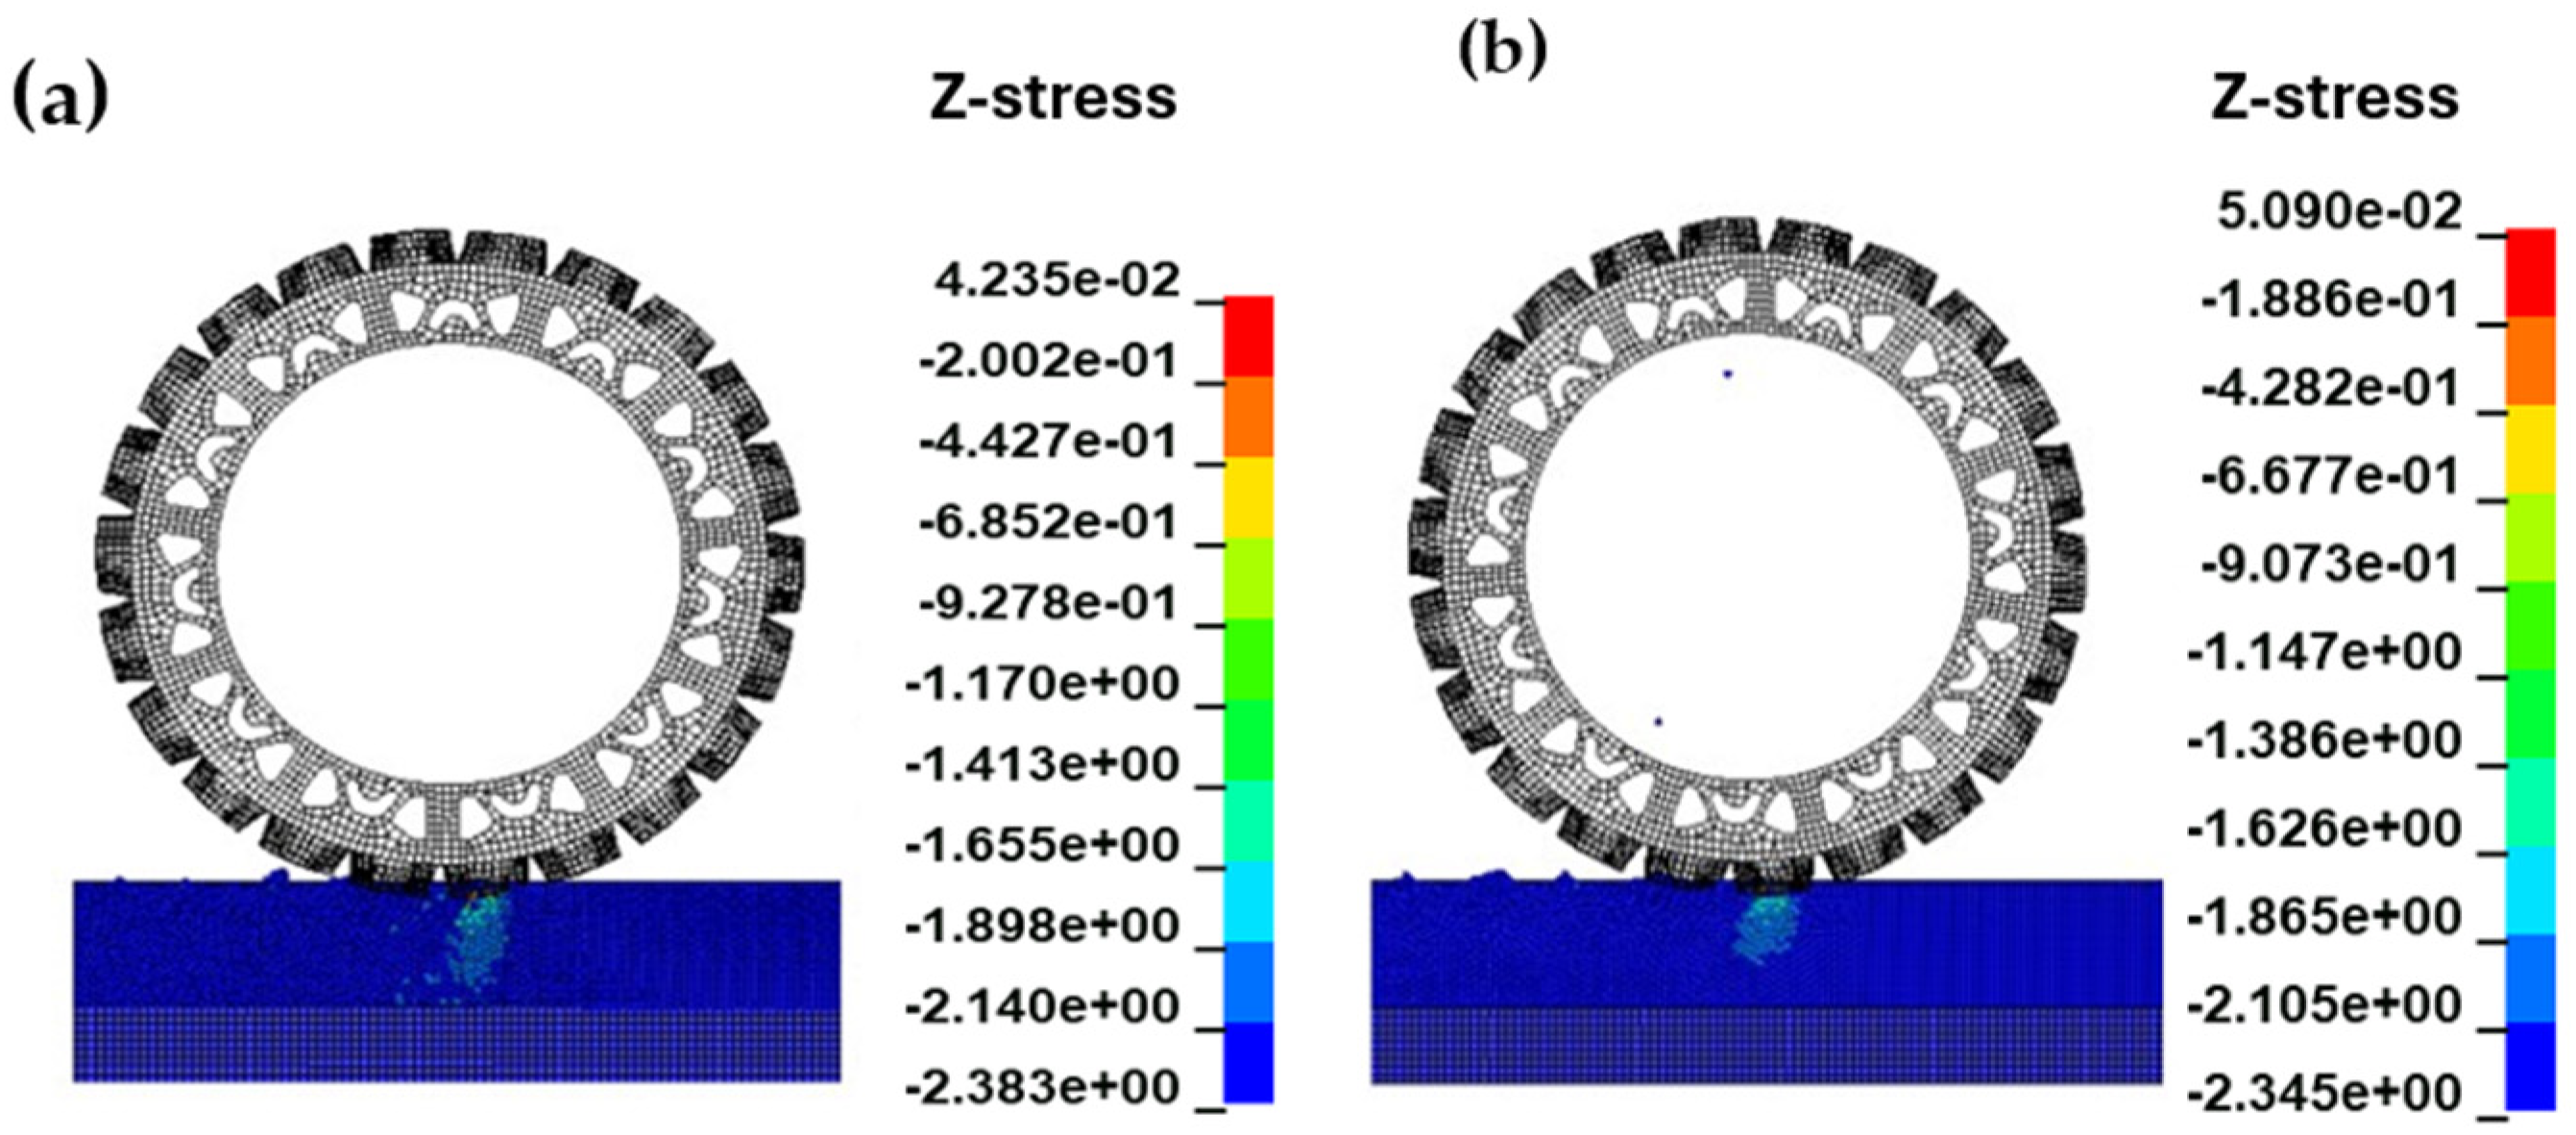
The comparison of normal stress (
Figure 21), shear stress (
Figure 22), effective plastic strain (
Figure 23), and rut profiles (
Figure 24) for the lab-tested soil parameters (Soil-A) and optimized parameters (Soil-B) under a 3 kN normal load and 0% slip ratio, benchmarked against experimental 3D-scanned rut profiles [
45]. In the standard stress contour plots (
Figure 21), both Soil-A and Soil-B captured the stress bulb formation beneath the tire—a key indicator of soil compaction and load transfer in off-road agricultural applications [
46,
47] but Soil-B produced a distribution and magnitude that more closely matched experimental observations, particularly in the uniformity and depth of the stress bulb. The shear stress plots (
Figure 22) further revealed that Soil-B’s contours aligned more closely with the experimentally observed slip plane, with a more realistic distribution of tensile stresses in front of the tire and compressive stress behind it, improving the prediction of traction efficiency and energy loss during field operations [
48]. In the effective plastic strain plots (
Figure 23), Soil-B better reproduced the depth and lateral spread of permanent deformation zones, closely matching the experimental rut shapes, which is vital for assessing cumulative soil compaction effects that can reduce porosity and crop yield [
49,
50]. Finally, the rut profile comparison (
Figure 24) confirmed that Soil-B more accurately replicated rut depth, width, and lug imprint geometry, while Soil-A underestimated both deformation depth and the lateral soil displacement around the rut. Overall, across all four figure sets, the improved agreement of Soil-B with experimental data highlights the advantage of optimized parameters in predicting soil response, making them more reliable for evaluating tire performance and developing strategies to mitigate harmful compaction in agricultural operations.
3.2.4. Comparative Analysis and Limitations
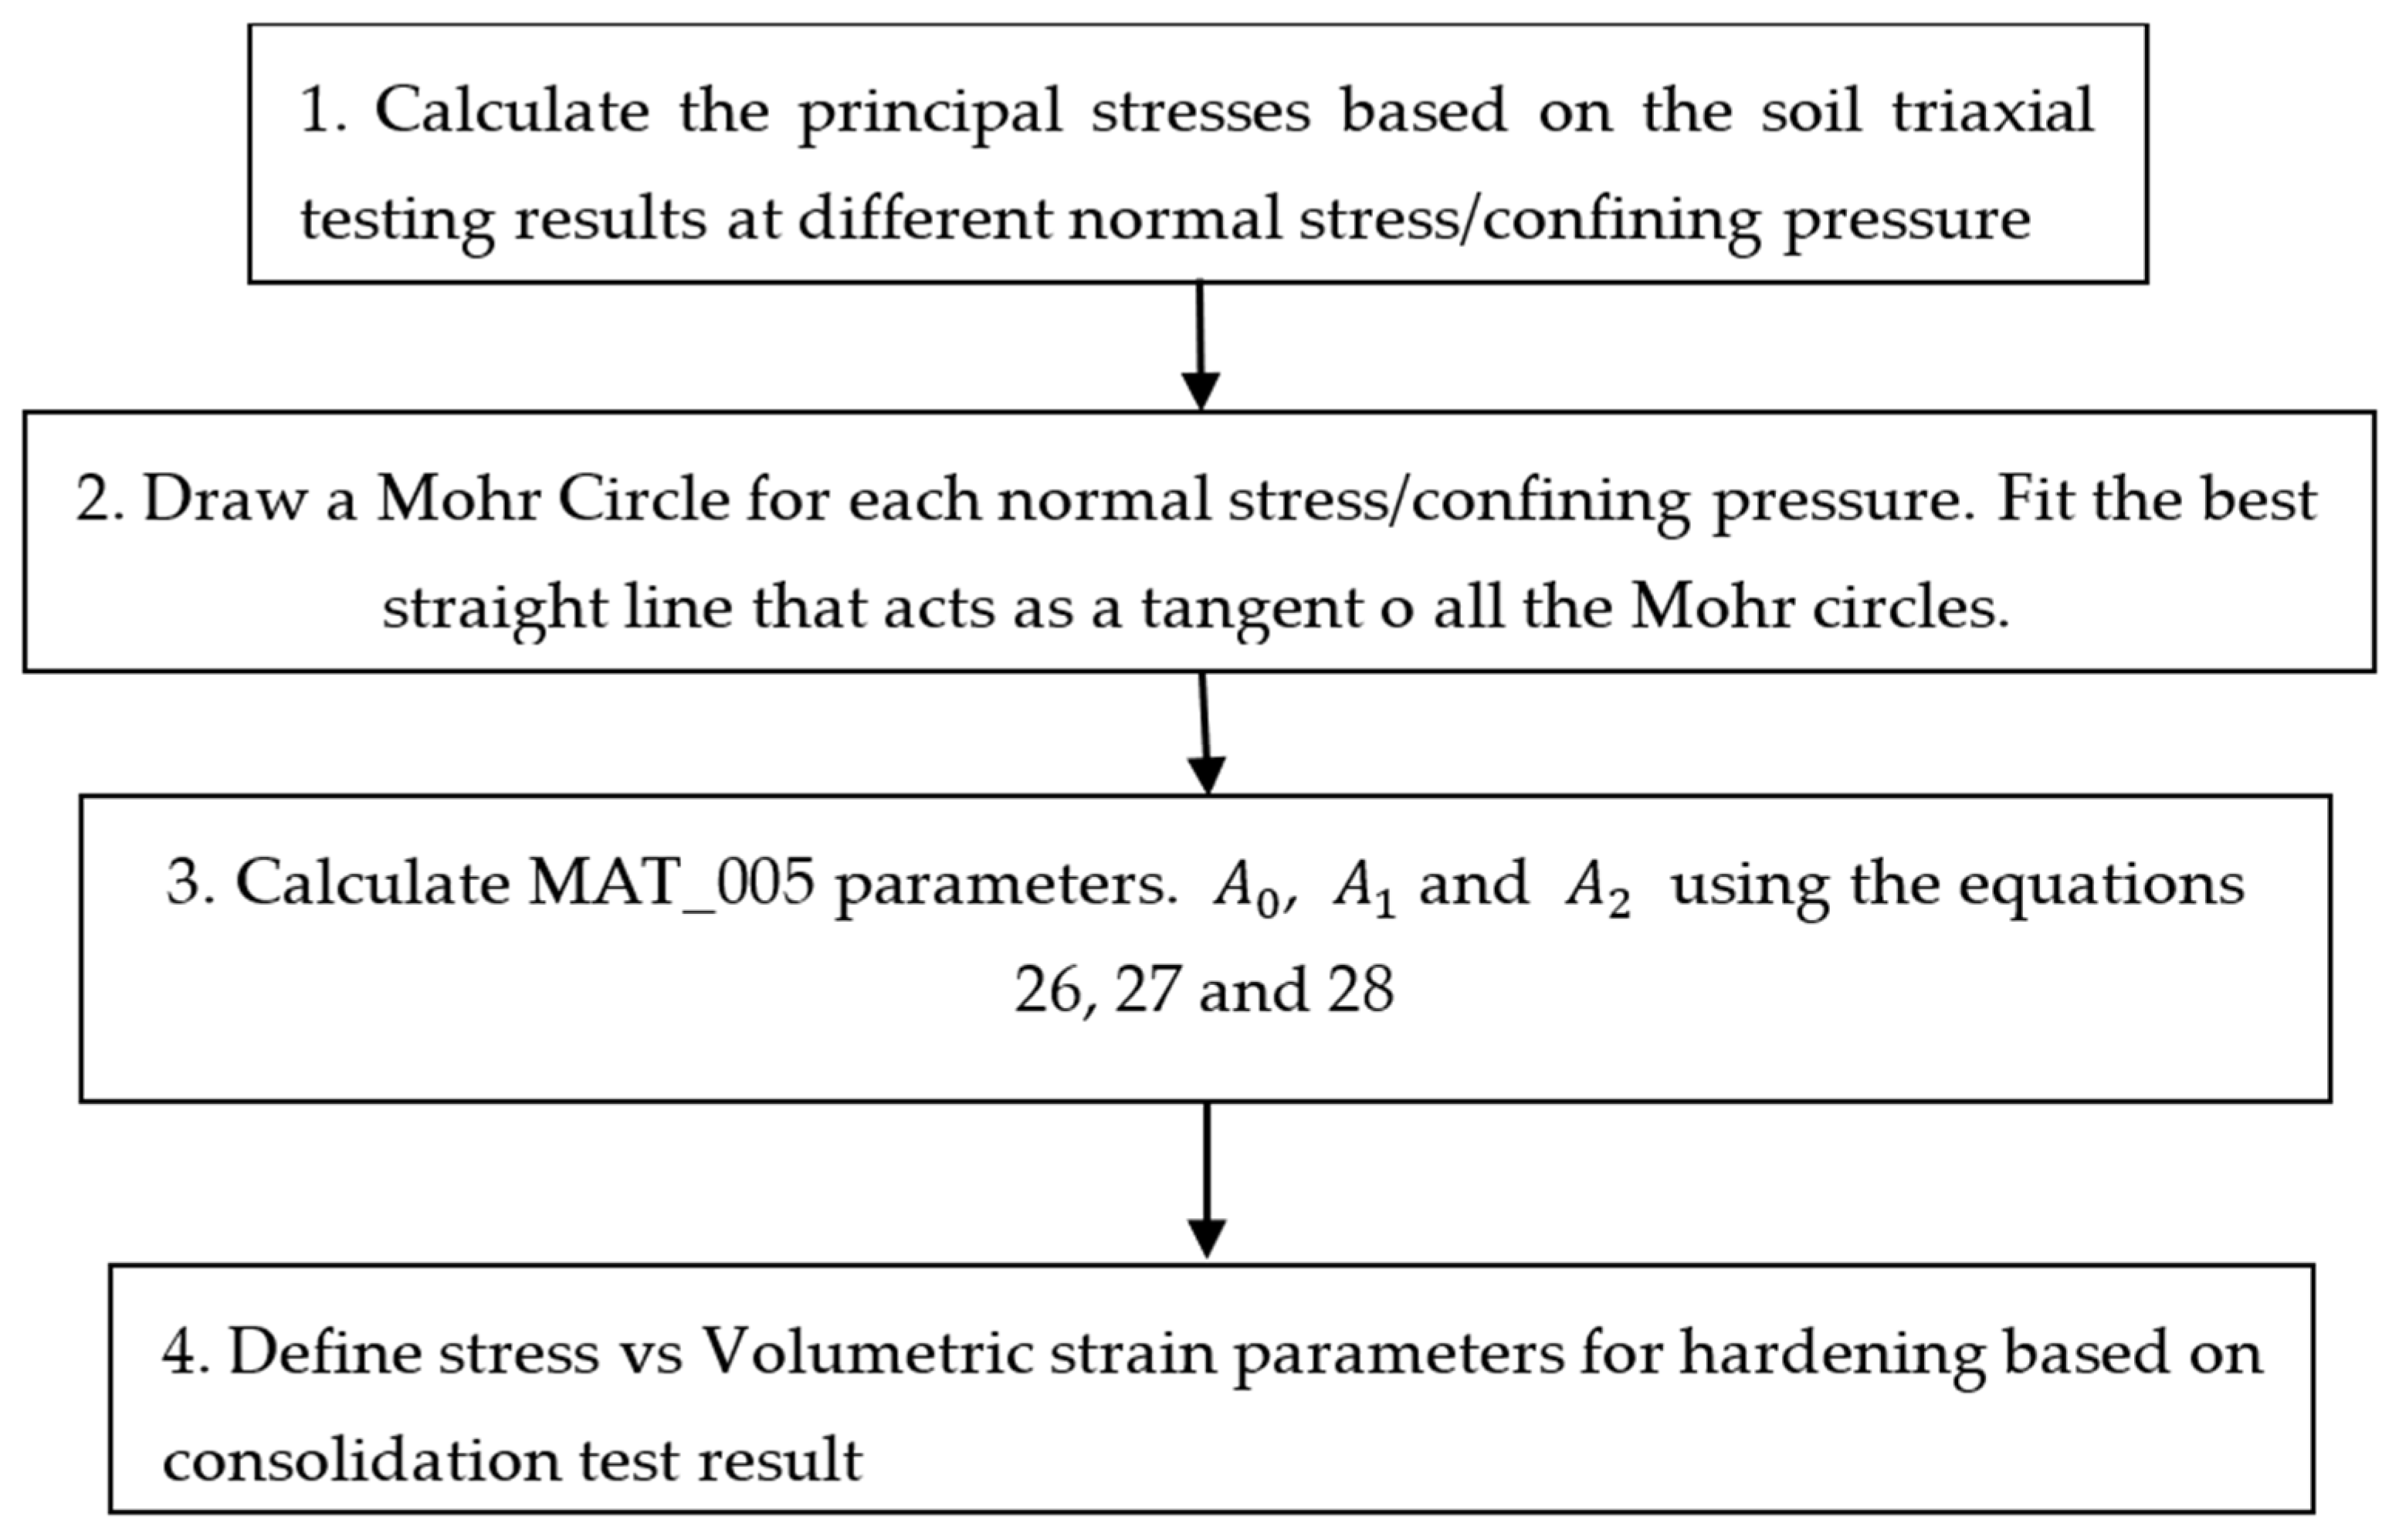
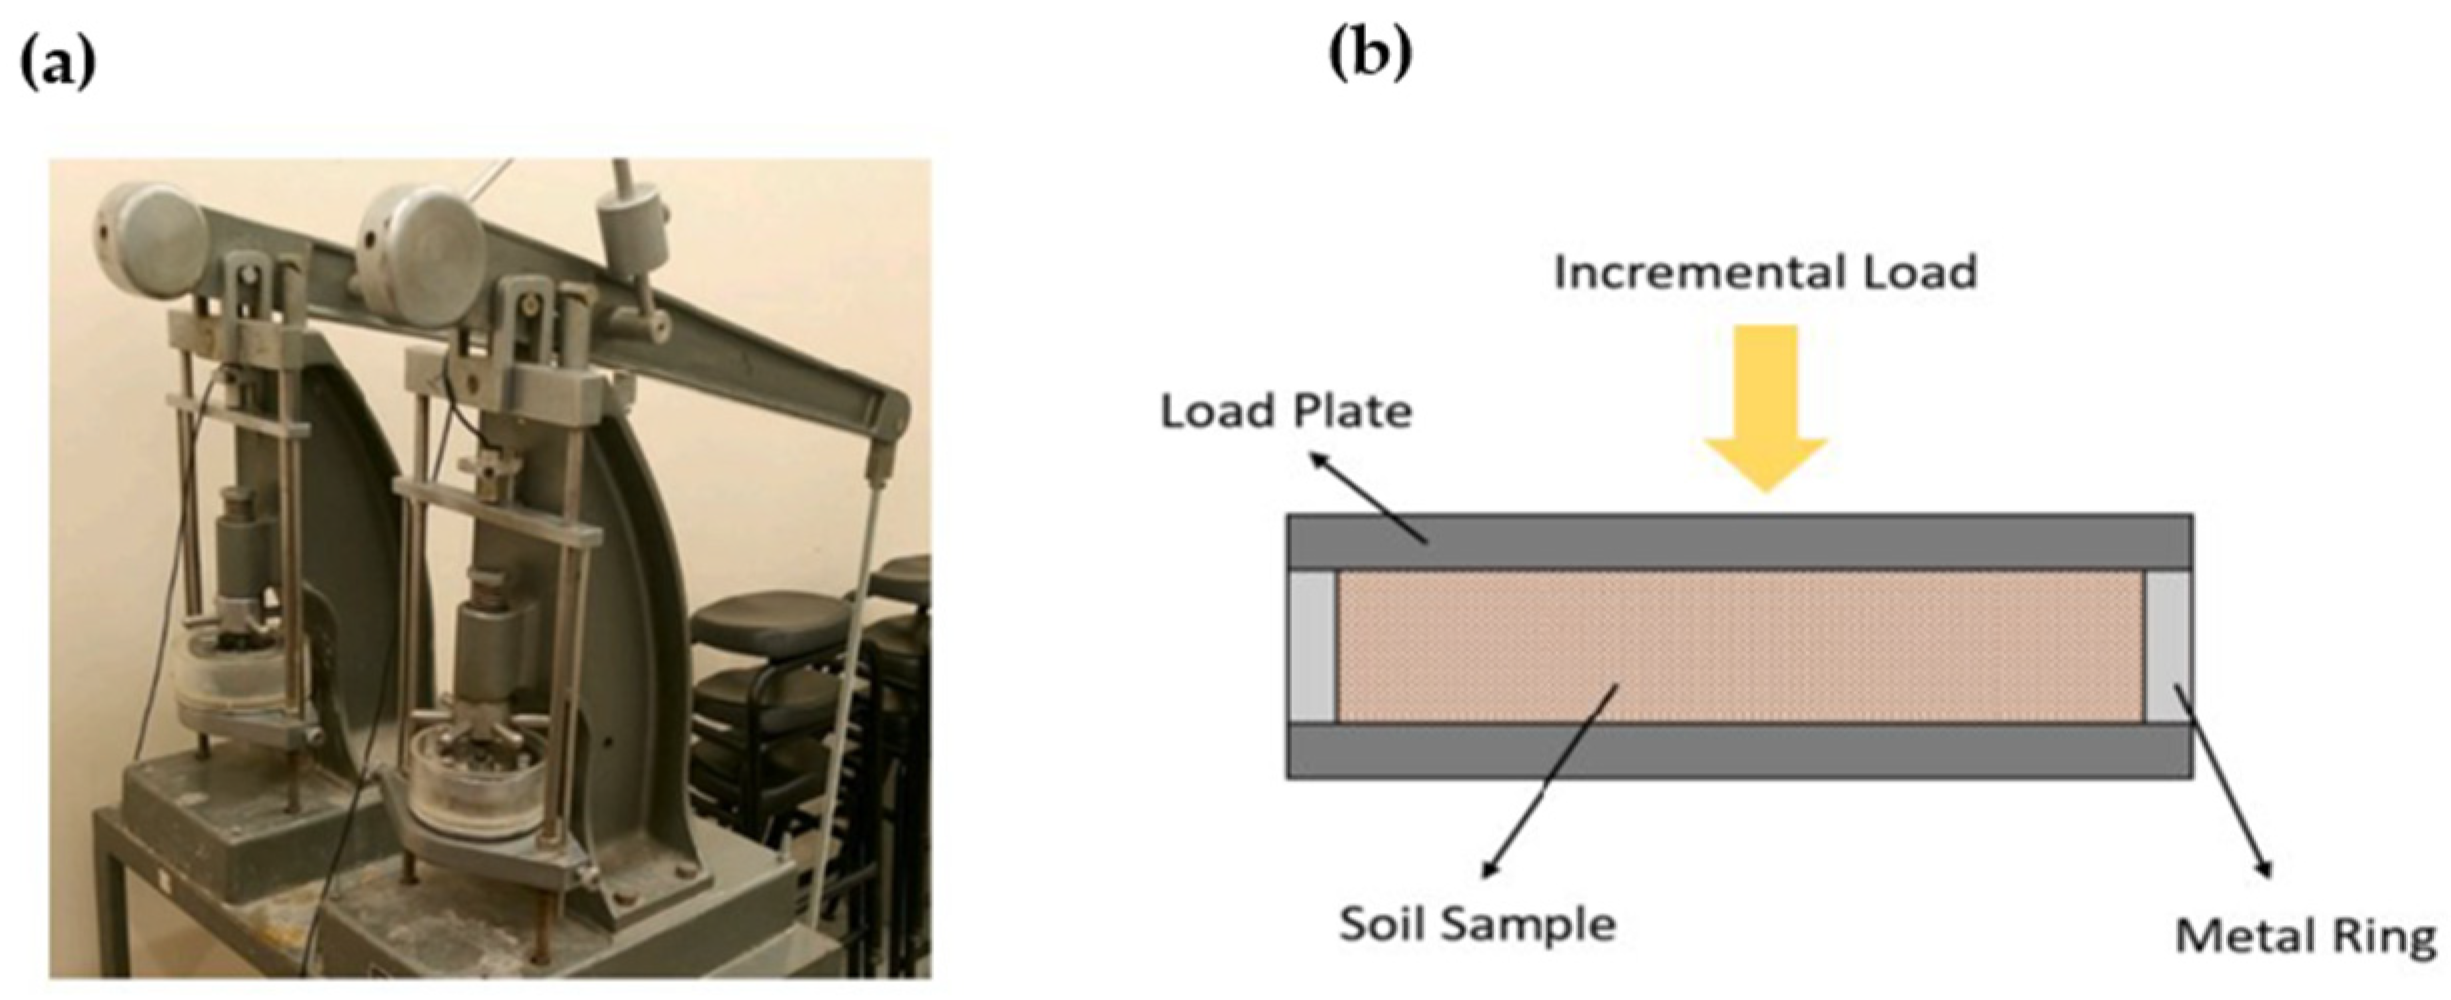
This study adopts two complementary methodologies for identifying the material parameters of sandy loam soil at 0.4% moisture content in the MAT_005 model for LS-DYNA: a conventional laboratory testing approach and a computational optimization-based approach. As
Section 2.2 and
Section 3.1 outlined, the laboratory approach relied on triaxial and consolidation tests to determine key parameters such as cohesion, friction angle, shear modulus, bulk modulus, and volumetric strain–pressure relationships. These experimentally derived values provided a solid baseline for initial simulations, capturing fundamental soil mechanical behavior under controlled conditions [
6]. However, despite their physical reliability, laboratory-derived parameters exhibited limitations when applied directly to complex in situ conditions. The initial Cone Penetrometer Test (CPT) simulations (
Section 3.1.3) showed higher prediction errors 15% for MM-ALE, 5% for SPH, and 4% for Hybrid FEM–SPH, indicating that laboratory data alone may not fully capture site-specific variability, boundary effects, and the natural heterogeneity of agricultural soils, as similarly reported in agriculture studies on soil compaction variability [
1].
The optimization-based approach using LS-OPT (
Section 2.3 and
Section 3.2) was introduced to address these shortcomings by calibrating the MAT_005 parameters directly against in situ CPT data. This inverse analysis method allowed targeted adjustment of model parameters to match field-measured penetration resistance within a defined corridor, significantly improving predictive accuracy for real-world conditions. Sensitivity analysis identified the shear modulus as the dominant contributor to the force–penetration response, followed by bulk modulus, friction angle, and cohesion. The optimization process produced measurable improvements in CPT simulation accuracy: Hybrid FEM–SPH achieved the lowest error at 2%, SPH followed closely at 3%, and MM-ALE improved to 8%—a notable gain over its pre-optimization performance but still limited by mesh-based representation of granular flow. These findings reinforce earlier conclusions in meshless soil modeling research [
1,
46] that SPH-based methods excel in replicating localized deformation and stress transmission in granular media.
A closer examination of stress and strain distributions (
Figure 13 and
Figure 14) highlighted key differences in the numerical approaches. SPH and Hybrid FEM–SPH methods accurately localized plastic strain and stress concentration beneath the cone tip, consistent with observed granular soil mechanics and in line with results reported by and agriculture-focused soil compaction studies [
26,
47]. In contrast, MM-ALE produced more diffuse stress and strain patterns, which may explain its tendency to overpredict cone resistance at deeper penetrations. These results underscore the importance of selecting numerical methods that align with the physical characteristics of the target soil and the scale of deformation being modeled.
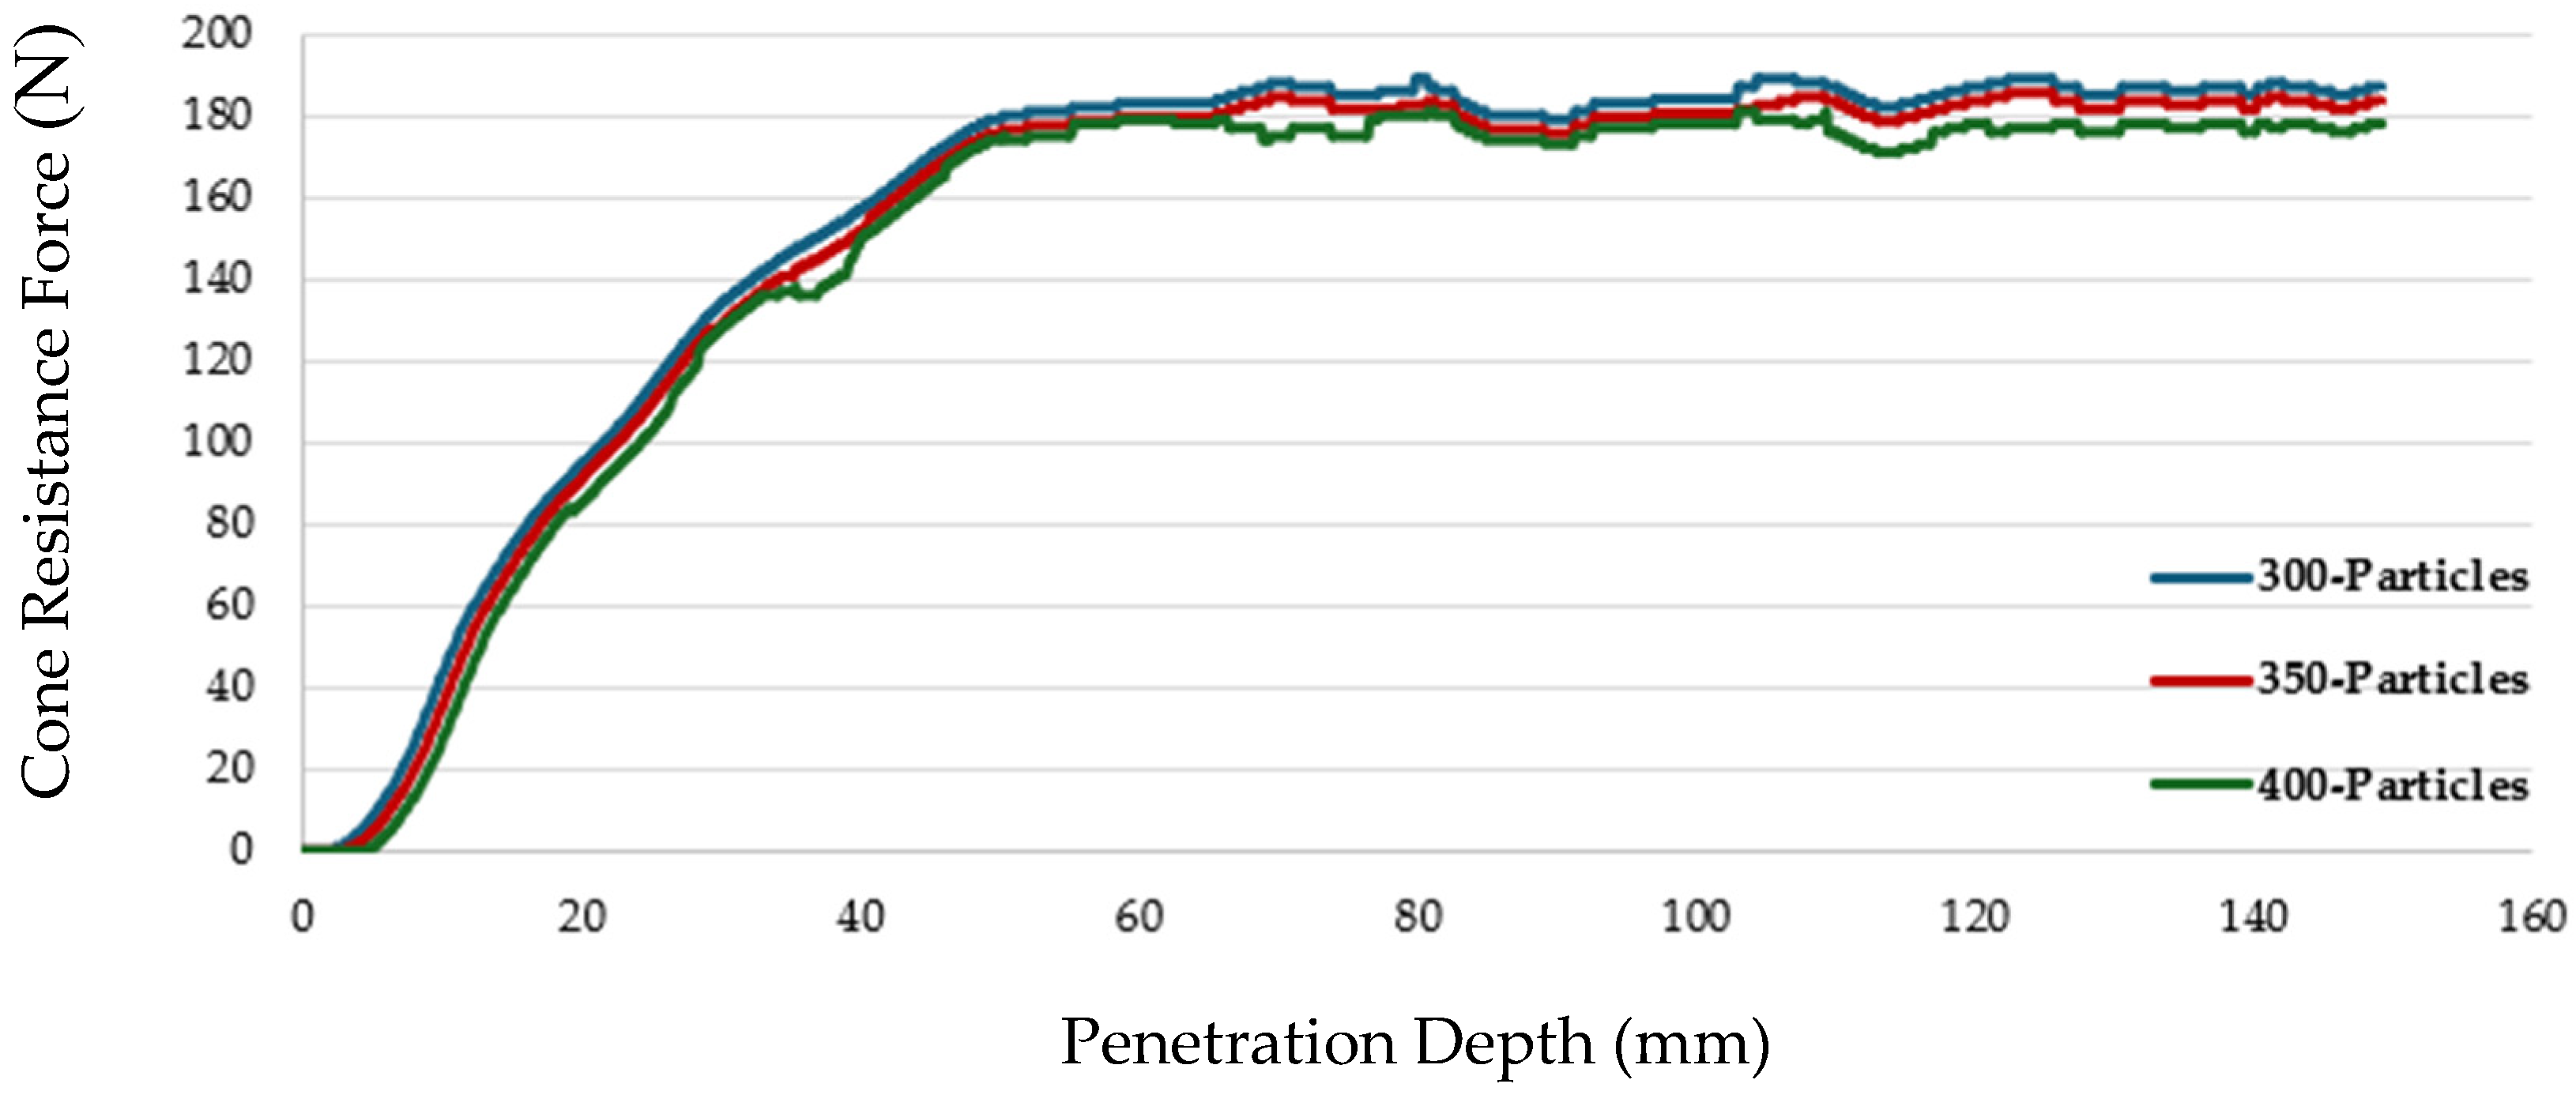
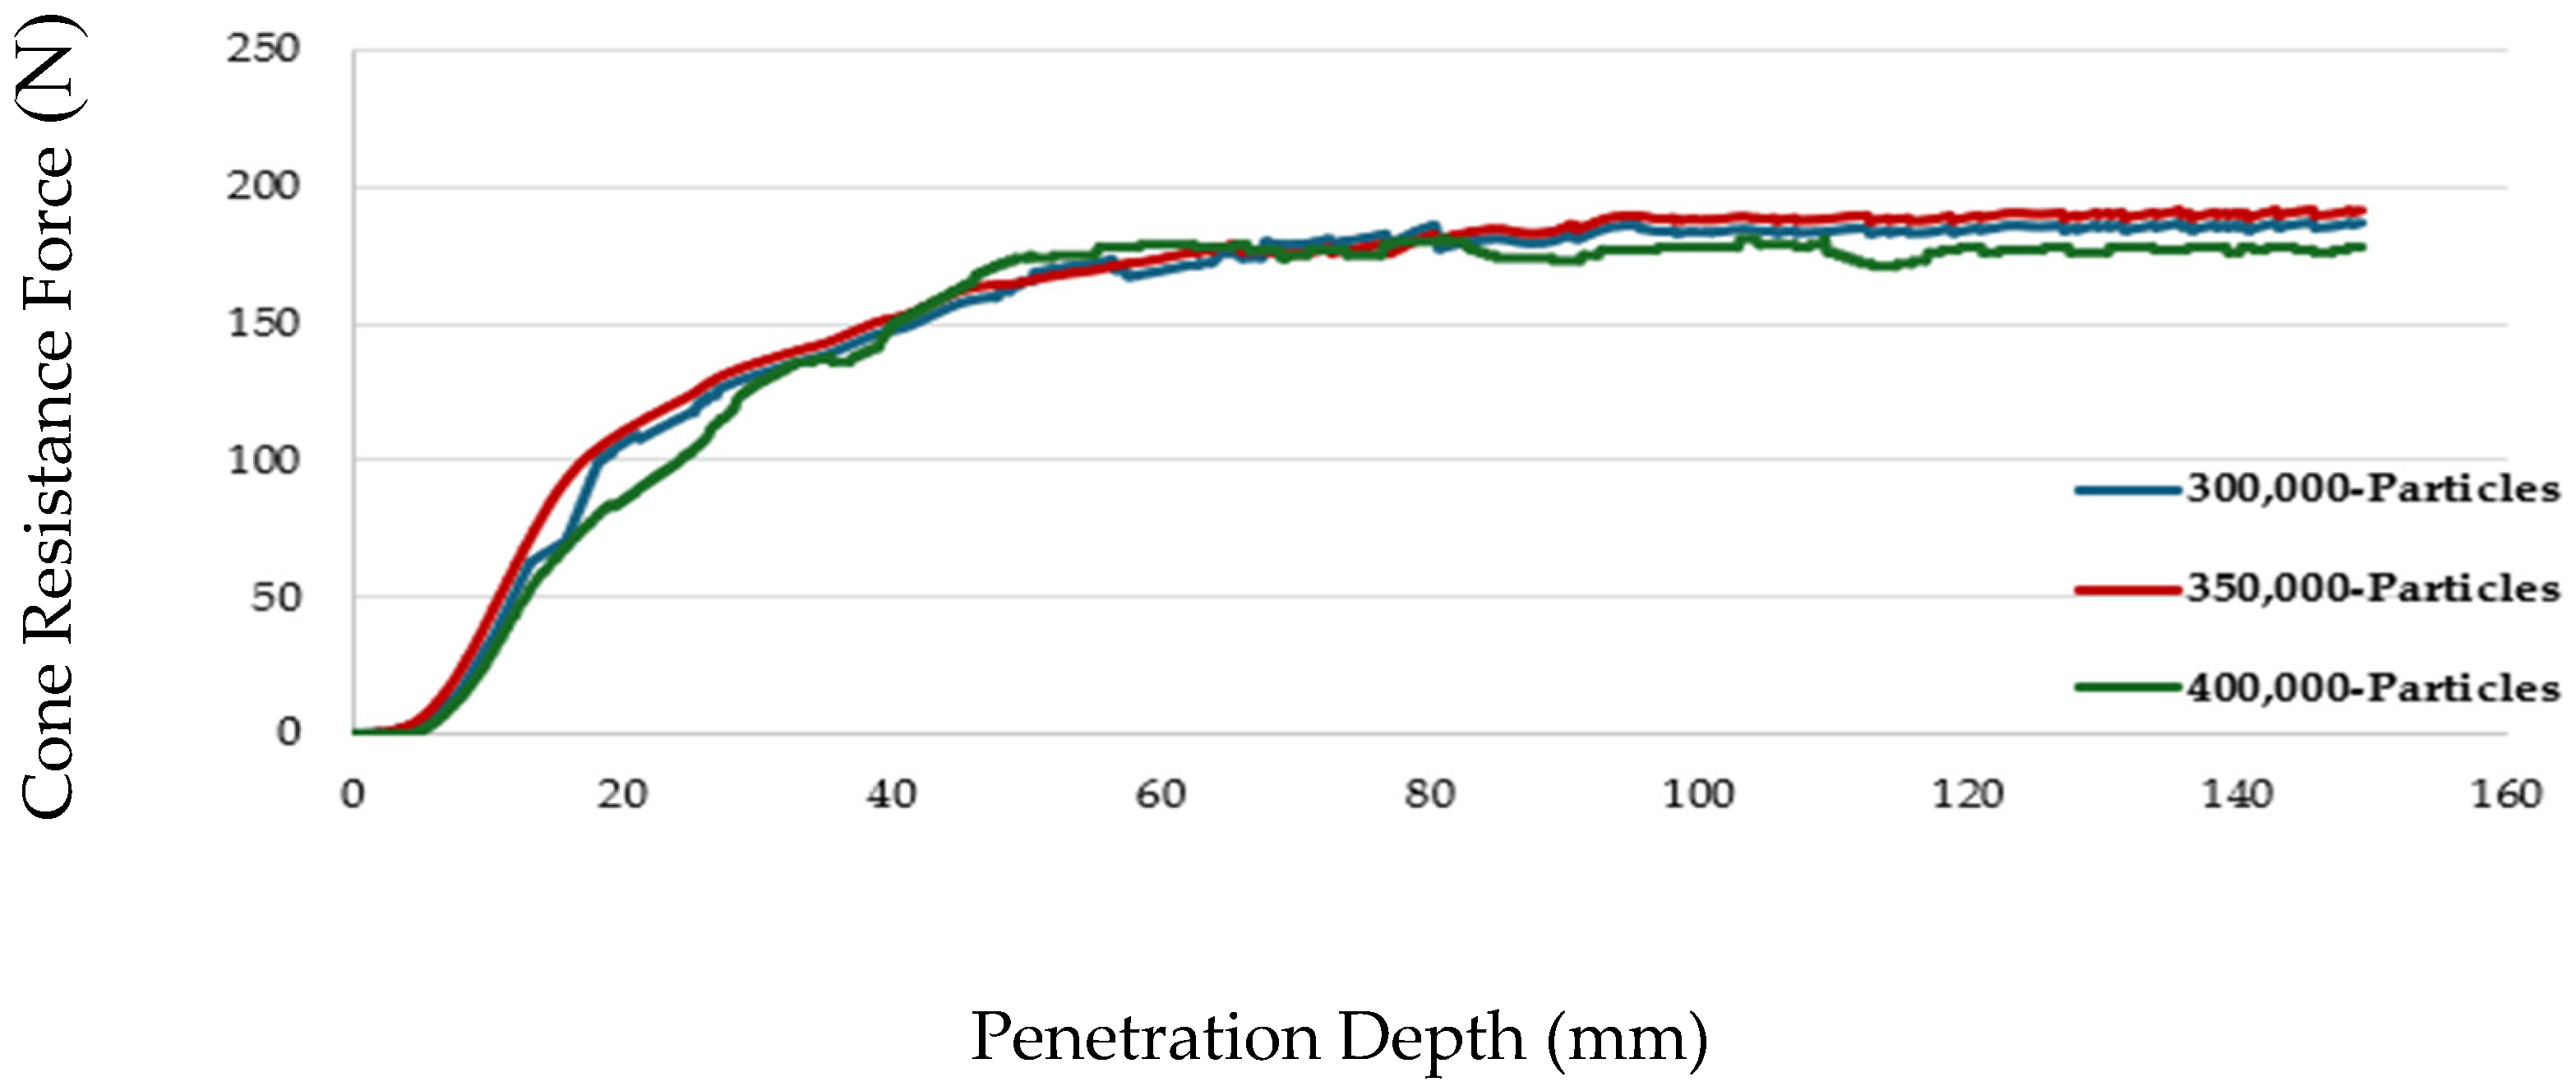
For large soil deformations, the Coupled Eulerian–Lagrangian (CEL) method [
6] typically offers higher computational efficiency (e.g., shorter runtimes due to reduced computational volume) but struggles with granular behavior, yielding 20% errors in CPT simulations. In contrast, SPH in LS-Dyna provides superior accuracy (2–5% error) for granular soils but is computationally intensive (e.g., 22 h and high memory for 350,000 particles in our CPT simulation). The Multi-Material Arbitrary Lagrangian–Eulerian (MM-ALE) method takes less computational time (e.g., 16 h with 300,000 elements), while Hybrid-SPH balances accuracy and efficiency, completing simulations by combining SPH and Lagrangian elements [
9] (e.g., in 14 h in our CPT simulation).
While validated for sandy loam, the methodology’s applicability to other soil types, such as clay (higher cohesion, lower permeability) or silt (intermediate granularity), warrants consideration. In clays, parameter identification may be more sensitive to moisture due to pronounced pore pressure effects, potentially increasing optimization iterations and errors (e.g., 5–10% higher than sandy loam) without strain softening. The Hybrid-SPH method could excel in capturing mixed granular-cohesive behavior for silts, but field CPT data calibration would need adjustment for texture-specific yield surfaces [
3,
5]. Future studies should test these adaptations to broaden the model’s utility across soil textures.
The benefits of optimized parameters extended beyond penetration simulations to the soil–tire interaction case study (
Section 3.2.3). Under identical loading and slip conditions, optimized parameters (Soil-B) consistently produced results closer to experimental benchmarks than lab-based parameters (Soil-A). Notably, Soil-B predicted tire sinkage at 13.8 mm—within 0.6 mm of measured 13.2 mm, while Soil-A underestimated at 12 mm. Similar improvements were seen in net traction prediction, stress bulb formation, shear band development, and rut geometry reproduction, reflecting a better alignment with experimental 3D rut profiles. These enhancements are consistent with findings from [
46,
48] that accurate soil–tire interaction models are critical for evaluating field traffic impacts, optimizing wheel load management, and mitigating soil compaction in precision agriculture.
Despite these improvements, the MAT_005 model retains inherent limitations. Its simplified elastic–perfectly plastic yield surface lacks strain hardening and softening mechanisms, limiting its ability to model progressive failure and post-peak softening in real soils under cyclic or repeated loading. This is evident in the triaxial simulations (
Section 3.1.2), where peak deviator stress was slightly underpredicted compared to both experimental data and the Cap Plasticity (CP) model results [
26]. The study’s focus on a single moisture content (0.4%) restricts its applicability across the full range of moisture conditions encountered in agricultural soils. As demonstrated in [
5,
6], soil compaction response can vary significantly with moisture content, texture, and structure, necessitating broader experimental coverage. Furthermore, the available CPT dataset was limited to peak cone resistance values without continuous force–depth profiles, constraining detailed validation of simulation curves.
Overall, the optimized MAT_005 model combined with SPH and Hybrid FEM–SPH methods demonstrated predictive capabilities comparable to the CP model for granular soils while maintaining compatibility with LS-DYNA’s advanced numerical frameworks. These results validate the integration between field-calibrated parameter identification and meshless methods for accurate, computationally efficient modeling of soil compaction under agricultural traffic. Future research should aim to integrate strain softening into the MAT_005 formulation, extend the methodology to other soil types (including cohesive clays and partially frozen soils), explore moisture-dependent parameterization, and employ high-resolution CPT equipment for capturing continuous penetration resistance profiles. Such developments would expand the applicability of this workflow in precision agriculture, enabling improved design of low-compaction machinery and more sustainable soil management practices [
46,
47].

