Article

Laboratory Characterization and Discrete Element Modeling of Shrinkage and Cracking Behavior of Soil in Farmland

1
Department of Rural Water Management, Nanjing Hydraulic Research Institute, Nanjing 210029, China
2
College of Agricultural Science and Engineering, Hohai University, Nanjing 211100, China
*
Author to whom correspondence should be addressed.
Agriculture 2025, 15(20), 2122; https://doi.org/10.3390/agriculture15202122 (registering DOI)
Submission received: 21 September 2025 / Revised: 3 October 2025 / Accepted: 10 October 2025 / Published: 12 October 2025
(This article belongs to the Section Agricultural Soils)

Abstract

Soil desiccation cracks are common in farmland under dry conditions, which can alter soil water movement by providing preferential flow paths and thus affect water and fertilizer use efficiency. Understanding the mechanism of soil shrinkage and cracking is of great significance for optimizing field management by crack utilization or prevention. The behavior of soil shrinkage and cracking was monitored during drying experiments and analyzed with the help of a digital image processing method. The results showed that during shrinkage, the changes in soil height and equivalent diameter with water content differed significantly. The height change consisted of a rapid decline stage and a residual stage, while the equivalent diameter had a stable stage before the rapid decline stage. The VG-Peng model was suitable to fit the soil shrinkage characteristic curves, and the curves revealed that the soil shrinkage contained structural shrinkage, proportional shrinkage, residual shrinkage, and zero shrinkage stages. According to the changes in evaporation intensity, soil water evaporation could be divided into three stages: stable stage, declining stage, and residual stage. Cracks first formed in the defect areas and edge areas of the soil, and they mainly propagated in the stable evaporation stage. Crack development was dominated by an increase in crack length during the early cracking stage, while the propagation of crack width played a major role during the later stage. At the end of drying, the contribution ratio of crack length and width to the crack area was approximately 30% and 70%, respectively. The box-counting fractal dimension of the stabilized cracks was approximately 1.65, indicating that the crack network had significant self-similarity. The experimental results were used to implement the discrete element method to model the process of soil shrinkage and cracking. The models could effectively simulate the variation characteristics of soil height and equivalent diameter during shrinkage, as well as the variation characteristics of crack ratio and length density during cracking, with acceptable relative errors. In particular, the modeled morphology of the crack network was highly similar to the experimental observation. Our results provide new insights into the characterization and simulation of soil desiccation cracks, which will be conducive to understanding crack evolution and soil water movement in farmland.

1. Introduction

Soil cracking commonly occurs under dry conditions [1]. The development of cracks can affect water movement in farmland [2]. Studies have shown that cracks can significantly enhance soil water conductivity [3,4] and increase water infiltration depth [5,6] by providing preferential flow paths [7]. Irrigation water bypasses the upper soil matrix and moves to the deep soil, causing deep leakage and reducing the irrigation efficiency [8]. Meanwhile, soluble fertilizers applied in the field migrate to deep layers along with irrigation water, resulting in a decrease in fertilizer use efficiency and an increase in the risk of groundwater contamination [9,10]. In addition, cracks also affect soil evaporation. Some research indicated that cracks significantly increased the evaporation rate [11,12]. In addition, soil cracking has significant impacts on engineering safety and structural stability [13]. Therefore, soil cracks have attracted much attention from many researchers in recent years [14].
Soil cracking is directly associated with the shrinkage characteristics. Grossman et al. [15] proposed the Coefficient of Linear Extensibility to quantify the shrink–swell potential of soil, which has been widely adopted in relevant studies [16,17,18]. Nevertheless, the Coefficient is only capable of quantifying the overall shrink–swell potential of soil. It fails to depict the shrink–swell characteristics during wetting–drying cycles, thereby exhibiting significant limitations in characterizing the dynamic deformation of soil. The soil shrinkage characteristic curve describes the dynamic relationship between soil volume and moisture content during shrinkage [19,20]. A typical soil shrinkage characteristic curve presents an “S” shape, consisting of structural shrinkage, proportional shrinkage, residual shrinkage, and zero shrinkage [19]. The three-linear model, XP model, PL model, and Sigmoid model are commonly used for curve fitting [21,22,23].
The morphology of soil cracks dominates their impact on water movement [24]. Experiments on clay soil have shown that most cracks formed when the soil matrix was still in a saturated state, and the crack area reached a relatively high value before the soil matrix approached the air-entry value [25]. The cracking process can be roughly divided into three stages: primary crack formation, secondary crack formation, and stabilization. The cracks generated early are primary cracks, which are relatively large in size at the end of drying. Secondary cracks form at the edges of primary cracks or between them. During these two stages, the crack length increases rapidly. At the stabilization stage, a few new cracks form, while the crack development is mainly characterized by the increase in crack width [26,27]. Crack development follows the principle of maximum stress release, propagating mostly in directions perpendicular to the maximum tensile stress [28], and hence most crack intersection angles are 90° [27]. Some other studies have found that after multiple wetting–drying cycles, the crack intersection angles gradually evolve from 90° to 120° (from “T” shapes to “Y” shapes) [29].
Cracking modeling is of great significance for understanding and predicting crack development. Researchers have proposed various theoretical models and frameworks to reveal the cracking mechanism, which can be mainly divided into three categories: energy-based models, volume change-based models, and stress-controlled models. Energy-based models hold that the development of materials from the elastic state to the damaged state, and the fractured state drives the dissipation of elastic energy. Cracking occurs when the free surface energy of the system caused by crack development balances with the energy dissipation caused by cracking [30]. Based on this theory, researchers have proposed linear elastic fracture mechanics models to predict crack development [31,32]. Volume change-based models link soil volume deformation with crack development. They predict the crack size by establishing the relationship between crack area/volume and the overall soil area/volume during soil shrinkage [33,34,35]. Stress-controlled models suggest that cracking occurs when the tensile stress or shear stress exceeds the soil strength [36,37]. Numerical simulation is an important means of studying the characteristics of crack development. In recent years, the discrete element method (DEM) has been widely used to model soil shrinkage and cracking [38]. Tran et al. [39] used two sets of particles to represent soil and water in the DEM model construction and successfully simulated the shrinkage process of the sample from a mud state to a semi-solid state. Peron et al. [40] assigned a radius shrinkage coefficient to particles and made soil shrink by reducing the radius, thus establishing a crack development DEM model for thin-layer soil with a thickness of 12 mm. Similarly, during the simulation, soil shrinkage was simulated by continuously reducing the particle radius, and the simulated crack network was close to the measured crack network in morphology. Overall, the discrete element method achieves good results in modeling soil shrinkage and cracking. However, most studies derive the average shrinkage coefficient of particle radius based on the initial and final values of the sample volume in drying tests, ignoring the phasic characteristics during shrinkage. As a result, the shrinkage process of soil and the cracking process are not effectively connected, and the phasic characteristics of cracking are not well simulated.
In general, the soil on farmland is exposed to open air, experiencing diurnal variations and seasonal sunny–rainy weather, thus being highly susceptible to cracking. In addition, the more frequent occurrence of extreme weather apparently increases the probability and scale of cracking. The study of soil cracking is of great importance for further understanding water and solute migration and for guiding precision irrigation in agricultural fields. However, most researchers investigated the cracking phenomenon from the perspective of engineering stability. Relatively few studies focused on agricultural soil. In this study, laboratory experiments were conducted to investigate the shrinkage and cracking characteristics of soil collected from farmland by employing a digital image processing method, and DEM models were built to simulate the desiccation cracking behavior, especially the phasic characteristics, based on the soil shrinkage characteristic curve and cracking characteristics.

2. Materials and Methods

2.1. Laboratory Experiments

The tested soil was collected from the upper 20 cm layer of the rice–wheat rotation experimental field in the Water-Saving Park of Hohai University in Nanjing, Jiangsu Province, China (31°570 N, 118°500 E). After collection, the soil was crushed and passed through a 2 mm sieve, and then air-dried (the soil mass water content was about 0.040 g·g−1) in a well-ventilated place prior to use. The dry bulk density of the soil was 1.25 g·cm−3, and the contents of clay particles (<0.002 mm), silt particles (0.002–0.02 mm), and sand particles (0.02–2 mm) were 21.1%, 56.2%, and 22.7%, respectively, with an organic carbon content of 11.7 g·kg−1. The tested soil was silt loam according to the ISSS soil texture classification.

2.1.1. Soil Shrinkage Experiment

The air-dried soil was uniformly backfilled into three Plexiglas boxes (20 cm × 20 cm × 20 cm). Water inlet holes were evenly distributed at the bottom of the boxes, and a double-layered non-woven fabric was laid to prevent soil particles from leaking out through the holes. The average dry bulk density of the filled soil was controlled at 1.25 g·cm−3. The soil surface was precisely flattened, and the final height was 10 cm. After backfilling, the Plexiglas boxes were placed in a container filled with pure water for saturation by immersion. The water level was maintained slightly lower than the soil surface, and the immersion lasted 48 h. After saturation, soil cores were collected from each box by the cutting ring method. The diameter of the cutting ring was approximately 70 mm, and the depth was approximately 52 mm. Vaseline was applied to the inner wall of the cutting ring before sampling to eliminate the influence of the friction on sampling and the subsequent shrinkage deformation of the soil. The soil that exceeded the volume of the cutting ring was removed by a scraper. The samples of the cutting ring were the specimens for the soil shrinkage experiment, and they were denoted as S1, S2, and S3. The specimens were placed in an oven at 40 °C for drying. During the drying process, they were taken out every 2 to 3 h and weighed using an electronic balance with an accuracy of 0.1 g. At the same time, the horizontal and vertical shrinkage of the specimens were measured and recorded by the same method in the literature from Qi et al. [41]. Once the relative difference in the weight between two adjacent measurements of specimens was less than 0.2%, the temperature of the oven was increased to 105 °C. And the weight and shrinkage of the specimens were measured every 2 to 3 h. When the relative difference in the weight was less than 0.2%, the drying process was stopped, and the soil shrinkage experiment was ended.

2.1.2. Soil Cracking Experiment

The soil cracking experiment was conducted in an air-conditioned laboratory. During the saturation process of the specimens, the indoor temperature was set at 18 °C to slow down evaporation, so as to ensure the consistency of the initial conditions for all specimens. During the drying process of the specimens, the temperature was set at 28 °C to accelerate evaporation. Three Plexiglas boxes (22 cm × 22 cm × 10 cm) were prepared as specimen containers. The air-dried soil was homogeneously backfilled into each Plexiglas box with a dry bulk density of 1.25 g·cm−3. The soil surface was leveled, and the height was controlled at 5.0 cm. The soil in the box was the specimen for the soil cracking experiment. A total of 1500 g of pure water was used for specimen saturation (according to the data of the dry bulk density and saturated soil water content, the amount of pure water was enough to completely saturate the specimen). An air-blasted atomizer was applied to evenly spray the pure water onto the soil. The whole saturation process was divided into 15 serial spraying events on average. Each spraying event lasted for 10 min, during which 100 g of pure water was slowly sprayed. After each spraying, the specimen was gently shaken to distribute the water evenly and expel the air in the soil. The total time for specimen saturation was 150 min, and the average density was 12.4 mm·h−1. The drying process started immediately after saturation. Once the water layer on the specimen surface had evaporated, the specimen was weighed every 2 h using an electronic balance with an accuracy of 0.1 g. At the same time, a digital camera was used to record the soil cracking process. When the relative difference in the weight between two adjacent measurements of the specimen was less than 0.2%, it was considered that the soil cracks had completely developed and already stabilized. The drying process was stopped, and the soil cracking experiment was ended. The method of digital image processing for soil cracks was similar to that described in Wang et al. [42]. First, the core 22 × 22 cm2 of the images was selected and resized to 2200 × 2200 pixels. Next, the images were converted into gray-level images, and then the soil crack and matrix were segmented by threshold segmentation using the OTSU algorithm [43]. Enhanced processing, including gap filling, spot removal, and breakpoint joint, was achieved by “open” and “close” operations. Crack skeletons were obtained by a parallel thinning algorithm. Parameters of cracks were calculated based on segmented images and skeleton images. The above image processing was accomplished using the intrinsic functions in (MATLAB R2016a, MathWorks, MA, USA).

2.1.3. Parameters of Soil Shrinkage and Crack

(1)
Equivalent diameter
d = ( 4 A / π ) 1 / 2
where d is the equivalent diameter of the sample (mm);   a n d   A is the cross-sectional area of the soil matrix (mm2).
(2)
Shrinkage characteristic curve
The soil shrinkage characteristic curve model proposed by Peng and Horn [44] was adopted in this study, which has been proven to be suitable for a wide range of soil types. For simplicity, we called the model the VG-Peng model.
e ϑ = e r + e s e r 1 + χ ϑ p q     0 ϑ ϑ s e = V p / V s ϑ = V w / V s
where e and ϑ are the void ratio and moisture ratio (mm3 mm–3), respectively; e s and e r are the saturated and residual void ratios (mm3 mm–3), respectively; ϑ s is the saturated moisture ratio (mm3 mm–3); χ , p , and q are dimensionless fitting parameters; and V p , V w and V s are the volumes of the pore, water, and solid, respectively (mm3).
(3)
Anisotropy of soil shrinkage
Soil shrinkage includes horizontal shrinkage and vertical shrinkage. The difference in shrinkage degree between horizontal and vertical directions is called the anisotropy of soil shrinkage, which was quantified by the shrinkage geometric factor ( r s ) [45].
r s = ln V i / V 0 / ln z i / z 0
where V 0 and V i are the initial and ith measured volume of the soil sample (mm3), respectively; and z 0 and z i are the initial and ith measured heights of the soil sample (mm3), respectively. According to the variation range of r s , the anisotropy of soil shrinkage can be divided into the following five situations: r s = 1.0 , only vertical shrinkage; 1.0   < r s < 3.0 , vertical shrinkage dominates; r s = 3.0 , isotropic shrinkage; r s > 3.0 , horizontal shrinkage dominates; and r s + , only horizontal shrinkage.
(4)
Crack ratio
R c = A c / A t o t a l × 100 %
where R c is the crack ratio, defined as the fraction of the crack area covering the total area in the image (%); A c is the crack area (cm2); and A t o t a l is the total area (cm2).
(5)
Crack length density
L D c = L c / A t o t a l
where L D c is crack length density, defined as the ratio of the length of all cracks to the total area in the image (cm·cm−2); L c is the length of all cracks (cm); and A t o t a l is the total area (cm2).
(6)
Contribution ratio of crack length (width)
Contribution ratio of crack length ( C L ) and contribution ratio of crack length ( C W ) are adopted to separately quantify the effect of extending crack length and crack width on the crack area. They are computed according to the study of Qi et al. [46].
(7)
Box-counting fractal dimension of crack network
A crack network generally exhibits fractal characteristics [26]. Fractal dimension could characterize the self-similarity or complexity of the crack network. Box-counting fractal dimension was employed to describe the fractal characteristics. The calculation is as follows: for the binary images of the crack network, square grids with reduced length scales l i are used to cover the crack areas, and the minimum number of grids k i required for complete coverage is calculated. Then, the box-counting fractal dimension D b is approximately the absolute value of the slope of the linear regression curve of the k i ~ l i relationship in the logarithmic coordinate system.
D b = log k i + m / log l i
where D b is the box-counting fractal dimension; l i is the square grid length; k i is the minimum number of grids required for complete coverage; and m is a fitting parameter. For 2D graphs, when D b is close to 2, the degree of self-similarity is extremely high, and when D b approaches 1, the degree of self-similarity is low.

2.1.4. Data Processing

Since the soil water content at the same moment was not entirely consistent across different replicates during the experiment, it was not feasible to calculate average values during data processing. Therefore, the data from all the replicates were presented in most figures. In addition, given that the differences among the data of replicates are relatively small, and for the sake of simplicity, only the data of the first replicate were used for parameter determination and model validation during modeling.

2.2. Model Construction

2.2.1. Model Assumptions

Particle Flow Code software (PFC5.0, Itasca, MN, USA) was employed in this study. In addition to the basic assumptions about particles, walls, contact models, and calculation principles in PFC, this model also has the following assumptions and definitions:
(1) The soil is composed of a series of aggregates of varying sizes that are cemented to each other. Similarly, the sample is formed by cementing a series of particles of different sizes.
(2) To improve the calculation efficiency, the size of particles is increased; thus, the particles do not have a one-to-one correspondence with the soil aggregates.
(3) Each particle contains the solid, liquid, and gas of the soil within the area it covers.
(4) The soil shrinkage is achieved by gradually reducing the particle radius, and the soil cracking is caused by the break of contacts between particles.
(5) All particles follow the same shrinkage pattern, jointly resulting in changes in the volume of the sample, which macroscopically manifests as the shrinkage or cracking of the soil.
(6) During the drying process, the soil water content and suction change continuously, and the tensile and shear strengths between particles also change accordingly.

2.2.2. Sample Preparation

The DEM samples were simplified to two-dimensional situations. The particles were disks.
(1) Shrinkage sample: the longitudinal section passing through the center of the upper and lower cross-sections of the actual soil sample was selected. The initial size was 52.0 mm in height and 70.0 mm in width. The minimum radius of the disks was 0.25 mm, the maximum radius was 0.50 mm, and there were 6547 disks in total.
(2) Cracking sample: the upper surface of the actual soil sample was selected, with dimensions of 22.0 cm in length and 22.0 cm in width. The differences in soil water content in the depth direction were ignored by assuming a uniform distribution, and the friction between soil layers was ignored as well. The minimum radius of the disks was 0.50 mm, the maximum radius was 1.00 mm, and there were 22,182 disks in total.

2.2.3. Contact Model

The linear contact bonding model in PFC stipulated that the sample could bear pressure, tension, and shear force, which was suitable for modeling the shrinkage and cracking behavior of soil. Therefore, the linear contact bonding model was used in this model.

2.2.4. Shrinkage Pattern of Particles

It is assumed that the change in particle radius follows the following equation:
R θ = α r θ R 0
where R θ is the particle radius when the soil gravimetric water content is θ ; R 0 is the initial particle radius; and α r θ is the shrinkage coefficient of particle radius when the soil water content is θ .
Similarly, the equation of sample volume shrinkage is as follows:
V t o t a l θ = α v θ V t o t a l 0
where V t o t a l θ is the sample volume when the soil water content is θ ; V t o t a l 0 is the initial sample volume; and α v θ is the shrinkage coefficient of sample volume when the soil water content is θ .
From model assumption (5),
4 3 π R θ 3 = 4 3 π α r θ R 0 3 = α r θ 3 4 3 π R 0 3
By combining Formulas (7) and (8), α r = α v 1 / 3 .
Soil gravimetric water content was calculated as follows:
θ = m w / m s
where θ is soil gravimetric water content; m w is the mass of soil water; and m s is the mass of dry soil.
Substituting m s = ρ s V s and m w = ρ w V w into formula (10), the following is achieved:
θ = ρ w V w / ρ s V s = ϑ / ρ s
where ρ s is the specific gravity of soil; ρ w is the density of water; and ϑ is moisture ratio.
Therefore, the sample volume could be calculated as follows:
V t o t a l = V s + V p = 1 + e V s
By combining Formulas (11), (12), and (2), the relationship between sample volume and soil gravimetric water content characterized by the VG-Peng model can be obtained as follows:
V t o t a l = 1 + e r + e s e r 1 + χ ρ s θ p q V s
Therefore, the shrinkage coefficient of sample volume and particle radius could be calculated as follows:
α v θ = 1 + e r + e s e r 1 + χ ρ s θ p q 1 + e r + e s e r 1 + χ ρ s θ s p q
α r θ = 1 + e r + e s e r 1 + χ ρ s θ p q 1 + e r + e s e r 1 + χ ρ s θ s p q 1 / 3
where θ s is the saturated soil gravimetric water content.
If the shrinkage is too large in a single step, it will lead to excessively large unbalanced forces in the model or massive failure of particle contacts, thus affecting the model results. Therefore, to ensure the accuracy and stability of the model results, it is necessary to subdivide the shrinkage process, that is, to subdivide the water content. Assume that the water content is equally divided into n parts, and the water content change in a single shrinkage step is as follows:
θ = θ s θ r / n
where θ r is the residual soil gravimetric water content.
Therefore,
α r θ = θ s θ α r ` θ s × α r ` θ s θ × α r ` θ
α r ` θ = 1 + e r + e s e r 1 + χ ρ s θ p q 1 + e r + e s e r 1 + χ ρ s θ + θ p q 1 / 3
where α r ` is the gradual shrinkage coefficient of particle radius. During modeling, as the soil water content decreased to the specified value, particle shrinkage was performed using the gradual shrinkage coefficient corresponding to the soil water content.

2.2.5. Parameter Determination

Contact Model Parameters
(1)
Particle density
The particle density is equivalent to the density of the soil sample. During drying, the soil sample changed with the reduction in soil water and volume. The calculation formula was as follows:
ρ = m s × 1 + θ / V t o t a l
where ρ is particle density.
Substituting Equation (13) into the above formula, the following is achieved:
ρ = m s 1 + θ / 1 + e r + e s e r 1 + χ ρ s θ p q V s
Simplifying the formula leads to the following:
ρ = ρ s 1 + θ / 1 + e r + e s e r 1 + χ ρ s θ p q
During the modeling, the particle density was continuously updated and assigned according to changes in soil water content.
(2)
Particle normal and shear stiffness
The macro–micro parameter correspondence of the linear contact bonding model has the following characteristics: the normal-to-shear stiffness ratio k affects the Poisson’s ratio ν of the elastic deformation of the material, and the two parameters are significantly positively correlated. The effective elastic modulus E controls the elastic modulus E of the material, and the two are also significantly positively correlated.
ν k *
E E *
In PFC2D, the calculation formula of k and E are as follows:
k = k n k s
E = k n × L A
A = 2 × r
r = m i n R 1 , R 2                       b a l l b a l l   c o n t a c t R 1                                                     b a l l f a c e t   c o n t a c t
L = R 1 + R 2                               b a l l b a l l   c o n t a c t R 1                                             b a l l f a c e t   c o n t a c t
where A is the contact area; r is the contact radius; L is the contact distance; R 1 is the radius of disk (particle) 1; and R 2 is the radius of disk (particle) 2.
Simplifying r to the average value of the radius of disk 1 and disk 2, the following is achieved:
E = k n
Based on the above formulas, during parameter calibration, the normal-to-shear stiffness ratio k and effective elastic modulus E were calibrated by using Poisson’s ratio ν and elastic modulus E , and then the particle normal stiffness and shear stiffness could be derived from the values. The elastic modulus E and Poisson’s ratio ν of the soil in this study are 12 MPa and 0.30, respectively.
A simulated uniaxial compression test was used to calibrate the normal and shear stiffness of discrete element sample particles. The initial sample for the uniaxial compression test is shown in Figure 1a, with dimensions of 50 mm in height and 25 mm in width. The minimum and maximum particle radii were, respectively, 0.25 and 0.50 mm, and the number of particles was 2281. Compression of the sample was achieved by setting the upper and lower walls to move toward the center of the sample. During the compression process, the wall force and wall displacement were monitored, and five monitoring points were selected on the left and right sides of the sample to measure displacement changes. Compression was stopped once the wall force became 70% of the peak force, which indicated that the sample had failed. The failure sample is shown in Figure 1b. The elastic modulus was calculated from the stress–strain curve, and Poisson’s ratio was determined from the horizontal and vertical deformation of the sample.
The tensile strength and shear strength between particles were, respectively, set to 0.3 MPa and 0.6 MPa. The initial normal-tangential stiffness ratio k was set to 1.4. Uniaxial compression was performed on the sample by adjusting the effective elastic modulus E to 10, 20, 30, 40, and 50 MPa, and the macroscopic elastic modulus E of the sample under different effective elastic moduli was recorded, as shown in Figure 2a. It could be seen that the macroscopic elastic modulus of the sample had a linear relationship with the effective elastic modulus of the particles. When the elastic modulus E was 12 MPa, the effective elastic modulus of the particles E was approximately 23 MPa.
While keeping the effective elastic modulus of particles E* constant at 23 MPa, uniaxial compression was performed on the sample by adjusting the normal-tangential stiffness ratio of particles k to 1.0, 2.0, 3.0, 4.0, and 5.0, respectively. The Poisson’s ratio of the sample under different stiffness ratios was recorded, as shown in Figure 2b. The Poisson’s ratio of the sample was logarithmically related to the particle stiffness ratio. According to that, the Poisson’s ratio ν was 0.30, and the soil particle stiffness ratio k was determined to be 5.0.
From the above, E = 23 MPa, k = 5.0. According to Formulas (24) and (25), k n = 2.3 × 10⁷, and k s = 4.6 × 10⁶. The Poisson’s ratio ν was 0.30, but the elastic modulus E of the sample was 9.3 MPa. It was because the change in the particle stiffness ratio caused a change in the soil elastic modulus in the process of calibrating Poisson’s ratio. Specifically, the increase in the stiffness ratio reduced the elastic modulus of the sample. Based on this rule, a slight adjustment was made to the current parameters. Finally, E = 31 MPa, k = 5.0, k n = 3.1 × 10⁷, and k s = 6.2 × 10⁶. The elastic modulus E of the sample was 12 MPa, and the Poisson’s ratio ν was 0.31, which were relatively close to the real values.
In the cracking model, the particle radius was increased to reduce the total number of particles, requiring re-sampling for uniaxial compression. The sample used for uniaxial compression had a height of 50 mm, a width of 25 mm, and contained 578 particles, with k n = 3.1 × 10⁷ and k s = 6.2 × 10⁶. The elastic modulus E of the sample was 11.7 MPa, and the Poisson’s ratio ν was 0.32 through the uniaxial compression test, which were also close to the real values. Therefore, the particle stiffness in both the shrinkage and cracking models was set as k n = 3.1 × 10⁷ and k s = 6.2 × 10⁶.
(3)
Tensile strength and shear strength
The shrinkage and cracking of soil are affected by the tensile strength and shear strength at the particle bonds. For simplicity, it was assumed that the shear strength was twice the tensile strength, S F = 2.0 T F . Previous studies showed that the tensile strength had the following relationship with soil water content [36]:
T F θ = a × e x p θ / b
where T F is the tensile strength of soil, MPa; θ is the gravimetric water content of soil; and a and b are fitting parameters.
Sima et al. found that the soil cracking water content was relatively sensitive to the tensile strength [47]. Therefore, the data on cracking water content from the cracking test were used to calibrate the soil tensile strength and shear strength in the model. By a large number of trial calculations, the values of a and b were finally determined to be 0.29 and –12.0, respectively.
Therefore,
T F θ = 0.29 × e x p θ / 12
S F θ = 0.58 × e x p θ / 12
During modeling, the tensile strength and shear strength of the contacts were continuously updated and assigned based on changes in soil water content. It should be noted that the values of tensile strength and shear strength obtained through back-calculation would increase the uncertainty of the model.
Shrinkage Parameters
(1)
Shrinkage Model
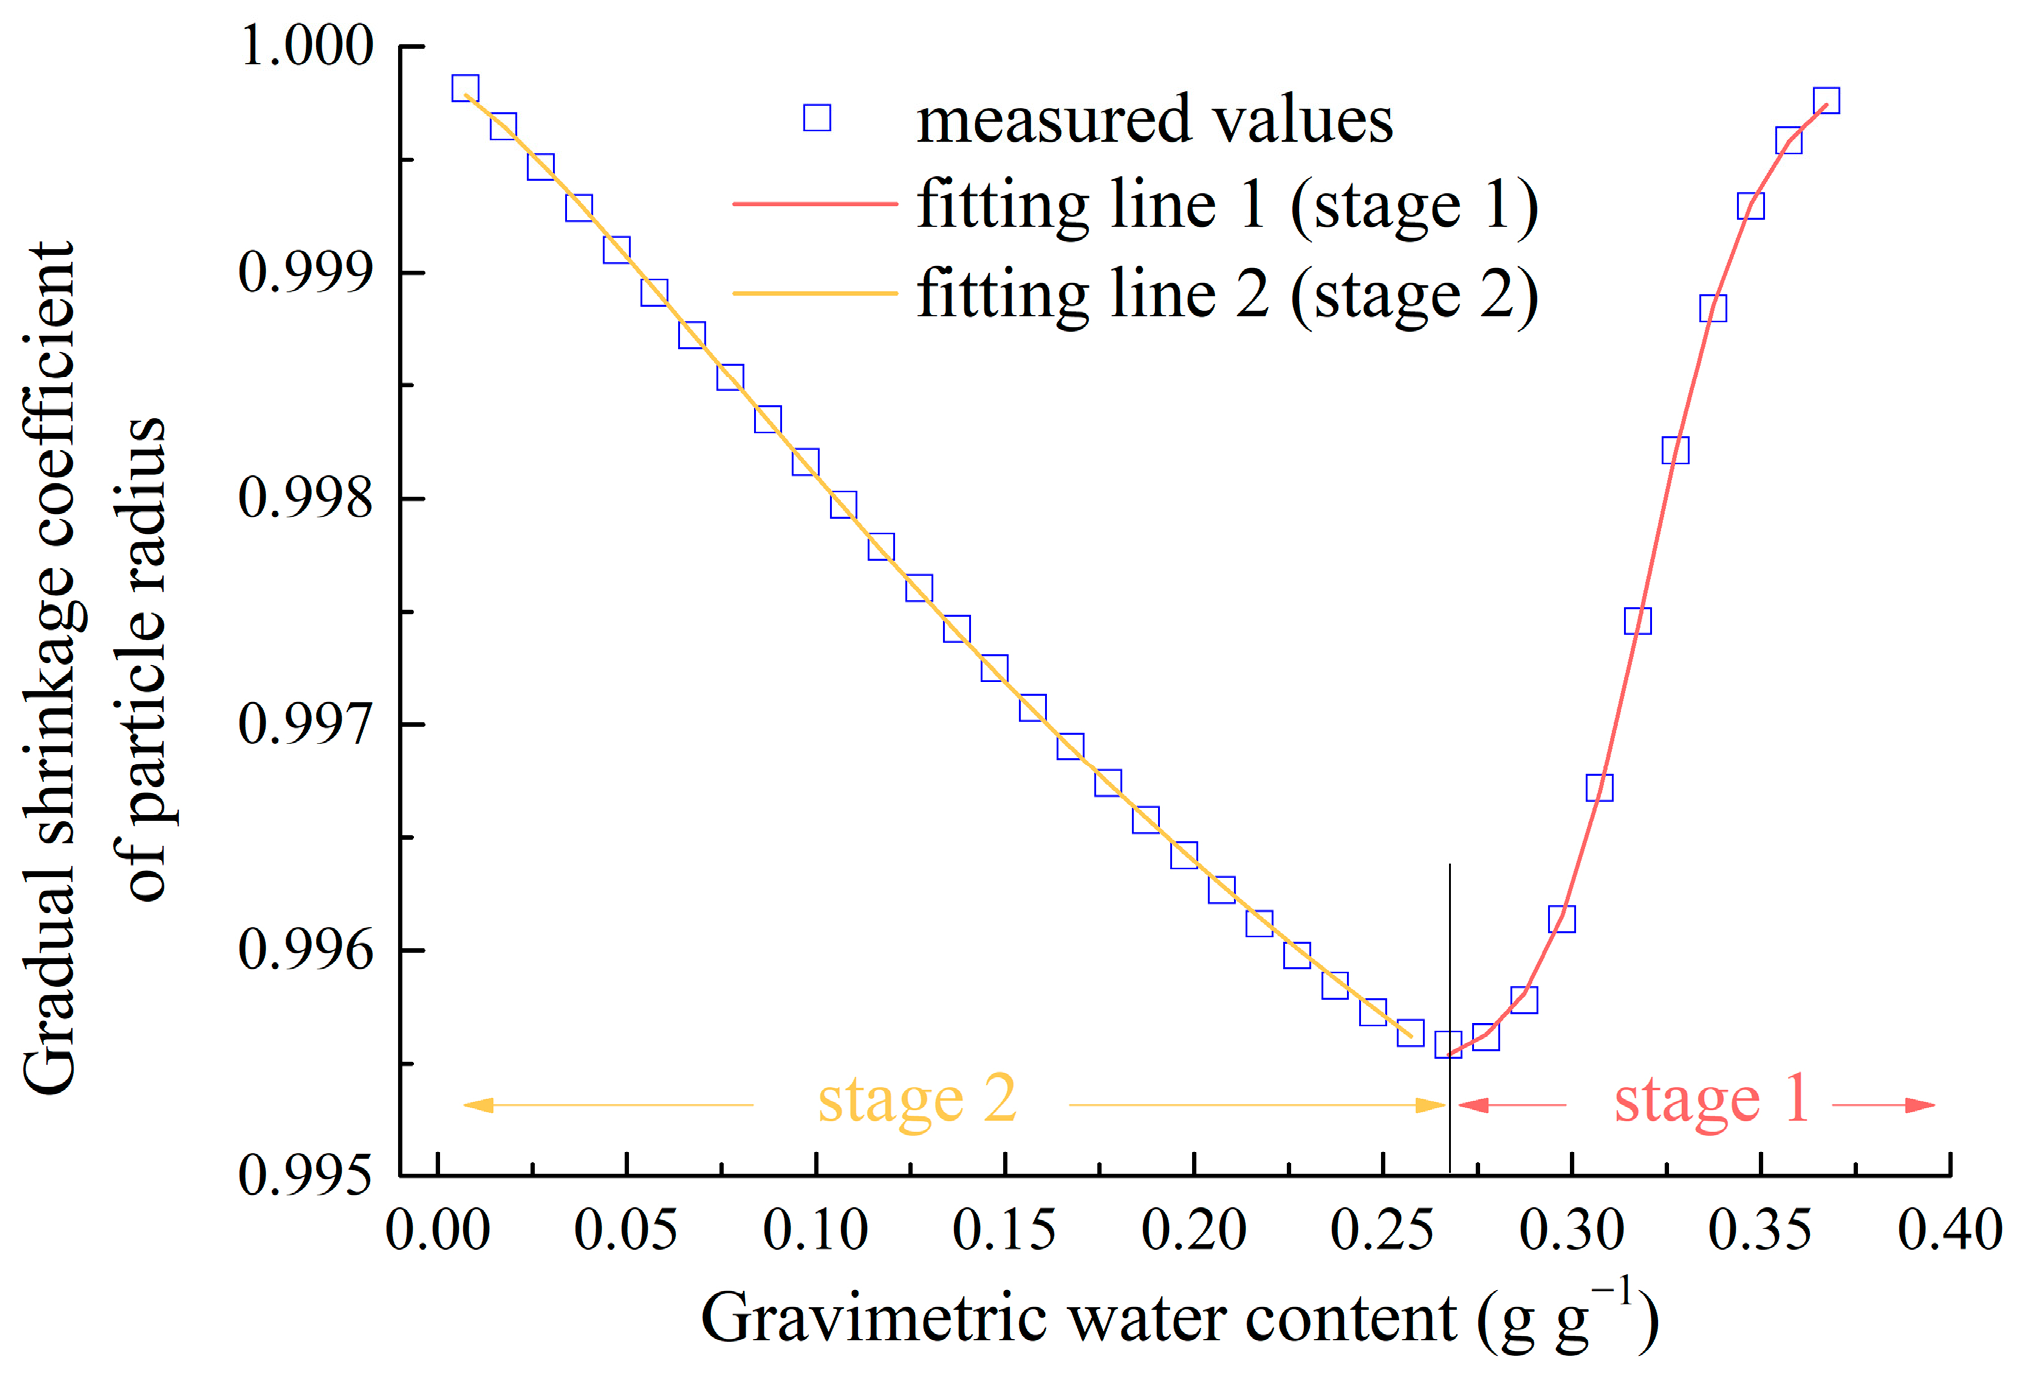
In the shrinkage experiment, the soil water content gradually decreased from the saturated condition to the drying limit. Based on the data of the soil shrinkage characteristic curve, the gradual shrinkage coefficients of particle radius in the discrete element model of shrinkage were determined, as shown in Figure 3. It could be seen that during the drying process, the gradual shrinkage coefficient of the particle radius exhibited a two-stage characteristic. At the first stage, the shrinkage coefficient continuously decreased from approximately 1.000 to approximately 0.996 with the reduction in soil water content. At the second stage, it continuously increased from about 0.996 back to approximately 1.000 with a decrease in soil water content. According to the characteristics of two-stage and “S-shaped” within each stage of the gradual shrinkage coefficient, the Logistic function was used for curve fitting (Figure 3), and the fitting results are shown below (Equations (33) and (34)), exhibiting a good fitting effect with all determination coefficients higher than 0.999. During the modeling, the gradual shrinkage coefficient was continuously updated and assigned according to the changes in soil water content.
α r ` = 0.99994 + 0.99547 0.99994 1 + θ 0.32077 22.6412 ( R 2 = 0.9998 )
α r ` = 0.99028 + 0.99985 0.99028 1 + θ 0.30672 1.3377 R 2 = 0.9997
(2)
Cracking Model
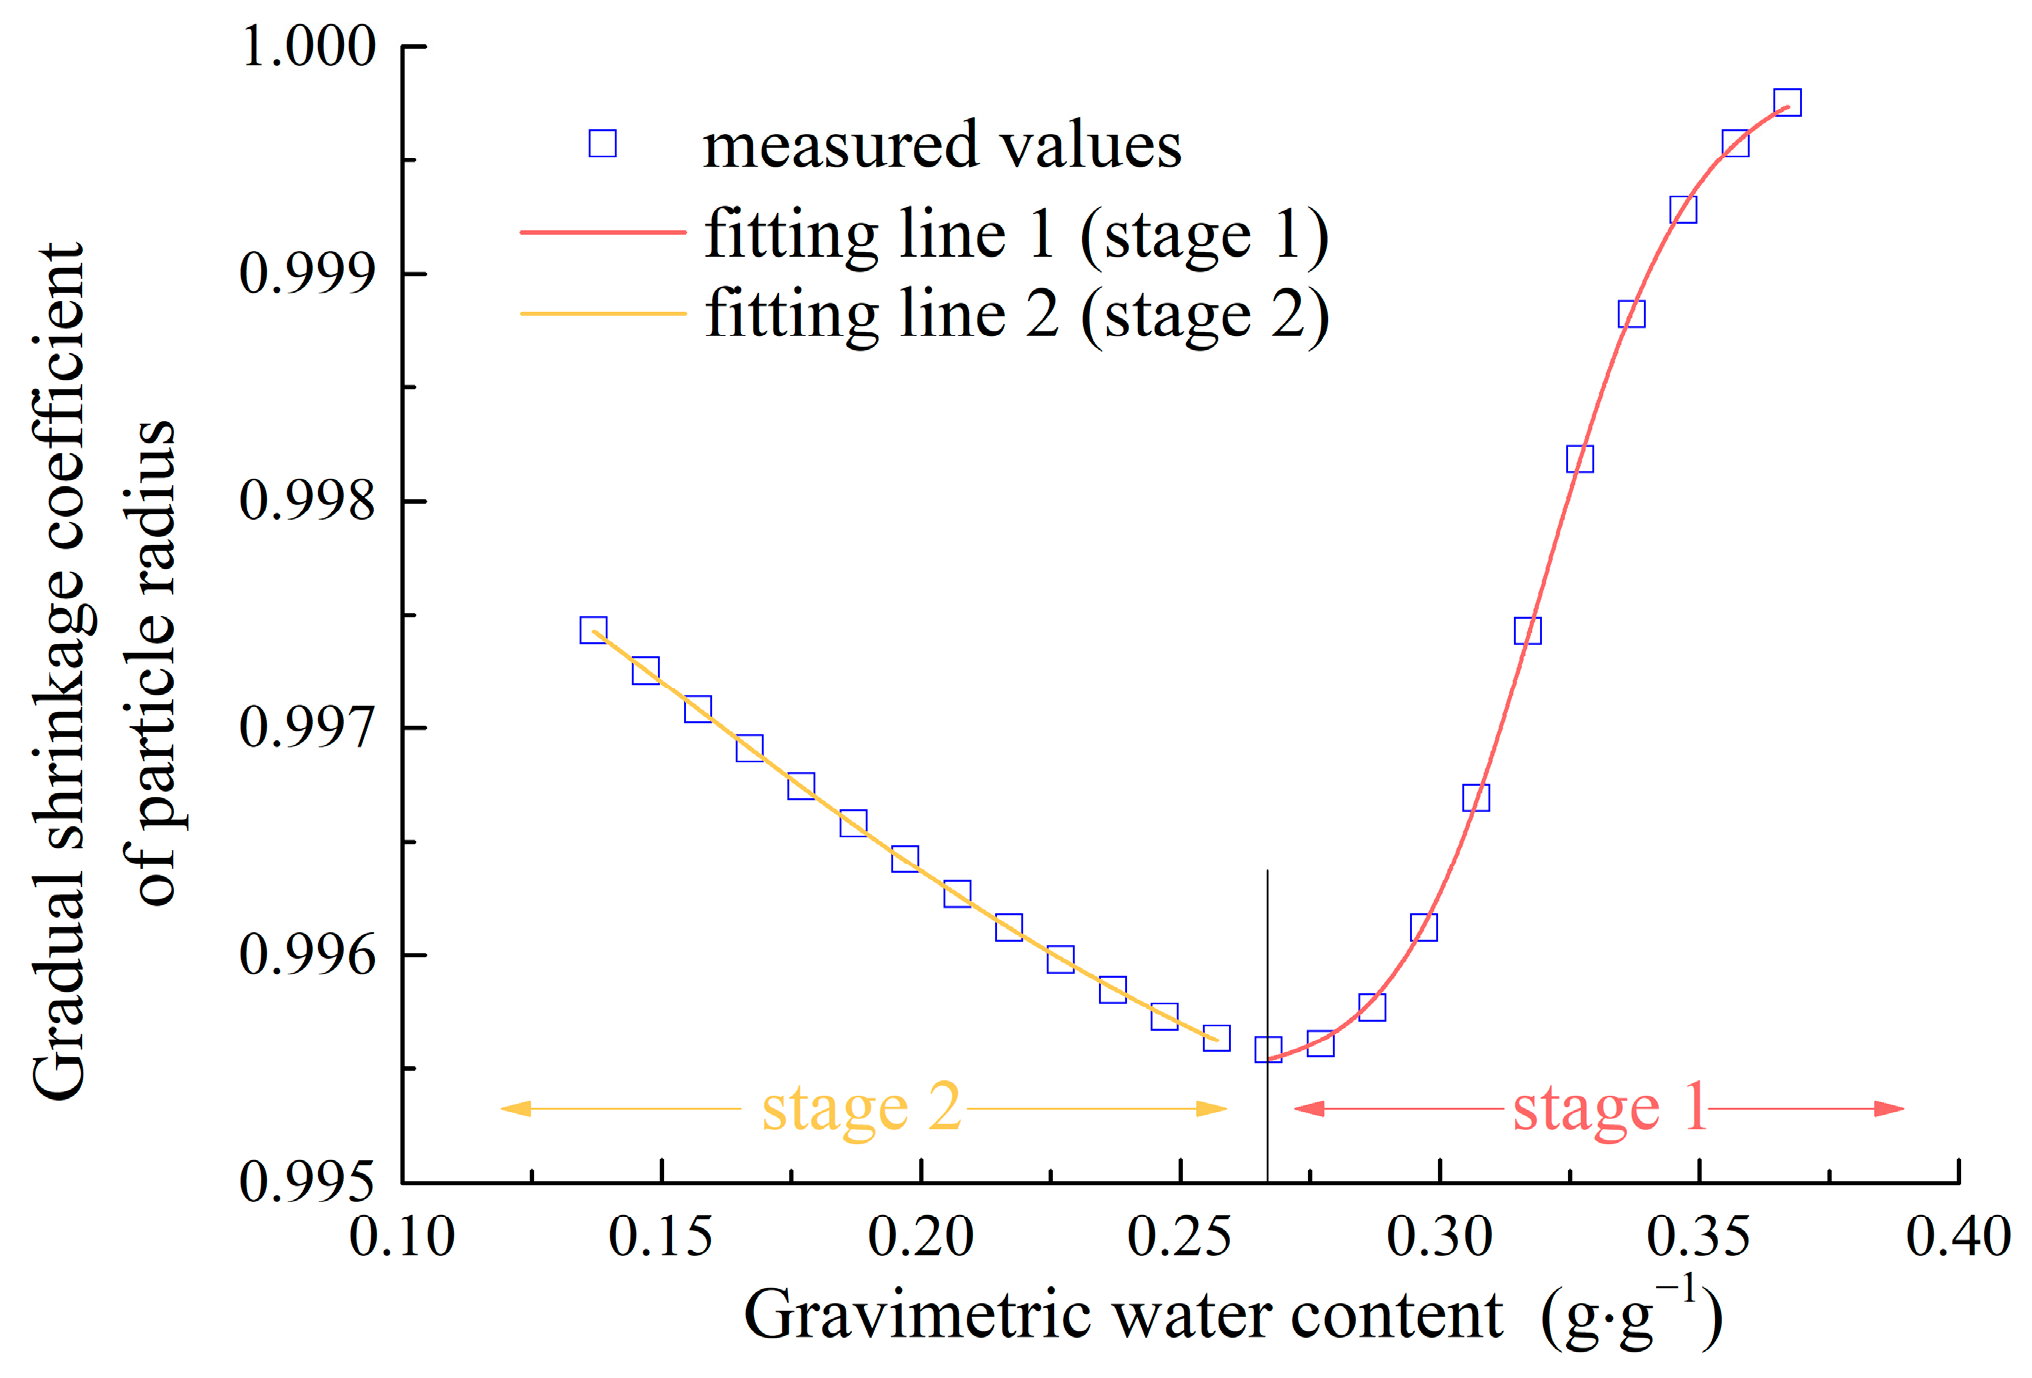
In the cracking experiment, the soil water content decreased from the saturated water content of approximately 0.410 g·g−1 to 0.137 g·g−1. The soil water content was subdivided at equal intervals, starting from 0.407 g·g−1 and gradually decreasing to 0.137 g·g−1 in steps of 0.01 g·g−1. Due to factors such as measurement errors, the saturated water content in the cracking experiment was higher than that in the shrinkage experiment (0.377 g·g−1). Hence, the gradual shrinkage coefficient for the cracking model was assumed as 1.0 when the soil water content was higher than 0.377 g·g−1. Based on the data of the soil shrinkage characteristic curve, the gradual shrinkage coefficient in the cracking experiment was derived and shown in Figure 4.
The gradual shrinkage coefficient of particle radius for the cracking model was similar to the shrinkage model, exhibiting a two-stage characteristic. At the first stage, it continuously decreased as the soil water content decreased. At the second stage, it continuously increased with the decrease in water content. The Logistic function was also used for curve fitting, and the results for Stage 1 and Stage 2 are as follows:
α r ` = 0.99994 + 0.99547 0.99994 1 + θ 0.32078 22.6783 R 2 = 0.9998
α r ` = 0.99415 + 0.99851 0.99415 1 + θ 0.20267 2.82583 R 2 = 0.9999
Similarly, during the modeling, the gradual shrinkage coefficient was continuously updated and assigned according to the changes in soil water content.

3. Results and Discussion

3.1. Experimental Results

3.1.1. Shrinkage Characteristic

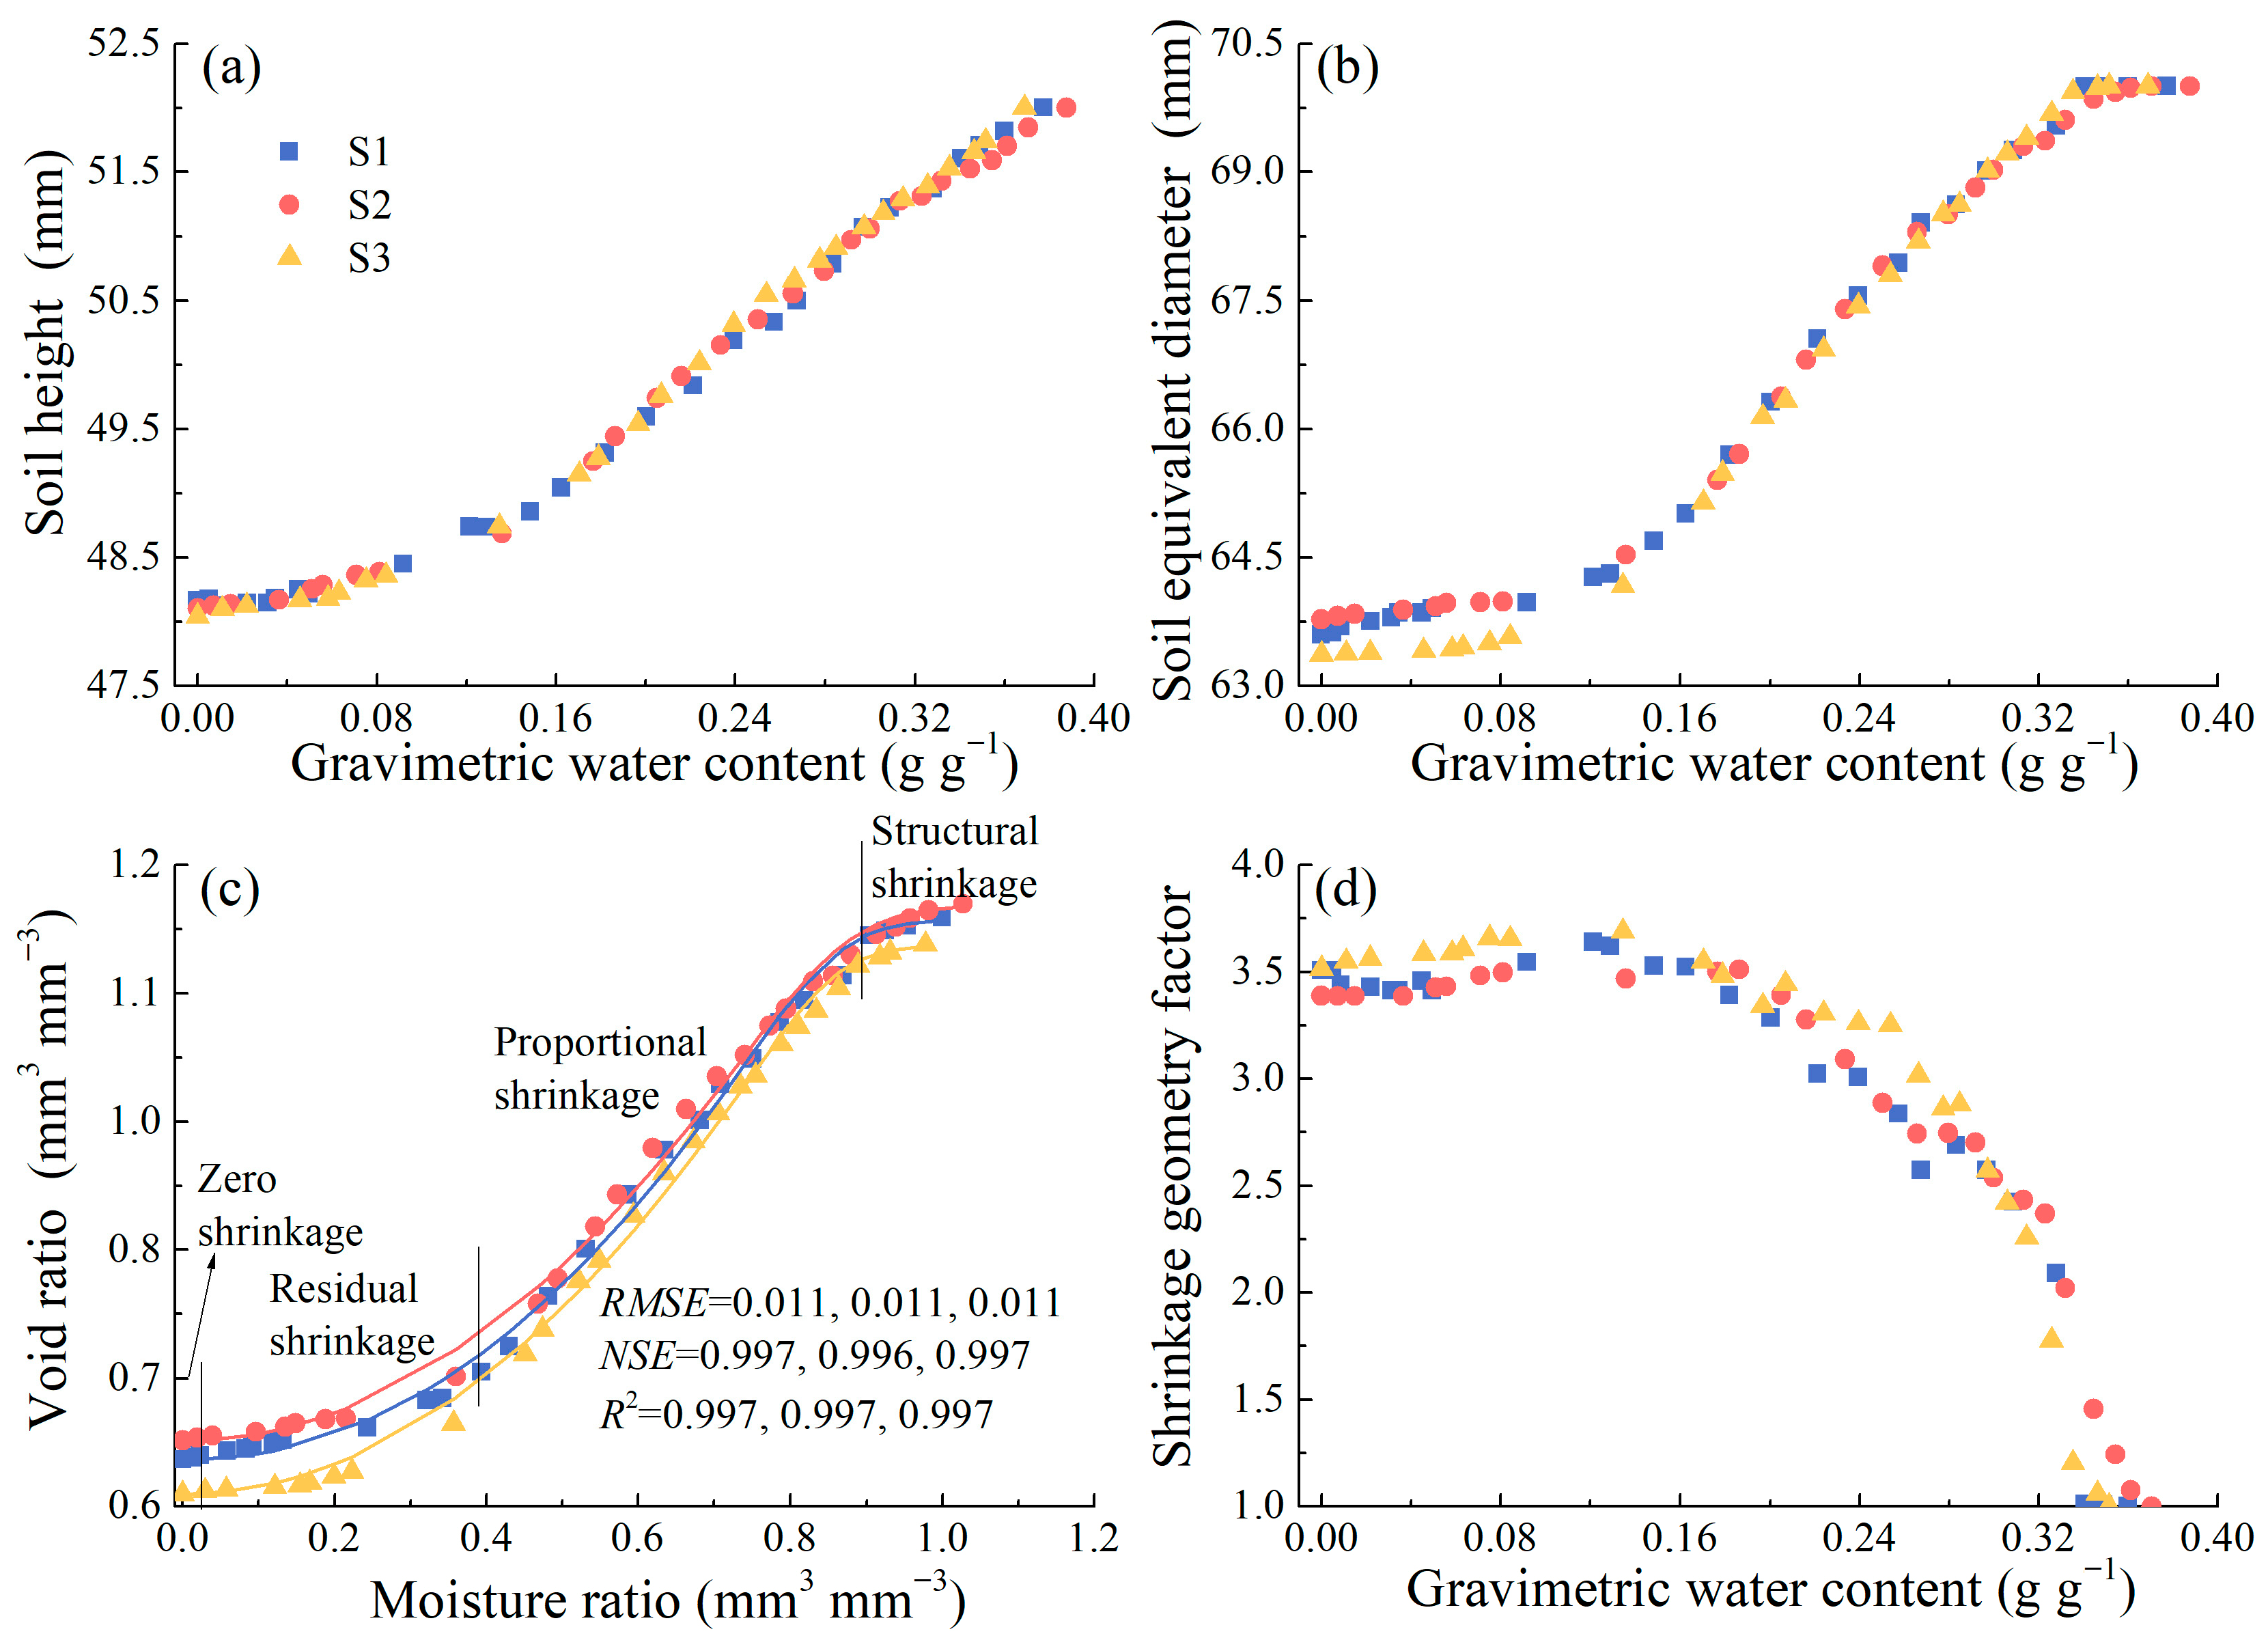
Figure 5a shows the dynamic changes in the soil height during the drying process. As the drying progressed, the soil water content continuously decreased, and the soil height decreased accordingly. The change in soil height could be roughly divided into two stages. (1) Rapid decline stage: the soil water content decreased from the maximum value to about 0.15 g·g−1, and the soil height rapidly decreased linearly from 52.0 mm to 48.6 mm with soil water content. (2) Residual decline stage: the soil water content decreased from about 0.15 g·g−1 to the drying limit, while the soil height declined slowly and the decline rate reduced continuously. The final soil height was approximately 48.1 mm.
Figure 5b shows the dynamic variation in the equivalent diameter of the soil during the drying process. The variation in the equivalent diameter with the soil water content could be roughly divided into three stages. (1) Stable stage: the soil water content decreased to about 0.33 g·g−1, while the equivalent diameter remained almost unchanged or changed slightly. (2) Rapid decline stage: the soil water content decreased from about 0.33 g·g−1 to about 0.15 g·g−1, and the equivalent diameter decreased rapidly and was almost linearly related to the soil water content. This stage was similar to the first stage of soil height change. (3) Residual decline stage: the decline of the equivalent diameter slowed down, and the decline rate also decreased continuously. This stage was similar to the second stage of soil height change. The change in the equivalent diameter of the soil had one more stage (stable stage) than the change in soil height. This indicated that during the drying process, the horizontal shrinkage and vertical shrinkage of the soil were not synchronized, and the vertical shrinkage occurred earlier than the horizontal shrinkage.
Figure 5c shows the fitting of the soil shrinkage characteristic curve. The values of Root Mean Square Error (RMSE) were close to 0.01, and the values of Nash–Sutcliffe Efficiency (NSE) and coefficient of determination (R2) were close to 1.0, verifying that the VG-Peng model was suitable for fitting shrinkage characteristic curves of the soil in this experiment. The shrinkage characteristic curves did not start from a 1:1 line as expected, which was probably because the sample was not thoroughly saturated by the capillary rise method. In addition, it was found that the soil shrinkage characteristic curves had four complete shrinkage stages. The proportional shrinkage stage occupied the highest moisture ratio, almost accounting for half of the total.
Figure 5d shows the variation in the shrinkage geometric factor with the soil water content. At the beginning of the drying, the shrinkage geometric factor was close to or slightly larger than 1.0, indicating that the vertical shrinkage dominated and horizontal shrinkage was almost negligible in the initial stage of drying. Subsequently, the shrinkage geometric factor increased rapidly, suggesting that the horizontal shrinkage was constantly increasing. When the soil water content dropped to approximately 0.15 g·g−1, the shrinkage geometric factor started to be stable at approximately 3.5 with slight fluctuation until the end of the drying process.

3.1.2. Crack Characteristic

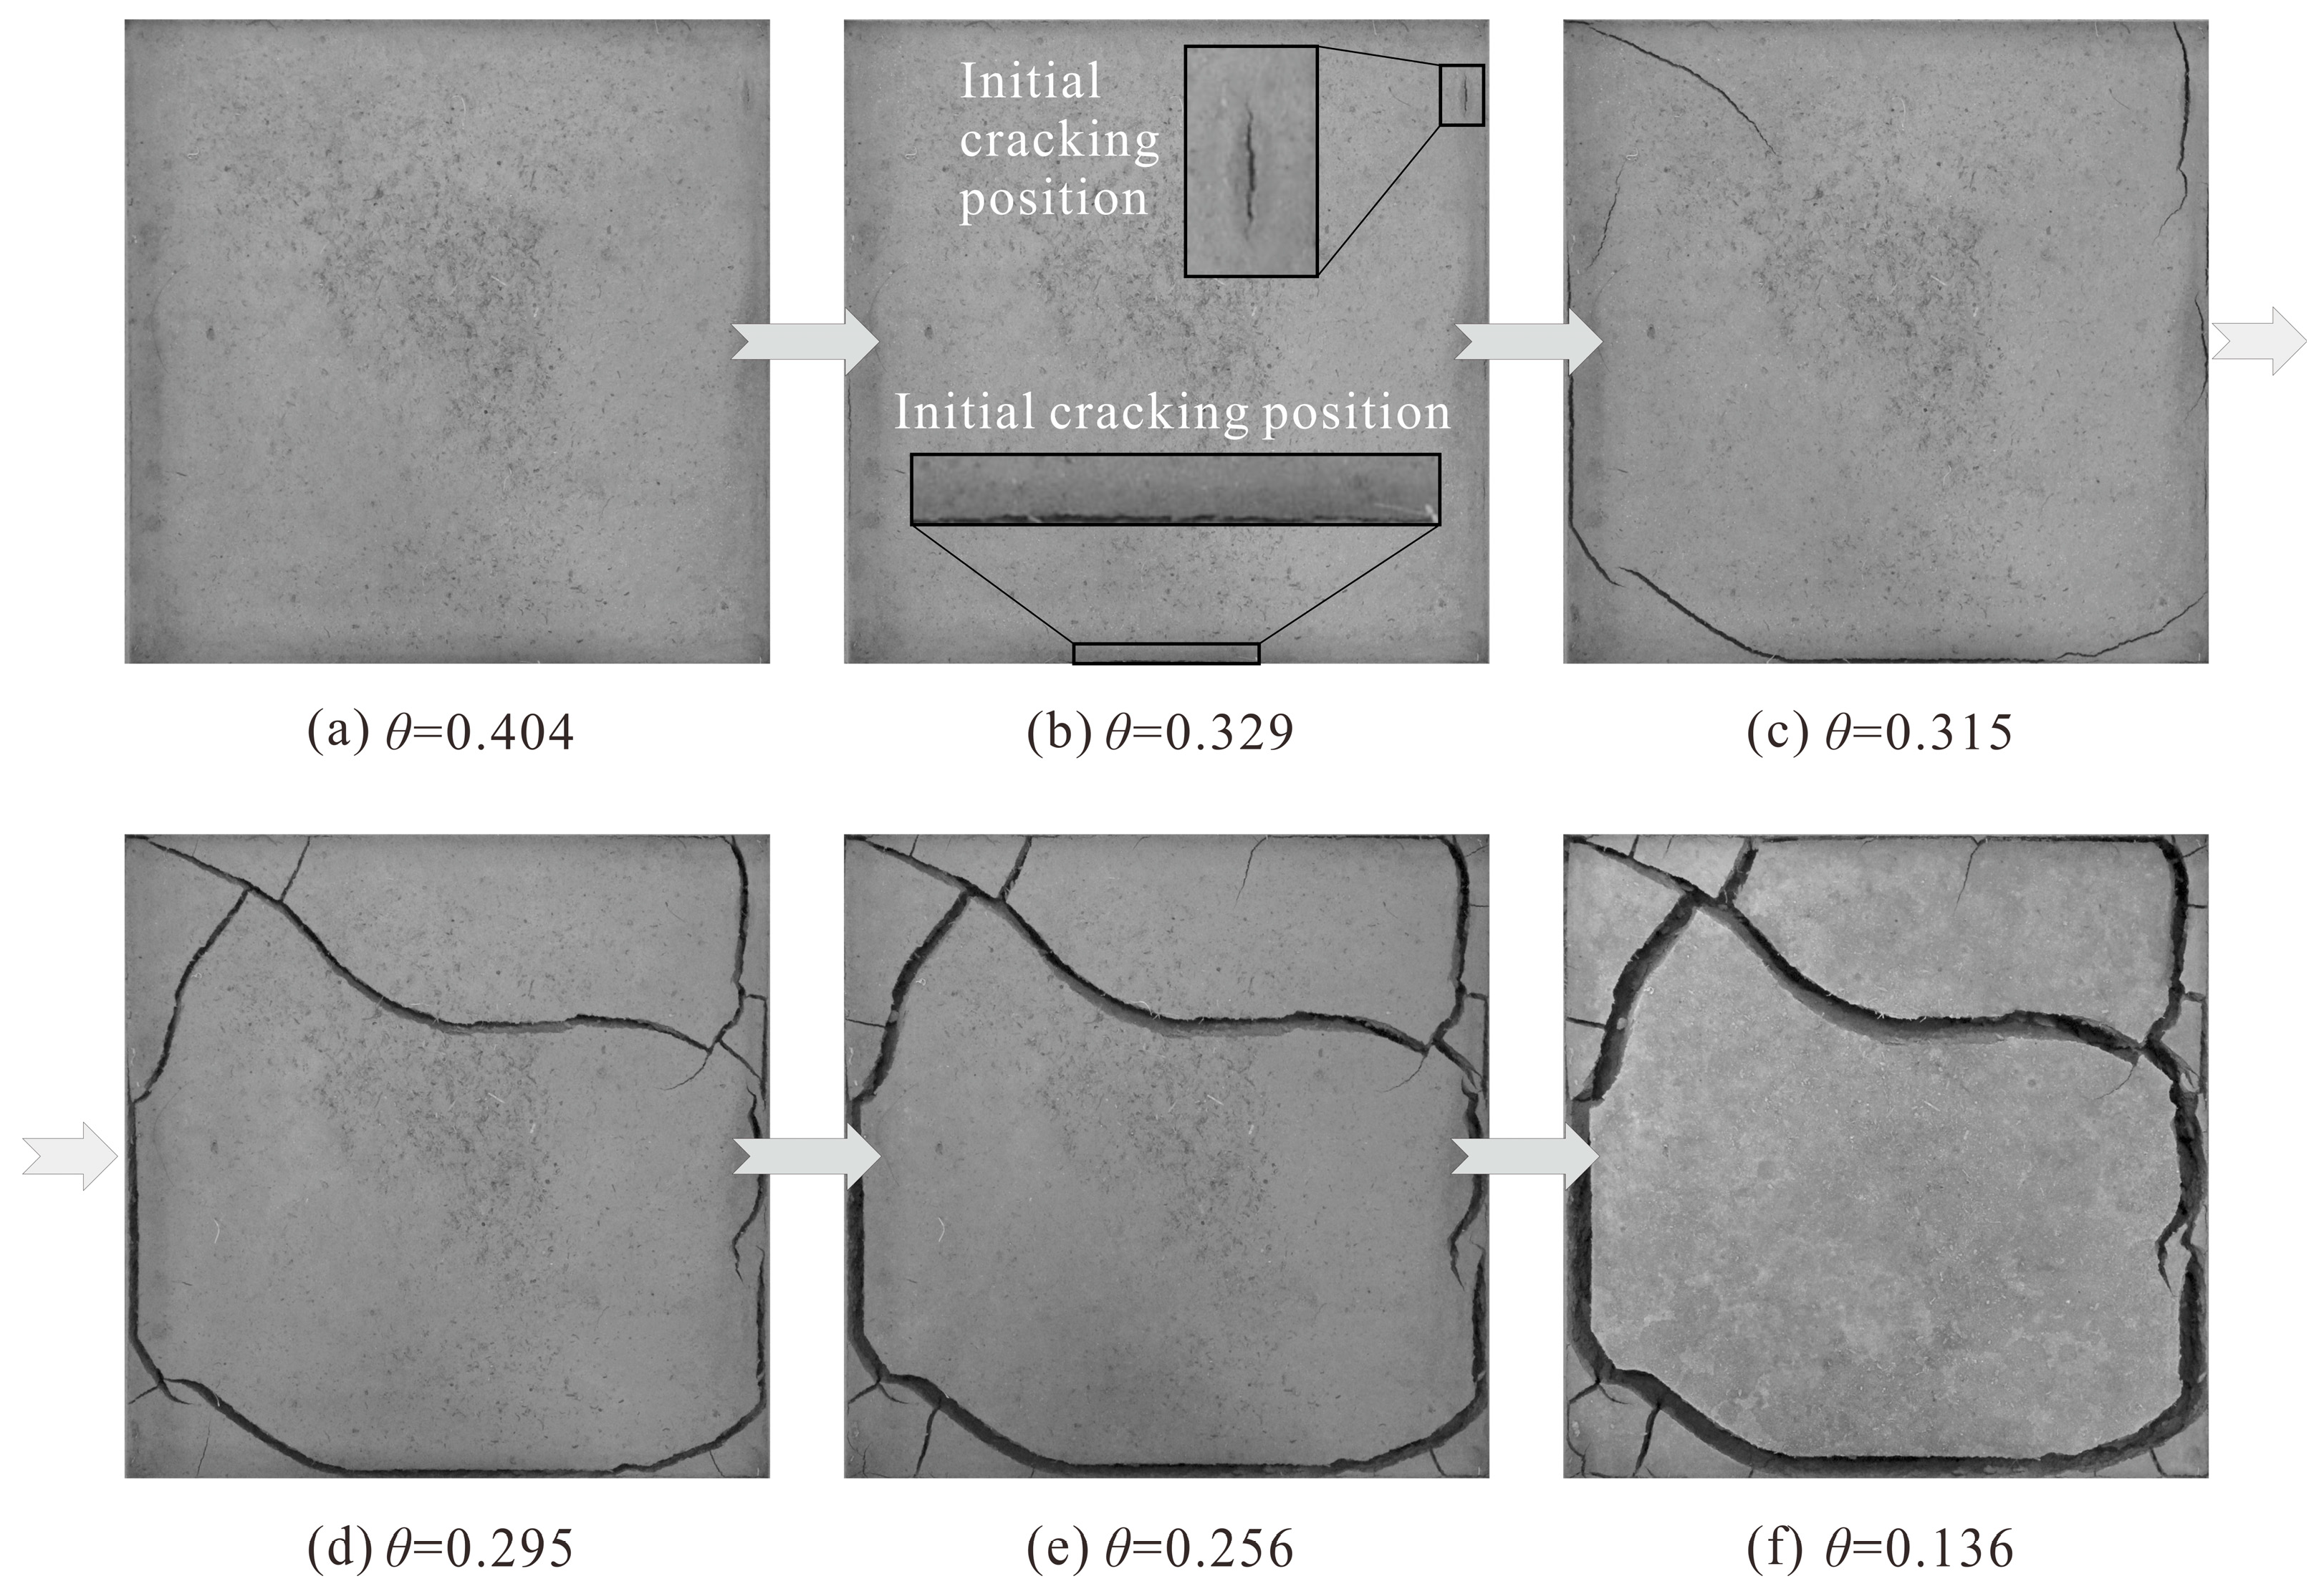
The dynamic process of crack development during drying is shown in Figure 6. When the soil water content decreased to approximately 0.329 g·g−1, two cracks that could be observed with the eye appeared on the soil surface (Figure 6b). One of the cracks was located at a depressed area on the soil surface. The other crack was near the edge of the container. As the soil water content further decreased, the two cracks developed rapidly, with the crack length and width increasing significantly. In addition, cracks were randomly generated in other areas, and the crack lengths increased extremely rapidly. When the soil water content dropped to 0.295 g·g−1, the development of crack length was nearly stable. These cracks were primary cracks, which determined the skeletal structure of the crack network. After that, during the drying process, some secondary cracks gradually formed around the primary cracks. The length of all cracks changed slightly, but the width was increasing continuously. When the soil water content decreased to 0.136 g·g−1, the crack length and width hardly changed, suggesting that the crack development had ceased. In addition, it could be seen that the intersections of the cracks were in the form of “T” or “Y” structures in the stabilized crack network.
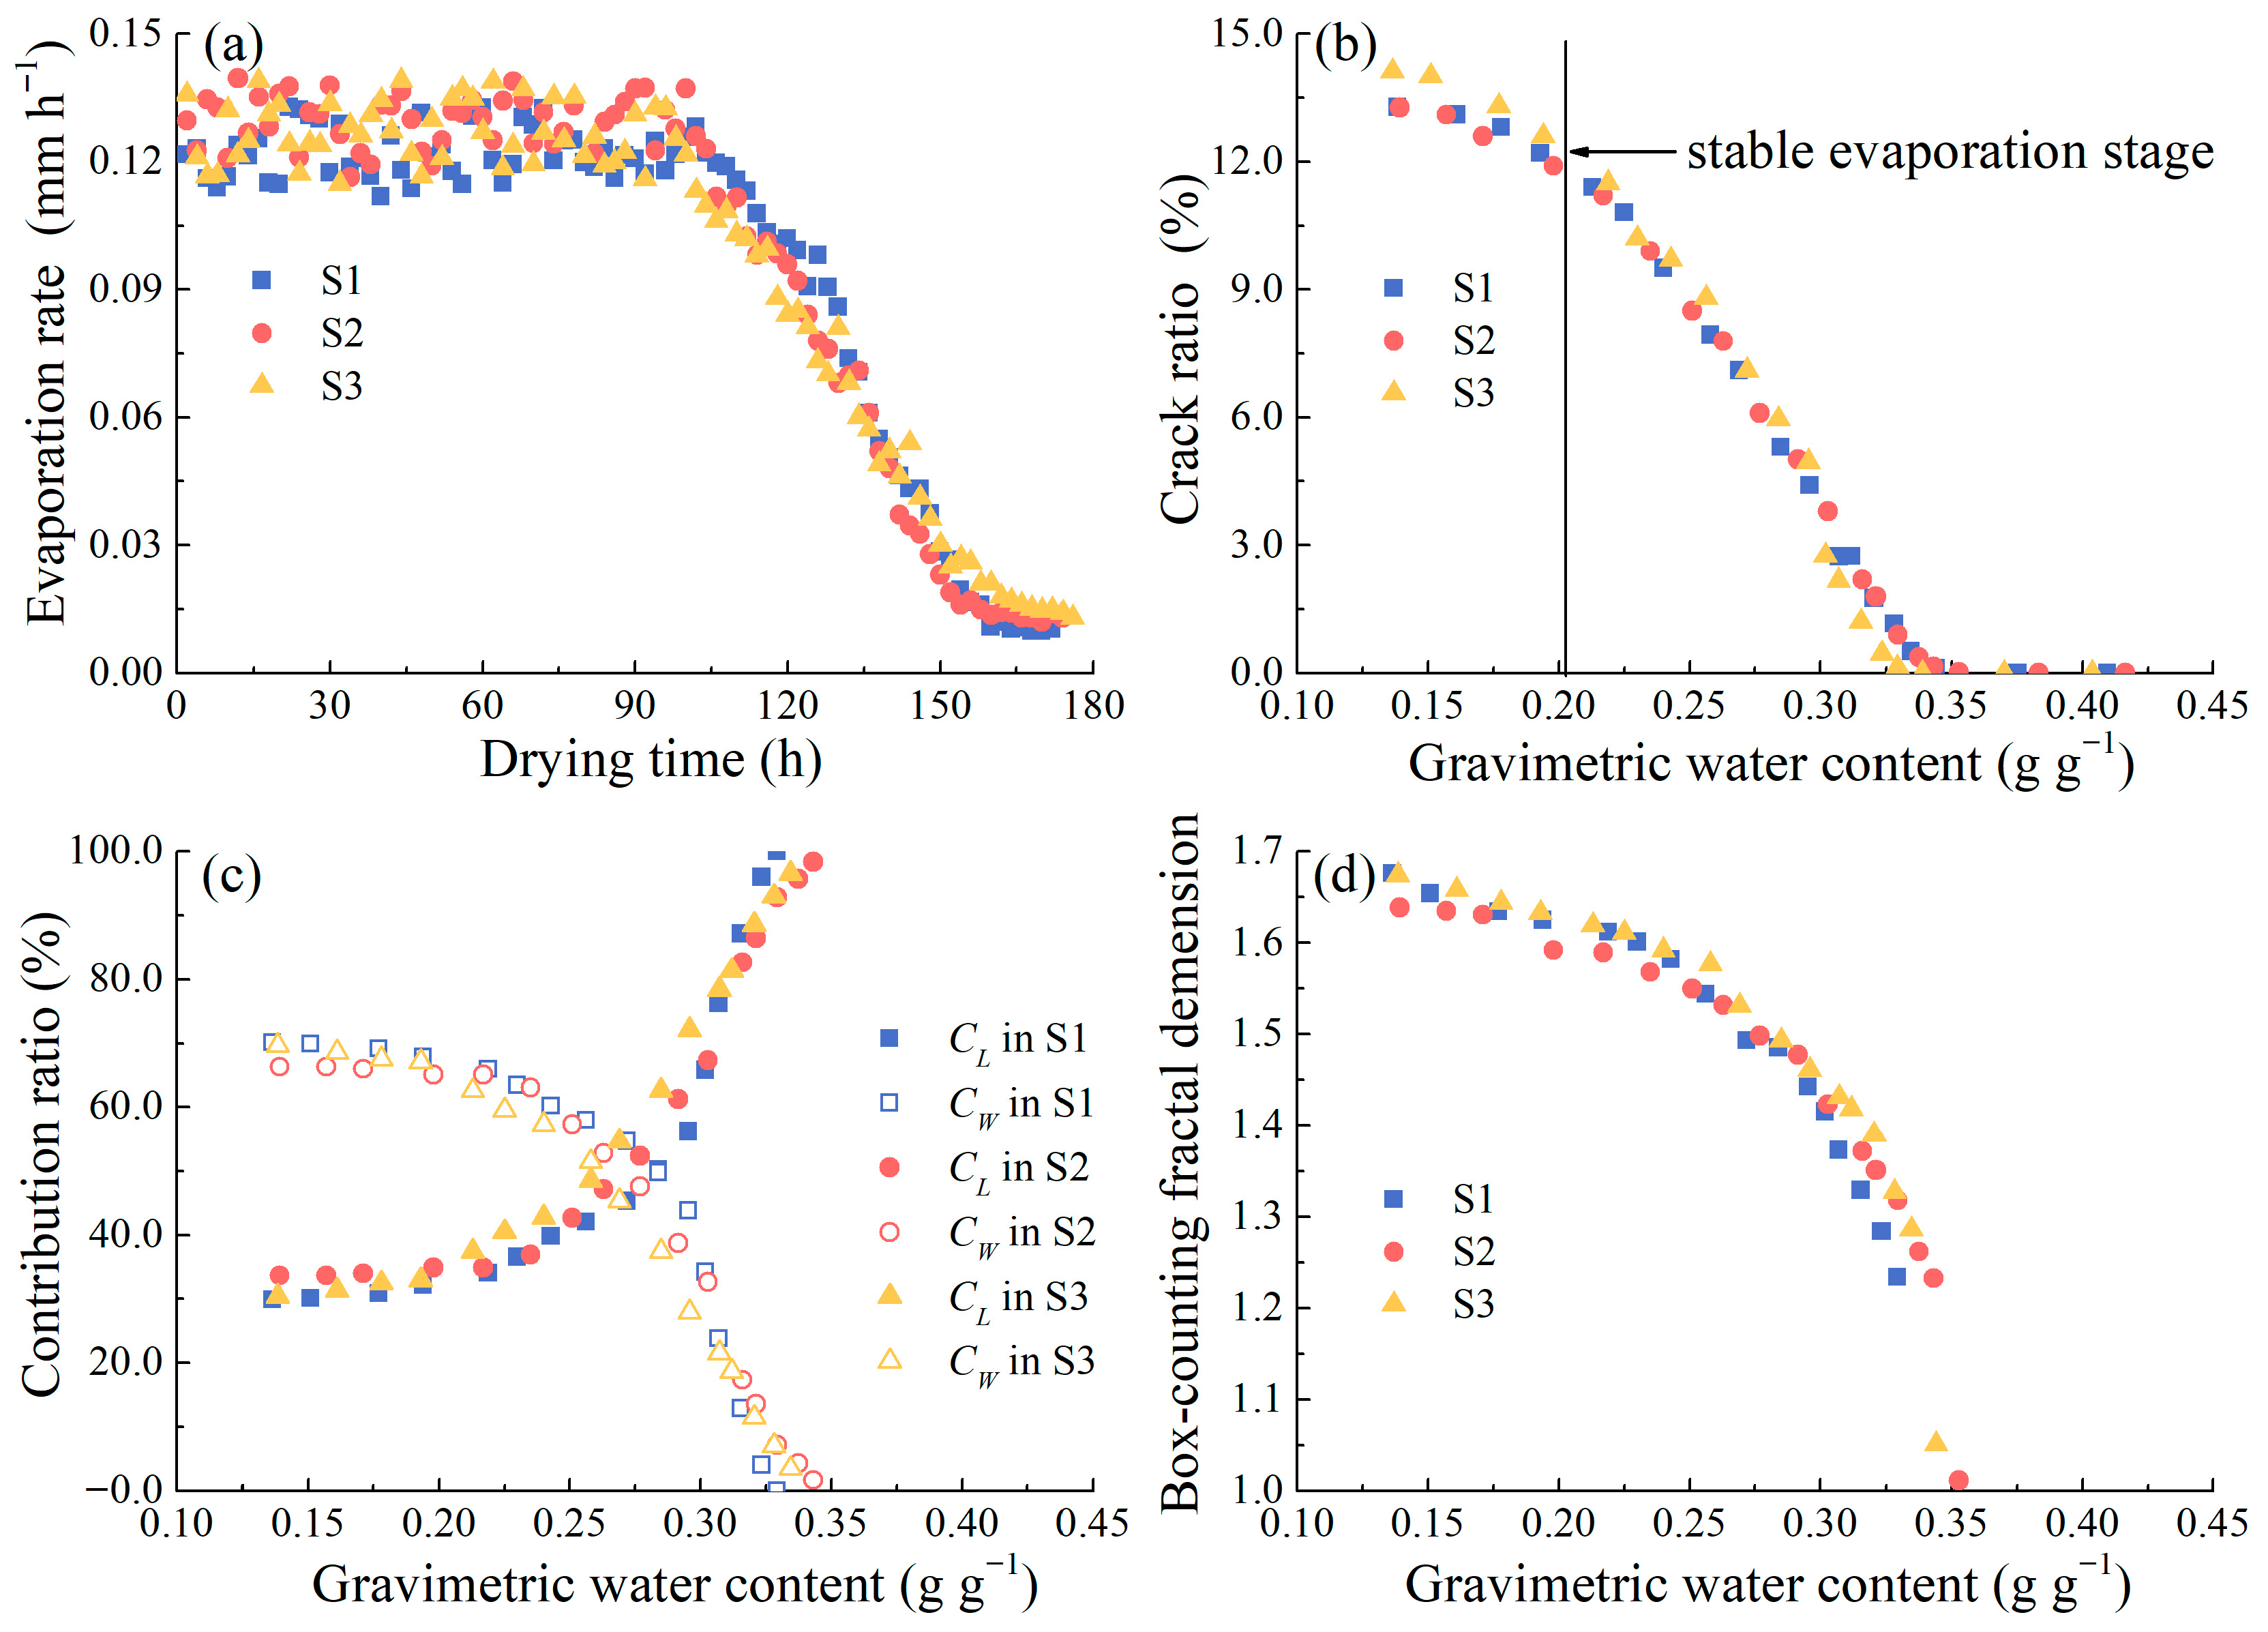
Figure 7a shows the changes in soil evaporation and soil water content during drying. The soil evaporation process could be roughly divided into three stages, namely the stable stage, the declining stage, and the residual stage. The stable stage lasted approximately 100 h. During this period, the soil evaporation intensity remained unchanged, with a value of approximately 0.13 mm·h−1. The declining stage lasted about 60 h. The evaporation intensity decreased rapidly within this stage. After the declining stage, the evaporation entered the residual stage. At this stage, the evaporation intensity was extremely low with values close to 0.01 mm·h−1.
Figure 7b shows the variation in the crack ratio with the soil water content during drying. When the soil water content dropped to around the cracking water content of 0.329 g·g−1, the crack ratio began to increase rapidly and had a linear relationship with the soil water content. When the soil water content decreased to about 0.200 g·g−1, the increasing rate of the crack ratio obviously slowed down. Eventually, the crack ratio stabilized at approximately 13.5%. It could also be found that at the end of the stable stage of evaporation, the crack ratio has reached a relatively high value, which was above 80% of the final crack ratio. This indicated that most cracks generated and expanded rapidly during the stable stage of evaporation during the drying process.
Figure 7c shows the variation in the contribution ratio of crack length and crack width with soil water content during drying. At the beginning of cracking, C L was close to 100%, whereas C W was almost 0. As drying proceeded, C L decreased rapidly while C W increased. At a certain point, when the soil water content was between 0.250 and 0.300 g·g−1, both C L and C W were 50%, indicating that the development of crack length and crack width contributed equally to the crack ratio. At the end of drying, C L and C W were approximately 30% and 75%, respectively.
Figure 7d shows the variation in the box-counting fractal dimension of the crack network with soil water content during drying. D b increased as the soil water content decreased. At the beginning of cracking, D b was close to 1.0 and then increased rapidly with the decreasing soil water content. When the soil water content dropped to approximately 0.250 g·g−1, the skeleton of the crack network was basically stabilized, and the growth rate of D b slowed down. The final values were approximately 1.65, indicating that the crack network had significant self-similarity.

3.2. Model Results

3.2.1. Soil Shrinkage

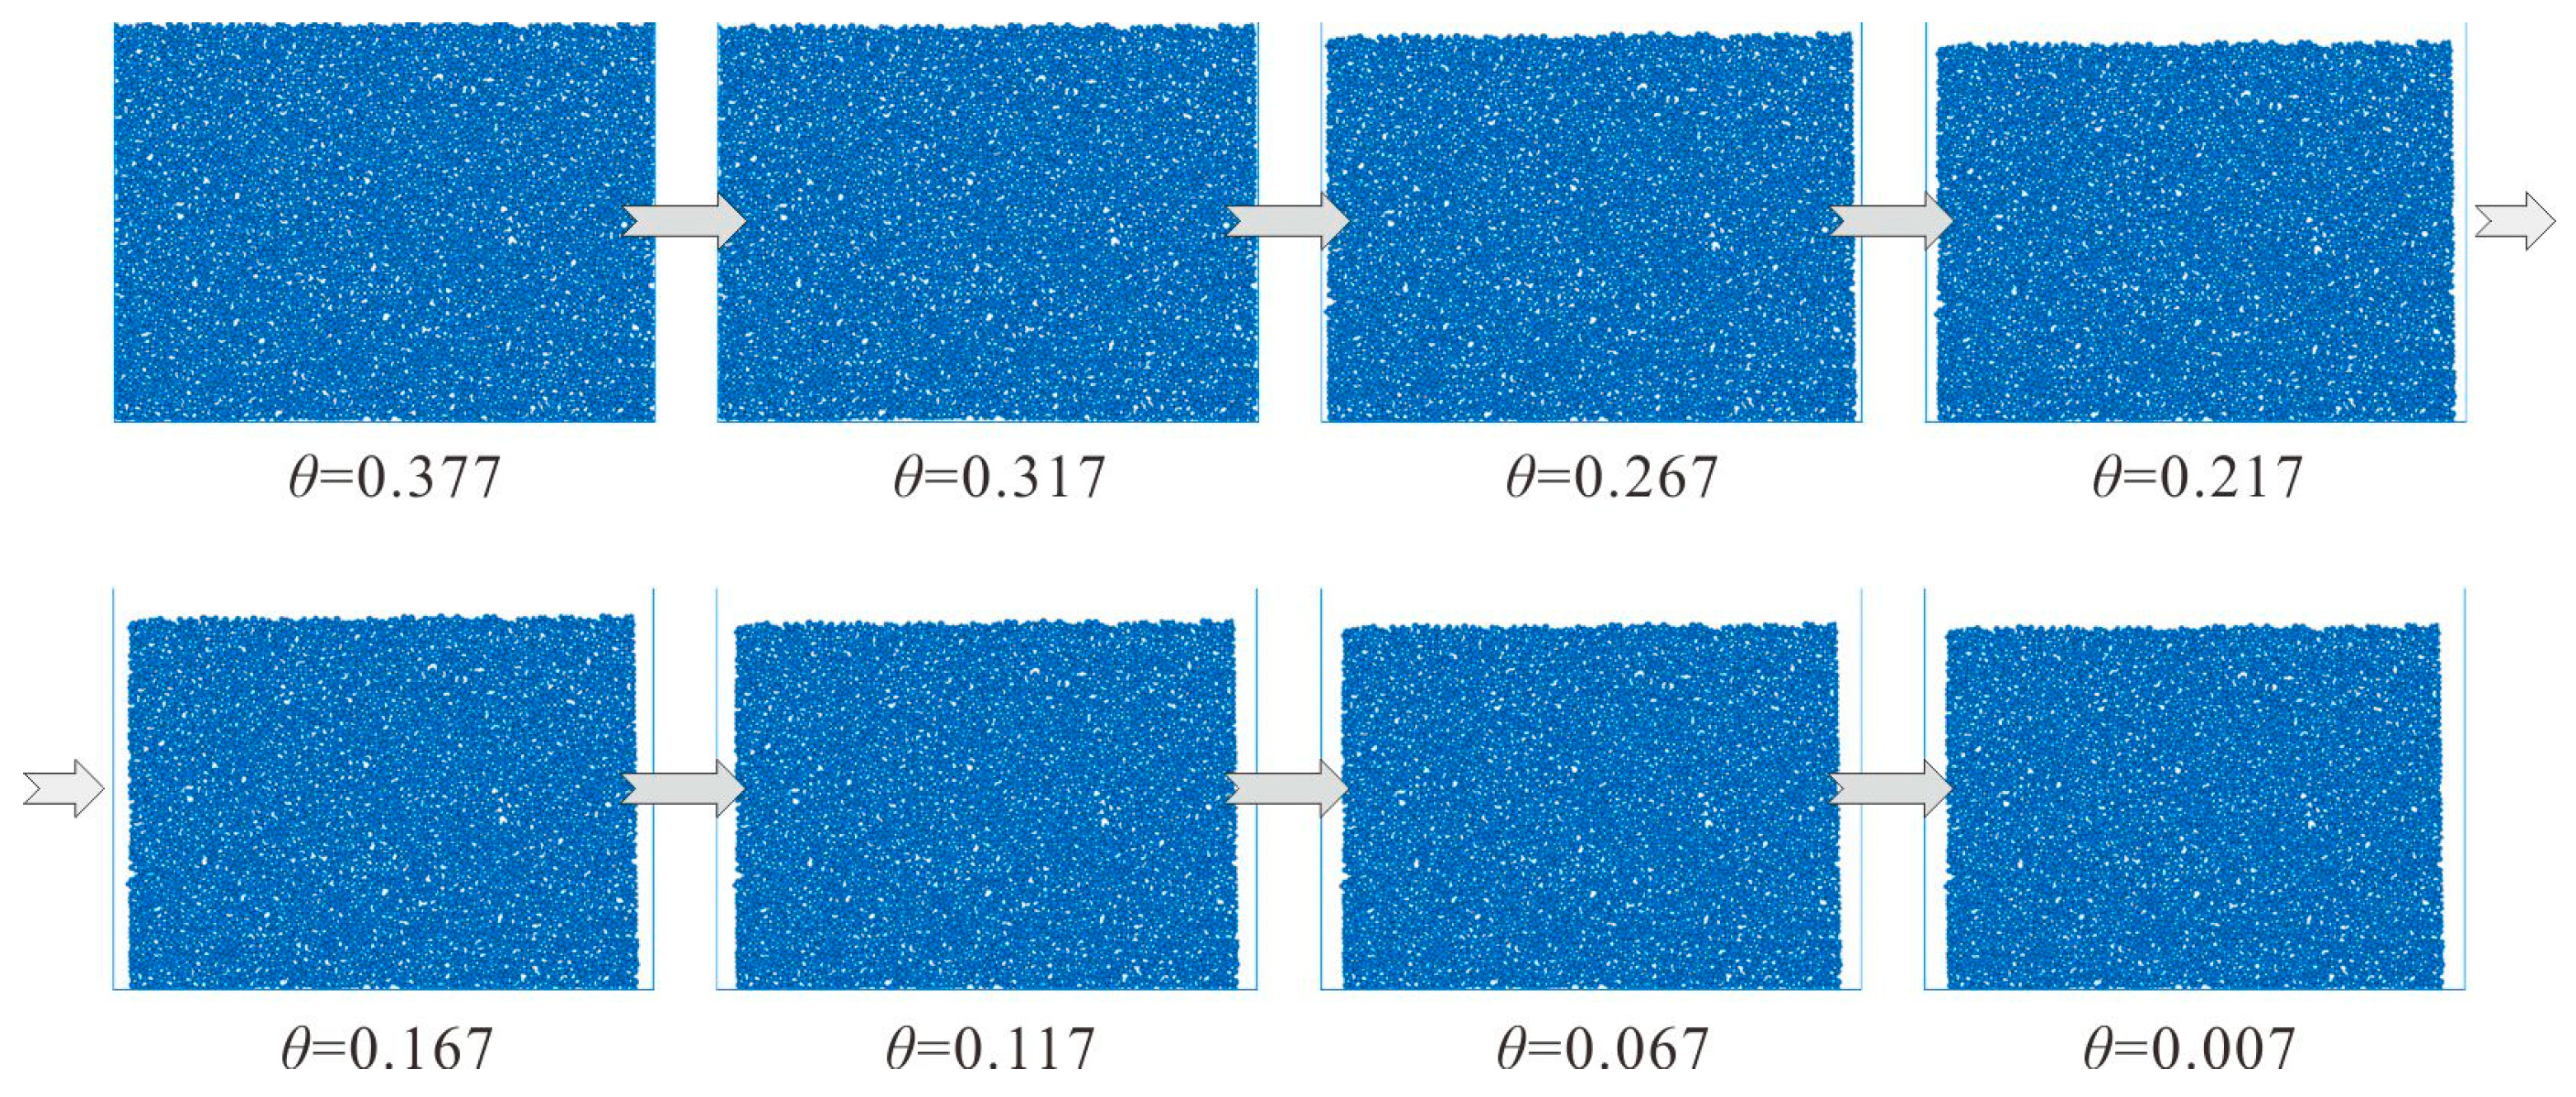
Figure 8 shows the modeled soil shrinkage process. It could be observed that as the soil water content decreased, vertical shrinkage of the sample occurred initially, followed by horizontal shrinkage. When the soil water content dropped to 0.267 g·g−1, the horizontal shrinkage became obvious. Then, the sample shrank rapidly in both vertical and horizontal directions. At the end of drying, the height and width (equivalent diameter) of the sample were significantly decreased. In general, the modeled shrinkage process was relatively consistent with the experimental observations.
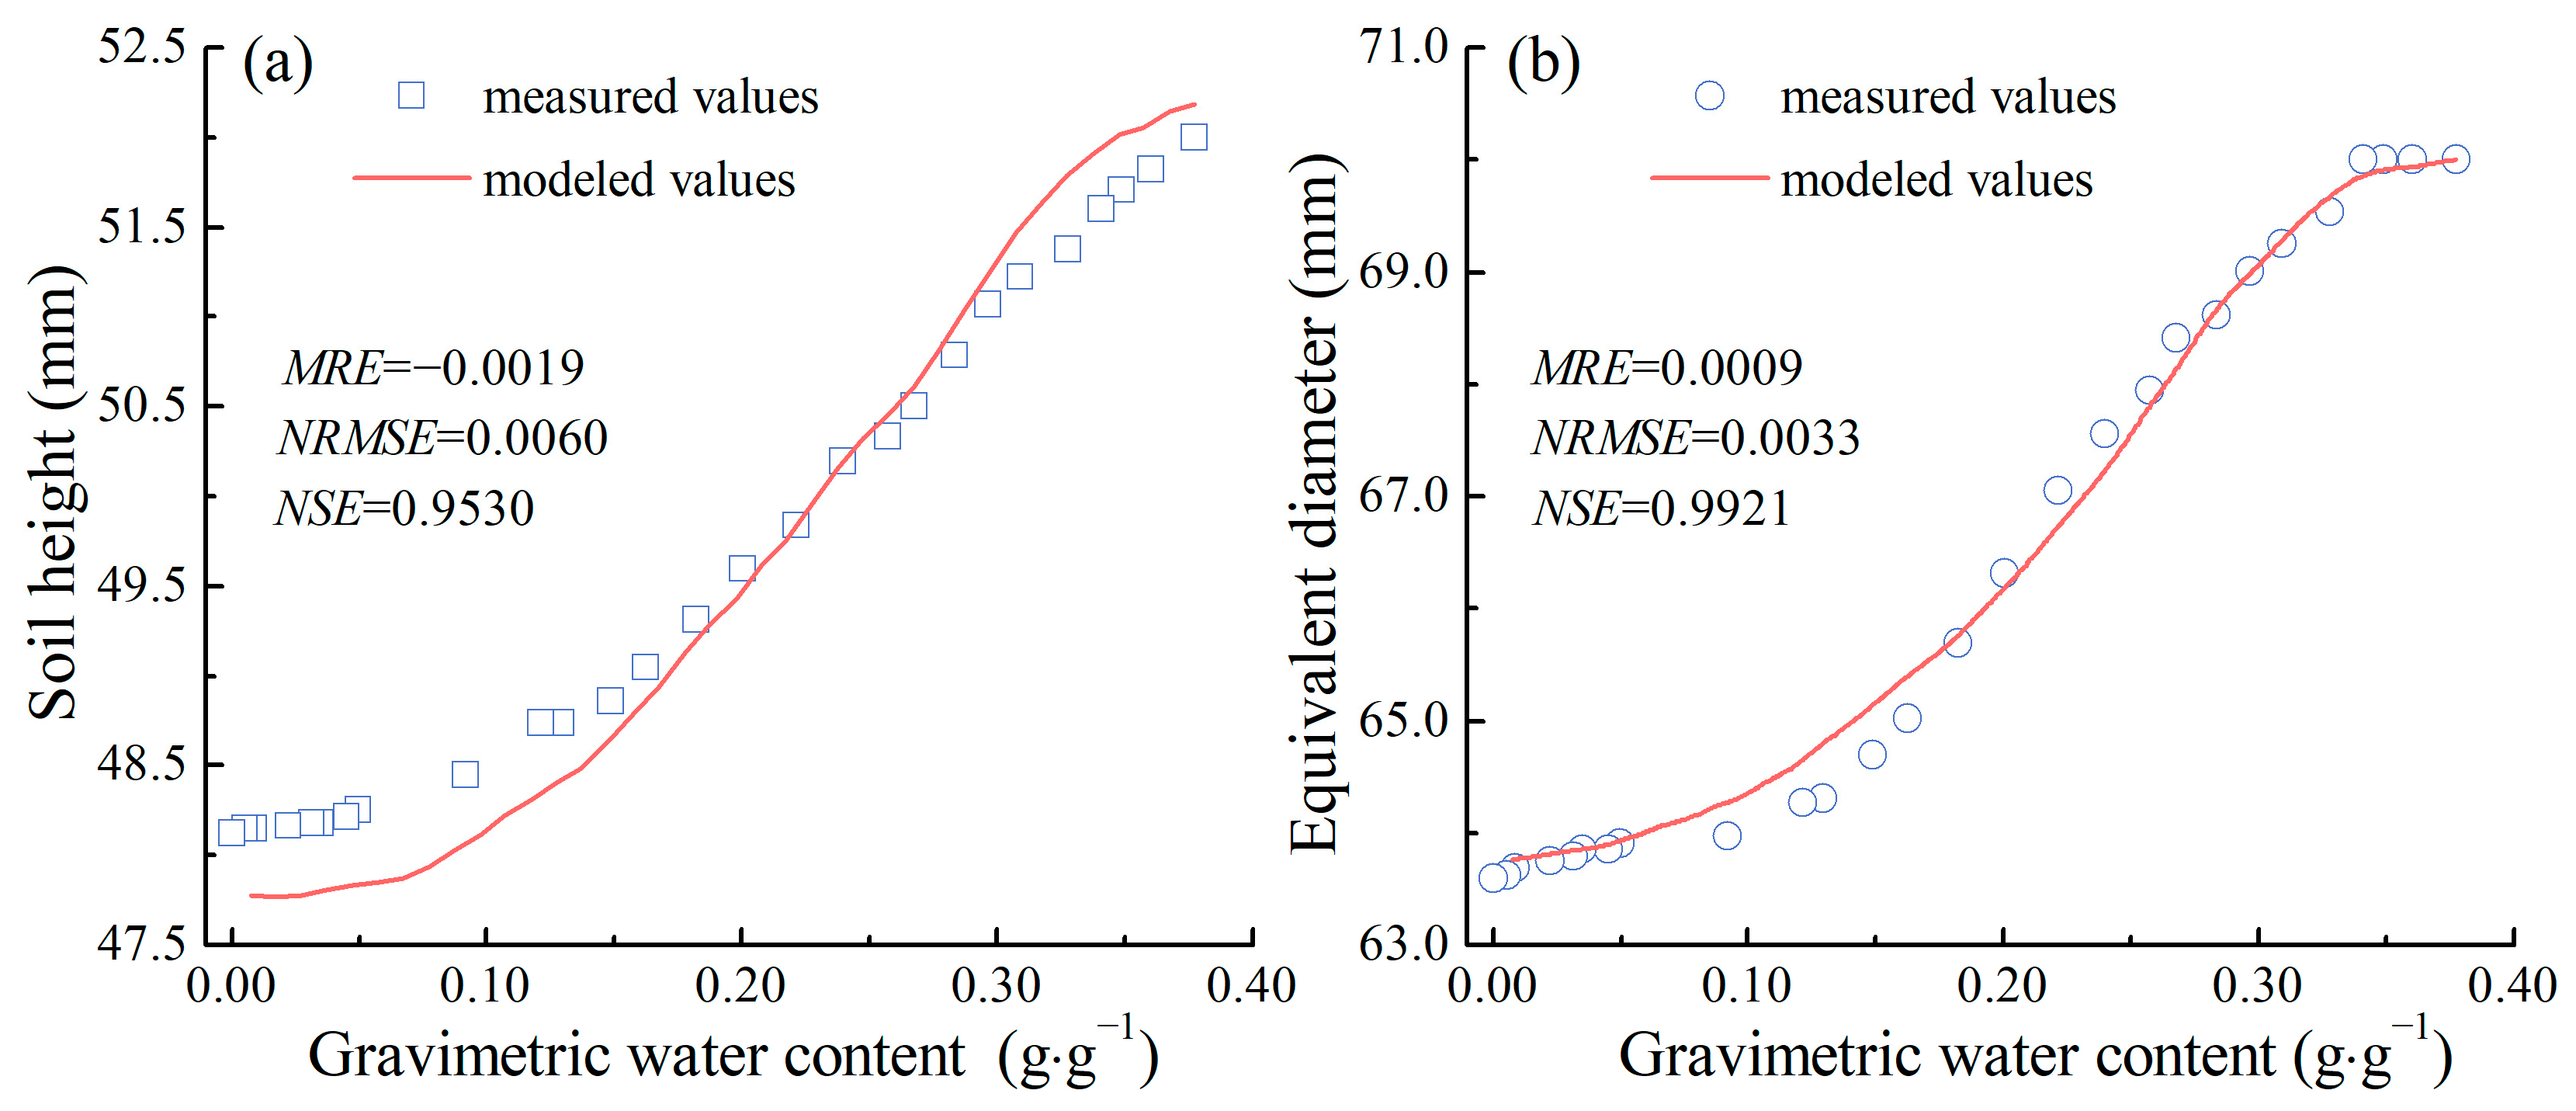
Figure 9 shows the comparison between the modeled and measured change in height and equivalent diameter of the sample. The changing trend of modeling values was consistent with the measured values, with small differences in magnitude. Statistical analysis shows that, for the height and equivalent diameter of the sample, the mean relative errors (MREs) between the simulated and measured values are −0.0019 and −0.0009, the normalized root mean square errors (NRMSEs) are 0.0060 and 0.0033, and the Nash–Sutcliffe efficiency coefficients (NSEs) are 0.9530 and 0.9921, respectively. These indicated that the model had high accuracy in modeling the vertical and horizontal shrinkage of soil. The above results also verify the effectiveness of the particle radius shrinkage coefficient in the model, and the microscopic changes in soil particles are basically consistent with the macroscopic deformation of soil during the shrinkage process. In summary, this shrinkage model could accurately simulate the soil shrinkage characteristics during drying.

3.2.2. Soil Cracking

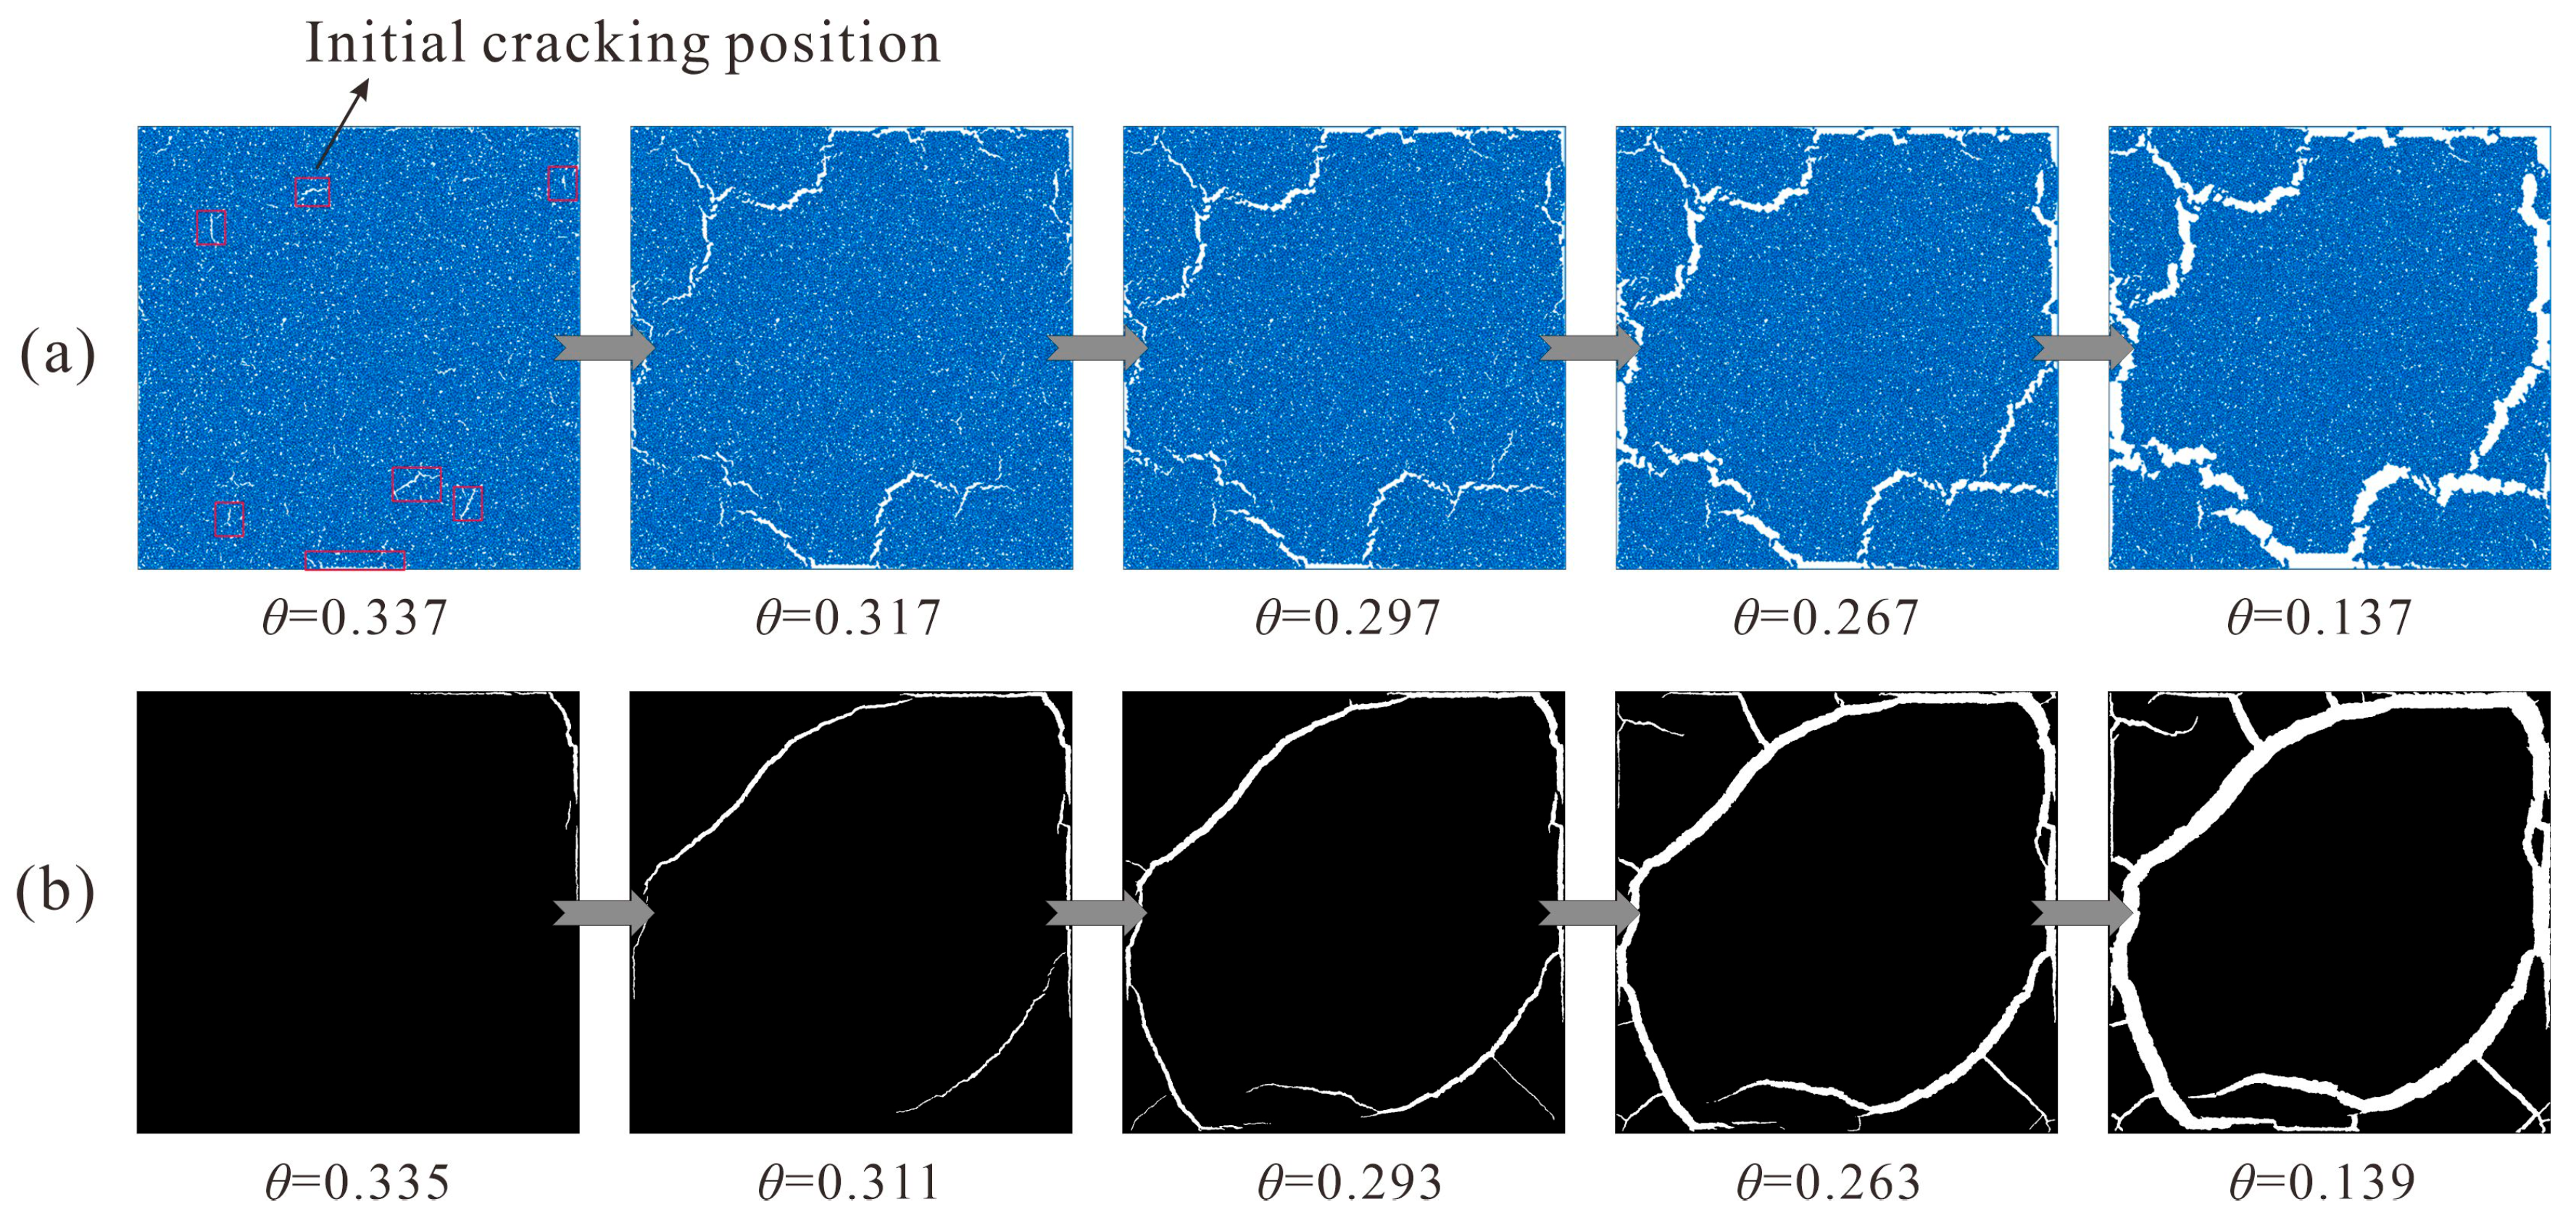
Figure 10 shows the comparison between the modeled and measured cracking processes. The cracking water content in the model was 0.337 g·g−1, which was relatively close to the measured cracking water content of 0.329 g·g−1. It could be observed that during the modeling process, cracks initially generated at the edge and middle areas of the sample. The initial cracking positions were more than that in the measured process, which was mainly because the degree of heterogeneity of the sample in the model was relatively low, although particles with different radii were generated to simulate soil heterogeneity, and the particle weight and contact strength both changed with the particle radius during the sample preparation. As the drying continued, the cracks developed rapidly in the length direction. When the soil water content decreased to 0.297 g·g−1, the skeleton of the crack network was basically stabilized. After that, cracks mainly developed in width, and some secondary cracks were generated, which was consistent with the measured process. It could also be found that the modeled cracks at the end of drying were relatively similar to the measured cracks in morphology.
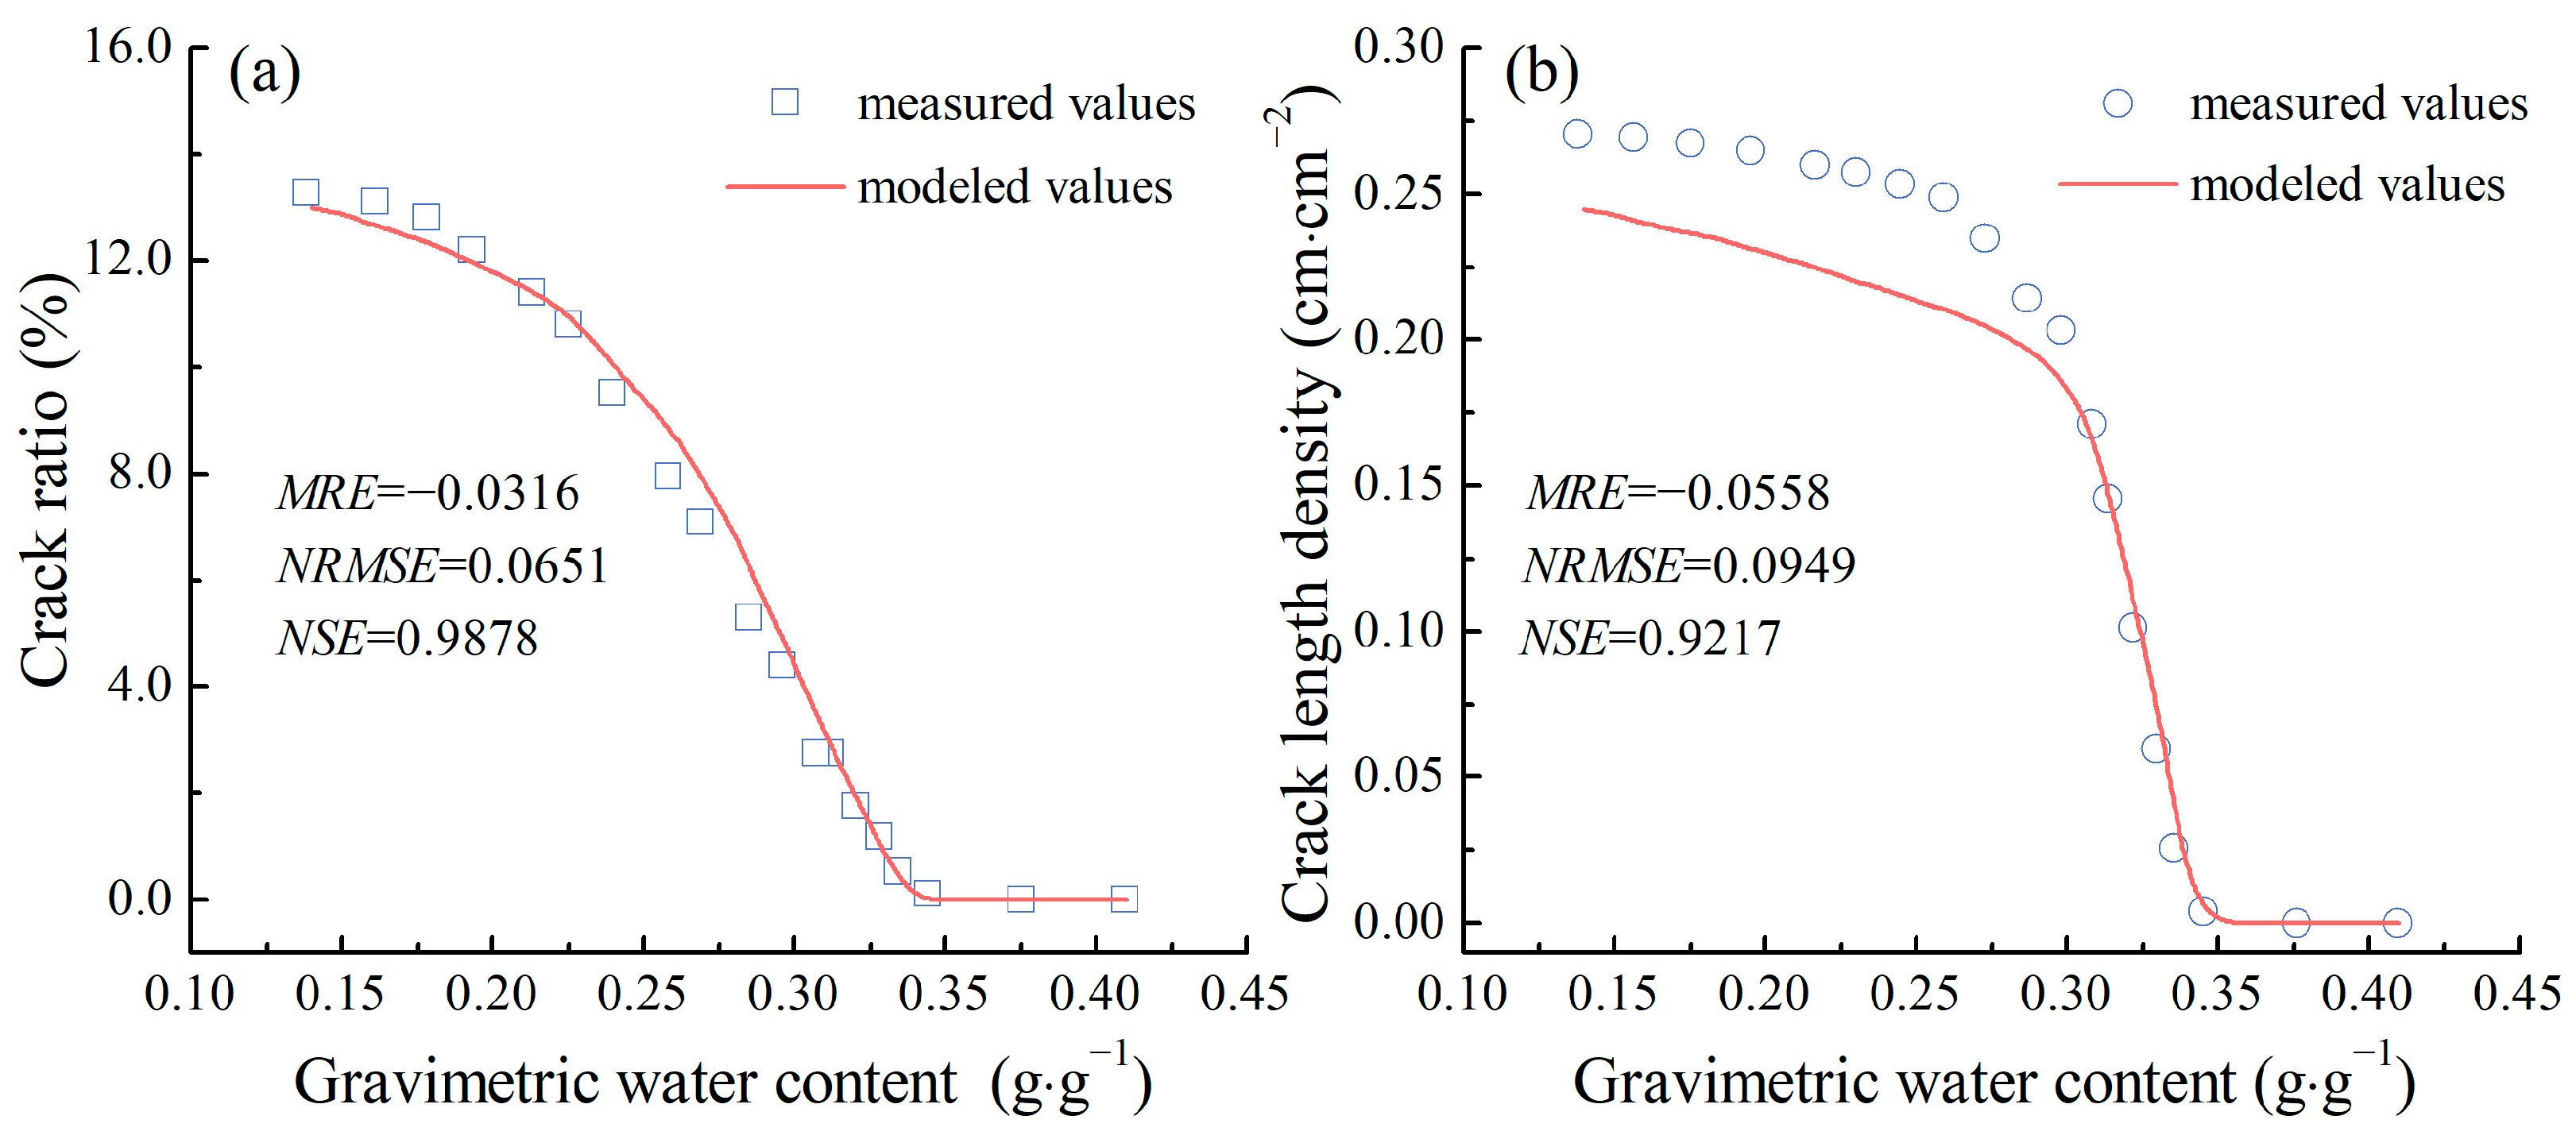
Figure 11 shows the comparison of crack ratio and length density between the modeled and measured processes. The modeled changes in crack ratio were relatively close to the measured values, both in terms of trend and magnitude. At the end of drying, the modeled crack ratio was 13.1%, while the measured result was 13.3%. By statistical analysis, the MRE was −0.0316, the NRMSE was 0.0651, and the NSE was 0.9878. The modeled crack length density was generally consistent with the measured values in terms of the changing trend. It increased rapidly after initial cracking and then slowed down when the water content was approximately 0.30 g·g−1. At the end of drying, the modeled crack length density was 0.245 cm·cm−2, and the measured value was 0.270 cm·cm−2. Statistical analysis showed that the MRE was −0.0558, the NRMSE was 0.0949, and the NSE was 0.9217. Overall, the cracking model had high accuracy in modeling the changes in crack ratio and crack length density. Thus, it could be considered that the model could effectively simulate the characteristics of crack development.

3.3. Discussion

3.3.1. Characteristics of Soil Shrinkage and Cracking

During the drying process, as the soil water gradually evaporates, a solid-liquid-gas meniscus forms in the soil, accompanied by the generation of capillary suction. This causes the development of suction stress between soil particles, creating a tensile force field within the soil and driving the soil particles to move closer to each other, which macroscopically manifests as soil shrinkage. Once the tensile force exceeds the tensile strength of soil particles in a certain area, the soil particles separate from the others, which macroscopically manifests as soil cracking.
Soil shrinkage included four stages: structural shrinkage, proportional shrinkage, residual shrinkage, and zero shrinkage [19]. The soil first entered the structural shrinkage stage, during which the water was mainly lost from large soil pores, and no capillary suction was generated. Thus, there was almost no horizontal shrinkage of the soil, and the equivalent diameter of the soil was in the stable state (Figure 5b). However, in the vertical direction, the soil subsided due to the effect of gravity, and the soil height entered a rapid decline stage (Figure 5a). During the proportional shrinkage stage, the influence of gravity on vertical shrinkage gradually weakened. Soil particles were pulled closer in both vertical and horizontal directions because of capillary suction, reducing the difference between the vertical and horizontal shrinkage. During the residual and zero shrinkage stages, the water was mainly lost from the pores within aggregates, and there was little difference between horizontal and vertical shrinkages. Thus, the shrinkage geometric factor generally reached a stable stage (Figure 5d).
The cracking experiment revealed that the soil evaporation process could be roughly divided into three stages, which was similar to the study of Jin et al. [48]. Cracks initially generated at the depressed area within the soil and the edge of the soil sample. This was because soil cracking generally first occurred in areas with lower tensile strength (soil defect areas) during drying; however, if the soil was relatively uniform without obvious defect areas, soil particles would move toward the sample center, making cracks occur at the edges of the sample. In addition, the crack ratio increased rapidly after cracking and then gradually stabilized, with most cracks forming during the stable evaporation stage, which was consistent with the results of Tang et al. [13].

3.3.2. Modeling of Soil Cracking

In this study, two-dimensional simplification was performed for the soil sample during the establishment of the discrete element model for cracking, and the final model results showed good performance, suggesting that the dimensional simplification was feasible. Since the sample thickness had a substantial effect on crack development [49], the rationality of dimensional simplification was closely related to the thickness of the soil sample. Previous studies have shown that a thicker sample would lead to fewer cracks and clods but a higher development degree (length and width) of individual cracks [1,38]. This phenomenon was essentially attributed to the different impacts of basal friction. For thin soil samples, the friction effectively restricted the movement of topsoil particles toward the shrinkage center [50] during drying, leading to more locations of cracking. More locations of cracking meant more crack numbers, which fully released the strain energy during drying and greatly reduced the length and width of individual cracks. In contrast, for thick soil samples, the effect of basal friction on the shrinkage movement of topsoil was obviously weakened. Once a crack was initiated, the development degree increased rapidly, and the strain energy was effectively released. Then, a few cracks could generate in adjacent areas. Consequently, the number of cracks and clods was reduced, but the length and width of individual cracks were increased. In our experiment, the soil thickness was 5 cm, and the number of cracks and clods at the end of drying was relatively small, demonstrating that the effect of basal friction was not large. This illustrated the rationality of simplifying the soil into a two-dimensional sample in the horizontal direction during the modeling in this study. In addition, this further suggested that when studying soil cracks in laboratory experiments, the sample thickness should be increased as much as possible so as to reduce the impact of basal friction and approximate field conditions.
The particle shrinkage coefficient in the discrete element model was calibrated based on the soil shrinkage characteristic curve. The modeled crack development process exhibited obvious phasic characteristics (Figure 11), which agreed well with the experimental observations. In addition, the crack morphology predicted by our model was very close to the experimental results, except that there were four or five initial cracking locations at the beginning of cracking, which were more than those in the experiment. It was because the tensile strength and shear strength were set uniformly in our model, which was different from the actual soil that contained some defect areas. Moreover, the values of tensile strength and shear strength in our model were derived by back-calculation based on the cracking water content, and this was bound to result in errors between the back-calculated values and actual values in the tensile strength and shear strength without considering defect areas. Therefore, to further improve the accuracy of the model in simulating the process of crack development, the characteristics of soil tensile strength, shear strength, and defect distribution should be explored in the future. In addition, the relationship between crack morphology, soil water conductivity, and preferential flow needs to be further investigated. This will help study the patterns of irrigation water movement based on modeled crack development, which could provide more practical guidance for water management in farmland.

4. Conclusions

Laboratory drying experiments were performed on agricultural soil specimens. The characteristics of soil shrinkage and cracking were monitored and analyzed using the digital image processing method. Based on the experimental results, discrete element models were constructed for the simulation of the process of soil shrinkage and cracking. The following conclusions arise from the present study:
(1) A significant difference was observed in the phasic characteristics between changes in soil height and equivalent diameter during shrinkage. The change in soil height consisted of two stages: rapid decline and residual decline stage, while the change in soil equivalent diameter contained three stages: stable, rapid decline, and residual decline stage. The VG-Peng model exhibited good performance in fitting the soil shrinkage characteristic curve, and the curve showed that the soil shrinkage included structural shrinkage, proportional shrinkage, residual shrinkage, and zero shrinkage stages. In the structural shrinkage, owing to gravity, the soil subsided immediately after the start of drying, and vertical shrinkage dominated soil deformation. Horizontal shrinkage gradually increased in the proportional shrinkage stage. During the residual shrinkage stage, vertical and horizontal shrinkage played almost equivalent roles in deformation.
(2) According to the changes in evaporation intensity, soil water evaporation could be divided into three stages: stable stage, declining stage, and residual stage. Cracks initially generated in the defect areas and edge areas of the soil, and the propagation mainly occurred in the stable evaporation stage. In the early stage of drying, the development of crack length played a major role in the cracking degree, while in the later stage, the increase in crack width became the dominant factor. At the end of drying, the contribution ratio of crack length and width to the crack area was approximately 30% and 70%, respectively. The box-counting fractal dimension of the crack network increased with the decreasing soil water content. The growth rate of the dimension slowed down, apparently, after the skeleton of the crack network was basically stabilized, and the final value was approximately 1.65, indicating that the crack network had significant self-similarity.
(3) The proposed discrete element models, in which the gradual shrinkage coefficient of particle radius was derived from the soil shrinkage characteristic curve, and two-dimensional simplification was applied to the model sample considering the relatively large soil thickness and small basal friction, could accurately simulate the process of soil shrinkage and cracking. The modeled changes in soil height and equivalent diameter with respect to water content during shrinkage were close to the measured results, with mean relative errors of −0.0019 and −0.0009, normalized root mean square errors of 0.0060 and 0.0033, and Nash–Sutcliffe efficiency coefficients of 0.9530 and 0.9921, respectively. The morphology of the modeled crack network was similar to the experimental observation. Meanwhile, the modeled changes in crack ratio and length density during cracking were highly consistent with those in the experiment. The mean relative errors were −0.0316 and −0.0558, the normalized root mean square errors were 0.0651 and 0.0949, and the Nash–Sutcliffe efficiency coefficients were 0.9878 and 0.9217, respectively.
Furthermore, only one type of soil was investigated in this study, and the experiments were carried out under laboratory conditions due to the limitations of time, equipment, and other factors. Future studies should be conducted across different soils and under field conditions to reveal the cracking characteristics of soil and verify the accuracy of the model.

Author Contributions

Conceptualization, W.Q. and C.W.; methodology, W.Q.; software, W.Z., Z.M., and C.W.; validation, W.Q., Y.H., and N.G.; formal analysis, W.Q.; investigation, C.W.; resources, W.Q.; data curation, W.Z. and Z.M.; writing—original draft preparation, W.Q.; writing—review and editing, Y.H. and C.W.; visualization, N.G.; supervision, W.Q.; project administration, W.Q.; funding acquisition, W.Q. All authors have read and agreed to the published version of the manuscript.

Funding

This research was funded by the National Natural Science Foundation of China (Grant No. 52409064), the Natural Science Foundation of Jiangsu Province (Grant No. BK20230126 and BK20240282), the Water Resources Science and Technology Project of Hunan Province (Grant No. Rs925001), and the Fundamental Research Funds for the Central Public Welfare Research Institutes (Grant No. Y924015, Y925016 and Y925017). We express our gratitude to the anonymous reviewers whose comments profoundly improved an earlier version of this manuscript.

Data Availability Statement

The original contributions presented in this study are included in the article. Further inquiries can be directed to the corresponding author.

Conflicts of Interest

The authors declare no conflicts of interest.

References

  1. Bu, F.; Liu, J.; Mei, H.; Song, Z.; Wang, Z.; Dai, C.; Qian, W. Cracking behavior of sisal fiber-reinforced clayey soil under wetting-drying cycles. Soil Tillage Res. 2023, 227, 105596. [Google Scholar] [CrossRef]
  2. Feng, H.; Xing, X.; Xing, J.; Du, J.; Li, D. Performance and modeling of infiltration flow in cracked saline soils. J. Hydrol. 2025, 656, 133054. [Google Scholar] [CrossRef]
  3. Novak, V.; Šimůnek, J.; Genuchten, M.T.V. Infiltration of water into soil with cracks. J. Irrig. Drain. Eng. 2000, 126, 41–47. [Google Scholar] [CrossRef]
  4. Yuliana, Y.; Apriyono, A.; Kamchoom, V.; Boldrin, D.; Cheng, Q.; Tang, C.-S. Seasonal dynamics of root growth and desiccation cracks and their effects on soil hydraulic conductivity. Eng. Geol. 2025, 349, 107973. [Google Scholar] [CrossRef]
  5. Zhang, Z.Y.; Chen, Y.; Kong, L.L.; Wang, C.; Li, W.J. Impacts of desiccation crack geometric characteristics on infiltration in soil. Trans. Chin. Soc. Agric. Mach. 2015, 46, 192–197. [Google Scholar]
  6. Qi, W.; Zhang, Z.Y.; Wang, C.; Chen, Y.; Zhang, Z.M. Crack closure and flow regimes in cracked clay loam subjected to different irrigation methods. Geoderma 2020, 358, 113978. [Google Scholar] [CrossRef]
  7. Hardie, M.A.; Cotching, W.E.; Doyle, R.B.; Holz, G.; Lisson, S.; Mattern, K. Effect of antecedent soil moisture on preferential flow in a texture-contrast soil. J. Hydrol. 2011, 398, 191–201. [Google Scholar] [CrossRef]
  8. Tuong, T.P.; Cabangon, R.J.; Wopereis, M.C.S. Quantifying flow processes during land soaking of cracked rice soils. Soil Sci. Soc. Am. J. 1996, 60, 872–879. [Google Scholar] [CrossRef]
  9. Jarvis, N.J. A review of non-equilibrium water flow and solute transport in soil macropores: Principles, controlling factors and consequences for water quality. Eur. J. Soil Sci. 2007, 58, 523–546. [Google Scholar] [CrossRef]
  10. Greve, A.; Andersen, M.S.; Acworth, R.I. Investigations of soil cracking and preferential flow in a weighing lysimeter filled with cracking clay soil. J. Hydrol. 2010, 393, 105–113. [Google Scholar] [CrossRef]
  11. Poulsen, T.G.; Cai, W.; Garg, A. Water evaporation from cracked soil under moist conditions as related to crack properties and near-surface wind speed. Eur. J. Soil Sci. 2020, 71, 627–640. [Google Scholar] [CrossRef]
  12. Xu, J.; Qin, Y.; Kakewati, A.L.; Liu, S.; Hallett, P.D.; Liu, G. Morphology-based mechanism of desiccation cracking in soil and montmorillonite. Soil Tillage Res. 2025, 249, 106474. [Google Scholar] [CrossRef]
  13. Tang, C.S.; Shi, B.; Liu, C.; Suo, W.B.; Gao, L. Experimental characterization of shrinkage and desiccation cracking in thin clay layer. Appl. Clay Sci. 2011, 52, 69–77. [Google Scholar] [CrossRef]
  14. Tang, C.S.; Zhu, C.; Cheng, Q.; Zeng, H.; Xu, J.-J.; Tian, B.G.; Shi, B. Desiccation cracking of soils: A review of investigation approaches, underlying mechanisms, and influencing factors. Earth-Sci. Rev. 2021, 216, 103586. [Google Scholar] [CrossRef]
  15. Grossman, R.; Brasher, B.; Franzmeier, D.; Walker, J.L. Linear extensibility as calculated from natural-clod bulk density measurements1. Soil Sci. Soc. Am. J. 1968, 32, 570–573. [Google Scholar] [CrossRef]
  16. Klopp, H.W.; Arriaga, F.J.; Likos, W.J.; Bleam, W.F. Atterberg limits and shrink/swell capacity of soil as indicators for sodium sensitivity within a gradient of soil exchangeable sodium percentage and salinity. Geoderma 2019, 353, 449–458. [Google Scholar] [CrossRef]
  17. Valle, S.R.; Dörner, J.; Zúñiga, F.; Dec, D. Seasonal dynamics of the physical quality of volcanic ash soils under different land uses in southern Chile. Soil Tillage Res. 2018, 182, 25–34. [Google Scholar] [CrossRef]
  18. Deng, C.; Teng, X.; Peng, X.; Zhang, B. Effects of simulated puddling intensity and pre-drying on shrinkage capacity of a paddy soil under long-term fertilization. Soil Tillage Res. 2014, 140, 135–143. [Google Scholar] [CrossRef]
  19. Peng, X.H.; Horn, R. Anisotropic shrinkage and swelling of some organic and inorganic soils. Eur. J. Soil Sci. 2007, 58, 98–107. [Google Scholar] [CrossRef]
  20. Chertkov, V.Y. An integrated approach to soil structure, shrinkage, and cracking in samples and layers. Geoderma 2012, 173–174, 258–273. [Google Scholar] [CrossRef]
  21. Groenevelt, P.H.; Grant, C.D. Re-evaluation of the structural properties of some British swelling soils. Eur. J. Soil Sci. 2001, 52, 469–477. [Google Scholar] [CrossRef]
  22. McGarry, D.; Malafant, K.W.J. The analysis of volume change in unconfined units of soil. Soil Sci. Soc. Am. J. 1987, 51, 290–297. [Google Scholar] [CrossRef]
  23. Braudeau, E.; Costantini, J.M.; Bellier, G.; Colleuille, H. New device and method for soil shrinkage curve measurement and characterization. Soil Sci. Soc. Am. J. 1999, 63, 525–535. [Google Scholar] [CrossRef]
  24. Xing, X.; Nie, W.; Chang, K.; Zhao, L.; Li, Y.; Ma, X. A numerical approach for modeling crack closure and infiltrated flow in cracked soils. Soil Tillage Res. 2023, 233, 105794. [Google Scholar] [CrossRef]
  25. Tang, C.S.; Cui, Y.J.; Shi, B.; Tang, A.M.; Liu, C. Desiccation and cracking behaviour of clay layer from slurry state under wetting–drying cycles. Geoderma 2011, 166, 111–118. [Google Scholar] [CrossRef]
  26. DeCarlo, K.F.; Shokri, N. Effects of substrate on cracking patterns and dynamics in desiccating clay layers. Water Resour. Res. 2014, 50, 3039–3051. [Google Scholar] [CrossRef]
  27. Wang, C.; Zhang, Z.; Liu, Y.; Fan, S. Geometric and fractal analysis of dynamic cracking patterns subjected to wetting-drying cycles. Soil Tillage Res. 2017, 170, 1–13. [Google Scholar] [CrossRef]
  28. Lachenbruch, A.H. Mechanics of Thermal Contraction Cracks and Ice-Wedge Polygons in Permafrost. Geol. Soc. Am. 1962, 70, 69–262. [Google Scholar]
  29. Goehring, L.; Conroy, R.; Akhter, A.; Clegg, W.J.; Routh, A.F. Evolution of mud-crack patterns during repeated drying cycles. Soft Matter 2010, 6, 3562–3567. [Google Scholar] [CrossRef]
  30. Hallett, P.D.; Newson, T.A. A simple fracture mechanics approach for assessing ductile crack growth in soil. Soil Sci. Soc. Am. J. 2001, 65, 1083–1088. [Google Scholar] [CrossRef]
  31. Bittencourt, T.N.; Wawrzynek, P.A.; Ingraffea, A.R.; Sousa, J.L. Quasi-automatic simulation of crack propagation for 2D LEFM problems. Eng. Fract. Mech. 1996, 55, 321–334. [Google Scholar] [CrossRef]
  32. Kodikara, J.; Barbour, S.L.; Fredlund, D.G. An idealized framework for the analysis of cohesive soils undergoing desiccation: Discussion. Can. Geotech. J. 1998, 35, 1112–1114. [Google Scholar] [CrossRef]
  33. Chertkov, V.Y. Physical modeling of the soil swelling curve vs. the shrinkage curve. Adv. Water Resour. 2012, 44, 66–84. [Google Scholar] [CrossRef]
  34. Stewart, R.D.; Rupp, D.E.; Abou Najm, M.R.; Selker, J.S. A unified model for soil shrinkage, subsidence, and cracking. Vadose Zone J. 2016, 15, 1–15. [Google Scholar] [CrossRef]
  35. Wang, C.; Zhang, Z.; Cao, D.; Chen, Y.; Qi, W.; Ma, L. Crack porosity estimation model based on VG-PENG shrinkage characteristic curve and soil shrinkage anisotropy. Trans. Chin. Soc. Agric. Eng. 2021, 37, 112–121. [Google Scholar]
  36. Lin, Z.Y.; Wang, Y.S.; Tang, C.S.; Cheng, Q.; Zeng, H.; Liu, C.; Shi, B. Discrete element modelling of desiccation cracking in thin clay layer under different basal boundary conditions. Comput. Geotech. 2021, 130, 103931. [Google Scholar] [CrossRef]
  37. Guo, Y.; Han, C.; Yu, X. Laboratory characterization and discrete element modeling of shrinkage and cracking in clay layer. Can. Geotech. J. 2018, 55, 680–688. [Google Scholar] [CrossRef]
  38. Yan, C.; Zheng, Y.; Ke, W.; Wang, G. A FDEM 3D moisture migration-fracture model for simulation of soil shrinkage and desiccation cracking. Comput. Geotech. 2021, 140, 104425. [Google Scholar] [CrossRef]
  39. Tran, K.M.; Bui, H.H.; Sánchez, M.; Kodikara, J. A DEM approach to study desiccation processes in slurry soils. Comput. Geotech. 2020, 120, 103448. [Google Scholar] [CrossRef]
  40. Peron, H.; Delenne, J.Y.; Laloui, L.; El Youssoufi, M.S. Discrete element modelling of drying shrinkage and cracking of soils. Comput. Geotech. 2009, 36, 61–69. [Google Scholar] [CrossRef]
  41. Qi, W.; Wang, C.; Zhang, Z.; Huang, M.; Xu, J. Experimental Investigation on the Impact of Drying–Wetting Cycles on the Shrink–Swell Behavior of Clay Loam in Farmland. Agriculture 2022, 12, 245. [Google Scholar] [CrossRef]
  42. Wang, C.; Zhang, Z.Y.; Qi, W.; Fan, S.M. Morphological approach to quantifying soil cracks: Application to dynamic crack patterns during wetting-drying cycles. Soil Sci. Soc. Am. J. 2018, 82, 751–771. [Google Scholar] [CrossRef]
  43. Otsu, N. A threshold selection method from gray-level histograms. IEEE Trans. Syst. Man Cybern.-Syst. 1979, 9, 62–66. [Google Scholar] [CrossRef]
  44. Peng, X.H.; Horn, R. Modeling soil shrinkage curve across a wide range of soil types. Soil Sci. Soc. Am. J. 2005, 69, 584–592. [Google Scholar] [CrossRef]
  45. Bronswijk, J.J.B. Shrinkage geometry of a heavy clay soil at various stress. Soil Sci. Soc. Am. J. 1990, 54, 1500–1502. [Google Scholar] [CrossRef]
  46. Qi, W.; Zhang, Z.Y.; Wang, C. Desiccation and cracking behaviour of clay loam subjected to different irrigation methods during wetting-drying cycles. Eur. J. Soil Sci. 2020, 72, 793–809. [Google Scholar] [CrossRef]
  47. Sima, J.; Jiang, M.; Zhou, C. Numerical simulation of desiccation cracking in a thin clay layer using 3D discrete element modeling. Comput. Geotech. 2014, 56, 168–180. [Google Scholar] [CrossRef]
  48. Jin, L.; Zhang, S.; Xu, Y. Fractal Dimension Characteristics of the Soil Cracking Process When Saline-Alkali Soil Is Mixed with Hippophae Roots. Fractal Fract. 2022, 6, 504. [Google Scholar] [CrossRef]
  49. Nahlawi, H.; Kodikara, J.K. Laboratory experiments on desiccation cracking of thin soil layers. Geotech. Geol. Eng. 2006, 24, 1641–1664. [Google Scholar] [CrossRef]
  50. Tang, C.S.; Cheng, Q.; Lin, L.; Tian, B.G.; Zeng, H.; Shi, B. Study on the dynamic mechanism of soil desiccation cracking by surface strain/displacement analysis. Comput. Geotech. 2022, 152, 104998. [Google Scholar] [CrossRef]
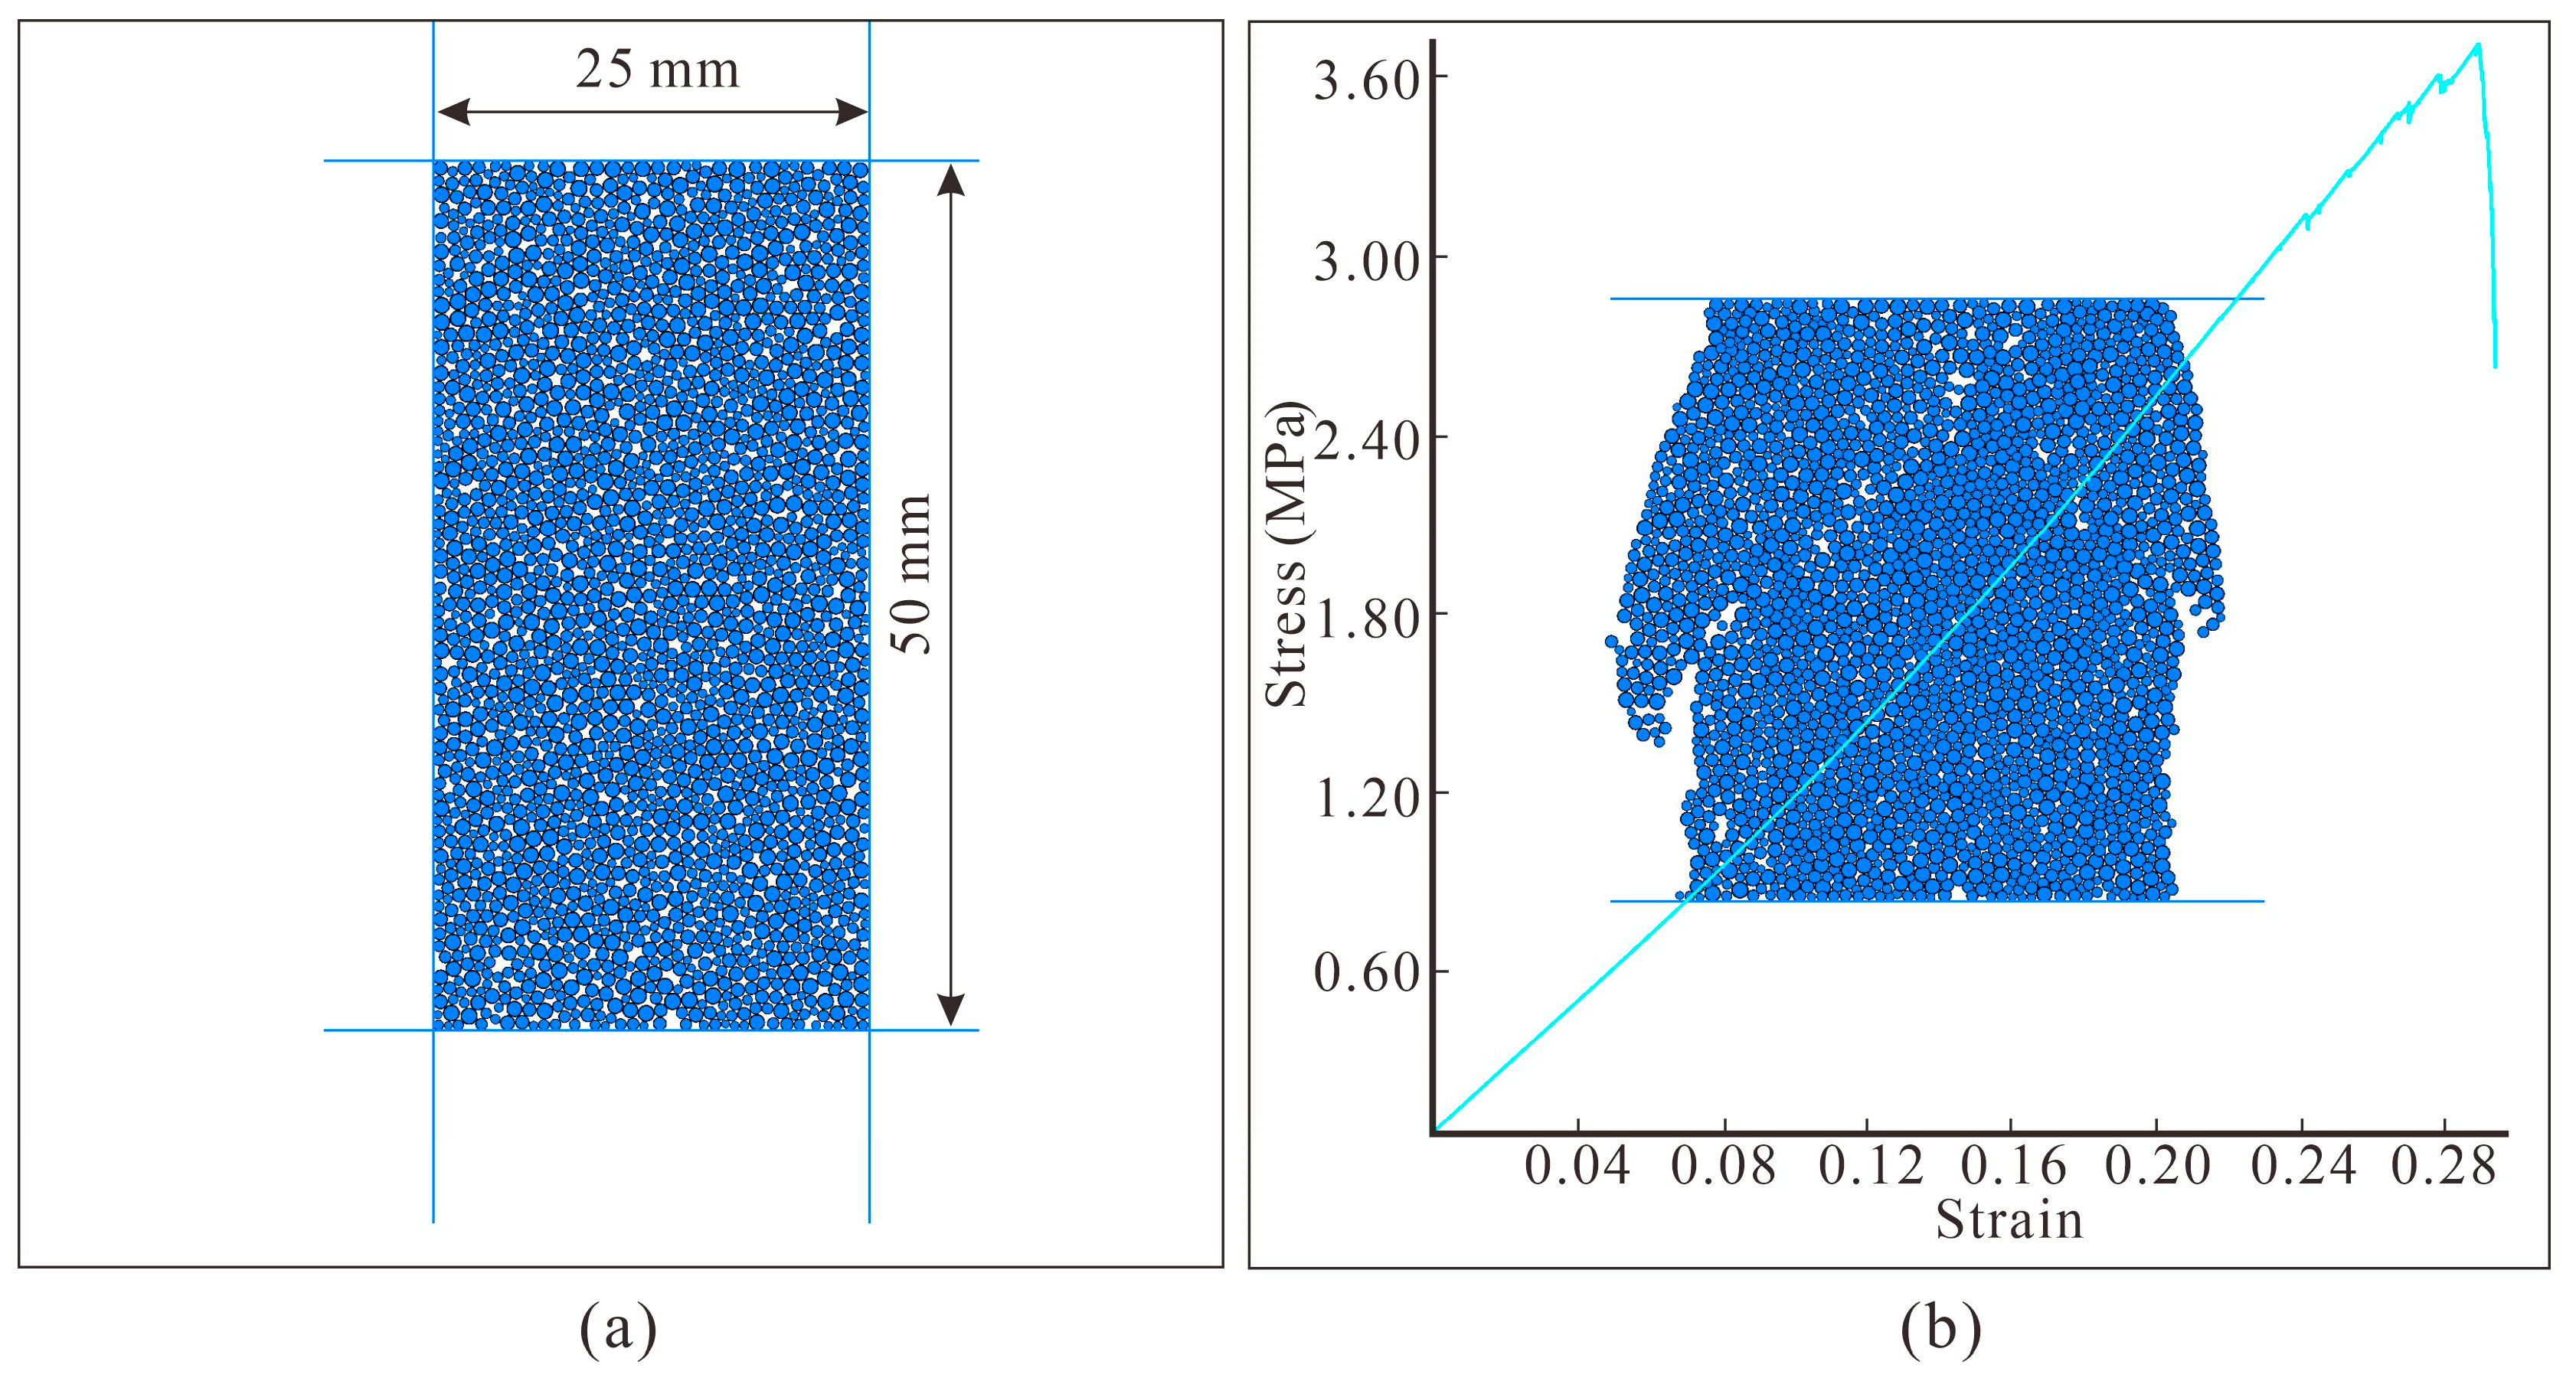
Figure 1. Initial sample (a) and broken sample (b) for the uniaxial compression test.
Agriculture 15 02122 g001
Figure 2. Relationship between macroscopic parameters and microscopic parameters (a) Elastic modulus and effective elastic modulus; (b) Poisson ratio and stiffness ratio.
Agriculture 15 02122 g002
Figure 3. Variation in gradual shrinkage coefficient of particle radius for soil shrinkage model. For brevity, only the first replicate was presented.
Agriculture 15 02122 g003
Figure 4. Variation in gradual shrinkage coefficient of particle radius for soil cracking model. For brevity, only the first replicate was presented.
Agriculture 15 02122 g004
Figure 5. Characteristics of soil shrinkage. (a) Soil height; (b) soil equivalent diameter; (c) soil shrinkage characteristic curve, scatters are measured values, and lines are fitted using Equation (2); (d) shrinkage geometry factor.
Agriculture 15 02122 g005
Figure 6. Process of soil crack generation and propagation.
Agriculture 15 02122 g006
Figure 7. Characteristics of soil cracking (a) Evaporation rate; (b) crack ratio; (c) contribution ratio of crack length and width; (d) box-counting fractal dimension.
Agriculture 15 02122 g007
Figure 8. Modeled soil shrinkage process.
Agriculture 15 02122 g008
Figure 9. Comparison between the modeled and observed shrinkage deformation (a) Soil height; (b) soil equivalent diameter.
Agriculture 15 02122 g009
Figure 10. Comparison between the modeled (a) and observed (b) cracking process.
Agriculture 15 02122 g010
Figure 11. Comparison between the modeled and observed variation in crack ratio (a) and crack length density (b) during cracking process.
Agriculture 15 02122 g011
Disclaimer/Publisher’s Note: The statements, opinions and data contained in all publications are solely those of the individual author(s) and contributor(s) and not of MDPI and/or the editor(s). MDPI and/or the editor(s) disclaim responsibility for any injury to people or property resulting from any ideas, methods, instructions or products referred to in the content.