Article

Design and Parameter Optimization of a Vertical Rotary Fixed-Angle Straw Cleaning Device

1
School of Mechanical Engineering, Changzhou Institute of Technology, Changzhou 213032, China
2
School of Automotive and Traffic Engineering, Jiangsu University, Zhenjiang 212013, China
3
School of Sciences, Changzhou Institute of Technology, Changzhou 213032, China
4
College of Engineering, Northeast Agricultural University, Harbin 150030, China
*
Authors to whom correspondence should be addressed.
Agriculture 2025, 15(20), 2113; https://doi.org/10.3390/agriculture15202113
Submission received: 14 September 2025 / Revised: 6 October 2025 / Accepted: 10 October 2025 / Published: 11 October 2025
(This article belongs to the Section Agricultural Technology)

Abstract

This study addresses the challenges encountered in mechanized agricultural fields, particularly the soil disruption associated with conventional horizontal rotary straw cleaning equipment. To mitigate the inefficiency of straw cleaning observed in the current vertical rotary apparatus, this study introduces a vertical rotary fixed-angle straw cleaning device. The essential conditions for establishing the cutter tooth angle were identified through theoretical analysis. Analyzing the kinematics of the cutter tooth to direct the movement of the straw, we determined that the deflection angle of the cutter tooth group (DA) is a critical parameter for enhancing the effectiveness of straw cleaning. A multiphase interaction model encompassing soil, straw, and machinery components was developed utilizing a coupled simulation approach with RecurDyn and EDEM software. The Box–Behnken response surface methodology was employed to systematically investigate the interaction effects of three critical parameters on both the straw cleaning rate and the soil disturbance rate: operation speed (OS), rotation speed of the straw cleaning rotary table (RS), and the DA. For optimization experiments where the OS is set to 2.4 m/s, RS is 400 r/min, and DA is 48°, the straw cleaning rate reaches 94.1% and the soil disturbance rate is 27.2%. This device can efficiently create a localized clean seeding belt for no-till planters without significantly damaging the soil structure, providing an innovative solution for the development of low-disturbance, high-efficiency conservation tillage equipment.

1. Introduction

In order to tackle the worldwide issues of soil degradation and promote sustainable agricultural development, conservation tillage practices, encompassing no-till, reduced tillage, and straw mulching, have emerged as a pivotal approach in sustainable agriculture [1,2]. This technique entails the application of crop residue as a protective layer over the soil surface, significantly mitigating the impacts of both wind and water erosion, enhancing the concentration of organic matter within the soil, and enhancing the soil’s moisture content and thermal properties [3,4]. While a substantial layer of surface straw offers protective benefits to the soil, it simultaneously presents considerable challenges for planting activities; this frequently results in mechanical obstructions and inadequate contact between the seeds and the soil [5]. As a critical element of the conservation tillage system, the operational performance of no-till seeders significantly influences the effective adoption and widespread implementation of this technology. In the process of no-till seeding, it is imperative to achieve optimal seed-to-soil contact and to ensure the proper functioning of the seeding machinery. This requires the localized and temporary clearing of a clean sowing strip on the seeding belt [6,7]. Accordingly, the straw cleaning apparatus must demonstrate the capacity to remove straw efficiently. Excessive tillage can negatively impact soil structure, thereby compromising the goals of conservation tillage [8]. Thus, achieving a balance between effective straw removal and the minimization of soil disturbance has become a critical challenge in the development of conservation tillage technologies [9].
Based on the mode of operation, devices designed for clearing straws can be primarily categorized into two types: passive and active. Passive devices, such as disc-type stubble cutters, rely on the forward motion of the machine to operate. They have a relatively simple structure and perform excellently when the amount of crop residue is moderate, making them the mainstream choice in many regions around the world [10,11]. However, when there is a large amount of straw residue and strong toughness, such devices are prone to issues like clogging. For instance, the residue cleaning disc developed by Kumar et al. has exhibited a residue removal rate between 70.52% and 75.94% in no-till corn stalk fields. However, the straw removal rate in the original paddy fields containing rice stalks is comparatively lower, ranging from 40.12% to 45.88% [12]. Conversely, the active straw cleaning apparatus operates through the application of supplementary power, exhibiting enhanced efficacy in the removal of residues. Aikins noted that the active device is capable of functioning efficiently without clogging in conditions where straw quantities reach up to 9000 kg per hectare [13]. Based on the rotational orientation of the cutter shaft, the active straw cleaning device can be categorized into two distinct types: horizontal rotation and vertical rotation. The cutter shaft of the horizontal rotary apparatus is oriented parallel to the ground, resulting in enhanced efficiency in stubble clearance. For instance, researchers Hou [14] and Yao [15] have both focused on attaining a high-definition straw rate; the designed horizontal rotary straw cleaning apparatus attains a straw cleaning rate exceeding 90%. However, this type of equipment tends to throw up and mix a large amount of soil during operation, which can cause serious clay-related problems, especially in wet, sticky soil conditions [16]. In relation to this matter, Liu et al. undertook optimization studies aimed at preventing adhesion on the cutter shaft [17]; this indirectly highlights the operational constraints of the horizontal rotary straw cleaning apparatus when utilized in environments characterized by wet and adhesive soil conditions. The vertical rotary straw cleaning device is characterized by a cutter shaft positioned orthogonally to the horizontal plane. The implementation of reciprocating soil cutting methods results in a significant reduction in soil disturbance. For example, Feng et al. designed a vertical rotary-type rotating cutter specifically for corn stubble, where the rate of soil disturbance was limited to 18.56% [18]. Nevertheless, the motion path of the device’s cutter teeth tends to redirect the straw onto the seeding belt that has already been cleared, and this leads to a generally low efficiency in the removal of straw. Wei et al. [19] explored the interaction mechanism of vertical rotary tillage operations on the effectiveness of rice straw removal. The optimized device achieved a straw removal rate of 81.95%, which is significantly lower than the performance of the horizontal rotary device [19].
To thoroughly explore the complex interactions between the straw cleaning device and the soil–straw system and achieve precise optimization, it is essential to rely on advanced research methods. Conventional field trials are constrained by substantial environmental variability, limited reproducibility, and extended durations required for completion. In this context, the integrated simulation approach combining the Discrete Element Method (DEM) and Multibody Dynamics (MBD) exhibits considerable benefits. DEM excels at simulating the mechanical properties of granular materials [20], while MBD focuses on the kinematic and dynamic analysis of complex mechanical systems [21]. The MBD-DEM approach, developed through the integration of both methods, is capable of precisely simulating field operational processes within a virtual setting. It has emerged as a significant instrument for the analysis of agricultural machinery mechanisms and the optimization of their parameters, with its efficacy extensively corroborated [22]. For instance, Mohammadi et al. employed the MBD-DEM to model the power consumption and soil mixing dynamics of a rotary tiller across different operational scenarios; the mean relative error for the estimated power consumption and the surface soil mixture were 6.65% and 9.32%, respectively [23]. Makange et al. employs the DEM to forecast the deformation of soil structure induced by the operational components, and the optimal regression coefficient obtained from the prediction results was R2 = 0.984 [24]. The aforementioned studies have comprehensively validated the feasibility and reliability of this approach in elucidating soil mechanics and kinematic behavior.
A systematic analysis of existing research results shows that current straw cleaning technologies have significant performance bottlenecks. Passive devices are prone to clogging when operating in environments with high residue straw. Horizontal rotary devices cause excessive soil disturbance and the thrown soil tends to stick. Traditional vertical rotary devices have lower efficiency due to the issue of the rotating path bringing the straw back. The above issue is particularly prominent in the rice–wheat rotation system in the East China region due to the special conditions of moist and heavy clay soils and high amount of straw residue. To tackle this issue, our research team engineered and constructed a vertical rotary fixed-angle straw cleaning device (VFD). This study aims to determine the principal structural parameters influencing the operational performance of straw cleaning devices through theoretical analysis. Furthermore, it aims to analyze and optimize critical structural components and operational parameters by implementing MBD-DEM simulation experiments. Optimization outcomes were subsequently validated through empirical testing. The findings of this research are intended to offer a theoretical foundation and technical guidance for mechanized no-till seeding operations characterized by minimal soil disturbances and a high straw-cleaning efficiency.

2. Materials and Methods

2.1. Structure and Principle of the VFD

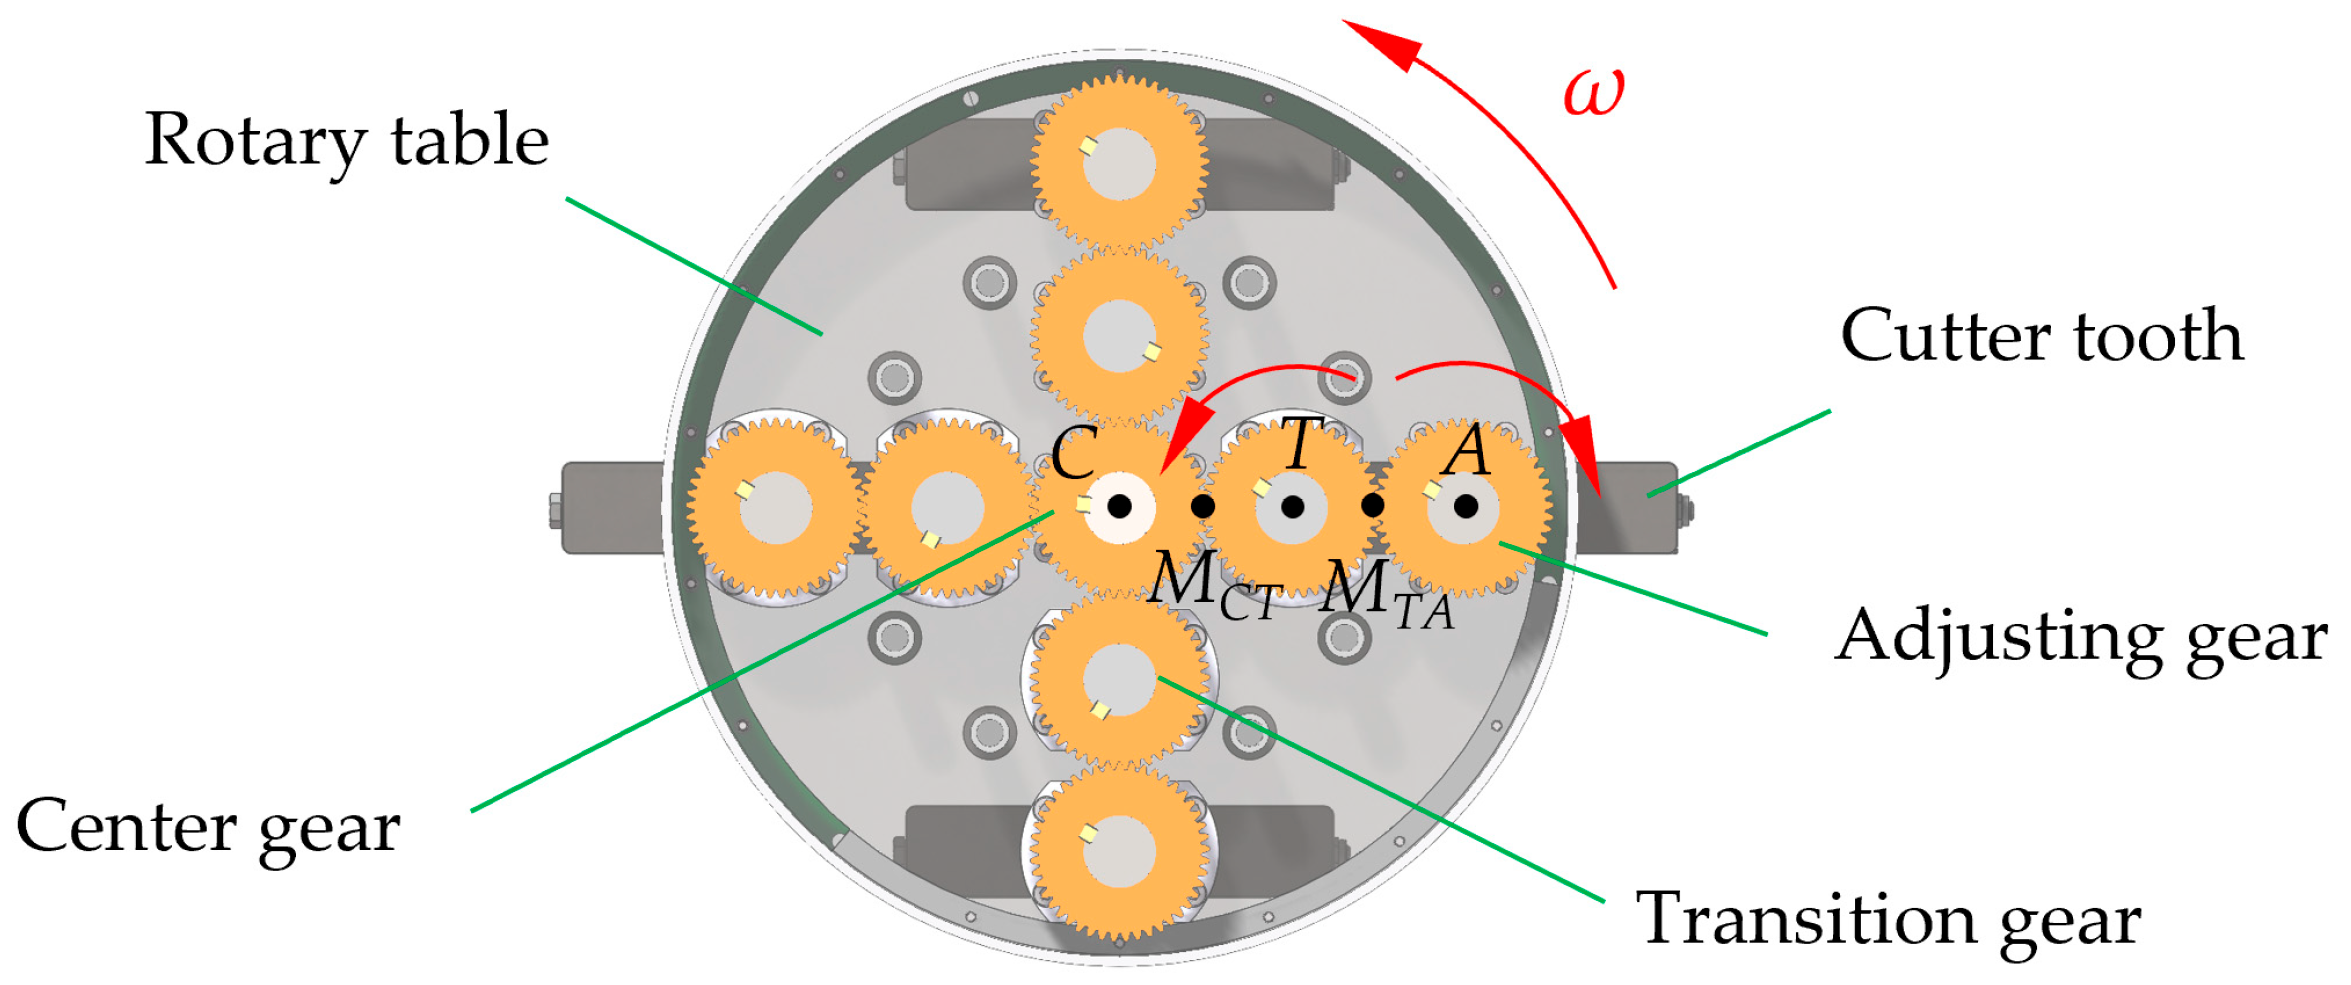
The VFD designed by the research team guarantees that the phase angle of the cutter teeth will remain constant during the rotation of the straw cleaning turntable. The primary structural components of the device are illustrated in Figure 1. The fixed-angle mechanism for the cutter teeth comprises a center gear, four transition gears, and four adjusting gears, which engage sequentially. The center gear is rigidly attached to the main body of the straw cleaning apparatus, while the adjusting gears are firmly connected to the cutter tooth assembly. Consequently, the phase angle of the cutter tooth assembly varies in correspondence with the motion of the adjusting gears.

2.2. Analysis of Gear Mechanisms

To achieve fixed angular positioning of the cutter tooth during operation, the gear mechanism was systematically modeled and analyzed. The straw cleaning rotary table is equipped with four sets of gears and cutter tooth groups, which are evenly spaced around its circumference and demonstrate consistent kinematic characteristics. Consequently, a single gear set was selected for detailed examination. As illustrated in Figure 2, the center gear is rigidly fixed, with its center designated as point C; the transition gear’s center is labeled point T; and the adjusting gear’s center is identified as point A. Both the transition and adjusting gears rotate about their own axes while simultaneously revolving around point C in conjunction with the straw cleaning turntable. The three gears have equal linear velocities at the two meshing points MCT and MTA. Taking the meshing point MCT as an example, its linear velocity on the central gear can be expressed as the product of the angular velocity of rotation ωC and the pitch circle radius RC; on the transition gear, it can be represented as the vector difference between the orbital linear velocity at point T and the rotational linear velocity at that point. Similarly, the linear velocity at the meshing point MTA on the transition gear can be expressed as the vector sum of the orbital linear velocity at point T and the rotational linear velocity at that point; on the adjusting gear, it can be represented as the vector difference between the orbital linear velocity at point T and the rotational linear velocity at that point. Therefore, the expressions for the gear rotational speeds are obtained as shown in Equation (1).
ω C · R C = ω C T · l C T ω T · R T = 0   ω CT · l CT   + ω T · R T = ω CA · l CA ω A · R A
Note that ωC denotes the angular velocity of the center gear’s rotation, rad/s; ωT represents the angular velocity of the idler gear’s rotation, rad/s; and ωA corresponds to the angular velocity of the adjusting gear’s rotation, rad/s. RC, RT, and RA signify the pitch circle radius of the center, transition, and adjusting gears in mm; ωCT and ωCA indicate the angular velocities of the transition and adjusting gears’ revolutions, rad/s; and lCT and lCA denote the revolution radius of the transition and adjusting gears in mm.
Given that the transition gear and the adjusting gear rotate synchronously with the rotary table, they exhibit identical angular velocities of rotation, denoted as ωCT = ωCA = ω. By incorporating this relationship into Equation (1), when the pitch circle radius of the center gear and the adjusting gear are equal, both gears possess the same angular velocity. Furthermore, since ωC equals zero, the phase angle of the cutter tooth assembly remains constant throughout the operation.

2.3. Analysis of Cutting Speed for Cutter Tooth

During operation, the straw cleaning rotary table transitions along the seedbed while simultaneously rotating about its own axis of rotation. Consequently, the cutter teeth exhibit a cycloidal trajectory [25]. By establishing a planar rectangular coordinate system in which the forward direction of the VFD aligns with the x-axis and the perpendicular direction aligns with the y-axis, the movement of the cutter tooth can be characterized by the equation provided in Equation (2).
x   = v · t   + R · cos w · t   y   = R · sin w · t
Note that (x, y) denote the coordinates of the cutter teeth position, mm; v represents the forward velocity of the VFD, m/s; t represents time, s; and R signifies the rotational radius of the cutter tooth in mm.
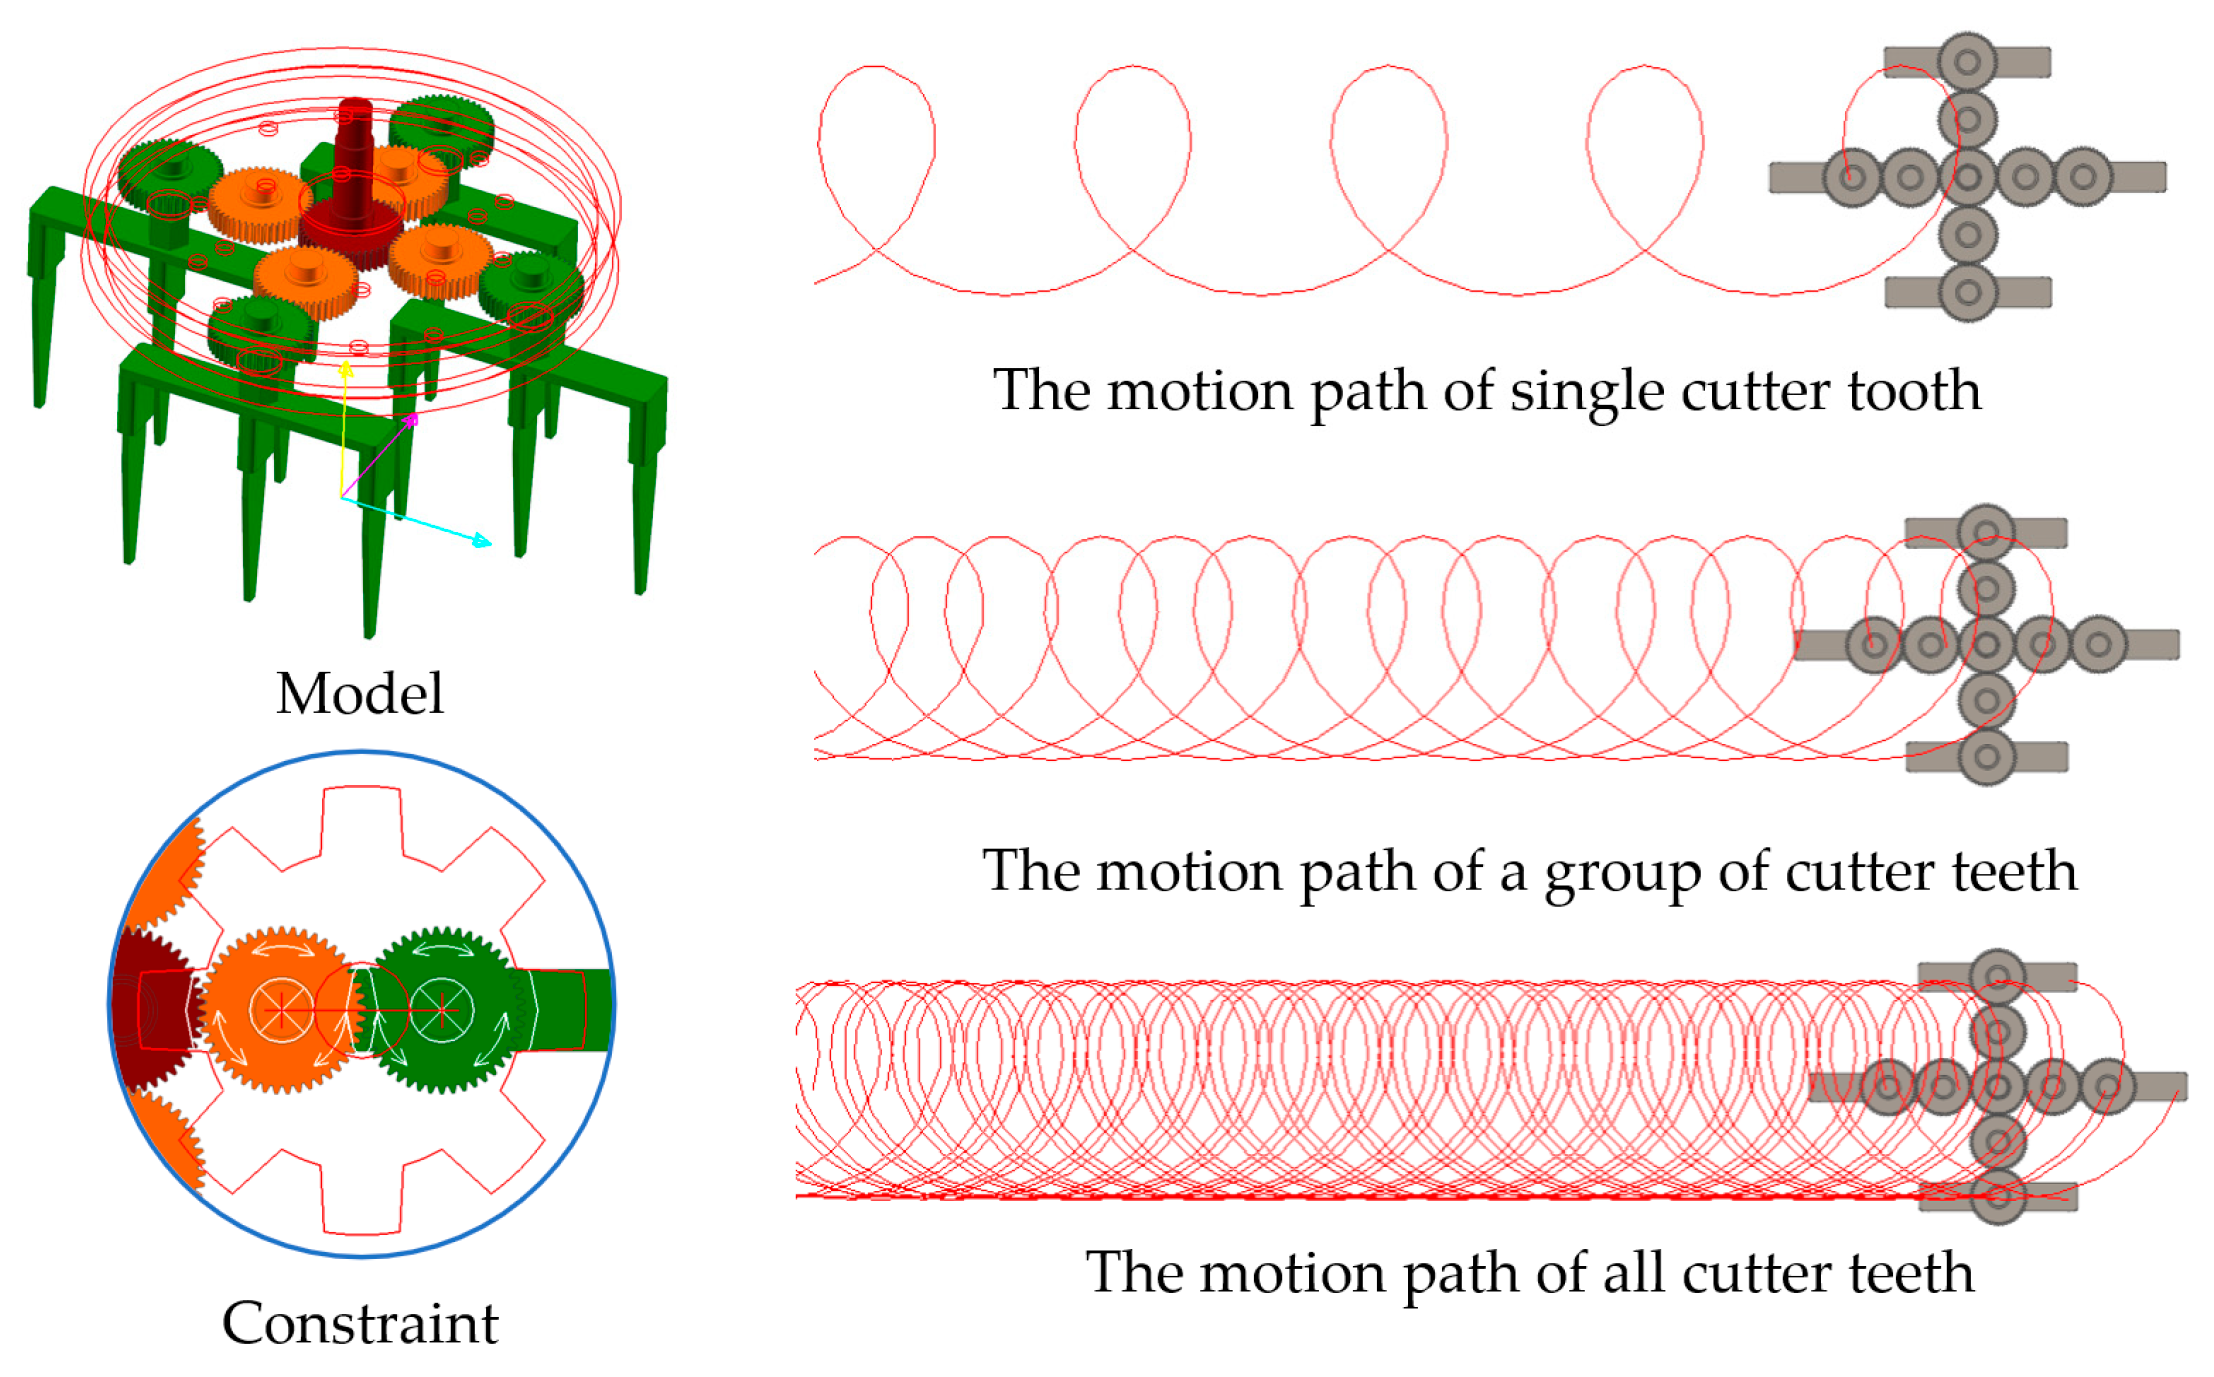
The cutter teeth clean the straw on the seeding belt according to the trochoid trajectory. The trochoid motion trajectory of a single cutter tooth is shown in Figure 3a. To investigate the effect of the deflection angle of the cutter tooth group (DA) on the removal of straw from the seeding belt, force analyses were conducted on the straw both during its movement and at the nodes where the straw is removed, as shown in Figure 3b,c. The straw is mainly subjected to the friction force Ff from the cutter teeth and the support force FN. The object providing the support force FN varies at different stages. Specifically, when the cutter teeth drive the straw to move toward the side of the seeding belt, FN is mainly provided by the cutter teeth. When the straw reaches the maximum y-value and the cutter teeth begins to move in the negative y-direction, away from the straw, FN is mainly provided by the already cleared straw. During the movement of the straw influenced by the cutter teeth, the resultant force FA acting on the straw, arising from the combined effects of Ff and FN, is directed toward posterolateral of the VFD under both conditions of DA = 0 and DA ≠ 0. This orientation facilitates the effective removal of the straw from the seeding belt. When the straw is about to be cleared from the seeding belt, under the DA = 0 condition, Ff points in the negative x-axis direction. Under the action of the normal force FN, the resultant force FA on the straw also points in the negative x-axis direction, which may cause the cleared straw to return to the seeding belt, resulting in a decrease in the straw cleaning rate. Under the DA ≠ 0 condition, DA alters the direction of the friction force Ff exerted by the cutter teeth on the straw, thereby adjusting the movement trend of the straw. Additionally, the DA (α) contributes to an increase in the width D of the straw cleaning zone, evidenced by Equation (3). The interplay of these factors collectively influences the overall performance of the VFD.
D   = 2 l C A + d · sin α
Note that d represents the length of the cutter tooth group in mm.
To prevent the straw from being redirected by the cutter teeth onto the clean seeding belt, the boundary condition at position necessitates that the straw exhibits no inclination to move toward the seeding belt. Analysis indicates that the parameters influencing this critical adjustment primarily include the operation speed (OS), the rotation speed of the straw cleaning rotary table (RS), the rotation radius of the cutter teeth, and the DA. The designed VFD is specifically intended for use during the rice stubble wheat sowing season within the rice wheat rotation regions of East China. Accordingly, to facilitate the sowing of subsequent wheat crops, the rotation radius of the cutter teeth is set at 180 mm. As a result, the principal structural and operational parameters influencing the performance of the VFD are identified as the OS, RS, and DA.

2.4. Coupled Simulation Analysis of EDEM and RecurDyn

To precisely replicate the operating conditions of the VFD, a coupled analysis was performed utilizing both the discrete element method simulation software EDEM 2020 and the multibody system dynamics simulation software RecurDyn V9R4. This approach aimed to examine the effects of multiple parameters on the device’s operational performance and optimize these parameter values [26,27].

2.4.1. Construction of the RecurDyn Simulation Platform

During the operation of the VFD, the cutter teeth follow a cycloidal trajectory to effectively sever the soil and straw. The overall efficiency of the straw cleaning process is determined by the combined trajectories of multiple cutter teeth. Therefore, the trajectories of the cutter teeth were initially analyzed using RecurDyn software. Prior to this analysis, the simulation model of the VFD was simplified in SolidWorks 2018 by removing non-essential components, such as bolts and keys. The resulting simplified model was then imported into RecurDyn, where appropriate constraints—including revolute pairs, translate pairs, and gear pairs—were applied, along with the integration of rotational and translational power sources. Theoretical analysis indicates that the trajectory of the cutter teeth is determined by the combined effects of the OS and RS. Based on the previous studies, it is recommended that the OS is set at 2.0 m/s, with the RS maintained at 300 r/min. Figure 4 depicts the cutter trajectories for a single tooth, a group of teeth, and all teeth when α is zero.
To examine the influence of the DA on the motion trajectory, simulations were performed with α values of 0°, 30°, and 60°. The corresponding results are presented in Figure 5. The analysis demonstrates that the working width D exhibits a substantial increase as parameter α rises, corroborating prior theoretical derivations. With a constant number of cutter teeth, the average area covered by each individual tooth correspondingly increases, leading to a reduction in the density of the cutting path distribution. Notably, at the lateral edges of the straw cleaning zone, the inadequate coverage by a single tooth leads to a localized decrease in straw cleaning efficiency.

2.4.2. Construction of the EDEM Simulation Platform

A simulation model representing soil and straw was developed utilizing the EDEM software. Considering the generally moist and adhesive properties of soil, the Hertz–Mindlin and JKR contact models were utilized to represent the interactions between soil particles [28]. For the construction of the straw segment, the Hertz–Mindlin model with bonding was selected. The global variable parameters within the simulation were primarily influenced by factors including soil type and moisture content. This investigation adopted calibration outcomes from prior studies, with the finalized simulation parameter configurations presented in Table 1.
A simulation model representing soil and straw was developed utilizing the EDEM pre-processing module. Soil particles were modeled as spherical entities with a radius of 5 mm [29]. These particles were generated randomly through the particle factory and, following natural settling, were compacted appropriately to achieve a level soil surface [31]. The degree of compaction is calibrated by the insertion resistance of a probe in the soil model. Specifically, during the suitable sowing period, a rectangular soil sample measuring 50 cm × 50 cm × 20 cm was excavated. Then, using a mechanical testing platform, the insertion resistance was measured with a 10 mm probe. The resistance value when the probe was inserted 5 cm is approximately 61 N. This value is used as the basis to determine the appropriate compaction level for the EDEM soil model. Considering the overall dimensions of the VFD, the final soil model within EDEM was constructed with dimensions of 2000 mm in length, 1000 mm in width, and 150 mm in height. Upon the completion of the soil model construction, straw simulation models were randomly distributed across the soil surface. The straw model performs empirical measurements of field straw by utilizing data and methodologies derived from the established literature [31]. Specifically, a 1 × 1 m2 section of the original straw stubble field was randomly selected for rice straw collection, and was subsequently categorized by length into four groups: 0–5 cm, 5–10 cm, 10–15 cm, and greater than 15 cm. For each category, measurements of length, diameter, and total mass were recorded, with the results presented in Table 2.
Based on the actual measurement results of straw, multiple spherical particles were bonded together to construct a simulation model of rice straw, which was evenly spread over the seeding belt surface at a coverage of 1.77 kg/m2 according to the actual test value. Finally, the VFD model was imported into the geometry module of EDEM through the External SPI module of RecurDyn. The final coupled simulation model and simulation process are shown in Figure 6 [32,33].

2.4.3. Experimental Design Plan

Theoretical analysis reveals that the tooth cutter trajectory is concurrently affected by both the OS and the RS, leading to notable interaction effects among the experimental variables. To enhance the experimental process, rigorous and systematic design methodologies were implemented. Based on the results of the theoretical analysis, the chosen experimental factors comprised the OS, the RS, and the DA. The experimental framework was developed utilizing the Box–Behnken design approach [34,35]. The OS of the VFD was limited to a range of 1.5 to 2.5 m/s, which aligns with the specifications of wheat seeders, whereas the RS was determined based on previous studies, with an operational range set between 200 and 400 r/min. From theoretical analysis and trajectory simulation results using RecurDyn, it is evident that the DA can improve the force direction on the straw, reduce the tendency of cleared straw to return to the seeding belt zone, and simultaneously increase the effective width of straw clearing. However, an excessively large DA will lead to a decrease in the operational coverage of individual cutter teeth. To further determine the range of DA, preliminary simulations were conducted at 10° intervals within the range of 0° to 90°. Initial simulation results indicate that 30° is the performance inflection point for maintaining effective straw clearing capability of this device. Given the potential interactions between DA, OS, and RS, the final formal test range was set from 0° to 60° to ensure all possible optimization intervals could be captured. The final determination of the experimental factor coding is presented in Table 3.
To thoroughly assess the operational performance and efficiency of the VFD, two primary metrics were employed: the straw cleaning rate and the soil disturbance rate. The straw cleaning rate is the percentage of the mass of straw cleared from the target area after operation relative to the original mass of straw, representing the device’s overall straw removal efficiency [36]. Similarly, the soil disturbance rate is the percentage of soil loss in the target area after operation relative to the original soil quantity, reflecting the degree of soil structure damage [37]. The width of the target area was dynamically adjusted in accordance with the actual straw cleaning width, which corresponds to the DA. Additionally, the soil sampling depth was set at 10 cm, based on prior studies [19,37]. The definitive calculation formula for these evaluation metrics is provided in Equation (4). The experimental design and corresponding results are detailed in Table 4.
Y 1 = m 0 m r m 0 Y 2 = N 0 N s N 0
Note that Y1 denotes the straw cleaning rate, %; Y2 represents the soil disturbance rate, %; m0 corresponds to the initial mass of straw within the target area in kg; mr signifies the mass of residual straw that remains in the target area following the operation, kg; N0 indicates the original quantity of soil in the target area; and NS refers to the quantity of soil remaining in the target area after the operation.

3. Results and Discussion

3.1. The Impact Patterns for Straw Cleaning Rate

3.1.1. Variance Analysis and Regression Model on Straw Cleaning Rate

An analysis of variance was conducted on the experimental data utilizing Design Expert 8.0.6 software. The results pertaining to the equation analysis of factors influencing the straw cleaning rate are presented in Table 5. The factors were ranked in terms of their impact on the straw cleaning rate as follows: n, v, α2, α, the interaction term v-n, the interaction term n-α, n2, v2, and the interaction term v-α. Notably, the variables n and v exhibited a highly significant effect on the straw cleaning rate (p < 0.01). The squared term α2 demonstrated a significant effect (0.01 < p < 0.05), while α and the interaction term v-n showed a moderately significant effect (0.05 < p < 0.1). Conversely, the interaction term n-α, along with n2, v2, and the interaction term v-α, did not exert a statistically significant influence on the measured experimental outcomes (p > 0.1). The analysis of variance revealed that the lack-of-fit term for the regression model is not statistically significant (p = 0.1706), suggesting a meaningful quadratic relationship between the experimental factors and the response variable. Consequently, by excluding the non-significant factors, the resulting regression equation is presented in Equation (5).
Y 1 = 111.68 12.05 v 0.03 n + 0.07 α + 0.03 v n 1.83 × 10 3 α 2

3.1.2. The Impact of Individual Factors on the Straw Cleaning Rate

Figure 7 illustrates the influence of individual factors on the straw cleaning rate derived from the established regression model. The data indicate that the straw cleaning rate declines with an increase in OS, whereas it markedly improves with higher cutter-shaft speeds. This phenomenon can be explained by the fact that the OS determines the total mass of straw that must be processed within a set time frame, whereas the RS establishes the device’s maximum cleaning capacity.
It is noteworthy that the effect of DA on the straw cleaning rate exhibits a nonlinear trend of first increasing and then decreasing. This phenomenon is mainly caused by the combined influence of the following two factors: (1) Theoretical analysis and Figure 3 indicate that a moderate DA can effectively suppress the tendency of straw being carried back into the cleared area by the cutter teeth. This effect is achieved through the optimization of the critical stress orientation within the straw. (2) As shown in Figure 8, trajectory simulation results based on RecurDyn demonstrate that as DA increases, the cutting width of the cutter teeth correspondingly increases. Within the positive effect range, DA helps reduce the gaps between cutter tooth trajectories, especially on both sides of the straw clearing zone, thereby enhancing the straw clearing capability. However, when DA exceeds a certain threshold and enters the negative effect range, an excessively large DA actually increases the cutting gaps, leading to a decrease in the density of effective cutting trajectories, an increase in the rate of missed straw clearing, and ultimately weakening the overall straw clearing performance.

3.1.3. The Impact of Interaction Factors on the Straw Cleaning Rate

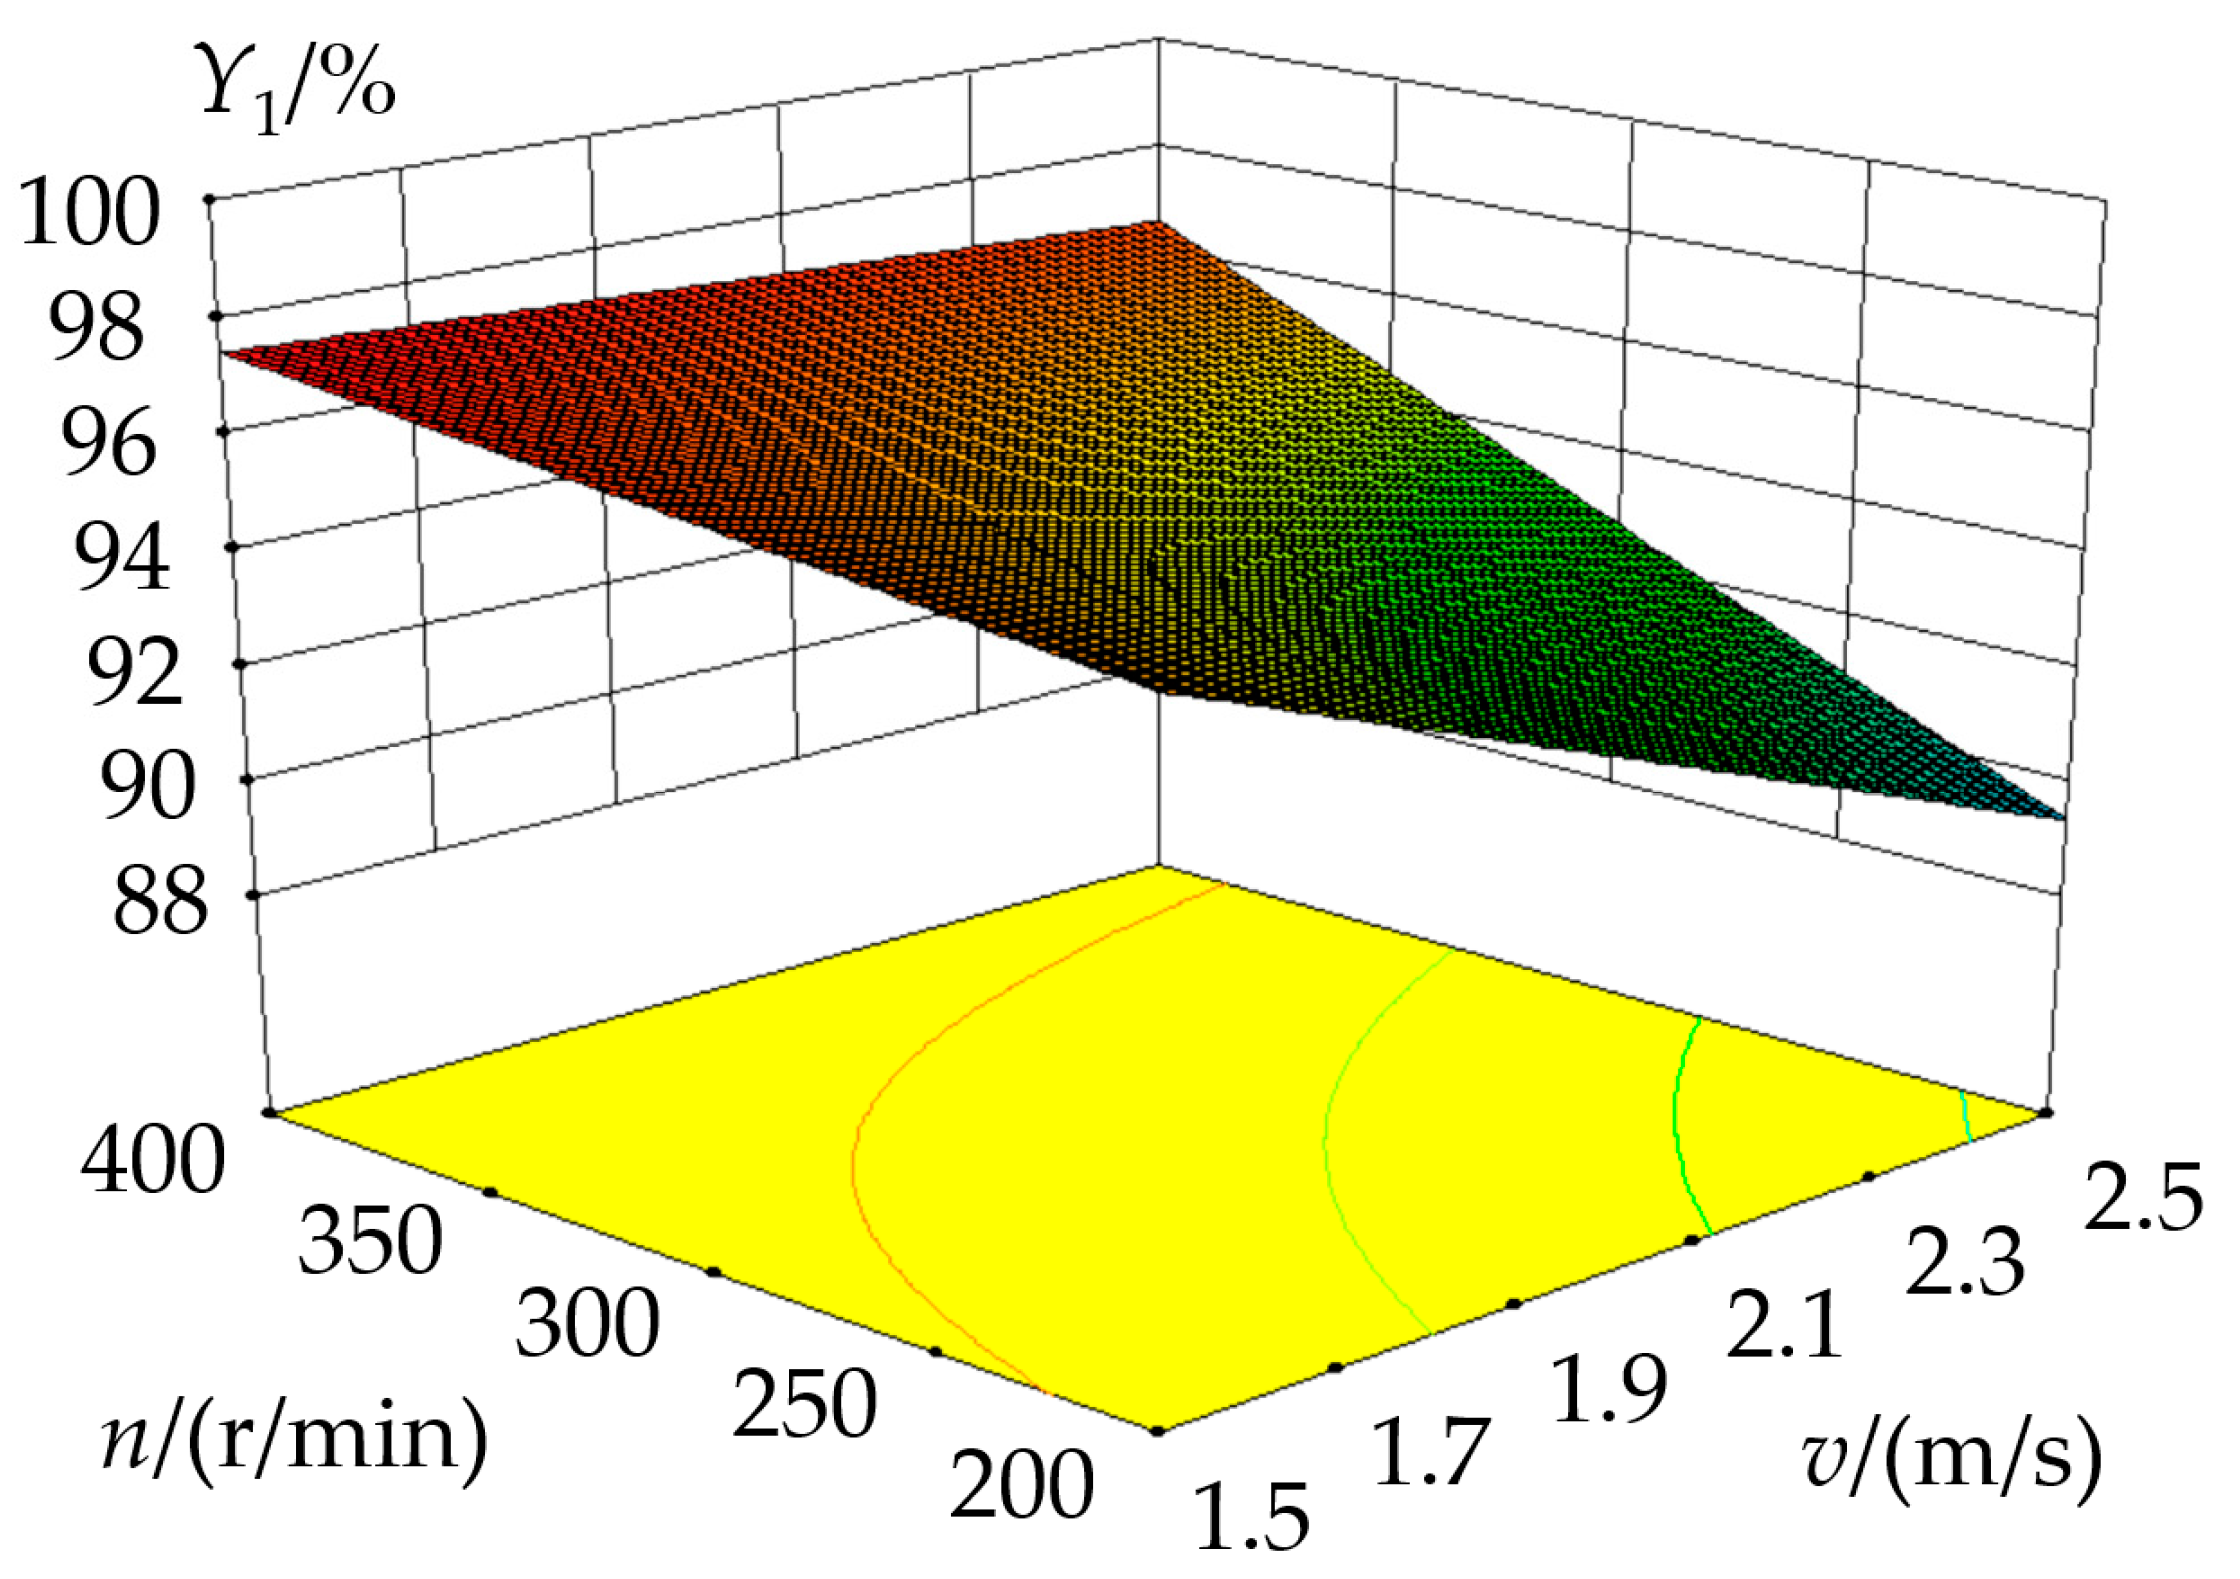
Given that the interaction terms v-α and v-n do not exhibit statistically significant effects on the straw cleaning rate (p > 0.1), we examined the response mechanism associated with the v-n interaction, as illustrated in Figure 9. The core principle can be summarized as follows: Within the high-RS range, the straw cleaning rate demonstrates considerable stability in response to variations in OS, indicating a performance saturation effect. Specifically, at an RS of 400 r/min, when the OS ranges between 1.5 and 2.5 m/s, the variation in straw cleaning rate is minimal, with a fluctuation amplitude of only 0.9%. Conversely, at a lower RS of 200 r/min, the straw cleaning rate declines markedly as OS increases, exhibiting a 6.4% reduction when the OS increases from 1.5 m/s to 2.5 m/s. However, this adverse impact lessens with increasing RS; at 300 r/min, the decrease in cleaning rate narrows to 3.6%. Furthermore, within the 1.5 to 2.5 m/s OS range, the straw cleaning rate consistently improves with increasing RS, and the magnitude of this improvement intensifies as OS increases, rising from a 1.7% increase at 1.5 m/s to a 7.2% increase at 2.5 m/s. The mechanism behind this saturation effect is that under low-RS conditions, the device’s straw cleaning capacity is lower than the straw feed rate caused by higher OSs, leading to a decline in cleaning rate as OS increases, whereas at high RSs, the device’s straw cleaning capacity is sufficient to absorb OS disturbances, making the cleaning rate insensitive to OS changes. However, this high-performance saturation state comes at the cost of higher energy consumption. Increases in RS and OS mean that the cutter shaft must overcome greater soil shear resistance and impart higher kinetic energy to soil particles, ultimately causing a significant rise in power consumption. For example, research by Mohammadi et al. shows that a 27.8% increase in cutter shaft RS results in a 78.7% increase in system power consumption [23]. Therefore, in practical applications, a balance must be struck between the saturation of straw cleaning rate and operational energy consumption; it is not advisable to continuously increase the RS in pursuit of absolute performance stability.

3.2. The Impact of Patterns on the Soil Disturbance Rate

3.2.1. Variance Analysis and Regression Model for Soil Disturbance Rate

Table 6 presents the results of the variance analysis examining the factors influencing the soil disturbance rate. The factors are ranked based on their impact on the soil disturbance rate as follows: n, α, v, the interaction term v-n, n2, v2, the interaction term n-α, the interaction term v-α, and α2. Among these, the three individual factors n, α, and v exhibit a significant effect on the soil disturbance rate (p < 0.01). The interaction term v-n and the quadratic term n2 demonstrate a moderately significant effect (0.05 < p < 0.1), whereas v2, the interaction terms n-α and v-α, and α2 do not show significant effects on the experimental indicators (p > 0.1). Analysis of variance reveals that the lack-of-fit term for the regression model is not significant (p = 0.257 1), suggesting a robust quadratic relationship between the experimental factors and the response variables. Following the exclusion of non-significant factors, the resulting regression equation is presented in Equation (6).
Y 2 = 35.13 11.05 v + 0.04 n 0.06 α + 0.03 v n 1.10 × 10 4 n 2

3.2.2. The Impact of Individual Factors on Soil Disturbance Rates

Figure 10 presents the single-factor influence analysis derived from the regression equation. The findings reveal that the soil disturbance rate declines in an approximately linear manner as both the OS and the DA increase. Conversely, the soil disturbance rate demonstrates a nonlinear pattern with respect to RS, initially rising before reaching a plateau. This behavior can be attributed to the fundamental mechanism whereby soil disturbance primarily results from the cutting action of the teeth on the soil. Specifically, as the OS increases, the contact duration between the teeth and the soil per unit area decreases linearly, thereby diminishing the extent of plastic deformation within the soil. Regarding the initial increase in RS, this increases the impact of the cutter tooth’s kinetic energy on the soil. Nevertheless, owing to the soil’s rheological stress characteristics, the rate of disturbance stabilizes at a higher RS. The reduction in the soil disturbance rate attributed to the DA primarily operates through two mechanisms: firstly, an increase in DA substantially broadens the straw cleaning width (with α = 60° showing a 57.7% increase relative to 0°), thereby expanding the soil disturbance measurement area and consequently diluting the disturbance intensity per unit area; secondly, augmenting DA increases the spacing between cutting trajectories, which decreases the frequency of cuts per unit area and directly diminishes the overall soil disturbance intensity.

3.2.3. The Impact of Interaction Factors on the Soil Disturbance Rate

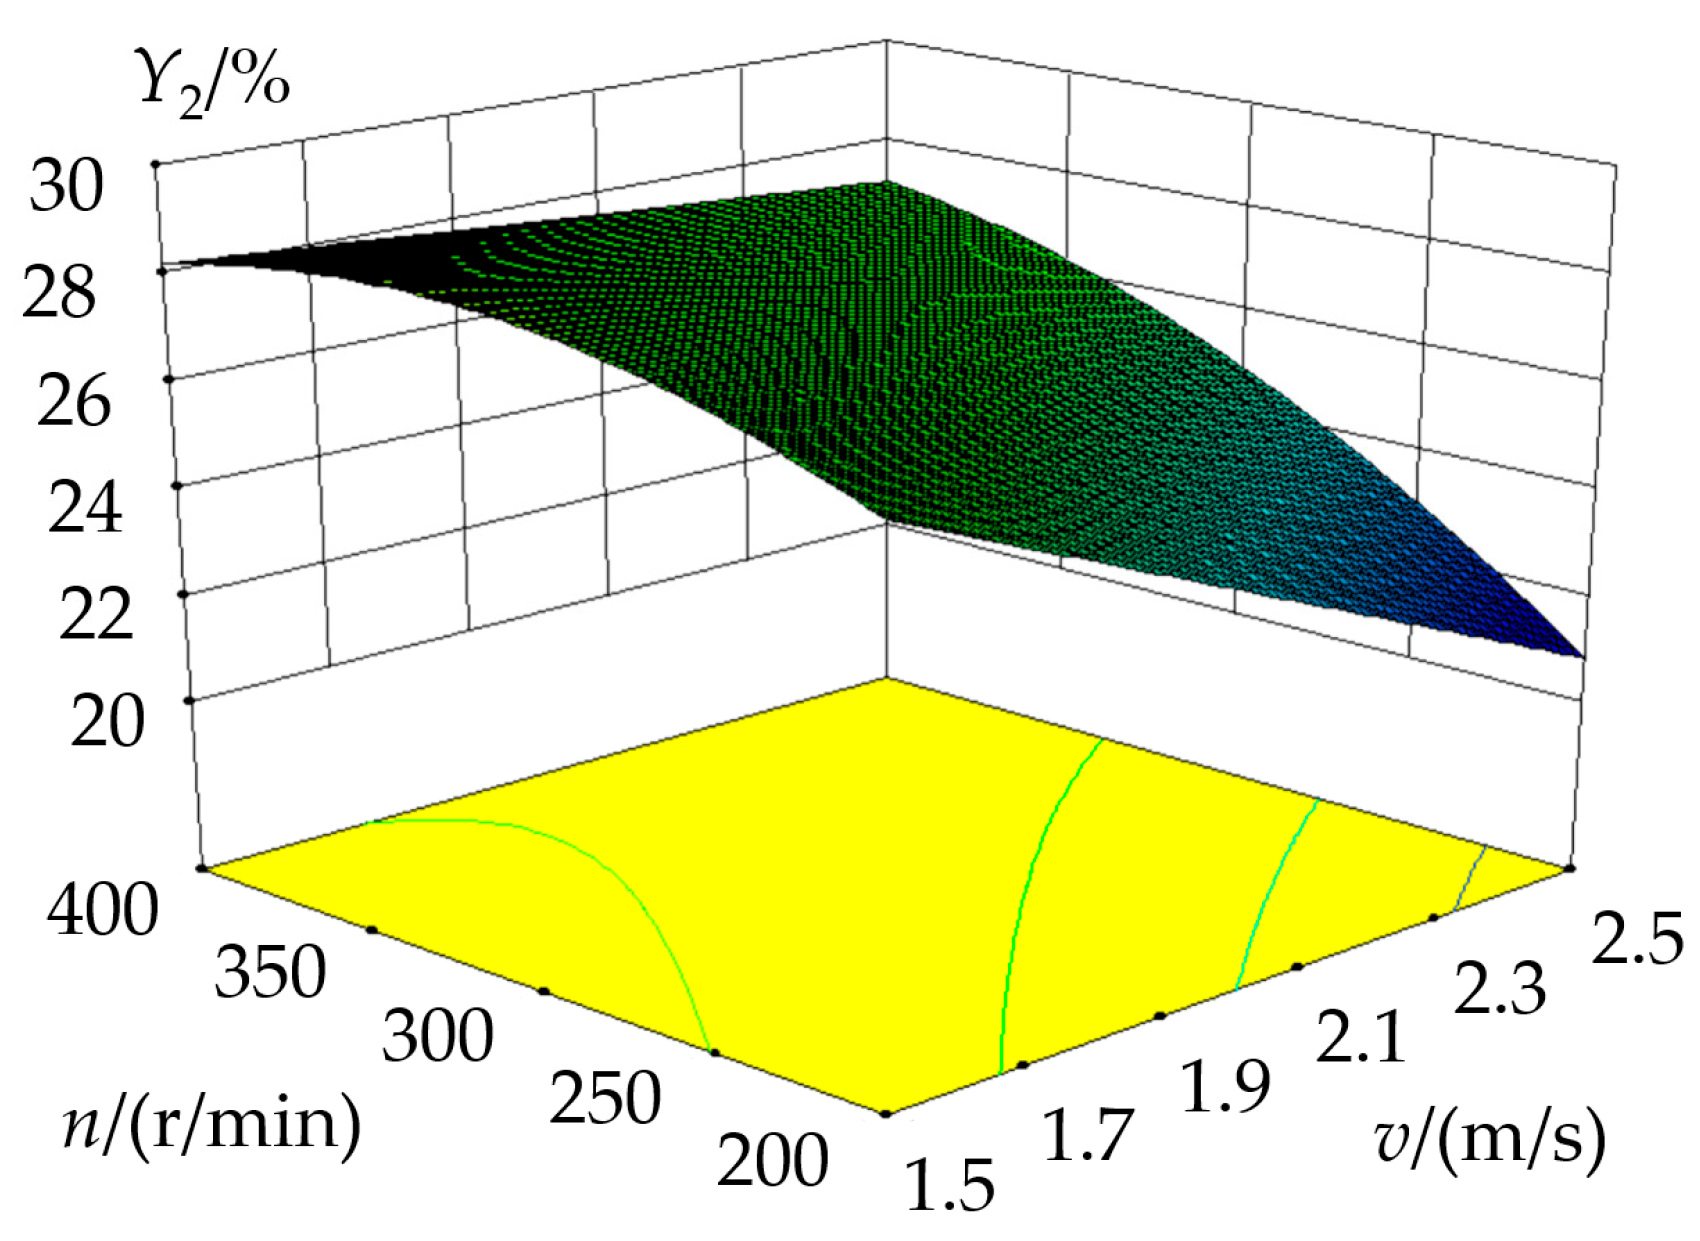
Soil disturbance is predominantly caused by the cutting action of the cutter teeth interacting with the soil. The cutting path is determined by the combined effects of the cutter tooth’s rotational circular motion and the machine’s linear forward movement, with the interplay between these two motions exerting a substantial influence on the soil disturbance rate. The influence of this is shown in Figure 11. Specifically, at an OS of 1.5 m/s, increasing the RS from 200 r/min to 300 r/min results in a marked rise in the tooth cutting frequency, which, in turn, causes a rapid escalation in the disturbance rate. However, further increasing the RS to 400 r/min leads to a higher likelihood of repeated cutting in the same soil area. Concurrently, the enhanced soil-throwing effect at elevated speeds causes some soil particles to be ejected beyond the cutter tooth’s effective cutting zone before complete disturbance occurs, thereby stabilizing the disturbance rate. Conversely, at an OS of 2.5 m/s, the increased OS linearly increases the spacing between successive tooth cuts, diminishing the overlap between adjacent cutting trajectories and reducing the probability of continuous soil cutting. Under conditions of a low RS, there is insufficient overlap between cutter tooth trajectories, which creates zones where cutting is omitted. Elevating the RS significantly enhances trajectory overlap, mitigating omission zones and sustaining a pronounced upward trend in the disturbance rate.

3.3. Parameter Optimization and Comparative Analysis

Based on actual operating conditions and agronomic necessities, the objective function and associated constraints formulated in this study are presented in Equation (7). Concerning the optimization approach for DA, this strategy prioritizes maximizing the DA value, provided that working performance is maintained. This prioritization is justified by the fact that a higher DA value significantly increases the straw cleaning width, thereby improving the operational efficiency of the VFD.
max Y 1 x 1 , x 2 , x 3 min Y 2 x 1 , x 2 , x 3 s . t . 1.5   m / s     v     2.5   m / s   200   r / min     n     400   r / min 0 °   α     60 °  
Design Expert software was utilized to determine multi-objective optimization of the experimental variables, with the optimal combination of parameters identified as follows: OS at 2.4 m/s, RS at 400 r/min, and DA at 48°. Under these conditions, the straw cleaning rate achieved 95.5% efficiency, while the soil disturbance rate was confirmed at 26.2%. To quantitatively evaluate the performance improvement of the device proposed in this study, a comparison was made with a typical vertical rotary straw cleaning device under the same operating conditions. According to study [19], in the rice straw fields of East China, the straw cleaning rate of the traditional non-fixed-angle vertical rotary device is 82.0%. To further control variables and enhance comparability, a simulation model of the traditional vertical rotary device was established based on EDEM, as shown in Figure 12, and simulation verification was conducted under the same OS and RS as the optimized device in this study. The results showed that the traditional vertical rotary device had a straw cleaning rate of 72.4% and a soil disturbance rate of 32.9%. In comparison, the proposed VFD increased the straw cleaning rate from 72.4% to 95.5%, an improvement of 23.1 percentage points; meanwhile, the soil disturbance rate decreased from 32.9% to 26.2%, a reduction of 6.7 percentage points. Additionally, the cleaning width increased from 360 mm to 449 mm, a growth of 24.7%. These quantitative results fully demonstrate that introducing the fixed-angle mechanism not only significantly enhances straw cleaning performance but also effectively reduces soil disturbance, achieving a dual optimization of cleaning effectiveness and operational quality. Moreover, setting the DA significantly increases the working width while maintaining cleaning quality, further improving the device’s practicality and operational efficiency.

3.4. Test Verification

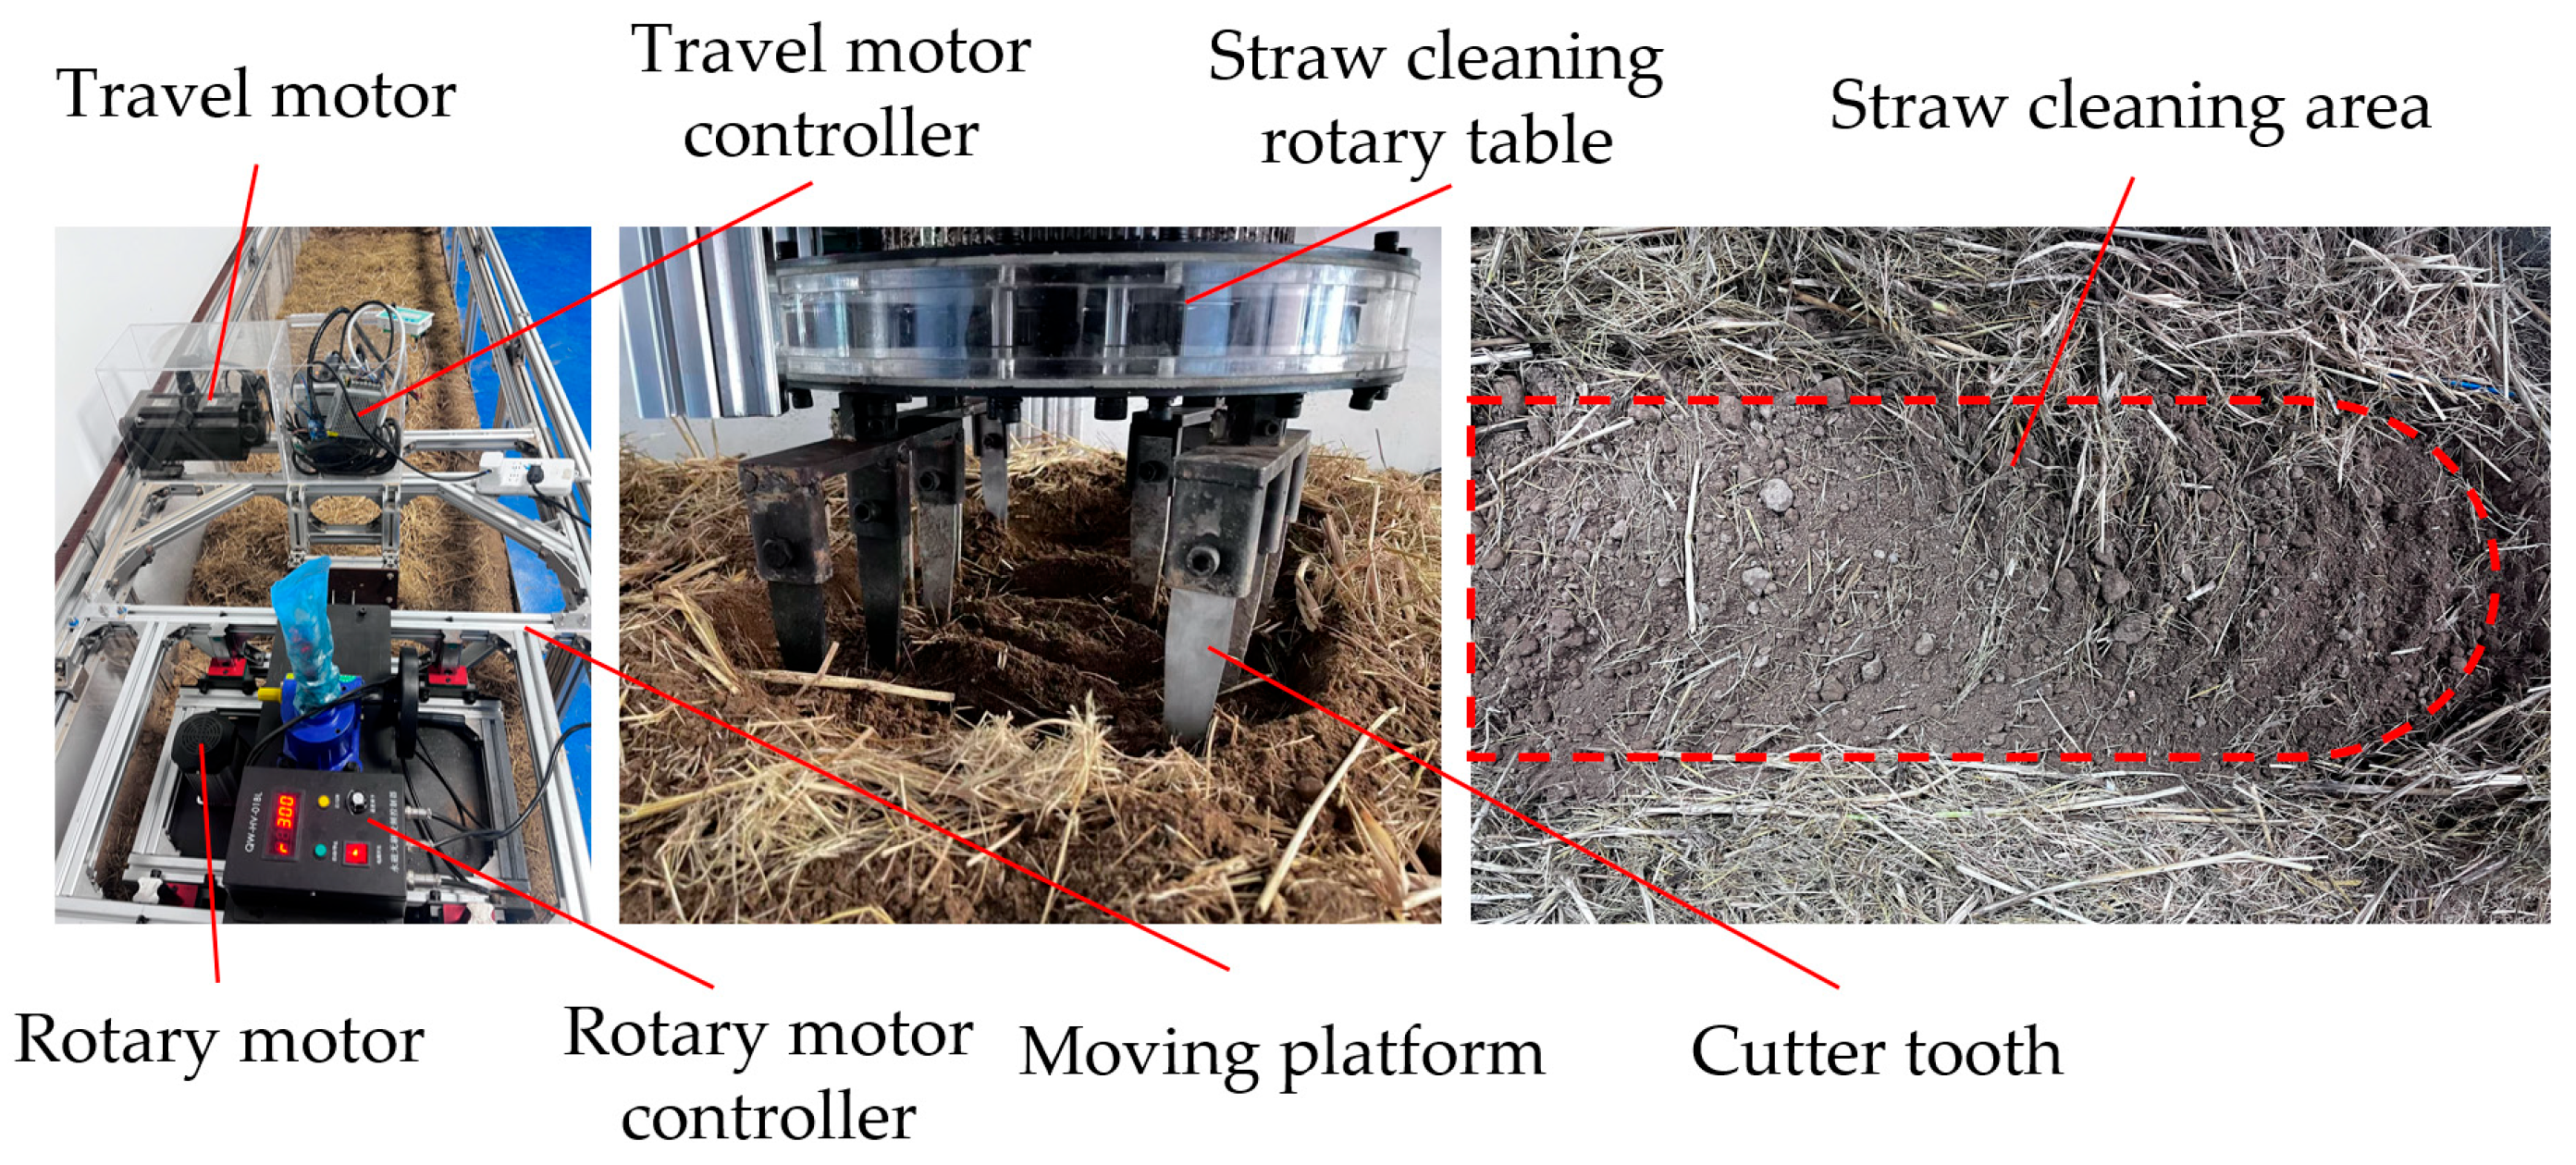
To verify the optimization results of the simulation experiment, validation tests were conducted using a soil trough test bench. The test setup and environment are shown in Figure 13. The test apparatus mainly comprised a travel motor, travel motor controller, rotary motor, rotary motor controller, moving platform, and VFD. The moving platform was driven by the travel motor, and its forward speed was controlled via the travel motor controller. The motor used for the soil trough moving platform is a 130-servo motor provided by Foshan Lvwei Technology Co., Ltd. (Foshan, Guangdong, China), with a rated power of 2.6 kW, operating on 220 V, 50 Hz AC power. The rotational power of the VFD was primarily driven by the rotary motor, with the rotary motor controller adjusting the RS value of the test device. The drive motor for the VFD is a brushless motor supplied by Changsha Qiwo Electronic Technology Co., Ltd. (Changsha, Hunan, China), with a rated power of 1.2 kW, operating on 220 V, 50 Hz AC power. The VFD is manufactured and assembled according to design parameters; after assembly, the module weighs 61 kg and has maximum dimensions of 584 × 584 × 438 mm. The DA value was adjusted through gear meshing during the assembly of the test. The instruments used included a ruler, electronic scale, and soil surface profiler. Based on the parameter optimization results, five repeated tests were conducted under the parameter combination of OS at 2.4 m/s, RS at 400 r/min, and DA at 48°. The final measured test results were a straw cleaning rate of 94.1% and a soil disturbance rate of 27.2%.

4. Conclusions

This research investigates the technical limitations associated with elevated soil disturbance in conventional horizontal rotary straw cleaning apparatus and the suboptimal straw cleaning efficiency observed in vertical rotary devices. To address these issues, the VFD was developed. This device employs a gear transmission system that dynamically adjusts the phase angle of the cutter tooth, thereby enabling a fixed angle for the cleaning operation of the teeth. Utilizing the integrated RecurDyn-EDEM modeling approach in conjunction with Box–Behnken response surface methodology, this study systematically examined the effects of operational parameters such as OS, RS, and DA on both the straw cleaning and soil disturbance rates. The experimental findings indicate that OS and RS exert extremely significant influences on both response variables, whereas DA demonstrates a significant impact on the straw cleaning and soil disturbance rates. DA plays a critical role by directly governing the efficiency at which straw is ejected from the machine; this is achieved by modifying the mechanical interaction direction between the straw and the cutter teeth, which is a primary factor influencing the straw cleaning rate. The interaction between RS and OS significantly influences soil disturbance by modifying the overlap of cutting paths. Specifically, at low OS, an elevated RS results in repeated soil cutting, whereas at a high OS, reduced RS causes incomplete cutting. Within the medium-to-high OS range, soil disturbance is minimized through optimal kinematic synchronization. Utilizing the optimized experimental configuration—an OS of 2.4 m/s, a RS of 400 r/min, and a DA of 48°—a straw cleaning rate of 94.1% and a soil disturbance rate of 27.2% were attained. Compared to traditional non-fixed-angle vertical rotary devices, the VFD shows significant improvements in both straw cleaning rate and cleaning width.
In summary, the proposed VFD overcomes the limitations of traditional vertical rotary straw cleaning devices, which have insufficient cleaning capacity. Its core value lies in its ability to efficiently create seeding belts locally for no-till planters while maximizing the retention of surface straw cover. This perfectly aligns with the technical requirements of conservation tillage, which focuses on residue management rather than residue removal. Therefore, this device offers an innovative solution for developing low-disturbance, highly precise conservation tillage equipment. During the experimental phase, bench testing was employed with the installation of cameras to monitor straw movement and mitigate the influence of environmental variables on the testing outcomes. Future research will focus on further validating the operational performance of the VFD under real field conditions.

Author Contributions

Conceptualization, N.S. and W.J.; methodology, H.L. and N.S.; software, B.J. and Y.C.; validation, J.C. and H.Z.; writing—original draft preparation, N.S. and B.J.; writing—review and editing, N.S. and H.L.; project administration, N.S. and W.J. All authors have read and agreed to the published version of the manuscript.

Funding

This research was funded by the National Natural Science Foundation of China (Grant No.32201673), the China Postdoctoral Science Foundation (Grant No. 2023M741436), and the China Soybean Industry Technology System (Grant No. CARS-04-PS29).

Institutional Review Board Statement

Not applicable.

Informed Consent Statement

Not applicable.

Data Availability Statement

The data presented in this study are included in the article. Further inquiries can be directed to the corresponding authors.

Conflicts of Interest

The authors declare no conflicts of interest.

References

  1. Ninkuu, V.; Liu, Z.X.; Qin, A.Z.; Xie, Y.J.; Song, X.; Sun., X.W. Impact of straw returning on soil ecology and crop yield: A review. Heliyon 2025, 11, e41651. [Google Scholar] [CrossRef] [PubMed]
  2. Zikeli, S.; Gruber, S. Reduced tillage and no-till in organic farming systems, germany—Status quo, potentials and challenges. Agriculture 2017, 7, 35. [Google Scholar] [CrossRef]
  3. Akhtar, K.; Wang, W.Y.; Khan, A.; Ren, G.X.; Afridi, M.Z.; Feng, Y.Z.; Yang, G.H. Wheat straw mulching offset soil moisture deficient for improving physiological and growth performance of summer sown soybean. Agric. Water Manag. 2019, 211, 16–25. [Google Scholar] [CrossRef]
  4. Outeiro, V.H.; Müller, M.M.L.; Pott, C.A.; Rosset, J.S.; Fuentes-Guevara, M.D.; Rampim, L. Rampim. L. Fixed shanks in the seeder and cover crops improve soil properties and soybean yield in no-tillage system subjected to heavy traffic. Soil Tillage Res. 2026, 255, 106769. [Google Scholar] [CrossRef]
  5. Aikins, K.A.; Antille, D.L.; Jensen, T.A.; Blackwell, J. Advances in residue management mechanisms of zero-tillage planters. In 2017 ASABE Annual International Meeting; ASABE Paper No.: 1700449; American Society of Agricultural and Biological Engineers: St. Joseph, MI, USA, 2017. [Google Scholar]
  6. Aikins, K.A.; Barr, J.B.; Ucgul, M.; Jensen, T.A.; Antille, D.L.; Desbiolles, J.M. No-tillage furrow opener performance: A review of tool geometry, settings and interactions with soil and crop residue. Soil Res. 2020, 58, 603–621. [Google Scholar] [CrossRef]
  7. Gürsoy, S. Performance Evaluation of the Row Cleaner on a No-Till Planter. Trans. ASABE 2014, 57, 709–713. [Google Scholar] [CrossRef]
  8. Conte, O.; Levien, R.; Debiasi, H.; Stürmer, S.L.K.; Mazurana, M.; Müller, J. Soil disturbance index as an indicator of seed drill efficiency in no-tillage agrosystems. Soil Tillage Res. 2011, 114, 37–42. [Google Scholar] [CrossRef]
  9. Torotwa, I.; Ding, Q.; Makange, N.R.; Liang, L.; He, R. Performance evaluation of a biomimetically designed disc for dense-straw mulched conservation tillage. Soil Tillage Res. 2021, 212, 105068. [Google Scholar] [CrossRef]
  10. Tahir, H.T. Evaluation and Comparative study of row cleaner modification through improving performance of the no-till planter and wheat production. Plant Arch. 2020, 20, 159–163. [Google Scholar]
  11. Li, X.; Zhang, Y.P.; He, H.J.; Wang, B.; Zhou, H.; Geng, D.Y.; Zhang, Y.Z. Design and experiment of row cleaner with staggered disc teeth for no-till planter. Agriculture 2023, 13, 1373. [Google Scholar] [CrossRef]
  12. Kumar, M.; Pandey, H.S.; Singh, K.P.; Verma, C.; Singh, S.K.; Singh, D. Sustainable no–tillage practices with a disc type novel residue cleaning mechanism: Design, development and field evaluation. Soil Tillage Res. 2025, 251, 106560. [Google Scholar] [CrossRef]
  13. Aikins, K.A.; Antille, D.L.; Jensen, T.A.; Blackwell, J. Performance comparison of residue management units of no-tillage sowing systems: A review. Eng. Agric. Environ. Food 2019, 12, 181–190. [Google Scholar] [CrossRef]
  14. Hou, S.Y.; Zou, Z.; Wei, Z.P.; Ji, W.Y.; Chen, H.T. Design and experiment of rectifier for multi-stage lateral movement of corn straw. Trans. Chin. Soc. Agric. Mach. 2021, 52, 45–56. [Google Scholar]
  15. Yao, W.Y.; Zhao, D.B.; Miao, H.Q.; Cui, P.D.; Wei, M.J.; Diao, P.S. Design and experiment of oblique anti -blocking device for no-tillage planter with shallow plowing stubble cleaning. Trans. Chin. Soc. Agric. Mach. 2022, 53, 42–52. [Google Scholar]
  16. Matin, M.A.; Hossain, M.I.; Gathala, M.K.; Timsina, J.; Krupnik, T.J. Optimal design and setting of rotary strip-tiller blades to intensify dry season cropping in Asian wet clay soil conditions. Soil Tillage Res. 2021, 207, 104854. [Google Scholar] [CrossRef] [PubMed]
  17. Liu, G.Y.; Xia, J.F.; Zheng, K.; Cheng, J.; Wei, Y.S.; Guo, L.W.; Li, X.F.; Zhang, J.M. Design and experiments of the barrier type rotary anti-adhesion blade roller with vibration crosspiece. Trans. CSAE 2022, 38, 29–40. [Google Scholar]
  18. Feng, X.; Xie, C.G.; Tong, J.R.; Guo, S.C.; Qi, B.D.; Gao, Y.P.; Wang, L.J.; Wang, Q. Design and test of vertical axis rotating cutters for cutting corn roots and crown. Agriculture 2025, 15, 717. [Google Scholar] [CrossRef]
  19. Wei, Z.X.; He, R.Y.; Li, Y.N.; Xu, G.M.; Ding, Q.S. Analysis of strip vertical rotation working parameters on seedbed straw cleaning and flatness effect in rice stubble field. J. Nanjing Agric. Univ. 2024, 47, 1037–1048. [Google Scholar]
  20. Tamás, K. Modelling the interaction of soil with a passively-vibrating sweep using the discrete element method. Biosyst. Eng. 2024, 245, 199–222. [Google Scholar] [CrossRef]
  21. Guo, J.B.; Wang, S.; Guo, Z.Y.; Pan, J.L.; Wang, G.Q.; Chen, Z.; Liu, Z.B.; Wu, S.W.; Guan, W. Dynamic characteristics analysis and optimization of track-soil interaction based on DEM-MBD coupling method. Powder Technol. 2026, 468, 121678. [Google Scholar] [CrossRef]
  22. Maraveas, C.; Tsigkas, N.; Bartzanas, T. Agricultural processes simulation using discrete element method: A review. Comput. Electron. Agric. 2025, 237, 110733. [Google Scholar] [CrossRef]
  23. Mohammadi, M.; Karparvarfard, S.H.; Razavizadeh, N.; Tekeste, M.; Moazeni_kalat, A.; Nematollahi, M.A.; Namjoo, M.; Rostami, M.A. Simulation of interaction between soil and rotary tiller to predict the power consumption and investigation of surface soil mixing. Soil Tillage Res. 2025, 252, 106626. [Google Scholar] [CrossRef]
  24. Makange, N.R.; Ji, C.Y.; Nyalala, I.; Sunusi, I.I.; Opiyo, S. Prediction of precise subsoiling based on analytical method, discrete element simulation and experimental data from soil bin. Sci. Rep. 2021, 11, 11082. [Google Scholar] [CrossRef] [PubMed]
  25. Celik, A.; Altikat, S. The effect of power harrow on the wheat residue cover and residue incorporation into the tilled soil layer. Soil Tillage Res. 2022, 215, 105202. [Google Scholar] [CrossRef]
  26. Issa, I.I.M.; Zhang, Z.G.; ElKolaly, W.; Wang, F.A.; Wang, Y. Innovated design, simulation and evaluation of potato harvester excavation and separation conveyors. Int. J. Agric. Biol. Eng. 2025, 18, 132–145. [Google Scholar] [CrossRef]
  27. Tamás, K.; Bernon, L. Role of particle shape and plant roots in the discrete element model of soil–sweep interaction. Biosyst. Eng. 2021, 211, 77–96. [Google Scholar] [CrossRef]
  28. Bartenev, I.M.; NLysych, M.N.; Shabanov, M.L.; Bukhtoyarov, L.D. Comparative studies of physical models of soil implemented by the method of discrete elements (DEM) on the example of a simple loosening tillage tool. IOP Conf. Ser. Earth Environ. Sci. 2019, 392, 012050. [Google Scholar] [CrossRef]
  29. Li, J.W.; Tong, J.; Hu, B.; Wang, H.B.; Mao, C.Y.; Ma, Y.H. Calibration of parameters of interaction between clayey black soil with different moisture content and soil-engaging component in northeast China. Trans. CSAE 2019, 35, 130–140. [Google Scholar]
  30. Xia, J.F.; Zhang, P.; Yuan, H.W.; Du, J.; Zheng, K.; Li, Y.F. Calibration and verification of flexible rice straw model by discrete element method. Trans. Chin. Soc. Agric. Mach. 2024, 55, 174–184. [Google Scholar]
  31. Wang, J.F.; Yang, D.Z.; Wang, Z.T.; Fu, Z.D.; Wang, J.W.; Weng, W.X. Design and experiment of rice straw biaxial deep-buried returning machine. Trans. Chin. Soc. Agric. Mach. 2023, 54, 21–30. [Google Scholar]
  32. Shan, F.K.; Kang, S.; Zhu, J.X.; Wang, Y.W.; Wang, J. Study on Tillage Fertilizer Mixing Effect Under Vertical Smashing Rotary Tillage and Rotary Tillage Based on EDEM. J. Agric. Sci. Technol. 2023, 11, 90–102. [Google Scholar]
  33. Awuah, E.; Zhou, J.; Liang, Z.; Aikins, K.A.; Gbenontin, B.V.; Mecha, P.; Makange, N.R. Parametric analysis and numerical optimisation of jerusalem artichoke vibrating digging shovel using discrete element method. Soil Tillage Res. 2022, 219, 105344. [Google Scholar] [CrossRef]
  34. Szpisják-Gulyás, N.; Al-Tayawi, A.N.; Horváth, Z.H.; László, Z.; Kertész, S.; Hodúr, C. Methods for experimental design, central composite design and the Box–Behnken design, to optimise operational parameters: A review. Acta Aliment. 2023, 52, 521–537. [Google Scholar] [CrossRef]
  35. Miressa, S.B.; Ding, Q.S.; Li, Y.N.; Amisi, E.O. Optimization of tillage operation parameters to enhance straw incorporation in rice-wheat rotation field. Agriculture 2024, 15, 54. [Google Scholar] [CrossRef]
  36. Zhang, S.L.; Huang, Y.X.; Zhao, H.B.; Fu, Z.L.; Liu, Z.D.; Shi, J.T. Design and experiment of cutting and throwing combined anti-blocking device for wide-seedbed seeding of wheat. Trans. Chin. Soc. Agric. Mach. 2024, 55, 40–52. [Google Scholar]
  37. Chen, H.T.; Lu, Y.D.; Wang, X.; Zhang, Y.; Yu, C.P. Design and test of lateral stubble clearing blade for high-speed operation in corn stubble field. Trans. Chin. Soc. Agric. Mach. 2025, 56, 163–173. [Google Scholar]
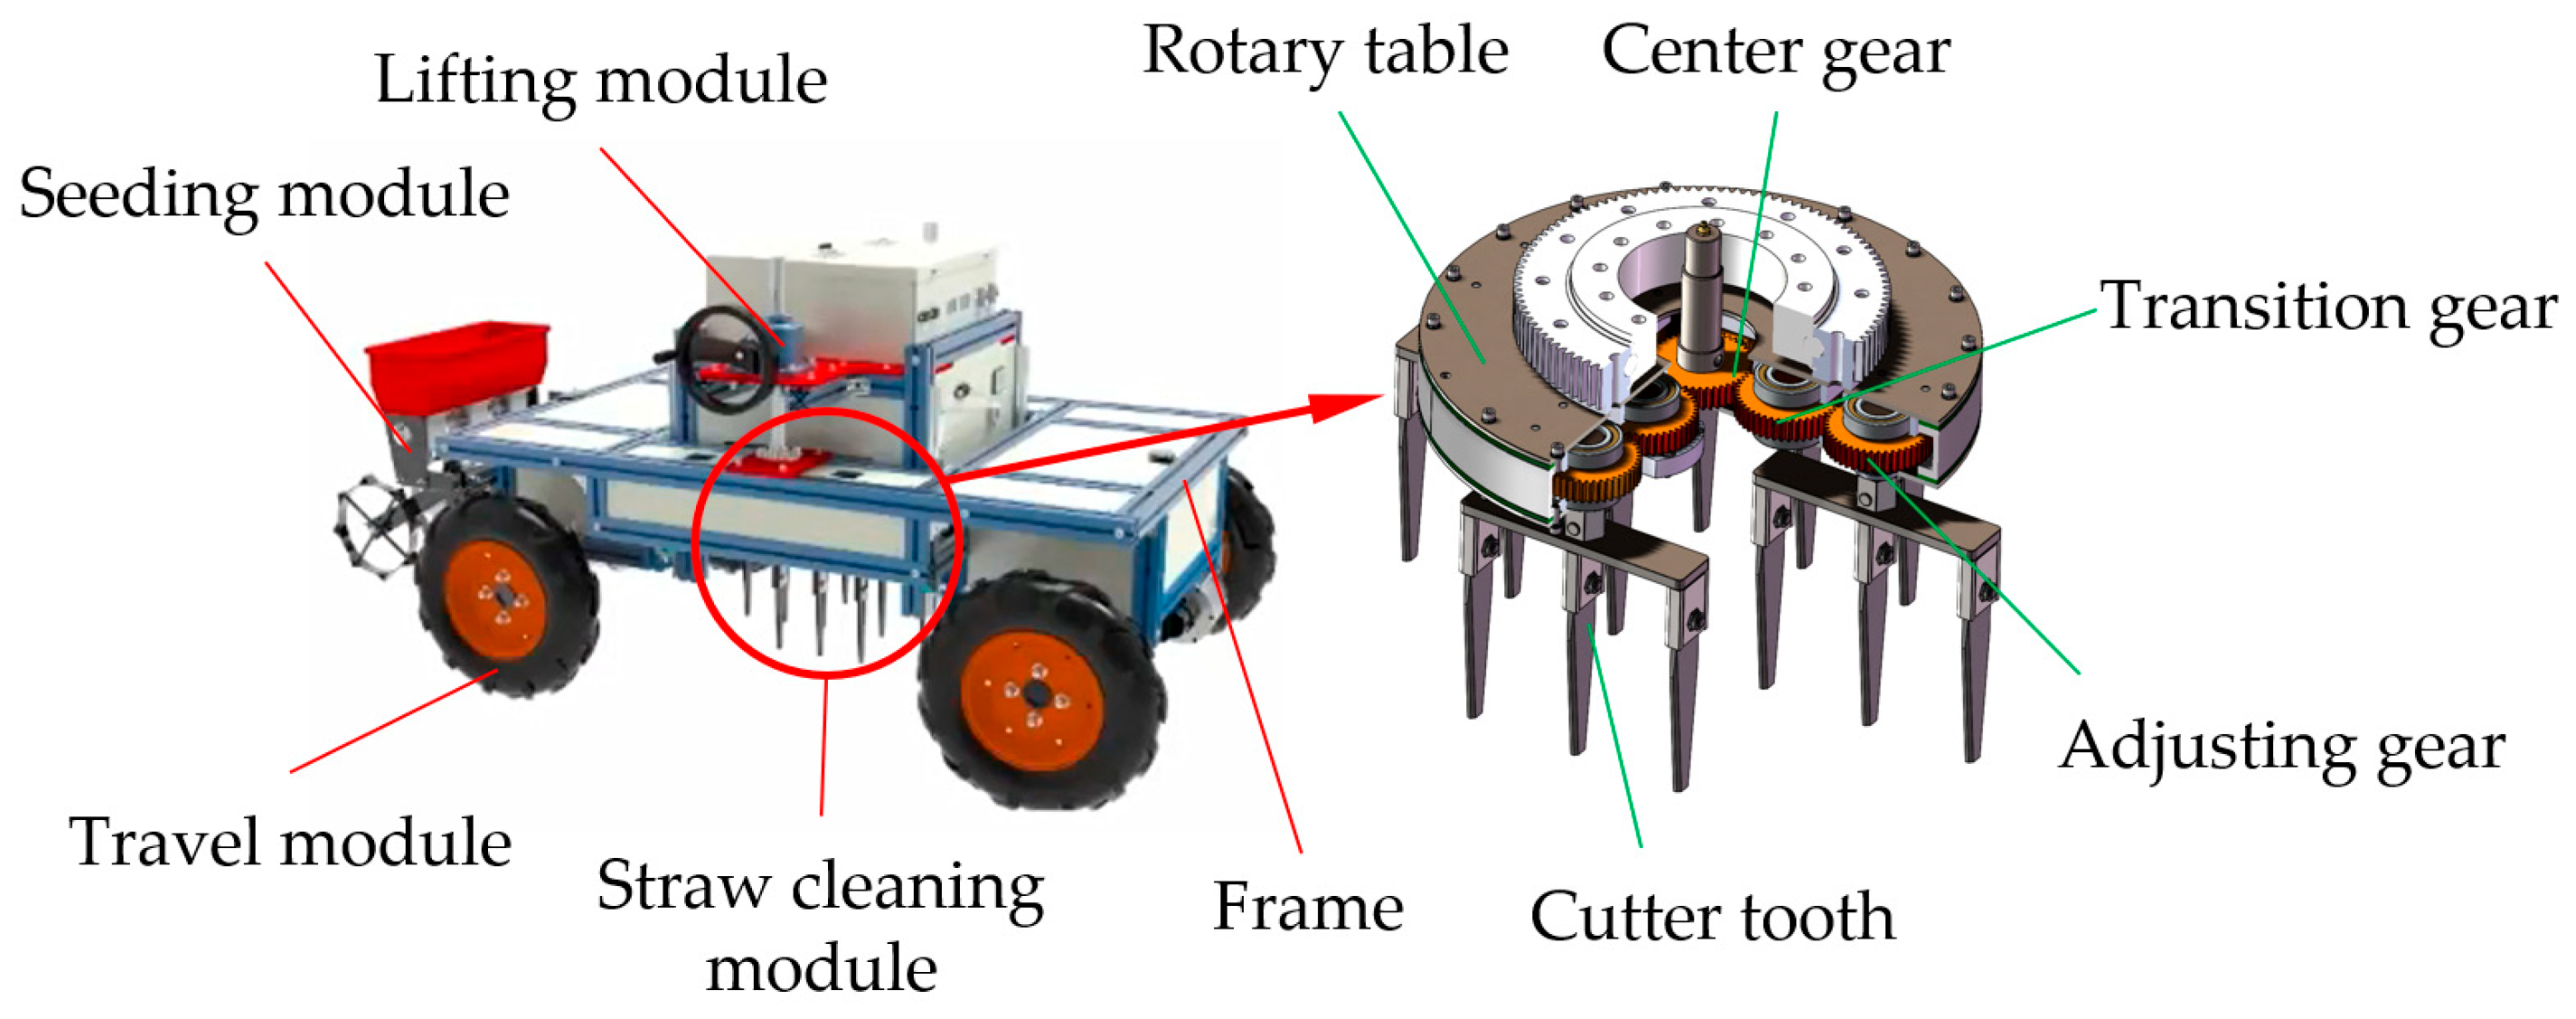
Figure 1. Structure of the VFD.
Agriculture 15 02113 g001
Figure 2. Analysis diagram of gear mechanism.
Agriculture 15 02113 g002
Figure 3. Analysis of the cutter tooth movement curve and straw velocity: (a) motion trajectory of the cutter tooth; (b) analysis of straw stress at DA = 0; and (c) analysis of straw stress at DA ≠ 0.
Agriculture 15 02113 g003
Figure 4. RecurDyn simulation model and cutting path of the cutter teeth.
Agriculture 15 02113 g004
Figure 5. Movement trajectories corresponding to different DA.
Agriculture 15 02113 g005
Figure 6. Coupled simulation process between EDEM and RecurDyn.
Agriculture 15 02113 g006
Figure 7. Single factors influencing the straw cleaning rate.
Agriculture 15 02113 g007
Figure 8. Comparison of cutting trajectories of different DA.
Agriculture 15 02113 g008
Figure 9. Influence of the interaction term v-n on the straw cleaning rate.
Agriculture 15 02113 g009
Figure 10. The single-factor influence of the soil disturbance rate.
Agriculture 15 02113 g010
Figure 11. The influence of the interactive term v-n on the soil disturbance rate.
Agriculture 15 02113 g011
Figure 12. Simulation process of traditional vertical rotary straw cleaning device.
Agriculture 15 02113 g012
Figure 13. Testing configuration and performance outcomes.
Agriculture 15 02113 g013
Table 1. Pre-treatment parameter settings.
MaterialsParametersValues
Soil particles [29]Poisson’s ratio0.46
Shear modulus/Pa1.00 × 106
Density/(kg·m−3)1516.40
Straw [30]Poisson’s ratio0.40
Shear modulus/Pa1.00 × 106
Density/(kg·m−3)241.00
Normal stiffness per unit area/(N·m−2)3.04 × 1010
Shear stiffness per unit area/(N·m−2)2.30 × 1010
Critical normal stress/Pa5.50 × 108
Critical shear stress/Pa5.50 × 108
Cutter tooth [29]Poisson’s ratio0.29
Shear modulus/Pa7.90 × 1010
Density/(kg·m−3)7861.00
Soil particles [29]Coefficient of restitution0.50
Coefficient of static friction0.80
Coefficient of rolling friction0.23
Surface energy/(J·m−2)8.41
Straw and cutter tooth [30]Coefficient of restitution0.30
Coefficient of static friction0.15
Coefficient of rolling friction0.10
Soil particles and straw [31]Coefficient of restitution0.60
Coefficient of static friction0.55
Coefficient of rolling friction0.20
Soil particles and cutter tooth [29]Coefficient of restitution0.61
Coefficient of static friction0.57
Coefficient of rolling friction0.06
Surface energy/(J·m−2)5.50
Straw and cutter tooth [30]Coefficient of restitution0.30
Coefficient of static friction0.16
Coefficient of rolling friction0.09
Table 2. Straw measurement data.
Measurement Interval/cmAverage Length/cmAverage Diameter/mmProportion of Mass/%
(0,5]4.656.210.5
(5,10]7.557.412.7
(10,15]13.618.235.1
(15,∞)18.496.741.7
Table 3. Codes for experimental factors.
Code No.OS
v/(m·s−1)
RS
n/(r·min−1)
DA
α/°
−11.52000
02.030030
+12.540060
Table 4. Experimental scheme and results.
NO.Experimental FactorsExperimental Index
v/(m·s−1)n/(r·min−1)α/(°)Y1/%Y2/%
11.52003097.127.3
22.52003089.521.4
31.54003097.328.7
42.54003095.327.8
51.5300095.232.3
62.5300092.827.7
71.53006094.226.2
82.53006091.623.4
92.0200092.425.1
102.0400096.627.4
112.02006087.521.7
122.04006095.126.9
132.03003093.725.9
142.03003094.926.1
152.03003096.028.1
162.03003093.926.5
172.03003095.725.8
Table 5. Variance analysis of the Y1 regression model.
SourcesSum of SquaresDegree of FreedomMean SquareF Valuesp Values
Model98.34910.935.740.0156 **
v26.65126.6514.000.0073 ***
n39.60139.6020.800.0026 ***
α9.2519.254.860.0634 *
v-n7.8417.844.120.0820 *
v-α0.0110.01<0.010.9443
n-α2.8912.891.520.2577
v20.2710.270.140.7158
n20.3710.370.190.6741
α211.39111.395.980.0443 **
Residual13.3371.90
Lack of fit9.0633.022.830.1706
Pure error4.2741.07
Total111.6616
Note that *** indicates an extremely significant effect (p < 0.01); ** indicates a significant effect (0.01 < p < 0.05); and * indicates a moderately significant effect (0.05 < p < 0.1).
Table 6. Variance analysis of the Y2 regression model.
SourcesSum of SquaresDegree of FreedomMean SquareF Valuesp Values
Model98.31910.928.590.0049 ***
v25.21125.2119.810.0030 ***
n29.26129.2623.000.0020 ***
α25.56125.5620.090.0029 ***
v-n6.2516.254.910.0622 *
v-α0.8110.810.640.4511
n-α2.1012.101.650.2395
v23.9813.983.130.1202
n25.5915.594.400.0742 *
α20.01210.012<0.010.9266
Residual8.9171.27
Lack of fit5.3431.781.990.2571
Pure error3.5740.89
Total107.2216
Note that *** indicates an extremely significant effect (p < 0.01); and * indicates a moderately significant effect (0.05 < p < 0.1).
Disclaimer/Publisher’s Note: The statements, opinions and data contained in all publications are solely those of the individual author(s) and contributor(s) and not of MDPI and/or the editor(s). MDPI and/or the editor(s) disclaim responsibility for any injury to people or property resulting from any ideas, methods, instructions or products referred to in the content.