Article

Research on the Operational Parameters and Performance of Key Components of an Industrial Hemp Harvester and Drier

1
College of Engineering, Heilongjiang Bayi Agricultural University, Daqing 163319, China
2
Heilongjiang Province Conservation Tillage Engineering Technology Research Center, Daqing 163319, China
3
Key Laboratory of Soybean Mechanized Production, Ministry of Agriculture and Rural Affairs, Daqing 163319, China
4
Raohe County Agricultural and Rural Affairs Bureau, Shuangyashan 155100, China
*
Author to whom correspondence should be addressed.
Agriculture 2025, 15(2), 141; https://doi.org/10.3390/agriculture15020141
Submission received: 11 December 2024 / Revised: 7 January 2025 / Accepted: 7 January 2025 / Published: 10 January 2025
(This article belongs to the Section Agricultural Technology)

Abstract

:
Industrial hemp has significant utilization value, and China is the largest producer of industrial hemp in the world, primarily growing hemp for fiber. Heilongjiang Province is the largest area of hemp fiber cultivation in China. In response to issues such as inconsistent operating standards, low efficiency, and poor harvesting quality of industrial hemp harvesters in China, this study integrates the mechanical properties of the “Hanma 5” hemp stalk and applies cutting platform design theory to analyze and optimize the key components of existing hemp harvesters, aiming to obtain optimal operational parameters. First, by analyzing the motion laws of the cutting blade and the regression equations of shear power consumption and shear force, the relationship between cutting speed and time is established, and the cutting and conveying parameter ranges are derived, providing the basis for subsequent simulation analysis and field validation. Next, dynamic simulation analysis of the key components of the domestic 4GM-2.2 industrial hemp harvester for fiber is conducted using ADAMS and Workbench. The conveyor speed values and corresponding chain drive combinations under different conveyor speed ratios are obtained. Field experiments validated the optimal combination of key operational parameters for the industrial hemp harvester as follows: forward speed of 2.1 m/s, cutting speed of 2.5 m/s, conveyor speed ratio of 2.2, coefficient of variation for the laying angle of 6.88%, coefficient of variation for the laying thickness of 4.11%, and cutting height of 10.4 cm. Under the optimal operational parameter combination, the re-cut rate was 8.4%, with no missed cutting observed. This paper provides technical references for exploring the optimal operational parameters of industrial hemp harvesters for fiber to achieve high-quality harvesting operations.

1. Introduction

Industrial hemp has significant utilization value, and China is the largest producer of industrial hemp in the world, primarily growing hemp for fiber. Heilongjiang Province is the largest area of fiber hemp cultivation in China, accounting for over 60% of the total cultivation area in the country [1,2,3,4]. Before the large-scale cultivation of fiber hemp in China, flax was the main fiber crop [5,6,7,8], with mature flax typically growing to a height between 0.8 and 1.2 m. In contrast, mature fiber hemp generally grows above 2 m, with some varieties reaching 3 to 5 m, or even up to 6 m. Additionally, the stalk diameter and hardness of hemp are larger than those of flax, leading to significant differences in plant characteristics. While flax is harvested by pulling, fiber hemp is harvested through cutting and drying operations. Therefore, flax harvesting machinery is not suitable for harvesting fiber hemp.
The development of industrial hemp harvesters began earlier abroad, with a high level of mechanization. There are various types of machinery used for harvesting industrial hemp, including those for harvesting stalks, leaves, flower seeds, and stem seeds. These machines feature good cutting performance, long operational life, and stable structures [9,10,11]. The industrial hemp harvester developed by the Polish Institute of Natural Fibers and Medicinal Plants adopts a tractor-mounted side-rear cutting mechanism. After cutting, the stalks are output sideways and cross-laid on the ground for subsequent collection and bundling, entering the fiber stripping process. Companies such as Czech Tebeco, John Deere in the United States, and the University of Manitoba in Canada [12,13] have also developed industrial hemp harvesters. However, these machines require a high level of land leveling and have low adaptability to lodging and tilted crops. Additionally, many foreign industrial hemp harvesters use segmented harvesting, and the fibers obtained are difficult to use in the long textile industry. The equipment is expensive and not suitable for China’s cultivation model [14,15]. China’s research and development of fiber hemp harvesters started late, with limited investment and slow progress, resulting in low mechanization, limited variety, and small quantities [16,17,18]. The 4GS-2880 industrial hemp harvester developed by Cao Yongquan et al. [19] is suitable for large-scale harvesting of hemp, reed, and other crops, with an efficiency of 1 to 1.3 hm²/h and a speed of 5 to 5.5 km/h. Features include high strength, wear resistance, and long service life; an adaptive mechanism for adjusting the cutting height; and a low-stubble device that can lower the cutting height to 6 cm. Zhu Hao et al. [20] developed a fiber hemp harvester and provided a detailed introduction to its working principles, structure, and components. Gong Yanfeng et al. [21] developed the 4GL-285 industrial hemp harvester tailored to the current situation in Heilongjiang, with a speed range of 8 to 10 km/h. Field experiments showed that the harvester has strong adaptability, wide working width, meets harvesting requirements, improves efficiency, resolves compaction issues, and facilitates subsequent mechanized operations. The domestically developed industrial hemp harvesters partially address the harvesting requirements of hemp, but the lack of unified harvesting standards leads to low operational efficiency and poor work quality. Moreover, during the design process, the unique characteristics and agronomic requirements of fiber hemp were not fully considered, leading to difficulties in cutting when harvesting fiber hemp.
To address the above issues, this study uses the “Hanma 5” variety as the experimental model, based on the prototype structural parameters, theoretical analysis, existing agronomic requirements, and relevant national standards. Combining the values obtained from the laboratory experiments on fiber hemp, numerical simulation analysis is performed to obtain the operational parameters that meet practical needs, which are then verified in the field. The optimal combination of operational parameters is ultimately determined, aiming to provide a reference for improving the operational quality of industrial hemp harvesters.

2. Materials and Methods

2.1. Study on the Mechanical Properties of Industrial Hemp Stems

The mechanical properties of fiber hemp stems are a critical factor in optimizing operational parameters and simulation analysis of key components. They can provide the relationship between cutting power consumption, cutting speed, cutting force, cutting time, and stem moisture content, serving as the basis for subsequent dynamic simulation analysis.

2.1.1. Experimental Materials and Instruments

The selected variety of fiber hemp in this study is “Hanma No. 5”. The selection criteria include uniform stem wall thickness, consistent upper and lower diameters, and absence of diseases, pests, and damage. Since the machine’s cutting height is set at 10 cm, a 20 cm section of the stem, starting from the root, is selected as the test sample and stored in a sealed bag for preservation. Measurements from the experiment show that the average external and internal diameters at the plant’s cutting point are 8 mm and 5 mm, respectively; the maximum values are 10 mm and 7 mm, and the minimum values are 5 mm and 2 mm. In this experiment, the Keet-MS100 grain moisture meter is used to measure the moisture content, and the CTM-2050 micro-controlled electronic universal material testing machine is used for the mechanical property analysis of the hemp stems, as shown in Figure 1.

2.1.2. Moisture Content Determination

The moisture content of a material refers to the percentage of the mass of water in the material relative to the total mass of the material. Its calculation formula is
M = M 1 M 2 M 1 100 %
In the equation, M represents moisture content of fiber hemp stems (%), M1 represents pre-drying mass of fiber hemp stems (g), and M2 is the post-drying mass of fiber hemp stems (g).

2.1.3. Shear Mechanical Property Testing Study

To ensure that the shear mechanical property test closely matches actual operations, the width of the cutting blade in this experiment is only increased to better secure it on the test bench, while the blade dimensions and material are consistent with those used in practice. During the test, the shear speed was adjusted to 5 mm/s, 7 mm/s, 9 mm/s, 11 mm/s, and 13 mm/s, with stem moisture contents of 35.86%, 37.53%, 39.20%, 40.87%, and 42.54%. Shear tests were conducted on stems with maximum, minimum, and average diameters, and shear force data were collected. Shear power consumption refers to the energy consumed by the shear force during the cutting process in performing work on the material. It reflects the energy consumption and efficiency of the shear process. Shear force refers to the force that causes the stalk to undergo shear deformation. Shear speed refers to the movement speed of the cutting blade relative to the crop stalk, which is an important indicator of the cutting efficiency and capability of the blade. The relationship between shear power consumption, shear force, shear speed, and shear time is shown in Equation (2).
W = F v t
In the equation, W represents shear power consumption (J), F represents shear force (N), v represents shear speed (cm/s), and t is shear time (s).
The results of the shear mechanical property tests for the fiber-type industrial hemp stems are shown in Table 1. The analysis focuses on the variation in shear power consumption, shear speed, shear time, and shear force with respect to stem diameter, and the relationship of shear force with shear speed, stem diameter, and stem moisture content [22,23,24,25].

2.2. Analysis and Simulation of Key Component Operational Parameters of the Harvesting Platform for Industrial Hemp Swathers

This section uses the previously derived regression equations for stalk cutting power consumption and cutting force as numerical references for theoretical calculations. By incorporating the theory of vertical cutting and conveying systems, it determines the range values for cutting speed, forward speed, and conveying speed that align with both practical operations and theoretical calculations. These values will serve as a basis for subsequent dynamic simulation analysis and field experiments.

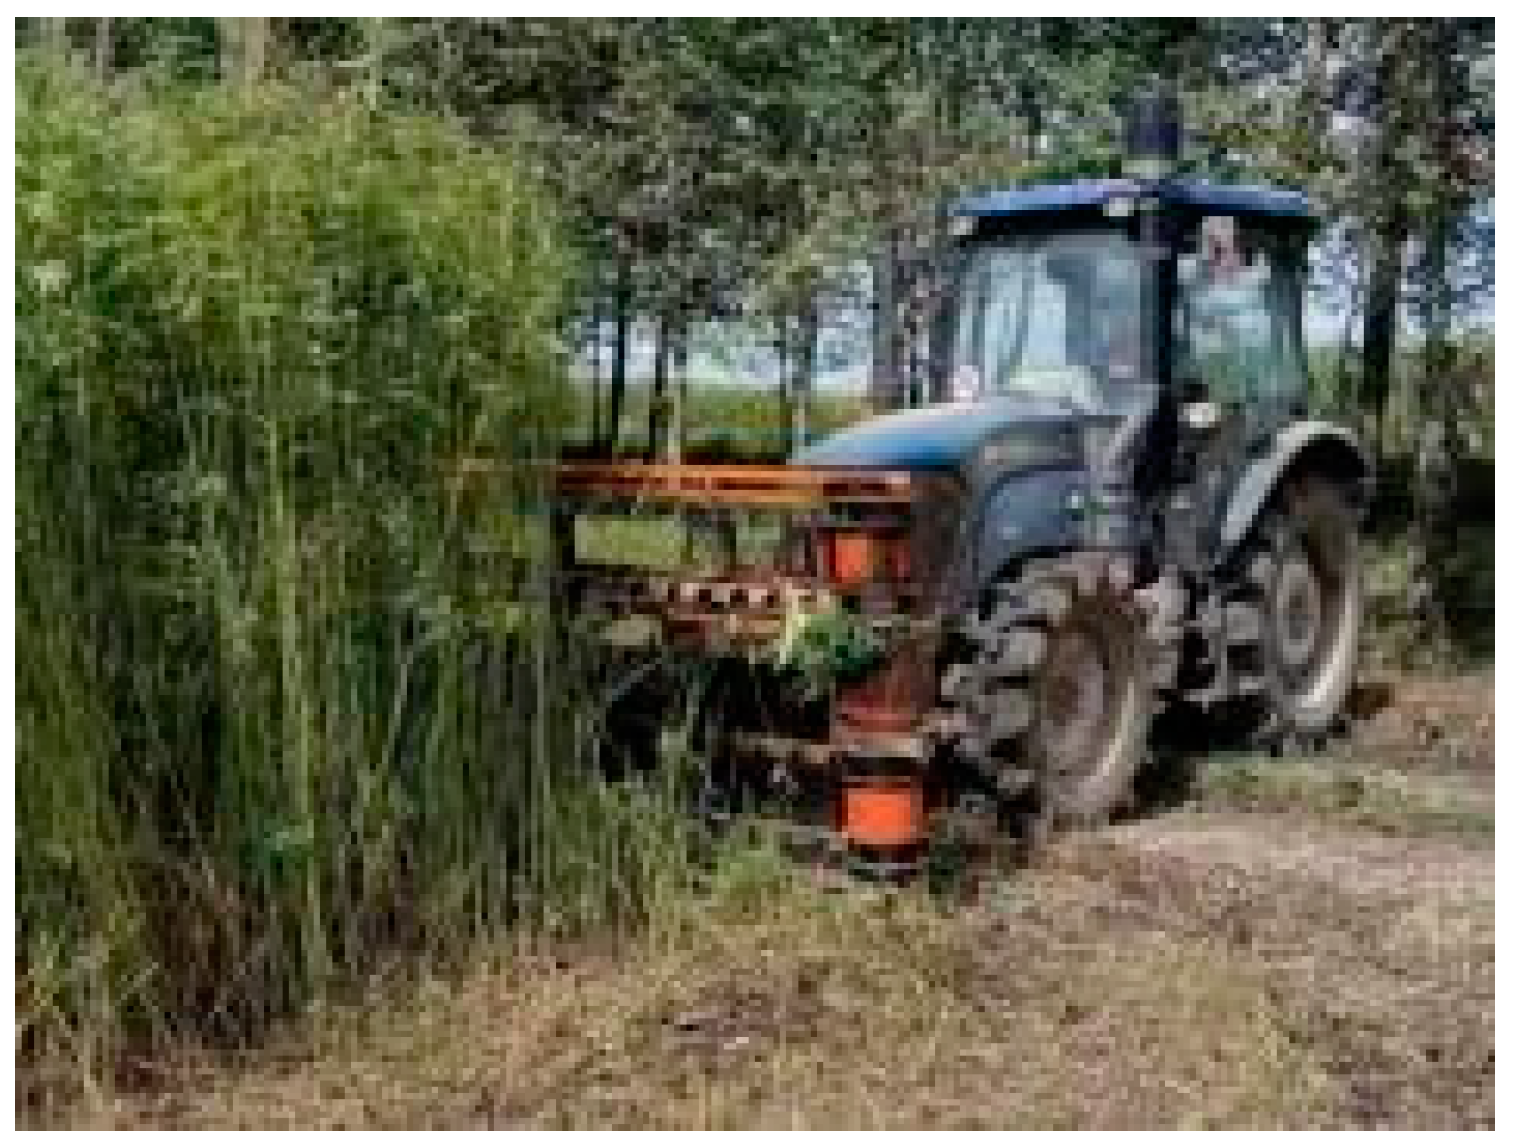
2.2.1. Overall Machine Structure and Working Principle

The overall machine can be divided into four major components: the cutting mechanism, conveying mechanism, plant lifting mechanism, and power transmission mechanism. The cutting mechanism consists of a cutter and a drive device, with the reciprocating cutter driven by a crank–slider mechanism to cut the fiber hemp plants. The conveying mechanism is composed of a conveyor belt, driving wheels, and idler wheels, responsible for transporting the cut plants to the ground. The plant lifting mechanism consists of a lifting device and a spring tape, responsible for guiding the hemp plants to the conveyor belt and lifting the lodged plants. The power transmission mechanism is composed of a drive shaft, gearbox, and chain drive, responsible for transmitting power and maintaining the normal operation of the machine.
The fiber hemp harvesting machine is based on a vertical cutting platform, and its working principle is as follows: The gearbox receives power from the tractor through the power output shaft and transmits it to the drive device of the cutting mechanism via the drive shaft, which powers the small sprocket and chain drive. The drive mechanism powers the cutter to complete the cutting operation. The small chain transmits power to the large sprocket and drive shaft, which drives the conveyor belt and idler shaft to move in a fixed direction, completing the conveying operation. The fiber hemp plants are guided by the lifting device to the front of the frame, and then held tightly against the machine by the spring tape to complete the plant lifting operation. A schematic diagram of the whole machine is shown in Figure 2.

2.2.2. Analysis of the Operating Parameters of the Cutting Components

(1)
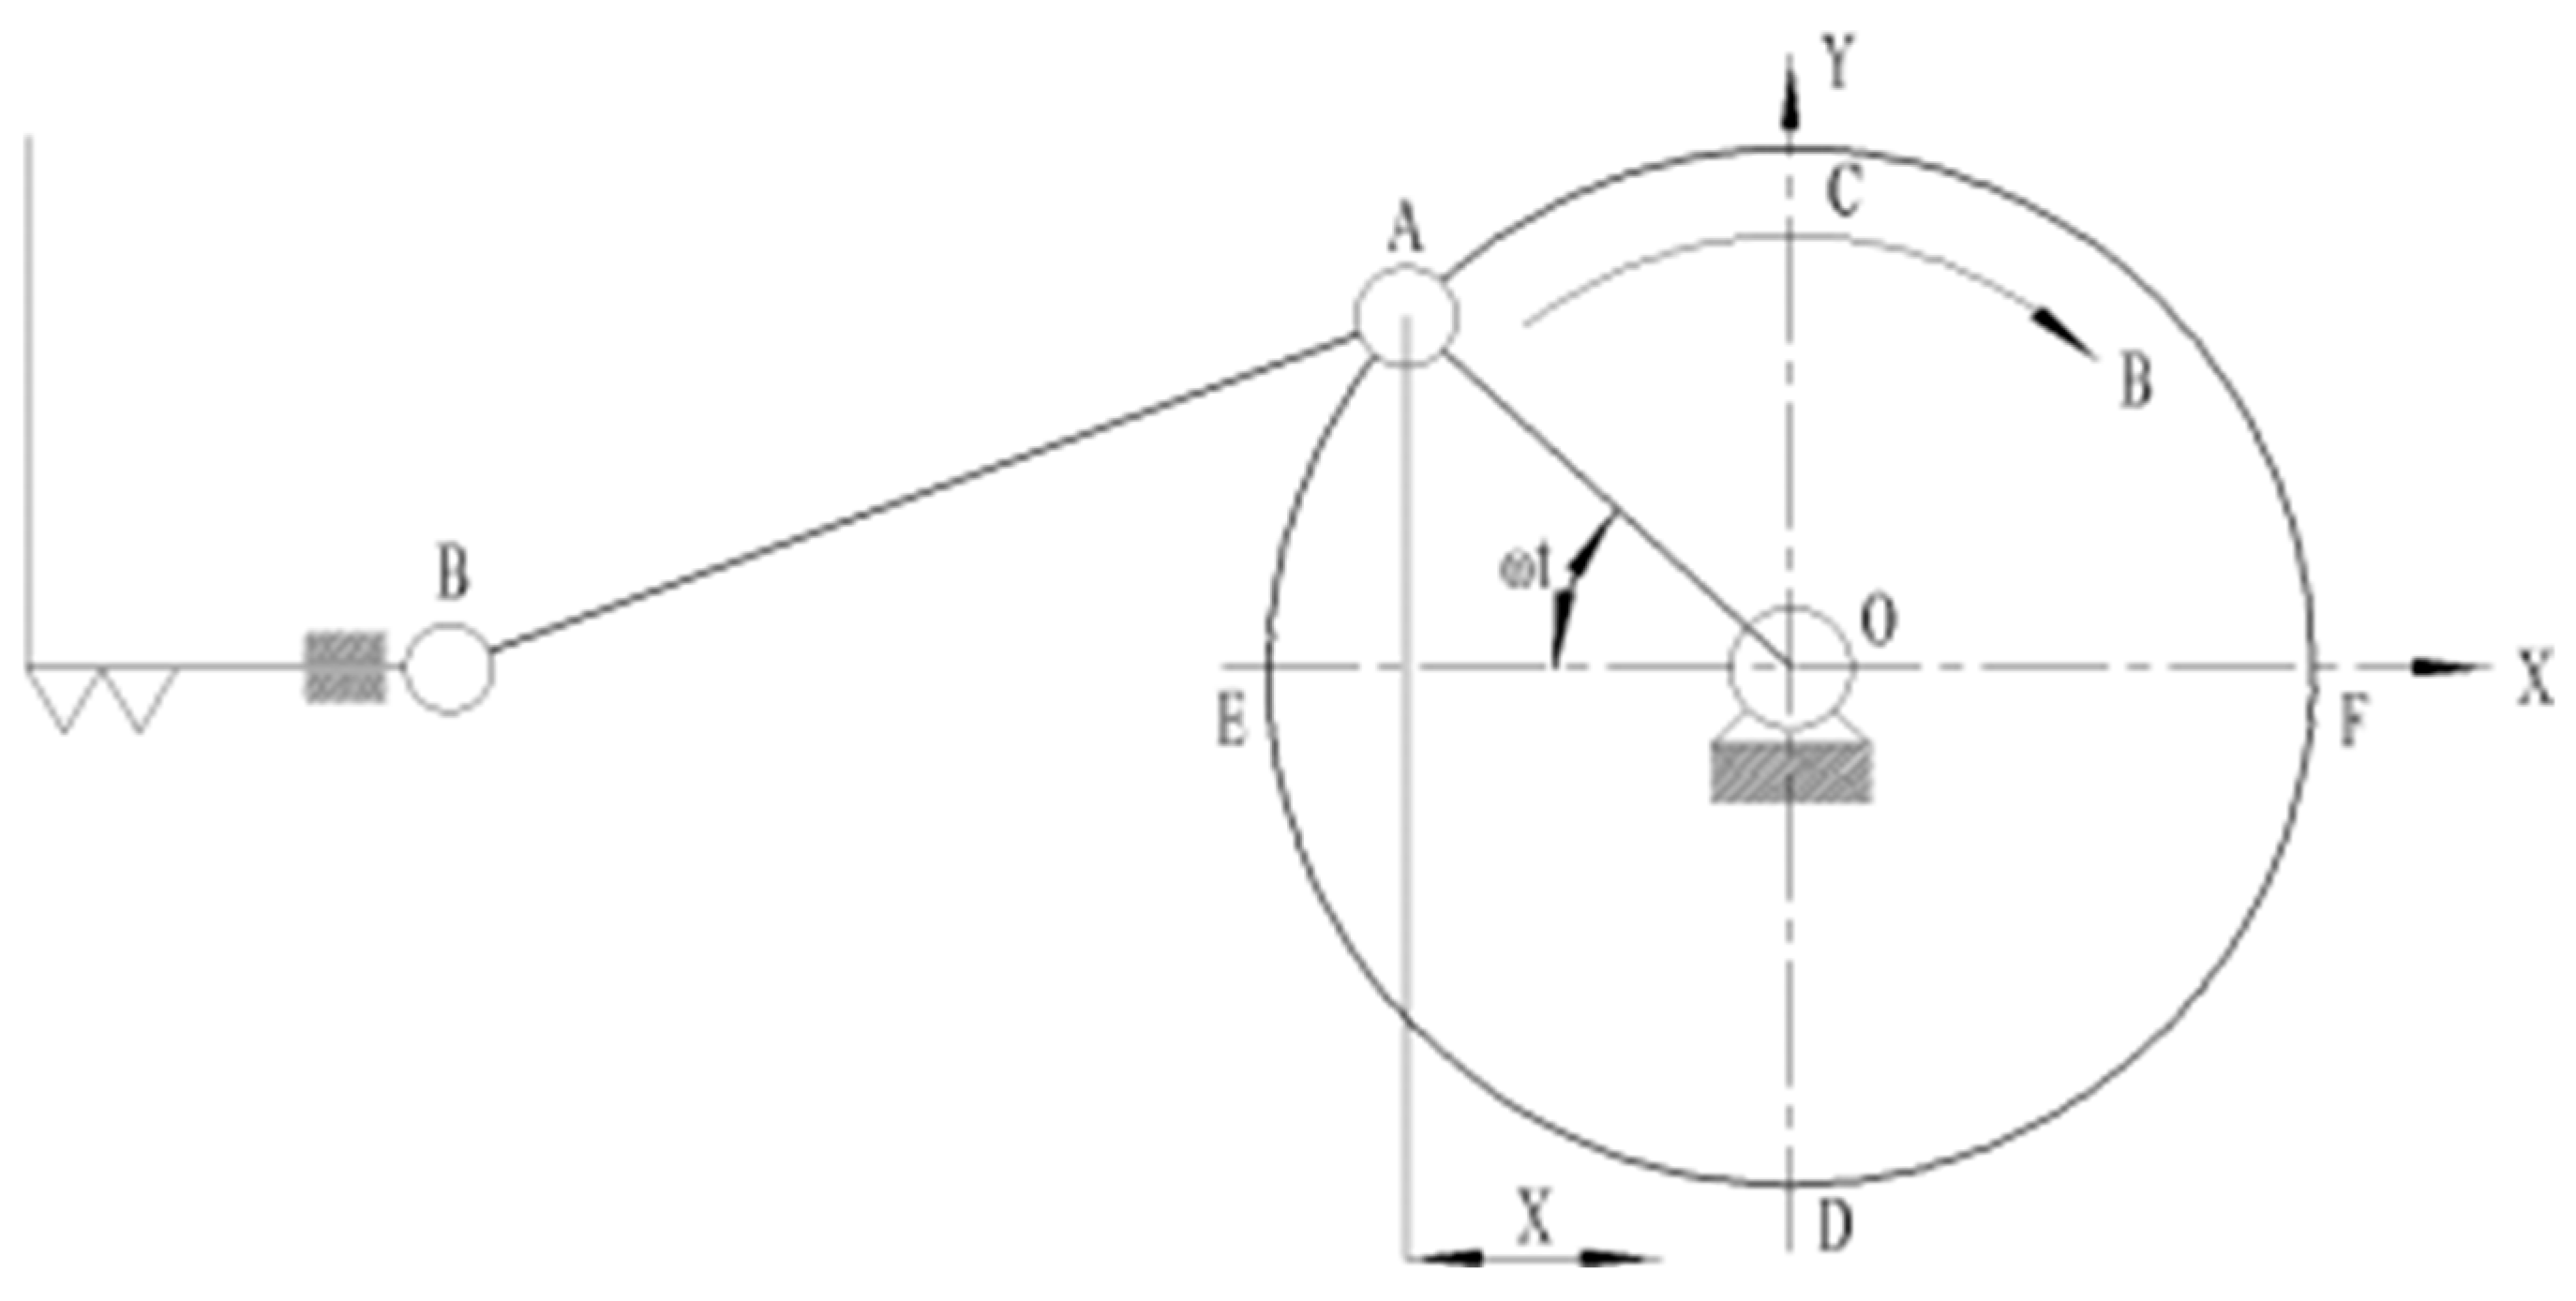
Analysis of the cutter movement
The cutter adopts a reciprocating cutter, which is characterized by a simple structure, a large lateral working width, and a small longitudinal space occupation, making it suitable for high-speed cutting operations in the reaping and drying machine. The drive mechanism uses a crank–link mechanism, known for its simple and compact structure, as well as high transmission efficiency. The analysis of the cutter’s motion characteristics directly affects the cutting performance. Its motion mode is reciprocating lateral movement, characterized by intermittency. Therefore, by analyzing the motion characteristics and determining the relationship between displacement and velocity, it provides a basis for determining the relationship between cutting speed and forward speed. Figure 3 illustrates the motion analysis of the cutter.
The relationship between the cutter speed and displacement is shown in Equation (3):
x 2 r 2 + V x 2 r 2 ω 2 = 1
In the equation, x represents cutter displacement(m), r represents crank radius (mm), Vx represents cutter speed (m/s), and ω is the crank angular velocity(rad/s).
This equation is an ellipse equation, indicating that the speed at any point on the cutter changes according to the elliptical variation law. Therefore, when x = 0, i.e., when a point on the cutter edge is at the midpoint positions C or D, the speed Vx reaches its maximum value, πrn/30 × 10−3 (m/s). When x = ±r, i.e., when a point on the cutter edge is at the two extreme positions E or F, the speed Vx reaches its minimum value, 0 m/s. As noted above, the cutter speed is variable, so the average cutter speed Vp is taken as the cutting speed, i.e.,
V p = S t × 10 3 = n S 30 × 10 3 = r n 15 × 10 3
In the equation, Vp represents average cutter speed(m/s), S represents cutter cutting stroke (mm), t represents time required for the cutter to complete one cutting stroke (s), r represents crank radius (mm), and n is the crank speed (r/min).
The cutting stroke is an important parameter for analyzing the cutter speed and cutting profile. Its value is generally the same as the width of the moving blade’s edge. In this experimental prototype, the value is 50 mm.
(2)
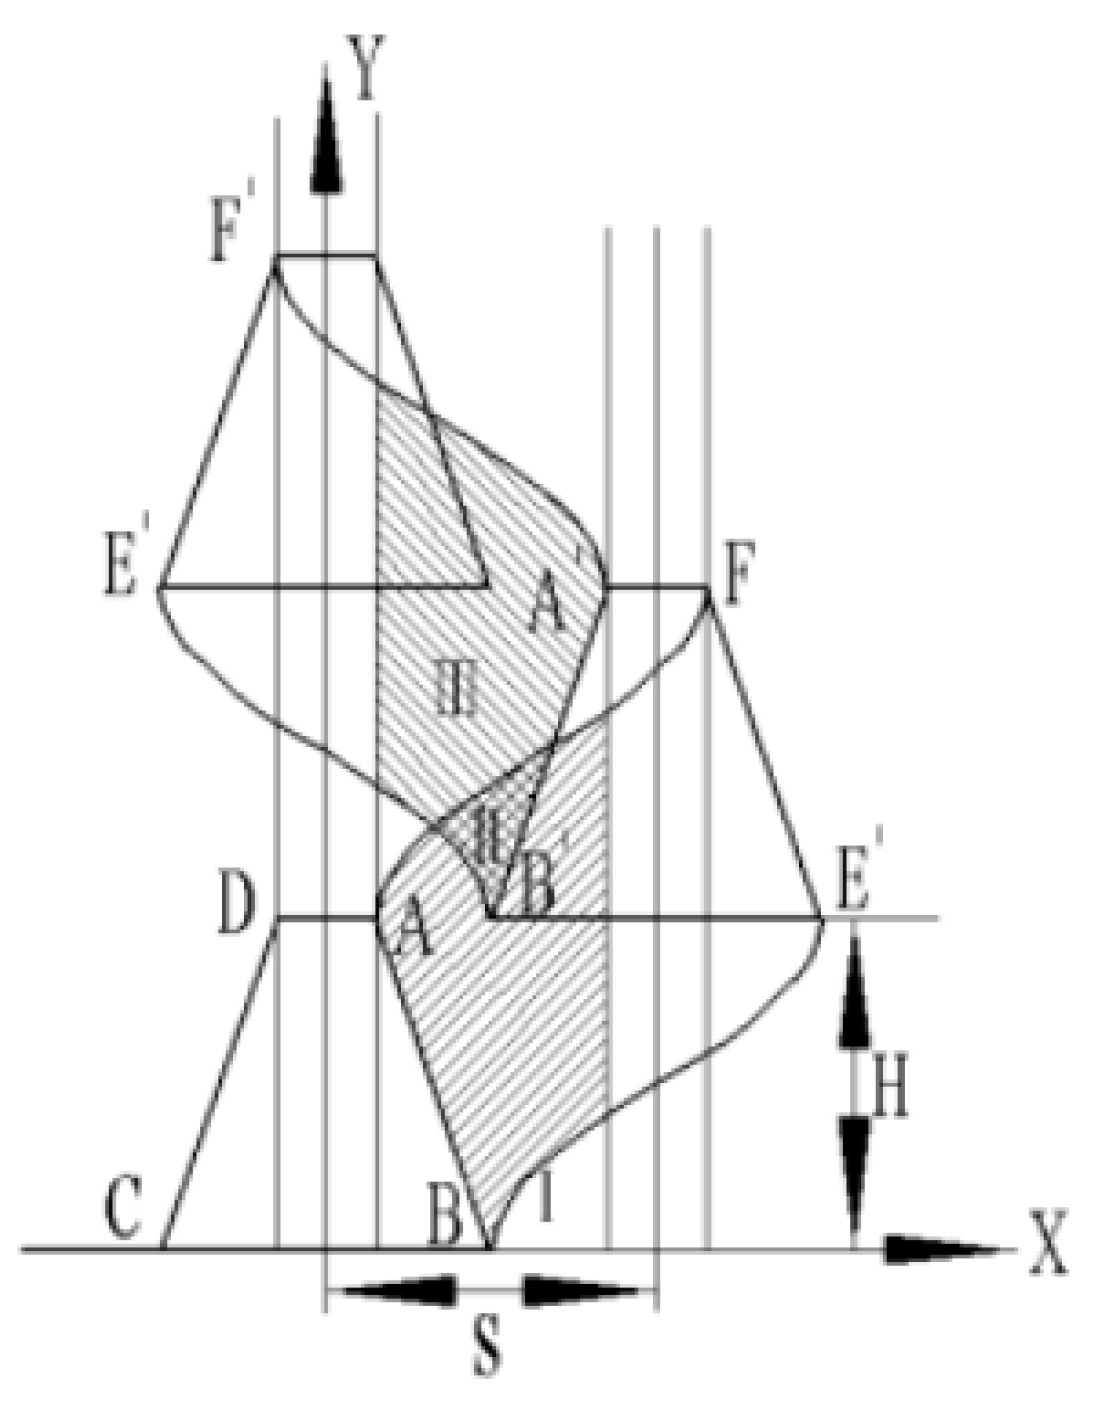
Cutter Cutting Diagram
The cutter’s motion relative to the machine is a reciprocating lateral movement. However, relative to the ground, it is the combination of the reciprocating lateral movement and the straight-line forward movement. Therefore, the cutter’s trajectory is determined by both the cutting speed Vp and the forward speed Vm, generally represented by the cutter advance distance H:
H = V m t = 30 V m n × 10 3
Solving with Equation (4) yields
H V m = S V p = 30 × 10 3 n
The cutter-to-machine speed ratio β is used to represent this relationship, i.e.,
β = V p V m = S H
β has a significant impact on cutting quality, so determining the relationship between Vp and Vm by specifying β is crucial. Typically, the cutting profile is plotted to obtain the motion trajectory of the moving blade, analyze the cutter’s motion pattern, and determine the β value. According to the Agricultural Machinery Design Handbook [26], the reasonable range for β is generally between 0.8 and 1.2. However, due to the high planting density of industrial hemp for fiber use, the β value range is set between 1 and 1.2. Figure 4 shows the cutting profile when β is set to 1.
(3)
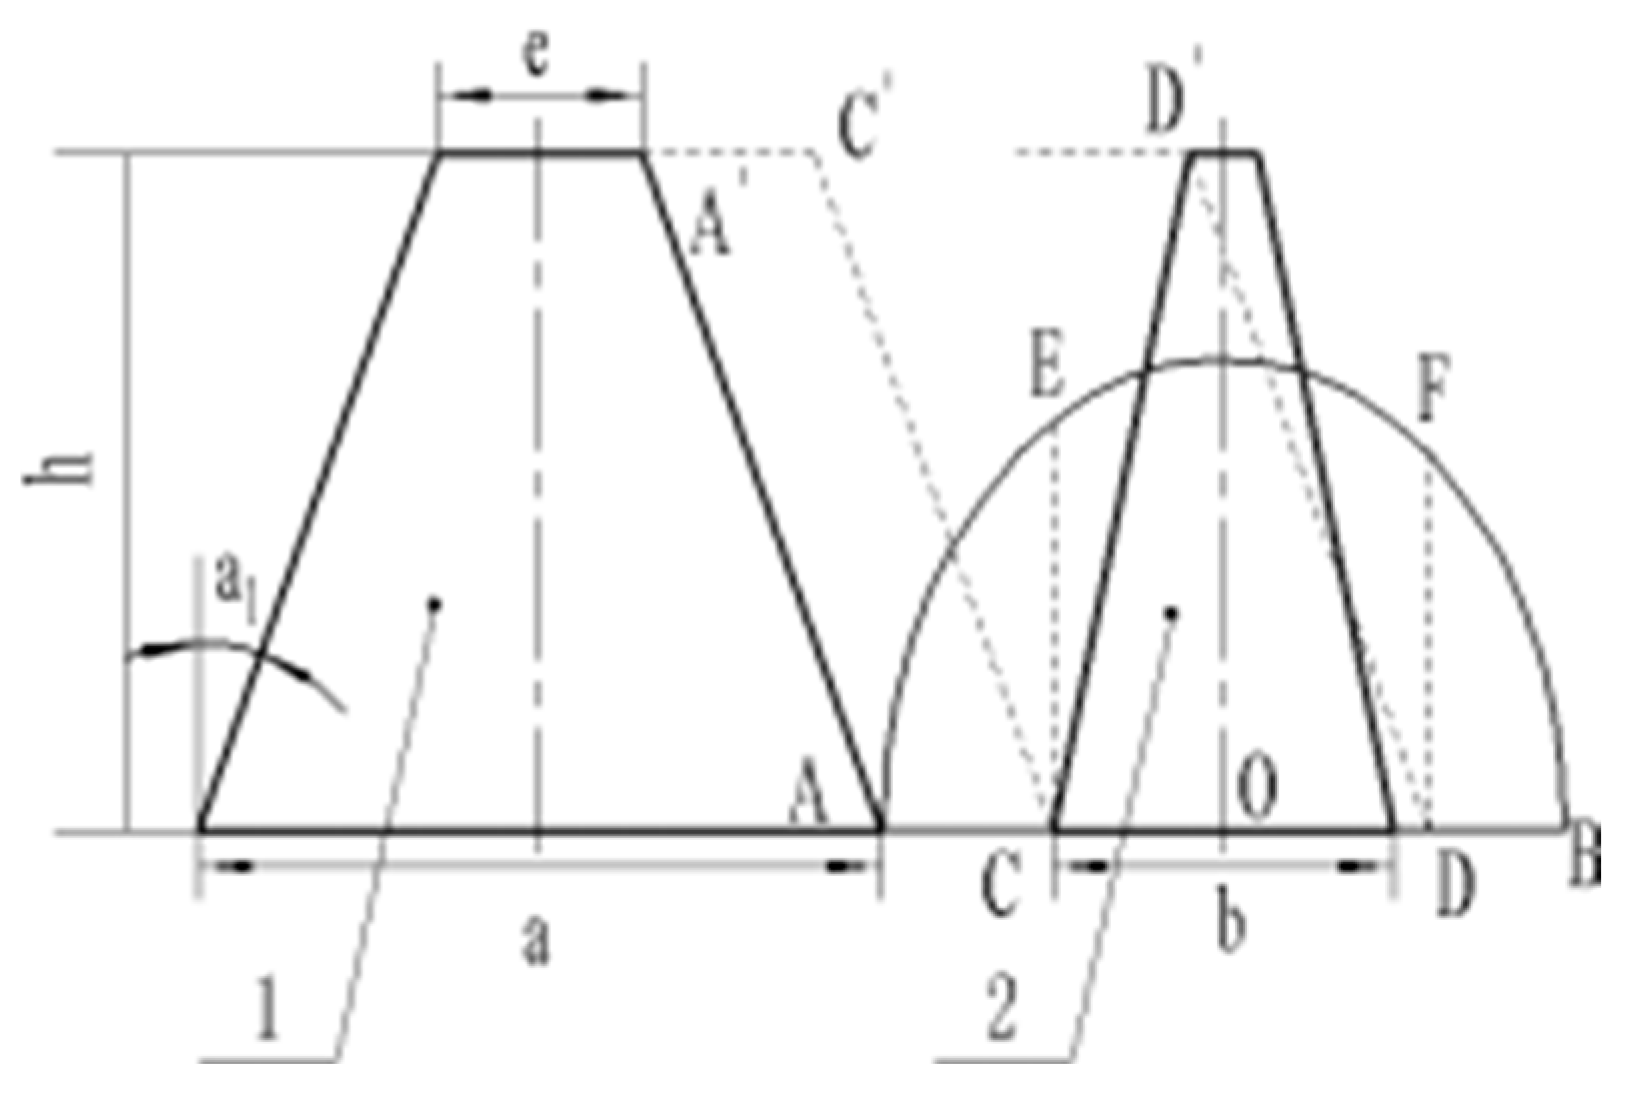
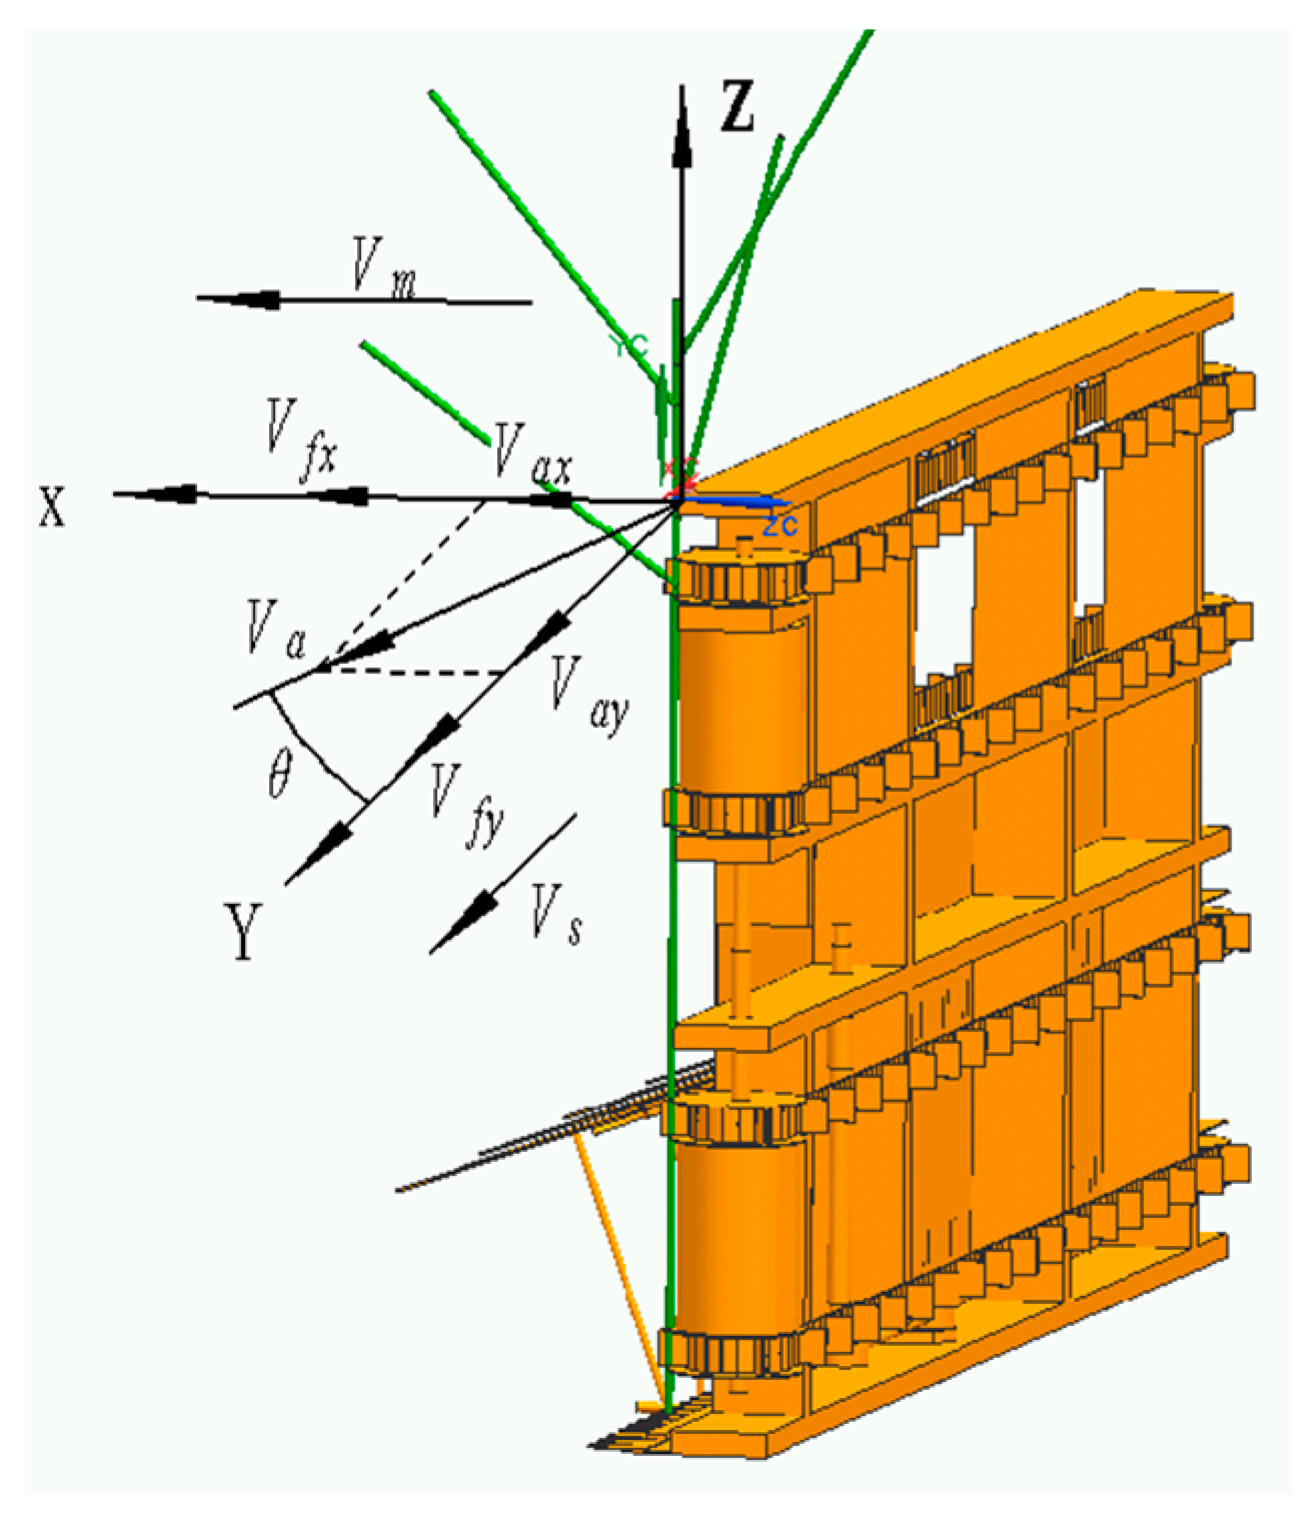
Theoretical Analysis of Cutting Speed
As mentioned above, the loading speed in the laboratory shear mechanics tests is far from the actual field working speed, but the work consumed to cut a single stalk is the same. Therefore, power consumption is used as the research focus to calculate the cutting speed of a single stalk during actual field operations.
W = 0.479105 + 0.001628 X 1 + 0.080724 X 2 + 0.192 X 3 + 0.007551 X 4
In the equation, W represents cutting power consumption (J), X1 represents cutting speed (m/s), X2 represents stalk diameter (mm), X3 represents cutting time (s), and X4 is stalk moisture content (%).
From the experimental data above, it can be seen that when the cutting speed is 0.5 cm/s, the stalk diameter is 10 mm, the moisture content is 42.54%, the cutting time is 2.88 s, the cutting force is 122.20 N, and the power consumption reaches its maximum value of 1.22 J. When the cutting speed is 13 mm/s, the stalk diameter is 5 mm, the moisture content is 35.86%, the cutting time is 0.45 s, the cutting force is 50.37 N, and the power consumption reaches its minimum value of 0.25 J. Equations (9) and (10) represent the relationships between cutting time and cutting speed when the power consumption is at its maximum and minimum values, respectively:
W m a x = 0.64935454 + 0.001628 V + 0.192 t = 1.22
W m i n = 0.19529386 + 0.001628 V + 0.192 t = 0.25
In the equation, Wmax represents maximum power consumption (J), Wmin represents minimum power consumption (J), V represents cutting speed (m/s), and t is the cutting time (s).
Through field measurements, the average planting density of industrial hemp for fiber use in Zhenxiang Town is 347 plants/m2, with a row spacing of 10 cm, resulting in an average plant spacing of 34.7 plants/m. To ensure that each plant can be cut smoothly, the average time for cutting plants in 1 s under different forward speeds was calculated, and this time was substituted into the equation to obtain the cutting speed. Considering the poor uniformity of plant spacing in industrial hemp for fiber use, an increment of less than 20% was added to the calculated cutting speed to determine the theoretical maximum cutting speed. When the maximum forward speed is 3.8 m/s, under this condition, 132 plants are cut, with a cutting time of 0.0076 s per plant. The cutting speed is calculated as 3.5 m/s, and a 14% increase brings it to 4.0 m/s. The minimum forward speed is 0.3 m/s, with 11 plants cut, and the cutting time per plant is 0.0909 s. The cutting speed is calculated as 0.3 m/s, and a 17% increase gives the minimum cutting speed as 0.35 m/s. Therefore, the cutting speed range is obtained as 0.35–4.0 m/s, corresponding to a forward speed range of 0.3–3.8 m/s.
(4)
Cutting Speed Diagram
As shown in Figure 5, according to field operations, when the crank speed n is less than 600 r/min, cutting difficulties occur. Therefore, the minimum speed is set to 700 r/min. When the crank speed n exceeds 1400 r/min, severe vibration occurs on the cutting platform, so the maximum speed is set to 1300 r/min. Therefore, using Equation (11), the cutting speed range is calculated to be 1.9–3.7 m/s, and the forward speed range is 1.7–3.5 m/s.
V p = 2.7 × 10 3 n

2.3. Analysis of Conveying Component Operating Parameters

2.3.1. Conditions for No Clogging During Plant Conveying

During the operation of the harvesting machine, it is essential to ensure that the conveyor belt’s delivery volume is no less than the cutting volume. Otherwise, the conveyor will accumulate too many plants, causing a blockage, which could damage the machine in severe cases [27,28]. The delivery volume depends on the conveyor speed (Vs), and the cutting volume depends on the forward speed (Vm). Therefore, this study introduces the conveyor speed ratio (λ) to express the conveyor speed, as shown in Equation (12).
λ = B V m k h
In the equation, λ represents conveyor speed ratio, Vs represents conveyor speed (m/s), Vm represents cutting speed (m/s), B represents cutting width (m), h represents conveyor finger length (m), and k is the stalk accumulation coefficient.
The stalk accumulation coefficient refers to the ratio of the accumulated area in front and behind a unit number of harvested fiber hemp plants. After calculation, the result is 36.69. Other parameters include a cutting width B of 2.2 m and a conveyor finger length h of 0.04 m. The final result yields a conveyor speed ratio λ ≥ 1.5.

2.3.2. Analysis of Plant Falling Process

The falling process of the plant after it is conveyed to the discharge point is a key factor in determining the uniformity of the laying process [29,30]. When analyzing the falling process of a single plant, without considering the connecting force between adjacent plants, it can be seen that when the plant is still upright and about to fall, it is influenced by the speed in the machine’s forward direction (Vm), the conveyor’s transport direction speed (Vs), the speed of the plant guide in the transport direction (Vfy), and the speed of the plant guide in the forward direction (Vfx). The angle between the conveyor speed (Vα) and the transport direction is θ, as shown in Figure 6.
The actual falling speed of the plant is shown in Equations (13)–(15):
V α x = V f x sin θ + V m
V a y = V f y sin θ + V s
V α = g t 1
In the equations, Vax represents the forward direction component of the plant’s falling speed (m/s), Vay represents the conveyor direction component of the plant’s falling speed (m/s), Va represents the actual falling speed of the plant in the falling direction (m/s), g represents gravitational acceleration (m/s2), and t1 is the time it takes for the bottom of the plant to hit the ground during the falling process (s).
When an object falls from an upright position, it generally undergoes a rotational motion around a fixed axis. Assuming that the plant does not bounce after landing and performs rotational motion around a fixed axis upon landing, the schematic diagram is shown in Figure 7.
During the plant’s falling process, the plant’s gravitational potential energy is converted into kinetic energy. According to Figure 7 and the law of conservation of energy, the energy change in the plant during fixed-axis rotation is given by
1 2 J 0 ω 2 = m g h g sin α + 1 2 m ( V a x 2 + V a y 2 )
In the equation, J0 represents the moment of inertia of the plant (kg × m2), ω represents the angular velocity of the plant during fixed-axis rotation (rad/s), m represents the mass of the plant (kg), hg represents the height of the plant’s center of mass (m/s2), and α is the laying angle of the plant (°).
The laying angle is related to the velocity component in the direction of the conveyor during the plant’s fall, so Equation (17) can be derived as follows:
α = arctan V a y t 2 2 h g
According to Equations (13) and (16), when the forward speed Vm increases, the plant falls in the forward direction, the angle α increases, and sin(α) decreases, leading to a smaller laying angle, which affects the laying quality. Therefore, the forward speed should not be too high.
According to Equations (14) and (16), when the conveyor speed Vs increases, the plant falls towards the conveyor speed and the angle α decreases. Based on the characteristics of the cosine function, when the angle is between 0° and 90°, the sine value and the angle show an inverse correlation. Therefore, it is difficult to determine the change in Vax. According to Equations (14) and (17), an increase in Vs leads to an increase in Vax and a decrease in t2. To maintain an ideal laying angle, the conveyor speed should be moderate, avoiding values that are too high or too low.

2.3.3. Final Conveyor Speed Analysis

In summary, the minimum value of the conveyor speed ratio is found to be 1.5. However, due to the high and uneven planting density of industrial hemp, and the possibility of belt or tire slippage when operating in rainy or other harsh conditions, this value requires further consideration. Based on field tests, it was observed that when the conveyor speed ratio falls below 1.7 or exceeds 2.6, the laying angle increases abruptly. Therefore, the minimum and maximum values for the conveyor speed ratio are set at 1.9 and 2.5, respectively.

2.4. Simulation Analysis of the Cutting Platform of the Industrial Hemp Harvester

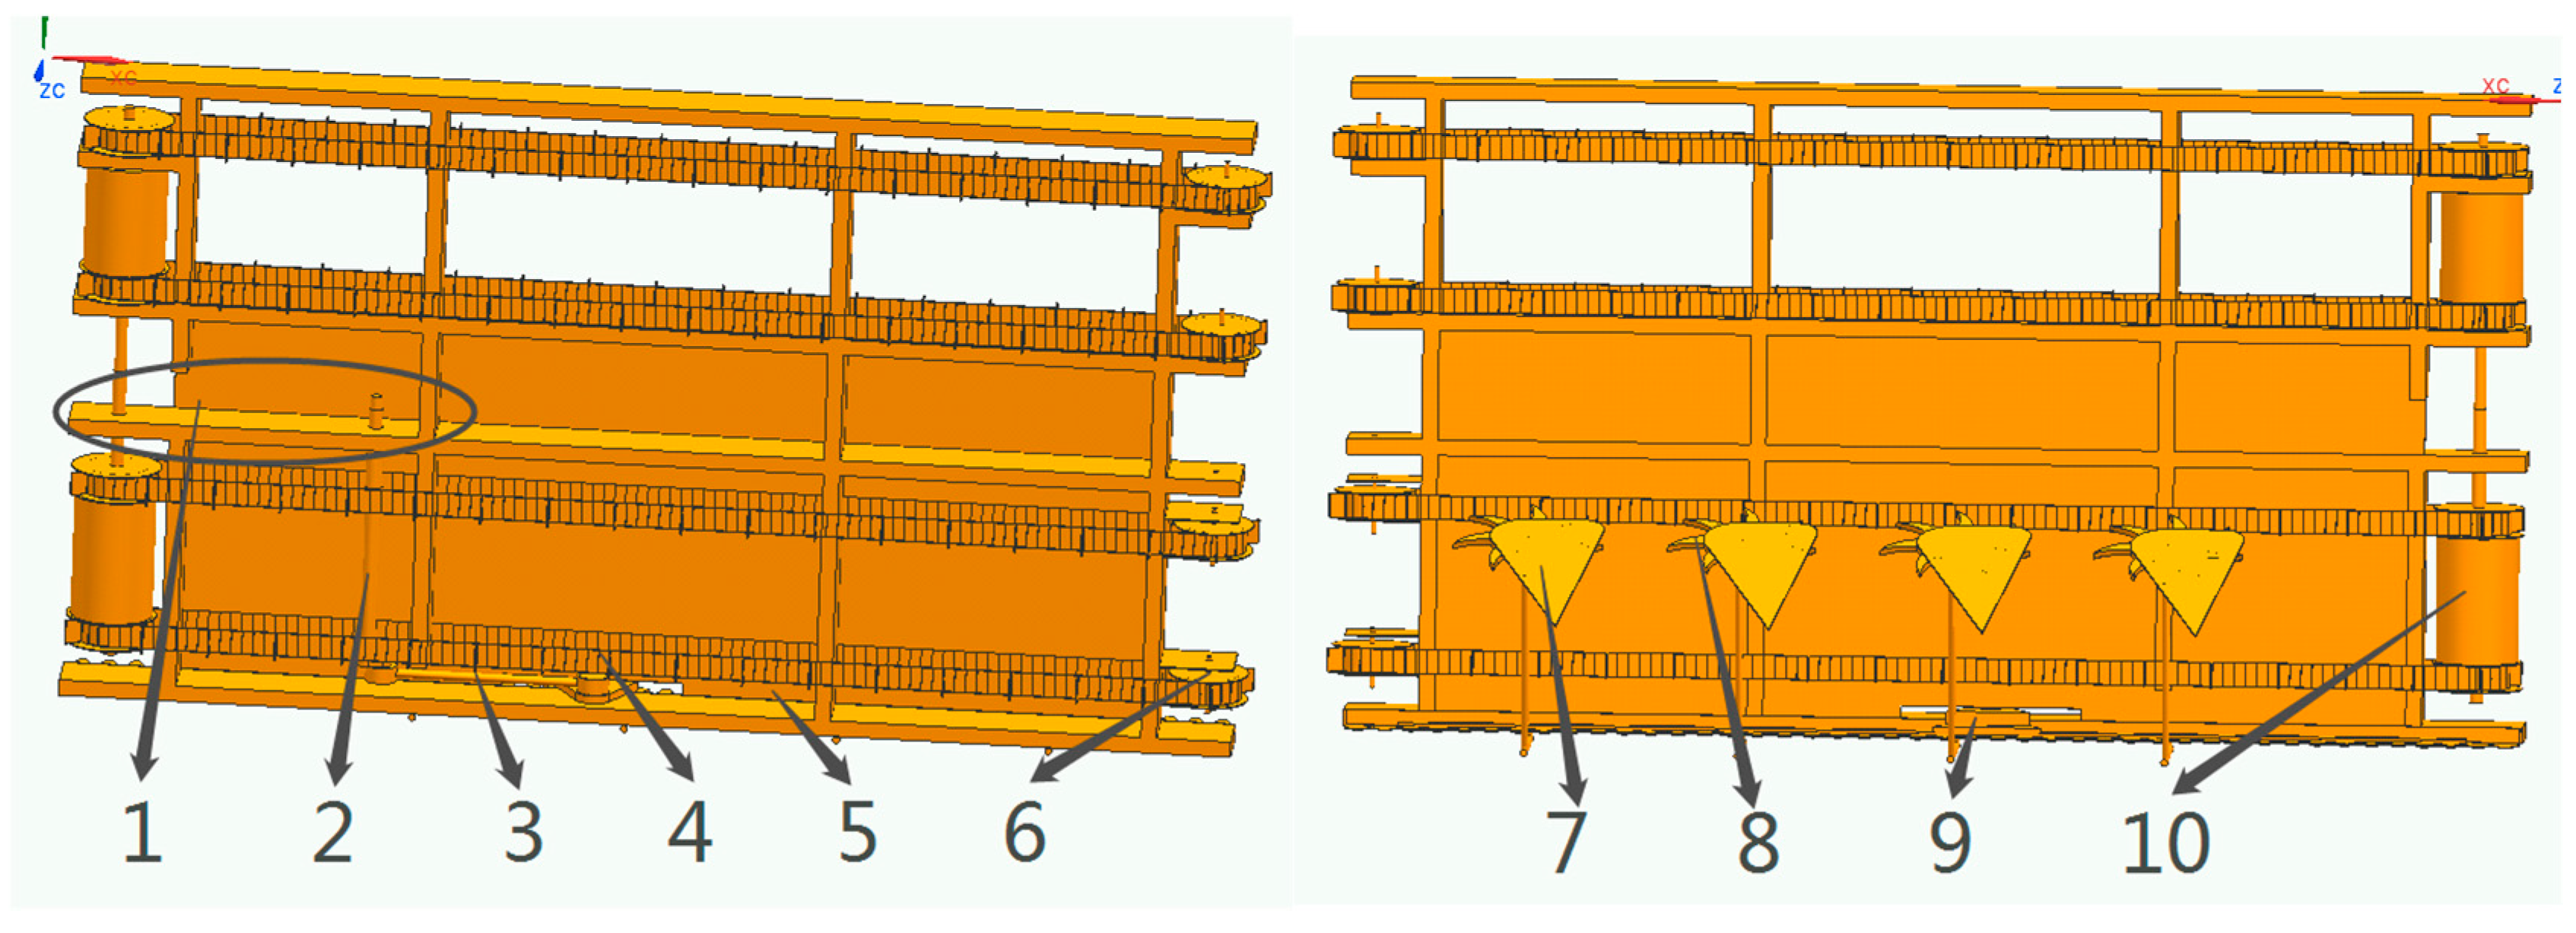
2.4.1. Overall Machine Modeling

This design uses UG for 3D modeling of the entire machine, as shown in Figure 8.
In the figure, the drive shaft 2 is located at the gearbox installation point. According to the working principle, the gearbox is responsible for driving the drive shaft, which in turn drives the entire machine. Since modeling the gearbox is relatively complicated, the rotation of drive shaft 2 is defined as the driving component for the whole machine. The chain drive 1 can be created as a standard and complete system in ADAMS 2018. However, modeling the chain and sprocket in UG 10.0 is similarly complex, so they have not been modeled. The drive shaft 10 consists of a shaft body and a protective casing. To simplify modeling and simulation, they have been combined into one component.

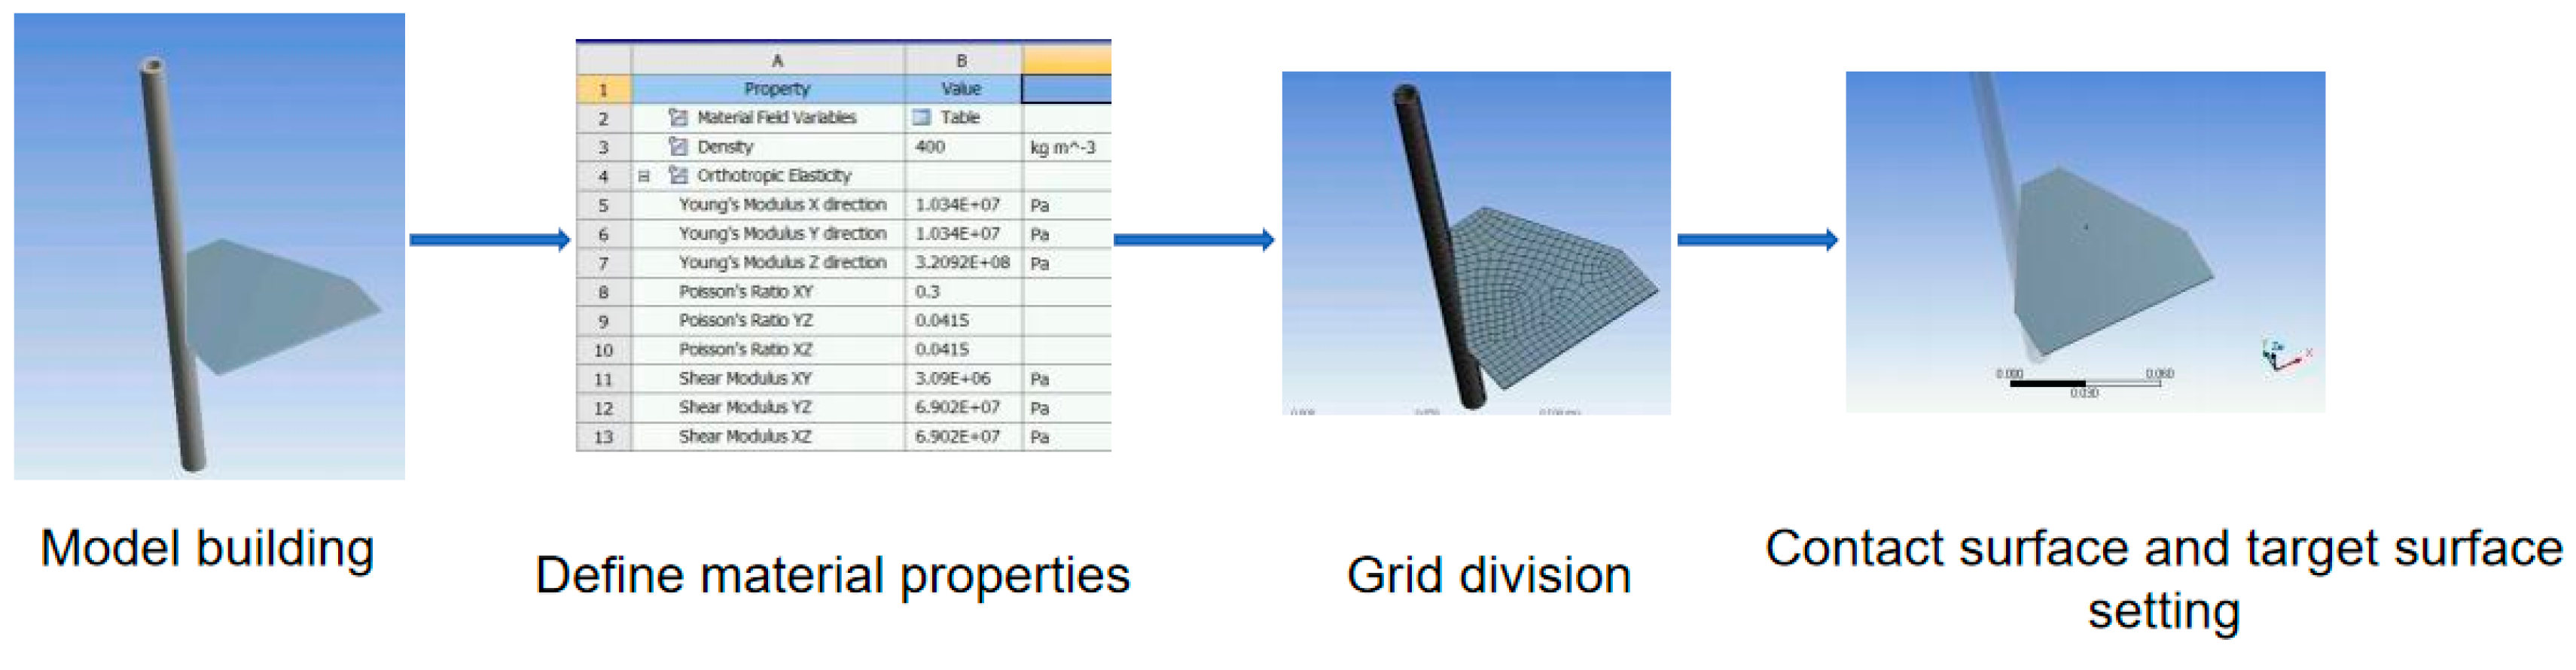
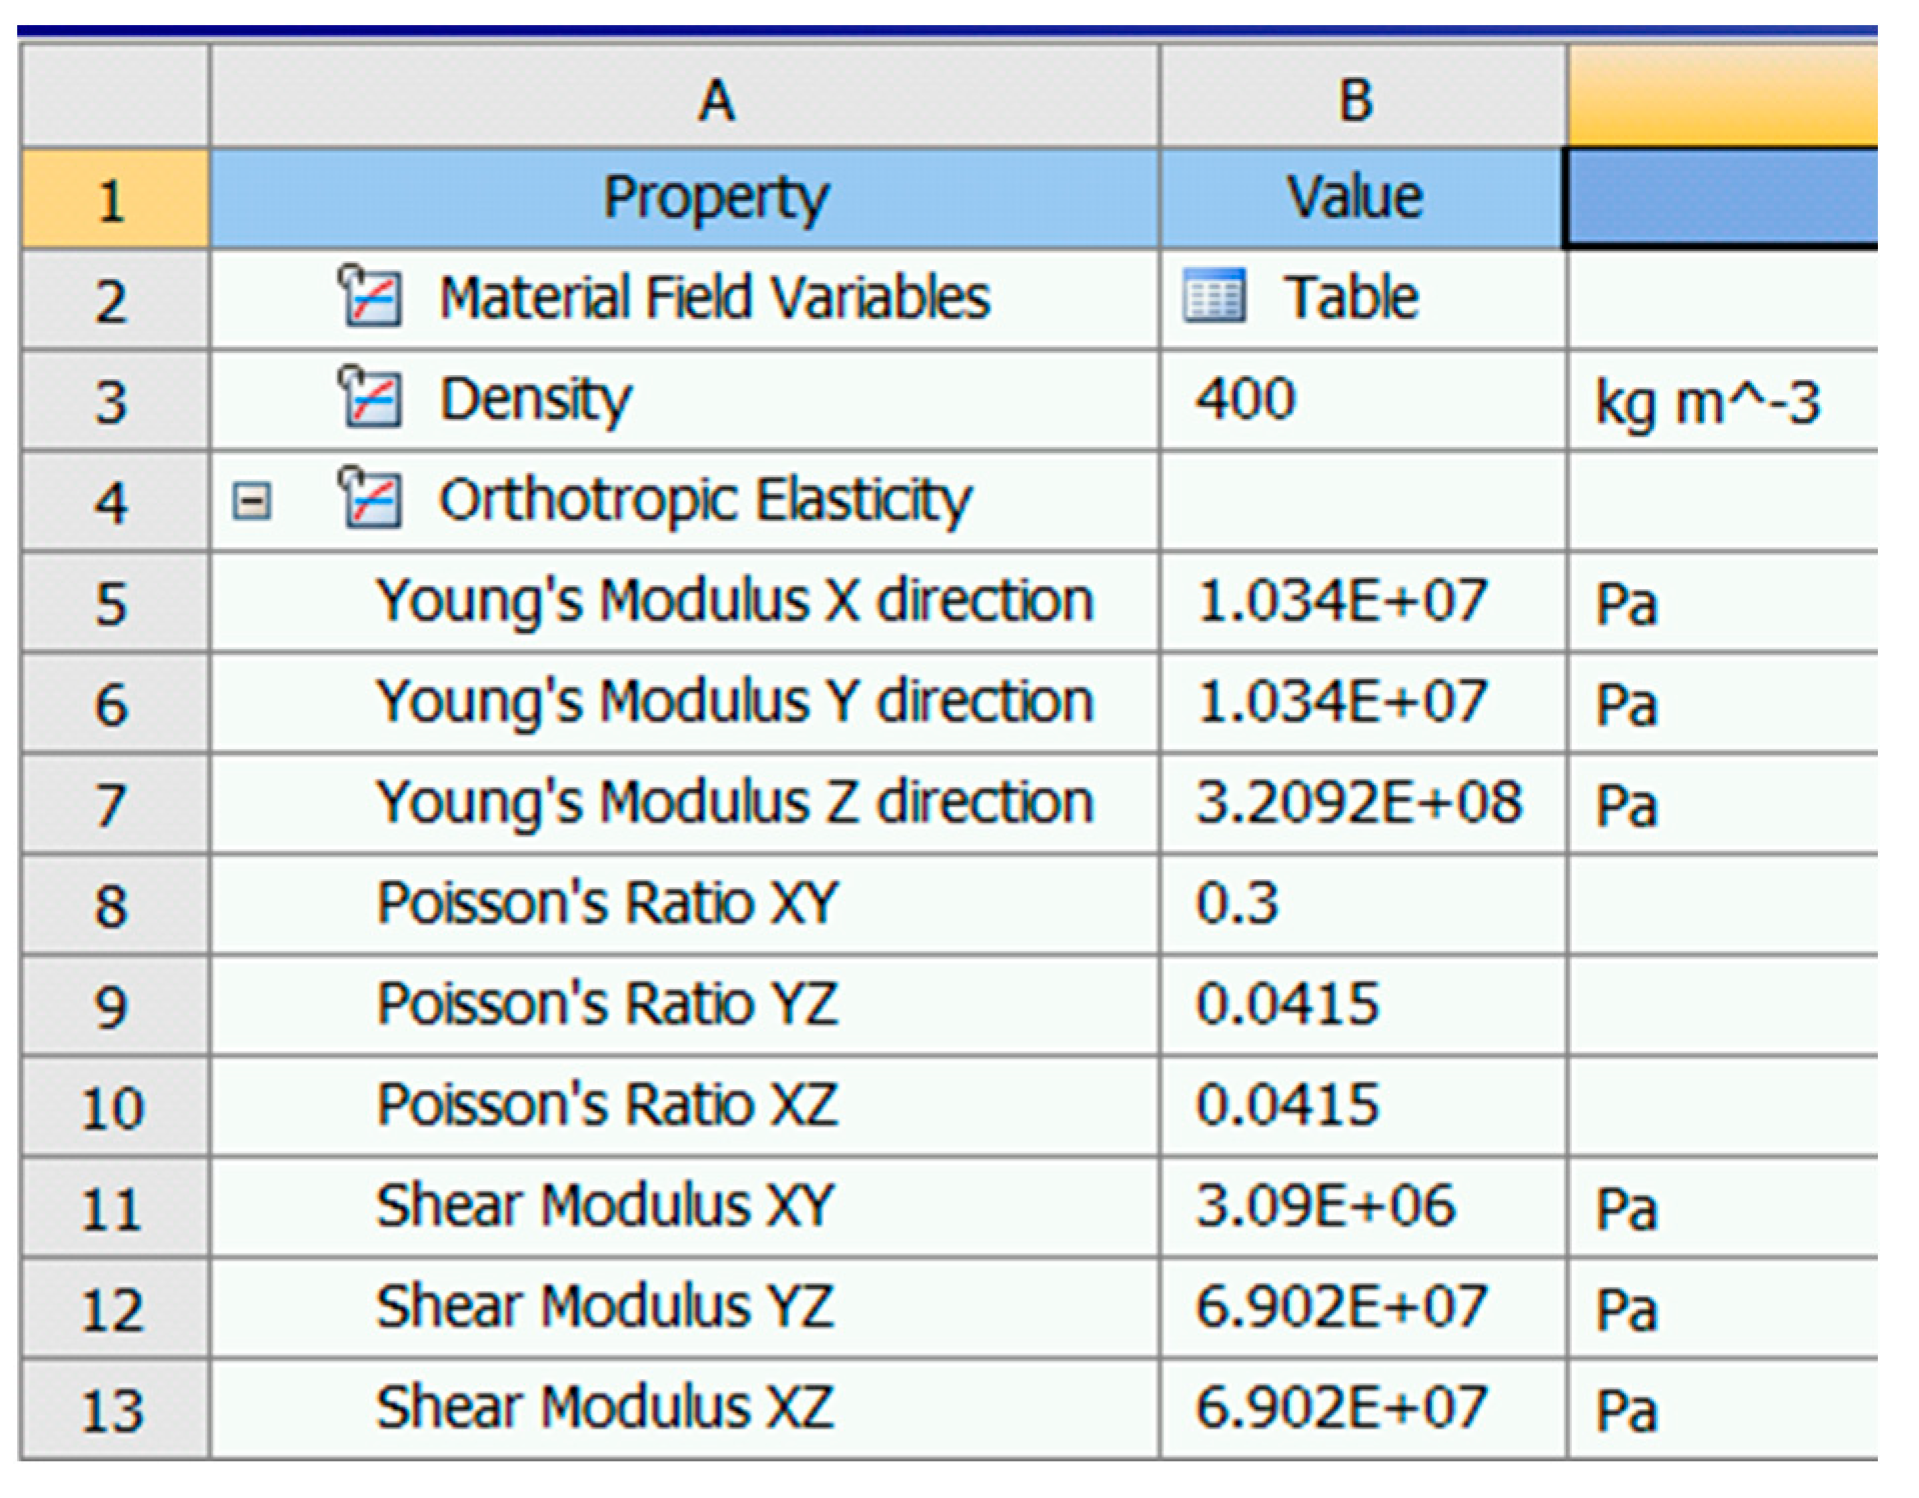
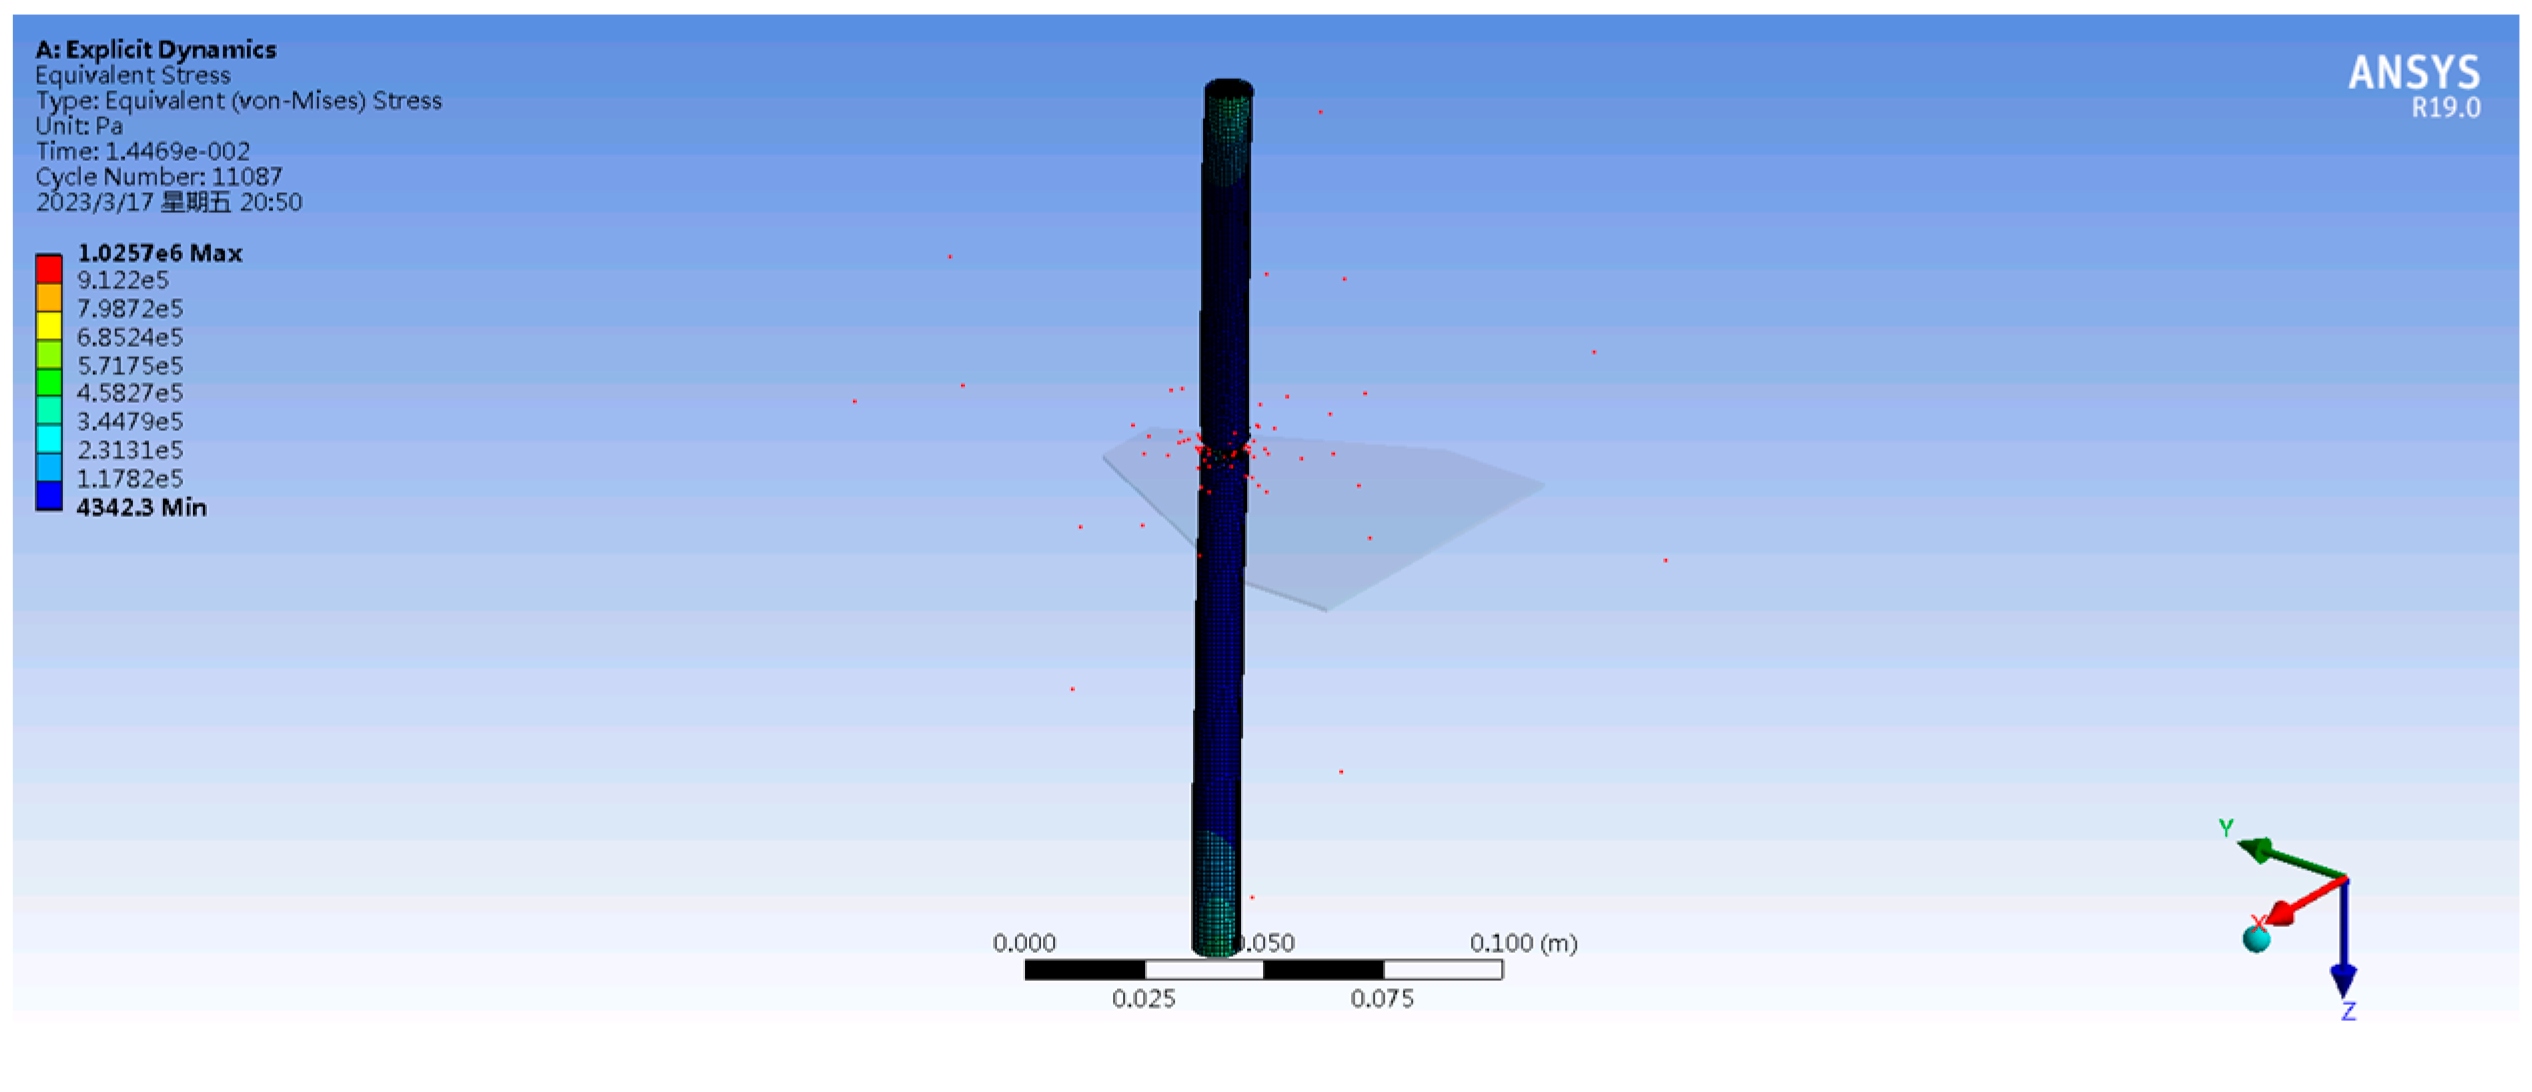
2.4.2. Simulation Analysis of the Industrial Hemp Plant Cutting Process

This section uses the Explicit Dynamics module in Workbench 19.0 to perform a dynamic analysis of the cutting operation. Explicit dynamics can analyze the stress changes in the impacted model when subjected to load or velocity impacts, which can cover most impact, cutting, and shear scenarios [31,32]. The preprocessing steps for simulation running using the software are shown in Figure 9. Figure 10 shows the material properties of industrial hemp plants.
Mesh division is critical for simulation accuracy. The plant, as a flexible body, should have a mesh density of 1 mm, while the blade, as the cutting body, should be defined as a rigid body with a smaller mesh density. The number of nodes generated is 17,854, and the number of elements is 12,097. From the previous text, the average cutting time for a single plant at cutting speeds of 1.9 m/s and 3.7 m/s is 0.0169 s and 0.0078 s, respectively, which are used as the simulation stop times.
Running the simulation, the stress maps of the cutting model at 1.9 m/s, 2.5 m/s, and 3.7 m/s can be obtained, as shown in Figure 11, Figure 12 and Figure 13. Analyzing the stress maps of the cutting model reveals that when the cutting speed is 2.5 m/s, the blade can just completely cut the plant, and the blade’s travel distance is moderate. Stress is only high at the cutting point, while stress is small and uniform at other positions, indicating that at this speed, the damage to the plant is minimal, maintaining its integrity.

2.4.3. Simulation Analysis of the Hemp Plant Transportation Process

In simulating the transportation process of hemp plants, the first step is to establish the flexibility model for the conveyor belt. Simulation software such as ADAMS 2018 has a flexible treatment module, but it is primarily used for analyzing rigid deformation and natural frequencies. Compared to previous studies, this research proposes decomposing the conveyor belt into small segments, connecting them with rotational pairs to simulate its motion and achieve flexible modeling. The length of each segment is set to 21 mm, and there are four types: straight edge and curved edge, with or without fingers. Transitional blocks are added to ensure precise assembly. The assembled conveyor belt consists of various segments. To prevent blocks with the same name in ADAMS from being recognized as the same component, the names are replaced after assembly. Figure 14 shows the model of the assembled conveyor belt.
In ADAMS 2018, the revolute joint needs to be applied to specific marker points. In this study, the revolute joint is required to be placed at the center of the common edge between two small blocks. Therefore, a circular passage is reserved during modeling to add the marker points, ensuring that the center of mass position is not affected, as shown in Figure 15.
Next, a chain drive system needs to be created and model constraints applied. The fiber industrial hemp reaper has four conveyor belts, each of which is wound around the drive shaft and driven shaft at the same shaft diameter and operates synchronously. Therefore, all four conveyor belts move at the same speed. In this study, only the speed variation of one conveyor belt is analyzed. This paper uses the built-in module of ADAMS 2018 to create a complete chain drive system, as shown in Figure 16.
The main types of kinematic pairs applied in the model are rotational pairs, translational pairs, and fixed pairs, which are used to simulate the movement of the conveyor belt and cutting mechanism, as well as to fix the entire machine. The specific locations and quantities of these pairs are shown in Table 2.
This paper mainly studies the optimal operating parameters for the fiber hemp harvester, which are primarily influenced by the forward speed, cutting speed, and conveyor speed ratio. The forward speed and cutting speed can be controlled by the tractor, whereas adjusting the conveyor speed ratio is cumbersome and requires changes to the chain drive system. Therefore, this chapter uses ADAMS 2018 to establish a rigid–flexible coupling model for the fiber hemp harvester, exploring the speed variation of the flexible conveyor belt under different chain drives to determine the optimal combination of operating parameters.
(1)
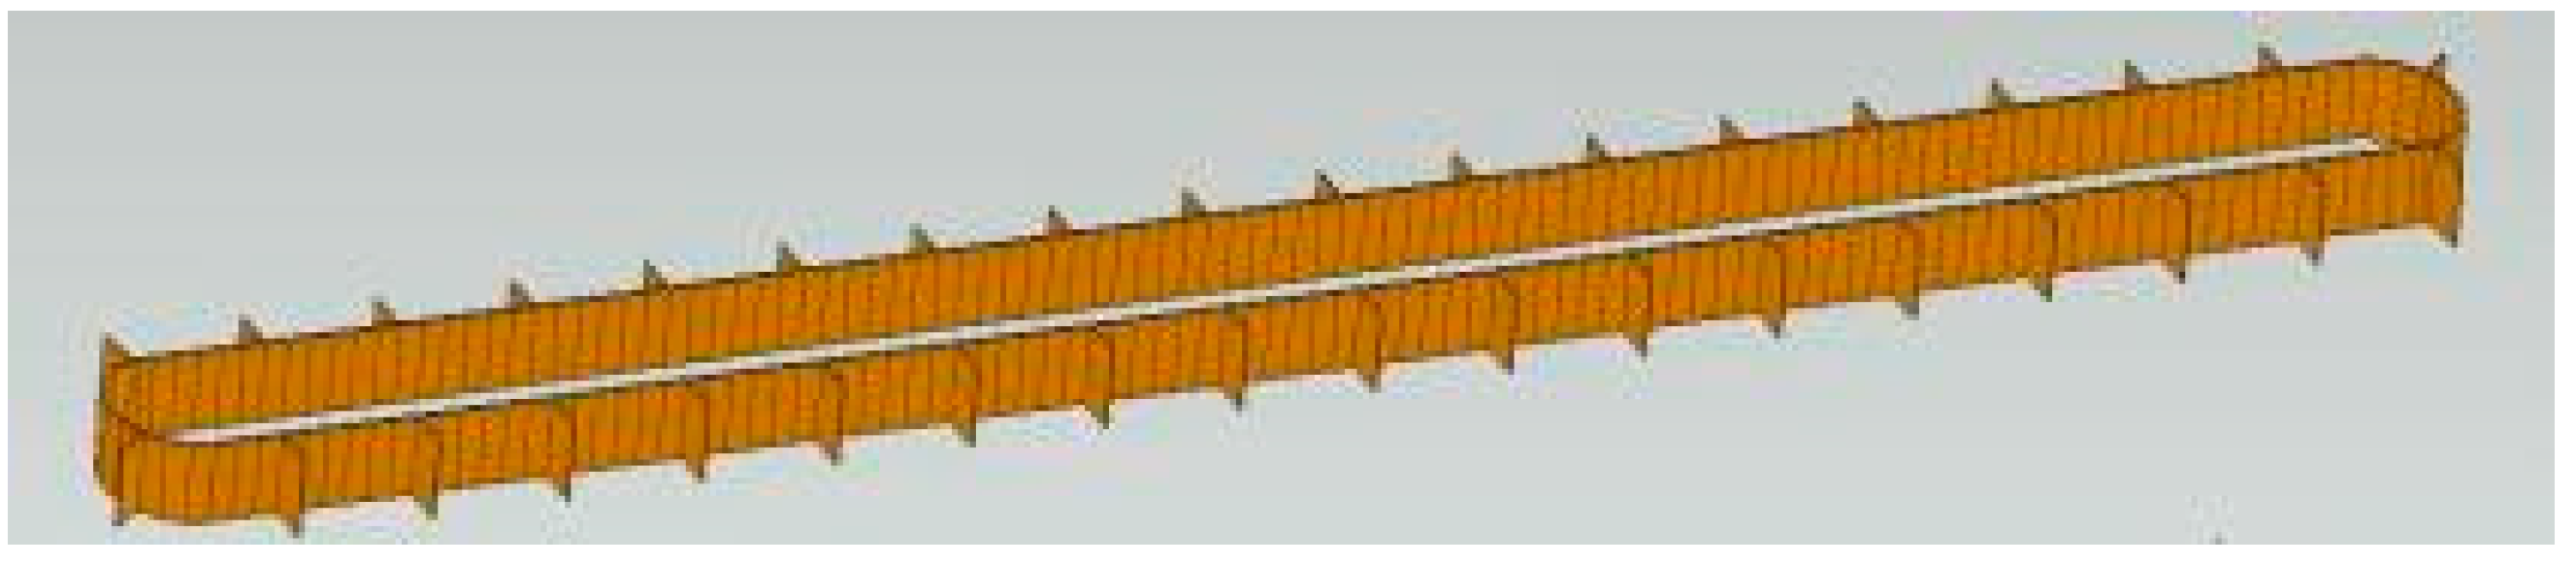
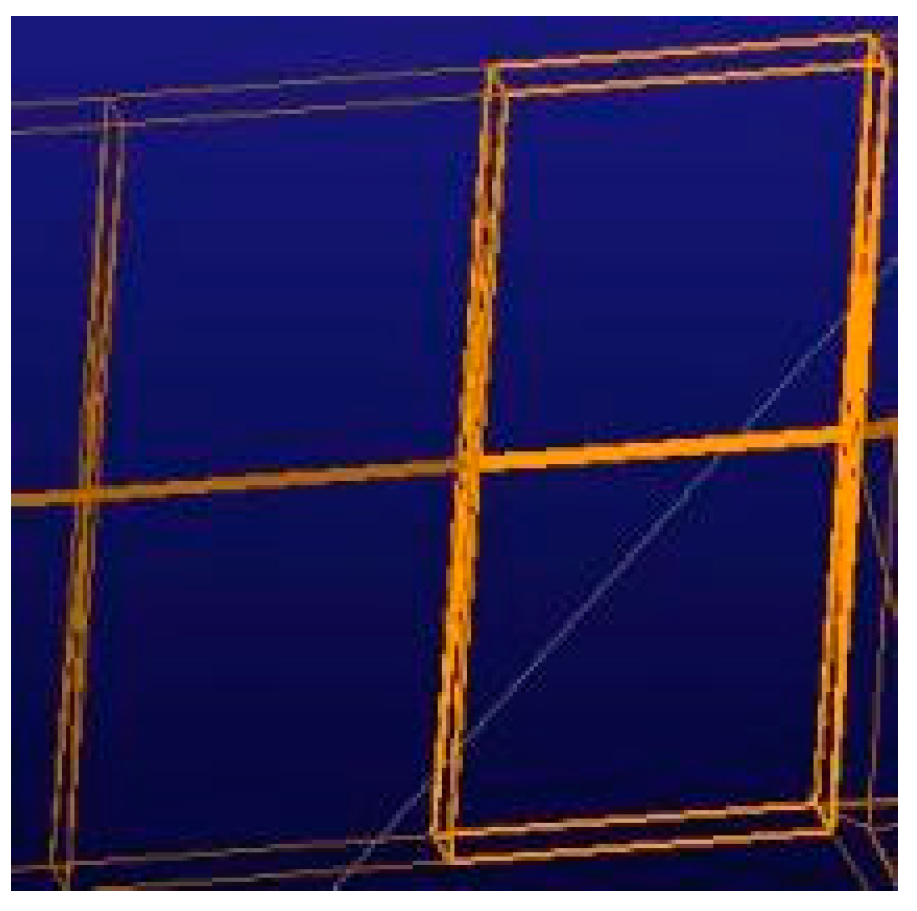
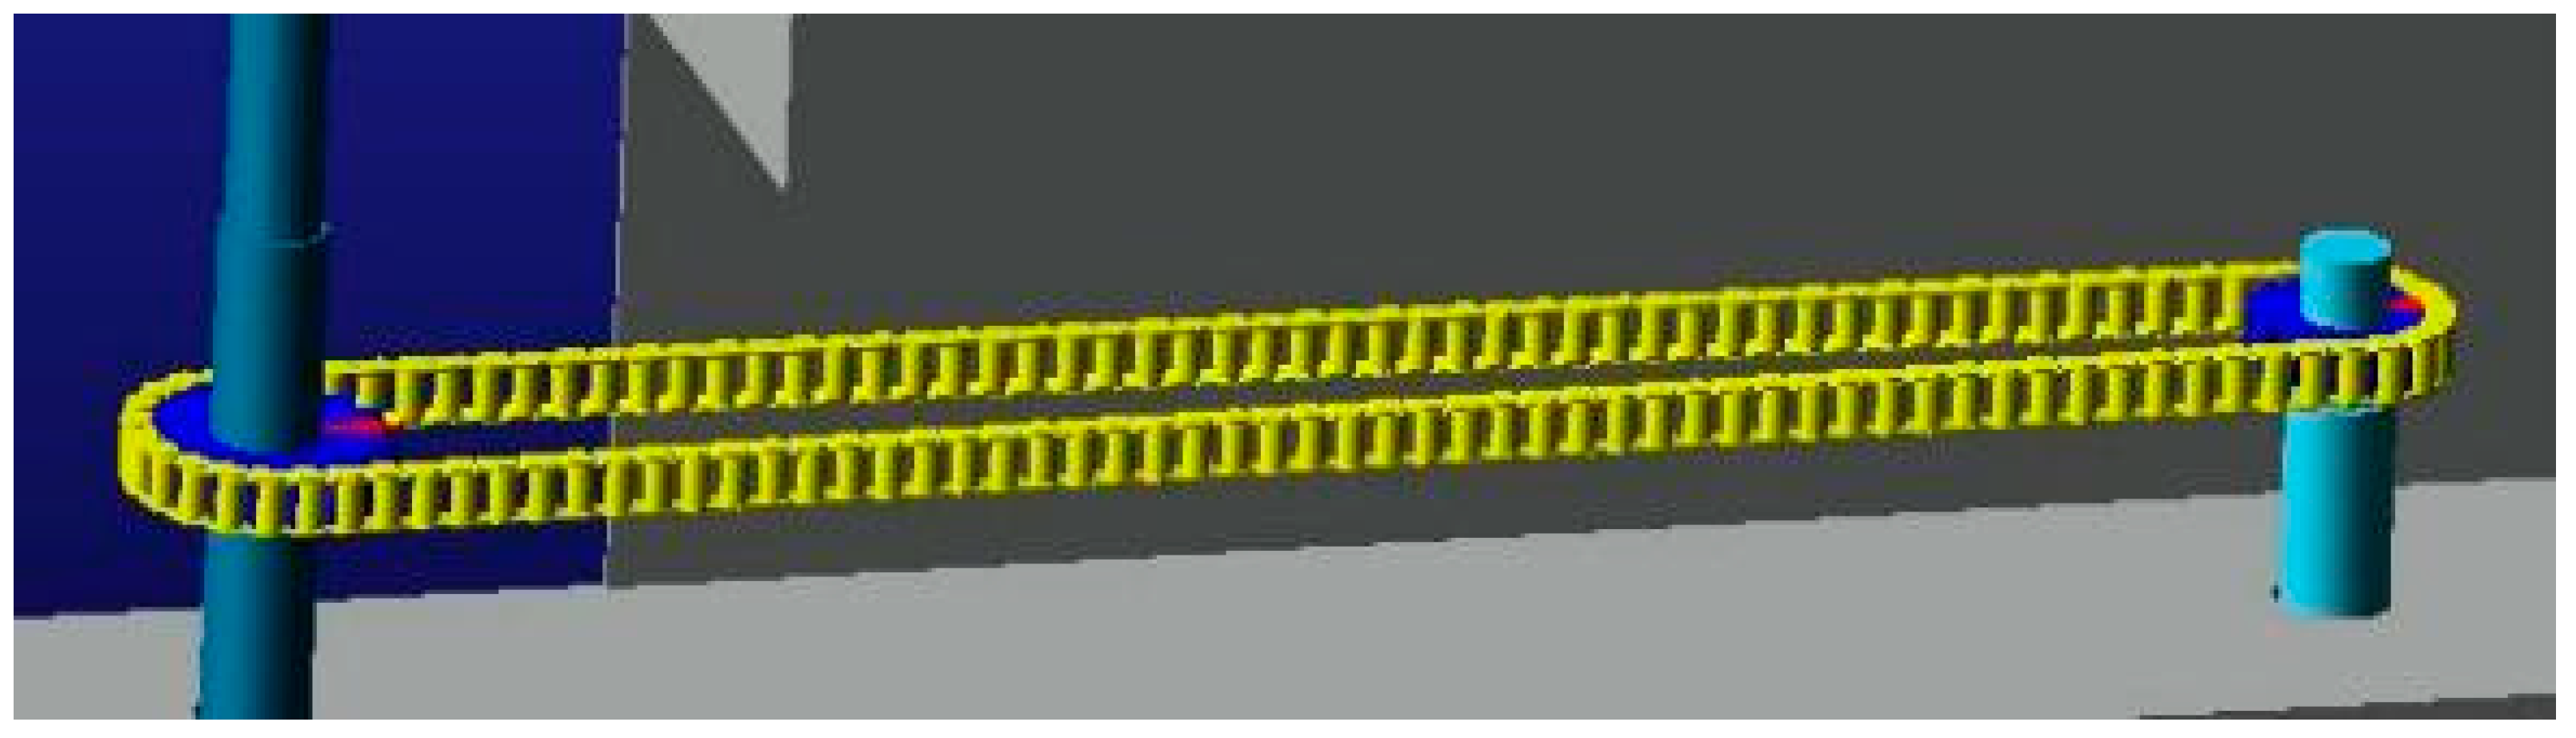
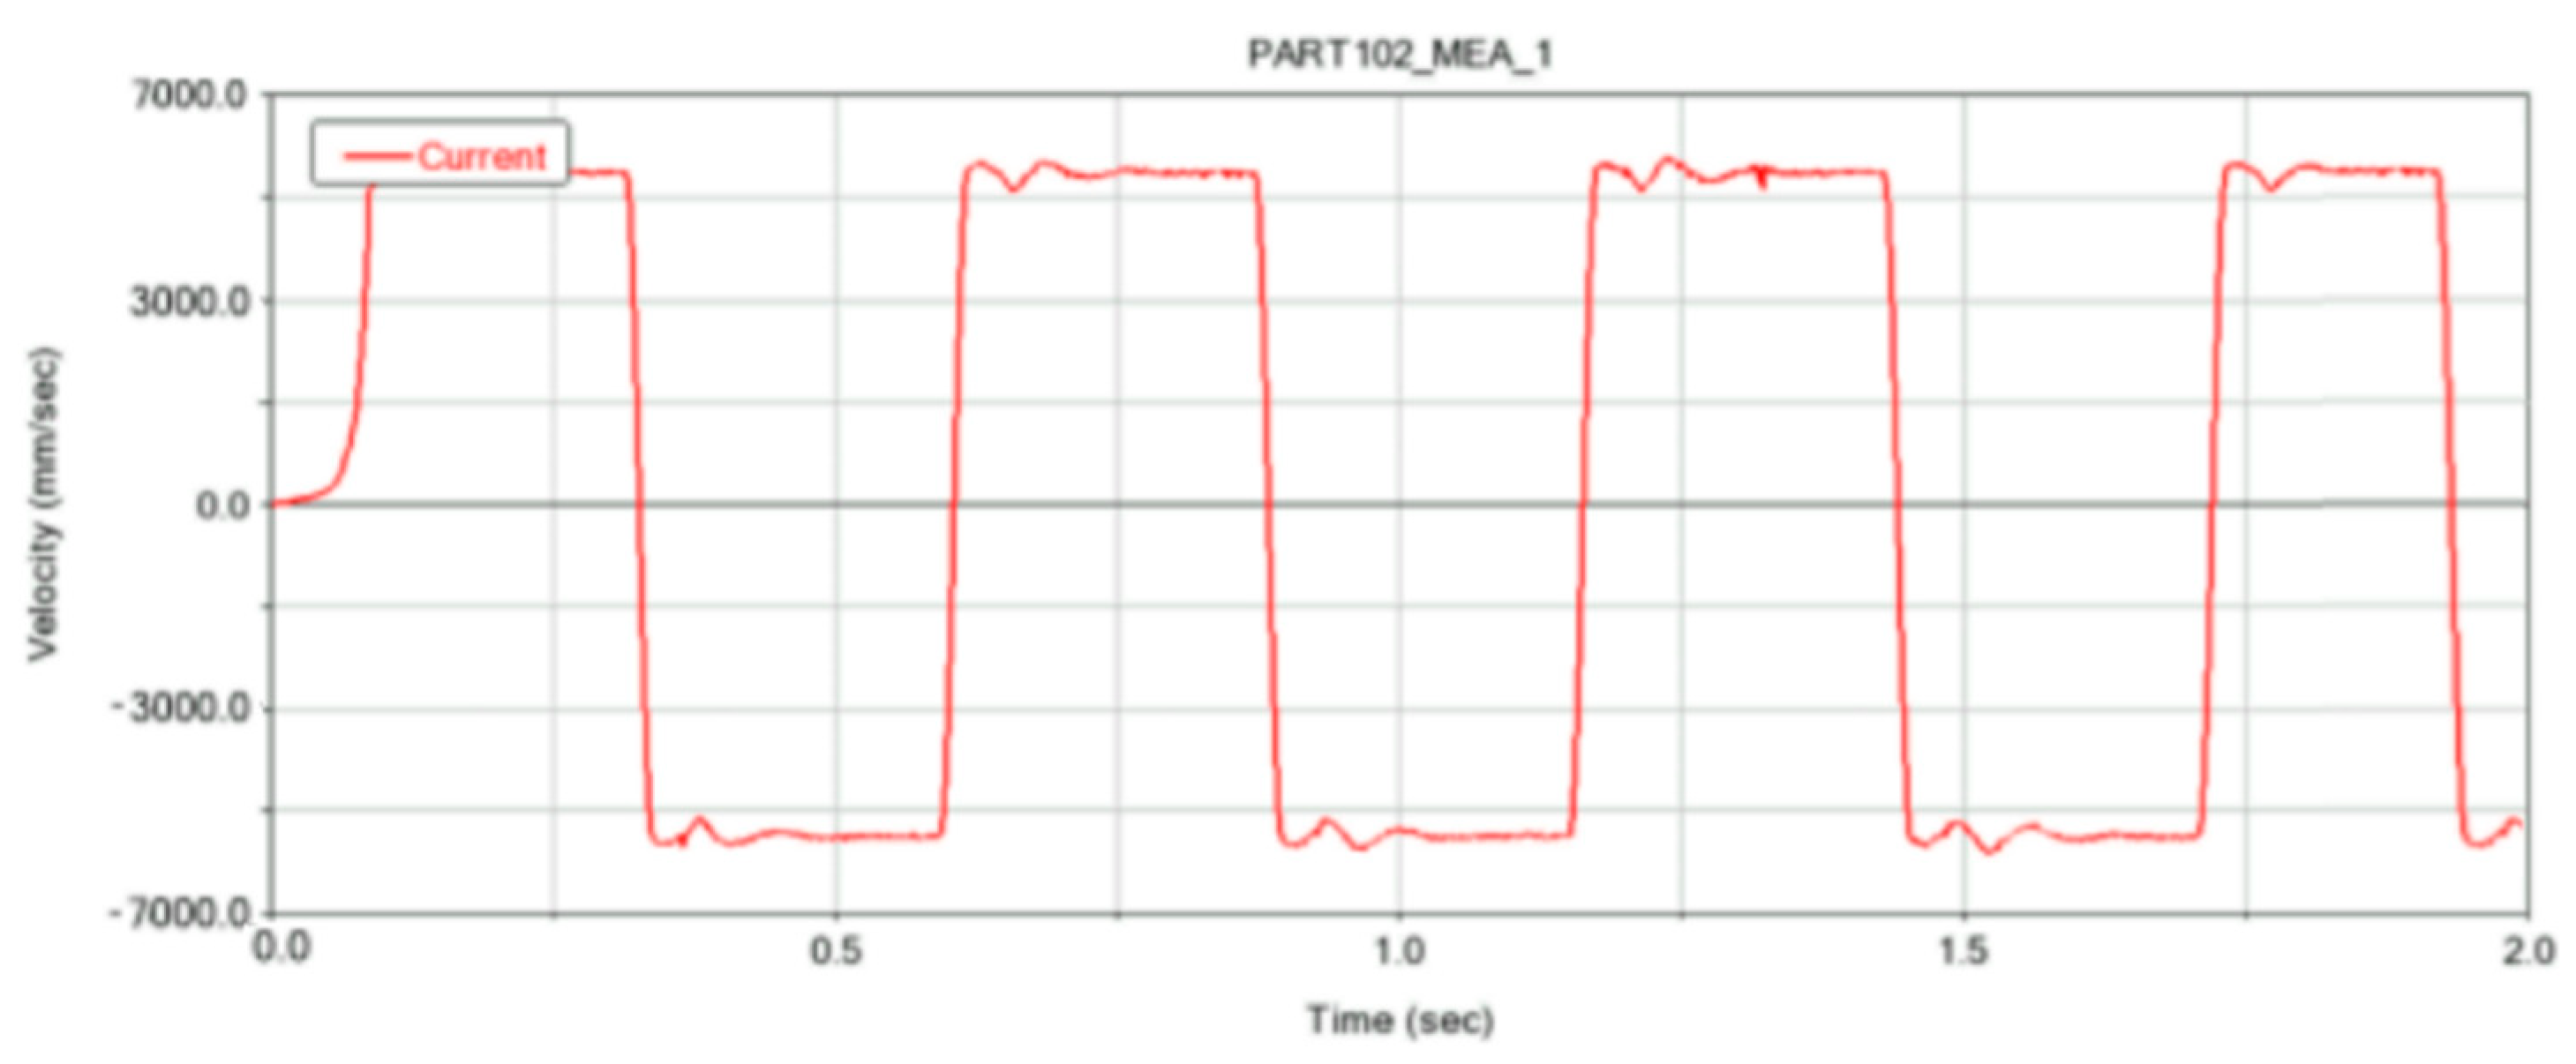
Conveyor Motion Simulation and Analysis
As mentioned above, the conveyor belt is composed of several small pieces. Therefore, by measuring the speed of any individual piece, the conveyor speed can be obtained, which in turn allows for the calculation of the corresponding conveyor speed ratio. The speed curve of any one piece is shown in Figure 17.
Figure 16 shows that when the number of teeth on the sprocket is 15 or 25 and the cutting speed is 2.5 m/s, the speed of the small blocks on the conveyor belt represents the conveyor speed. After stabilization, the conveyor speed is 5.3 m/s with an error of ±0.1 m/s. The error arises from the expansion of the conveyor belt due to the movement of the small blocks in the simulation, with centroid deviation leading to curve errors.
(2)
Determine the range of actual operating parameters.
We tested the following forward speeds to determine whether they can achieve the conveyor speed ratio under theoretical conditions, and provided a range of values for the influencing factors in the single-factor experiment, as shown in Table 3 for the conveying speed ratio under different speed conditions.

3. Results

3.1. Results and Analysis of Multi-Factor Orthogonal Experiment

SPSS 21.0 was used to construct a linear regression equation for shear power consumption and shear force with stem diameter, shear speed, shear time, and stem moisture content, providing a basis for dynamic simulation analysis. The significance analysis of the relationships between shear power consumption and stem diameter, shear speed, shear time, and stem moisture content is shown in Table 4, and the fitted equation is presented as Equation (18).
The fitting equation is
Z = 0.046 + 0.021 X 1 + 0.760 X 2 + 0.192 X 3 0.054 X 4
In the equation, Z represents the shearing energy consumption of hemp stalks (J), X1 represents shear force (N), X2 represents shear speed (cm/s), X3 represents shear time (s), and X4 is stem moisture content (%).
As shown in Table 2, the order of significance for the factors affecting the variation in stem shearing energy consumption is shear speed > shear time > stem moisture content > shear force. All factors have a highly significant impact on the shearing energy consumption of the hemp stalk.
Similarly, a mathematical model is constructed for the shear force in relation to stem diameter, shear speed, shear time, and stem moisture content, as expressed in Equation (19).
Z = 25.005 36.268 X 1 + 3.844 X 2 + 2.931 X 3
In the equation, Z represents the shear force of fiber hemp stems (N), X1 represents shear speed (cm/s), X2 represents stem diameter (mm), and X3 is the stem moisture content (%).
From the significance analysis, it is evident that the order of significance for the factors influencing the variation in stem shear force is as follows: shear speed > stem diameter > stem moisture content. All of the factors have a highly significant impact on stem shear force.
Overall, the linear regression equations derived in this section regarding the shear mechanical properties of fiber hemp stems can, to a certain extent, effectively describe the linear dependency between the dependent and independent variables. The mathematical models thus have significant practical value.

3.2. Validation Test of Operating Parameters for the Industrial Hemp Harvester’s Cutter Bar

This section is based on the previous research conclusions and conducts field validation experiments in Zhenxiang Town, Qingan County, Suhua City, Heilongjiang Province. The variety selected is “Hanma No. 5”, with a plant moisture content of 48.37%. Field experiments with single-factor and multi-factor designs are carried out to optimize and validate the operational performance of the fiber-specific industrial hemp harvester. As relevant standards for fiber-specific industrial hemp harvesting operations have not yet been established in China, this experiment uses the general national standards for harvesting machines, JB/T7733-2007, JB/T8097-2008, and DG/T111-2019, as the main reference basis [33]. The plant laying angle, laying thickness, and cutting height are proposed as evaluation criteria, while forward speed, cutting speed, and conveyor speed ratio are considered as influencing factors for the field validation experiments. Based on the previous section, the forward speeds are selected as 2.1 m/s, 2.3 m/s, 2.5 m/s, and 2.7 m/s; the suitable cutting speeds are 2.3 m/s, 2.5 m/s, 2.7 m/s, and 2.9 m/s; and the conveyor speed ratios are 1.9, 2.1, 2.3, and 2.5.

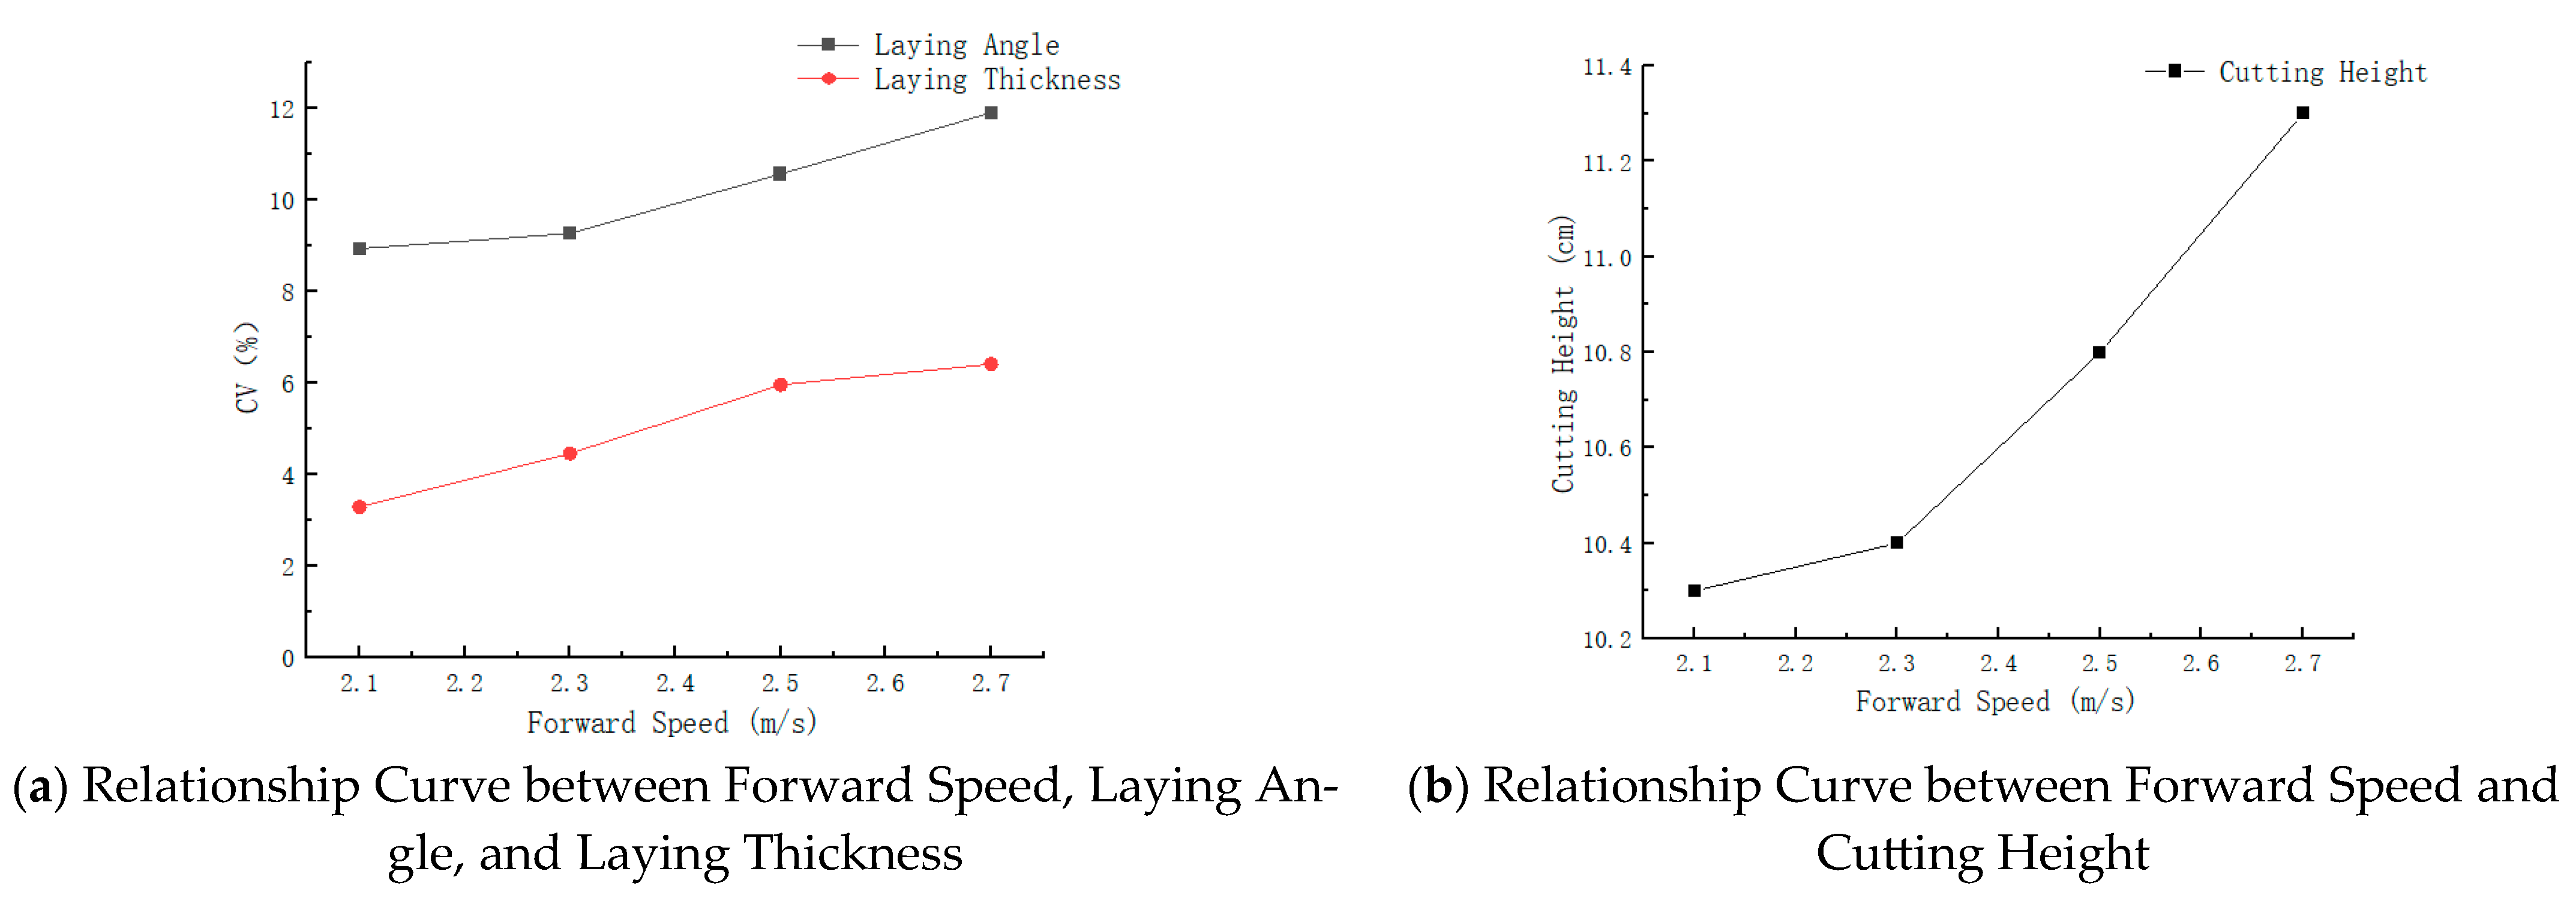
3.2.1. Single-Factor Experiment on Forward Speed

With the cutting speed controlled at 2.5 m/s and the conveyor speed ratio set to 2.1, four levels of forward speed were selected for the performance test. The test results are shown in Table 5, and the fitted curve is shown in Figure 17.
Analysis of Figure 18 shows that forward speed has a significant impact on the coefficient of variation of the laying angle and laying thickness, as well as on cutting height. This indicates that forward speed greatly influences the machine’s operational performance. When the forward speed is 2.7 m/s, the coefficients of variation for the laying angle and laying thickness, as well as the cutting height, reach their maximum values, which are 11.91%, 6.41%, and 11.3 cm, respectively. Therefore, the forward speed range is set as 2.1 to 2.5 m/s.

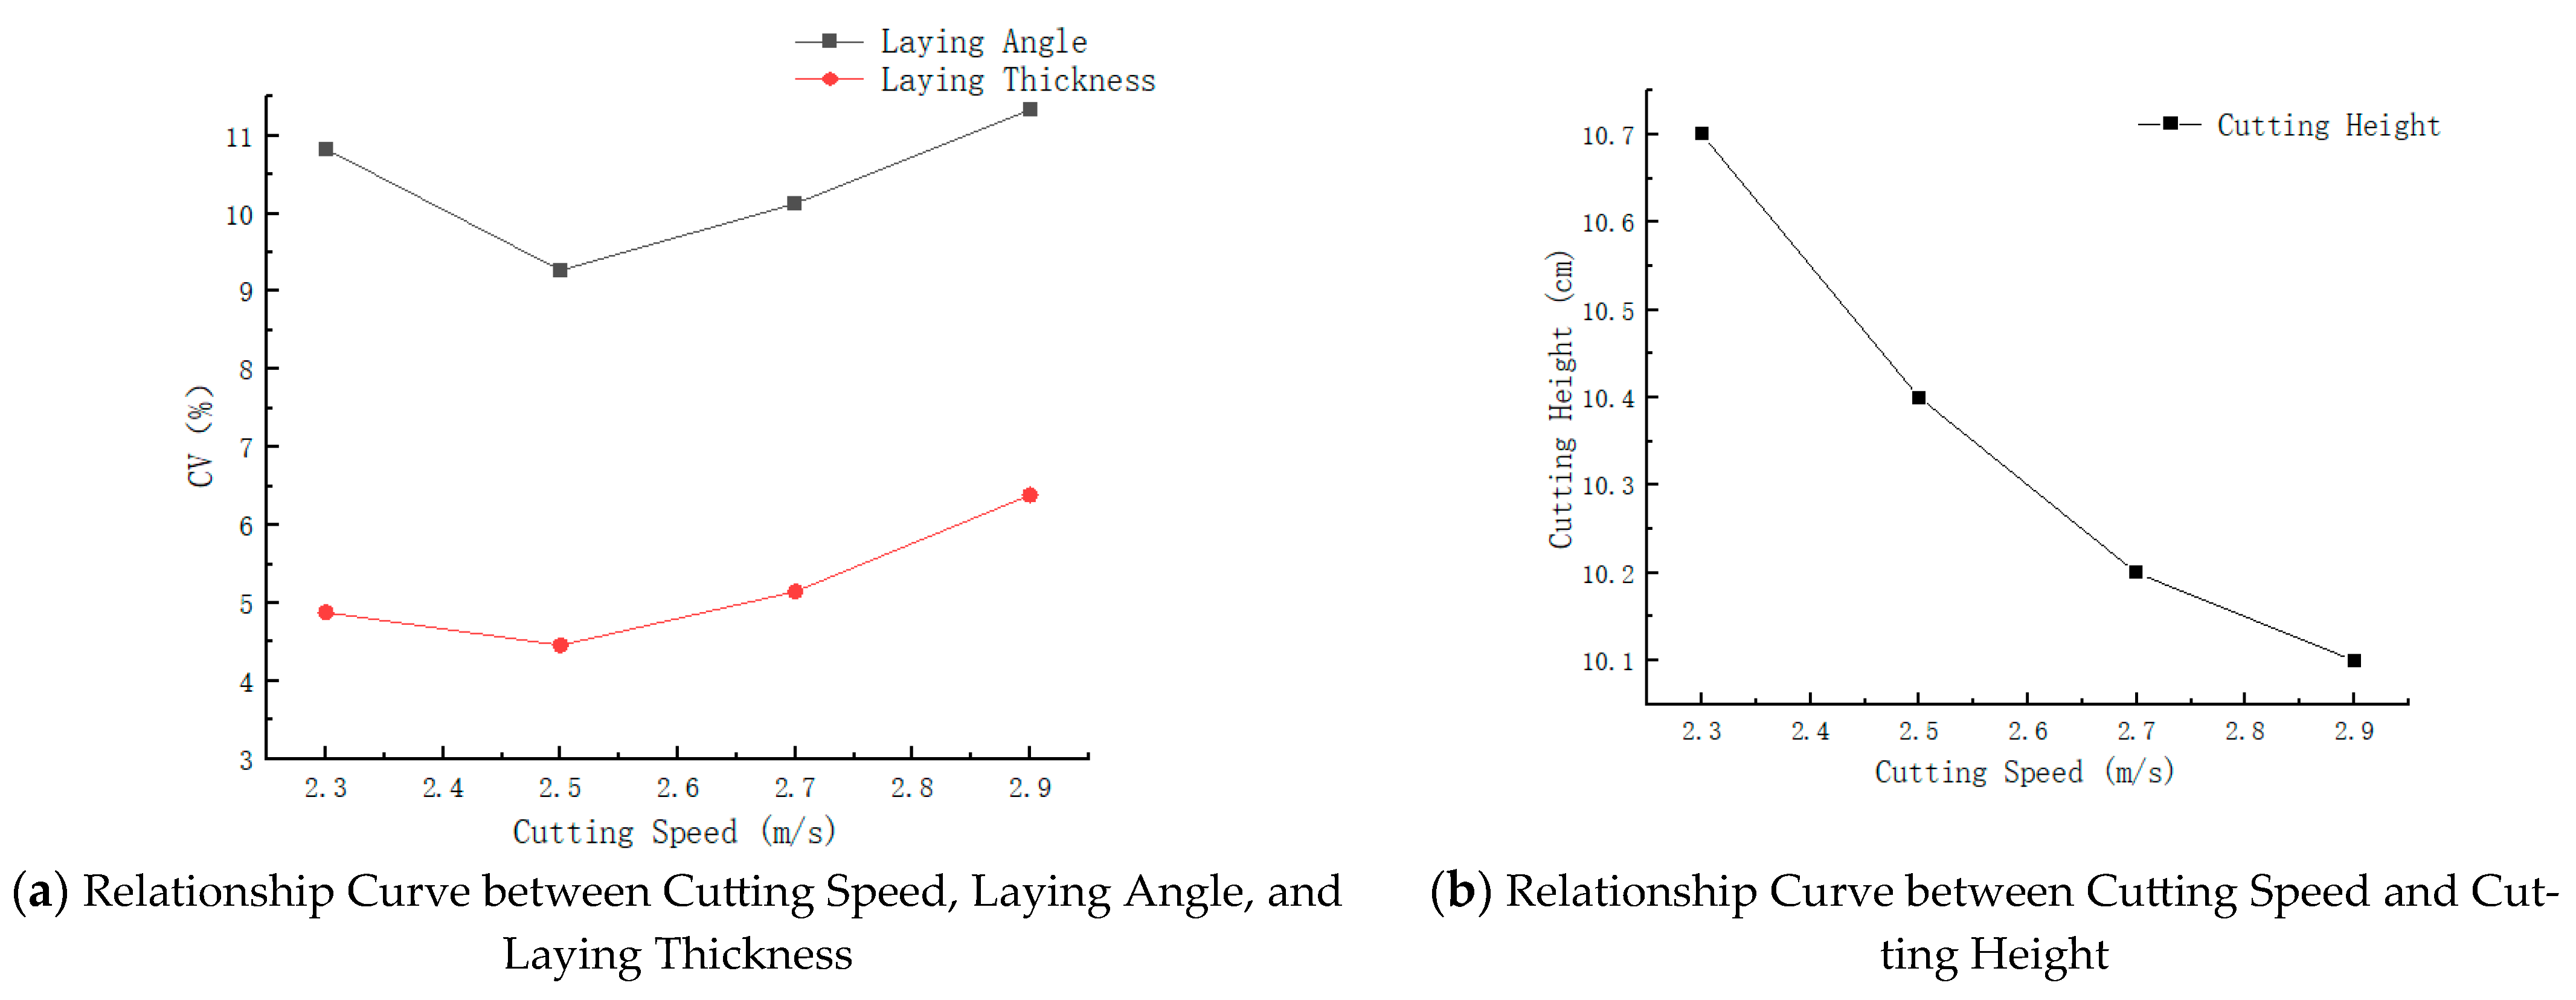
3.2.2. Single-Factor Experiment on Cutting Speed

With the forward speed controlled at 2.3 m/s and the conveyor speed ratio set to 2.1, four levels of cutting speed were selected for the performance test. The test results are shown in Table 6, and the fitted curve is shown in Figure 17.
Analysis of Figure 19 shows that the coefficient of variation for the laying angle and thickness decreases and then increases with increasing cutting speed. The minimum values occur at 2.5 m/s (9.27%, 4.46%), and the maximum values occur at 2.9 m/s (11.33%, 6.39%). The cutting height decreases with increasing speed, with the minimum value at 2.9 m/s being 10.1 cm and the maximum value at 2.3 m/s being 10.7 cm. The reasons for this are as follows: at low speeds, cutting is difficult, affecting the uniformity of the laying; as speed increases, the propulsion effect weakens, and uniformity improves. However, at excessively high speeds, repeated cutting causes angle variations, which negatively affect uniformity. At low speeds, the plants tilt forward, resulting in a higher cutting height. As speed increases, the plants become more upright, and the cutting height decreases. Therefore, the cutting speed range is set as 2.3 to 2.7 m/s.

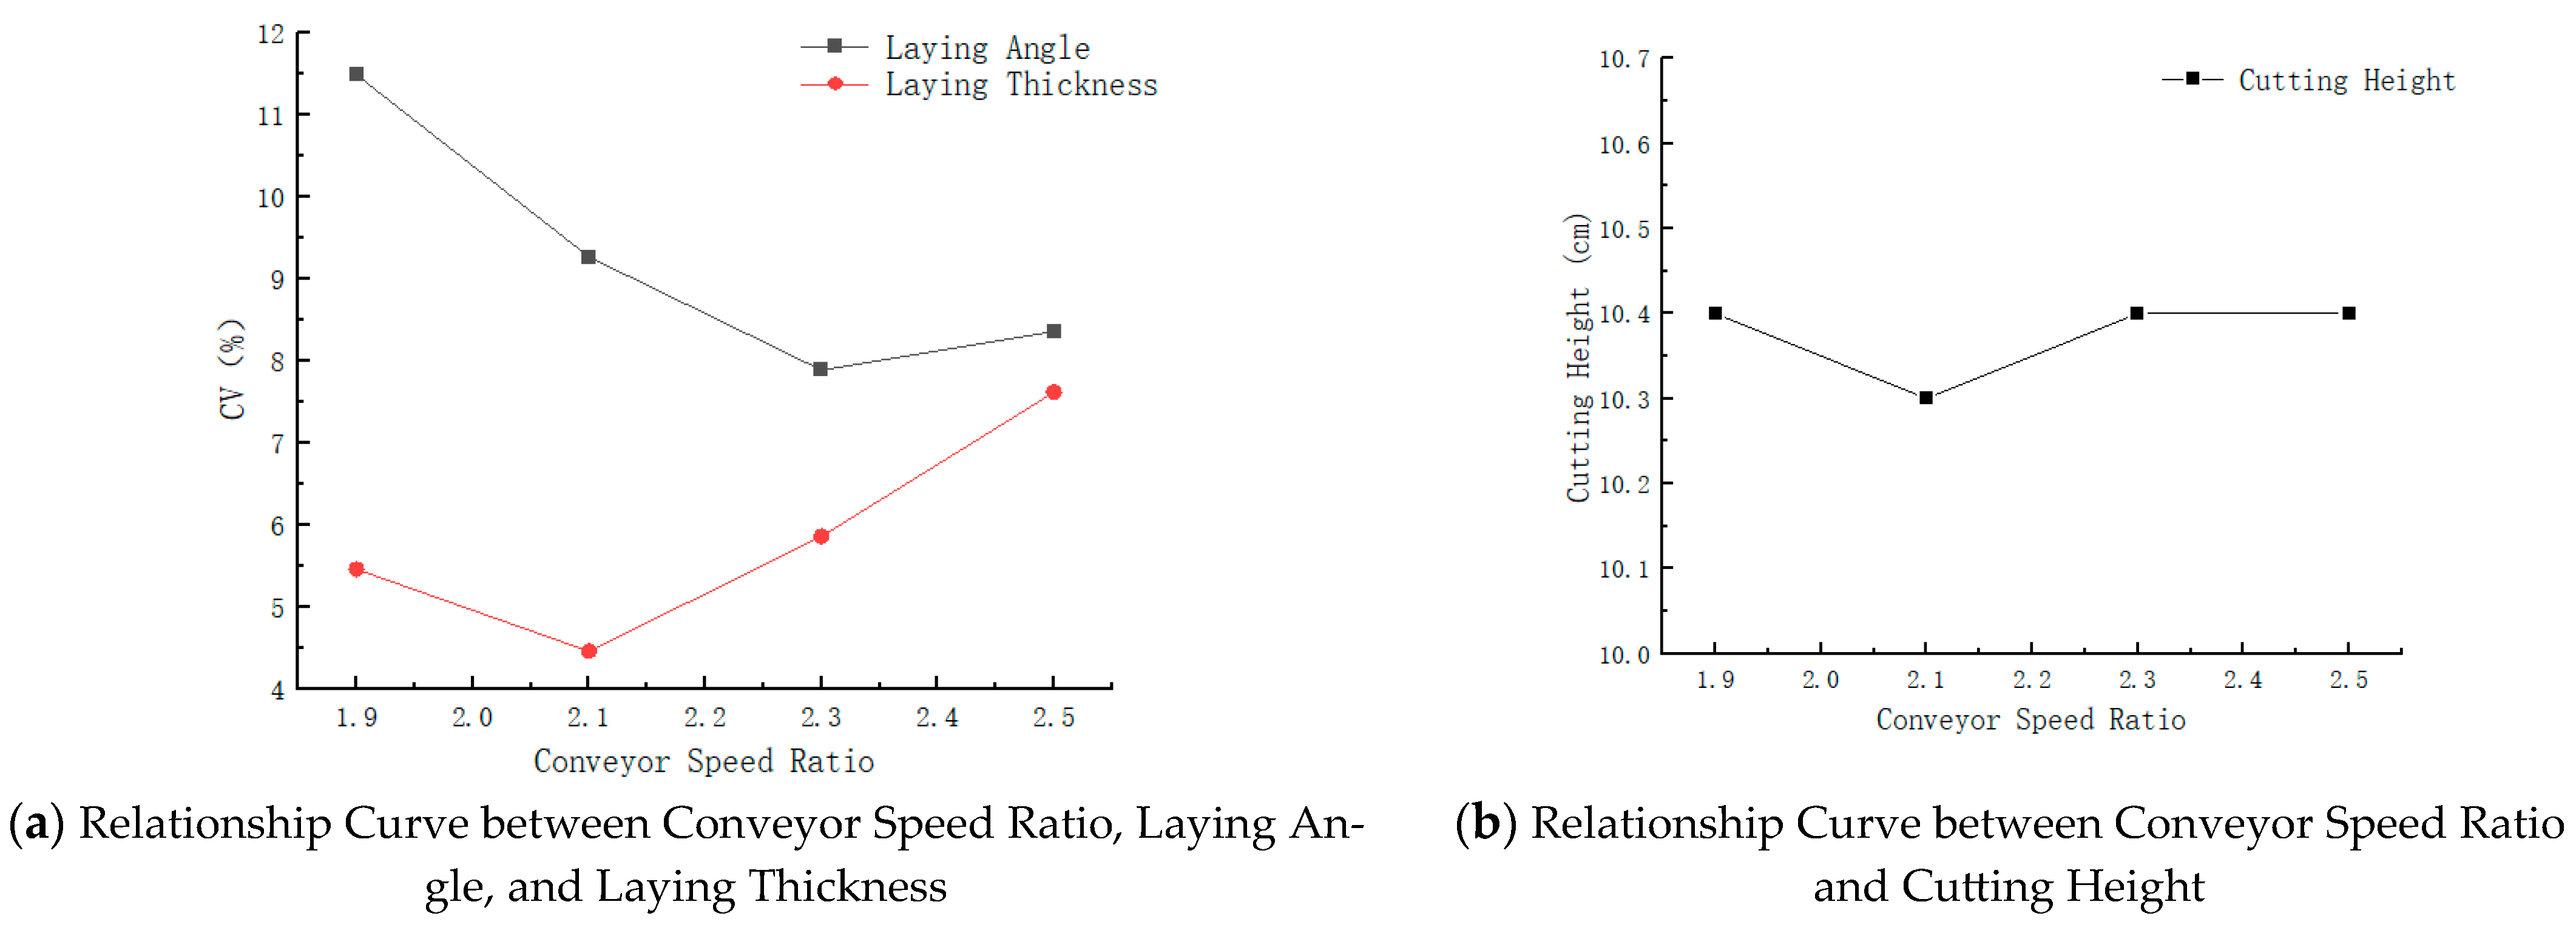
3.2.3. Single-Factor Experiment on Conveyor Speed Ratio

With the forward speed controlled at 2.3 m/s and the cutting speed set to 2.5 m/s, four levels of conveyor speed ratio were selected for the performance test. The test results are shown in Table 7, and the fitted curve is shown in Figure 18.
Analysis of Figure 20 shows that the coefficient of variation for the laying angle and thickness decreases and then increases with the conveyor speed ratio. The minimum values occur at conveyor speed ratios of 2.1 and 1.9, while the maximum values occur at 1.9 and 2.5. The cutting height shows a slight fluctuation trend with the increase in conveyor speed ratio, with an overall variation between 10.3 cm and 10.4 cm. The conveyor speed ratio affects the plant delivery status, thereby influencing the uniformity of the laying, but has a minimal impact on the cutting height. Therefore, the conveyor speed ratio range is set as 2.1 to 2.5.

3.2.4. Multi-Factor Experiment
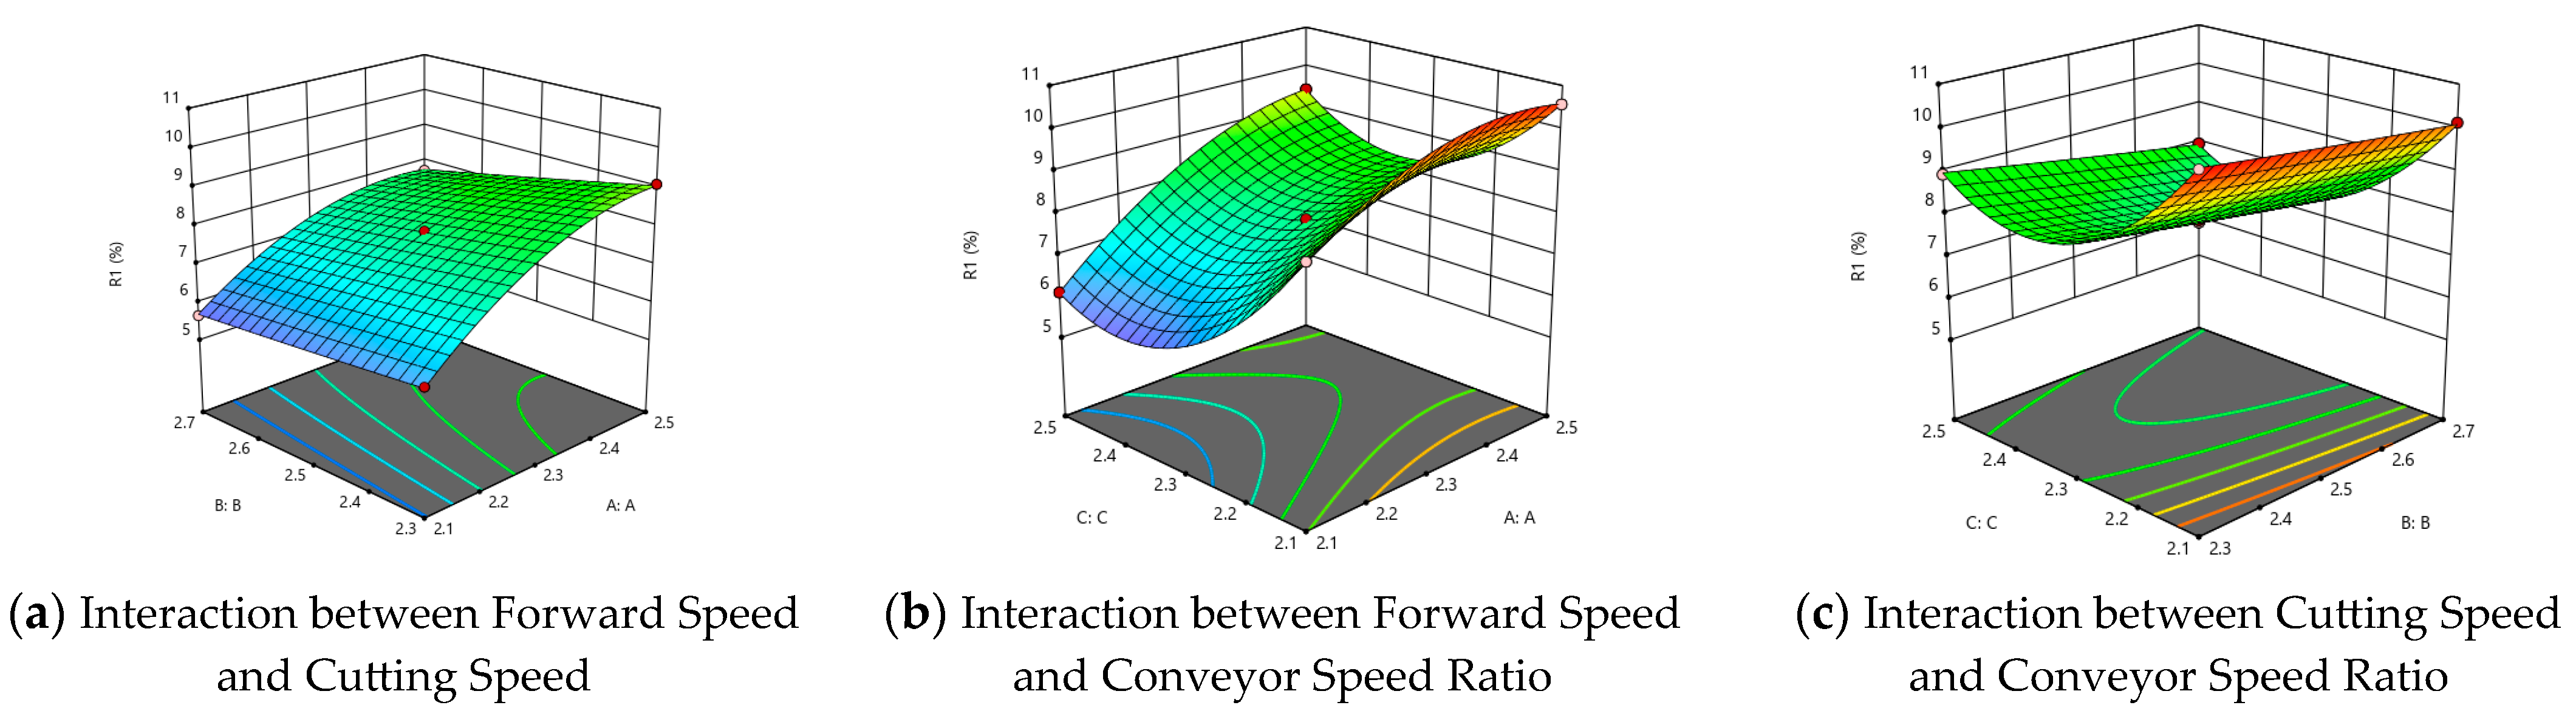
To further investigate the interactive effects of forward speed, cutting speed, and conveyor speed ratio on the coefficient of variation for the laying angle and thickness, as well as cutting height, this experiment is based on the response surface methodology. A three-factor, three-level orthogonal experiment is designed to determine the optimal operational parameter combination.
(1)
Influencing Factors and Analysis of the Coefficient of Variation for Laying Angle
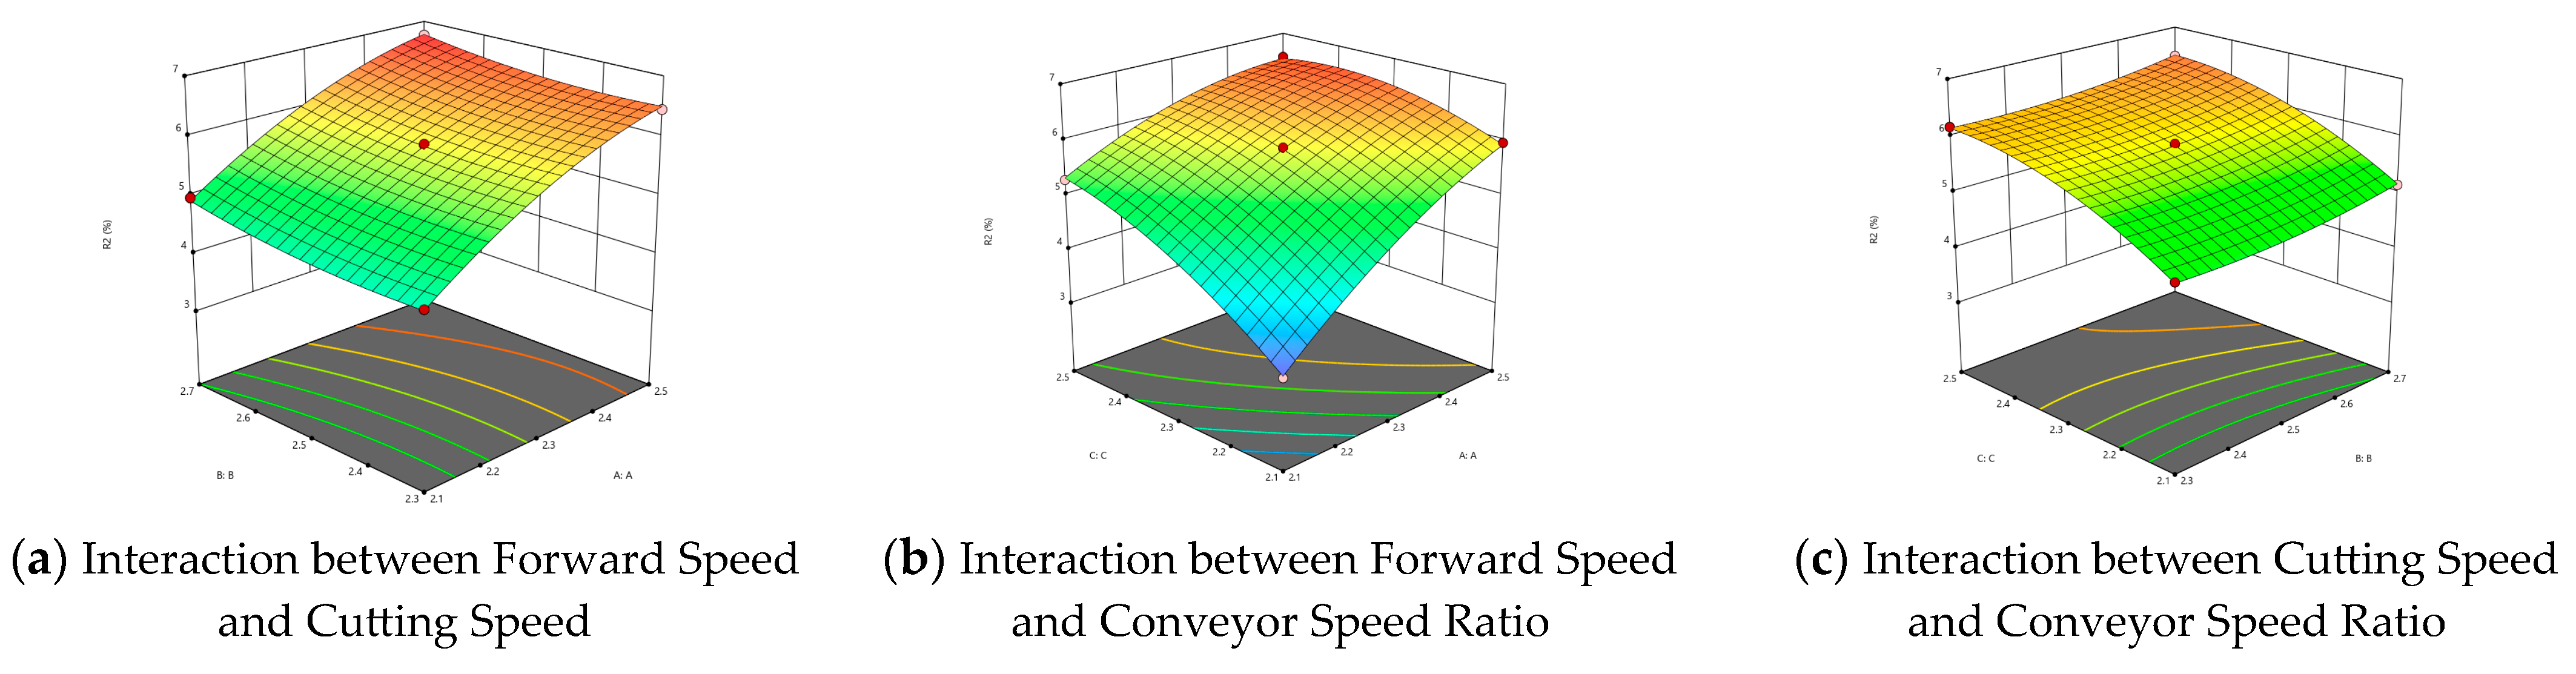
A significance analysis was conducted for the coefficient of variation of the laying angle. The model significance for the laying angle’s coefficient of variation is p < 0.0001, indicating a highly significant regression model. Regression fitting analysis was performed on the experimental data using Design-Expert 8.0.6 software, resulting in a quadratic regression mathematical model for the laying angle’s coefficient of variation. Non-significant factors with p > 0.05 were excluded, and the optimized model is shown in Equation (20).
Y 1 = 7.85 + 1.24 X 1 0.45 X 2 1.01 X 3 0.2 X 1 X 2 + 0.42 X 1 X 3 0.068 X 2 X 3 0.69 X 1 2 + 1.6 X 3 2
The significance analysis of the model for the coefficient of variation of the laying angle shows that the order of significance for factors affecting the variation in the laying angle’s coefficient of variation is forward speed > conveyor speed ratio > cutting speed, with p values all <0.01, indicating that the influence of each individual factor is highly significant. Interaction analysis reveals that all three factors have pairwise interactions. The p values for X1X2 and X1X3 are both <0.01, indicating that the interaction between forward speed and cutting speed, as well as between forward speed and conveyor speed, is highly significant for the laying angle’s coefficient of variation. The lack-of-fit item has a p value of 0.1180 > 0.05, proving that there are no lack-of-fit factors. Figure 21 shows the response surface plots of pairwise interactions for each factor.
(2)
Factors Influencing the Coefficient of Variation of Laying Thickness and Analysis
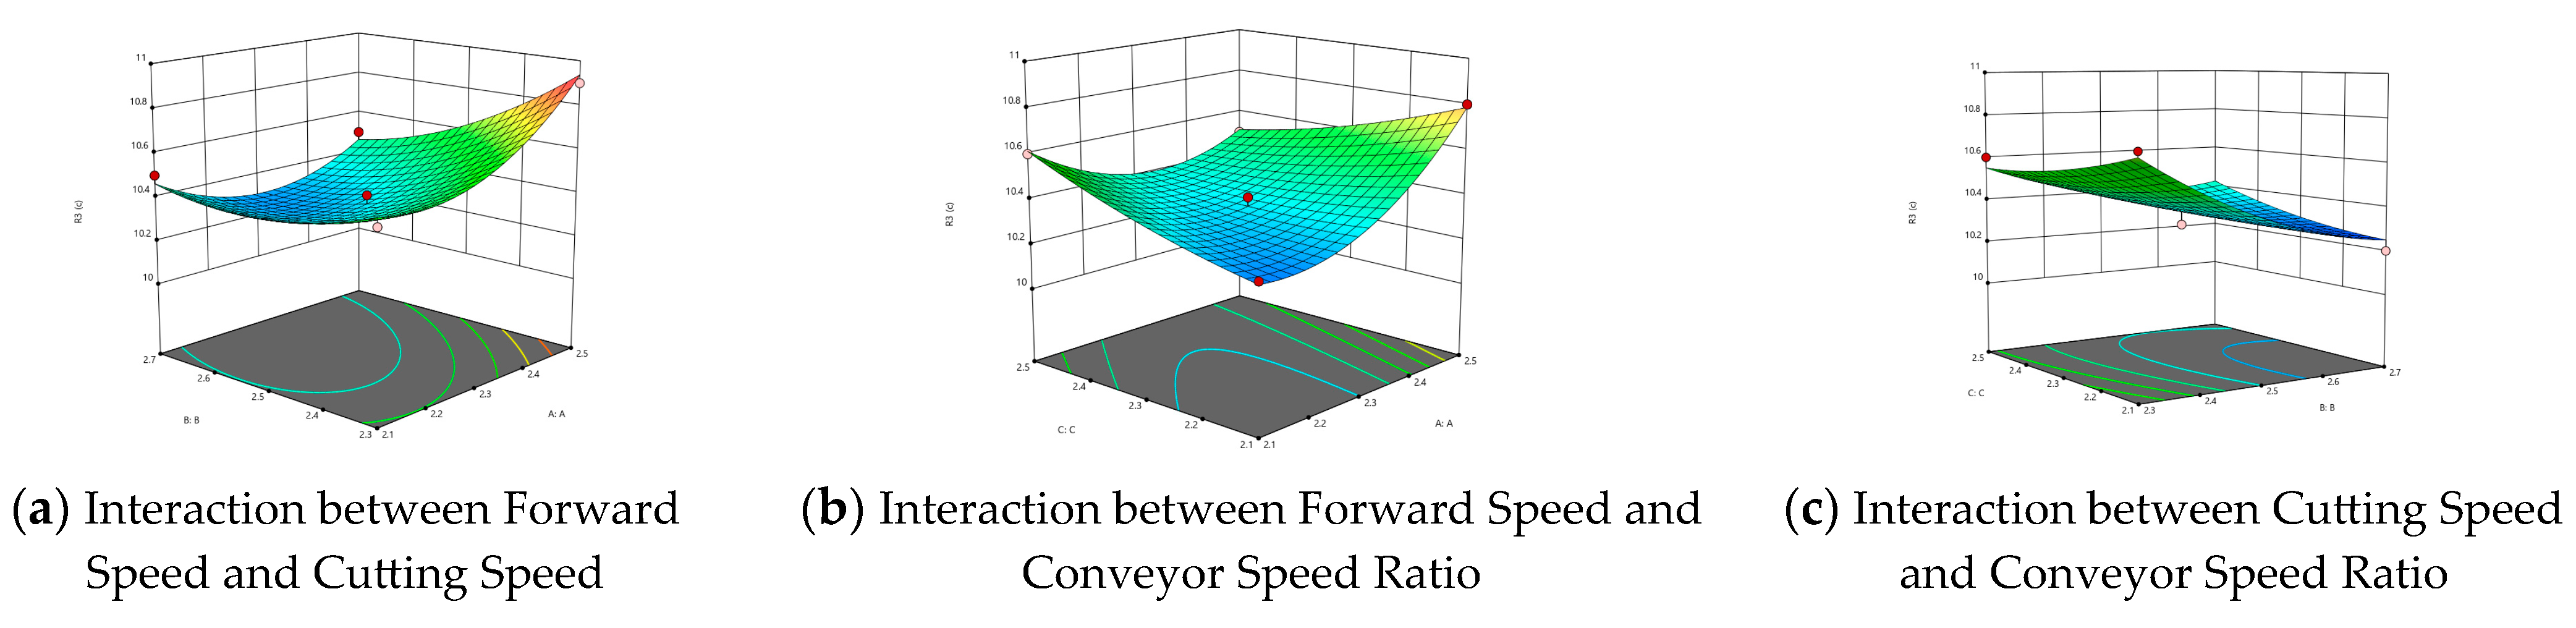
A variance analysis was conducted on the laying thickness data in Table 7, and the model significance for the coefficient of variation of laying thickness was found to be p < 0.0001, indicating a highly significant regression model. A regression fitting analysis was performed on the experimental data to obtain the quadratic regression mathematical model for the coefficient of variation of laying thickness. Non-significant factors with p > 0.05 were excluded, and the optimized model is shown in Equation (21):
Y 2 = 5.84 + 0.95 X 1 + 0.15 X 2 + 0.65 X 3 0.36 X 1 X 3 0.27 X 1 2 0.30 X 3 2
The significance analysis of the model for the coefficient of variation of laying thickness indicates that the order of significance for the factors influencing the variation in laying thickness is as follows: forward speed > conveyor speed ratio > cutting speed, with p-values all <0.01, indicating that the influence of each individual factor is highly significant. Interaction analysis shows that the p-value for X1X3 is <0.01, indicating that the interaction between forward speed and conveyor speed ratio is highly significant for the coefficient of variation of laying thickness. The p-values for X1X2 and X2X3 are both >0.05, indicating that there is no interaction between forward speed and cutting speed, as well as between cutting speed and conveyor speed ratio, on the coefficient of variation of laying thickness. The p-value for the lack of fit is 0.0844 (>0.05), indicating that there are no lack-of-fit factors. Figure 22 shows the response surface plots for pairwise interactions of the factors.
(3)
Factors Affecting Cutting Height and Analysis
A variance analysis was conducted on the cutting height data in Table 7, and the significance of the cutting height model was found to be p < 0.0001, indicating that the regression model is highly significant. Regression fitting analysis was performed on the experimental data using software, resulting in a regression mathematical model for cutting height. Factors with p > 0.05, which were not significant, were excluded, and the optimized mathematical model is shown in Equation (22):
Y 3 = 10.36 + 0.10 X 1 0.14 X 2 0.10 X 1 X 2 0.15 X 1 X 3 + 0.075 X 2 X 3 + 0.16 X 1 2 + 0.082 X 2 2
In the equation, Y3 represents the coefficient of variation for cutting height, X1 represents the coded value for forward speed, X2 represents the coded value for cutting speed, and X3 is the coded value for conveyor speed ratio.
The significance analysis of the cutting height variation coefficient model shows that the significance ranking of factors affecting cutting height variation is cutting speed > forward speed > conveyor speed ratio. The p-values for X1X2 are all <0.01, indicating that the effects of forward speed and cutting speed on cutting height variation are highly significant. Interaction analysis indicates that all three factors have pairwise interactions, with the p-value for X1X3 being <0.01, indicating that the interaction between forward speed and conveyor speed ratio on cutting height is highly significant, and the p-values for X1X2 and X2X3 are both <0.05, indicating that the interactions between forward speed and cutting speed, as well as cutting speed and conveyor speed ratio, on cutting height are significant, The p-value for the lack of fit is 0.3678 (>0.05), proving that there are no lack-of-fit factors. Figure 23 shows the response surface plots for the pairwise interactions of each factor.
(4)
Optimal Parameter Combination and Validation of Each Indicator
Using Design-Expert 8.0.6 to optimize the orthogonal experimental results, the parameter ranges were set as follows: forward speed 2.1–2.5 m/s, cutting speed 2.3–2.7 m/s, and conveyor speed ratio 2.1–2.5. The variation coefficients of planting angle and thickness were controlled within 0–10.83% and 0–6.75%, respectively, while the cutting height was set between 10 and 10.9 cm. The optimal operational parameter combination results are shown in Table 8.
The parameters for the field validation experiment were adjusted based on actual conditions: forward speed 2.1 m/s, cutting speed 2.5 m/s, and conveyor speed ratio 2.2. The experimental results are shown in Table 9. The actual values are close to the optimal values obtained by the model, with errors within the allowable range. The optimal operational parameters derived from the model are reliable and suitable for practical use. As shown in Figure 24, the actual field operation under the optimal parameter combination conditions.
The re-harvest rate refers to the ratio of the actual amount of crop harvested by the harvester in a unit of time to the theoretical amount of crop that can be harvested. The missed harvest rate refers to the ratio of the crop portions that the harvester failed to effectively harvest to the total theoretically harvestable crop amount. The re-cutting rate and missed cutting rate are key indicators for evaluating the performance of industrial hemp reaping machines. No missed cutting was observed in the field operation; however, re-cutting is difficult to directly observe, so the theoretical missed cutting rate is calculated using cutting diagrams. Under the optimal parameters, the cutter speed ratio (β) is 1.19. Using CAXA 2018, the total area is calculated as 3405.887 mm2, with the re-cutting area being 286.054 mm2, resulting in a re-cutting rate of 8.4%.

4. Discussion

This study primarily focuses on the cutter–bar design theory and explores the operational parameters and influencing factors of the 4GM-2.2 fiber-type industrial hemp harvesting machine, conducting an in-depth analysis of its optimal operational parameters. Currently, there is no unified operational standard for fiber-type industrial hemp harvesting machines in China, leading to unclear optimal operational parameters and issues such as low operational quality [17,18,19,20,21]. Therefore, we analyze the cutter–bar design principles of existing machines based on the mechanical properties of the “Hanma 5” hemp stalks grown in the cold regions of Heilongjiang, conduct dynamic simulation analysis of the key components of the fiber-type industrial hemp harvesting machine using ADAMS and Workbench, and obtain the optimal parameter combination through field experiments. This method provides new technical support for the development of future fiber-type industrial hemp harvesting machines. Compared to the operational parameters of industrial hemp harvesting machines that do not consider the mechanical properties of the stalks [18], this study fully considers the mechanical properties of the “Hanma 5” hemp stalks grown in Heilongjiang’s cold regions, providing a more realistic technical reference for improving the operational quality of industrial hemp harvesting machines. However, the main focus of this study is on the operational parameters, and there has been limited exploration of structural parameters. Future research should begin with structural parameters and integrate them with the operational parameters to achieve optimization and improvement of the fiber-type industrial hemp harvesting machine. The study found that the machine relies on a single power system to transmit power, resulting in significant load on some components. To further improve the operational efficiency of the fiber-type industrial hemp harvesting machine, multiple power systems can be designed.

5. Conclusions

This study, based on the mechanical properties of “Hanma 5” hemp stalks in Heilongjiang, presents a technical method for determining the optimal operational parameters for fiber hemp harvesting machines. Furthermore, this study, based on cutting platform design theory, combines numerical simulations to analyze the optimal ranges of various influencing factors and determines the optimal operational parameter combination through field trials. The main conclusions are as follows:
(1)
The linear relationship between shear speed, stalk moisture content, stalk diameter, shear force, and shear strength was derived by measuring fiber hemp plant samples. The results show that the shear speed has the most significant effect on stalk shear energy consumption, followed by shear time, stalk moisture content, and shear force, with all factors being highly significant. The shear speed has the most significant effect on stalk shear force, followed by stalk diameter and stalk moisture content, all of which are also highly significant.
(2)
Through the analysis and simulation of the operational parameters of key components of the industrial hemp harvesting machine’s cutting platform, the range values for cutting speed, forward speed, and conveyor speed that match both practical operations and theoretical calculations were determined, as follows: the cutting speed range is 1.9~3.7 m/s; the conveyor speed ratio range is 1.9–2.5; and the optimal cutting speed is 2.5 m/s.
(3)
Field trials of the fiber hemp harvesting machine revealed the optimal operational parameters as follows: forward speed 2.1 m/s, cutting speed 2.5 m/s, and conveyor speed ratio 2.2; with these parameters, the variation coefficient of the laying angle was 6.88%, the variation coefficient of the laying thickness was 4.11%, and the cutting height was 10.4 cm. The overlap rate was 8.4%, with no missed cutting.

Author Contributions

J.H. and C.F. conceived the idea of the experiment; C.L. and C.F. performed the field test; Y.L. and C.F. analyzed the data; J.H., C.F., Y.L., C.L., H.S. (Hang Shi), H.S. (Hao Sun) and B.W. wrote and revised the paper. All authors have read and agreed to the published version of the manuscript.

Funding

This research was funded by Heilongjiang Province Applied Technology Research and Development Program Project (No. GA21B003), Double First-Class Discipline Collaborative Innovation Achievements Project of Heilongjiang Province (LJGXCG2023-045), National Soybean Industry Technology System Post Expert Project (CARS-04-PS30), Heilongjiang Provincial Natural Science Foundation Joint Guidance Project (LH2023E106), Heilongjiang Province key research and development plan (2023ZX01A06), and Jiusan Soybean Industry Innovation Research Institute Project (2022402).

Data Availability Statement

Data are contained within the article.

Conflicts of Interest

The authors declare no conflicts of interest.

References

  1. Wang, Q.; Zhang, X.; Li, Q.; Wang, S.; Xie, L. Progress on Cultivating Cannabis under Different Cultivation Condiotons. Northeast Agric. Sci. 2020, 45, 45–49. [Google Scholar] [CrossRef]
  2. Zhang, S.; Wang, G.; Song, X.; Zhang, L.; Fang, Y.; Zheng, N.; Wu, G.; Song, X.; Chen, J. Advantages and Countermeasures of the Development of the Hemp Industry in Heilongjiang Province. Heilongjiang Agric. Sci. 2018, 1, 125–128. [Google Scholar]
  3. Xiang, W.; Ma, L.; Liu, J.; Yan, B.; Duan, Y.; Lv, J. Research Progress on Primary Technology and Equipment of Industrial Hemp. Chin. J. Agric. Mech. Chem. 2022, 43, 96–103. [Google Scholar] [CrossRef]
  4. Si, S. Design and Optimization of the Conveying and Baling Device for Ramie Cutting and Baling Machine; Chinese Academy of Agricultural Sciences: Beijing, China, 2023. [Google Scholar] [CrossRef]
  5. Liu, L.-J.; Lao, C.-Y.; Zhang, N. The effect of new continuous harvest technology of ramie on fiber yield and quality. Ind. Crops Prod. 2013, 44, 677–683. [Google Scholar] [CrossRef]
  6. Zhou, Y. Design and Experimental Research of Hemp Plate Cutter; Chinese Academy of Agricultural Sciences: Beijing, China, 2017. [Google Scholar]
  7. Tan, L.T.; Yu, C.M.; Chen, P.; Wang, Y.Z.; Chen, J.K.; Wen, L.; Xiong, H.P. Research Status and Prospective Development of Bast Fiber Crops for Multi-purpose. Plant Fiber Sci. China 2012, 34, 94–99. [Google Scholar]
  8. Wang, B.; Hu, J.; Liu, C. Current Situation and Development Countermeasures of Hemp Industry in Heilongjiang Province. South. Agric. Mach. 2021, 52, 50–52. [Google Scholar]
  9. Khan, M.R.; Chen, Y.; Laguë, C.; Landry, H.; Peng, Q.; Zhong, W. Compressive properties of Hemp (Cannabis sativa L.) stalks. Biosyst. Eng. 2010, 106, 315–323. [Google Scholar] [CrossRef]
  10. Chen, Y.; Liu, J.; Gratton, J.-L. Engineering perspectives of the hemp plant, harvesting and processing. J. Ind. Hemp 2004, 9, 23–39. [Google Scholar] [CrossRef]
  11. Zheng, W. Design of Sweet Potato Vine Recycling Machine and Study on Cutting Mechanism; Shandong Agricultural University: Tai’an, China, 2019. [Google Scholar] [CrossRef]
  12. Khan, M.M.R.; Chen, Y.; Laguë, C.; Landry, H.; Peng, Q.; Zhong, W. Hemp (Cannabis sativa L.) decortications using the drop weight method. Appl. Eng. Agric. 2013, 29, 79–87. [Google Scholar] [CrossRef]
  13. Deyholos, M.K.; Potter, S. Engineering bast fiber feedstocks for use in composite materials. Biocatal. Agric. Biotechnol. 2014, 3, 53–57. [Google Scholar] [CrossRef]
  14. Xiang, W.; Ma, L.; Liu, J.J.; Yan, B.; Duan, Y.P.; Hu, Y.; Lyu, J.N. Review on Technology and Equipment of Mechanization for Industrial Hemp in China. China Hemp Sci. 2021, 43, 320–332. [Google Scholar]
  15. Mu, S.L.; Chen, C.L.; Zhang, B.; Luo, X.Y.; Li, X.W. Current Situation and Existing Problem of Bast Fiber Harvester in China. China Agric. Mach. 2010, 3, 11–14. [Google Scholar]
  16. Tang, B.; Li, X.-W.; Yuan, J.-N.; Zhang, B.; Huang, J. Analysis of technology and development for hemp micro-harvesting machinery. J. Chin. Agric. Mech. 2018, 39, 17–21. [Google Scholar]
  17. Huang, J.-C.; Li, X.-W.; Zhang, B.; Tian, K.-P.; Shen, C.; Wang, J.-G. Research on the 4LMZ160 crawler ramie combine harvester. J. Agric. Mech. Res. 2015, 9, 155–158. [Google Scholar]
  18. Lv, J.-N.; Ma, L.; Liu, J.-J.; Long, C.-H.; Zhou, W. The investigation on the development of industrial hemp and its harvesting machinery of Heilongjiang province. Plant Fiber Sci. China 2017, 39, 94–102. [Google Scholar]
  19. Cao, Y.; Yao, C. Development and use of the 4GS-2880 hemp harvesting machine. Agric. Mach. Technol. Promot. 2015, 5, 44–45. [Google Scholar]
  20. Zhu, H.; Zhang, Z.; Yu, G. Development and Test of the Hemp Swather. Agric. Eng. 2018, 8, 95–98. [Google Scholar]
  21. Gong, Y.; Cao, H.; Wang, Z.; Zhang, X. Research and design of the 4GL-285 hemp harvesting machine. Agric. Mach. Usage Maint. 2020, 7, 11–12. [Google Scholar] [CrossRef]
  22. Marrot, L.; Lefeuvre, A.; Pontoire, B.; Bourmaud, A.; Baley, C. Analysis of the hemp fiber mechanical properties and their scattering. Ind. Crops Prod. 2013, 51, 317–327. [Google Scholar] [CrossRef]
  23. Li, X.; Wang, S.; Du, G.; Wu, Z.; Meng, Y. Variation in physical and mechanical properties of hemp stalk fibers along height of stem. Ind. Crops Prod. 2013, 42, 344–348. [Google Scholar] [CrossRef]
  24. Beaugrand, J.; Nottez, M.; Konnerth, J.; Bourmaud, A. Multi-scale analysis of the structure and mechanical performance of woody hemp core and the dependence on the sampling location. Ind. Crops Prod. 2014, 60, 193–204. [Google Scholar] [CrossRef]
  25. Guo, Y.; Deng, Y.; Hu, S.; Lai, Q.; Liu, M.; Deng, J.; Li, C. Experimental Study on the Shear Mechanical Properties of Fibrous Roots of Polygonatum. J. Jiangxi Agric. Univ. 2024, 1–16. Available online: http://kns.cnki.net/kcms/detail/36.1028.S.20241129.1755.019.html. (accessed on 28 December 2024).
  26. Chinese Academy of Agricultural Mechanization Sciences. Agricultural Machinery Design Handbook; China Agricultural Science and Technology Press: Beijing, China, 2007. [Google Scholar]
  27. Jing, F. The Experimental Study About The Structural and Motion Parameters of The Maize Straw Transverse Transporter of The Corn Harvester. Henan Univ. Sci. Technol. 2011, 32, 1–5. [Google Scholar]
  28. Liu, Y. Design and Experiment of Key Components of the Sunflower Combine Harvester’s Reaper Chain-Type Cutter Bar; Huazhong Agricultural University: Wuhan, China, 2021. [Google Scholar] [CrossRef]
  29. Qu, T.J. Design and Experiment of Low-Damage Cutting Platform for Soybean Harvester; Sichuan Agricultural University: Yaan, China, 2021. [Google Scholar] [CrossRef]
  30. Liu, D.; Xiao, H.; Jin, Y.; Yang, G. Finite Element Analysis of Stalk Cutting of Chinese Little Greens Based on ANSYS and Verification Test. China Agric. Sci. Technol. Bull. 2018, 20, 85–93. [Google Scholar] [CrossRef]
  31. Li, K. Study on Design and Parameter Optimization of The Harvesting Device for Industrialized Shanghaiqing; Southwest University: Chongqing, China, 2020. [Google Scholar] [CrossRef]
  32. Liu, Y.C. Simulation and Experimental Study of Corn Straw Crimping Based on Discrete Element Method; Gansu Agricultural University: Lanzhou, China, 2023. [Google Scholar]
  33. Wang, T. Design and Experimental Study of a Wild Chrysanthemum Stem Cutter; Northwest A&F University: Xianyang, China, 2023. [Google Scholar]
Figure 1. CTM-2050 micro-controlled electronic universal testing machine.
Agriculture 15 00141 g001
Figure 2. Schematic diagram of the entire machine.
Agriculture 15 00141 g002
Figure 3. Diagram of cutter movement analysis.
Agriculture 15 00141 g003
Figure 4. Cutter cutting profile when β = 1.
Agriculture 15 00141 g004
Figure 5. Prototype cutting speed diagram.
Agriculture 15 00141 g005
Figure 6. Schematic diagram of the speed of fiber hemp plants before falling.
Agriculture 15 00141 g006
Figure 7. Schematic diagram of fixed-axis rotational motion during the falling process of industrial hemp plants.
Agriculture 15 00141 g007
Figure 8. Three-dimensional model of the complete machine. In the figure, 1 represents the chain drive, 2 represents the drive shaft, 3 represents the driving mechanism, 4 represents the conveyor belt, 5 represents the frame, 6 represents the driven wheel, 7 represents the plant support plate, 8 represents the star wheel, 9 represents the cutter, and 10 is the driver shaft.
Agriculture 15 00141 g008
Figure 9. Preprocessing steps before simulation run.
Agriculture 15 00141 g009
Figure 10. Material properties of industrial cannabis plants.
Agriculture 15 00141 g010
Figure 11. Stress map of the cutting model at a cutting speed of 1.9 m/s.
Agriculture 15 00141 g011
Figure 12. Stress map of the cutting model at a cutting speed of 2.5 m/s.
Agriculture 15 00141 g012
Figure 13. Stress map of the cutting model at a cutting speed of 3.7 m/s.
Agriculture 15 00141 g013
Figure 14. The assembled conveyor belt model.
Agriculture 15 00141 g014
Figure 15. A schematic representation of the circular pathway.
Agriculture 15 00141 g015
Figure 16. Chain drive system.
Agriculture 15 00141 g016
Figure 17. Conveyor belt speed diagram.
Agriculture 15 00141 g017
Figure 18. Relationship curve between forward speed and evaluation indicators.
Agriculture 15 00141 g018
Figure 19. Relationship curve between cutting speed and evaluation indicators.
Agriculture 15 00141 g019
Figure 20. Relationship curve between conveyor speed ratio and evaluation indicators.
Agriculture 15 00141 g020
Figure 21. Response surface plot of pairwise interactions for each factor.
Agriculture 15 00141 g021
Figure 22. Response surface plot of pairwise interactions for each factor.
Agriculture 15 00141 g022
Figure 23. Response surface plot of pairwise interactions for each factor.
Agriculture 15 00141 g023
Figure 24. Actual field operation under the optimal parameter combination conditions.
Agriculture 15 00141 g024
Table 1. Shear mechanical property test results of stems.
Shear Speed
(mm/s)
Stem Diameter
(mm)
Stem Moisture Content (%)Shear Force
(N)
Energy
(J)
Time
(s)
51035.86100.51.012.35
1037.53106.21.062.47
1039.201091.092.65
1040.87116.81.172.76
1042.54122.21.222.88
835.8691.20.731.86
837.5395.10.761.98
839.20100.70.812.13
840.87103.90.832.27
842.54109.50.882.41
535.8684.50.421.17
537.5388.10.441.29
539.2090.10.451.44
540.8795.90.481.59
542.54101.10.511.78
71035.8696.30.961.65
1037.53100.91.011.79
1039.21061.061.94
1040.87111.91.122.21
1042.54118.11.182.57
835.8684.10.671.33
837.5387.30.701.58
839.291.50.731.71
840.8795.40.761.83
842.54100.30.801.98
535.8674.50.371.13
537.5379.50.400.86
539.281.30.410.94
540.87860.431.14
542.5492.30.461.39
91035.8687.70.881.35
1037.5392.90.931.47
1039.296.50.971.65
1040.87101.81.021.77
1042.54110.41.101.96
835.8676.50.610.94
837.53800.641.08
839.294.10.751.21
840.8795.40.761.46
842.5498.520.791.51
535.8666.60.330.66
537.5371.90.360.74
539.2750.380.86
540.8779.10.400.91
542.54850.431.04
111035.8679.10.790.95
1037.5384.90.851.07
1039.291.40.911.16
1040.8796.70.971.28
1042.54101.31.011.43
835.8668.70.550.85
837.5379.730.640.96
839.278.30.631.11
840.8783.30.671.32
842.54880.701.45
535.8657.50.290.51
537.5365.10.330.67
539.268.90.340.78
540.87760.380.84
542.5477.80.390.97
131035.8668.80.690.81
1037.5372.50.730.92
1039.278.30.781.01
1040.87820.821.17
1042.5486.80.871.35
835.8663.30.510.69
837.53670.540.74
839.269.60.560.85
840.87740.590.96
842.5479.50.641.10
535.8650.370.250.45
537.53660.330.51
539.266.60.330.67
540.8769.90.350.79
542.5480.450.400.92
Table 2. Motion pairs imposed by the model.
Name of Kinematic PairsApplication LocationNumber of Applications
Revolute jointTransmission shaft and frame1
Crank and connecting rod1
Connecting rod and moving blade1
Driving shaft and frame1
Translational jointDriven shaft and frame1
Every two adjacent segments of the conveyor belt1
Moving blade and fixed blade218
Prismatic jointFrame and ground1
Transmission shaft and crank1
Fixed knife and frame1
Table 3. Conveyor speed ratio under different speed conditions.
Experiment NumberForward Speed (m/s)Power Output Shaft Speed (r/min)Cutting Speed (m/s)Conveyor Speed Ratio
11.59001.72.4
21.711001.92.4
31.912002.12.2
42.113002.32.3
52.314002.52.3
62.515002.72.3
72.716002.92.3
82.917003.12.3
93.118003.32.4
103.319003.52.3
113.520003.72.4
Table 4. Fitted equation coefficients.
Unstandardized CoefficientsStandardized CoefficientsT-ValueSignificance
BStandard ErrorBeta
Constant0.0460.094 0.4880.62701
Shear Force0.0210.0011.20917.5690.00016
Shear Speed0.7600.0310.82924.3970.00036
Shear Time0.1920.0290.4306.6460.00028
Stem Moisture Content−0.0540.003−0.493−17.7470.00024
Table 5. Results of the single-factor experiment on forward speed.
Experiment NumberForward Speed (m/s)Number of Teeth on the Large SprocketLaying Angle C.V1 (%)Laying Thickness C.V2 (%)Cutting Height (cm)
12.1308.943.2910.3
22.3279.274.4610.4
32.52510.575.9610.8
42.72311.916.4111.3
Table 6. Results of the single-factor experiment on cutting speed.
Experiment NumberCutting Speed (m/s)Number of Teeth on the Large SprocketLaying Angle C.V1 (%)Laying Thickness C.V2 (%)Cutting Height (cm)
12.32410.834.8810.7
22.5279.274.4610.4
32.72910.135.1510.2
42.93211.336.3910.1
Table 7. Results of the single-factor experiment on conveyor speed ratio.
Experiment NumberConveyor Speed RatioNumber of Teeth on the Large SprocketLaying Angle C.V1 (%)Laying Thickness C.V2 (%)Cutting Height (cm)
11.93011.495.4610.4
22.1279.274.4610.3
32.3257.895.8610.4
42.5228.367.6210.4
Table 8. Optimal operational parameter combination of the model.
Forward Speed (m/s)Cutting Speed (m/s)Conveyor Speed RatioLaying Angle C.V1 (%)Laying Thickness C.V2 (%)Stubble Height (cm)
2.102.562.206.914.1410.3
Table 9. Actual optimal operation parameter combination in the field.
Laying Angle
C.V1 (%)
Laying Thickness C.V2 (%)Stubble Height (cm)
Optimal model value6.924.1410.3
Field actual value6.884.1110.4
Disclaimer/Publisher’s Note: The statements, opinions and data contained in all publications are solely those of the individual author(s) and contributor(s) and not of MDPI and/or the editor(s). MDPI and/or the editor(s) disclaim responsibility for any injury to people or property resulting from any ideas, methods, instructions or products referred to in the content.

