Article

Intelligent 3D Potato Cutting Simulation System Based on Multi-View Images and Point Cloud Fusion

College of Engineering and Technology, Southwest University, Chongqing 400715, China
*
Author to whom correspondence should be addressed.
Agriculture 2025, 15(19), 2088; https://doi.org/10.3390/agriculture15192088
Submission received: 26 August 2025 / Revised: 1 October 2025 / Accepted: 3 October 2025 / Published: 7 October 2025
(This article belongs to the Section Artificial Intelligence and Digital Agriculture)

Abstract

The quality of seed pieces is crucial for potato planting. Each seed piece should contain viable potato eyes and maintain a uniform size for mechanized planting. However, existing intelligent methods are limited by a single view, making it difficult to satisfy both requirements simultaneously. To address this problem, we present an intelligent 3D potato cutting simulation system. A sparse 3D point cloud of the potato is reconstructed from multi-perspective images, which are acquired with a single-camera rotating platform. Subsequently, the 2D positions of potato eyes in each image are detected using deep learning, from which their 3D positions are mapped via back-projection and a clustering algorithm. Finally, the cutting paths are optimized by a Bayesian optimizer, which incorporates both the potato’s volume and the locations of its eyes, and generates cutting schemes suitable for different potato size categories. Experimental results showed that the system achieved a mean absolute percentage error of 2.16% (95% CI: 1.60–2.73%) for potato volume estimation, a potato eye detection precision of 98%, and a recall of 94%. The optimized cutting plans showed a volume coefficient of variation below 0.10 and avoided damage to the detected potato eyes, producing seed pieces that each contained potato eyes. This work demonstrates that the system can effectively utilize the detected potato eye information to obtain seed pieces containing potato eyes and having uniform size. The proposed system provides a feasible pathway for high-precision automated seed potato cutting.

1. Introduction

The potato is an important food crop that contributes to global food security [1]. According to the latest official FAOSTAT data, global potato production has continued to increase over the past decade, and as of 2022, the global potato planting area was approximately 1.7 × 10⁷ hectares, with a total production of about 373 million tons [2]. Potato cutting represents a critical step in the planting process. To facilitate mechanized planting, a key requirement is that each seed piece contains viable potato eyes and maintains a uniform size [3]. Manual cutting, however, is characterized by high costs, uneven seed pieces, and the potential for potato eye damage, making it difficult to meet this requirement [4]. Consequently, achieving the precision cutting of potatoes is crucial. To address these challenges in potato processing, advanced technologies including 3D reconstruction, computer vision, and deep learning have emerged as promising solutions for agricultural automation.
With the development of precision agriculture [5], researchers have increasingly applied three-dimensional (3D) reconstruction, computer vision, and deep learning technologies to agricultural crops [6,7]. Among these, 3D reconstruction is utilized in agricultural phenotyping, such as plant modeling and non-destructive measurement. Masoudi et al. [8] utilized a kaolin particle film pretreatment to accurately construct 3D models of shiny surface fruits using structure from motion (SfM) technology. Gené-Mola et al. [9] proposed a method combining structure from motion–multi-view stereo (SfM-MVS) and visibility assessment, achieving millimeter-level apple size measurement accuracy in the field. Vázquez-Arellano et al. [10] achieved 3D reconstruction of maize plants using a time-of-flight (TOF) camera and iterative closest point (ICP) algorithm. Ghahremani et al. [11] achieved 3D point cloud analysis of complex plant organs using a random sample consensus (RANSAC) algorithm, providing high-precision non-destructive measurement methods for plant phenotyping analysis. To achieve 2D–3D information complementation for asparagus measurement, Chen et al. [12] proposed a method that integrates a vision system based on YOLO-V9 with 3D point-cloud data, which avoids the loss of 3D point cloud information from depth cameras in natural environments. These 3D reconstruction advances have laid the foundation for more precise agricultural applications.
Computer vision and deep learning technologies have been applied in agricultural target recognition, such as crop disease and pest detection [13], fruit recognition [14], and fruit load estimation [15]. In terms of potato eye recognition, Li et al. [16] proposed a method based on color saturation and 3D geometric features, identifying potato eyes by analyzing the saturation component in a 3D geometric space. Yang et al. [17] combined multispectral imaging, supervised multiple threshold segmentation, and Canny edge detection to detect potato eyes. Xi et al. [18] proposed an improved Faster R-CNN model for potato eye detection. Huang et al. [19] proposed the POD-YOLO model, which achieved accurate detection of potato orientation and eye position by introducing a CSPDPNet network structure, SPD-Conv downsampling module, and KFIoU loss function, with a precision of 95.2% and a recall of 94.0%. While these studies have made significant progress in potato eye detection, they predominantly rely on single-view approaches. However, single-view image detection can only capture information from one side of the potato, resulting in incomplete visual data and compromising the cutting path planning [3]. Similarly, Zhao et al. [20] proposed a method using a two-camera system to simultaneously capture images of potatoes from both the left and right sides, generate top-view images through perspective transformation to obtain maximum-field-of-view images, and then employed YoloV8n for potato eye position detection. Despite the improvements provided by the two-camera system, viewing-angle limitations were not completely overcome.
Currently, potato cutting predominantly relies on conventional mechanical cutting methods [4,21]. However, these methods cannot ensure that each seed piece contains potato eyes and maintains uniform sizes. To address this, Huang et al. [3] developed an intelligent system using deep learning and a delta robotic system for potato eye detection and cutting path planning. Although this represents a significant advancement in intelligent cutting systems, the system can only acquire potato eye information from a single viewpoint, leading to incomplete utilization of the potato’s overall eye information and potential damage to potato eyes. To overcome the limitations caused by the single-view issue, this study developed an intelligent 3D potato cutting simulation system based on machine vision and point cloud reconstruction. This system achieves a complete workflow of potato 3D point cloud reconstruction, potato eye detection and mapping, and potato cutting optimization. The main contributions of this study are as follows: (1) Developing an intelligent 3D potato cutting simulation system that overcomes single-view limitations by combining 2D information from YOLO detection with 3D point cloud data. (2) Proposing a method to compute the 3D positions of potato eyes based on back-projection and a clustering algorithm. (3) Formulating a single-objective cutting-path optimization function for trading off three criteria, and employing Bayesian optimization to generate cutting plans adapted to different potato-size categories.
The remainder of this paper is organized as follows. Section 2 provides a detailed description of materials and methods, including system workflow design, 3D point cloud reconstruction of potatoes, potato eye 3D position determination, potato cutting optimization algorithm, and experimental setup. Section 3 describes the evaluation metrics, and the presentation and discussion of results. Section 4 concludes the paper and outlines future work.

2. Materials and Methods

2.1. System Architecture

This section proposes the Intelligent 3D Potato Cutting Simulation System, which leverages reconstructed potato point clouds and detected 2D potato eye positions to perform accurate cutting simulations. The system consists of three modules: (1) potato 3D point cloud reconstruction (2) potato eye detection and mapping (3) potato cutting optimization. The workflow of the system is shown in Figure 1.
First, multi-view images of each potato are captured using a single-camera rotating platform. After being preprocessed, these images are used by Structure from Motion (SfM) to reconstruct a 3D point cloud of the potato.
Subsequently, a YOLOv5 model is used to detect potato-eye 2D positions in the captured multi-view images. Leveraging the correspondences between the point cloud and these images, each detected potato eye is then back-projected from the 2D image onto the reconstructed point cloud, thereby obtaining its corresponding 3D position. A clustering algorithm is then applied to the collection of back-projected 3D points to partition them into groups, each corresponding to a single potato eye, and determine their final 3D coordinates.
Finally, surface reconstruction is performed on the potato point cloud to calculate its volume. Based on this calculated volume, the corresponding number of cutting pieces is determined. A Bayesian optimizer then determines the optimal cutting paths by jointly considering the potato’s volume and the 3D coordinates of its eyes.

2.2. Potato 3D Point Cloud Reconstruction

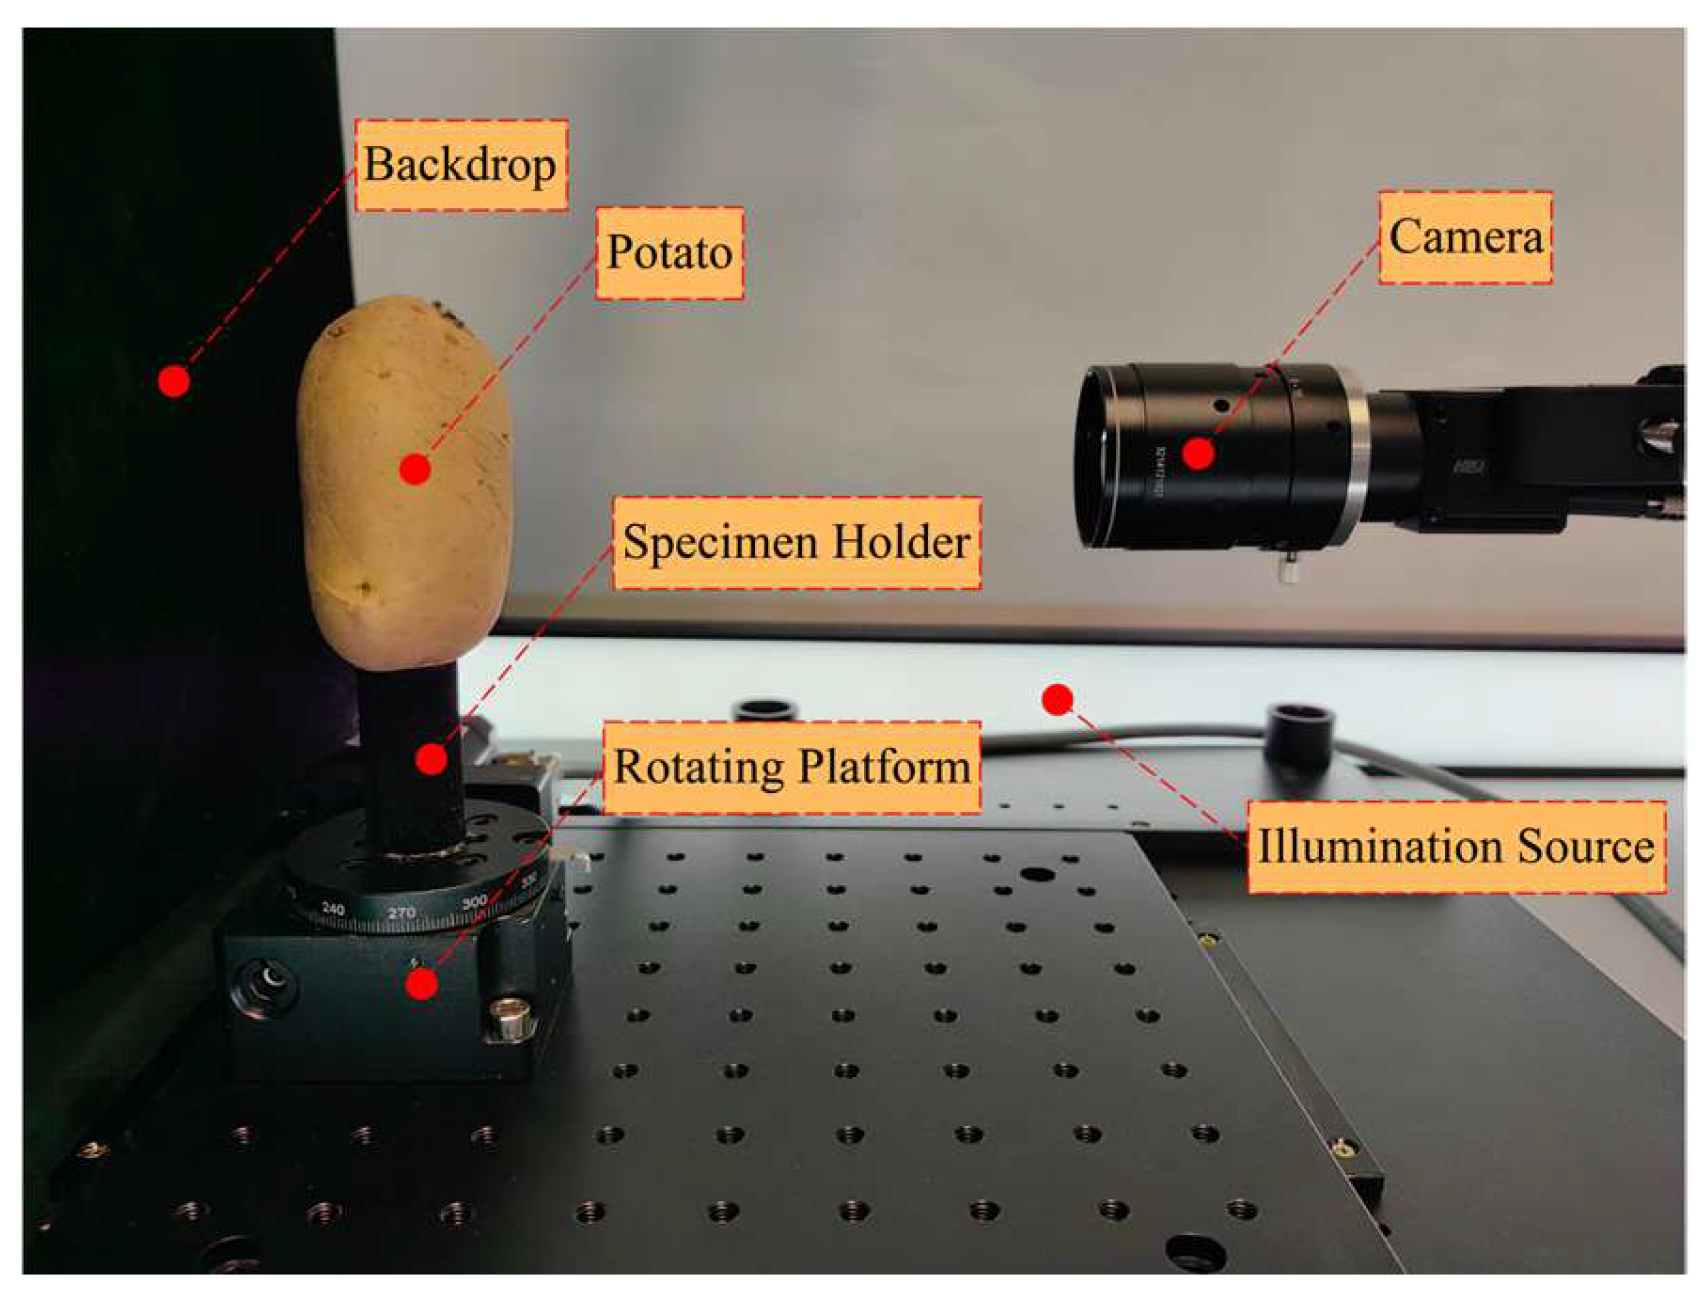
The 3D point clouds of potatoes were reconstructed using a multi-view image acquisition apparatus shown in Figure 2. The apparatus consists of an industrial camera, a rotating platform, and controlled illumination sources. To minimize background interference, a black backdrop and a black specimen holder were used. The platform was programmatically rotated in 10-degree increments, allowing the camera to capture images of each potato sample from 36 uniformly distributed viewpoints. Prior to the acquisition process, the camera was calibrated with a standard checkerboard to obtain its intrinsic parameters.
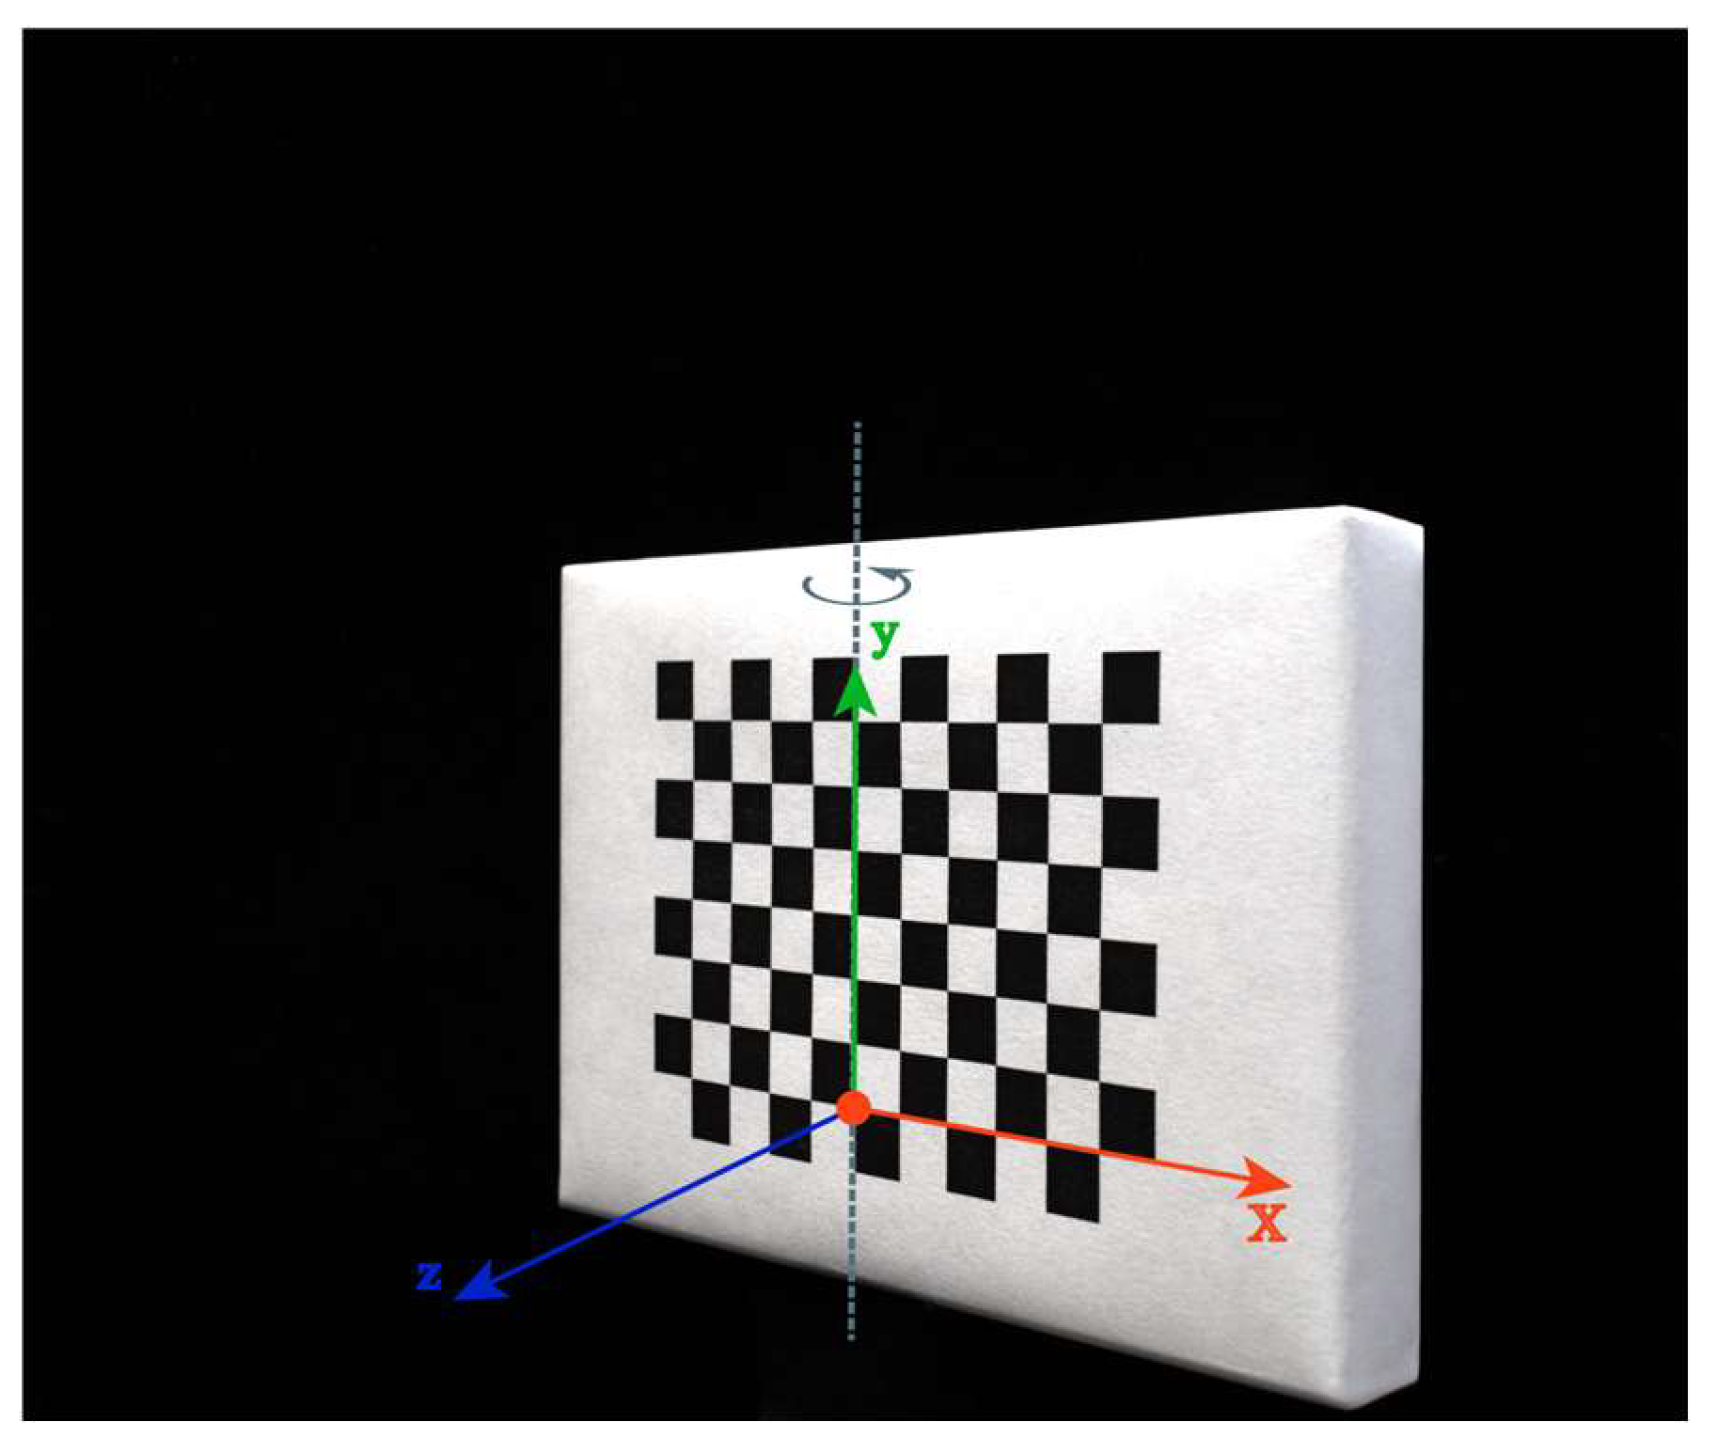
To establish the physical scale of the SfM-generated point cloud, an additional calibration step was required. In this step, a checkerboard was placed vertically on the rotating platform, with its designated coordinate origin aligned with the platform’s rotation axis. The coordinate system for the checkerboard is defined as shown in Figure 3. Furthermore, the checkerboard plane was positioned to form a 45° angle with a reference plane perpendicular to the camera’s optical axis, as illustrated in Figure 4 [22]. Subsequently, an image of the checkerboard in this configuration was captured by the camera. This captured image was processed using the Perspective-n-Point (PnP) algorithm to compute the camera’s pose (rotation and translation) relative to the checkerboard [23]. This pose information was used to recover the physical scale of the entire point cloud.
Since the accuracy of subsequent potato eye mapping and potato volume estimation relies on the quality of point cloud, we preprocessed the original images using adaptive histogram equalization and image sharpening to improve image details. This enabled the detection of more feature points, thereby increasing the final point cloud density. Subsequently, COLMAP 3.8 was used to perform feature extraction, feature matching, and sparse reconstruction on these preprocessed images. The scale was then recovered by the camera’s pose from the prior calibration step, resulting in a sparse point cloud model with physical scale.

2.3. Potato Eye Detection and Mapping

To achieve precise localization of potato eyes, we propose a method that combines 2D object detection with 3D mapping. First, YOLOv5, a deep-learning detector is used to detect potato eyes in the potato images, yielding the 2D pixel coordinates of each bounding box. Subsequently, the 3D mapping is performed in two steps. (1) These 2D coordinates are back-projected into the reconstructed 3D space. (2) The 3D coordinates of the potato eyes are determined by clustering the back-projected data points into groups corresponding to each potato eye. This module provides the positional data required for subsequent potato cutting while ensuring potato eye protection.

2.3.1. 2D-to-3D Back-Projection Method

Given the acquired sparse point cloud and calibrated camera parameters, the 2D-to-3D back-projection proceeds in two steps: (1) ray back-projection from 2D bounding-box centers, and (2) depth estimation from reconstructed 3D points whose 2D observation in the current image lies inside the corresponding bounding box.
According to the pinhole camera model, a 3D point X w = [ X , Y , Z ] T in the world coordinate system is first transformed to the camera coordinate system using the camera extrinsic parameters (rotation matrix R and translation vector T) as shown in Equation (1), and then projected onto the image plane by the camera intrinsic parameter matrix K as shown in Equation (2), producing the pixel coordinates x = [ u , v ] T .
X c = R X w + T ,
s u v 1 = K X c ,
where K is the camera intrinsic parameter matrix:
K = f x 0 c x 0 f y c y 0 0 1 ,
f x and f y are the focal lengths, ( c x ,   c y ) are the principal-point coordinates, and s is the scale factor.
For our task, the inverse operation is required. Given the pixel coordinates of a bounding-box center x = [ u , v ] T , we first back-project the pixel to a ray in the camera coordinate system, and then place the point at depth d along this ray to obtain the 3D coordinates X c in the camera coordinate system as shown in Equation (3). Finally, the point is transformed to the world coordinate system via the inverse of the camera extrinsic transformation as shown in Equation (4).
X c = d K 1 u v 1   ,
X w = R T X c T = R T X c R T T .
The key to back-projection lies in estimating the depth d . We estimate depth by distance-weighting reconstructed 3D points whose 2D observations in the current image lie inside the bounding box. For each bounding box, let { P i } i = 1 n be the selected reconstructed 3D points and let { u i } i = 1 n denote their corresponding observation pixels in the current image that lies inside this bounding box. Define
d i s t i = | | u i u b o x | | 2 ,
where u b o x is the bounding-box center. The n observation pixels nearest to the bounding-box center ( 3 n 5 ) are used, and the depth is obtained by a weighted average of the corresponding depths in the camera coordinate system, as shown in Equations (5) and (6), where d i is the depth of the reconstructed 3D point P i in the camera coordinate system, corresponding to the i - th observation pixel u i . If fewer than three valid observation pixels are available, the estimate is considered unreliable and the 3D coordinate is not computed for that bounding box. A small constant ε is used in Equation (6) to avoid division by zero.
d weighted = i = 1 n w i d i i = 1 n w i   ,
w i = 1 dist i + ε   .
The choice of the observation pixel usage range ( 3 n 5 ) and the setting that 3D coordinates are not calculated for bounding boxes with fewer than 3 observation pixels are based on prior experimental measurements. Since 3D coordinates are computed through back-projection from the bounding box center, observation pixels closer to the bounding box center provide more reliable depth estimates.
Lower bound n = 3 determination: We analyzed the average distance from observation pixels to the bounding box center in bounding boxes containing exactly n observation pixels to evaluate the reliability of boxes with limited observation pixels, while observing the potato eye recall under the corresponding lower bound n. Table 1 shows that the average distance from observation pixels to the bounding box center exhibits a decreasing-then-increasing trend, reaching the minimum value of 19.36 pixels at n = 3, indicating optimal depth estimation accuracy. Meanwhile, the recall remains stable at around 94% when the lower bound n = 1, 2, and 3. Therefore, we exclude bounding boxes with fewer than 3 observation pixels from 3D coordinate calculation.
Upper bound n = 5 determination: We further analyzed the average distance from each bounding box center to the closest n observation pixels. Table 2 demonstrates that as the number of observation pixels used increases, the average distance shows an ascending trend. When using 5 observation pixels, the average distance is 19.35 pixels, essentially consistent with the 19.36 pixels obtained at n = 3 in the lower bound analysis, indicating that similar depth estimation accuracy can still be maintained, therefore the upper bound n = 5.
Considering both depth estimation accuracy and detection completeness, we select ( 3 n 5 ) as the observation pixel usage range, which range avoids unreliable estimates due to insufficient features while preventing interference from excessive noise pixels.

2.3.2. Multi-View Clustering

The system first detects potato eye positions in each image, then back-projects the detections in all images to obtain a set of 3D candidate points. Because detections of the same potato eye from different views exhibit positional deviations, direct stacking would introduce redundancy and errors. We therefore apply DBSCAN (Density-Based Spatial Clustering of Applications with Noise) [24] to cluster all back-projected 3D candidates, merging spatially proximate candidates into clusters corresponding to individual potato eyes.
DBSCAN determines whether a point is a core point by counting neighbors within a neighborhood radius and groups density-connected points into the same cluster. The two key parameters of the algorithm are the neighborhood radius and the minimum sample number, which are set to 3 mm and 3, respectively, based on prior experimental data. After clustering, the centroid C k of each cluster is taken as the final 3D position of potato eye k .
To protect potato eyes during subsequent cutting, we define a spherical safety region around each cluster center:
S k = { X 3 |   | | X C k | | 2 r k } ,
where r k is the safety sphere radius, calculated from the 3D corner points of all bounding boxes assigned to cluster k:
r k = 1 Corners k Q j Corners k | | Q j C k | | 2 ,
where Corners k denotes the set of 3D coordinates of the bounding box corners associated with cluster k . Each corner Q j is obtained by back-projecting the corresponding 2D bounding box corner from the YOLOv5 detection using the same estimated depth as the box center. The resulting safety radius r k reflects the effective size of the potato eye and is used as a constraint in the cutting path optimization to prevent damage to potato eyes.

2.4. Potato Cutting Optimization

To enable cutting-path optimization and select an appropriate cutting tool, we also estimate the potato volume. Based on the COLMAP sparse reconstruction, we remove noisy 3D points by performing threshold filtering on the multi-view reprojection errors and track lengths recorded in the points3D.txt file. We then reconstruct a watertight mesh with the Alpha-Shape method and compute its volume as the potato volume.
To improve potato utilization, following Meng et al. [25], we categorize potatoes into three classes: 50 ≤ m ≤ 100 g are cut into two pieces with an I-type blade; 100 < m ≤ 150 g are cut into three pieces with a Y-type blade; and m > 150 g are cut into four pieces with an X-type blade. To interface this categorization with our volume-based optimization, we convert mass thresholds to volume thresholds using the batch-averaged density ρ (g/cm3) measured from the experimental samples. Accordingly, the three classes correspond to the volume ranges 50/ρ ≤ V ≤ 100/ρ, 100/ρ < V ≤ 150/ρ, and V > 150/ρ cm3.
Given the watertight mesh of the potato and the spherical safety regions for each potato eye, we employ a global search based on Bayesian optimization to determine optimal cutting-tool pose parameters. This process is formulated as a single-objective optimization that trades off three criteria: (i) volume uniformity—a uniform distribution of cut piece volumes; (ii) potato eye uniformity—a uniform allocation of potato eye counts across cut pieces; and (iii) protection of potato eye regions.
We represent the cutting-tool pose parameters vectors by x = c x ,   c y ,   c z ,   θ ,   ϕ ,   α , where c x ,   c y ,   c z denotes the cutting center coordinates, fine-tuned within ±3 mm of the potato centroid; θ and ϕ are, respectively, the polar and azimuth angles of the cutting plane normal in the spherical coordinate system, which control the spatial inclination of the cutting tool. The polar angle θ is the angle between the z-axis and the radial vector, with range [ 0 , π ] ; the azimuth angle ϕ is the angle between the x-axis and the projection of the radial vector on the x y plane, with range 0 , 2 π . The angle α specifies the initial rotation of the cutting tool and is limited to 0 , 2 π / N .
Based on the pose parameters, we establish an orthonormal cutting coordinate frame e 1 ,   e 2 ,   e 3 . The tool axis e 1 is determined by the polar angle θ and the azimuth ϕ as shown in Equation (9). The remaining unit vectors e 2 and e 3 are then obtained using Equations (10) and (11), where base denotes an auxiliary vector chosen as 1 , 0 , 0 T or 0 , 1 , 0 T so that it is not parallel to e 1 .
Subsequently, based on the cutting coordinate frame e 1 ,   e 2 ,   e 3 and the initial rotation α , the normal n l and the tangent t l of the l - th cutting plane are defined as shown in Equation (12). The l - th blade angle α l is given by Equation (13), where N denotes the number of cut pieces.
The l - th potato cutting piece is formed from a sector region anchored at the cutting center c and bounded by the half-planes of the two adjacent cutting planes with normals n l 1 and n l   n 0 = n N , where each half-plane is selected by the corresponding tangent direction t l 1 and t l   t 0 = t N as defined in Equation (12). The specific cutting operation is implemented using the slice_plane function of the Trimesh library.
e 1 = sin θ cos ϕ sin θ sin ϕ cos θ
e 2 = e 1 × base e 1 × base 2
e 3 = e 1 × e 2 e 1 × e 2 2
n l = cos α l e 2 + sin α l e 3 , t l = sin α l e 2 + cos α l e 3
α l = α + 2 π l 1 N , l = 1 , 2 , , N
To determine whether the cutting blade intersects with potato eyes, spherical safety regions S k are constructed around each potato eye center, with center C k and radius r k , where k indexes potato eyes. The vector from the cutting center c to the k - th potato eye center C k is defined as
Δ p k = C k c .
For the l - th cutting plane, the projections of Δ p k onto the normal and tangential directions are computed respectively:
δ k , l n = n l Δ p k , δ k , l t = t l Δ p k .
The normal component δ k , l n measures the distance from the potato eye center to blade l , and the tangent component δ k , l t indicates whether the center lies on the selected half-plane of that blade. Therefore, the effective distance from the k - th potato eye center to the l - th blade is
d k , l x = δ k , l n if δ k , l t 0 , δ k , l n 2 + δ k , l t 2 if δ k , l t < 0 .
The minimum effective distance from the k - th potato eye to all blades is
δ k x = min l = 1 , 2 , , N d k , l x ,
and the cutting depth of the k - th potato eye is.
d k x = max 0 , r k δ k x .
To address the multi-criteria requirements of volume uniformity, potato eye uniformity, and potato eye protection, we define a composite single objective function f x as shown in Equation (19). Coefficients of variation are used to normalize the volume and potato eye count metrics, eliminating the dimensional incompatibility and enabling proper weighting in the objective function. Minimizing this objective function improves both volume uniformity and the balance of potato eye allocation while penalizing any potato eye cuts.
f x = k D x 100 d k x if D x 1 w v CV v x + w e CV e x if D x = 0
  CV v x = σ v x μ v x = 1 N l = 1 N V l x μ v x 2 μ v x μ v x = 1 N l = 1 N V l x
CV e x = σ e x μ e x = 1 N l = 1 N E l x μ e x 2 μ e x μ e x = 1 N l = 1 N E l x
where D x donates the set of potato eyes that would be cut by the blades, and its cardinality | D x | is the number of such cut potato eyes; d k ( x ) is the cutting depth of the k - th potato eye (potato eye sphere radius minus the distance from sphere center to the nearest cutting plane, see Equation (18)); the coefficient 100 serves as a large penalty to strongly discourage cutting potato eye regions. CV v x is the volume coefficient of variation, defined in Equation (20) as the standard deviation of cut piece volumes divided by the average volume, where V l x is the volume of the l - th cut piece and μ v x is the average volume; CV e x is the potato eye count coefficient of variation, defined in Equation (21) as the standard deviation of potato eye counts per cut piece divided by the average count, where E l x is the number of potato eyes in the l - th cut piece and μ e x is the average potato eye count. The weights w v and w e control the relative importance of volume uniformity and potato eye uniformity, respectively; in this study we set w v = 1.0 and w e = 1.0.
Based on this objective function, we employ Bayesian optimization to search the parameter space and determine the optimal cutting parameters x * that minimize f x . In implementation, Latin Hypercube Sampling (LHS) is used for initial space exploration [26]; Expected Improvement (EI) is adopted as the acquisition function [27]; the number of initial random samples is set to 60 (10 times the problem dimension) [28]; and the total number of evaluations is 120 (the initial samples account for 50% of the total). This approach effectively balances global exploration and local refinement under limited computational resources, and mitigates convergence to local optimal [29]. After optimization, the obtained optimal cutting parameters x * = c x * ,   c y * ,   c z * ,   θ * ,   ϕ * ,   α * are directly used to determine the cutting tool orientation.

2.5. Experimental Setup

To validate the proposed system, we selected a total of 90 Jiuen No.12 potatoes of different sizes, with 60 used for training and 30 for testing. Jiuen No.12 is a common commercial potato variety characterized by round-elliptical to elliptical shapes. For each test specimen, we measured its true mass and volume. From these measurements, we calculated an average density of ρ = 1.06 g/cm3. Using this density to convert the mass-based classes to volume, the corresponding volume ranges are defined as: Small (47 ≤ V ≤ 94 cm3), Medium (94 < V ≤ 141 cm3), and Large (V > 141 cm3). The test samples included 10 small, 10 medium, and 10 large potatoes, with volumes of 56–182 cm3 and 5–10 eyes per potato. These diverse samples were used to assess the system’s robustness and adaptability.
The computational experiments were conducted on a desktop computer equipped with an Intel i7-8750H processor, 16GB RAM, NVIDIA GTX 1050Ti graphics card, Windows 10 operating system, and Python 3.10 programming environment. For image acquisition, an MV-CS050-10UC camera (2448 × 2048 pixels) with a 12-mm focal-length lens was employed following the method described in Section 2.2. For true values of volume measurements, we used the water displacement method to determine the volume of each sample, and potato eye counts were manually annotated by professional personnel. This experimental setup provides the foundation for evaluating the system performance presented in Section 3.

3. Results and Discussion

This section presents and discusses the experimental results of the intelligent 3D potato cutting simulation system. The system performance is evaluated from multiple perspectives, including potato eye detection and mapping, volume estimation, cutting optimization, and comprehensive performance comparison with existing methods. In the subsequent analysis, precision and recall, defined in Equations (22) and (23), were used to evaluate potato eye detection; Mean Absolute Error (MAE) and Mean Absolute Percentage Error (MAPE), defined in Equations (24) and (25), were used to evaluate volume estimation; and CVᵥ and CVₑ, defined in Equations (20) and (21), were used to evaluate cutting optimization results.
Precision = TP TP + FP ,
Recall = TP TP + FN ,
MAE = 1 n i = 1 n | V ^ i V i | ,
MAPE = 100 % n i = 1 n | V ^ i V i | V i ,
where V ^ i is the estimated volume, V i is the true volume, and n is the number of samples; TP, FP, and FN denote true positives, false positives, and false negatives, respectively.

3.1. Potato Eye Detection and Mapping Results

Figure 5 shows the potato eye detection results based on YOLOv5 for single views and the corresponding back-projection results; one panel shows back-projection onto the sparse point cloud, and another shows back-projection onto a same-view dense point cloud for clearer visualization of eye locations. The single-view detection results demonstrate that the system can accurately identify potato eye positions on the potato surface and estimate their 3D positions by back-projecting the detections using depths estimated from observation pixels inside the bounding box. If fewer than three such observation pixels are available, the estimate is considered unreliable and no back-projection is performed. The results show that single-view detection results can be correctly back-projected onto the 3D space.
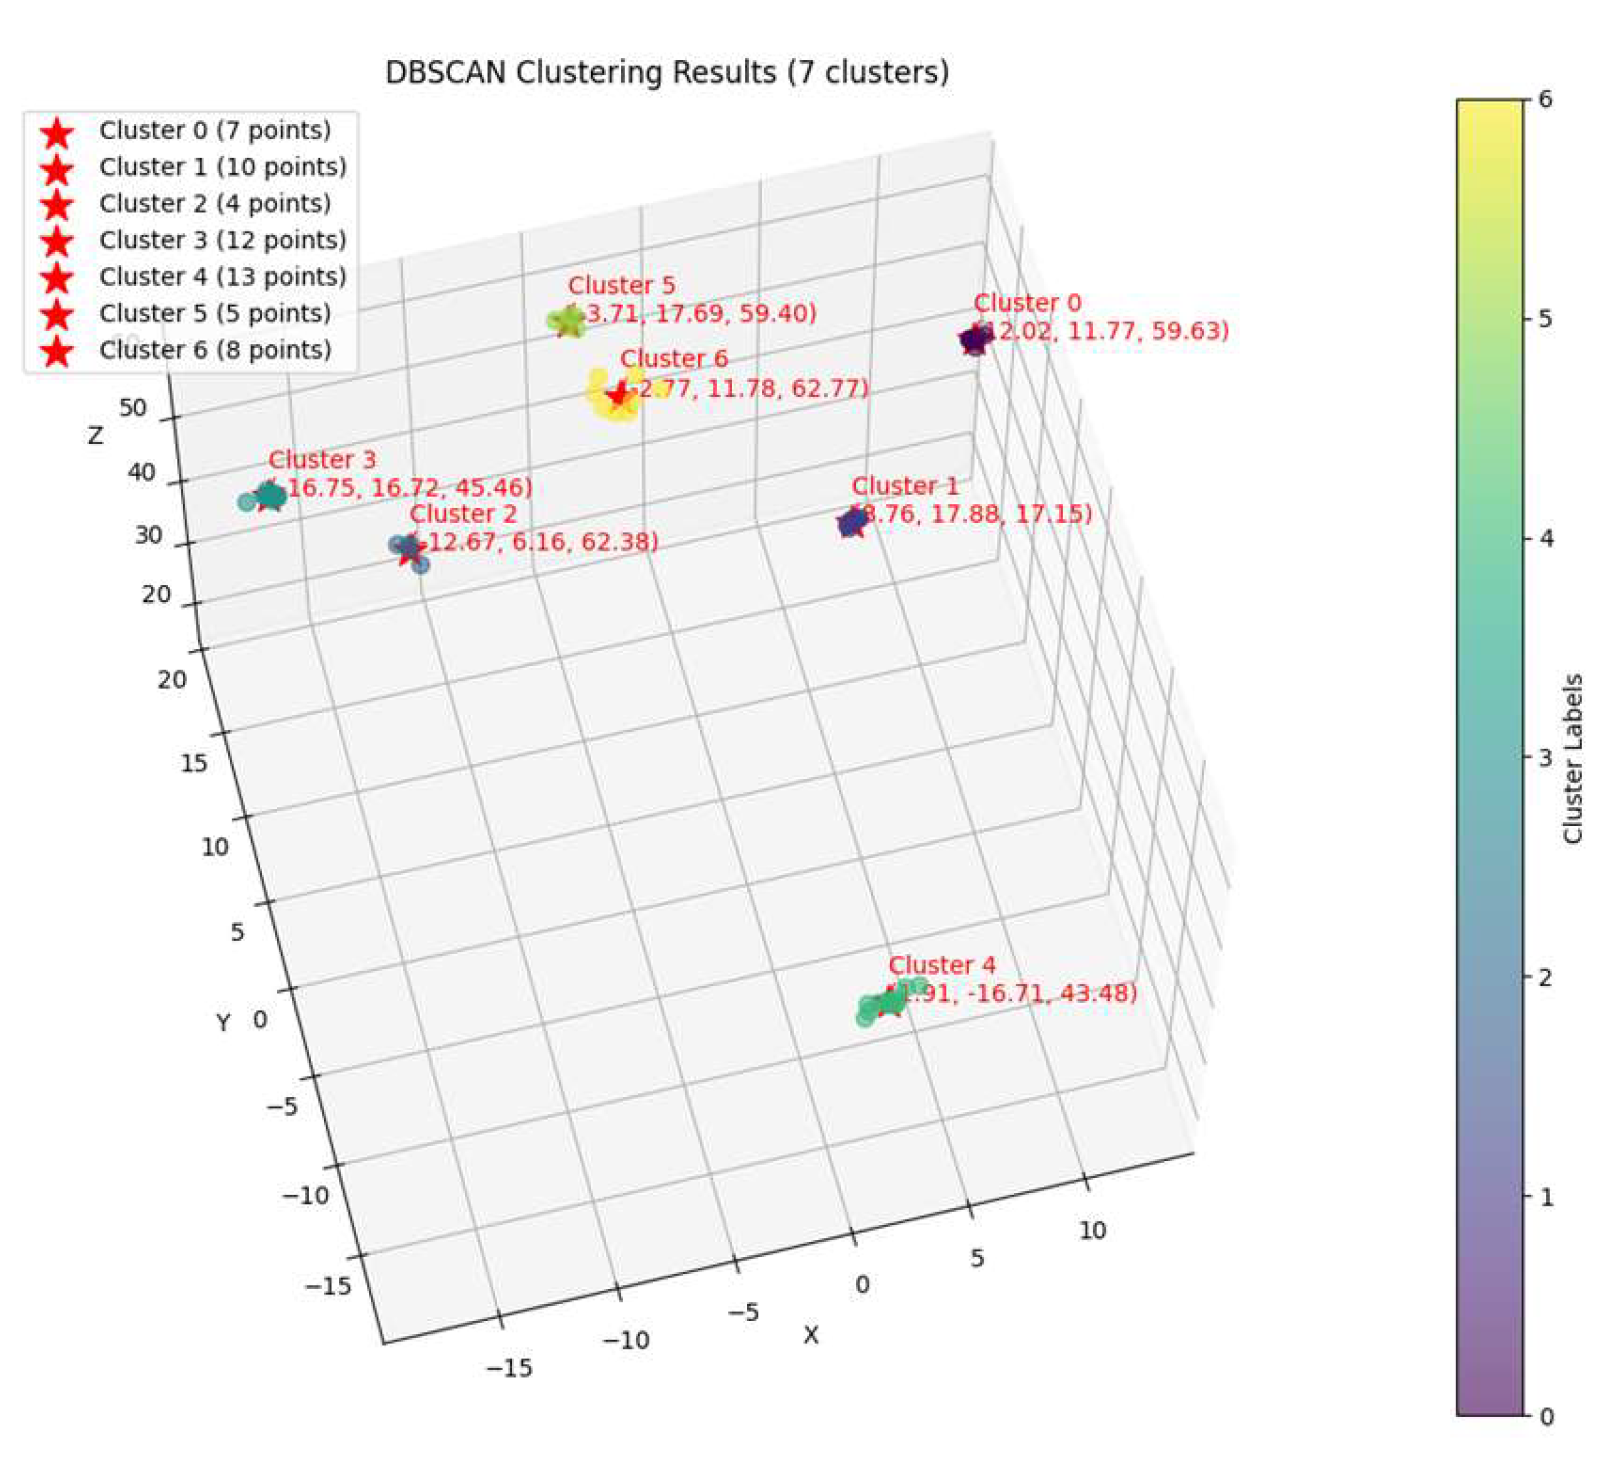
To address the positional deviations caused by multiple detections of the same potato eye from different viewpoints being back-projected into 3D space, we apply DBSCAN to cluster the 3D back-projected detections across views. The clustering results are shown in Figure 6. The centroid of each cluster is taken as the final 3D position of the corresponding potato eye. Figure 7 presents the potato eye centroids in 3D space before and after clustering. The fused results demonstrate that the system can accurately locate the potato eye distribution on the potato surface. From Figure 6, we can see that some potato eyes were only detected in 4 or 5 viewing angles. Compared to single-view detection, the multi-view approach significantly reduces missed detections, effectively improving the completeness of potato eye recognition.
Table 3 details the potato eye detection results of 30 potato samples. Statistical analysis shows that the system overall achieved a recall of 94% and a precision of 98%. From individual samples, most samples achieved 100% detection recall rate, but a few samples had decreased recall rates. On one hand, when detecting potatoes from the same batch, the camera must remain fixed, resulting in different proportions of large and small potatoes in the image. Some large and tall potatoes, due to camera viewing angle limitations, form observation blind spots in the top regions of potatoes, making it impossible to capture potato eye information at the top. On the other hand, physical occlusion exists in the bottom region of potatoes near the rotating platform’s specimen holder, affecting potato eye detection in that area. These limitations led to decreased detection recall rates for individual potatoes, with Sample 11 having a recall rate of only 63% because the potato eyes were located in concave areas on the top region, creating observation blind spots for the camera.
These results indicate that although individual potatoes had lower recall rates due to single-camera viewing angle limitations and physical occlusion in the bottom regions, the multi-view fusion mapping strategy still effectively compensates for occlusions and missed detections inherent in single-view setups, providing reliable 3D potato eye data for subsequent cutting optimization.

3.2. Volume Estimation Results

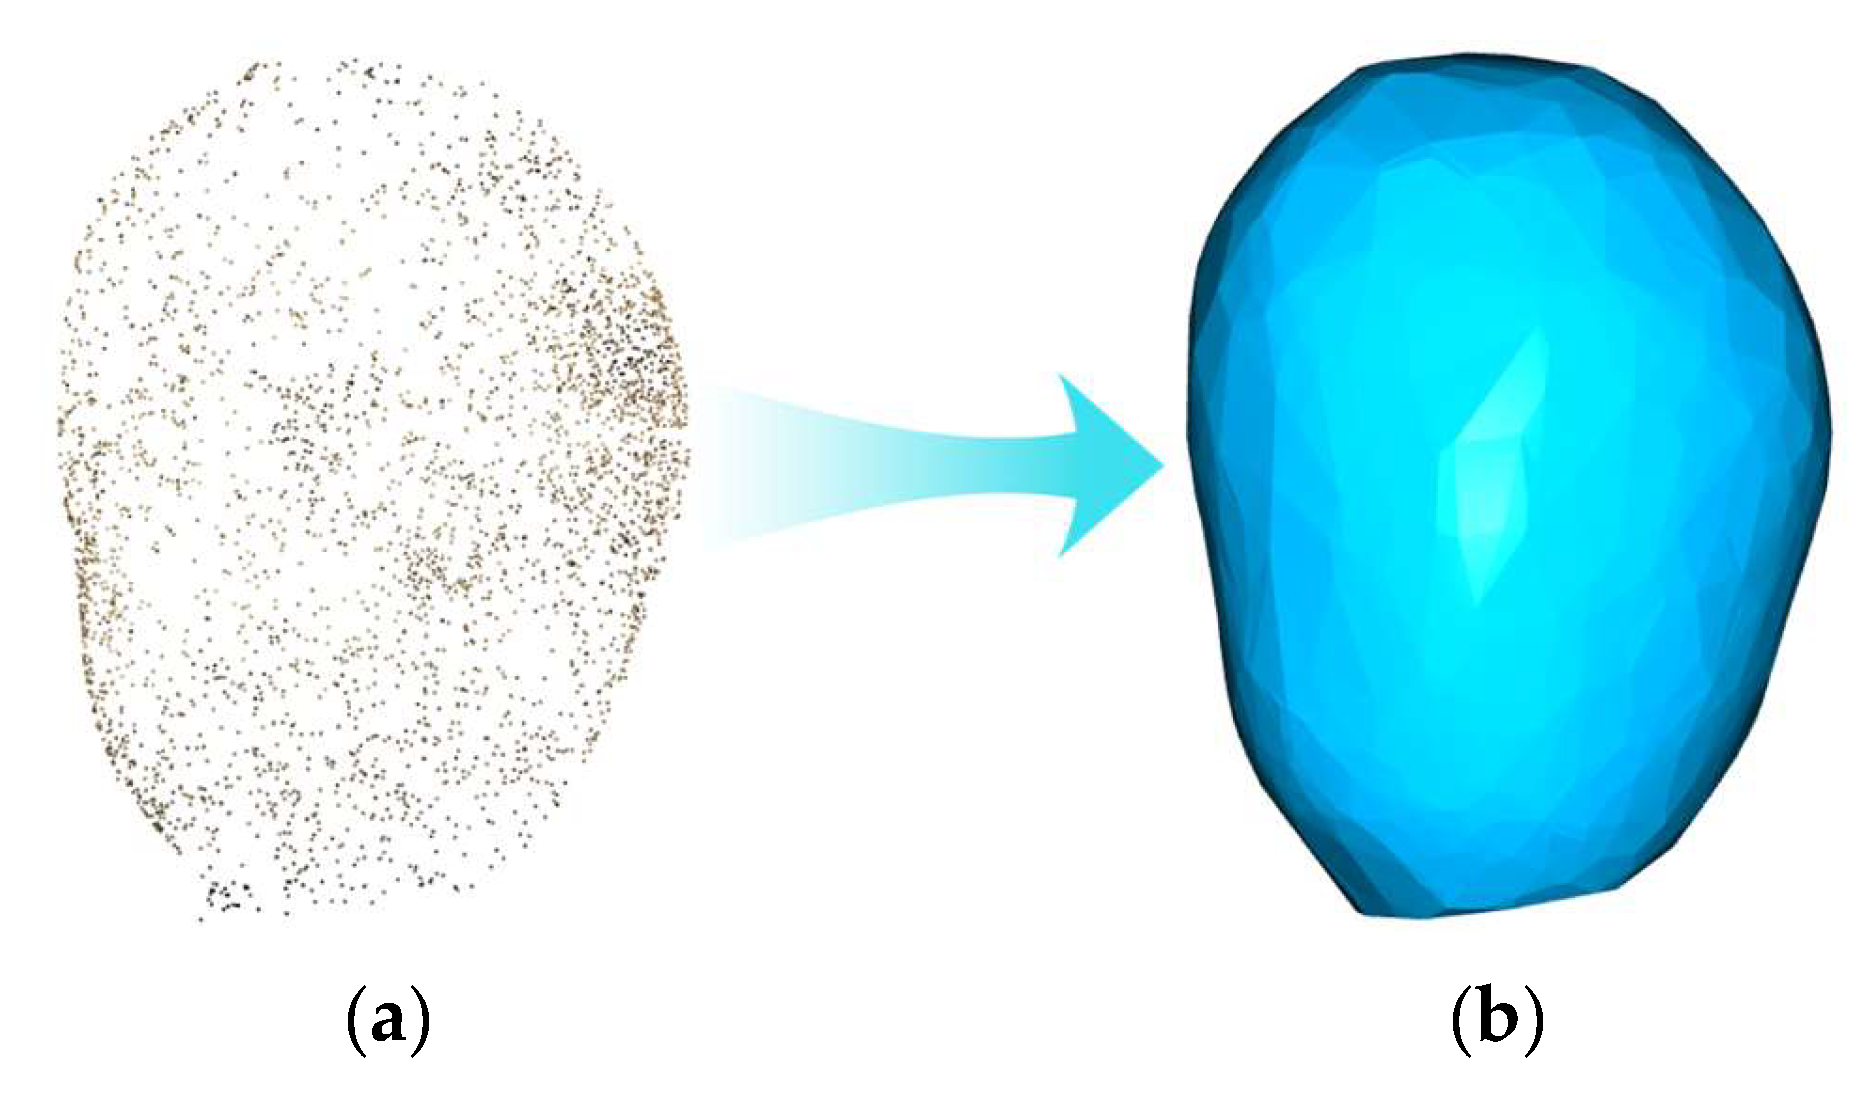
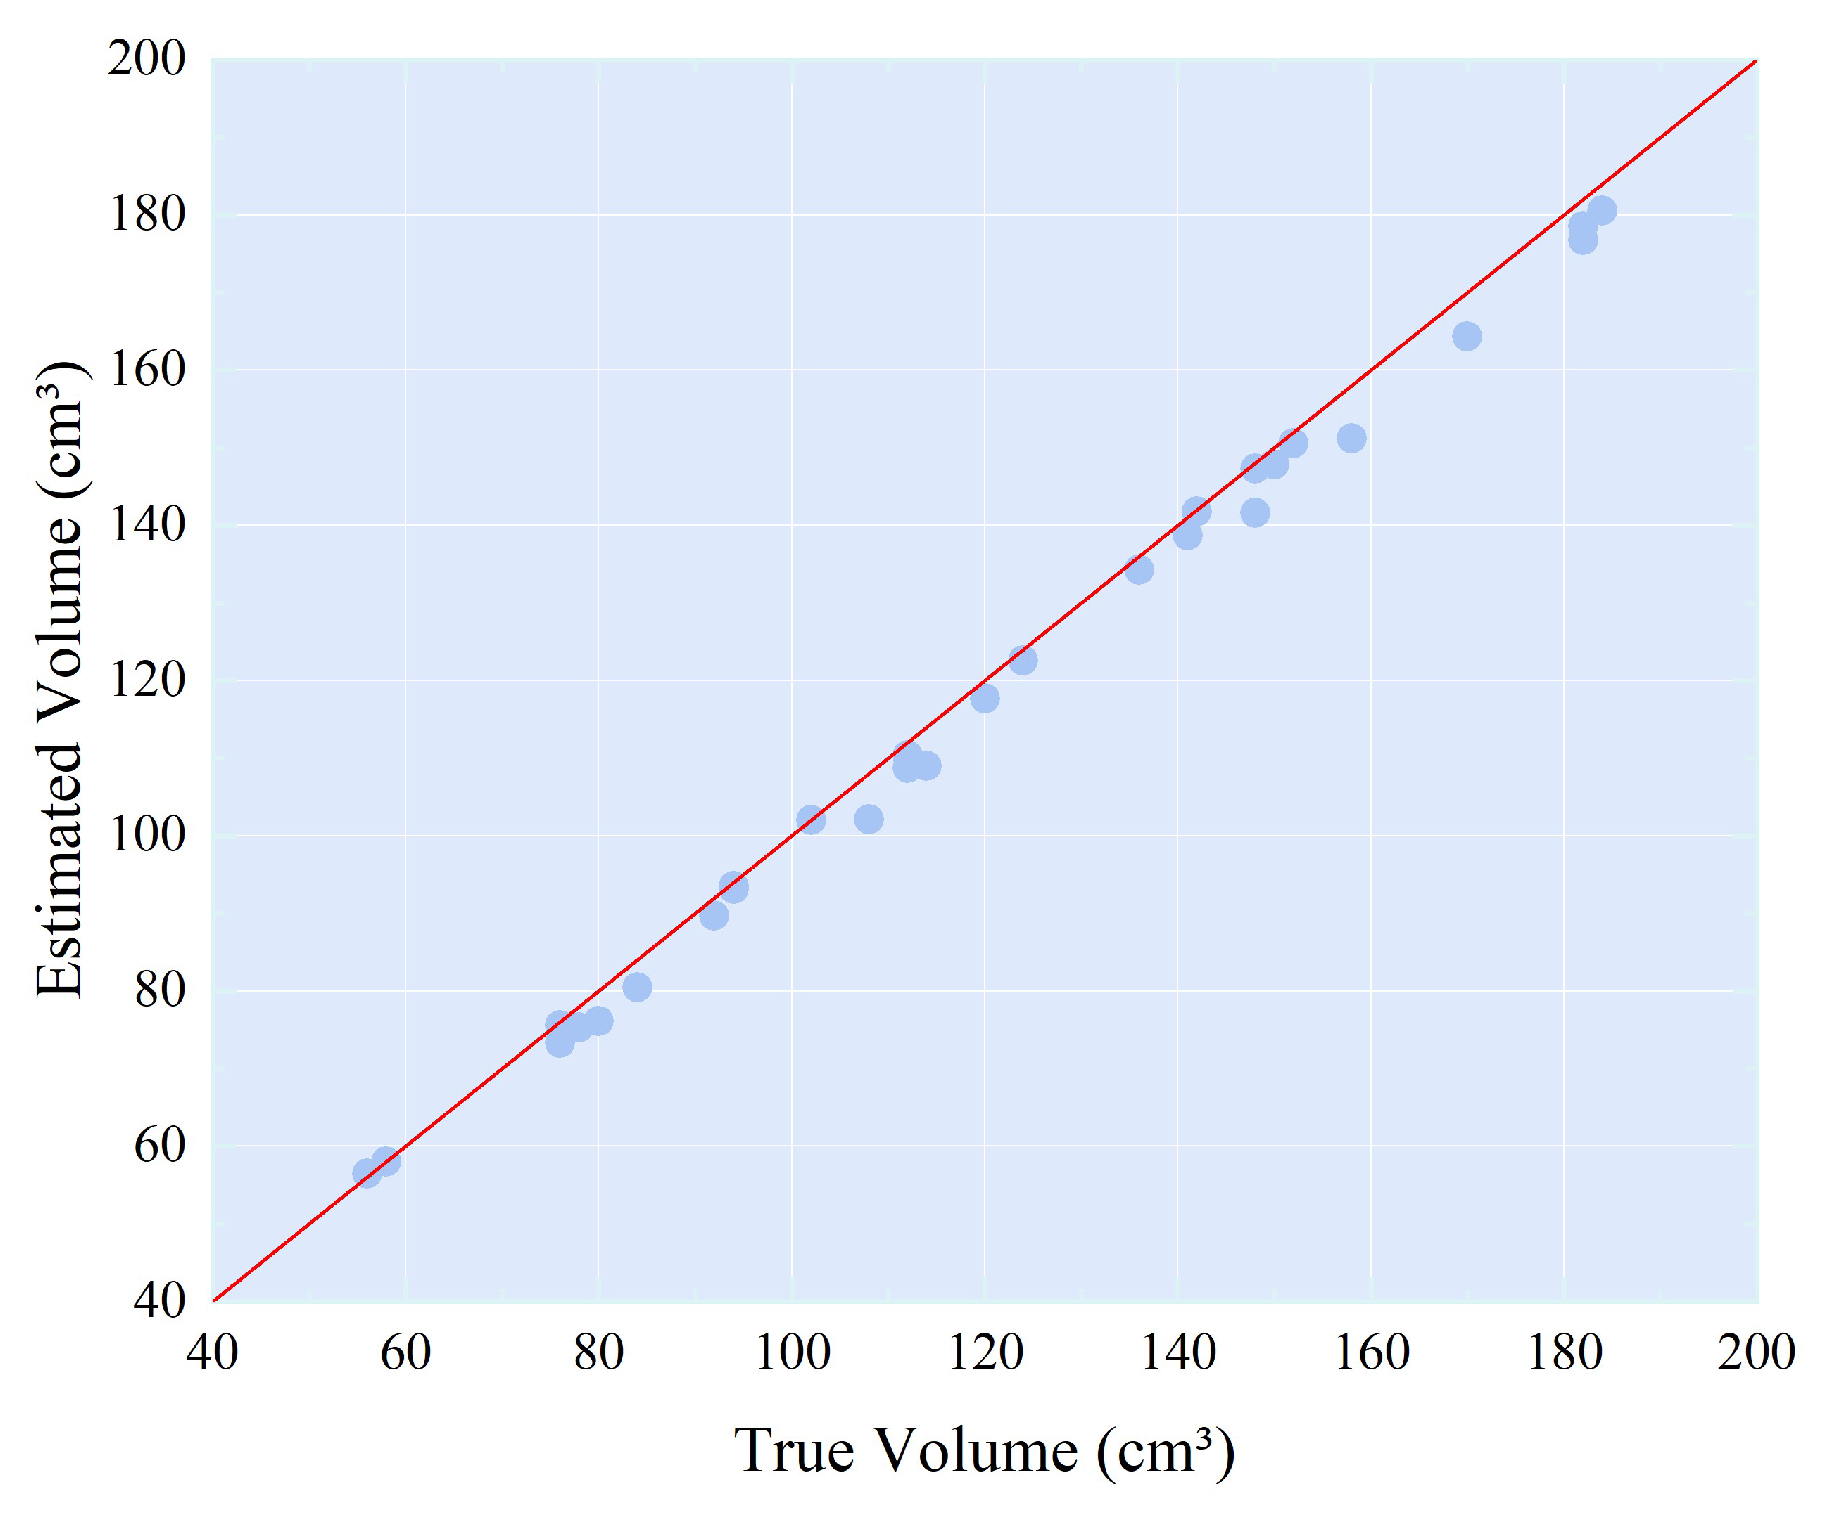
Based on the watertight mesh reconstructed using the Alpha-Shape method as shown in Figure 8, we performed volume estimation and potato eye detection on 30 test samples and compared the results with true values.
Figure 9 shows the scatter plot between estimated volumes and true volumes measured by the water displacement method. The red line represents the x = y reference line, indicating the ideal case where estimated volumes perfectly match true volumes. Each point corresponds to one of the 30 potato samples. The results show that most data points are located below the reference line, indicating systematic underestimation. According to Table 3, quantitative analysis reveals that 93.3% of samples were underestimated, with a mean bias of −2.58 cm3. Among all samples, 96.7% of samples had absolute percentage error within 5%, with a maximum absolute percentage error of 5.42%. These results indicate that although there is slight systematic underestimation, the overall accuracy is high.
The main causes of systematic underestimation may include two factors: (1) Camera viewing angle limitations: Due to limitations in camera installation position and shooting angles, blind spots may exist in the top regions of potatoes during multi-view image acquisition, resulting in incomplete acquisition of top region geometric information during the 3D reconstruction process. (2) Rotating platform occlusion: When potatoes are placed on the rotating platform’s specimen holder, the holder occludes the bottom region of each potato, making it impossible to capture partial contour information of the bottom region. The combined effect of these two factors is the primary cause of systematic underestimation in volume estimation.
To further evaluate the method’s adaptability to potatoes of different sizes, the 30 samples were grouped into three volume ranges for analysis, with results shown in Table 4. The table shows that as potato size increases, the MAE exhibits an increasing trend, rising from 1.731 cm3 in the small-volume group to 3.557 cm3 in the large-volume group. The MAPE remains relatively stable across different volume groups. This indicates that although large-volume potatoes have a larger MAE, this is mainly a natural result of the increased volume base. The overall average MAPE reaches 2.16% (95% CI: 1.60–2.73%), providing reliable geometric information for subsequent cutting optimization.

3.3. Cutting Optimization Results

Based on the aforementioned potato eye detection and volume estimation results, this section focuses on analyzing the performance of potato cutting planning based on Bayesian optimization. The objective of cutting optimization is to simultaneously achieve volume uniformity and potato eye uniformity while protecting the potato eye regions. The cutting optimization system automatically determines the number of cutting pieces based on potato volume, with the corresponding number of cutting pieces defined as: Small (47 ≤ V ≤ 94 cm3), cut into two pieces; Medium (94 < V ≤ 141 cm3), cut into three pieces; and Large (V > 141 cm3), cut into four pieces. Representative cutting simulation results for the three potato size categories are shown in Figure 10. The cutting quality is objectively evaluated using two core metrics, CVᵥ and CVₑ.
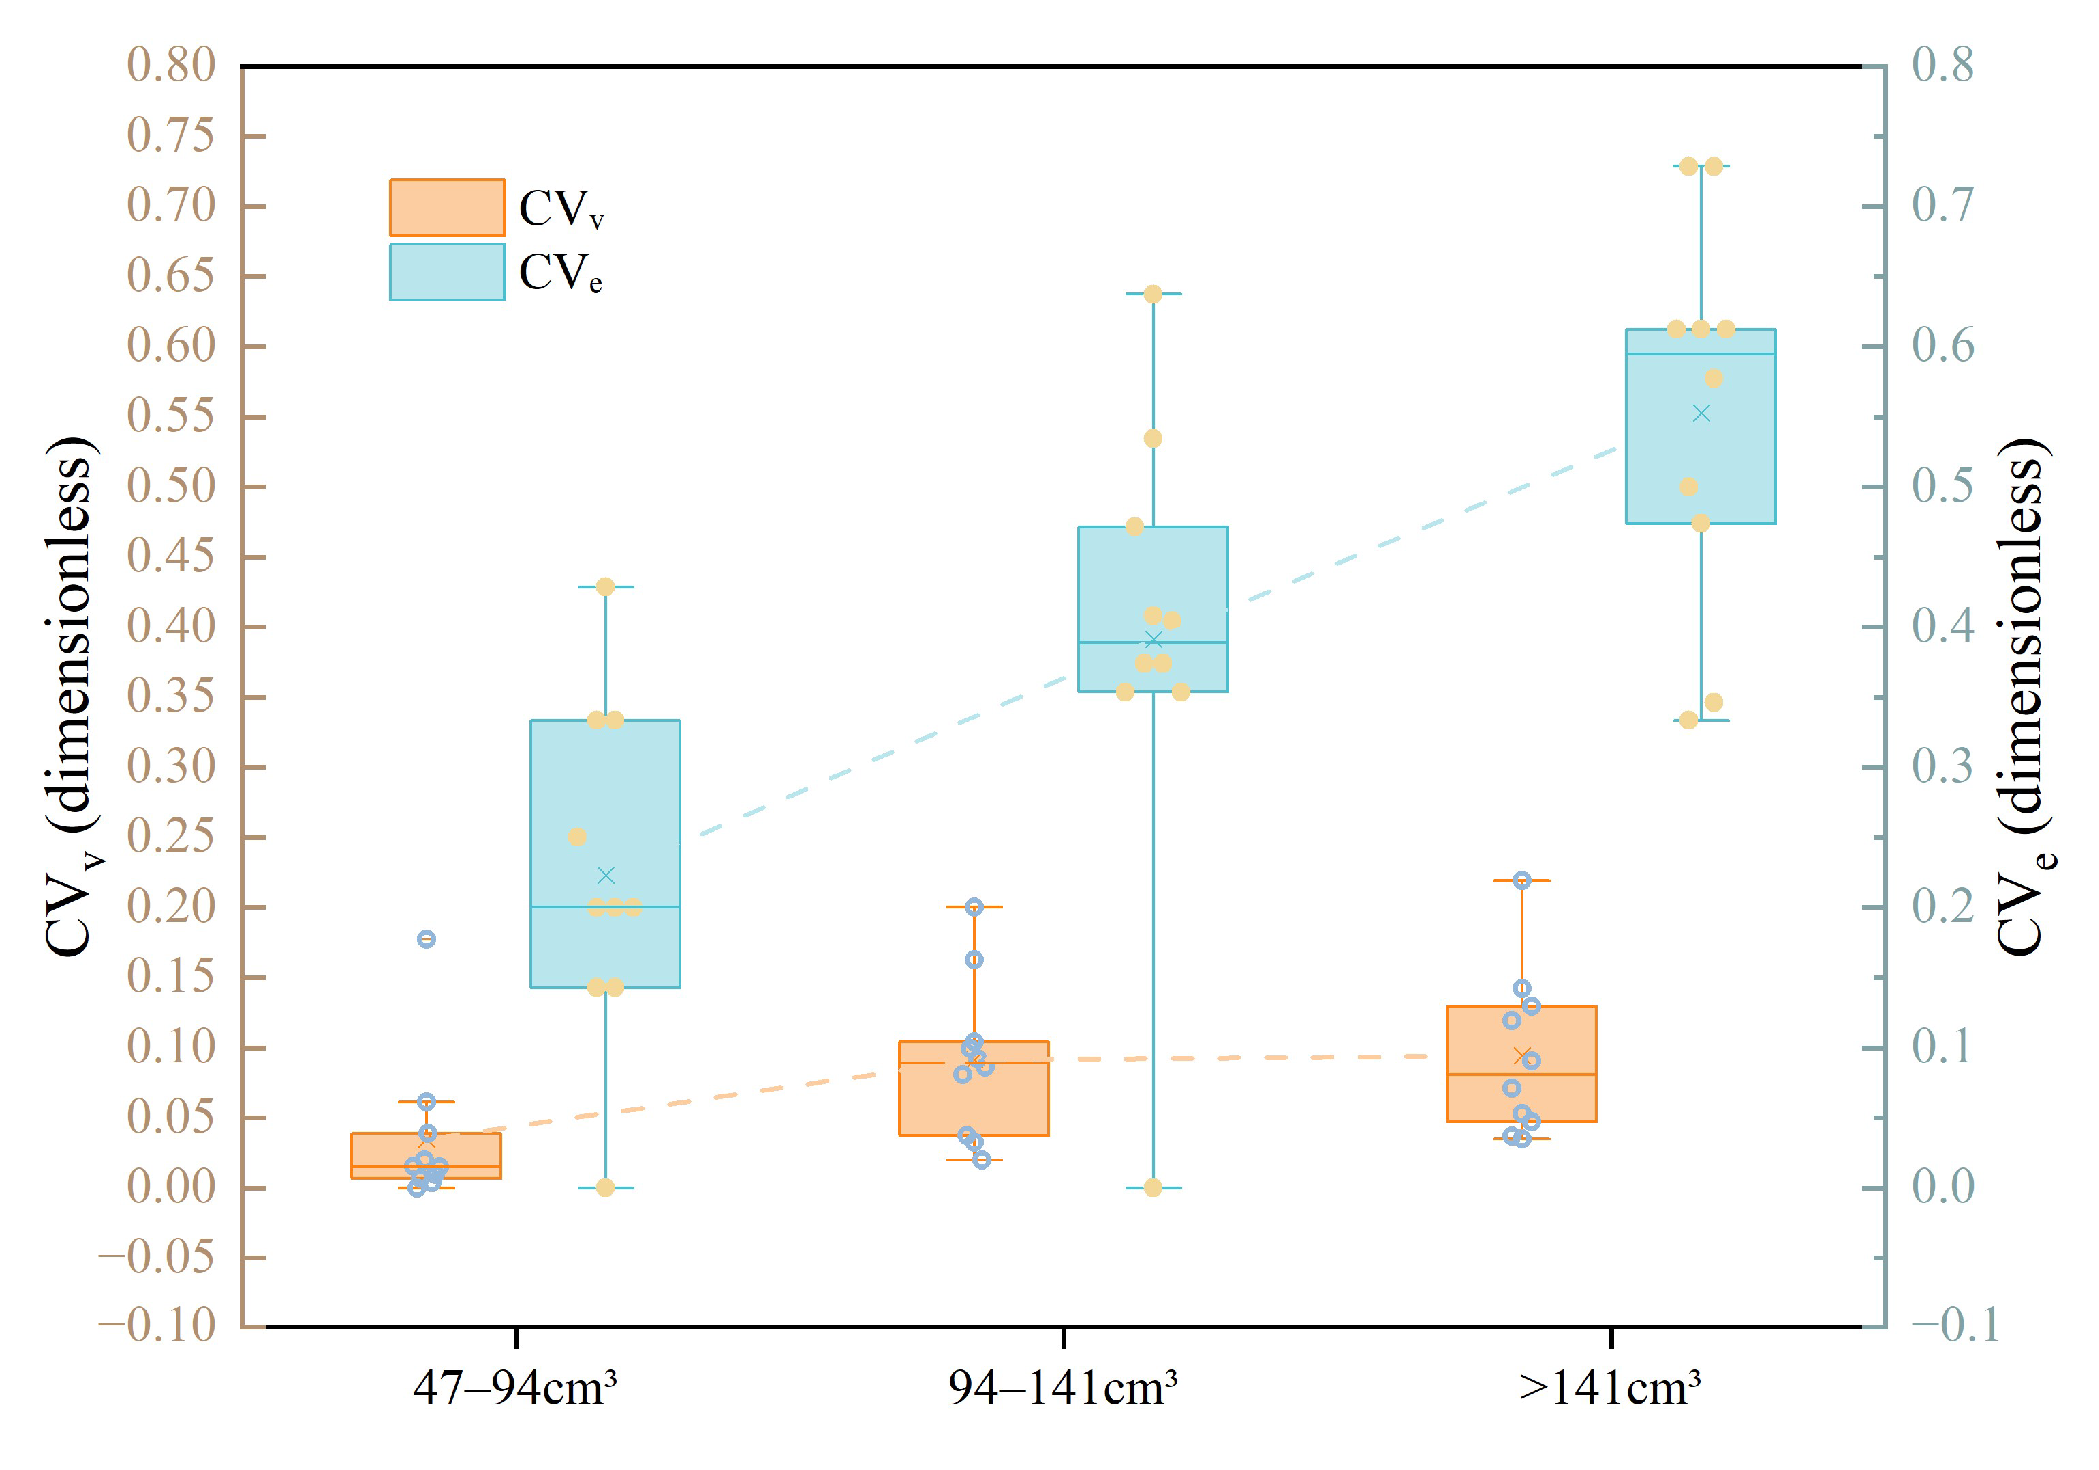
Table 5 shows the statistical results of cutting performance for potatoes in different volume ranges, where values represent the averages of samples within each range. From the overall performance, the average CVᵥ for each volume group is controlled below 0.10, with the small-volume group performing best (0.0347), indicating that the system achieves a good level of volume uniformity. It can be observed that as the number of cutting pieces increases, both CVᵥ and CVₑ also increase, demonstrating that complexity increases with the number of cutting pieces. When there are more cutting pieces, maintaining volume uniformity and potato eye balance becomes more challenging. Compared to CVᵥ, CVₑ shows larger values, which is primarily caused by the natural distribution characteristics of potato eyes. Despite this, the system achieved 100% potato eye protection rate across all test samples, minimizing potato eye damage.
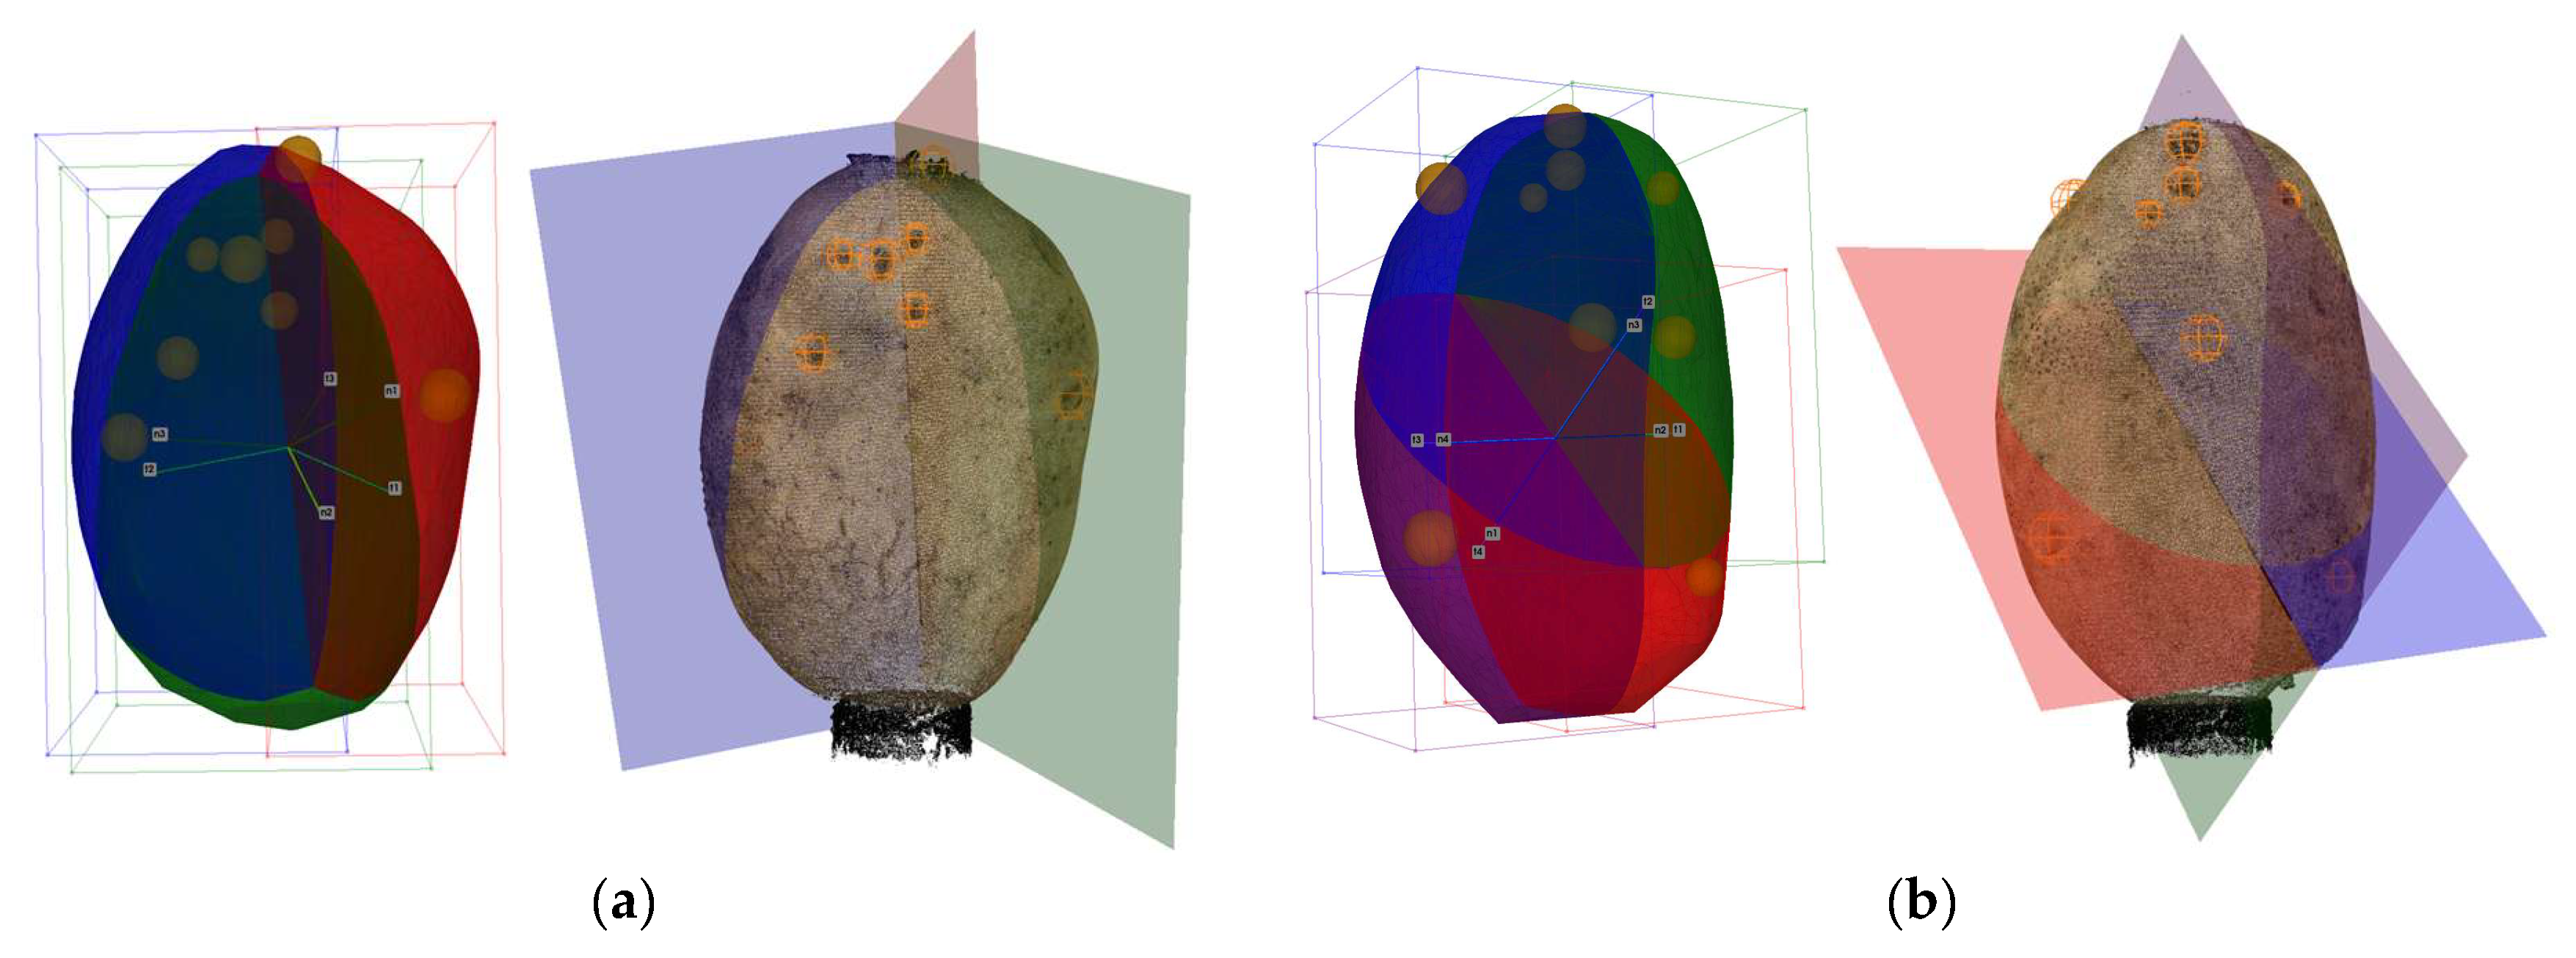
The box plots in Figure 11 further reveal the distribution characteristics of cutting performance. For the CVᵥ, all three groups exhibit small interquartile ranges and relatively concentrated distributions. In contrast, the overall fluctuation of the CVₑ is significantly larger than that of the CVᵥ, reflecting the inherent uneven distribution characteristics of potato eyes. This is particularly evident in large-volume potatoes (>141 cm3). The cutting results of typical samples in Figure 12 demonstrate the specific manifestation of this unbalanced distribution: Sample 16 was cut into 3 pieces with potato eye counts of 2, 5, and 1 respectively; Sample 30 was cut into four pieces with potato eye counts of 1, 2, 5, and 1 respectively. Both samples show obvious potato eye clustering phenomena. This occurs because the top region of potatoes is the most densely populated area for potato eyes, typically with 3–5 clustered together, while the bottom end, which connects to the stolon, has almost no potato eyes. During the cutting process, combined with the use of fixed-shape cutting tools, the concentrated potato eye region at the top is often allocated to the same cutting piece to ensure potato eye integrity, resulting in non-uniformity in potato eye distribution. Despite this, the system can effectively utilize the detected potato eye information to produce uniformly sized seed pieces, each containing at least one potato eye, meeting the requirements for mechanized planting.
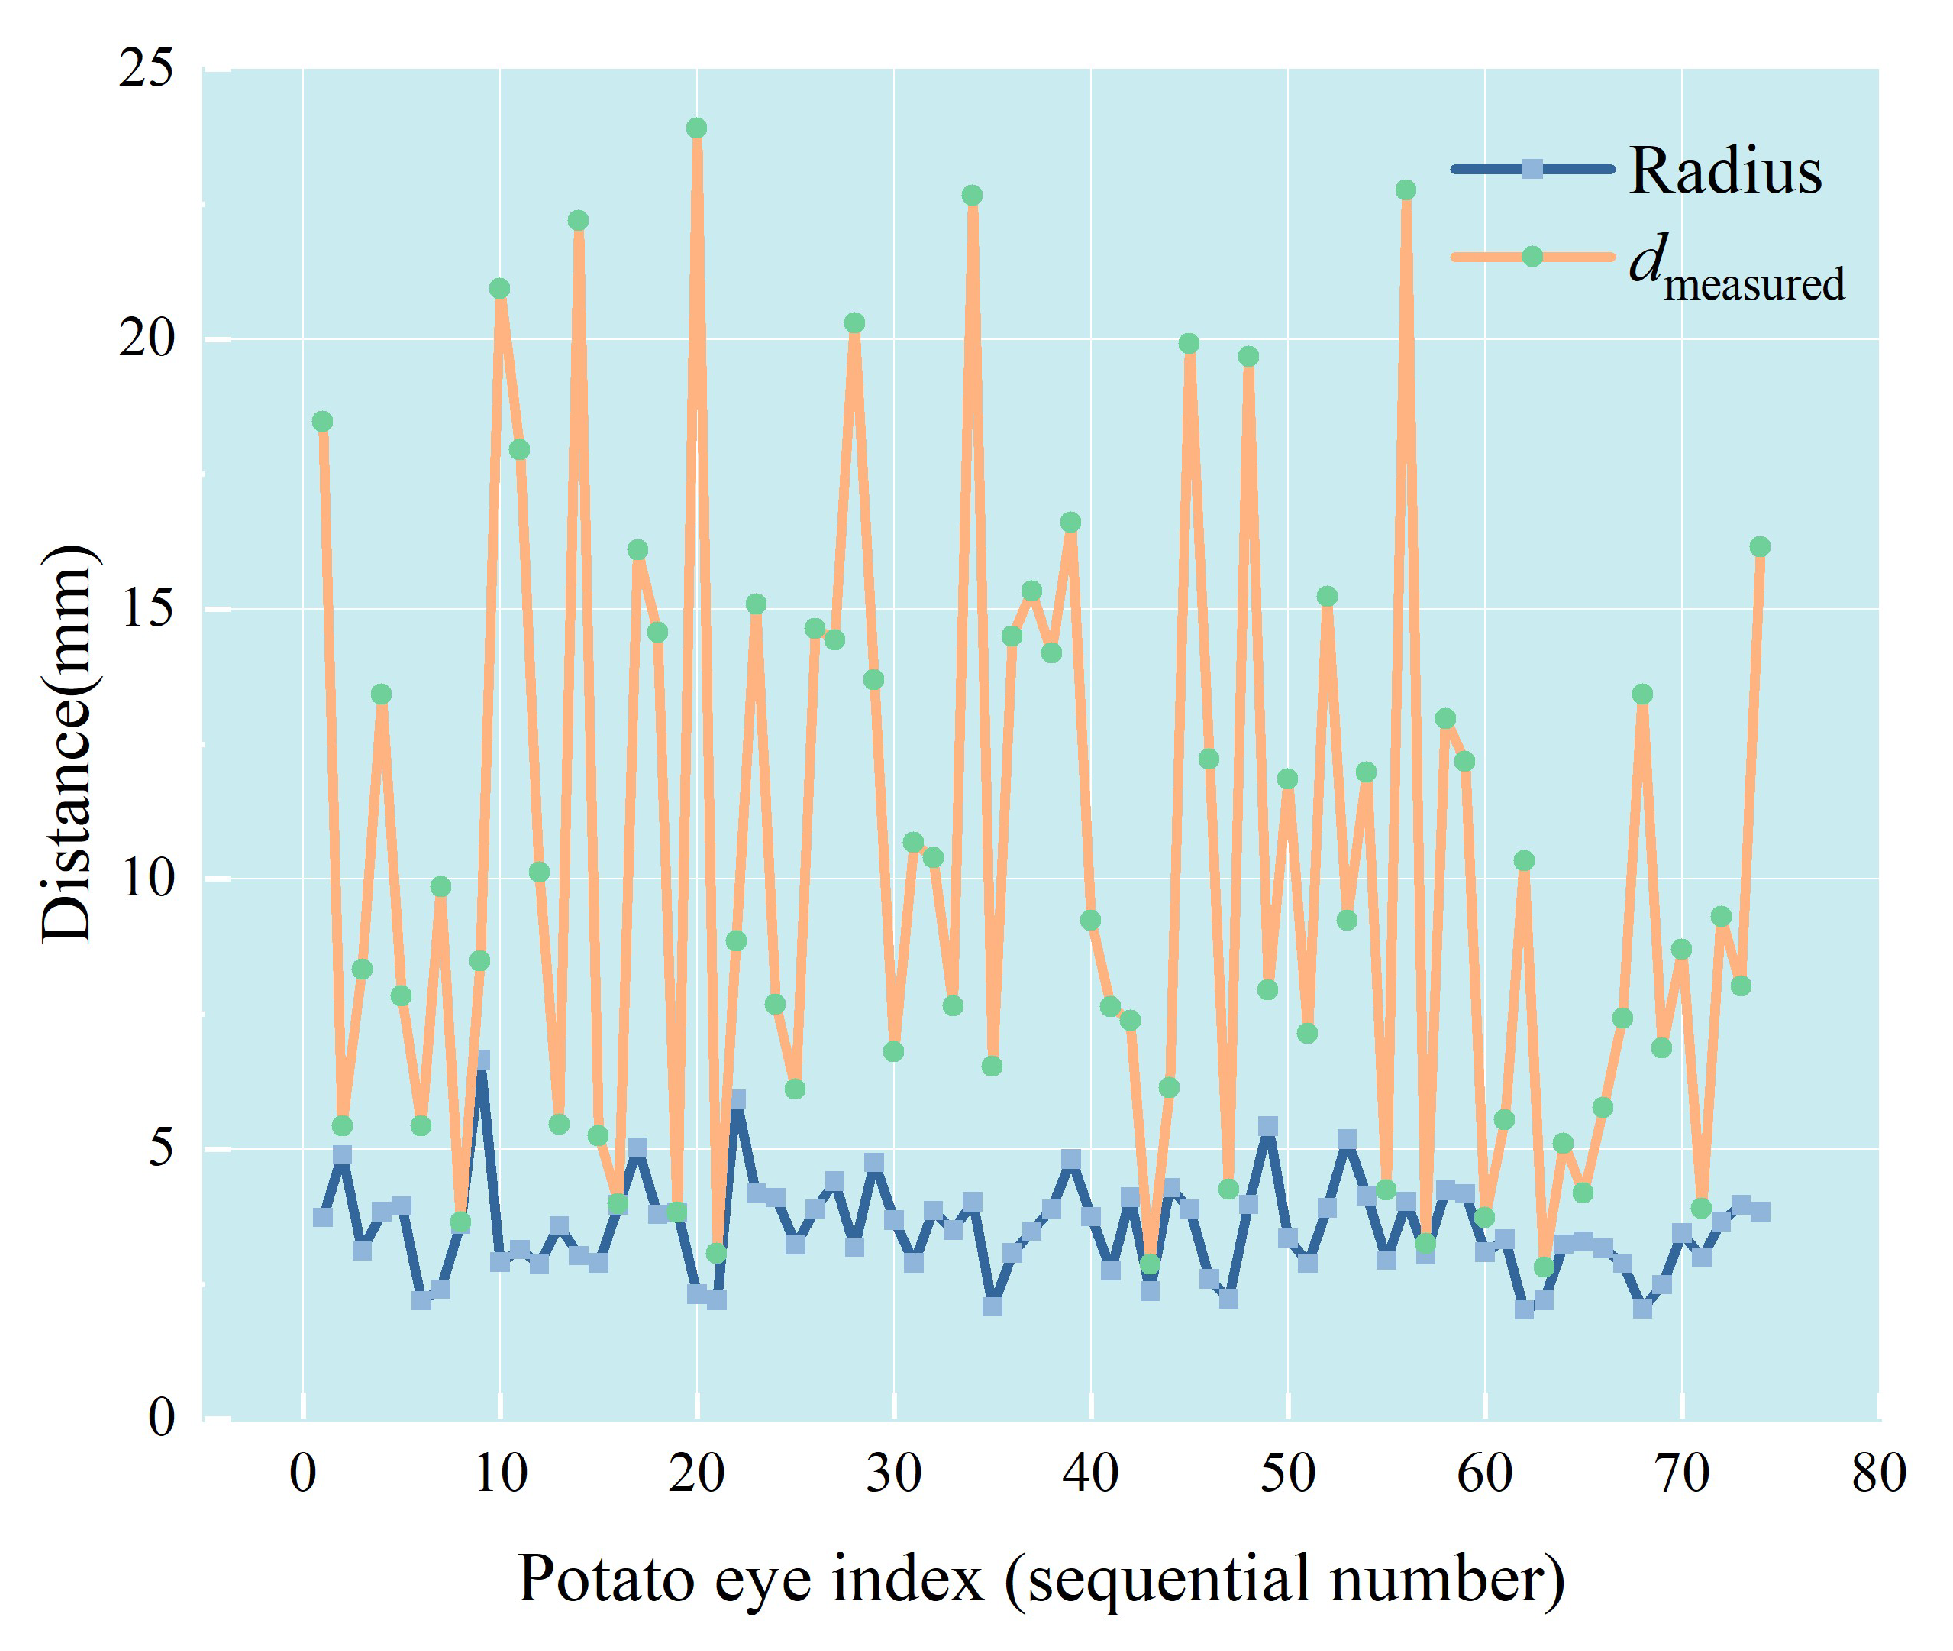
To further validate whether the calculated spherical safety regions can cover the actual potato eyes and provide protection during real cutting operations, we conducted a physical verification experiment as shown in Figure 13. We simulated the X-type blade using a cross-shaped laser, which represents the most complex cutting configuration with the largest contact area with potatoes. A 6-DOF robotic arm (JAKA Zu 5) was employed to position potato samples at their optimized cutting orientations.
For each large potato sample, we measured the shortest distance from each detected potato eye center to the nearest laser line using digital calipers with 0.01 mm precision, compared these measured distances d measured against the corresponding calculated safety radius r k from Equation (8), and manually observed whether the laser lines intersected the detected potato eyes. The validation results demonstrated that, as shown in Figure 14, d measured > r k for all detected potato eyes, and through manual observation, no laser lines intersected with the detected potato eyes, thus confirming that the spherical safety regions cover the actual potato eye regions and achieve effective protection.

3.4. Comprehensive Performance Comparison

In the simulation cutting tests of Jiuen No.12 potatoes, we compared our system with existing methods. For potato eye detection and mapping performance, our multi-view fusion approach using YOLOv5 achieved a precision of 98% and recall of 94%. Compared with the single-view improved POD-YOLO method proposed by Huang et al., which achieved a precision of 95.2% and recall of 94.0% [19], our system achieved improved performance.
Given the limited availability of public literature on automated potato cutting, we recalculated the mass standard deviation of all seed pieces from the cutting optimization results of 30 sample potatoes. This metric serves as an alternative to CVᵥ for evaluating cutting uniformity and enables comparison with existing literature. Our system achieved a mass standard deviation of 6.46 g for all seed pieces from the 30 sample potatoes. Compared with the optimal circular potato cutting result of 20.28 g reported by Huang et al. [3], our system demonstrated better cutting uniformity with a 68.1% reduction in mass standard deviation.
The intelligent 3D potato cutting simulation system proposed in this study demonstrates advantages in both detection accuracy and cutting optimization performance. However, the current simulation cutting efficiency is the main bottleneck of the system. Due to the relatively low configuration of current experimental equipment and high computational cost of the algorithm, the average total processing time per potato is approximately 1.5 min, with the potato 3D point cloud reconstruction and potato cutting optimization modules being the two most time-consuming, averaging 26 s and 54 s, respectively. This is significantly slower than the 2.14 s processing cycle time achieved by Huang et al. [3]. Furthermore, this study was conducted only on a single potato variety (Jiuen No. 12), which may affect the generalizability of the results to other potatoes with different morphological characteristics and eye distribution patterns.

4. Conclusions

This study developed an intelligent 3D potato cutting simulation system based on machine vision and point cloud reconstruction, achieving a complete workflow of potato 3D point cloud reconstruction, potato eye detection and mapping, and potato cutting optimization. The system employs a single-camera–rotating platform setup, captures multi-view images from 36 uniformly distributed viewpoints, and combines COLMAP 3D reconstruction with YOLOv5 potato eye detection to successfully achieve 3D localization of potato eyes and potato classification based on volume. Based on this foundation, the system implements cutting optimization oriented toward “volume uniformity,” “potato eye uniformity,” and “protection of potato eye regions” through Bayesian optimization algorithm, providing a new technical solution for intelligent potato cutting.
Experimental results demonstrate that the system shows advantages in both detection accuracy and cutting optimization performance. In potato eye detection, the system achieved an overall recall rate of 94% and precision rate of 98%. In potato volume estimation, the system achieved a MAPE of 2.16% (95% CI: 1.60–2.73%), with 96.7% of samples having absolute percentage error controlled within 5%. In cutting optimization, the average CVᵥ for each volume group was controlled below 0.10, with each cutting piece in the experimental samples containing at least one complete potato eye, while achieving 100% potato eye protection rate.
Based on the achievements and identified issues of this study, future work will focus on multi-camera systems and the improvement of specimen holder design, more efficient point cloud reconstruction methods, more efficient cutting optimization methods, and cutting tool development, and extending the system to actual cutting equipment to verify its feasibility and stability in real production environments. These improvements will further promote the practical application of automated intelligent potato cutting technology.

Author Contributions

Conceptualization, R.X. and C.C.; methodology, R.X. and C.C.; software, R.X.; validation, R.X. and C.C.; formal analysis, R.X.; investigation, R.X.; resources, C.C. and F.L.; data curation, R.X.; writing—original draft preparation, R.X. and C.C.; writing—review and editing, R.X. and C.C.; visualization, R.X.; supervision, C.C., F.L. and S.X.; project administration, C.C.; funding acquisition, S.X. All authors have read and agreed to the published version of the manuscript.

Funding

This research was funded by the National Natural Science Foundation of China (32201668), and the Fundamental Research Funds for the Central Universities (SWU-KQ24001).

Institutional Review Board Statement

Not applicable.

Data Availability Statement

The data used and/or analyzed during the current study are available from the corresponding author upon reasonable request.

Conflicts of Interest

The authors declare no conflicts of interest.

Abbreviations

The following abbreviations are used in this manuscript:
SfMStructure from Motion
DBSCANDensity-Based Spatial Clustering of Applications with Noise
CVᵥVolume coefficient of variation
CVₑPotato eye count coefficient of variation
MAEMean Absolute Error
MAPEMean Absolute Percentage Error
TPTrue Positives
FNFalse Negatives
FPFalse Positives

References

  1. Johnson, C.M.; Auat Cheein, F. Machinery for Potato Harvesting: A State-of-the-Art Review. Front. Plant Sci. 2023, 14, 1156734. [Google Scholar] [CrossRef]
  2. Food and Agriculture Organization Corporate Statistical (FAOSTAT). Crops and Livestock Products—Global Potato Production and Harvested Area Data (2012–2022). Available online: https://www.fao.org/faostat/en/#data/QCL (accessed on 22 August 2025).
  3. Huang, J.; Yi, F.; Cui, Y.; Wang, X.; Jin, C.; Cheein, F.A. Design and Implementation of a Seed Potato Cutting Robot Using Deep Learning and Delta Robotic System with Accuracy and Speed for Automated Processing of Agricultural Products. Comput. Electron. Agric. 2025, 237, 110716. [Google Scholar] [CrossRef]
  4. Lü, J.Q.; Yang, X.H.; Li, Z.H.; Li, J.C.; Liu, Z.Y. Design and Test of Seed Potato Cutting Device with Vertical and Horizontal Knife Group. Trans. Chin. Soc. Agric. Mach. 2020, 51, 89–97. [Google Scholar] [CrossRef]
  5. Barbosa Júnior, M.R.; Moreira, B.R.D.A.; Carreira, V.D.S.; Brito Filho, A.L.D.; Trentin, C.; Souza, F.L.P.D.; Tedesco, D.; Setiyono, T.; Flores, J.P.; Ampatzidis, Y.; et al. Precision Agriculture in the United States: A Comprehensive Meta-Review Inspiring Further Research, Innovation, and Adoption. Comput. Electron. Agric. 2024, 221, 108993. [Google Scholar] [CrossRef]
  6. Tian, H.; Wang, T.; Liu, Y.; Qiao, X.; Li, Y. Computer Vision Technology in Agricultural Automation—A Review. Inf. Process. Agric. 2020, 7, 1–19. [Google Scholar] [CrossRef]
  7. Yu, S.; Liu, X.; Tan, Q.; Wang, Z.; Zhang, B. Sensors, Systems and Algorithms of 3D Reconstruction for Smart Agriculture and Precision Farming: A Review. Comput. Electron. Agric. 2024, 224, 109229. [Google Scholar] [CrossRef]
  8. Masoudi, M.; Golzarian, M.R.; Lawson, S.S.; Rahimi, M.; Islam, S.M.S.; Khodabakhshian, R. Improving 3D Reconstruction for Accurate Measurement of Appearance Characteristics in Shiny Fruits Using Post-Harvest Particle Film: A Case Study on Tomatoes. Comput. Electron. Agric. 2024, 224, 109141. [Google Scholar] [CrossRef]
  9. Gené-Mola, J.; Sanz-Cortiella, R.; Rosell-Polo, J.R.; Escolà, A.; Gregorio, E. In-Field Apple Size Estimation Using Photogrammetry-Derived 3D Point Clouds: Comparison of 4 Different Methods Considering Fruit Occlusions. Comput. Electron. Agric. 2021, 188, 106343. [Google Scholar] [CrossRef]
  10. Vázquez-Arellano, M.; Reiser, D.; Paraforos, D.S.; Garrido-Izard, M.; Burce, M.E.C.; Griepentrog, H.W. 3-D Reconstruction of Maize Plants Using a Time-of-Flight Camera. Comput. Electron. Agric. 2018, 145, 235–247. [Google Scholar] [CrossRef]
  11. Ghahremani, M.; Williams, K.; Corke, F.; Tiddeman, B.; Liu, Y.; Wang, X.; Doonan, J.H. Direct and Accurate Feature Extraction from 3D Point Clouds of Plants Using RANSAC. Comput. Electron. Agric. 2021, 187, 106240. [Google Scholar] [CrossRef]
  12. Chen, C.; Li, J.; Liu, B.; Huang, B.; Yang, J.; Xue, L. A Robust Vision System for Measuring and Positioning Green Asparagus Based on YOLO-Seg and 3D Point Cloud Data. Comput. Electron. Agric. 2025, 230, 109937. [Google Scholar] [CrossRef]
  13. George, R.; Thuseethan, S.; Ragel, R.G.; Mahendrakumaran, K.; Nimishan, S.; Wimalasooriya, C.; Alazab, M. Past, Present and Future of Deep Plant Leaf Disease Recognition: A Survey. Comput. Electron. Agric. 2025, 234, 110128. [Google Scholar] [CrossRef]
  14. Zhang, Y.; Li, L.; Chun, C.; Wen, Y.; Xu, G. Multi-Scale Feature Adaptive Fusion Model for Real-Time Detection in Complex Citrus Orchard Environments. Comput. Electron. Agric. 2024, 219, 108836. [Google Scholar] [CrossRef]
  15. Mirhaji, H.; Soleymani, M.; Asakereh, A.; Mehdizadeh, S.A. Fruit Detection and Load Estimation of an Orange Orchard Using the YOLO Models through Simple Approaches in Different Imaging and Illumination Conditions. Comput. Electron. Agric. 2021, 191, 106533. [Google Scholar] [CrossRef]
  16. Li, Y.H.; Li, T.H.; Niu, Z.R.; Wu, Y.Q.; Zhang, Z.L.; Hou, J.L. Potato Bud Eyes Recognition Based on Three-Dimensional Geometric Features of Color Saturation. Trans. Chin. Soc. Agric. Eng. 2018, 34, 158–164. [Google Scholar] [CrossRef]
  17. Yang, Y.; Zhao, X.; Huang, M.; Wang, X.; Zhu, Q. Multispectral Image Based Germination Detection of Potato by Using Supervised Multiple Threshold Segmentation Model and Canny Edge Detector. Comput. Electron. Agric. 2021, 182, 106041. [Google Scholar] [CrossRef]
  18. Xi, R.; Hou, J.; Lou, W. Potato Bud Detection with Improved Faster R-CNN. Trans. ASABE 2020, 63, 557–569. [Google Scholar] [CrossRef]
  19. Huang, J.; Wang, X.; Jin, C.; Cheein, F.A.; Yang, X. Estimation of the Orientation of Potatoes and Detection Bud Eye Position Using Potato Orientation Detection You Only Look Once with Fast and Accurate Features for the Movement Strategy of Intelligent Cutting Robots. Eng. Appl. Artif. Intell. 2025, 142, 109923. [Google Scholar] [CrossRef]
  20. Zhao, W.S.; Feng, Q.; Sun, B.G.; Sun, W. Optimization and Cutting Decision of Potato Seed Based on Visual Detection. For. Mach. Woodwork. Equip. 2024, 52, 76–82. [Google Scholar] [CrossRef]
  21. Wu, Y.; La, X.; Zhao, X.; Liu, F.; Yan, J. Design and Performance Testing of Seed Potato Cutting Machine with Posture Adjustment. Agriculture 2025, 15, 732. [Google Scholar] [CrossRef]
  22. Kalaitzakis, M.; Cain, B.; Carroll, S.; Ambrosi, A.; Whitehead, C.; Vitzilaios, N. Fiducial Markers for Pose Estimation: Overview, Applications and Experimental Comparison of the ARTag, AprilTag, ArUco and STag Markers. J. Intell. Robot. Syst. 2021, 101, 71. [Google Scholar] [CrossRef]
  23. Lepetit, V.; Moreno-Noguer, F.; Fua, P. EPnP: An Accurate O(n) Solution to the PnP Problem. Int. J. Comput. Vis. 2009, 81, 155–166. [Google Scholar] [CrossRef]
  24. Ester, M.; Kriegel, H.-P.; Sander, J.; Xu, X. A Density-Based Algorithm for Discovering Clusters in Large Spatial Databases with Noise. In Proceedings of the Second International Conference on Knowledge Discovery and Data Mining (KDD’96), Portland, OR, USA, 2–4 August 1996; pp. 226–231. [Google Scholar]
  25. Meng, L.; Wang, S.; Wang, C.; Wang, X.; Wang, W. Design of Potato Seed Cutter System on PLC and MCGS. J. Agric. Mech. Res. 2022, 44, 95–101. [Google Scholar] [CrossRef]
  26. Frazier, P.I. A Tutorial on Bayesian Optimization. arXiv 2018, arXiv:1807.02811. [Google Scholar] [CrossRef]
  27. Gan, W.; Ji, Z.; Liang, Y. Acquisition Functions in Bayesian Optimization. In Proceedings of the 2021 2nd International Conference on Big Data & Artificial Intelligence & Software Engineering (ICBASE), Zhuhai, China, 24–26 September 2021; IEEE: Piscataway, NJ, USA, 2021; pp. 129–135. [Google Scholar] [CrossRef]
  28. Jones, D.R.; Schonlau, M.; Welch, W.J. Efficient Global Optimization of Expensive Black-Box Functions. J. Glob. Optim. 1998, 13, 455–492. [Google Scholar] [CrossRef]
  29. Furuuchi, S.; Yamada, S. Verifying the Effect of Initial Sample Size in Bayesian Optimization. Total Qual. Sci. 2024, 10, 8–19. [Google Scholar] [CrossRef]
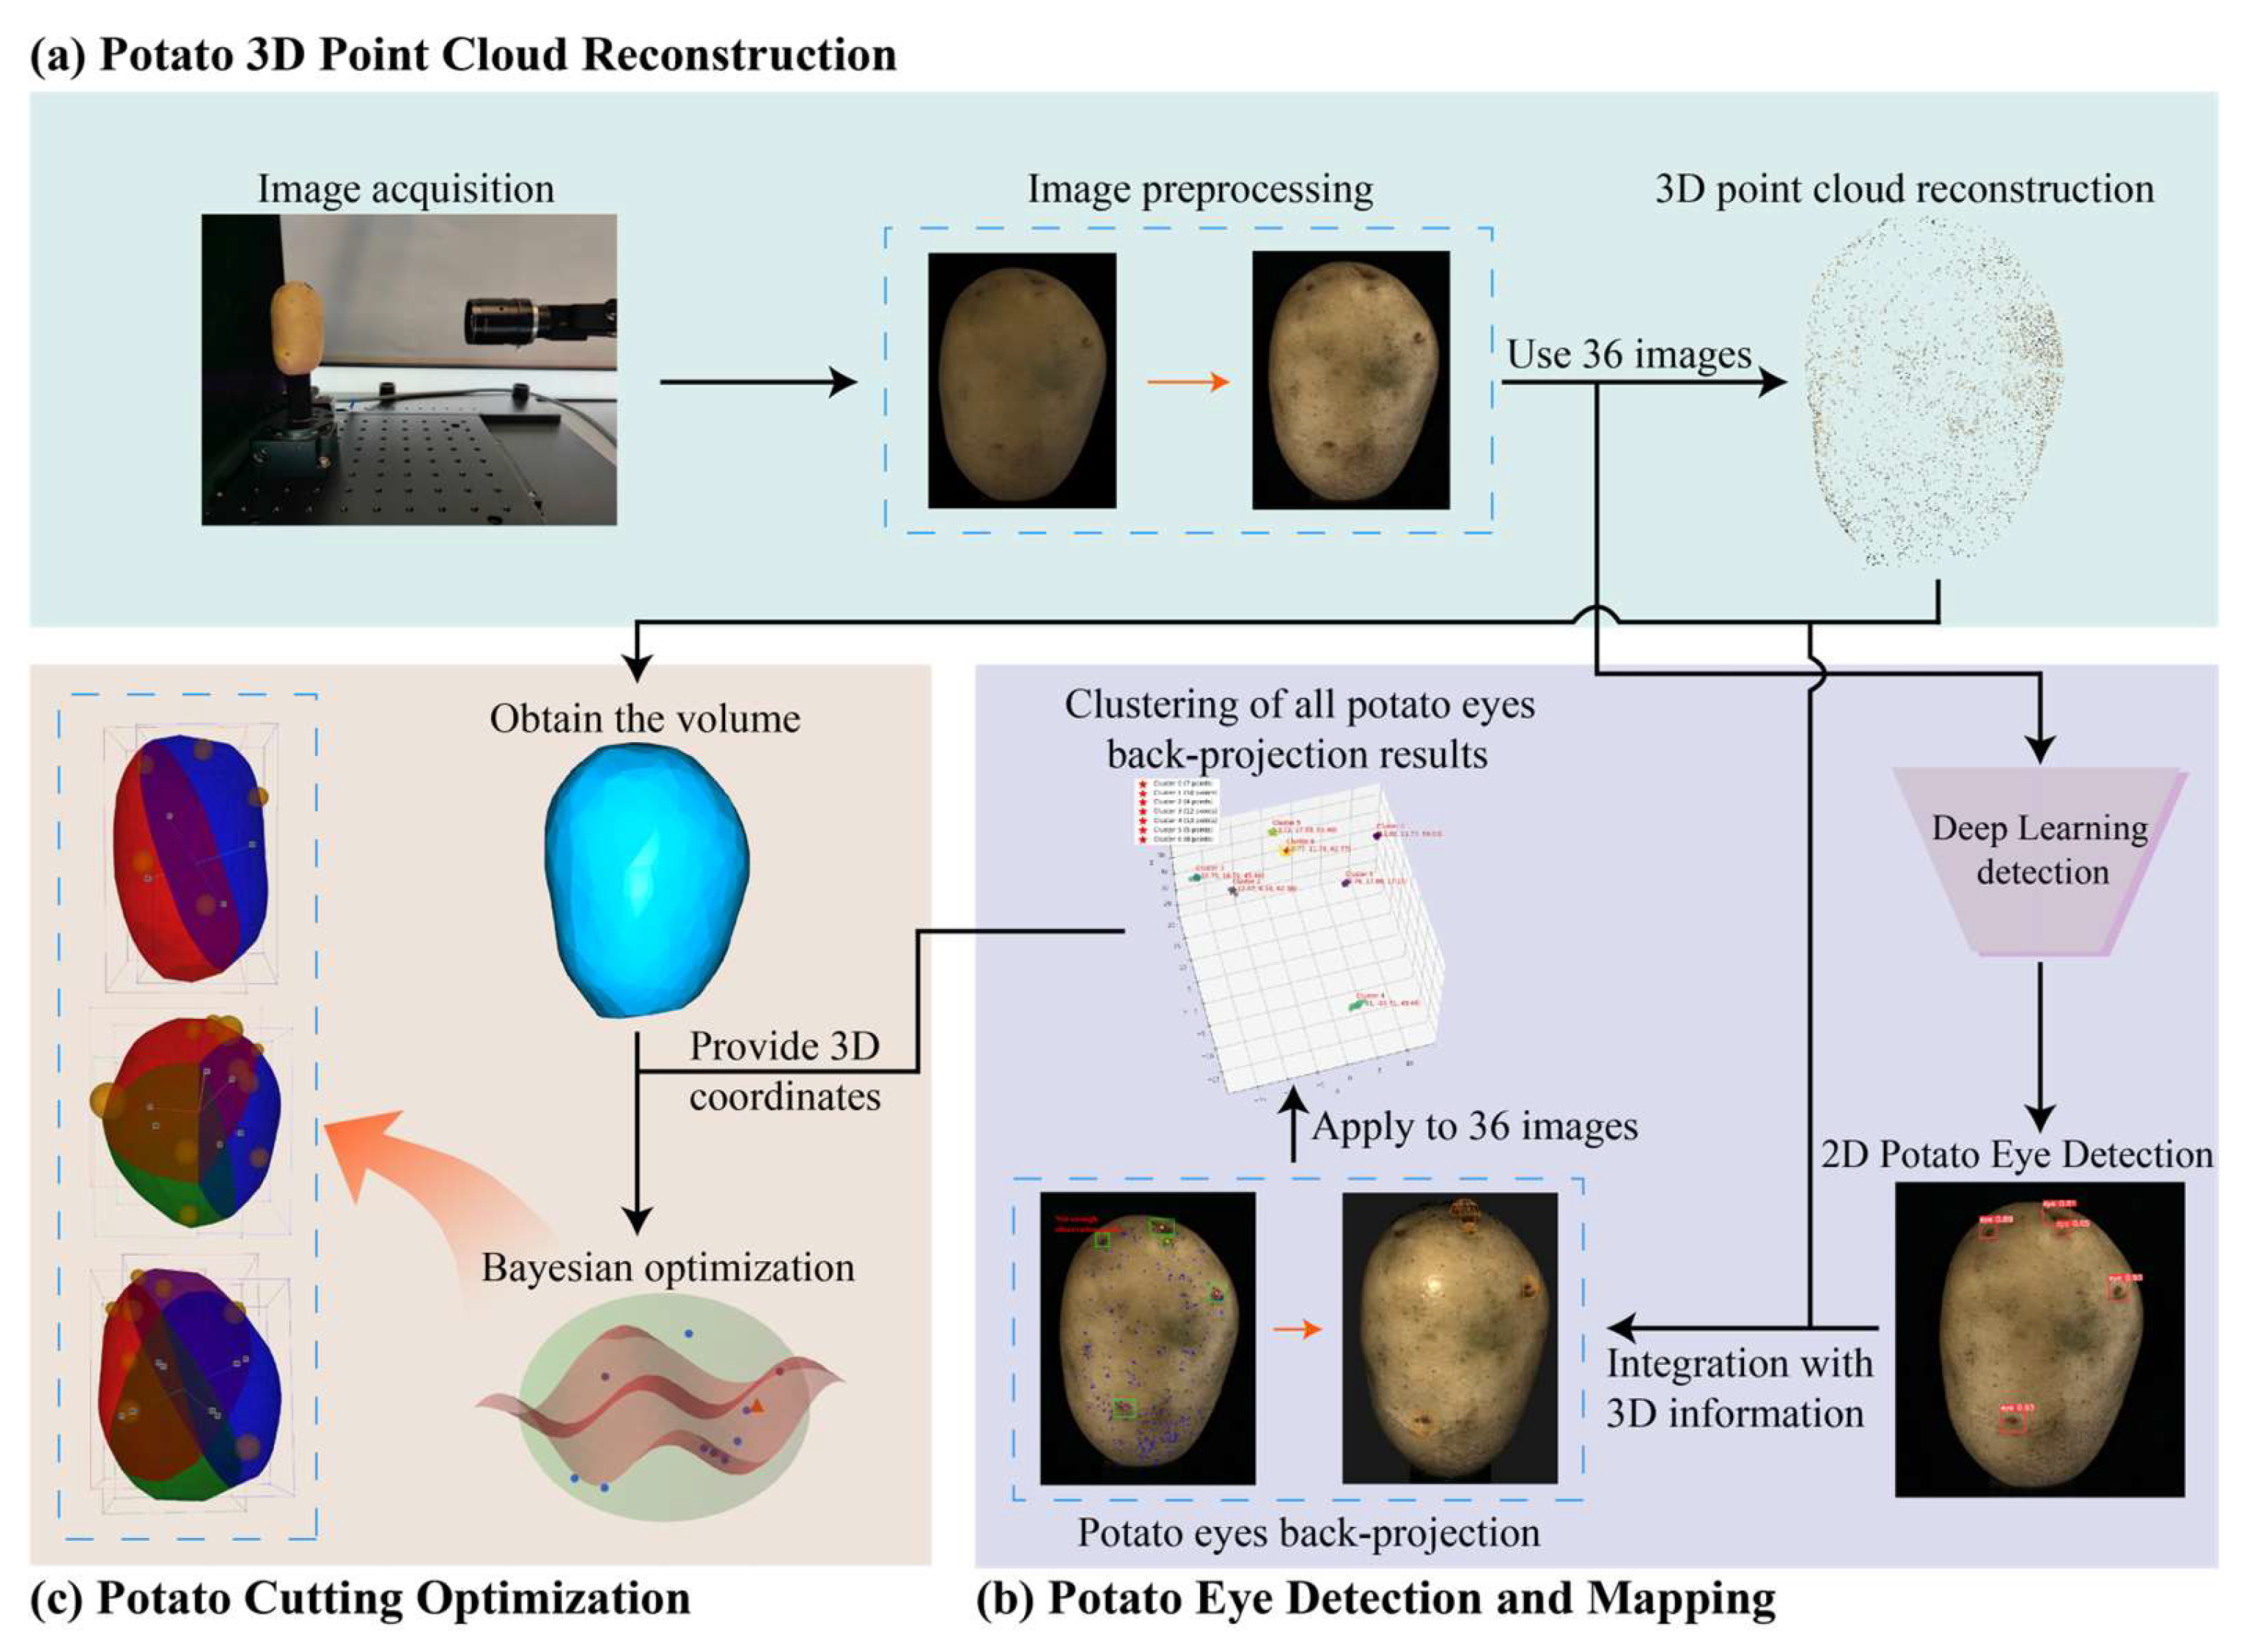
Figure 1. Technical workflow of the Intelligent 3D Potato Cutting Simulation System.
Agriculture 15 02088 g001
Figure 2. Multi-view image acquisition apparatus.
Agriculture 15 02088 g002
Figure 3. Definition of the checkerboard’s coordinate system.
Agriculture 15 02088 g003
Figure 4. Apparatus for physical scale calibration: the checkerboard (yellow) is positioned at a 45° angle to the reference plane (blue), which is perpendicular to the camera’s optical axis (orange dotted line). The inset shows a top-view schematic.
Agriculture 15 02088 g004
Figure 5. Single-view potato eye detection and corresponding back-projections. (a) Potato eye detection and observation pixels (blue points represent the 2D observations of reconstructed 3D points in the current image). (b) Back-projection onto the sparse point cloud. (c) Back-projection onto the dense point cloud (providing clearer visualization of eye locations).
Agriculture 15 02088 g005
Figure 6. DBSCAN clustering of 3D back-projected potato eye detections.
Agriculture 15 02088 g006
Figure 7. Potato eye centroids in 3D space before and after clustering. (a) Sparse point cloud with unclustered eyes. (b) Sparse point cloud with clustered eyes. (c) Dense point cloud with unclustered eyes. (d) Dense point cloud with clustered eyes. The dense point cloud is used for clearer visualization of eye locations on the potato.
Agriculture 15 02088 g007
Figure 8. Potato surface reconstruction: (a) point cloud, (b) watertight mesh from Alpha-Shape.
Agriculture 15 02088 g008
Figure 9. Scatter plot of estimated versus truth volumes for 30 potato samples.
Agriculture 15 02088 g009
Figure 10. Cutting simulation results for different potato sizes: (a) small, (b) medium, and (c) large. Different colors represent individual cut pieces; yellow spheres indicate spherical safety regions of detected potato eyes.
Agriculture 15 02088 g010
Figure 11. Distribution characteristics of cutting performance indicators for potatoes in different volume ranges.
Agriculture 15 02088 g011
Figure 12. Potato eye distribution and cutting results of typical samples. (a) Sample 16. (b) Sample 30. The dense point cloud is used for clearer visualization of eye locations on the potato, with semi-transparent planes representing the cutting blades.
Agriculture 15 02088 g012
Figure 13. Safety radius validation experiment setup and measurements. (a) Potato cutting optimization results. (b) Experimental apparatus. (c) Digital caliper measurement of distances from potato eye centers to the nearest laser lines.
Agriculture 15 02088 g013
Figure 14. Validation of safety radius effectiveness: measured distances versus calculated safety radii for detected potato eyes.
Agriculture 15 02088 g014
Table 1. Analysis of average distance for bounding boxes containing exactly n observation pixels and potato eye recall under corresponding lower bound n.
Number of Observation PixelsAverage Distance (Pixels)Recall
122.2994.2%
220.8794.1%
319.3694.1%
422.2692.7%
523.2889.9%
623.586.4%
726.8382.6%
Table 2. Analysis of n observation pixels closest to the bounding box center.
Number of Observation PixelsAverage Distance (Pixels)
110.27
212.82
315.23
417.41
519.35
621.18
722.67
Table 3. Detailed data of 30 test samples.
Sample IDEstimated Volume (cm3)True Volume (cm3)Absolute Percentage ErrorDetected Potato EyesTrue
Potato Eyes
True
Positives
(TP)
False
Negatives (FN)
False
Positives (FP)
PrecisionRecall
180.5844.17%77700100%100%
275.33783.42%67610100%86%
3122.591241.14%10101000100%100%
473.33763.51%67610100%86%
5110.181121.62%67610100%86%
689.68922.52%77700100%100%
776.12804.85%66600100%100%
8102.041020.04%10101000100%100%
957.97580.05%78710100%88%
1075.58760.55%55500100%100%
1193.12940.94%58530100%63%
1256.43560.77%55500100%100%
13147.811501.46%7660186%100%
14102.151085.42%910910100%90%
15108.681122.96%77700100%100%
16134.31361.25%89810100%89%
17150.61520.92%88800100%100%
1893.49940.54%77700100%100%
19138.681411.65%78710100%88%
20108.971144.41%8770188%100%
21110.371121.46%88800100%100%
22117.71201.92%35320100%60%
23176.791822.86%88800100%100%
24164.361703.32%9880189%100%
25180.571841.86%88800100%100%
26141.741420.18%99900100%100%
27151.181584.32%56510100%83%
28178.551821.90%88800100%100%
29141.561484.35%66600100%100%
30147.271480.49%99900100%100%
Mean116.92119.52.16%----------98%94%
Table 4. Volume estimation performance for different sized potatoes.
Volume Range/cm3Sample CountMAEMAPE
47–94101.7312.13%
94–141102.5422.19%
>141103.5572.17%
Overall302.612.16%
Table 5. Cutting optimization performance of potatoes in different volume ranges.
Volume Range/cm3Number of PiecesMean CVᵥMean CVₑPotato Eye Protection Rate
47–9420.03470.2230100%
94–14130.09140.3911100%
>14140.09430.5525100%
Overall--0.07350.3889100%
Disclaimer/Publisher’s Note: The statements, opinions and data contained in all publications are solely those of the individual author(s) and contributor(s) and not of MDPI and/or the editor(s). MDPI and/or the editor(s) disclaim responsibility for any injury to people or property resulting from any ideas, methods, instructions or products referred to in the content.