Article

SPMF-YOLO-Tracker: A Method for Quantifying Individual Activity Levels and Assessing Health in Newborn Piglets

1
College of Artificial Intelligence, Nanjing Agricultural University, Nanjing 210031, China
2
College of Engineering, Nanjing Agricultural University, Nanjing 210031, China
3
College of Information Engineering, Suqian University, Suqian 223800, China
*
Author to whom correspondence should be addressed.
Agriculture 2025, 15(19), 2087; https://doi.org/10.3390/agriculture15192087
Submission received: 10 September 2025 / Revised: 2 October 2025 / Accepted: 6 October 2025 / Published: 7 October 2025
(This article belongs to the Special Issue Modeling of Livestock Breeding Environment and Animal Behavior)

Abstract

This study proposes a behavioral monitoring framework for newborn piglets based on SPMF-YOLO object detection and ByteTrack multi-object tracking, which enables precise quantification of early postnatal activity levels and health assessment. The method enhances small-object detection performance by incorporating the SPDConv module, the MFM module, and the NWD loss function into YOLOv11. When combined with the ByteTrack algorithm, it achieves stable tracking and maintains trajectory continuity for multiple targets. An annotated dataset containing both detection and tracking labels was constructed using video data from 10 piglet pens for evaluation. Experimental results indicate that SPMF-YOLO achieved a recognition accuracy rate of 95.3% for newborn piglets. When integrated with ByteTrack, it achieves 79.1% HOTA, 92.2% MOTA, and 84.7% IDF1 in multi-object tracking tasks, thereby outperforming existing methods. Building upon this foundation, this study further quantified the cumulative movement distance of each newborn piglet within 30 min after birth and proposed a health-assessment method based on statistical thresholds. The results demonstrated an overall consistency rate of 98.2% across pens and an accuracy rate of 92.9% for identifying abnormal individuals. The results validated the effectiveness of this method for quantifying individual behavior and assessing health status in newborn piglets within complex farming environments, providing a feasible technical pathway and scientific basis for health management and early intervention in precision animal husbandry.

1. Introduction

As modern pig farming continues to expand, effective health management of newborn piglets has become a critical factor in improving survival rates and farming efficiency [1]. Newborn piglets, owing to their limited thermoregulatory capacity and immature immune systems, are highly vulnerable to mortality shortly after birth, often resulting from abnormal behavior, insufficient vitality, or failure to suckle colostrum in time. H. Quesnel et al. [2] reported that more than 50% of piglet deaths occur within 48 h of birth, most of which could be prevented by timely intervention. Traditional labor-intensive management methods rely heavily on manual intervention, which leads to low efficiency in workforce utilization and operational expenditure and is constrained by the skill level of operators, resulting in reduced accuracy of identification and, consequently, compromising livestock well-being and production performance. In response, technologies enabling real-time supervision and control have emerged in recent years, aimed at pig activity monitoring and behavioral assessment, showing great potential to enhance production efficiency, optimize management processes, and improve animal welfare in large-scale farms [3].
Over the past few years, driven by the fast progress of computer vision technologies, various image-processing techniques along with deep learning methods have found extensive application in the automatic identification and tracking of pig behavior. As the foundation of pig behavior detection and analysis, object detection has undergone particularly rapid advancements. Traditional approaches primarily relied on image-processing and machine-learning algorithms. For example, Lao et al. [4] employed depth images and image-processing techniques to detect lactating sows and piglets. Nasirahmadi et al. [5] employed image analysis methods for identifying pigs kept in groups using elliptical fitting. Xu et al. [6] applied CNN and SVM to detect and automatically evaluate pig posture. Gan et al. [7] proposed a graph convolutional network (GCN) approach for detecting and examining the social behaviors in pre-weaning piglets. Ji et al. [8] proposed an improved YOLOX model to detect the location and posture of pigs, and Chen et al. [9] introduced a PPR-YOLO model to detect the resting posture of lactating piglets. However, these methods face substantial limitations when addressing high-density occlusions and complex posture variations. Under the uncontrollable natural lighting of farrowing rooms, the texture details of small newborn piglets are easily obscured, rendering traditional image-processing techniques less robust. Meanwhile, deep-learning models, lacking targeted design, often struggle to balance detection accuracy with real-time performance, limiting their direct applicability to large-scale automated farming.
In the field of multi-object tracking, Cowton et al. [10] integrated Faster R-CNN and DeepSORT to achieve piglet tracking in short temporal sequences. Guo et al. [11] incorporated YOLOv5 along with DeepSORT, further refining the Re-ID module, thereby improving tracking accuracy while mitigating ID-switching issues. Tu et al. [12] introduced a YOLOv5-Byte-based multi-target tracking approach, which combined pig behavior cues with identity recognition to enable simultaneous detection and tracking. Yang et al. [13] designed an improved lightweight network, YOLOv7-tiny_Pig, coupled with StrongSORT, to enlarge the camera field of view for maintaining a consistent number of targets and enhancing pig tracking efficiency. Yu et al. [14] proposed an FTO-SORT-based method for multi-target piglet tracking under weak illumination, employing techniques including separating foreground from background, applying data augmentation, and utilizing a foreground–background differential loss. Despite progress, current tracking algorithms still face fundamental challenges in newborn piglet monitoring. The Re-ID module struggles with highly similar appearances in top-view videos, often resulting in ID switches under occlusion. Moreover, most existing systems have difficulty in reliably quantifying activity during the early postnatal stage, when piglets are highly active and prone to overlapping. Such shortcomings underscore the necessity of a specialized framework designed to accurately detect, track, and quantify piglet behavior within the first minutes after birth, supporting early health assessment.
The activity level of individual pigs serves as a crucial indicator of their health status and behavioral responses. In smart farming contexts, researchers have attempted to quantify activity through metrics such as movement trajectories, speed, or group Euclidean distance [15,16,17,18]. However, most studies remain confined to the group level with simplified indicators, often failing to achieve stable modeling and accurate assessment of individual pigs in complex farrowing environments. Moreover, existing research indicates that the first 30–60 min after birth represent a critical window for differentiating vitality and health in newborn piglets. Typically, healthy piglets complete their first suckling within 20–30 min after birth, whereas failure to suckle within one hour often signals insufficient vitality or potential health issues [19]. In addition, piglets requiring more than five minutes to stand after birth face a significantly increased risk of mortality during the first week [20]. Review studies further emphasize that activity and suckling behavior within the first hour post-birth serve as critical early indicators of survival and health status [21]. On this basis, selecting the first 30 min post-birth as the core observation window provides a scientifically grounded timeframe that captures individual differences while enabling timely health assessment and intervention in practical farming.
Against this backdrop, this study proposes a personalized behavior evaluation framework combining object detection powered by deep learning and multi-target tracking. The framework leverages pig-pen video data, employing an improved YOLOv11 model (SPMF-YOLO) for precise detection of newborn piglets, and incorporates the ByteTrack algorithm to ensure identity continuity of individuals within the same pen. Building on this foundation, a quantitative system for activity assessment is established, using cumulative movement distance within the first 30 min after birth as the core metric, thereby enabling automated evaluation of individual activity levels in newborn piglets. This assessment is further applied to the early identification and validation of health status in newborn piglets.
The main contributions of this paper are summarized as follows:
First, we propose SPMF-YOLO, an improved object detection model for newborn piglets. This model introduces the SPDConv module to reduce information loss in small targets, integrates the MFM module to enhance multi-scale feature fusion, and adopts the NWD loss function to achieve more robust bounding box regression, significantly improving detection performance in a complex pig pen environment.
Second, we developed a robust multi-object tracking and individual activity quantification system by combining the SPMF-YOLO detector with the ByteTrack tracker. This system achieves stable, identity-consistent tracking of highly similar newborn piglets, enabling precise calculation of each individual’s cumulative movement distance.
Third, we propose a novel health assessment method based on individual movement statistical thresholds during the critical first 30 min after birth.

2. Materials and Methods

2.1. Test Site and Data Acquisition

The experimental dataset was collected in April 2025 at the Nanshang Nongke Pig Farm in Nanyang City, Henan Province. The sows were of the Large White breed. Ten farrowing pens, each measuring 2.4 m × 1.8 m, were selected as experimental sites. Each pen housed one sow and a variable number of newborn piglets, ranging from 7 to 14, and was fitted with plastic slatted flooring and iron guardrails. The farrowing house was maintained at a temperature of 24–30 °C. Heat lamps were installed in the piglet activity areas, while natural daylight provided overall illumination. A hemispherical camera (DS-2CD3326WDV3-I, Hikvision, Hangzhou, China) was mounted 1.8 m above the center of each pen to capture the entire piglet activity area. The cameras were connected via Ethernet to a switch (DS-3E0526P-E, Hikvision, China) and powered using Power over Ethernet (POE). Video streams were stored on a network video recorder (DS-7932N-R4, Hikvision, China) at 25 fps and a resolution of 1920 × 1080 pixels. Recordings covered the period from the onset of farrowing to 30 min after delivery, ensuring capture of the critical neonatal activity phase. A schematic diagram and a representative image of the farrowing pen setup are shown in Figure 1.

2.2. Dataset Construction

2.2.1. Object Detection Dataset

In this study, the dataset used to evaluate the health status of newborn piglets consists of two subsets: one for training/testing the object detection model and another for the tracking model. For object detection, one frame was sampled every two seconds from the surveillance videos. We then used optical flow to compute the average motion magnitude between adjacent frames and the structural similarity index (SSIM) to remove redundant high-similarity frames. In total, 1780 images were selected and annotated with the open-source software LabelMe 3.16.2, including piglet bounding boxes and corresponding labels. To avoid redundancy and potential overfitting, only behaviorally representative frames were retained, ensuring that—despite the limited size—the dataset covered diverse conditions such as daytime and nighttime recordings, varying degrees of occlusion, and posture variations. The dataset was randomly divided, via stratified sampling, into 1246 training images (70%), 267 validation images (15%), and 267 test images (15%), ensuring proportional representation of scenarios across subsets.

2.2.2. Multi-Object Tracking Dataset

To construct a dataset for multi-object tracking of newborn piglets, 33 representative video clips were selected from 10 farrowing pens. Each clip lasted 2.5 min and covered different stages from the sow’s farrowing process to the post-farrowing period. These clips encompassed typical scenarios such as dense piglet activity, severe occlusion, and varying illumination conditions. In particular, eight clips were selected from two low-light pens to ensure that challenging illumination scenarios were incorporated into the dataset. The sampling strategy ensured balance across pens and environments, providing representative coverage of both normal daytime pens and the two low-light pens. From each clip, images were sampled at 25-frame intervals (i.e., one image every 25 frames), yielding a total of 4950 images. The annotation process was performed using the open-source tool X-AnyLabeling 2.5.4, where individual piglets were manually annotated and assigned unique IDs to maintain identity consistency across frames. Class definitions and ID standards were aligned with the detection dataset. Details of the dataset division are presented in Table 1.

2.3. SPMF-YOLO Model

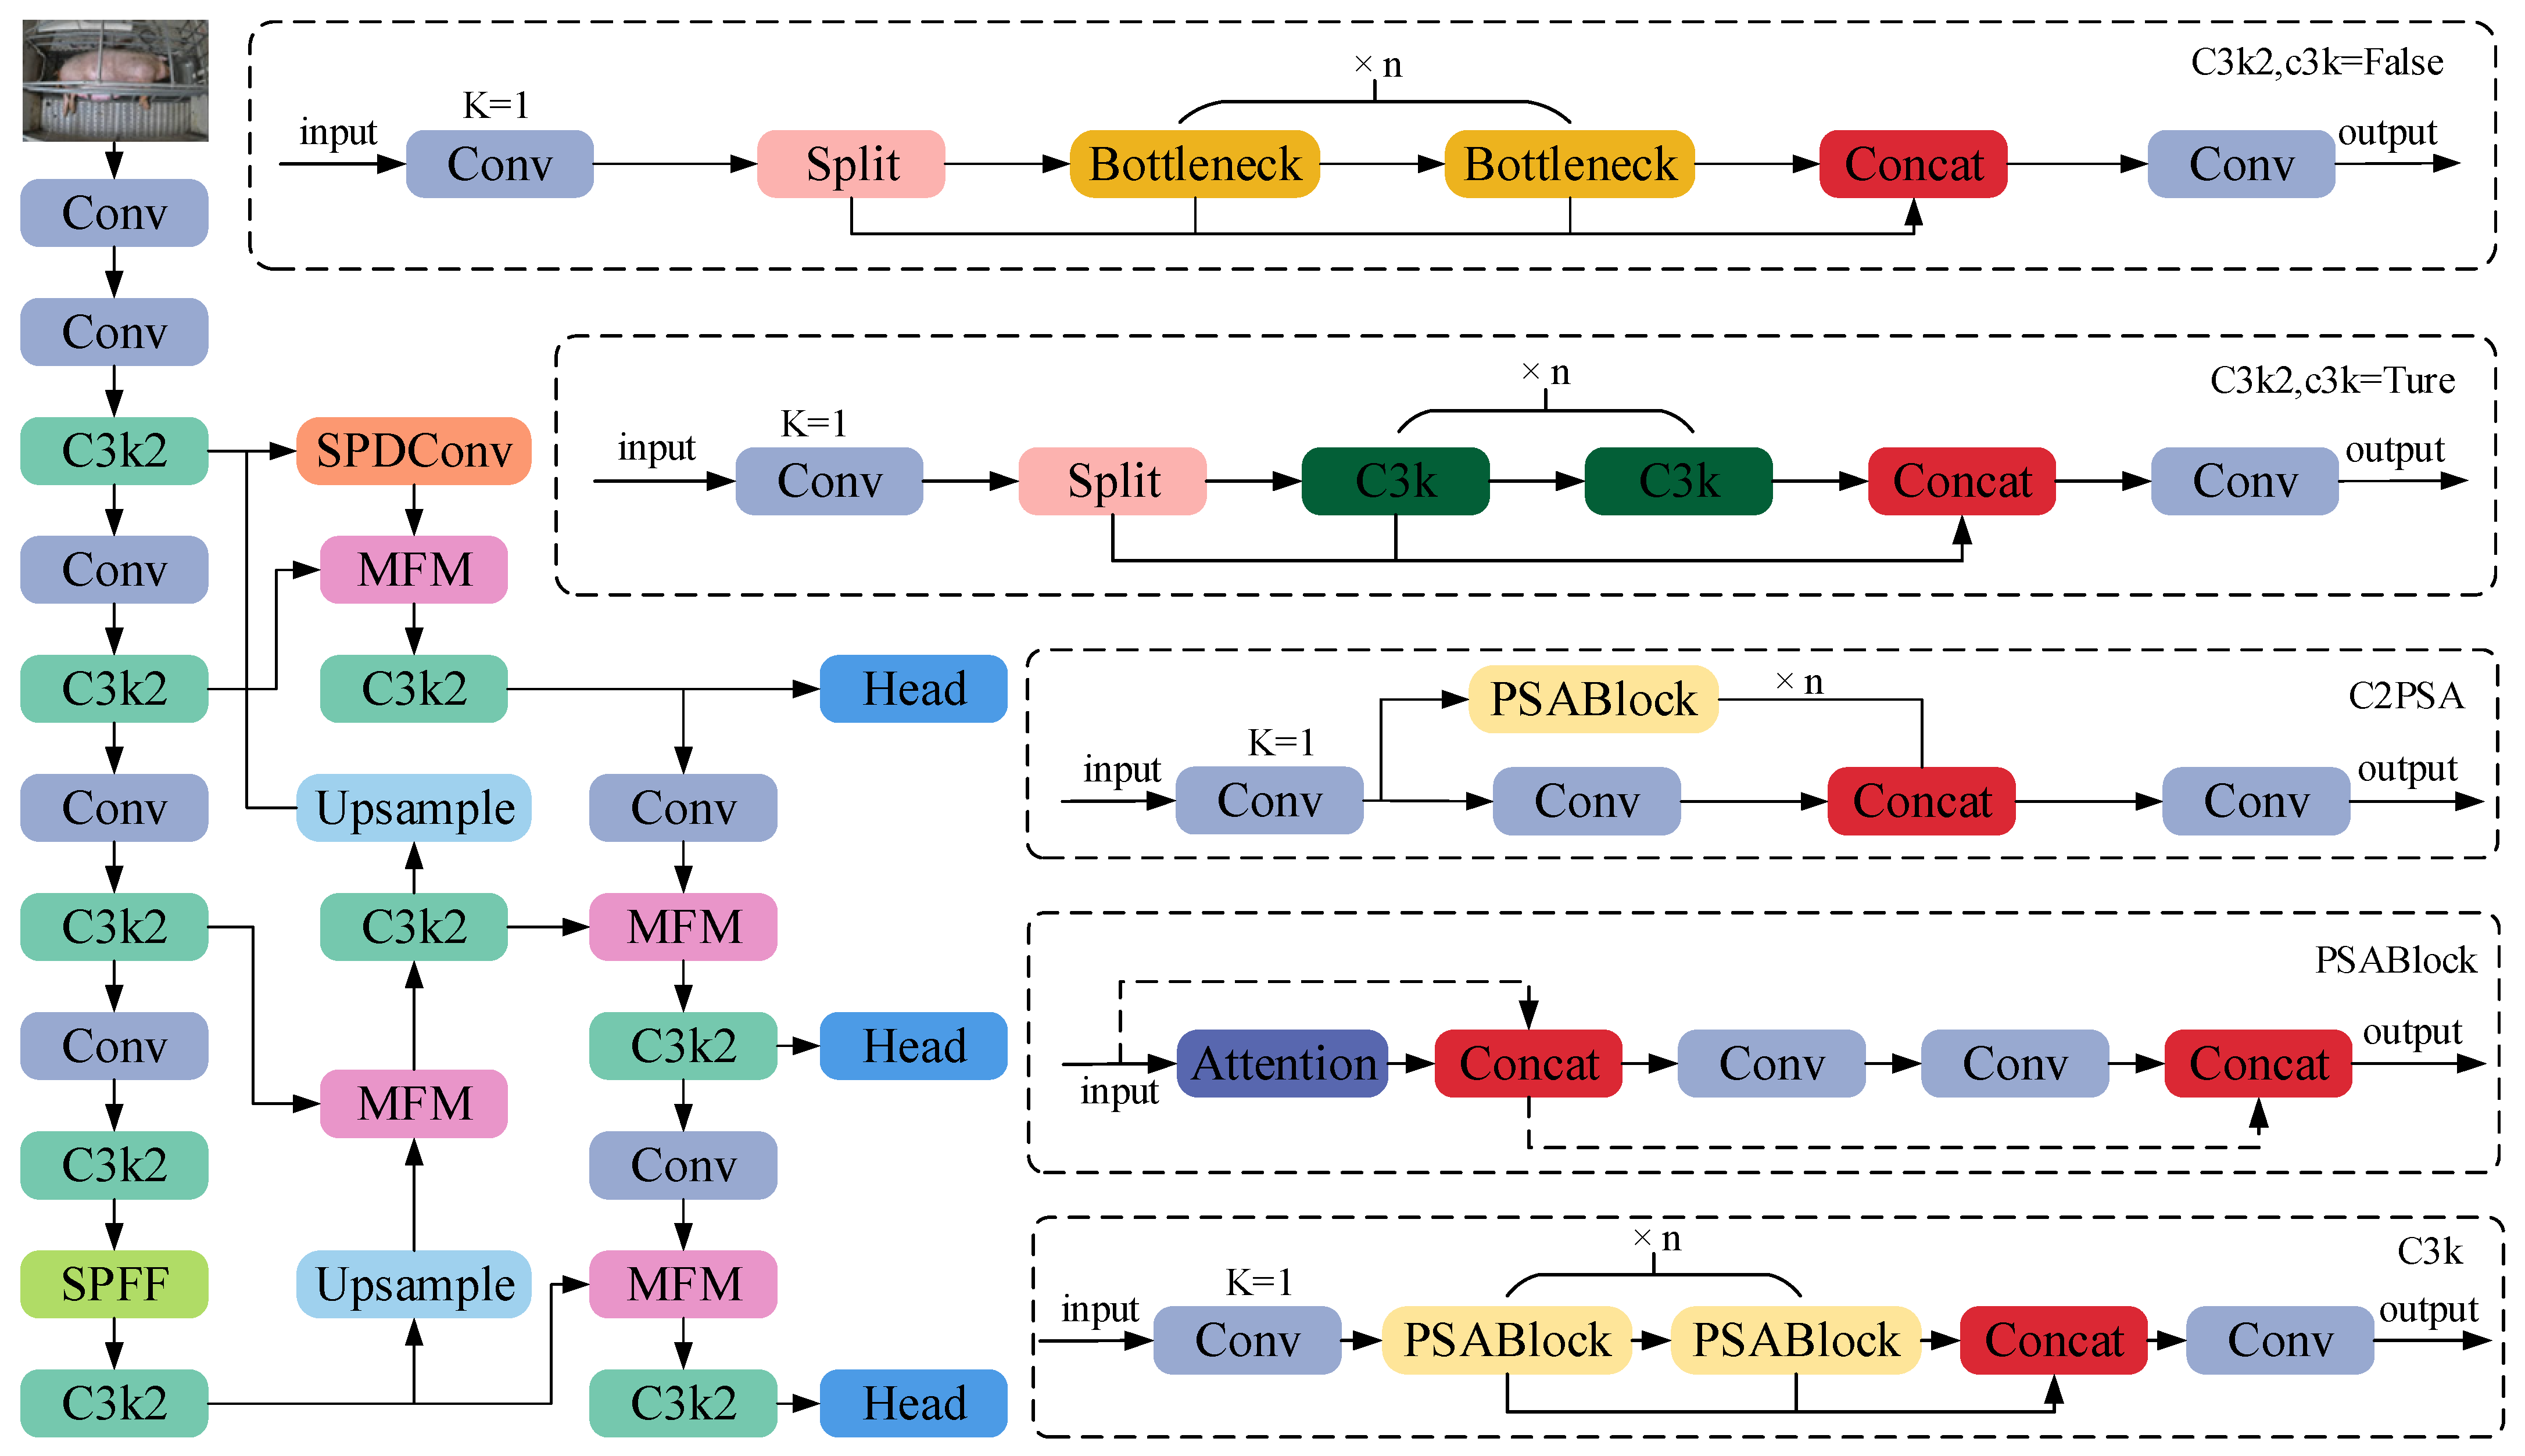
This study adopts the Tracking-by-Detection (TBD) paradigm, in which reliable multi-object tracking is achieved by first detecting targets in each frame and then associating these detections across time. Within this framework, detection accuracy directly determines the quality of trajectory continuity. To this end, we propose an enhanced detection framework based on YOLOv11 [22], termed SPMF-YOLO, designed to improve the precision of newborn piglet detection under challenging farrowing conditions and to provide dependable inputs for subsequent activity quantification. At the input stage, the model applies standardization and frame-selection enhancement before feeding the data into the YOLOv11 backbone for multi-level feature extraction. At the backbone output stage, the original deep semantic extraction structure is preserved, while optimizations are introduced to improve shallow-level small-object feature learning. The SPMF module group, consisting of SPDConv and MFM, is incorporated into the model neck to enhance the feature pyramid’s capacity for small-object pose representation. Specifically, the SPDConv module transforms spatial structural information from layer P2 into depth-dimensional signals, thereby enriching low-level structural features. The MFM module performs attention-weighted fusion of feature maps across different resolutions to mitigate semantic dilution caused by conventional feature concatenation. Compared with conventional PANet pathways, the SPMF module effectively enhances small-object detection performance while maintaining manageable computational complexity.
At the detection output stage, the model generates three feature maps (P3, P4, P5) at different scales and performs classification as well as localization decoding in the Detect layer. In addition, the original CIoU loss was substituted by the NWD loss, which improves the robustness of bounding box regression. Figure 2 presents the complete architecture of the SPMF-YOLO model.

2.3.1. SPDConv Module

To improve the detection capability of the model for small targets such as newborn piglets, we introduce a lightweight spatial–depth feature conversion module, SPDConv [23]. This module strengthens the representational capacity of shallow-layer features while substantially reducing computational complexity. It is designed to mitigate problems caused by conventional downsampling operations, such as the loss of small-target information and the elimination of texture details resulting from strided convolution.
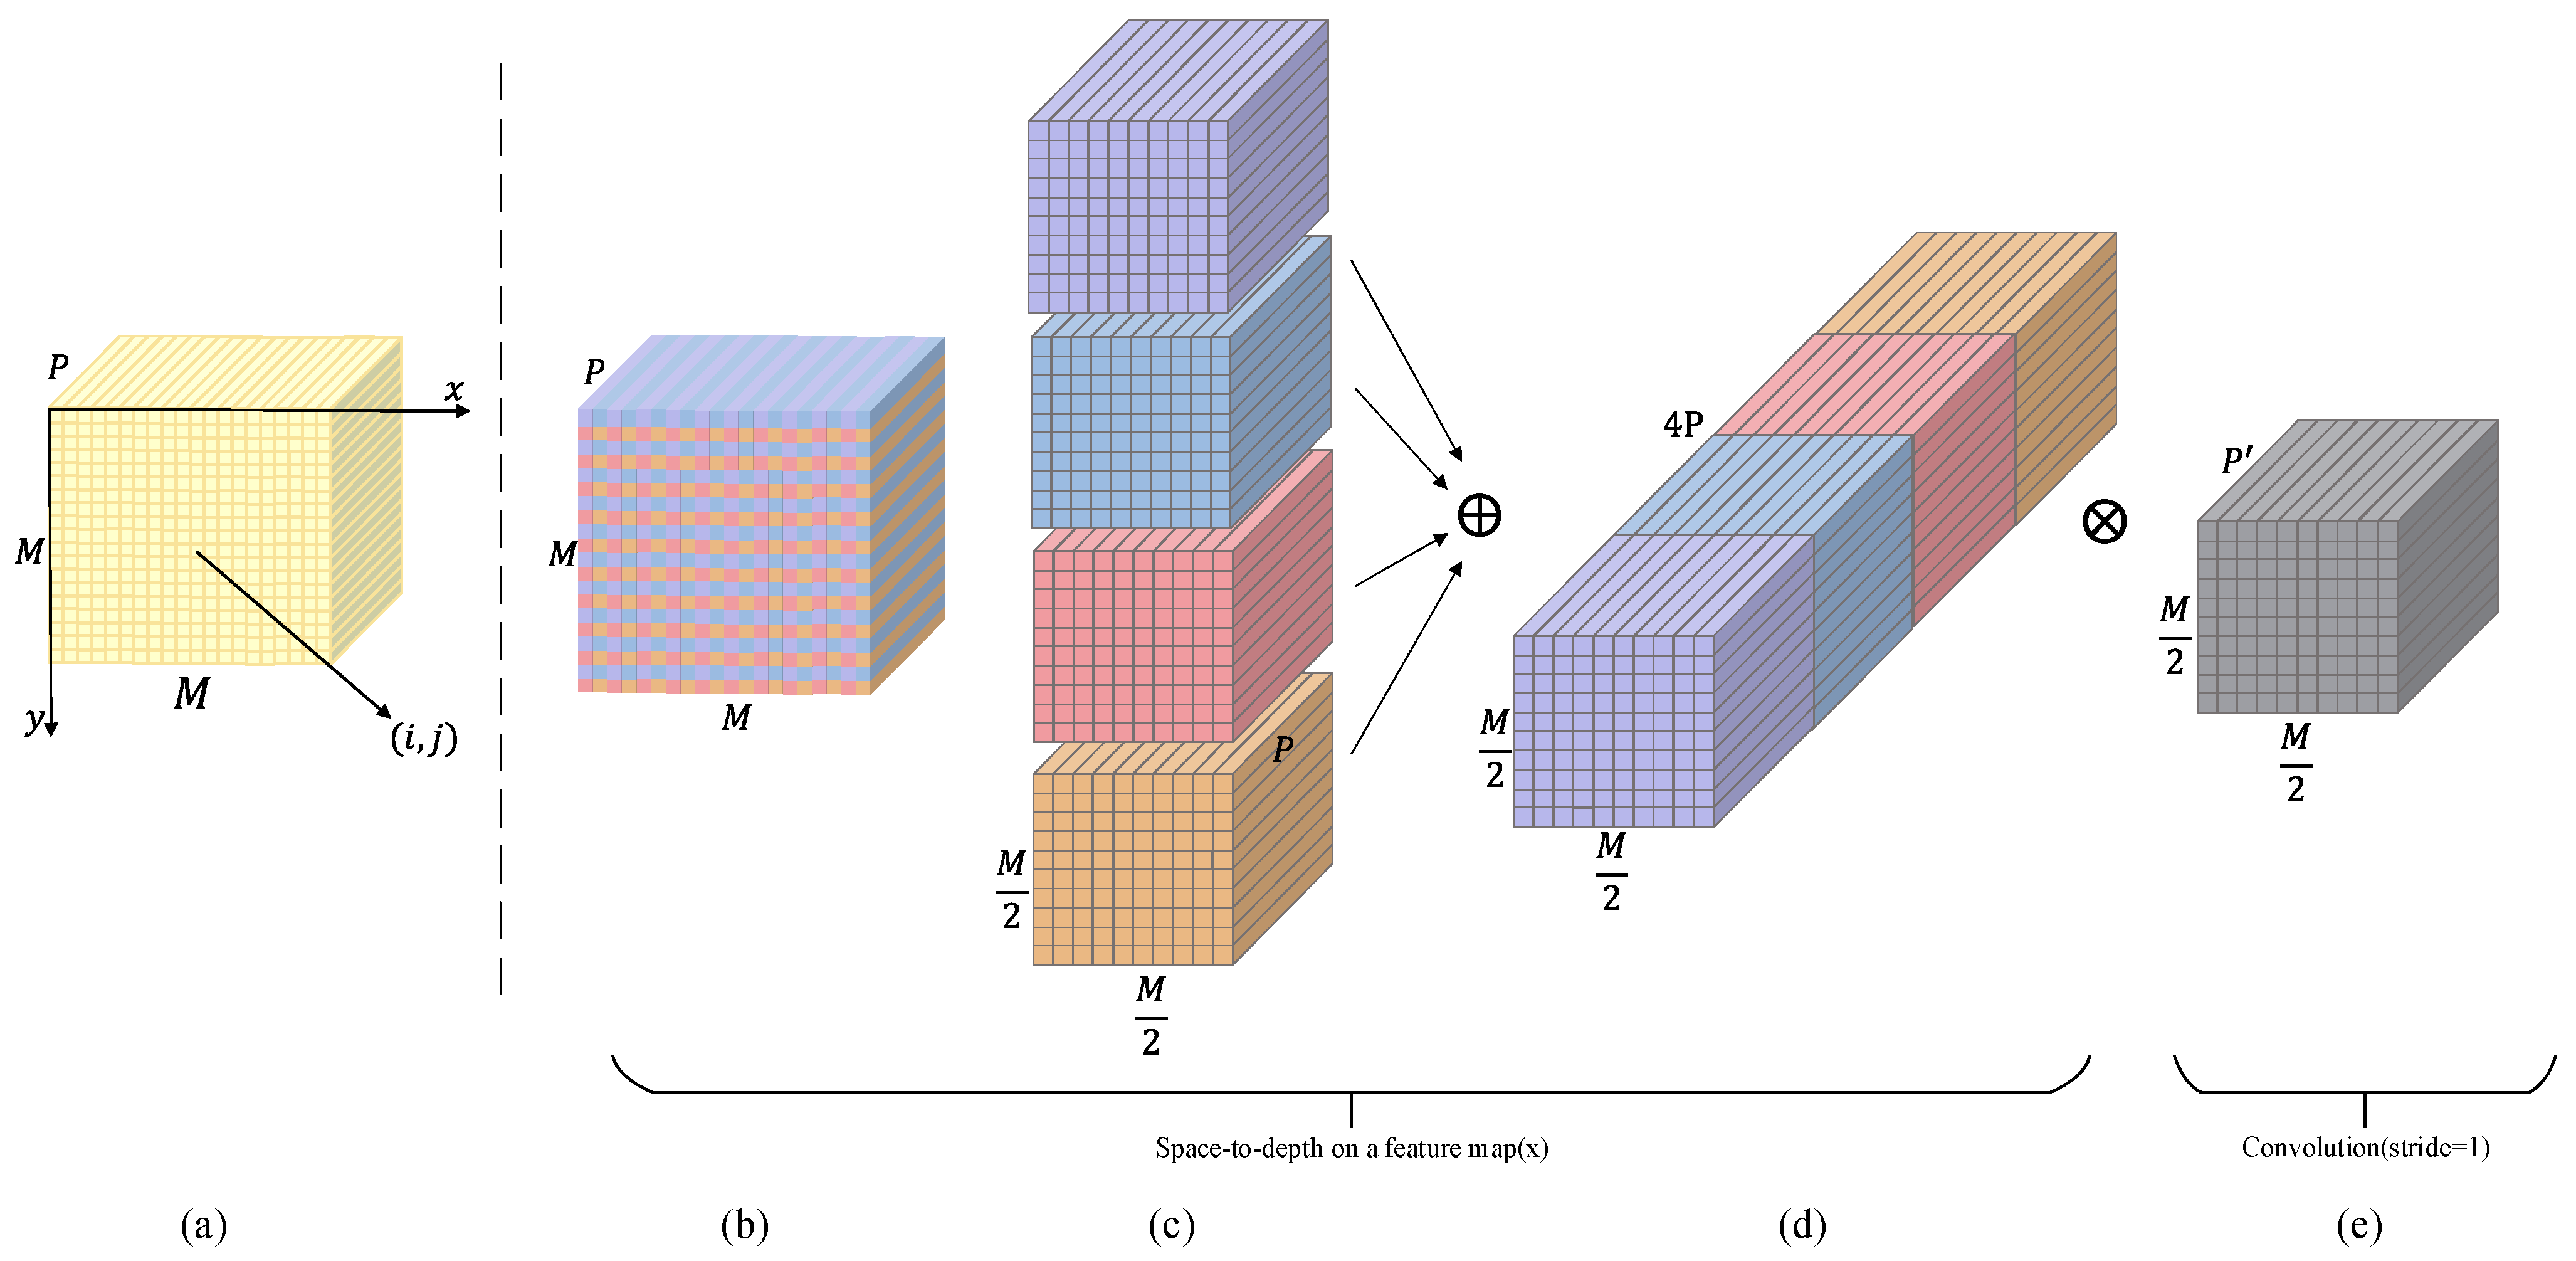
The core concept of SPDConv is to re-encode two-dimensional spatial information into the channel dimension, thereby implementing an efficient feature-reconstruction strategy that simultaneously achieves spatial compression and channel enhancement. Specifically, given an input feature map X R M × M × C 1 , it is partitioned into P   ×   P subregions, and subfeature maps f i , j R M P × M P × C 1 are extracted from each region, as defined in Equation (1):
f i , j x , y , : = X x · P + i , y · P + j , :
where i , j 0 , 1 , , P 1 , x and y denote spatial coordinates within the traversed subgraph.
These subfeature maps are subsequently concatenated along the channel dimension to construct the intermediate feature map (Equation (2)).
X R M P × M P × ( P 2 C 1 )
In this study, P = 2 is selected, meaning that a four-way slicing operation is performed on the input feature map (Equations (3) and (4)).
f 0,0 = X 0 : M : P , 0 : M : P , f 1,0 = X 1 : M : P , 0 : M : P
f 0,1 = X 0 : M : P , 1 : M : P , f 1,1 = X 1 : M : P , 1 : M : P
This achieves spatial dimension reduction and channel dimension expansion. To prevent semantic dilution of feature representations after compression, we further introduce a s t r i d e = 1 convolutional layer on X , with an output channel count of C 2 < P 2 C 1 , to perform non-stride channel integration.
This process achieves spatial-dimension reduction and channel-dimension expansion. To mitigate semantic dilution of feature representations after compression, a stride-1 convolutional layer is further applied to X , with the output channel count constrained to C 2 < P 2 C 1 , in order to perform non-strided channel integration (Equation (5)).
X = C o n v 1 × 1 s t r i d e = 1 ( X ) R M P × M P × C 2
The use of non-strided convolution effectively prevents asymmetric information loss during the sampling process. Conventional convolutions with s t r i d e = 2 can cause temporal sampling discrepancies between even and odd columns, while odd strides (e.g., s t r i d e = 3 ) result in partial pixel sampling, which blurs or removes the boundaries of small targets. Therefore, applying a s t r i d e = 1 convolutional kernel after SPD preserves discriminative details and particularly enhances structural retention for piglet targets in overlapping or stacked environments. The above process is shown in Figure 3.
During model training, SPDConv was applied to the shallow path of the P3 branch, significantly enhancing detection accuracy for low-resolution targets such as newborn piglets. In the validation phase, SPDConv played a crucial role in preserving contour fidelity, retaining fine-grained piglet features even in complex backgrounds or under occlusion by sows.

2.3.2. MFM Module

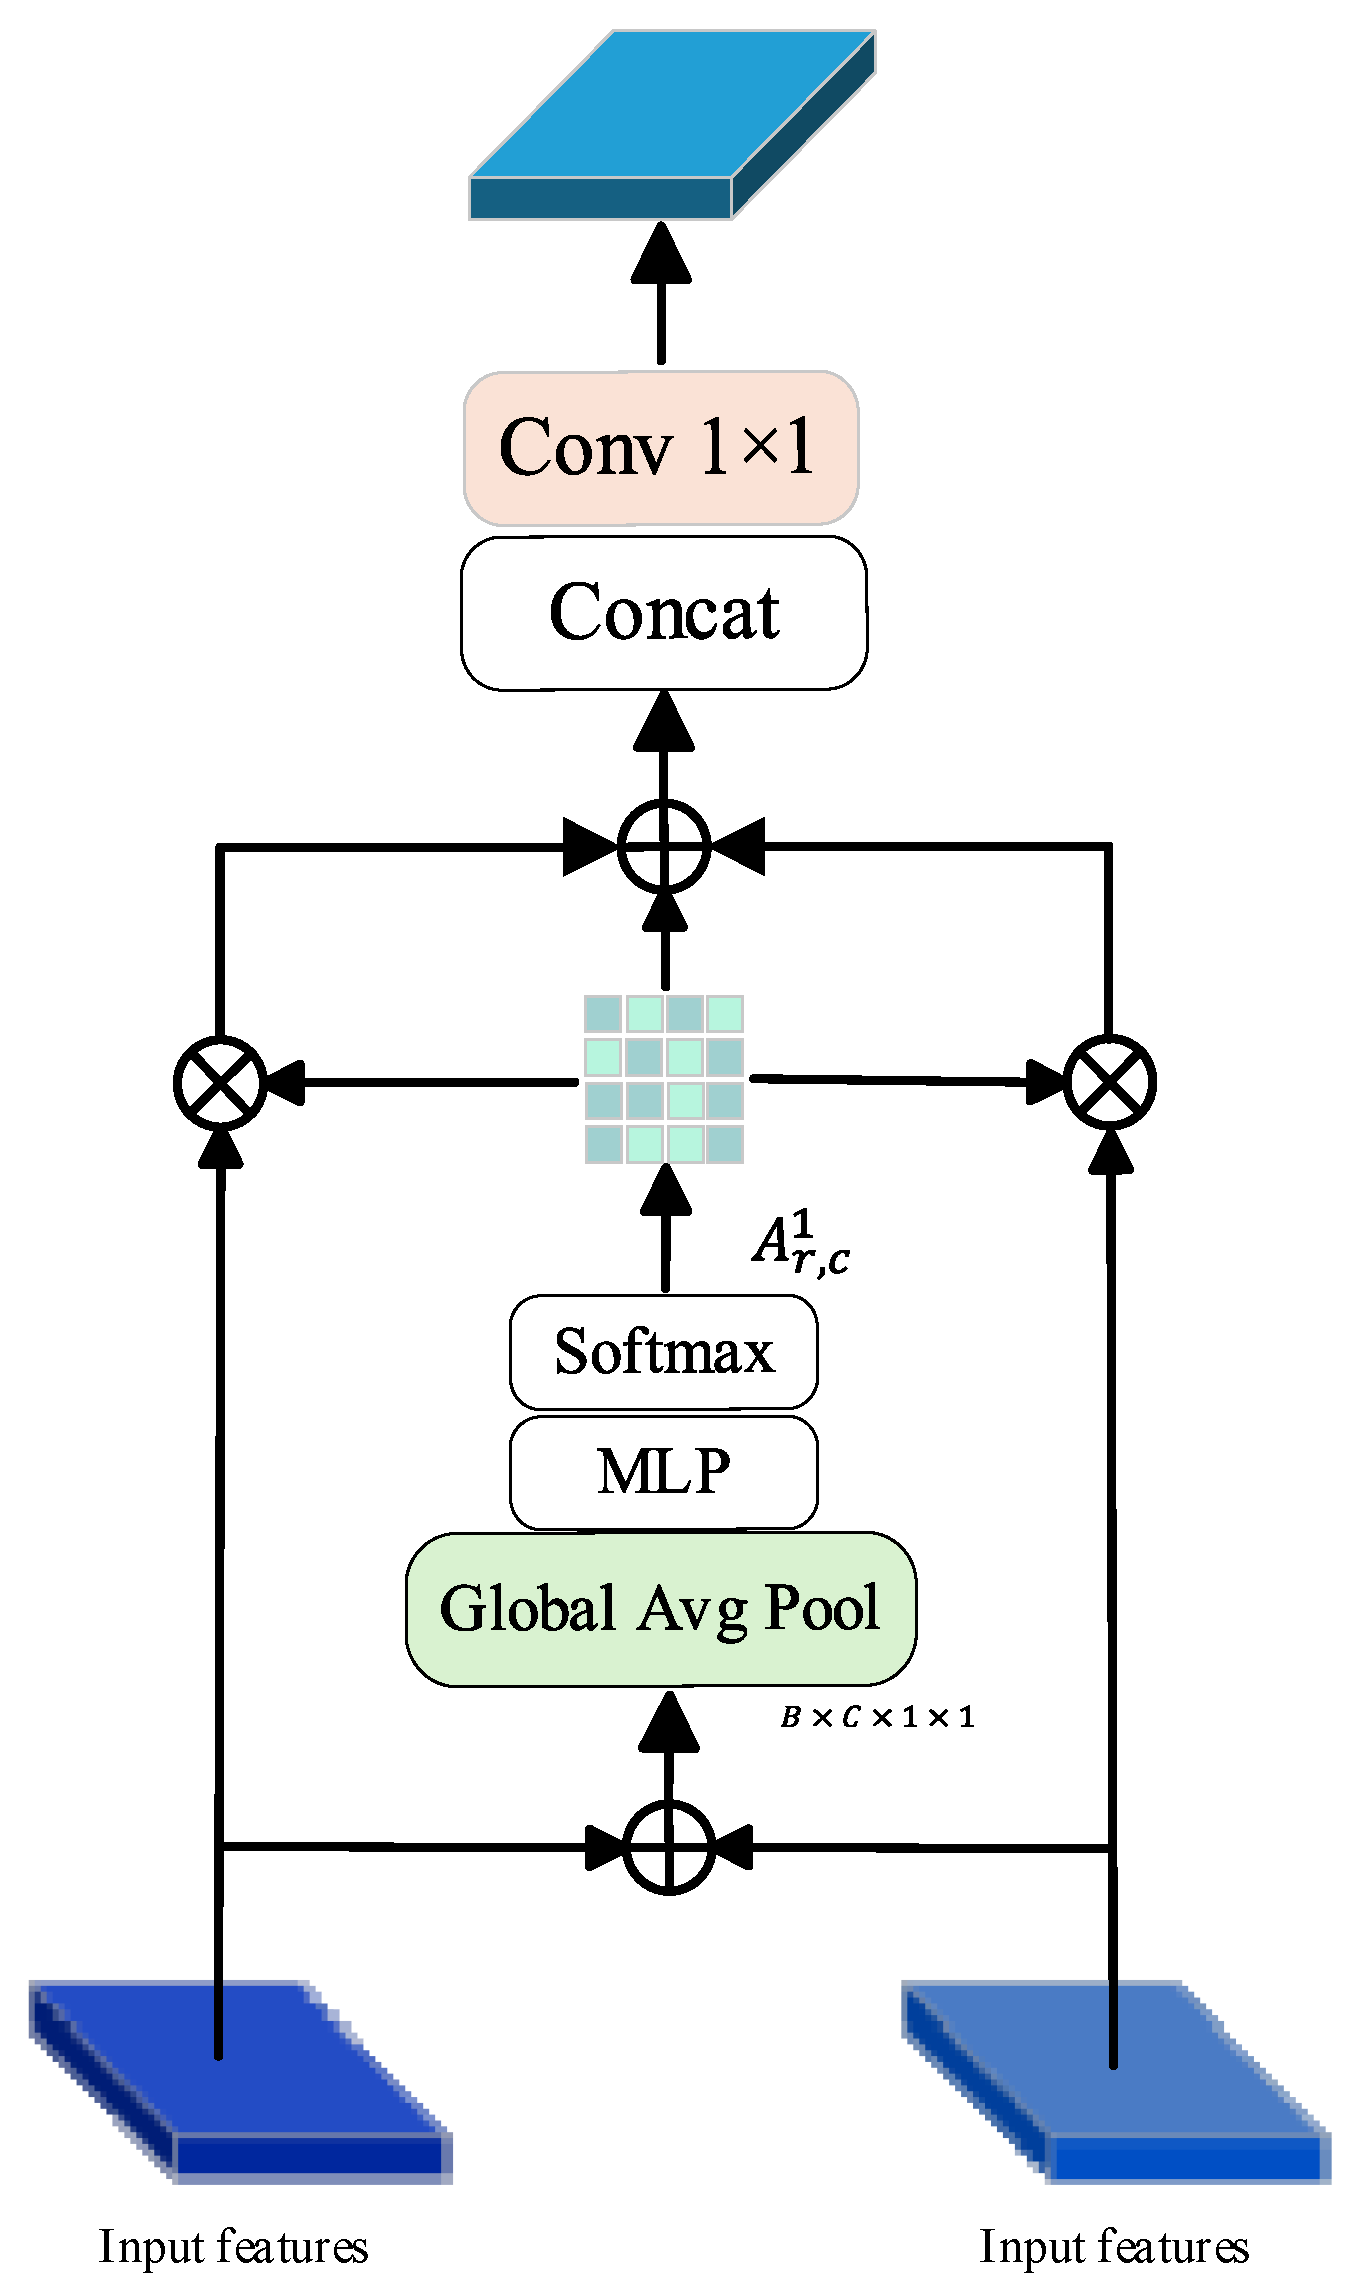
In order to overcome the shortcomings inherent in conventional feature-fusion approaches, specifically, semantic information dilution and the inability of fixed fusion coefficients to adapt to dynamic scene demands—this study proposes a lightweight Modulation Fusion Module (MFM) [24]. The module enhances the interaction among multi-scale features by assigning dynamic weights to each input branch during fusion, thereby enabling efficient integration of cross-layer semantic information. It is particularly effective for detecting small targets, such as newborn piglets, in farrowing environments. An overview of the MFM architecture is presented in Figure 4.
Structurally, the MFM module receives feature maps from multiple scales or channel dimensions as inputs. First, it aligns the features of each branch to the target dimension C using a 1 × 1 convolution. Specifically, for each input feature map F i R B × C i × H × W with C i input channels: if C i C , a 1 × 1 convolution is applied to project it into the C dimensional space; otherwise, identity mapping is adopted to preserve the original features and avoid redundant computation. All aligned feature maps are concatenated along the channel dimension to form a tensor F R B × ( n · C ) × H × W , which is then reshaped into a five-dimensional tensor F R B × n × C × H × W to preserve the independent semantics of each branch. Subsequently, the module performs weighted fusion on F along the branch dimension. First, it computes the channel-wise global contextual representation of F , as defined in Equation (6).
g = G A P ( i = 1 n F i ) R B × C × 1 × 1
The global feature is then fed into a two-layer multi-layer perceptron (MLP) for dimensionality reduction and expansion, enabling the model to learn the relative importance of each branch under the current context, as formulated in Equation (7).
A = S o f t m a x ( C o n v 1 × 1 u p ( R e L U ( C o n v 1 × 1 d o w n ( g ) ) ) ) R B × C × 1 × 1
Here, the channel-reduction ratio is controlled by the hyperparameter r e d u c t i o n = 8 . The weight tensor A represents the fusion importance of each branch across different channels, with the Softmax function applied to ensure normalization and interpretability. Finally, the MFM module integrates multi-scale semantics through branch-wise weighted summation, as expressed in Equation (8).
F o u t = i = 1 n A i · F i
The experimental findings indicate that incorporating the MFM module strengthens the feature-integration ability of the SPMF-YOLO framework, with only a minimal rise in computational cost.

2.3.3. Normalized Wasserstein Distance Loss Function

In newborn piglet detection, the accuracy of bounding-box prediction is crucial for overall detection performance. Mainstream detectors typically employ localization loss functions. However, these metrics rely solely on the overlapping area of bounding boxes and present the following drawbacks: (1) If the bounding boxes are non-overlapping, the gradient of the loss drops to zero, hindering effective training; and (2) they are unable to fully represent the shape and spatial distribution of objects. To address these issues, we adopt the Normalized Wasserstein Distance (NWD) [25] loss as an alternative, which evaluates bounding boxes from a probabilistic distribution perspective and improves localization for small or ambiguous targets. In the NWD formulation, the box center coordinates ( x , y ) and dimensions ( w , h ) are used as inputs, and a Gaussian distribution is applied to measure the discrepancy between predicted boxes and ground-truth annotations. The NWD loss function can be formulated as follows:
N W D P , G = 1 α · | | μ P μ G | | 2 2 + T r ( Σ P + Σ G 2 ( Σ P 1 / 2 Σ G Σ P 1 / 2 ) 1 / 2 )
Here, μ P and μ G indicate the central coordinates of the predicted bounding box P and the ground-truth box G , respectively; Σ P and Σ G represent the covariance matrices of the predicted box and the ground-truth box, respectively, which are generally assumed to be in the form of diagonal matrices Σ = d i a g ( w 2 , h 2 ) , where w and h are the width and height of the box, respectively; α denotes the normalization coefficient, which is used to balance the value range in the calculation and generally takes the length of the image diagonal; T r ( · ) represents the trace of a matrix;
In this way, the NWD loss can comprehensively calculate the overall difference between the predicted box and the ground-truth box while accounting for both the center position and size of the boxes. Notably, in scenarios where target centroids are close but there are significant differences in size, NWD enables more accurate measurement.

2.4. Bytetrack Model

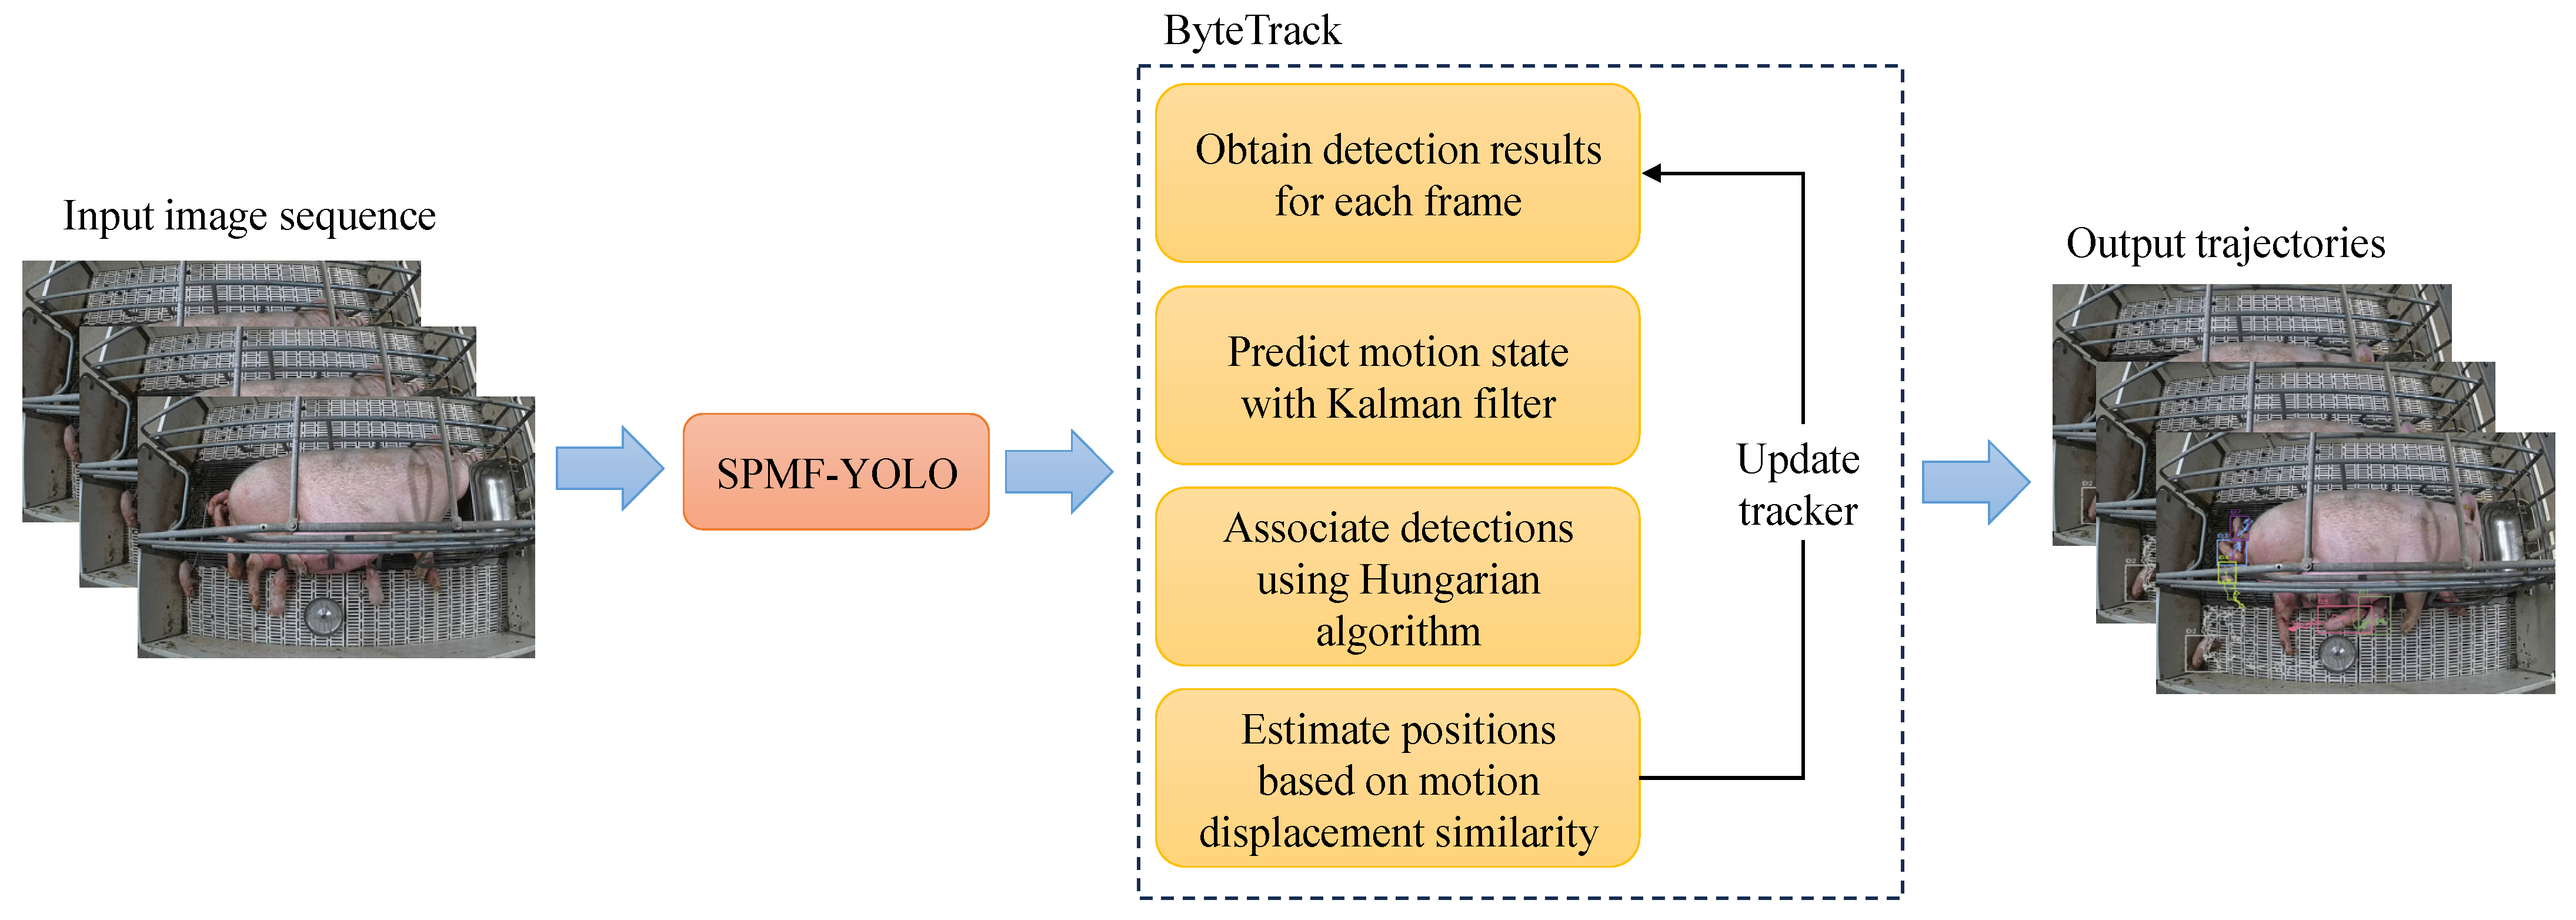
This study integrates the high-performance multi-object tracker ByteTrack [26] with the outputs of the SPMF-YOLO detector to achieve frame-by-frame tracking of each piglet. As an advanced tracking algorithm, ByteTrack enhances robustness in pig behavior monitoring through its unique frame-processing mechanism: First, it applies a confidence threshold to divide detected boxes into high- and low-confidence sets. High-confidence boxes are used for Kalman filter–based trajectory prediction and historical ID matching to maintain pig identity continuity, whereas low-confidence boxes are secondarily matched with unassociated trajectories to account for reappearance after brief occlusions. Unmatched high-confidence boxes initiate new trajectories, while unmatched trajectories are retained for a fixed number of frames to accommodate potential reappearance after occlusion. At its core, ByteTrack leverages the Hungarian algorithm to efficiently solve optimal matching problems in complex scenarios, in combination with Kalman filtering to accurately predict pig movement states. The proposed design facilitates ID recovery following occlusion and markedly boosts tracking robustness and precision in large-scale livestock farming scenarios. Figure 5 depicts the operational principle of ByteTrack.

2.5. Model Evaluation Approach

2.5.1. Performance Indicators for Object Detection

For a thorough assessment of the proposed detection model, precision (P), recall (R), mAP@0.5, and mAP@0.5:0.95 are employed as evaluation criteria, with their definitions provided in Equations (10)–(13).
P = T P T P + F N × 100 %
R = T P T P + F P × 100 %
A P = 0 1 p ( r ) d r
m A P = i = 1 M A P i M
TP denotes the number of correctly identified newborn piglets, FP denotes the number of false positives detected by the model, and FN denotes the number of false negatives.
In addition, the number of model parameters (Params) is reported as an evaluation metric to assess the improved YOLOv11 model.

2.5.2. Evaluation Metrics for Target Tracking

In evaluating the multi-object tracking of newborn piglets, four principal metrics are adopted: High-Order Tracking Accuracy (HOTA), MOTA, IDF1, and ID Switches (IDSW). Among them, HOTA serves as a high-dimensional metric that offers a systematic and holistic evaluation of multi-object tracking methods. Its mathematical formulation is presented in Equation (14).
H O T A = D e t A · A s s A = C T P A ( c ) T P + F N + F P
where DetA measures detection accuracy and AssA evaluates the stability of identity association during tracking. Here, C denotes the set of matching points belonging to true positives (TP), and A(c) represents the accuracy of association results within this set.
MOTA serves as an aggregate index of tracking accuracy, integrating errors from missed detections, false positives, and identity switches. Its computation is given in Equation (15).
M O T A = 1 F N + F P + I D S W G T
Here, FN and FP refer to the counts of false negatives and false positives at frame t, while GT denotes the overall ground-truth instances within the sequence.
IDF1 measures the robustness of a tracking system, where a larger score corresponds to more precise and stable tracking results. The computation of IDF1 is provided in Equation (16).
I D F 1 = 2 I D T P 2 I D T P + I D F P + I D F N
Here, IDTP indicates the count of targets that were tracked correctly while maintaining consistent IDs. IDFN corresponds to the total instances that retained their IDs but were missed by the tracker, and IDFP describes the number of incorrectly tracked targets whose IDs remained unchanged.

3. Results and Analysis

3.1. Training Settings

All experiments in this work were conducted using the PyTorch 1.13.0 deep learning framework, on a workstation configured with an Intel Core i9-10900K CPU, 64 GB of memory, and an NVIDIA RTX 3090 graphics card. All models were trained under the same hyperparameter settings, including an input resolution of 640 × 640 pixels with the AdamW optimizer, 300 epochs, a batch size of 24, 8 workers, and a close-mosaic value of 10. All models included in the comparison were trained and validated on a common dataset.

3.2. SPMF-YOLO Detection Performance

In this study, we conducted systematic ablation experiments on the proposed SPMF-YOLO model (Table 2).
Results demonstrate that introducing SPDConv, MFM, and NWD modules increases parameters by only 3.6 M, yet detection accuracy and recall both improve by 2.3%, achieving optimal overall performance. Compared with the baseline YOLOv11n, FLOPs increased from 6.3 G to 12.3 G and inference latency rose moderately from 6.3 ms to 10.1 ms, indicating that the computational overhead remains acceptable. Specifically, SPDConv effectively mitigates small object information loss caused by downsampling, boosting mAP@0.5 by 0.6%. The addition of MFM enhances cross-scale semantic fusion capabilities, elevating mAP@0.5 to 97.1%. Further introduction of the NWD loss function significantly improved localization robustness under complex backgrounds and overlapping targets, ultimately achieving detection accuracy and recall of 95.3% and 93.8%. These performance gains can be attributed to complementary mechanisms: SPDConv reduces detail loss during downsampling, MFM strengthens semantic consistency across multiple resolutions, and NWD provides more stable regression optimization under overlap or clutter. Together, they transform limited increases in model complexity into notable improvements in precision and recall.
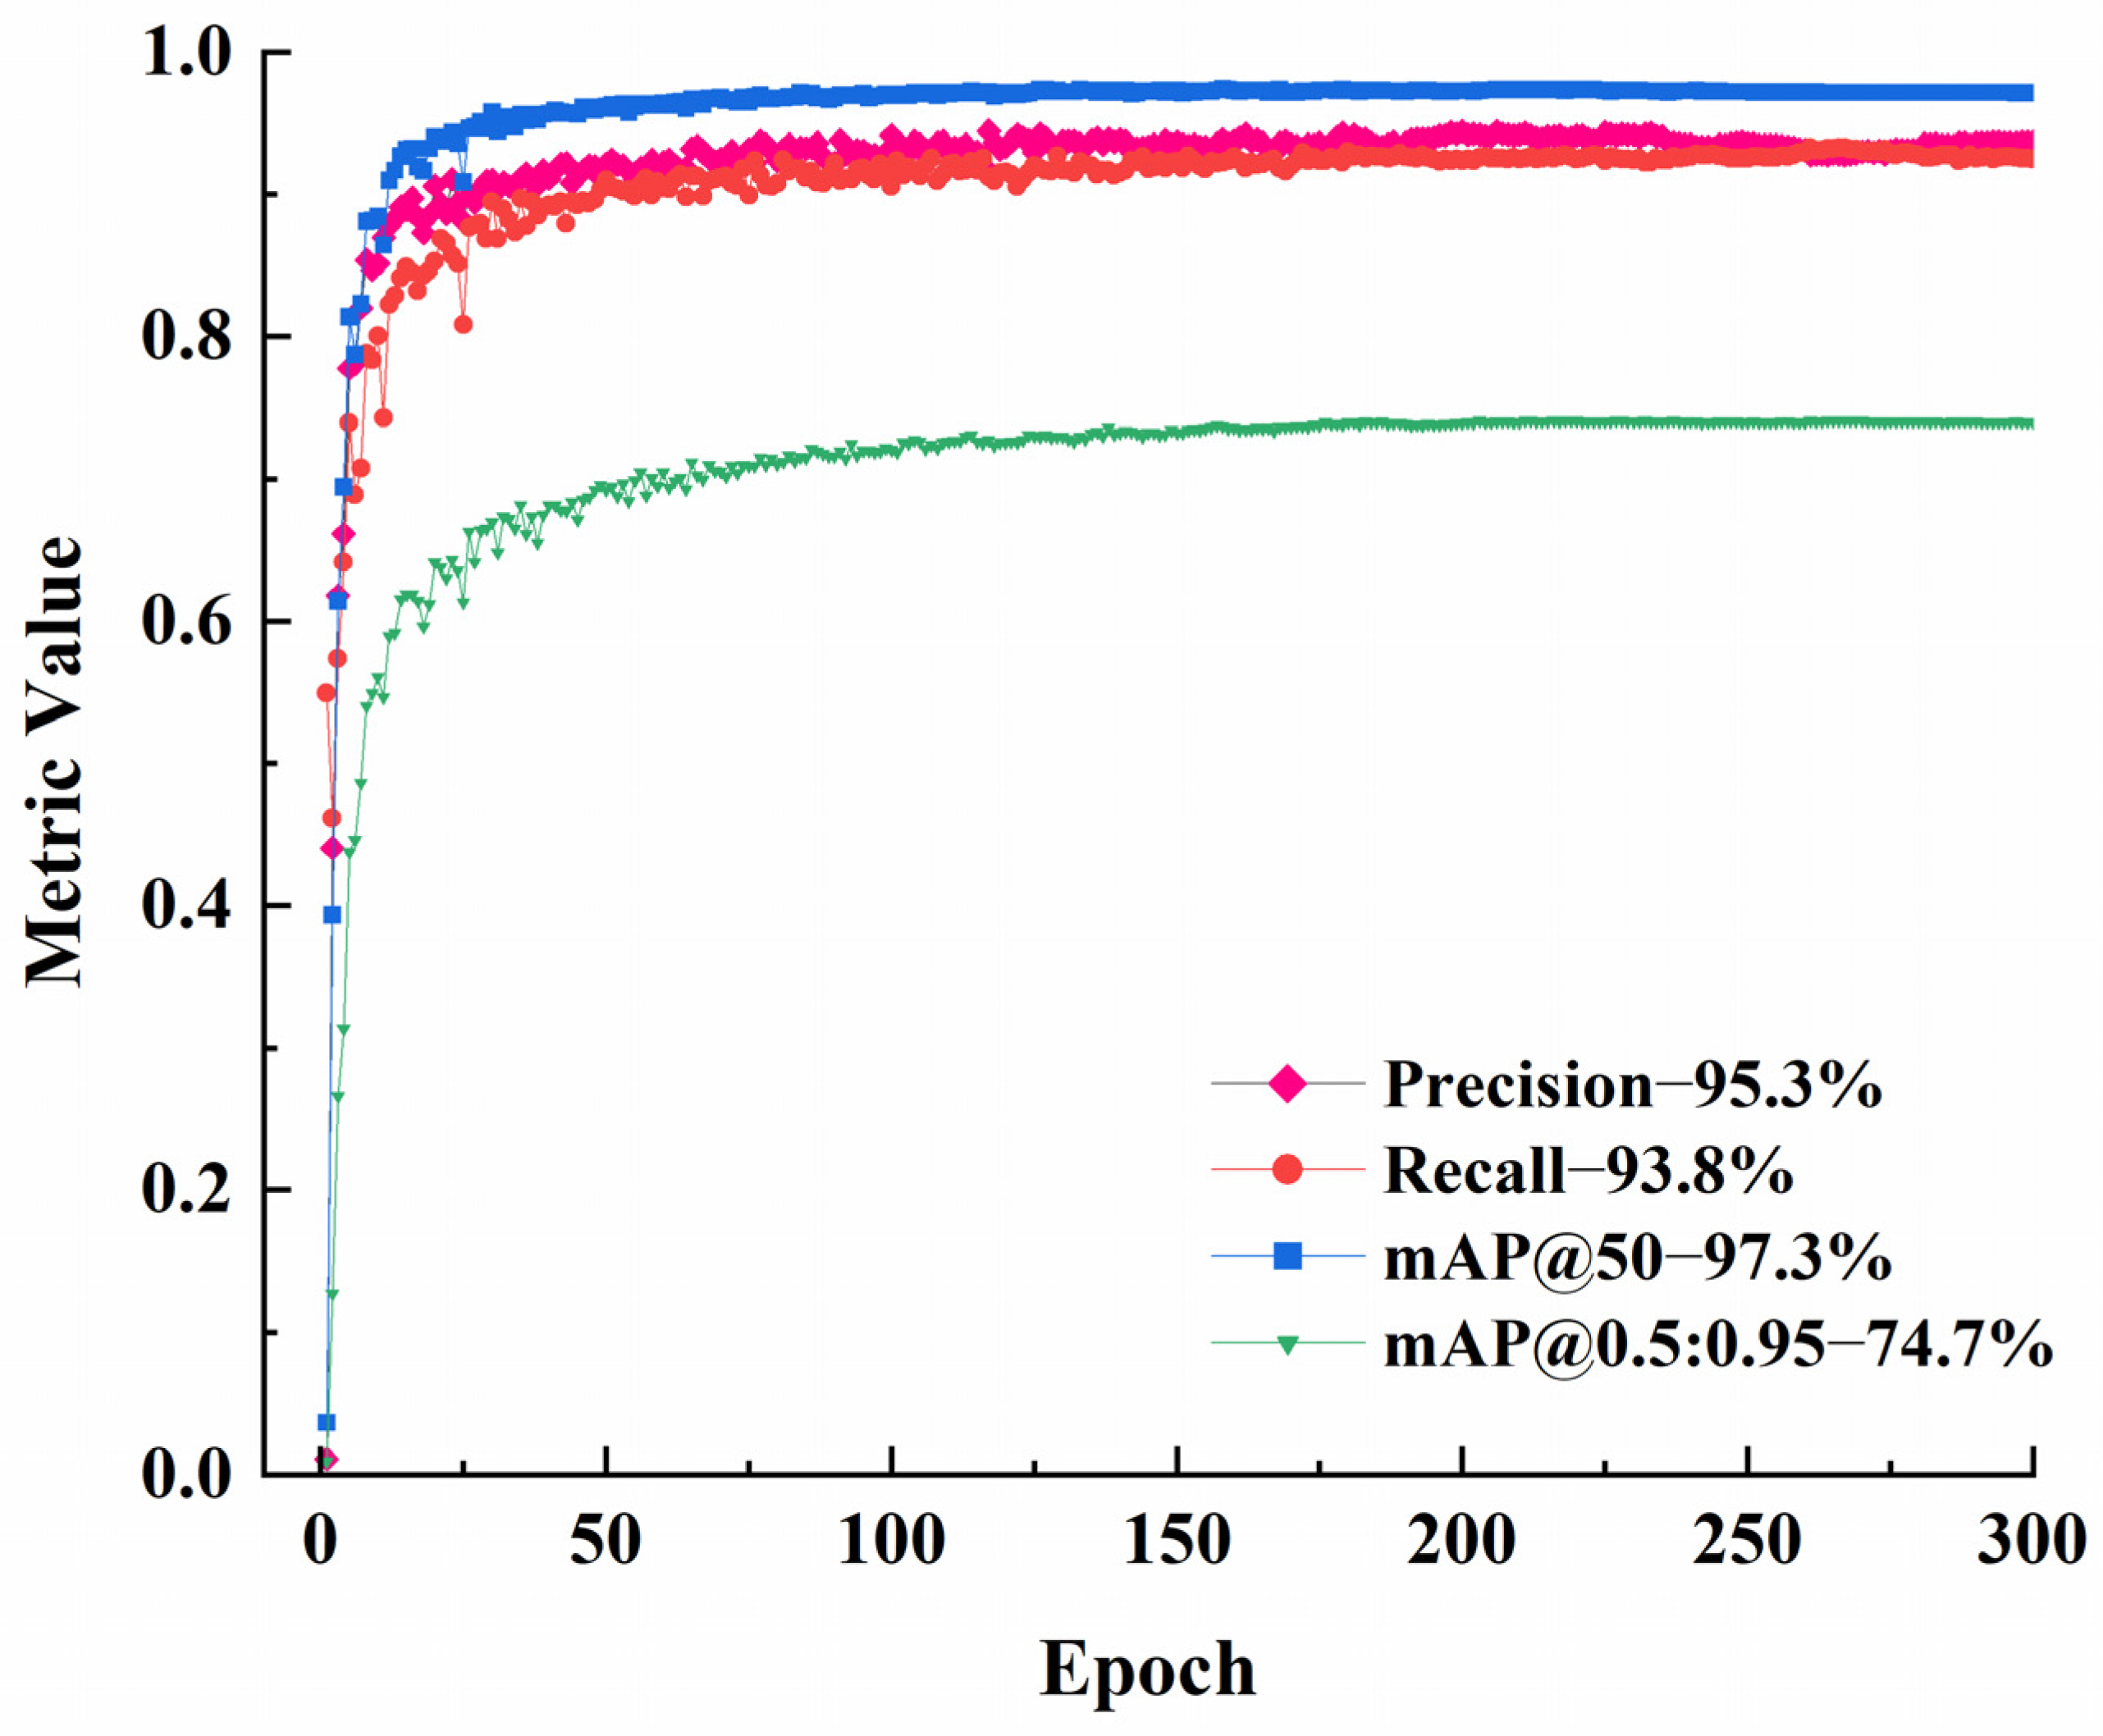
To evaluate model convergence, the evolution of various metrics during training is plotted (Figure 6). Results show rapid improvement across metrics within the first 50 epochs, followed by stabilization after approximately 100 epochs, indicating efficient learning and strong generalization capabilities.
To comprehensively evaluate practical performance, several representative detectors were selected for comparison, including Fast R-CNN, SSD, YOLO variants [27,28,29,30], and RT-DETR [31] (Table 3). The results indicate that Fast R-CNN exhibits high inference latency and achieves only 80.5% mAP@0.5; SSD, while lightweight, struggles with small-object detection; and RT-DETR-L converges slowly under small-sample conditions, with mAP@0.5:0.95 falling below 60%. In contrast, SPMF-YOLO outperformed all comparison models across metrics, surpassing YOLOv8n by 1.9% in mAP@0.5 and by 12.4% in mAP@0.5:0.95. Although the improved SPMF-YOLO increases FLOPs from 6.3 G to 12.3 G and inference latency from 6.2 ms to 10.1 ms, this computational overhead remains moderate compared to large-parameter detectors like Fast R-CNN and RT-DETR-L. More importantly, the proposed model achieves the highest accuracy while maintaining real-time feasibility, demonstrating a favorable balance between complexity and performance. These results demonstrate the superior suitability of SPMF-YOLO for real-world farming scenarios involving newborn piglets characterized by dense occlusions, small body sizes, and blurred boundaries.
In summary, SPMF-YOLO demonstrates significant advantages in small object detection tasks under complex farrowing conditions, validating its applicability and robustness for newborn piglet health identification.

3.3. Results and Analysis of Multi-Target Tracking Algorithms

3.3.1. Performance Comparison of the Algorithm Before and After Improvement

To systematically evaluate multi-object tracking performance under complex scenarios, both the baseline YOLOv11n and the enhanced SPMF-YOLO were employed as detectors on a unified test dataset, combined with the same ByteTrack tracker for comparison. Table 4 reports the experimental outcomes; in this table, (↑) denotes that larger values correspond to better performance, whereas (↓) signifies that smaller values are favorable.
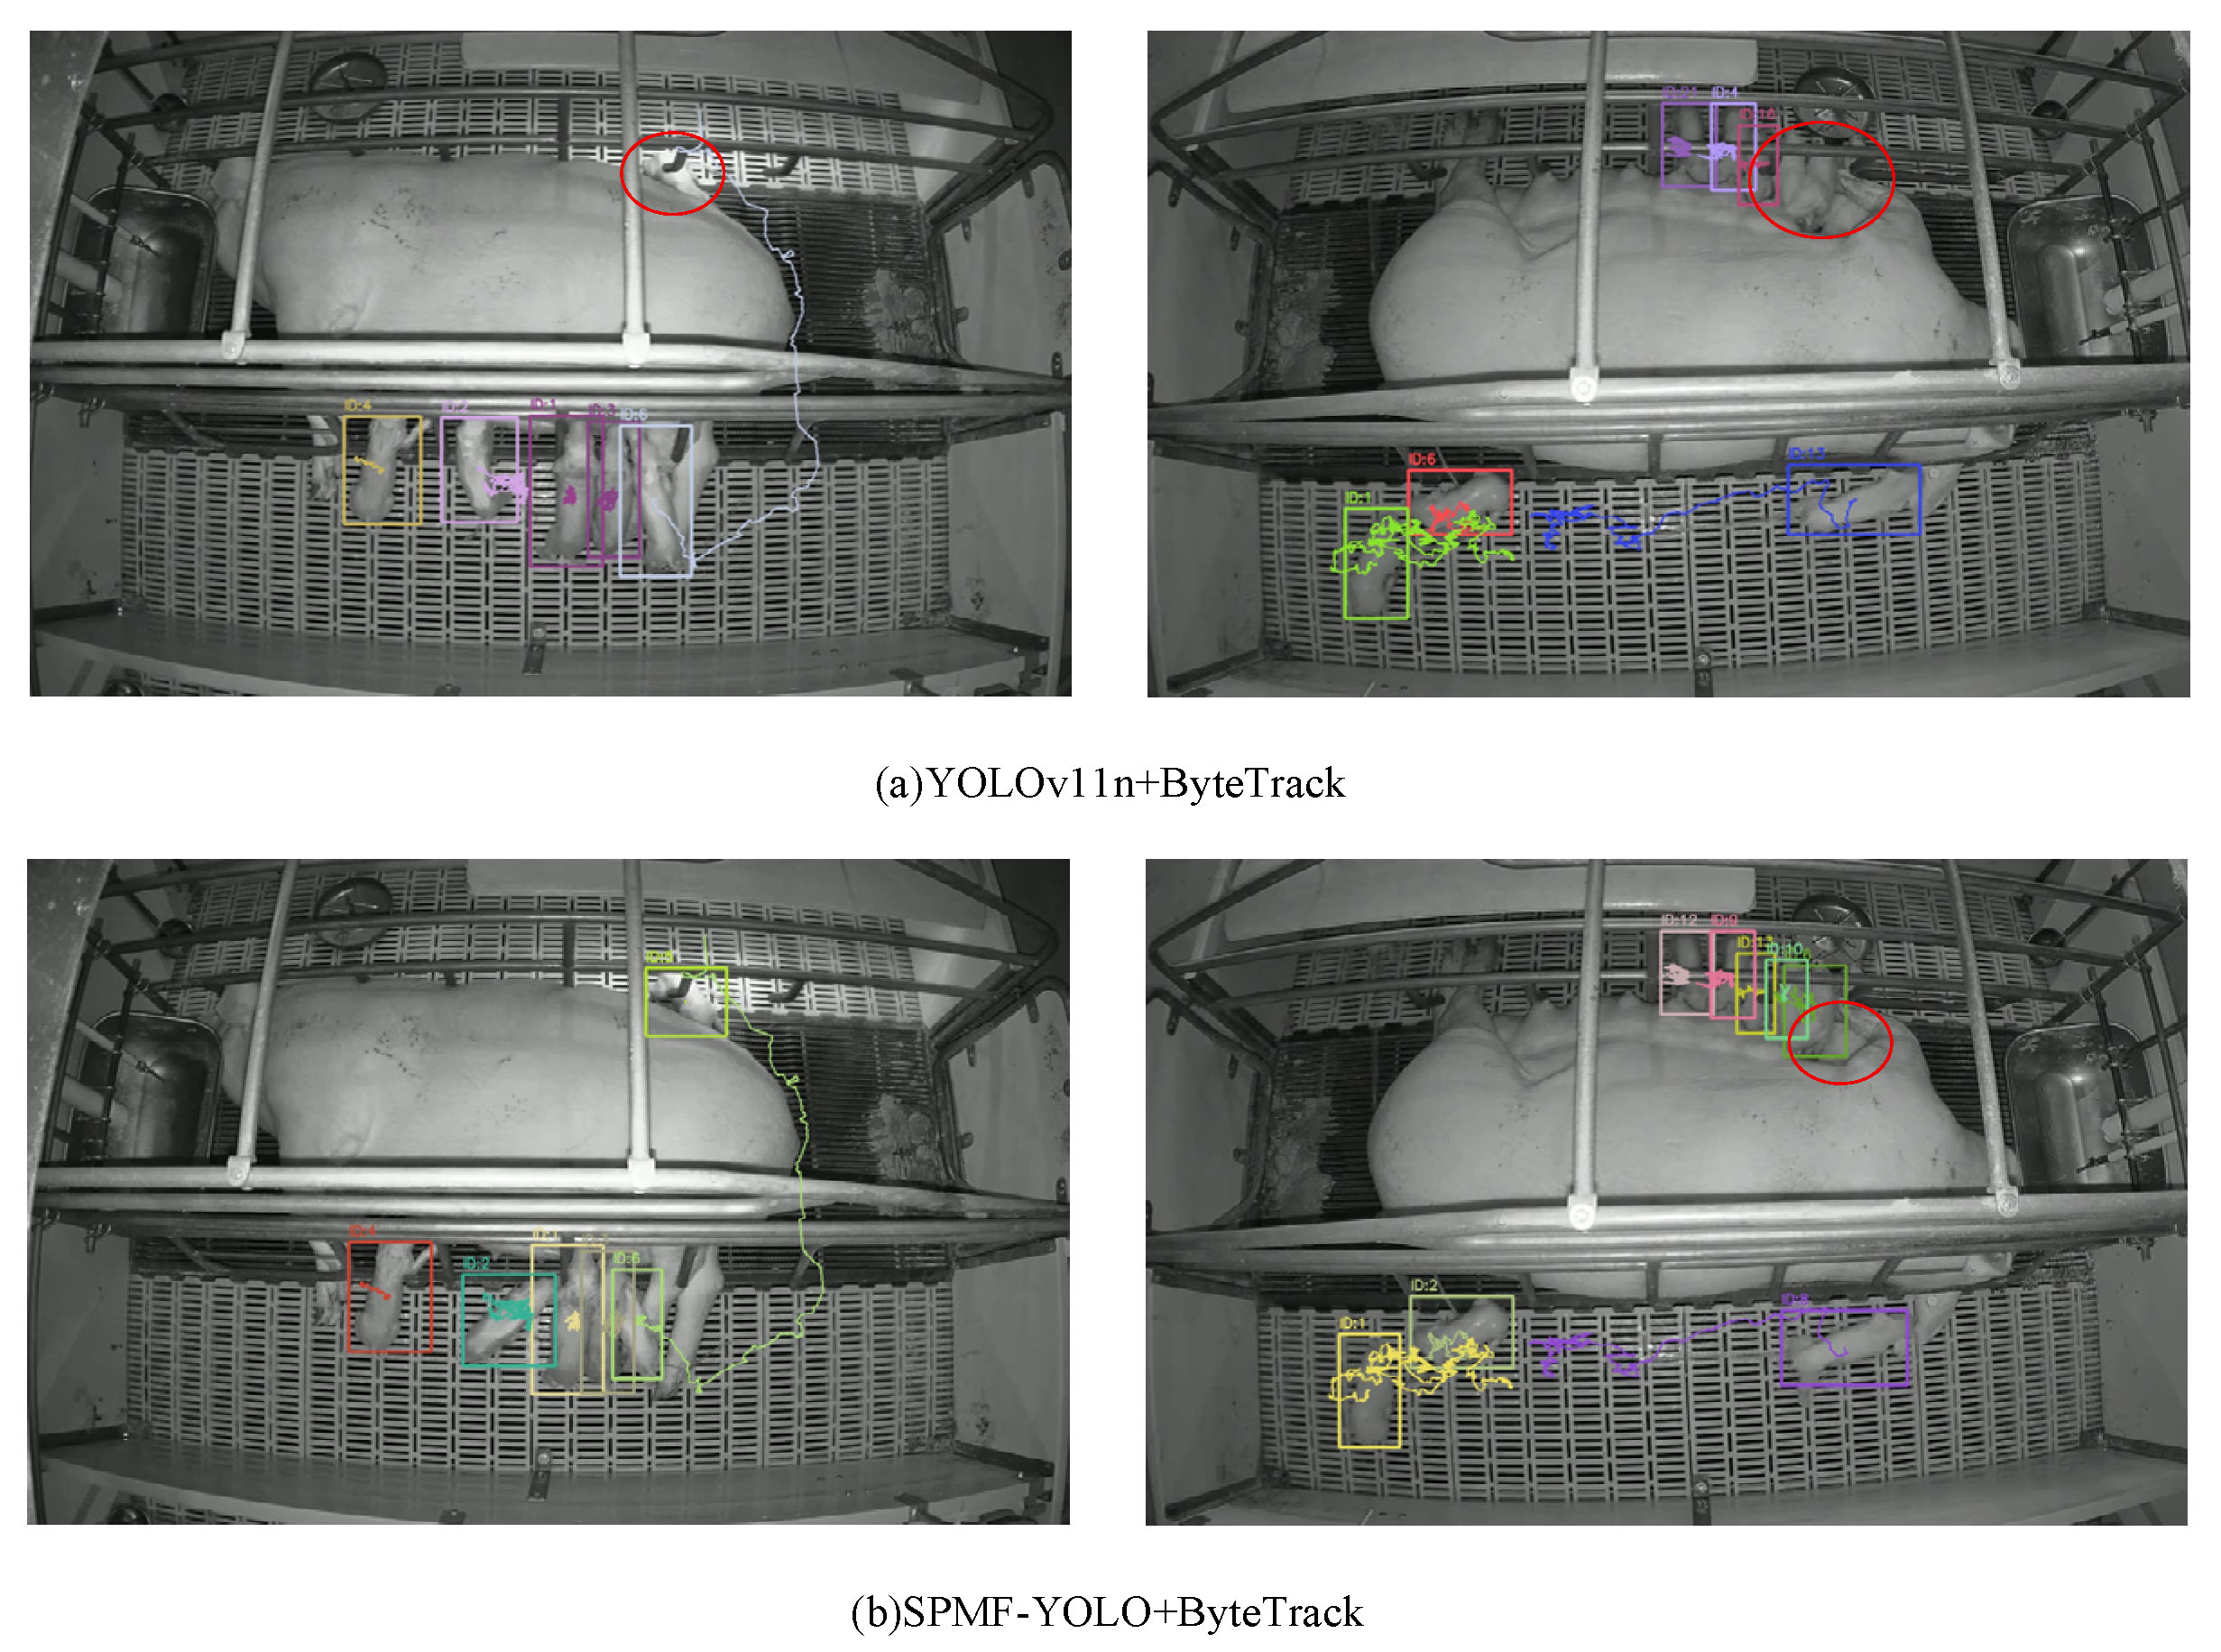
The results demonstrate that the SPMF-YOLO framework outperformed the original YOLOv11n across all metrics: HOTA improved by 13.8 percentage points, MOTA increased to 92.2%, IDF1 rose to 84.7%, and ID switching decreased from 26 to 15, indicating enhanced robustness in identity retention and occlusion scenarios. Although FPS decreased slightly, real-time processing capability was preserved. Additionally, to intuitively illustrate the effectiveness of the enhanced multi-object tracking approach under different lighting conditions, video sequences from diverse illumination environments were utilized in the evaluation. Figure 7 shows an example of the model’s tracking performance under daylight illumination.
Figure 7 illustrates the tracking performance of the two methods under daytime illumination. In Figure 7a, the baseline YOLOv11n + ByteTrack suffers from missed detections and identity switches when piglets overlap, as well as additional missed detections caused by pen-bar occlusions, with errors highlighted by red boxes. In contrast, the improved SPMF-YOLO + ByteTrack exhibited stable performance under the same challenging conditions, successfully maintaining identity consistency for all piglets. Figure 7b further confirms that, across the entire daytime sequence, the improved model achieved complete ID initialization in the first frame and avoided ID switches thereafter, indicating enhanced robustness to both piglet clustering and structural occlusions under adequate daylight conditions. This stability may be attributed to ample daylight exposure and a moderate number of piglets per pen, which reduced the likelihood of severe occlusion and crowding. To further examine the robustness of the improved model, we subsequently evaluated two low-light pens under different piglet densities and degrees of clustering, as presented in Figure 8.
Figure 8 compares the performance of the baseline model and the improved model under low-light conditions in a two-pen environment. As shown in Figure 8a, insufficient illumination causes occlusions between piglets and the sow, leading to detection and tracking difficulties. This results in missed detections and target loss, with these errors highlighted by red boxes. In scenarios where multiple piglets heavily overlap around the sow, both the baseline YOLOv11n + ByteTrack and the proposed SPMF-YOLO + ByteTrack exhibit identity switching and occasional missed detections. However, the baseline model also suffers from severe ID switching, while the improved model, despite some errors under challenging conditions, generally maintains better trajectory continuity. Overall, compared with the baseline, the proposed method still demonstrates superior tracking robustness under complex low-light and occlusion conditions.

3.3.2. Performance Evaluation Across Multiple Multi-Target Tracking Approaches

To gain deeper insight into the capability of the developed multi-object tracking framework, the SPMF-YOLO object detector was employed as the base model. Using a dataset of multi-object tracking with recordings from ten pens (each lasting 2.5 min), the approach was tested and compared with six alternative tracking methods [32,33,34,35,36,37]. Table 5 summarizes the average results over the full test set; in the notation, (↑) denotes metrics where higher values indicate superior performance, whereas (↓) highlights those where lower values are advantageous.
In terms of overall performance, SORT, which is based on a motion model, is prone to target drift and identity switching under occlusion and dense-target conditions, resulting in relatively low accuracy. DeepSORT and StrongSORT introduce Re-ID modules to improve identity consistency; however, the Re-ID model struggles to reliably distinguish newborn piglets with highly similar appearances from a top-down view. Additionally, they exhibit relatively slow processing speeds and high identity-switch (IDSW) counts. Although BoT-SORT achieves an MOTA of 84.6%, its performance in IDF1 and IDSW remains mediocre, indicating limited tracking consistency. By incorporating an IoU buffer and a cascaded matching strategy, C-BIoU Tracker effectively reduces IDSW to 24 and demonstrates balanced performance across most metrics. Hybrid-SORT improves tracking accuracy and achieves a maximum speed of 40.5 FPS, but its stability under occlusion remains slightly inferior.
In summary, the proposed method achieves more accurate detection and trajectory matching by combining SPMF-YOLO with the ByteTrack tracking model. By directly using the detection positions of newborn piglets as trajectory positions, the number of IDSW is reduced. Furthermore, across all baselines, it attains superior scores on HOTA, MOTA, and IDF1, thereby establishing a reliable basis for the later quantification of individual activity levels in neonatal piglets.

3.4. Performance Tracking of Newborn Piglets

To validate the adaptability and robustness of the proposed tracking framework in complex environments, 2.5-min video clips were selected from each of the first three pens for independent evaluation. These samples were not included in model training or testing and encompassed typical interference factors, including daytime and nighttime lighting, peer occlusions, and pen-barrier shadows. Representative examples are illustrated in Figure 9.
In the three sample segments, the target ID remains stable and trajectory integrity is good, indicating that the current target detection and tracking combination remains reusable under conditions of multi-target interference and occlusion. From the overall displacement distribution, most individuals remain within similar activity ranges, but the displacement of a few individuals is significantly lower, suggesting potential anomalies.

3.5. Quantification of Activity Levels and Health Assessment Analysis in Newborn Piglets

3.5.1. Quantification of Activity Levels in Newborn Piglets

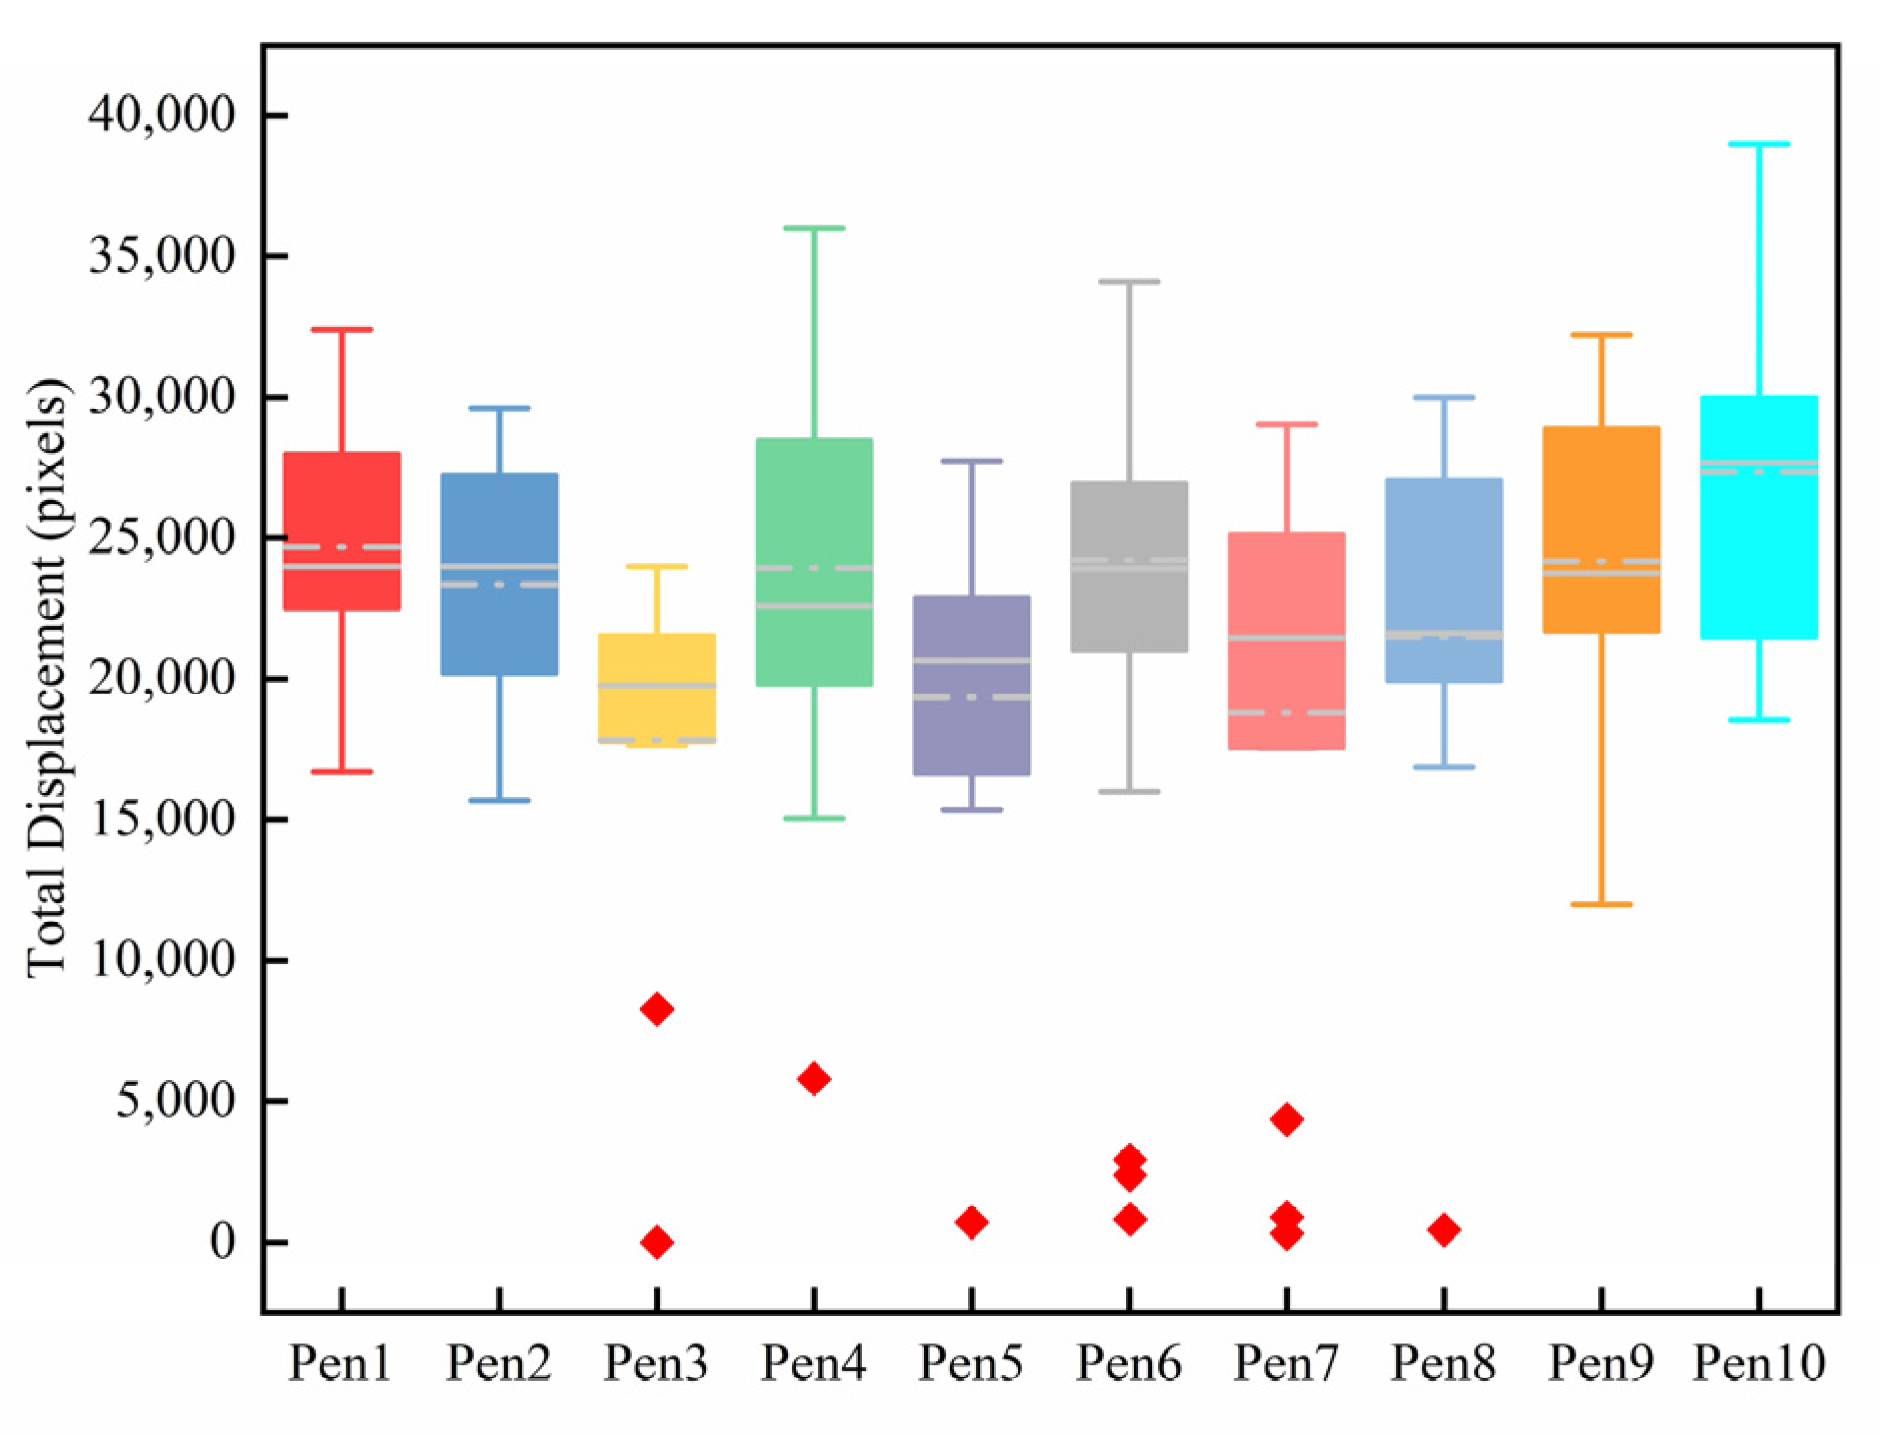
Building upon sample validation, this study further tracked and quantified the movement trajectories of newborn piglets across ten pens during the first 30 min after birth. Unlike previous methods that relied solely on group-level statistics, this study obtained cumulative displacement data at the individual level, ensuring that the movement activity of each piglet during the critical postnatal period was comprehensively captured and analyzed. This individualized tracking approach enables more sensitive detection of activity-distribution variations within pens, thereby supporting the early identification of abnormal individuals. It should be noted that outliers in the box plots indicate deviations from the statistical distribution but do not constitute definitive criteria for health-status classification.
As shown in Figure 10, statistical analysis of individual activity levels indicates that most piglets fall within a relatively stable activity range. However, in several pens, individual piglets exhibited significantly lower cumulative displacement than their counterparts in the same pen. These low-activity individuals appeared as outliers in the box plots, suggesting potential health risks. This finding further indicates that only individual-level tracking can reveal abnormal behaviors that may be obscured by group-level statistics. It should be noted that outliers in the box plots represent deviations in statistical distribution but do not constitute definitive criteria for health-status classification.

3.5.2. Experimental Results of Health Assessment

To robustly distinguish the health status of newborn piglets at the individual level, this study calculated the mean ( μ ) and standard deviation ( σ ) of cumulative displacement for newborn piglets within each pen. The statistical lower bound for the healthy range was defined as μ 2 σ . Individuals with cumulative displacement below this threshold were classified as abnormal. Considering that outliers could potentially influence the mean and standard deviation, we conducted sensitivity analyses using box plot thresholds and MAD estimation for robustness verification. The three methods yielded highly consistent sets of abnormalities, ensuring the scientific validity and stability of the threshold setting.
Furthermore, this study manually labeled the health status of newborn piglets in each pen. The labeling process was independently conducted by two experienced livestock technicians. When discrepancies arose between the technicians’ assessments, discussions were organized to reach a unified labeling decision. The labeling criteria are detailed in Table 6.
The labeling information for newborn piglets in the pens is summarized in Table 7. Overall, the model’s detection results exhibited high consistency with manual annotations, achieving complete agreement in 8 out of 10 pens. Minor discrepancies occurred only in Pen 4 and Pen 9: one healthy piglet in Pen 4 was misclassified as abnormal, while one abnormal piglet in Pen 9 was missed by the model. The overall agreement rate reached 98.2%, with an accuracy of 92.9% for identifying abnormal individuals. The findings confirm that the introduced detection and quantification framework offers high accuracy and robustness in distinguishing healthy from abnormal piglets.

3.5.3. Case Analysis of Misclassification

To further validate the model’s diagnostic accuracy, this study conducted video retrospectives on all piglets identified as abnormal and extracted individual images as visual examples (Figure 11). The retrospective analysis revealed that these low-activity individuals exhibited not only significantly lower cumulative displacement relative to the group average but also distinct differences in appearance and behavioral patterns compared with healthy piglets.
In Pen 2, one abnormal piglet exhibited markedly reduced activity frequency and prolonged immobility, requiring artificial feeding support to sustain development. This finding highlights that low activity does not imply a complete absence of movement but rather manifests as abnormal behavioral rhythms and impaired feeding performance. In Pen 3, abnormal piglets showed a rapid decline in vitality, characterized by restricted locomotion and a lack of exploratory behavior. In Pen 4, one piglet was misclassified as abnormal because its movement was constrained by a confinement bar; once released, it resumed normal locomotion and suckling, representing a typical case of environmentally induced misclassification. In Pen 9, a piglet’s movement trajectory was interrupted after being trampled by the sow. Because its cumulative displacement did not fall below the statistical threshold, it was not recognized as abnormal by the model, suggesting that external interference can mask genuine health risks.
Additionally, in several pens (e.g., Pens 5–8), abnormal piglets exhibited not only markedly lower activity levels but also distinct physical abnormalities such as limb weakness and rigid posture, in sharp contrast to healthy piglets, which displayed active crawling and effective suckling.
In summary, this study achieved health assessment of newborn piglets within 30 min after birth by combining individual activity quantification with statistical thresholds. The results demonstrated an overall consistency rate of 98.2% and an anomaly-detection accuracy of 92.9%. Video retrospective analysis further revealed typical behavioral and physical characteristics of abnormal individuals and clarified the special cases of Pens 3, 4, and 9. This method effectively identifies individuals at early health risk, providing a scientific basis and practical value for precision livestock farming and early intervention.

4. Discussion

This study focuses on quantifying the activity levels of individual newborn piglets, with its core challenges lying in the precision of object detection and the consistency of tracking techniques. Earlier studies (e.g., Cangar et al., Chen et al., Ho et al. [15,16,18]) have investigated automated approaches for piglet tracking, but most efforts have concentrated on group-level behavior detection and statistics, lacking in-depth investigation into individual activity quantification. Particularly during the critical early stages of newborns, group averages often obscure individual variations, hindering precise health assessments. The proposed behavioral evaluation system, based on an improved YOLOv11 and ByteTrack, enables continuous individual tracking in complex farrowing environments. By using cumulative movement distance as a core metric, it addresses the existing gap in individualized quantification.
The experimental results demonstrate the system’s strong versatility and robustness across different pens and under varying lighting and occlusion conditions. This observed robustness is not incidental but stems from complementary mechanisms deliberately engineered into the detection and tracking stages. At the detection stage, SPDConv preserved fine-grained piglet features that are easily lost during downsampling; MFM promoted consistent multi-scale feature integration under complex illumination and occlusion; and NWD stabilized regression through a distribution-aware loss, thereby improving localization accuracy at higher IoU thresholds. At the tracking stage, ByteTrack’s dual-threshold association strategy combined with Kalman motion modeling effectively bridged fragmented detections and reduced premature identity loss, maintaining trajectory continuity under partial occlusion. These improvements highlight how accurate detection directly supports reliable tracking in the TBD framework, and together they account for the superior robustness of the proposed system compared with YOLOv11n and other baseline methods.
Nevertheless, the approach retains certain limitations. A key factor affecting accuracy lies in environmental conditions and piglet stacking. As the degree of occlusion increases, detection performance declines accordingly. In the current dataset, only two pens were recorded under low-light conditions, which restricts the diversity of nighttime scenarios. In these pens, insufficient illumination and dense piglet clustering increased the likelihood of missed detections and identity switches, as illustrated in Figure 8. Such errors mainly involved false negatives at sow–piglet boundaries or in shadowed regions, and identity switches when multiple piglets underwent severe stacking in low-light environments. While the improved model alleviated these problems compared with the baseline, they were not completely eliminated in such challenging environments.
Future work will therefore focus on expanding the dataset with more recordings under diverse illumination and crowding conditions, so as to improve the robustness and generalizability of the model. Since only two low-light pens were available, adding further scenarios will be particularly important. In addition, incorporating auxiliary behavioral or physiological indicators such as static duration or body-surface temperature represents a promising direction to further strengthen early health assessment and reduce residual errors in complex environments.
In summary, the individualized activity-quantification system proposed in this study demonstrates both feasibility and application potential for early health assessment in newborn piglets. It not only provides reliable data support for precision livestock farming but also lays a crucial foundation for establishing early warning and intervention mechanisms.

5. Conclusions

In this work, we introduce an innovative contact-free behavioral evaluation approach designed for newborn piglets, constructed upon the SPMF-YOLO detector and the ByteTrack tracker, validating the system’s robustness and accuracy in complex environments. Key findings are summarized as follows:
(1)
Object Detection Performance: The enhanced SPMF-YOLO model significantly improves detection capabilities for small targets. It achieves 95.3% detection accuracy on the test dataset while maintaining stable performance under occlusion and overlapping scenarios, validating its applicability in complex farrowing environments.
(2)
Multi-Object Tracking Performance: Integrated with the ByteTrack tracking algorithm, the system reliably captures postnatal movement trajectories of newborn piglets, achieving HOTA, MOTA, and IDF1 values of 79.1%, 92.2%, and 84.7%, respectively. Compared to mainstream multi-object tracking methods, our approach demonstrates superior identity retention and trajectory continuity, significantly reducing ID switching in occlusion and dense interference scenarios.
(3)
Activity Quantification and Health Identification: Based on precise individual movement trajectories, the system quantifies the cumulative movement distance of newborn piglets within 30 min post-birth, using this as a core indicator of activity level. Comparison with manual labeling shows an overall consistency rate of 98.2%, with an accuracy rate of 92.9% in identifying abnormal individuals. Video retrospective analysis further confirmed behavioral and physical abnormalities in low-activity individuals, demonstrating the method’s capability to accurately identify potential health risks and provide data support for early intervention.

Author Contributions

Conceptualization, J.W., L.L. and M.S.; methodology, J.W., L.L. and M.S.; software, J.W.; validation, Y.T. and P.L.; formal analysis, J.W.; investigation, J.W., K.W. and J.C.; resources, M.S. and L.L.; data curation, J.C. and Y.T.; writing—original draft preparation, J.W.; writing—review and editing, J.W., L.L. and M.S.; visualization, J.W.; supervision, L.L. and M.S.; project administration, L.L.; funding acquisition, L.L. and M.S. All authors have read and agreed to the published version of the manuscript.

Funding

This research was funded by the National Natural Science Foundation of China (Grant No: 32272929).

Institutional Review Board Statement

The datasets supporting this study are not publicly accessible at present, but they can be obtained from the authors upon reasonable request.

Data Availability Statement

The data underlying the results presented in this paper are not publicly available at this time, but may be obtained from the authors upon reasonable request.

Acknowledgments

We acknowledge the Nanshang Nongke Pig Farm for the use of their animals and facilities.

Conflicts of Interest

The authors declare no conflicts of interest.

References

  1. Singh, A.; Jadoun, Y.S.; Brar, P.S.; Kour, G. Smart Technologies in Livestock Farming. In Smart and Sustainable Food Technologies; Sehgal, S., Singh, B., Sharma, V., Eds.; Springer Nature: Singapore, 2022; pp. 25–57. ISBN 978-981-19-1746-2. [Google Scholar]
  2. Quesnel, H.; Resmond, R.; Merlot, E.; Père, M.-C.; Gondret, F.; Louveau, I. Physiological Traits of Newborn Piglets Associated with Colostrum Intake, Neonatal Survival and Preweaning Growth. Animal 2023, 17, 100843. [Google Scholar] [CrossRef] [PubMed]
  3. Tullo, E.; Finzi, A.; Guarino, M. Review: Environmental Impact of Livestock Farming and Precision Livestock Farming as a Mitigation Strategy. Sci. Total Environ. 2019, 650, 2751–2760. [Google Scholar] [CrossRef]
  4. Lao, F.; Brown-Brandl, T.; Stinn, J.P.; Liu, K.; Teng, G.; Xin, H. Automatic Recognition of Lactating Sow Behaviors Through Depth Image Processing. Comput. Electron. Agric. 2016, 125, 56–62. [Google Scholar] [CrossRef]
  5. Nasirahmadi, A.; Edwards, S.A.; Matheson, S.M.; Sturm, B. Using Automated Image Analysis in Pig Behavioural Research: Assessment of the Influence of Enrichment Substrate Provision on Lying Behaviour. Appl. Anim. Behav. Sci. 2017, 196, 30–35. [Google Scholar] [CrossRef]
  6. Xu, J.; Zhou, S.; Xu, A.; Ye, J.; Zhao, A. Automatic Scoring of Postures in Grouped Pigs Using Depth Image and CNN-SVM. Comput. Electron. Agric. 2022, 194, 106746. [Google Scholar] [CrossRef]
  7. Gan, H.; Xu, C.; Hou, W.; Guo, J.; Liu, K.; Xue, Y. Spatiotemporal Graph Convolutional Network for Automated Detection and Analysis of Social Behaviours Among Pre-Weaning Piglets. Biosyst. Eng. 2022, 217, 102–114. [Google Scholar] [CrossRef]
  8. Ji, H.; Yu, J.; Lao, F.; Zhuang, Y.; Wen, Y.; Teng, G. Automatic Position Detection and Posture Recognition of Grouped Pigs Based on Deep Learning. Agriculture 2022, 12, 1314. [Google Scholar] [CrossRef]
  9. Chen, J.; Liu, L.; Li, P.; Yao, W.; Shen, M.; Liu, L. Resting Posture Recognition Method for Suckling Piglets Based on Piglet Posture Recognition (PPR)–You Only Look Once. Agriculture 2025, 15, 230. [Google Scholar] [CrossRef]
  10. Cowton, J.; Kyriazakis, I.; Bacardit, J. Automated Individual Pig Localisation, Tracking and Behaviour Metric Extraction Using Deep Learning. IEEE Access 2019, 7, 108049–108060. [Google Scholar] [CrossRef]
  11. Guo, Q.; Sun, Y.; Orsini, C.; Bolhuis, J.E.; de Vlieg, J.; Bijma, P.; With, P.H.N. de Enhanced Camera-Based Individual Pig Detection and Tracking for Smart Pig Farms. Comput. Electron. Agric. 2023, 211, 108009. [Google Scholar] [CrossRef]
  12. Tu, S.; Cai, Y.; Liang, Y.; Lei, H.; Huang, Y.; Liu, H.; Xiao, D. Tracking and Monitoring of Individual Pig Behavior Based on YOLOv5-Byte. Comput. Electron. Agric. 2024, 221, 108997. [Google Scholar] [CrossRef]
  13. Yang, Q.; Hui, X.; Huang, Y.; Chen, M.; Huang, S.; Xiao, D. A Long-Term Video Tracking Method for Group-Housed Pigs. Animals 2024, 14, 1505. [Google Scholar] [CrossRef] [PubMed]
  14. Yu, S.; Baek, H.; Son, S.; Seo, J.; Chung, Y. FTO-SORT: A Fast Track-Id Optimizer for Enhanced Multi-Object Tracking with SORT in Unseen Pig Farm Environments. Comput. Electron. Agric. 2025, 237, 110540. [Google Scholar] [CrossRef]
  15. Cangar, Ö.; Leroy, T.; Guarino, M.; Vranken, E.; Fallon, R.; Lenehan, J.; Mee, J.; Berckmans, D. Automatic Real-Time Monitoring of Locomotion and Posture Behaviour of Pregnant Cows Prior to Calving Using Online Image Analysis. Comput. Electron. Agric. 2008, 64, 53–60. [Google Scholar] [CrossRef]
  16. Chen, J.; Liu, L.; Li, P.; Yao, W.; Shen, M.; Ding, Q.; Liu, L. PKL-Track: A Keypoint-Optimized Approach for Piglet Tracking and Activity Measurement. Comput. Electron. Agric. 2025, 237, 110578. [Google Scholar] [CrossRef]
  17. Valle, J.E.D.; Pereira, D.F.; Neto, M.M.; Filho, L.R.A.G.; Salgado, D.D. Unrest Index for Estimating Thermal Comfort of Poultry Birds (Gallus Gallus Domesticus) Using Computer Vision Techniques. Biosyst. Eng. 2021, 206, 123–134. [Google Scholar] [CrossRef]
  18. Ho, K.-Y.; Tsai, Y.-J.; Kuo, Y.-F. Automatic Monitoring of Lactation Frequency of Sows and Movement Quantification of Newborn Piglets in Farrowing Houses Using Convolutional Neural Networks. Comput. Electron. Agric. 2021, 189, 106376. [Google Scholar] [CrossRef]
  19. Vanden Hole, C.; Ayuso, M.; Aerts, P.; Prims, S.; Van Cruchten, S.; Van Ginneken, C. Glucose and Glycogen Levels in Piglets That Differ in Birth Weight and Vitality. Heliyon 2019, 5, e02510. [Google Scholar] [CrossRef]
  20. Panzardi, A.; Bernardi, M.L.; Mellagi, A.P.; Bierhals, T.; Bortolozzo, F.P.; Wentz, I. Newborn Piglet Traits Associated with Survival and Growth Performance Until Weaning. Prev. Vet. Med. 2013, 110, 206–213. [Google Scholar] [CrossRef]
  21. Tucker, B.S.; Craig, J.R.; Morrison, R.S.; Smits, R.J.; Kirkwood, R.N. Piglet Viability: A Review of Identification and Pre-Weaning Management Strategies. Animals 2021, 11, 2902. [Google Scholar] [CrossRef]
  22. Khanam, R.; Hussain, M. Yolov11: An Overview of the Key Architectural Enhancements. arXiv 2024, arXiv:2410.17725. [Google Scholar] [CrossRef]
  23. Sunkara, R.; Luo, T. No More Strided Convolutions or Pooling: A New CNN Building Block for Low-Resolution Images and Small Objects 2022. arXiv 2022. [Google Scholar] [CrossRef]
  24. Zhang, Y.; Zhou, S.; Li, H. Depth Information Assisted Collaborative Mutual Promotion Network for Single Image Dehazing. In Proceedings of the 2024 IEEE/CVF Conference on Computer Vision and Pattern Recognition (CVPR), Seattle, WA, USA, 17–21 June 2024; pp. 2846–2855. [Google Scholar]
  25. Wang, J.; Xu, C.; Yang, W.; Yu, L. A Normalized Gaussian Wasserstein Distance for Tiny Object Detection 2022. arXiv 2022. [Google Scholar] [CrossRef]
  26. Zhang, Y.; Sun, P.; Jiang, Y.; Yu, D.; Weng, F.; Yuan, Z.; Luo, P.; Liu, W.; Wang, X. ByteTrack: Multi-Object Tracking by Associating Every Detection Box 2022. arXiv 2022. [Google Scholar] [CrossRef]
  27. Girshick, R. Fast R-CNN 2015. arXiv 2015. [Google Scholar] [CrossRef]
  28. Liu, W.; Anguelov, D.; Erhan, D.; Szegedy, C.; Reed, S.; Fu, C.-Y.; Berg, A.C. SSD: Single Shot MultiBox Detector. In Proceedings of the ECCV, Amsterdam, The Netherlands, 11–14 October 2016. [Google Scholar]
  29. Varghese, R.; Sambath, M. YOLOv8: A Novel Object Detection Algorithm with Enhanced Performance and Robustness. In Proceedings of the 2024 International Conference on Advances in Data Engineering and Intelligent Computing Systems (ADICS), Chennai, India, 18–19 April 2024; pp. 1–6. [Google Scholar]
  30. Alif, M.A.R.; Hussain, M. YOLOv12: A Breakdown of the Key Architectural Features 2025. arXiv 2025. [Google Scholar] [CrossRef]
  31. Zhao, Y.; Lv, W.; Xu, S.; Wei, J.; Wang, G.; Dang, Q.; Liu, Y.; Chen, J. DETRs Beat YOLOs on Real-Time Object Detection 2024. arXiv 2024, arXiv:2304.08069v3. [Google Scholar]
  32. Bewley, A.; Ge, Z.; Ott, L.; Ramos, F.; Upcroft, B. Simple Online and Realtime Tracking. In Proceedings of the 2016 IEEE International Conference on Image Processing (ICIP), Phoenix, AZ, USA, 25–28 September 2016; IEEE: Piscataway, NJ, USA. [Google Scholar]
  33. Pujara, A.; Bhamare, M. DeepSORT: Real Time & Multi-Object Detection and Tracking with YOLO and TensorFlow. In Proceedings of the 2022 International Conference on Augmented Intelligence and Sustainable Systems (ICAISS), Trichy, India, 24–26 November 2022; pp. 456–460. [Google Scholar]
  34. Yang, F.; Odashima, S.; Masui, S.; Jiang, S. Hard to Track Objects with Irregular Motions and Similar Appearances? Make It Easier by Buffering the Matching Space 2023. arXiv 2023. [Google Scholar] [CrossRef]
  35. Yang, M.; Han, G.; Yan, B.; Zhang, W.; Qi, J.; Lu, H.; Wang, D. Hybrid-SORT: Weak Cues Matter for Online Multi-Object Tracking. AAAI 2024, 38, 6504–6512. [Google Scholar] [CrossRef]
  36. Du, Y.; Zhao, Z.; Song, Y.; Zhao, Y.; Su, F.; Gong, T.; Meng, H. StrongSORT: Make DeepSORT Great Again 2023. arXiv 2023. [Google Scholar] [CrossRef]
  37. Aharon, N.; Orfaig, R.; Bobrovsky, B.-Z. BoT-SORT: Robust Associations Multi-Pedestrian Tracking 2022. arXiv 2022. [Google Scholar] [CrossRef]
Figure 1. Schematic Diagram of Experimental Data Collection for Newborn Piglets.
Agriculture 15 02087 g001
Figure 2. SPMF-YOLO Model Architecture Diagram.
Agriculture 15 02087 g002
Figure 3. Architecture of the SPDConv module. (a) Original feature map of size M × M × P ; (b) Sampling along the row and column directions according to the step size to generate multiple subfeature maps; (c) After two-fold downsampling, the feature map was divided into four subfeature maps, each of size M 2 × M 2 × P ; (d) When the four subfeature maps are stacked along the channel dimension, the output becomes a feature map with dimensions M 2 × M 2 × 4 P ; (e) Through convolution with a unit stride, a feature map sized M 2 × M 2 × P is produced.
Agriculture 15 02087 g003
Figure 4. Schematic Diagram of MFM Structure.
Agriculture 15 02087 g004
Figure 5. ByteTrack Working Principle Diagram.
Agriculture 15 02087 g005
Figure 6. SPMF-YOLO Training Metrics Over Epochs.
Agriculture 15 02087 g006
Figure 7. Example of model tracking before and after improvement under daytime illumination.
Agriculture 15 02087 g007
Figure 8. Example of model tracking before and after improvement under weak lighting.
Agriculture 15 02087 g008
Figure 9. Schematic Diagram Quantifying the Movement Trajectories and Activity Levels of Newborn Piglets. (a) Position representing newborn piglets; (b) Trajectory representing newborn piglets; (c) Total displacement representing newborn piglets.
Agriculture 15 02087 g009
Figure 10. Quantification of Activity Levels in Newborn Piglets Across Ten Pens.
Agriculture 15 02087 g010
Figure 11. Illustration of Abnormal Piglets. (a) Pen 2: A piglet requiring manual assistance for suckling.; (b) Pen 3: An individual with rapid decline in vitality and lack of normal locomotor behavior; (c) Pen 4: A piglet misclassified as abnormal due to temporary restriction by the confinement pen; (dg) Pens 5, 6, 7, and 8: Multiple abnormal piglets showing marked lethargy after birth, progressively losing effective locomotion and suckling behavior, with typical signs of limb weakness or rigid posture; (h) Pen 9: A piglet with interrupted movement trajectory caused by trampling by the sow.
Agriculture 15 02087 g011
Table 1. Dataset Division Information.
Dataset TypeNumber of ImagesDataset Purpose
Object Detection Dataset1780Training, testing, and validating object detection models
Multi-Object Tracking Model Dataset4950Testing multi-object tracking algorithms
Table 2. Results of the Ablation Study for the Improved YOLOv11n Model.
SPDConvMFMNWDP (%)R (%)mAP@0.5 (%)mAP@0.5–0.95 (%)Params (M)FLOPs (G)Inference Time
(ms)
×××93.091.596.370.12.66.36.3
××93.391.996.974.05.69.07.4
×94.292.997.174.36.212.310.1
95.393.897.374.76.212.310.1
Note: In the table, “√” indicates that the corresponding module has been incorporated into the model, while “×” indicates that the module has not been incorporated.
Table 3. Comparative Analysis of Our Approach and Existing Detection Techniques.
ModelP (%)R (%)mAP@0.5 (%)mAP@0.5–0.95 (%)Params (M)FLOPs (G)Inference Time
(ms)
Fast R-CNN73.579.280.540.645.31117.496.4
RT-DETR-L91.389.394.359.632131.368.4
SSD80.586.687.857.236.28139.7114.7
YOLOv8n92.790.995.462.33.27.56.7
YOLOv11n93.091.596.370.12.66.36.2
YOLOv12n93.090.596.168.86.26.77.1
SPMF-YOLO95.393.897.374.76.212.310.1
Table 4. Comparative Evaluation of Mean Multi-Object Tracking Results in Newborn Piglets.
ModelHOTA (%) ↑MOTA (%) ↑IDF1 (%) ↑IDSW ↓FPS ↑
YOLOv11n + ByteTrack65.387.571.12638.9
SPMF-YOLO + ByteTrack79.192.284.71535.9
Table 5. Assessment of Overall Multi-Target Tracking Accuracy for Newborn Piglets.
ModelHOTA (%) ↑MOTA (%) ↑IDF1 (%) ↑IDSW ↓FPS ↑
SORT56.570.252.21516.1
DeepSORT58.872.153.414028.3
C-BIoU Tracker69.381.566.12438.9
Hybrid-SORT64.280.267.78440.5
StrongSORT59.477.651.71517.3
BoT-SORT70.284.663.96338.2
Our79.192.284.71535.9
Table 6. Classification Basis for Piglet Labels.
LabelCriteria for Label Classification
Healthy pigletsAble to crawl independently and is relatively active; frequently explores and suckles, moves naturally, and is in good spirits.
Abnormal pigletsSluggish movement, prolonged inactivity in corners, lack of exploration; activity levels below group norms; abnormal posture, low energy levels, and even risk of death.
Table 7. Label Information for Newborn Piglets in Ten Pens.
PenActual Value/Predicted Value
Piglet CountHealthy PigletsAbnormal PigletsPen Consistency Rate
Pen177/70/0100%
Pen21110/101/1100%
Pen31210/102/2100%
Pen41111/100/190.9%
Pen5109/91/1100%
Pen6118/83/3100%
Pen71411/113/3100%
Pen81311/112/2100%
Pen91413/141/092.9%
Pen101010/100/0100%
Total113100/10011/1198.2%
Disclaimer/Publisher’s Note: The statements, opinions and data contained in all publications are solely those of the individual author(s) and contributor(s) and not of MDPI and/or the editor(s). MDPI and/or the editor(s) disclaim responsibility for any injury to people or property resulting from any ideas, methods, instructions or products referred to in the content.