Article

Global Potential Distribution of Carpomya vesuviana Costa Under Climate Change and Potential Economic Impacts on Chinese Jujube Industries

1
Shandong Engineering Research Center for Environment-Friendly Agricultural Pest Management, Shandong Province Laboratory for Biological Invasions and Ecological Security, China-Australia Cooperative Research Center for Crop Health and Biological Invasions, College of Plant Health & Medicine, Qingdao Agricultural University, Qingdao 266109, China
2
State Key Laboratory for Biology of Plant Diseases and Insect Pests, Key Laboratory for Prevention and Control of Invasive Alien Species of Ministry of Agriculture and Rural Affairs, Institute of Plant Protection, Chinese Academy of Agricultural Science, Beijing 100193, China
3
Western Agricultural Research Center, Chinese Academy of Agricultural Sciences, Changji 831100, China
*
Authors to whom correspondence should be addressed.
Agriculture 2025, 15(19), 2081; https://doi.org/10.3390/agriculture15192081
Submission received: 25 August 2025 / Revised: 27 September 2025 / Accepted: 30 September 2025 / Published: 6 October 2025
(This article belongs to the Section Crop Protection, Diseases, Pests and Weeds)

Abstract

Carpomya vesuviana (Diptera: Tephritidae), a significant invasive forestry pest of Zizyphus crops worldwide, has spread globally across jujube-growing regions, causing substantial yield losses and economic damage. In China, it is classified as both an imported and forestry quarantine pest. Existing risk assessments have primarily focused on the potential geographical distributions (PGDs) of C. vesuviana, but its economic impact on host plants is unknown. Therefore, we used an optimised MaxEnt model based on species distribution records and relevant environmental variables to predict the PGDs of C. vesuviana under current and future climate scenarios. Meanwhile, we used the @RISK stochastic model to assess the economic impact of this pest on the Chinese jujube industry under various scenarios. The results showed that the human influence index (HII), mean temperature of the wettest quarter (Bio8), temperature seasonality (Bio4), and precipitation during the driest month (Bio14) were the significant environmental variables affecting species distribution. Under the current climatic scenario, the total suitable area of C. vesuviana reached 2171.39 × 104 km2, which is mainly distributed in southern and western Asia, southern Europe, central North America, western Africa, and eastern South America. Potentially suitable habitats will increase and shift to the middle and high latitudes of the Northern Hemisphere under future climatic scenarios. Under the no-control scenario, C. vesuviana could cause losses of 15,687 million CNY to the jujube industry in China. However, control measures could have saved losses of 5047 million CNY. This study provides a theoretical basis for preventive monitoring and integrated management of C. vesuviana globally and helps reduce its economic impact on the jujube industry in China.

1. Introduction

Driven by accelerating global trade and economic integration, biological invasions have emerged as one of the most pressing ecological threats worldwide [1,2,3]. Invasive alien species (IAS) spread globally through the trade of fruits, vegetables, horticultural products, and timber, inflicting substantial damage to crop production, ecosystems, and biodiversity [4,5]. Countries worldwide are confronted with severe threats from invasive insects [6], with annual economic costs estimated to exceed 70 billion US dollars [7]. More than 660 IAS have been documented in China (https://www.mee.gov.cn (accessed on 6 January 2025)), distributed across all 34 provincial-level administrative regions and causing annual direct economic losses exceeding 200 billion CNY [8]. For instance, the invasion of Bursaphelenchus xylophilus in mainland China led to the extensive mortality of pine forests, incurring economic losses of approximately 19.5 billion CNY [9]. Additionally, global climate change has accelerated the growth and reproduction of IAS, thereby altering their potential geographical distributions (PGDs) and exacerbating the risk of new invasions [10,11]. Thus, predicting the PGDs of the IAS and assessing their economic impacts on regional crops are essential for early warning and control strategies to mitigate adverse effects on agriculture and economic development.
Carpomya vesuviana Costa. (Diptera: Tephritidae) is native to India [12]. Primarily dispersed through host plant translocation [13], this species has spread over long distances and gradually established populations across Asia, Europe, and Africa. It reached Pakistan in 1999 [14], was introduced to Iran and Oman in 2004 [15,16], and was reported in Mauritius in 2006 [17]. It was first detected in Xinjiang, China, in 2007 [18]. Currently, C. vesuviana is cultivated in 15 countries and territories [19]. According to the General Administration of Customs People’s Republic of China (accessed on 9 January 2025), C. vesuviana is designated as a quarantine-invasive pest, and entry into China is strictly prohibited (http://dzs.customs.gov.cn (accessed on 9 January 2025)). It predominantly targets jujube palm species, including Ziziphus spina-christi, Z. mauritiana, Z. nummularia and Z. lotus [20]. Female C. vesuviana typically oviposit beneath the skin of jujube fruits, primarily targeting the middle, lower, and basal regions. Upon hatching, the larvae consume the flesh internally, causing depressions or tubercle-like symptoms on the fruit surface. In severe cases, this leads to wilting, rot, and premature fruit drop [21]. Statistics have shown that C. vesuviana typically reduces jujube yields by more than 20% in China. In serious cases, it can cause 70–90% of fruits to drop, resulting in significantly compromising both fruit quality and overall yield [22]. As the world’s largest jujube cultivator and producer, China has the highest global production volume [23,24]. The CLIMEX model has been used to investigate suitable areas and the extent of C. vesuviana in China [25], focusing on regional distribution and local damage. Current research lacks a systematic assessment of potential globally suitable areas for C. vesuviana under climate change and a quantitative analysis of regional economic losses. Clarifying the global distribution and habitat suitability of C. vesuviana, coupled with a scientific assessment of its associated economic losses, has critical theoretical and practical implications.
Species distribution models (SDMs) integrate environmental variables such as climate and topography with the study of the natural distribution of a species, thereby becoming a pivotal tool for predicting or explaining the PGDs of species [26,27]. The CLIMEX model is constrained by its dependence on species-specific physiological parameters, which are often poorly documented, leading to significant uncertainty. Optimised MaxEnt models offer advantages including minimal sample size requirements, short computation times, high accuracy, stable results, and avoidance of model overfitting [28,29]. Combined with ArcGIS spatial analysis techniques, they have been extensively applied to predict the PGD of IAS [30,31]. For instance, the MaxEnt model was used to predict the distribution and invasion risk of Solenopsis invicta, Cydia pomonella, and Bactrocera dorsalis under climate change in China and globally [32,33,34]. Integrating species distribution modelling and quantitative pest risk assessment provides a technical framework for the quantitative analysis of biological invasion risk. Quantifying potential economic losses is an important element in quantitative pest risk assessments [35]. Unlike traditional econometric methods that use fixed values for inherently uncertain parameters, the @RISK 7.5 software employs Monte Carlo simulation to quantify this uncertainty, enabling the calculation of outcomes and probabilities across various scenarios [36]. It enables the quantitative prediction of risks and the identification of important drivers (http://www.Palisade.com/risk/ (accessed on 20 January 2025)). In recent years, @RISK software has been used extensively, both nationally and internationally, to assess economic losses caused by pests. Examples include the potential economic impact of Bactrocera zonata on the peach industry under different scenarios [37] and the economic impact of Plasmopara viticola on the Western Australian grape industry [38].
This study integrated an optimized MaxEnt model with @RISK software to assess the global PGDs of C. vesuviana and its economic threat to China’s jujube industry. The primary aims of this study include: (1) identifying key environmental variables affecting its distribution, (2) modelling the potential global distribution of C. vesuviana under current and future climate scenarios, (3) analyzing changes trends of potential suitable areas under future climate scenarios and (4) quantifying potential economic losses to the Chinese jujube industry. These results are crucial for informing early warning, monitoring, and optimized quarantine strategies against C. vesuviana.

2. Materials and Methods

2.1. Occurrence Records

Global occurrence records of C. vesuviana were collected from the Global Biodiversity Information Facility (GBIF Occurrence Download. Available online: https://doi.org/10.15468/dl.ywze8k (accessed on 15 June 2024)) [39], the Invasive Species Compendium of the Centre Agriculture Bioscience International [12], published literature, and field survey data from our team. These records were saved in the order of species name, longitude, and latitude. First, distribution records with incomplete information, nonspecific descriptions, and sea areas were removed, and 157 global occurrence records were obtained. Second, the data were cleaned using the ENMTools software 1.0 (https://github.com/danlwarren/ENMTools (accessed on 13 July 2024)) so that only one datum point was retained for each 5 km × 5 km raster to avoid the occurrence of point clustering effects that can lead to model instability [40]. Finally, 124 occurrence records were used to construct the MaxEnt model (Figure 1).

2.2. Selection of Environment Variables

Considering the effects of three main categories of influences (bioclimatic variables, altitude, and human variables) on the PGDs of C. vesuviana under the current (1970–2000) and future (2040–2060 and 2060–2080) climatic scenarios, data for 19 bioclimatic variables and 1 elevation variable were obtained from the World Climate Database (http://www.worldclim.org (accessed on 1 November 2024)) with a resolution of 2.5′ (Table S1). Three shared socioeconomic paths, SSP1–2.6, SSP2–4.5, and SSP5–8.5, were used for the 2050s and the 2070s. Human variables were downloaded from the Global Human Influence Index (HII) (Geographic) dataset (SEDAC, https://www.earthdata.nasa.gov/centers/sedac-daac (accessed on 2 November 2024)). The HII was resampled to 5 km × 5 km using ArcGIS 10.8 software to ensure a consistent resolution of all environmental variables. Owing to the presence of multicollinearity in the environmental variables which can easily lead to the model being overfitted, we screened the environmental variables. First, the ENMTools was used to analyse the correlations between the 21 environmental variables (Figure S1). We then eliminated environmental variables with zero contribution using the MaxEnt model with 10 replicate runs based on C. vesuviana global occurrence records and 21 environmental variables. If the absolute value of the correlation coefficient of two environmental variables is greater than 0.8 (|r| > 0.8), higher contributing environmental variables are retained [41]. Finally, ten environmental variables were used to construct the MaxEnt model. It was assumed that the Altitude and HII remained unchanged in the next two periods (the 2050s and the 2070s) to ensure comparability of the model.

2.3. Model Optimisation, Assessment and Classification of PGDs

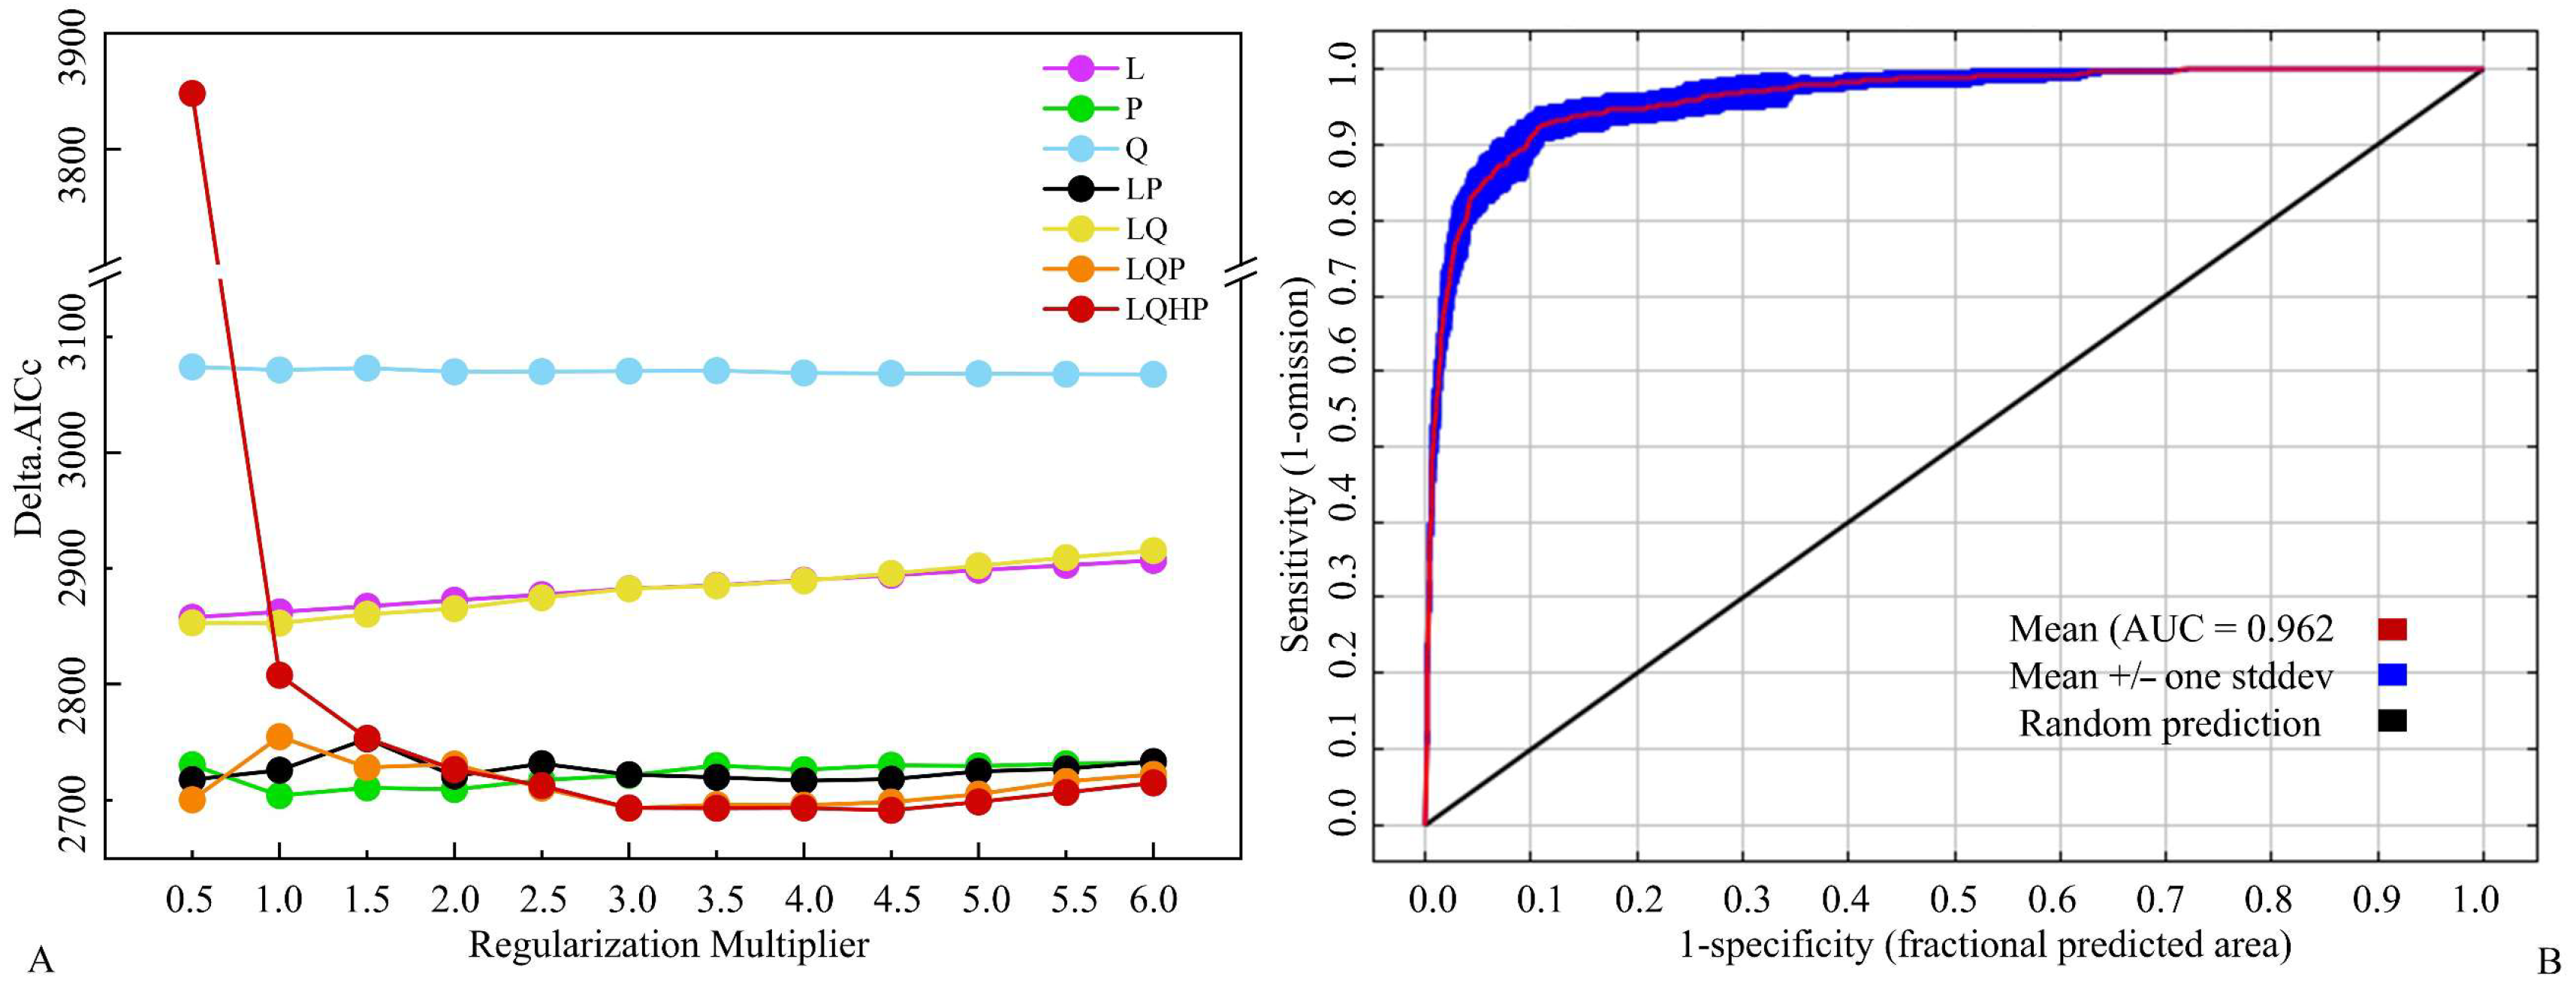
Optimising the regularisation multiplier (RM) and feature combination (FCs) parameters significantly improves the prediction accuracy of the MaxEnt model [42]. The ENMeval package was used to adjust the RM and FC parameters. The RM was set from 0.5 to 6 at intervals of 0.5, and seven feature combinations (L, P, Q, LP, LQ, LQP, and LQHP) were set to model the 84 different combinations of RM and FCs. Finally, a feature combination parameter corresponding to the minimum value of the AICc (delta AICc = 0) was selected to set up the MaxEnt model. In this study, 25% of the occurrence records were randomly selected as the testing set, and the remaining 75% were used for model training. The maximum number of iterations was set to 500, with 10,000 background points and the output format specified as Cloglog. Model robustness was assessed using 10 bootstrap replicates [43,44], and the standard deviation map was generated [45]. The area under the receiver operating characteristic (ROC) curve (AUC) is used to evaluate the accuracy of model prediction results. The AUC values are classified into three grades of assessment criteria for model accuracy: poor (AUC ≤ 0.50), moderate (0.5 < AUC ≤ 0.90), and excellent (0.90 < AUC ≤ 1.00) [46]. A combination of the contribution rate and jackknife method was used to determine the degree of influence of the environmental variables on the distribution of C. vesuviana.
The model predictions were converted to a raster format using ArcGIS software to process, classify, and visualise suitable areas of C. vesuviana. We used the maximum training sensitivity plus specificity Cloglog threshold as the threshold for species presence and categorised the potential suitability zones of C. vesuviana into four types: unsuitable area (0–0.1543), poorly suitable area (0.1543–0.4), moderately suitable area (0.4–0.6), and highly suitable area (0.6–1) four classes.

2.4. Economic Loss Assessment Model

In this study, @RISK was used to model the potential economic losses of C. vesuviana to the Chinese jujube industry under no-control and control scenarios. Under the no-control scenario, the potential economic loss (F3) comprises production losses (F1) and quality losses (F2) caused by C. vesuviana in China, which were calculated as F3 = F1 + F2. In the control scenario, economic loss (F6) refers to the economic loss that C. vesuviana can cause to the jujube industry after certain artificial control measures are taken to bring the loss of jujube production to an economic injury level (EIL). This involves control costs (F4) and potential economic losses after input control (F5), with F6 = F4 + F5. The loss saved after control (F7) is the difference between the economic losses under the no-control and control scenarios, calculated using the formula F7 = F3 − F6. The model was set to 100,000 iterations and one simulation.

2.5. Sources of Economic Loss Parameters

The potential economic losses caused by the production decline (F1) and quality decline (F2) of jujubes under the no-control scenario are given by the following formulas:
F1 = Q1 × I × R × Pa/(1 − IR)
F2 = Q1 × I × (1 − R) × (Pa − Pb)/(1 − IR)
where Q1 is the annual production of Chinese jujubes in suitable areas for C. vesuviana, derived from the data of the National Bureau of Statistics (http://data.stats.gov.cn (accessed on 18 February 2025)), calculated based on the proportion of the suitable area for C. vesuviana in the national territory, and then multiplied by the annual production of jujubes, which was fitted to the data using Pert (23.71, 24.31, 24.91) × 108 kg. I represents the damage rate of C. vesuviana. Data were obtained from actual surveys and fitted using Pert (36.67%, 46.67%, 60%). R is the yield loss rate of jujubes damaged by C. vesuviana, obtained from published literature [47,48] and fitted with Pert (20%, 30%, 40%). Pa and Pb are the normal market price of jujubes and the price of jujubes after a quality decline, respectively. Based on the data of the National Key Agricultural Products Market Information Platform (https://ncpscxx.moa.gov.cn/ (accessed on 15 March 2025)), the price of jujubes was evenly divided into two parts, from largest to smallest, with the higher half the price taken as the normal market price of jujubes and the lower half as the price of jujubes with declining quality. The Pert distribution was used to fit the two sets of data separately; that is, Pa was Pert (11.5, 18, 24.5) CNY/kg, and Pb was Pert (5.95, 8.73, 11.5) CNY/kg.
Under the control scenario, the potential economic loss includes the control costs (F4) and the economic loss after control (F5), using the following formulas:
F4 = S × I × C
F5 = Q1 × I × E × Pa/(1 − IE) + Q1 × I×(1 − E) × (Pa − Pb)/(1 − IE)
where S is the planting area of jujubes in the C. vesuviana suitable area, referring to the relevant literature [49,50]. Using the same calculation as Q1, the maximum value of the planted area of jujubes in the C. vesuviana suitable area is 60.15 × 10⁴ hm2, the minimum value is 48.33 × 10⁴ hm2, and the mean value is 54.24 × 10⁴ hm2. Pert 48.33, 54.24, and 60.15 × 10⁴ hm2 was used for fitting. C represents the unit cost of control, and data were obtained from the literature [51,52], converted using the China Pesticide Network (http://www.agrichem.cn/ (accessed on 21 March 2025)), and fitted using Pert (175.21, 182.66, 190.10) CNY/hm2.
E represents the economic injury level (EIL) of C. vesuviana damage to jujube, and the formula is as follows:
E = C/(A × Pa × M) × D × 100%
where A represents the unit yield of jujubes in suitable areas, using the formula A = Q1/S. M denotes the control effects, with data sourced from the literature [51,53] and fitted using Pert (92.37%, 93.69%, and 95%). D represents the efficiency correction coefficient, which is valued at 2 [54]. All input variables and model parameters are summarised in Table 1.

3. Results

3.1. Model Optimisation and Accuracy Evaluation

Based on 124 global occurrence records and 10 environmental variables of C. vesuviana, we used the “ENMeval” package in R software to adjust the parameters and obtained 84 combinations of MaxEnt model parameters for predicting the PGDs of C. vesuviana. Based on the optimization results, a feature parameter combination with a delta AICc value of 0 was selected for model optimization (RM = 4.5, FCs = LQHP; Figure 2A). Under optimal parameter settings, the mean AUC value was 0.962 (Figure 2B), indicating that the optimized MaxEnt results were reliable. Moreover, the low standard deviation across ten replicate runs suggests that the model exhibits high stability and consistency (Figure S2).

3.2. Significant Environmental Variables

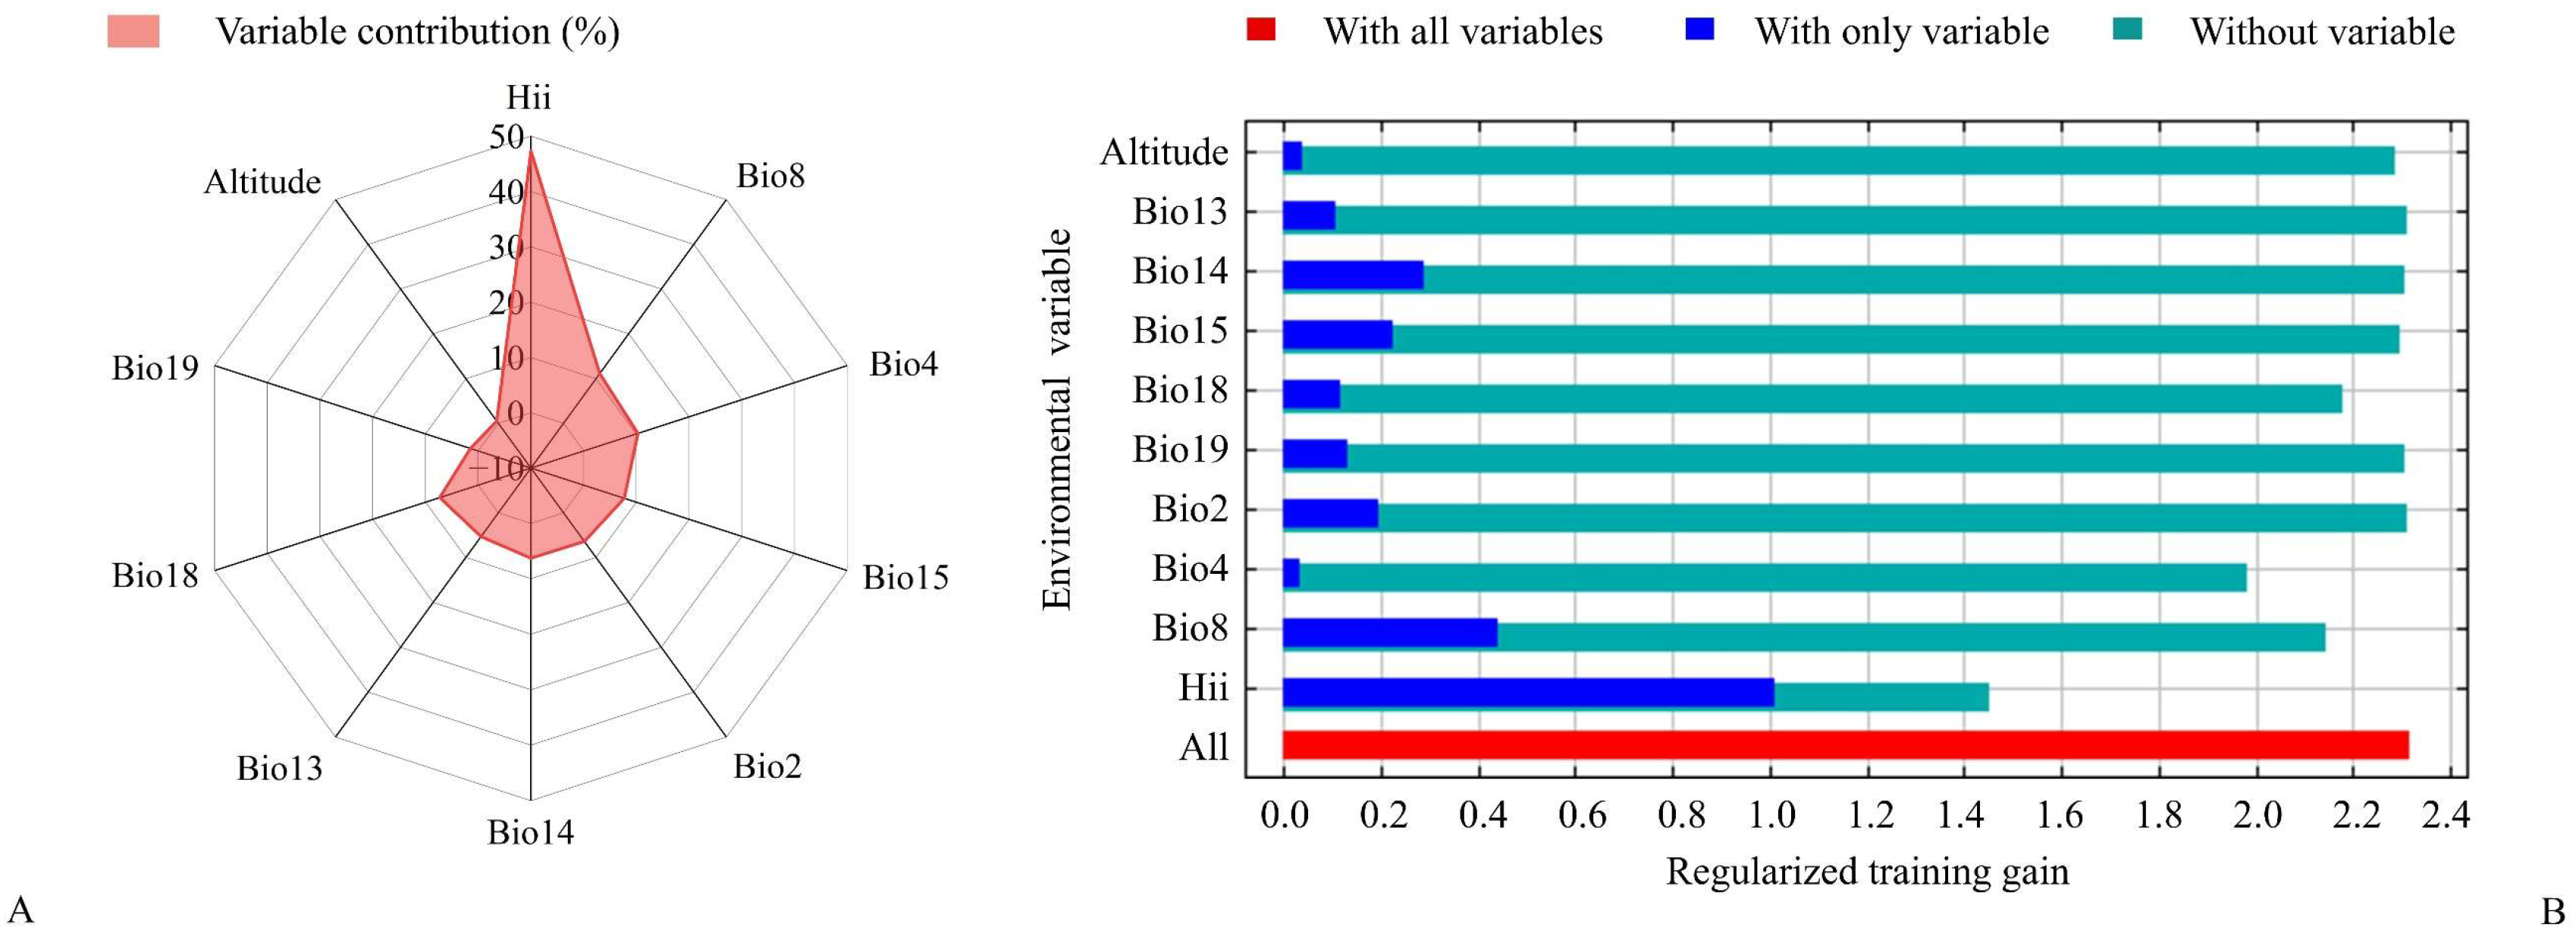
In the present study, significant environmental variables affecting the PGDs of C. vesuviana were selected based on the contribution of environmental variables and the jackknife method. The results of the contribution rate analysis showed that HII had the highest contribution (47.3%) to the model prediction, followed by the mean temperature of the wettest quarter (Bio8) and temperature seasonality (Bio4), with a cumulative contribution of 68.7% from these three environmental factors (Figure 3A). The Jackknife results showed that the three variables had the most significant influence on regularisation training gain when using only the HII, mean temperature of the wettest quarter (Bio8), and precipitation of the driest month (Bio14) (Figure 3B). In summary, HII, Bio8, Bio4, and Bio14 were the significant environmental variables affecting the PGDs of C. vesuviana.

3.3. Current Potential Suitable Habitats

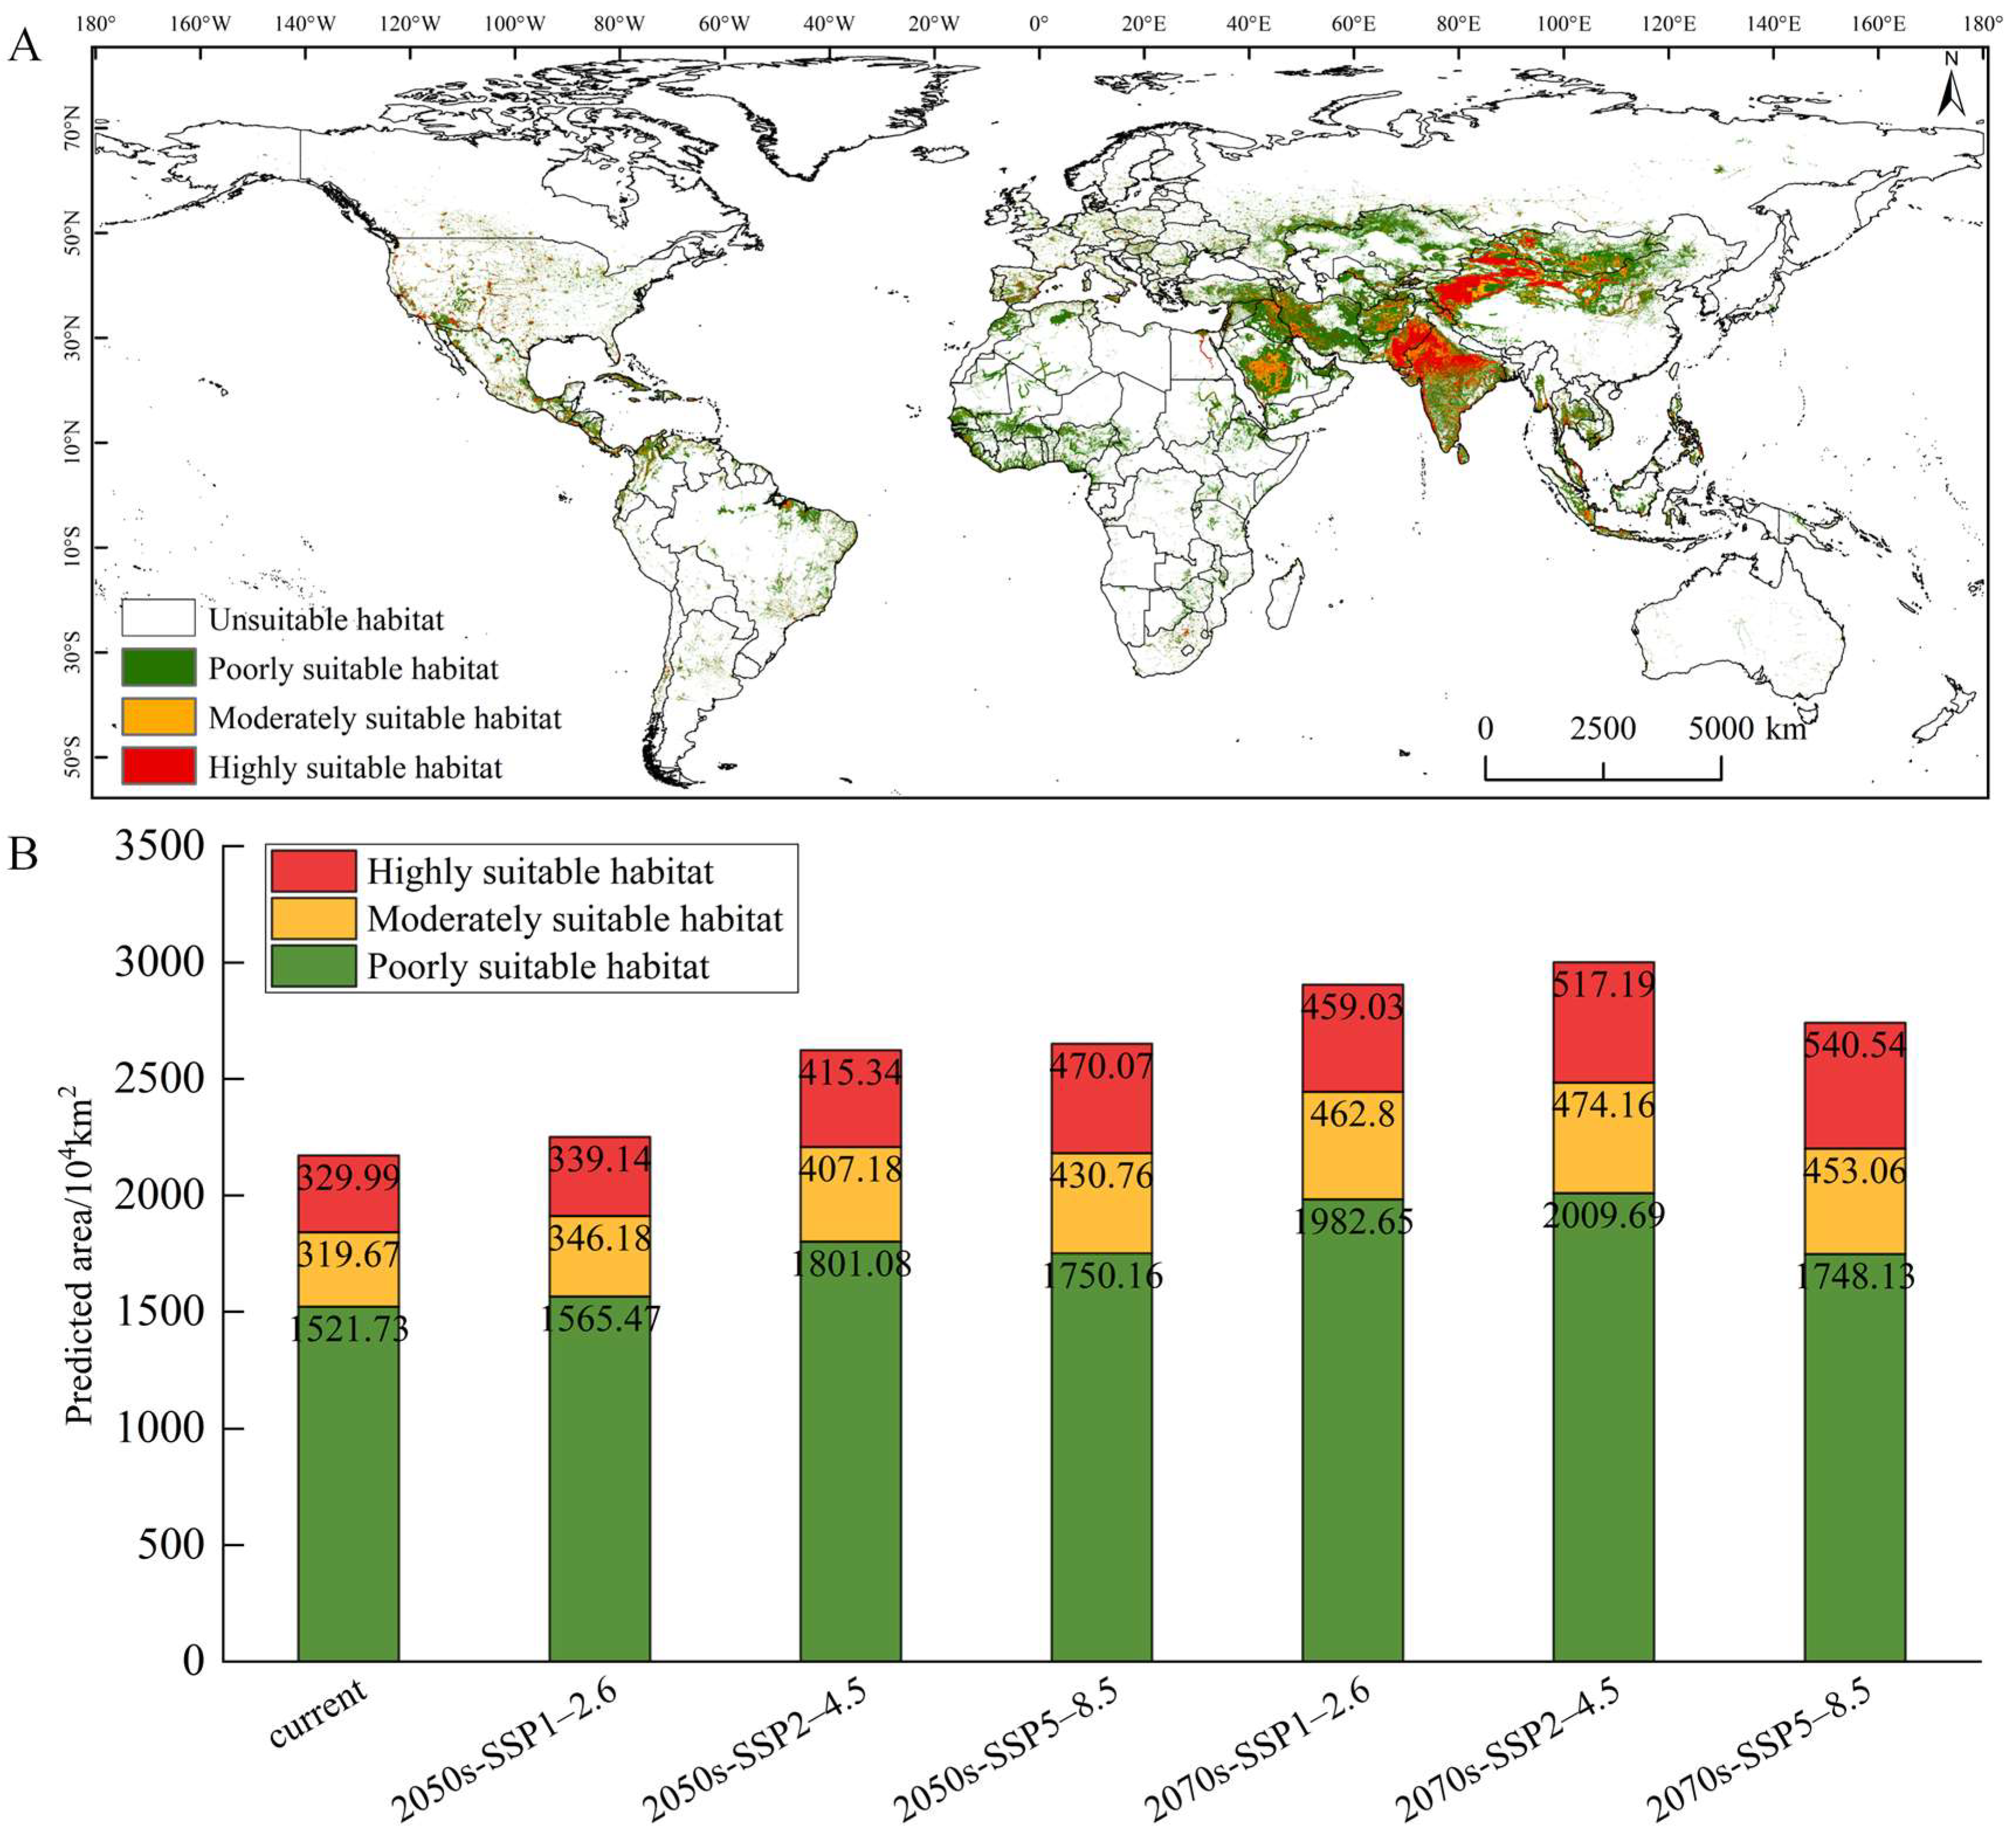
Figure 4A showed the potential suitable habitats of C. vesuviana under the current climatic scenario, which was mainly between 50° N and 10° S. The total suitable habitat of C. vesuviana was 2171.39 × 104 km2 (Figure 4B), accounting for 14.57% of the global land area. It was mainly distributed in southern and western Asia, southern Europe, central North America, western Africa and eastern South America. The highly, moderately, and poorly suitable habitats covered 329.99 × 10⁴ km2 (15.20%), 319.67 × 10⁴ km2 (14.72%), and 1521.73 × 104 km2 (70.08%) of the total suitable area, respectively (Figure 4B). Highly suitable habitat was concentrated in South and East Asia (India, Pakistan, and north western China), highlighting these as priority regions for monitoring. Moderately suitable areas were also prevalent in western and southern Asia (central Saudi Arabia, Afghanistan, southwestern Iran, south-central Thailand and western Indonesia), while poorly suitable habitat was widespread across Africa (Gulf of Guinea region), southern Europe (south-eastern Turkey, southern Spain, and southern Italy), and the Americas (United States, Mexico, Brazil). C. vesuviana has adaptable ecological preferences, allowing it to persist in a variety of environments.

3.4. Future Potential Suitable Habitats and Trends

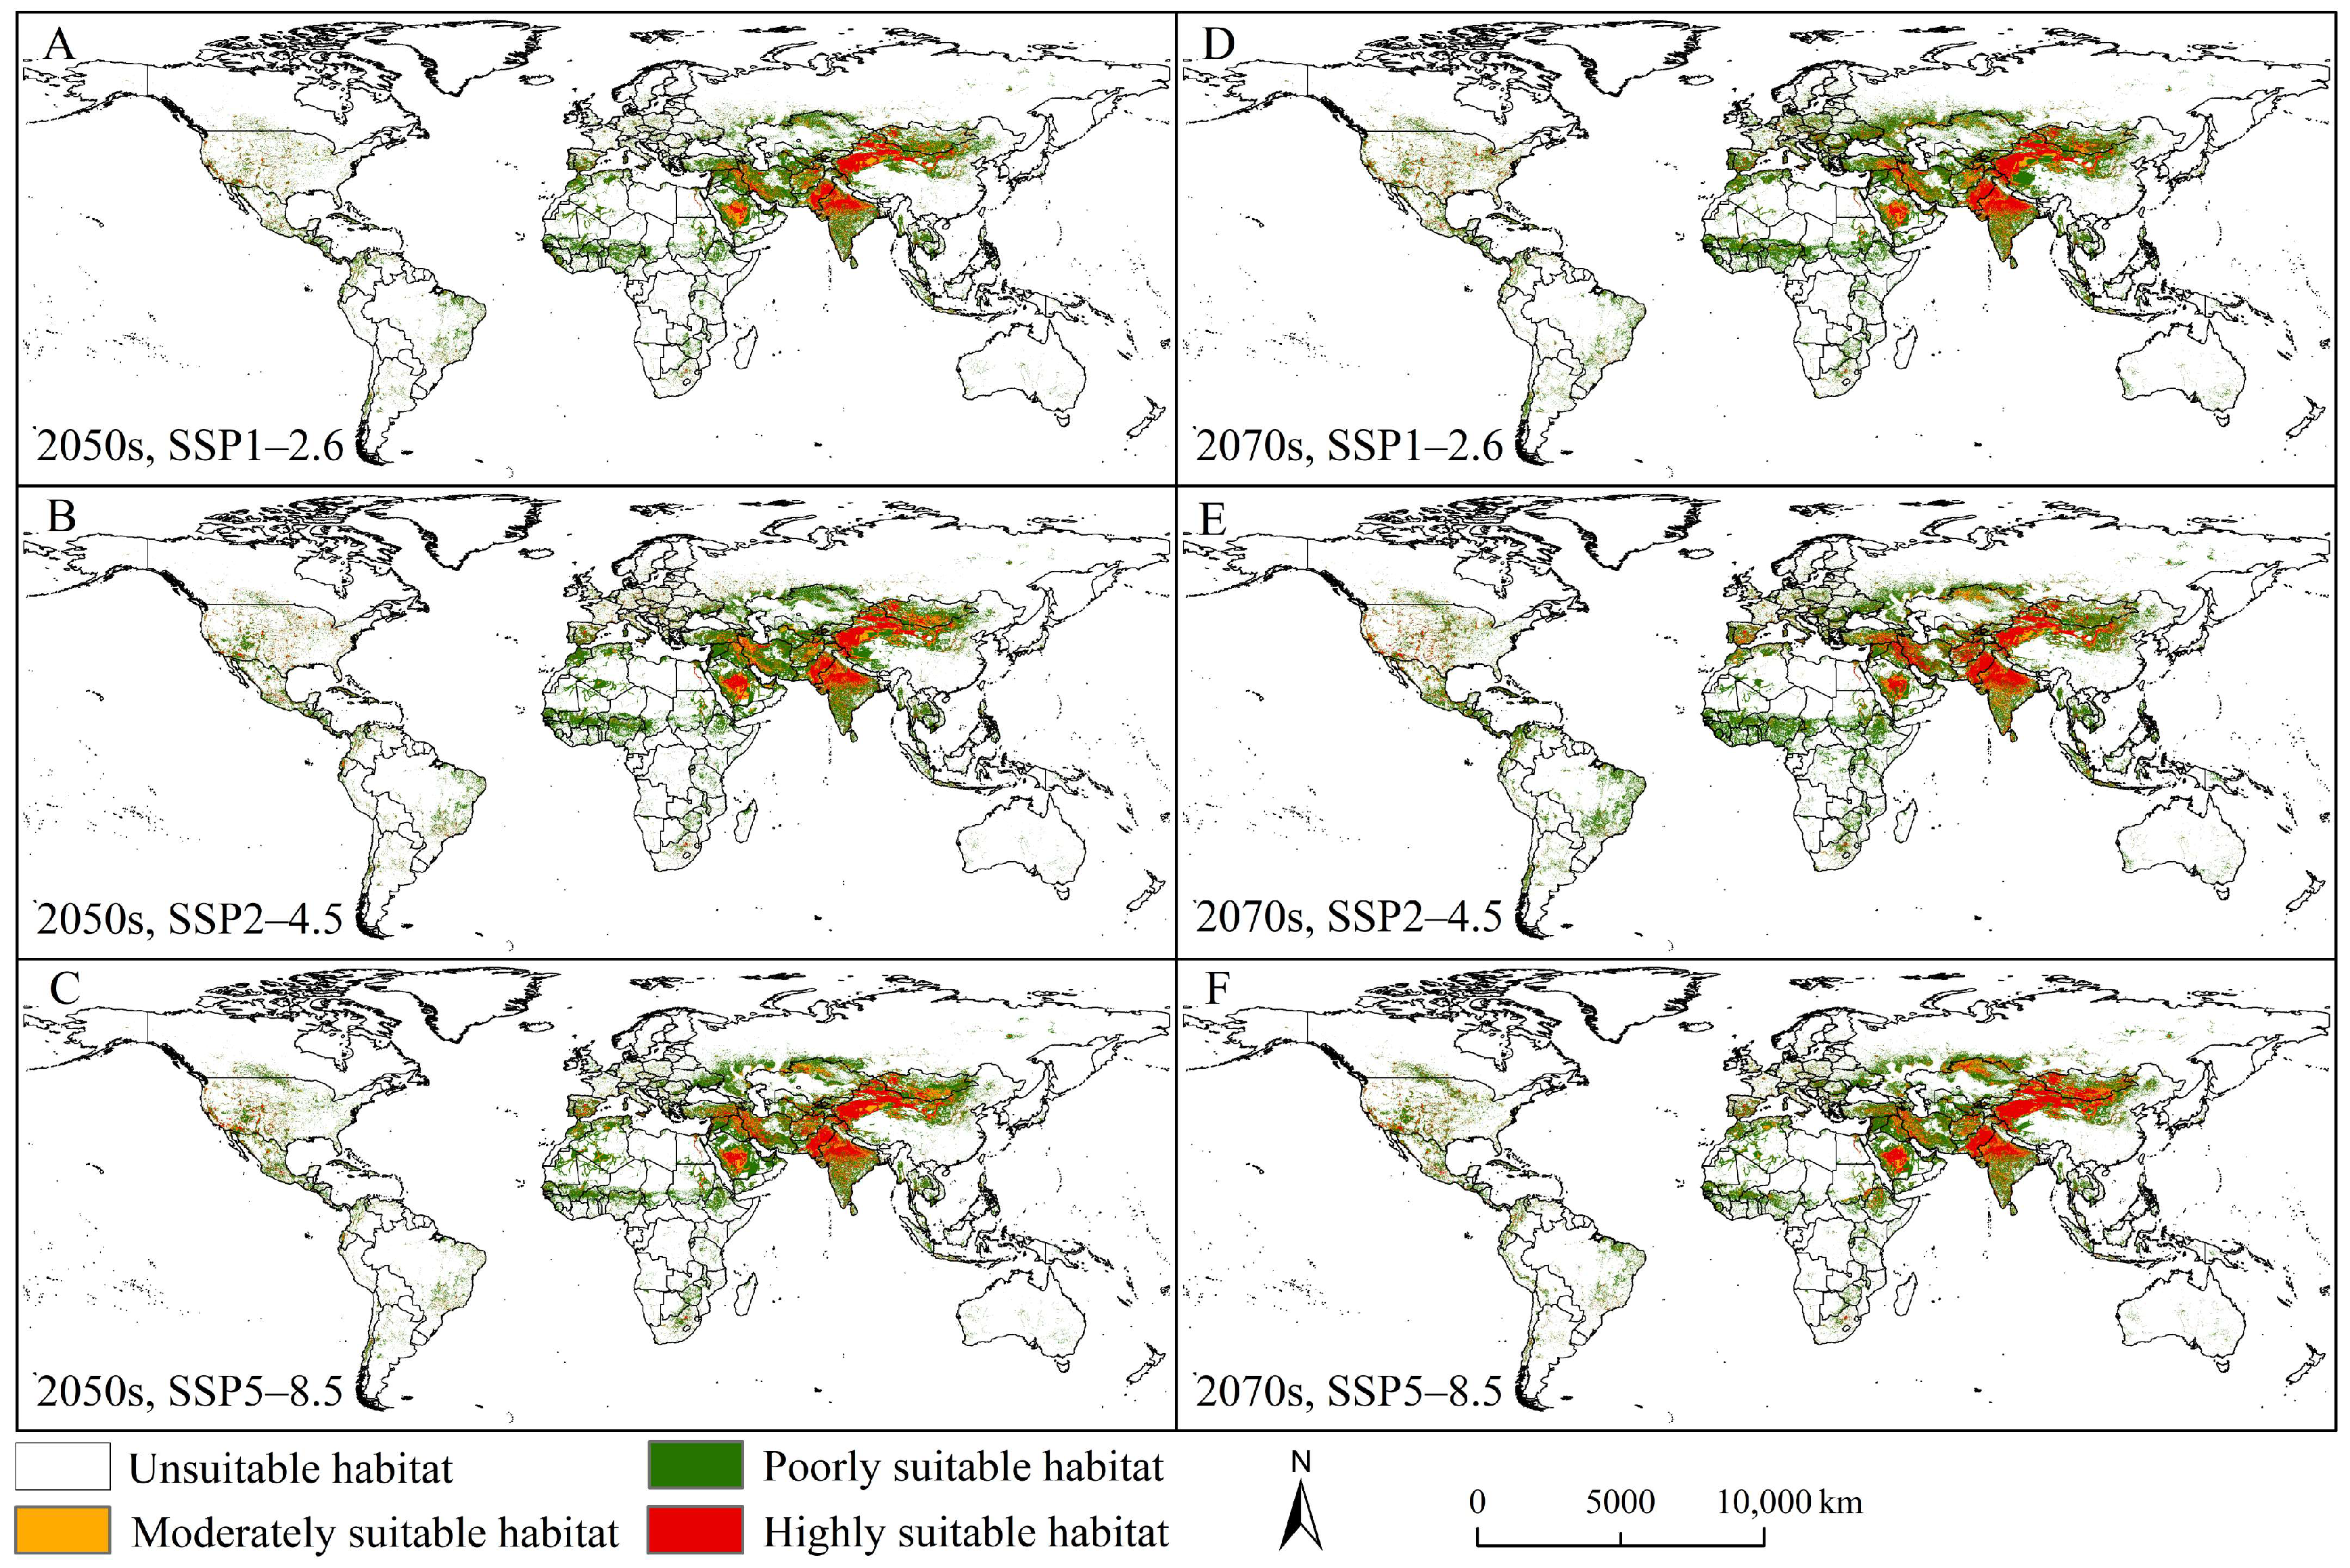
Under future climate scenarios (SSP1-2.6, SSP2-4.5, SSP5-8.5) for the 2050s and 2070s, the geographic distribution of C. vesuviana remains stable, with a consistent expansion in suitable habitat area (Figure 5). Highly and moderately suitable habitats stay concentrated in southern and western Asia, while poorly suitable areas are mainly in North America, southern Europe, and central Africa. All future scenarios predict an increase in suitable habitat compared to current scenarios (Figure 4B). By the 2050s under SSP5-8.5, the total, highly, and moderately suitable habitats reach 2650.99 × 104 km2, 470.07 × 10⁴ km2, and 430.76 × 10⁴ km2, respectively. By the 2070s, under SSP2-4.5, further expansion occurs in total (3001.05 × 104 km2), moderately (474.16 × 10⁴ km2), and poorly suitable areas (2009.69 × 104 km2). The highly suitable habitat under SSP5-8.5 peaks at 540.54 × 10⁴ km2 by the 2070s.
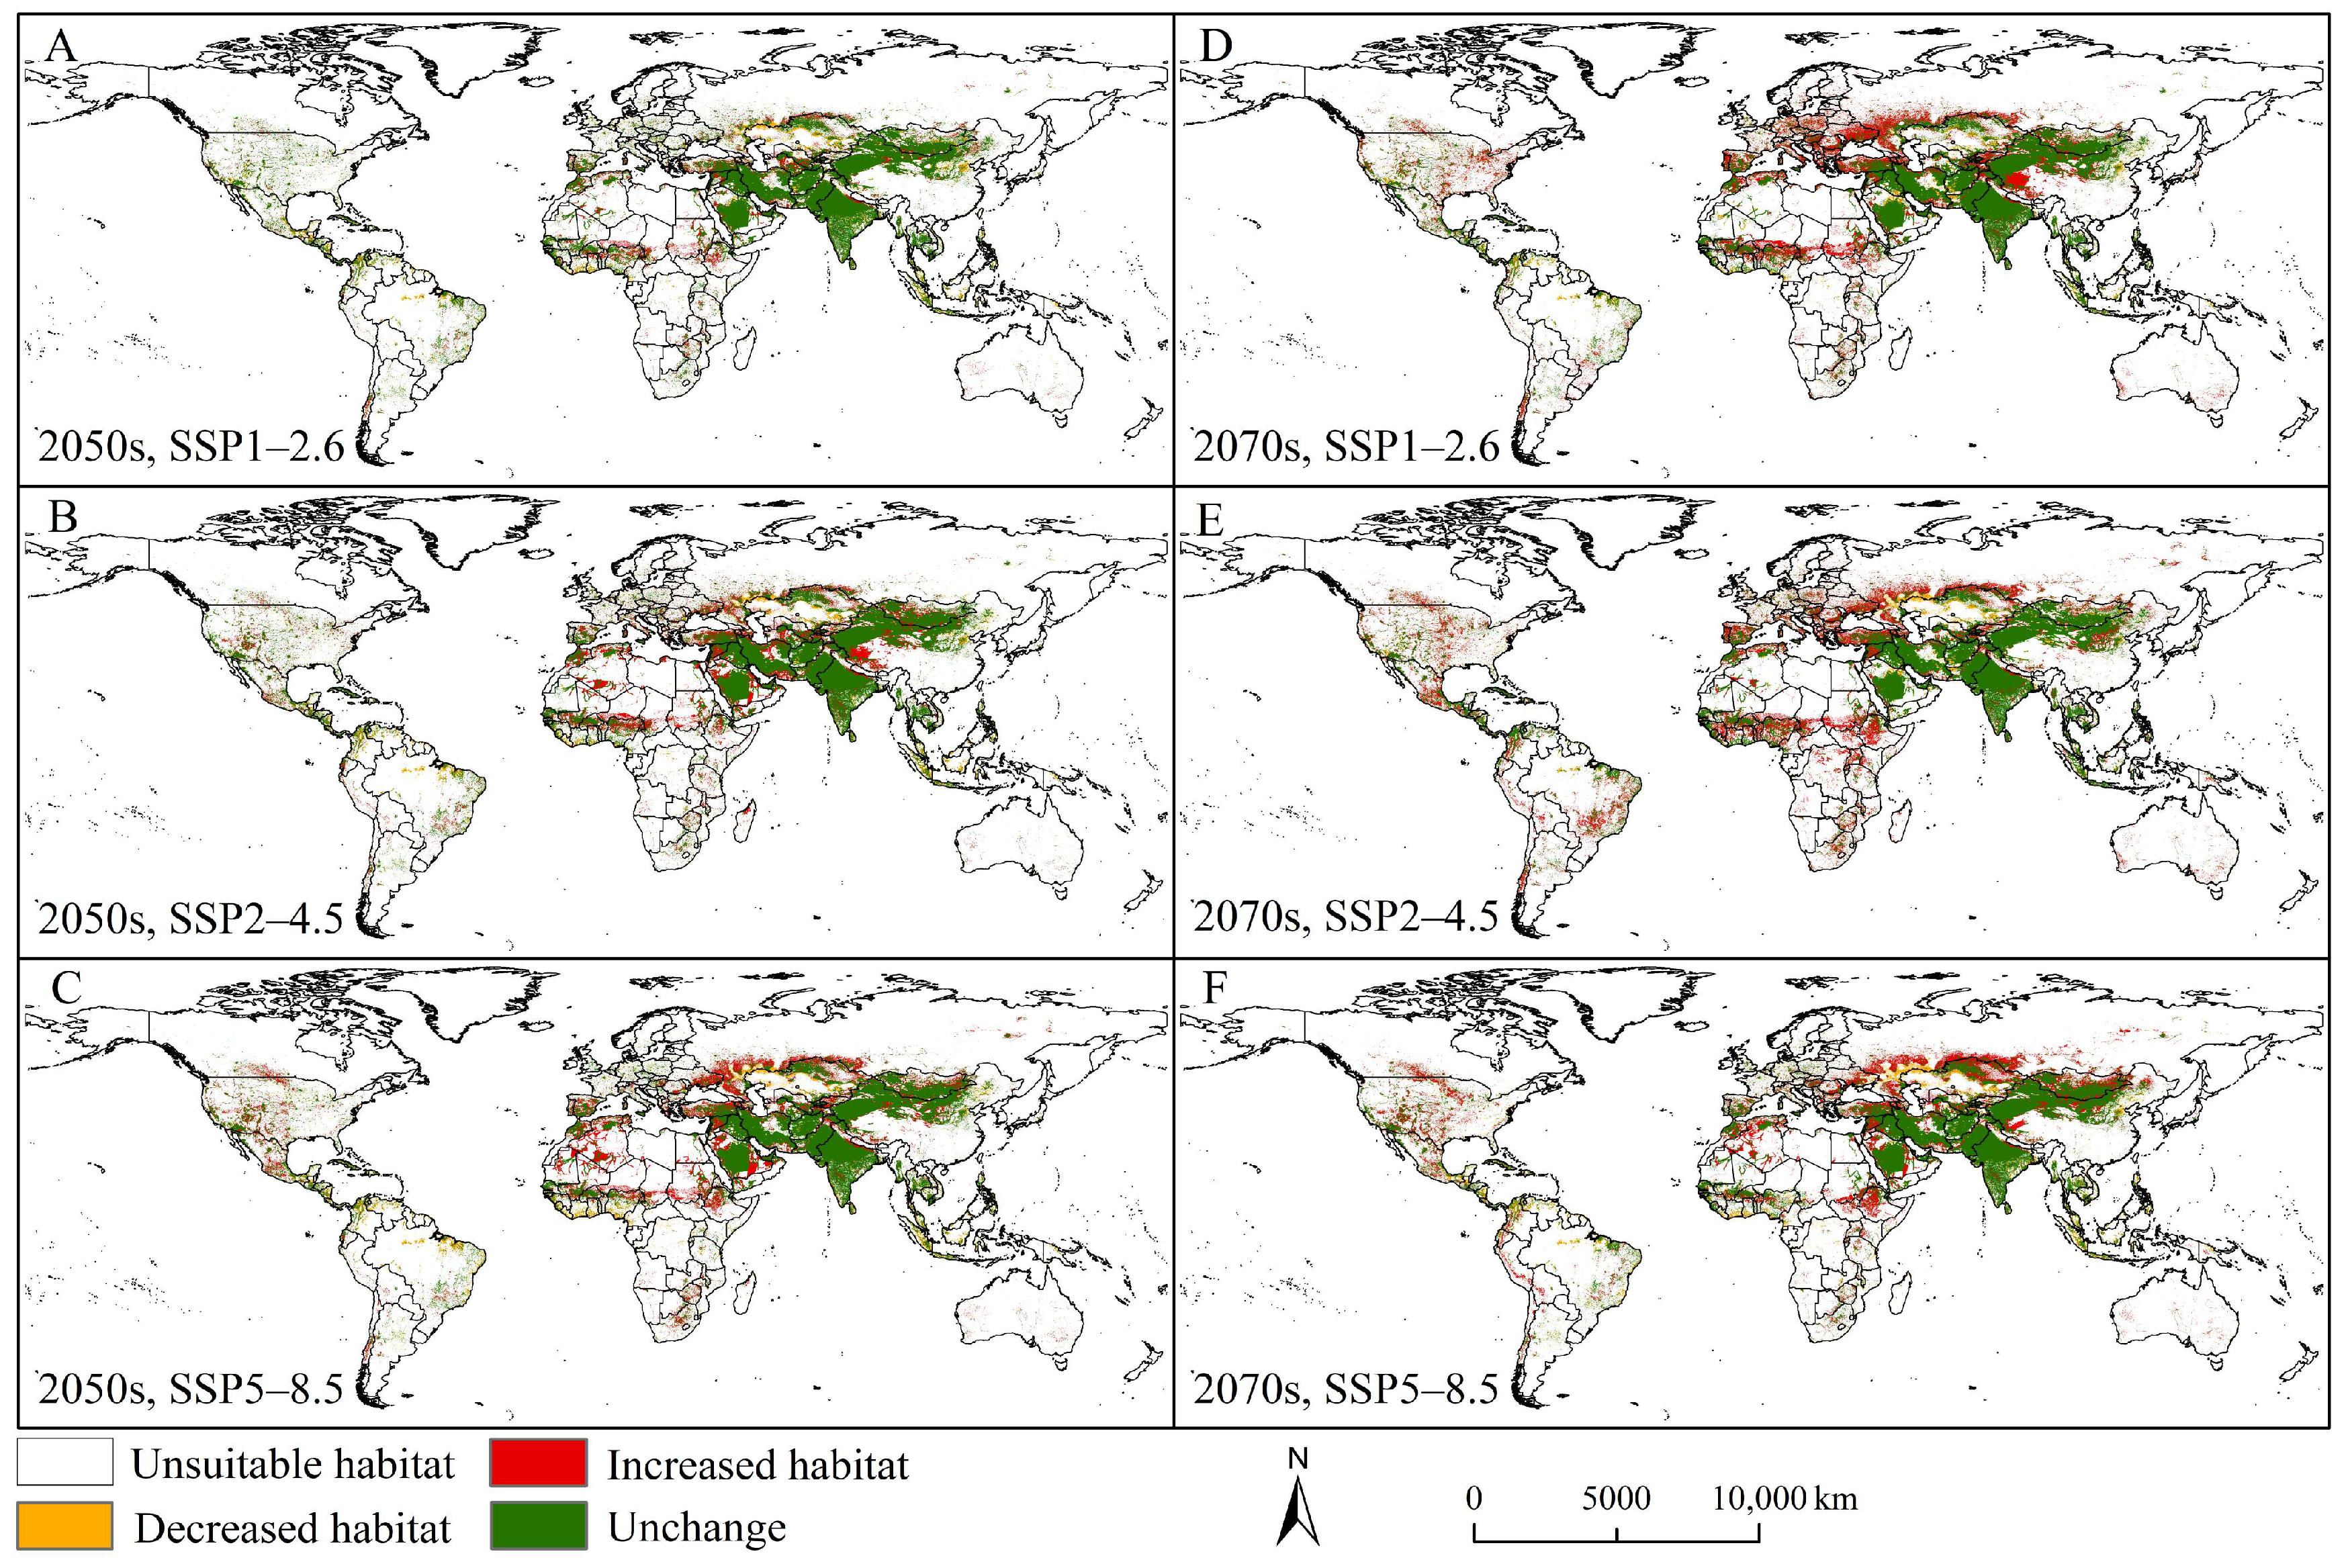
The potentially suitable habitats for C. vesuviana showed a northward expansion in the 2050s and the 2070s under SSP1–2.6, SSP2–4.5, and SSP5–8.5. The increased habitats distributed mainly in the middle-to high-latitude regions of the Northern Hemisphere (Figure 6). Specifically, they were in eastern and western Asia (northwestern China and Saudi Arabia), southern and eastern Europe (Turkey, Spain, and southwestern Russia), the Americas (United States, central Mexico, and Brazil), and central Africa. Under the three climate scenarios SSP1–2.6, SSP2–4.5, and SSP5–8.5, C. vesuviana expanded its global suitable habitats by 305.29 × 10⁴ km2, 612.85 × 10⁴ km2 and 697.91 × 10⁴ km2, respectively, in the 2050s. Under the three climate scenarios SSP1–2.6, SSP2–4.5, and SSP5–8.5, C. vesuviana increased the global suitable habitats by 871.94 × 10⁴ km2, 920.92 × 10⁴ km2 and 800.33 × 10⁴ km2, respectively, in the 2070s (Table S2). Despite variations in expansion rates across climate scenarios, the consistent systematic northward shift of C. vesuviana’s distribution provides a critical scientific basis for developing proactive transboundary monitoring and defense strategies.

3.5. Potential Economic Losses of C. vesuviana on Chinese Jujube Industry

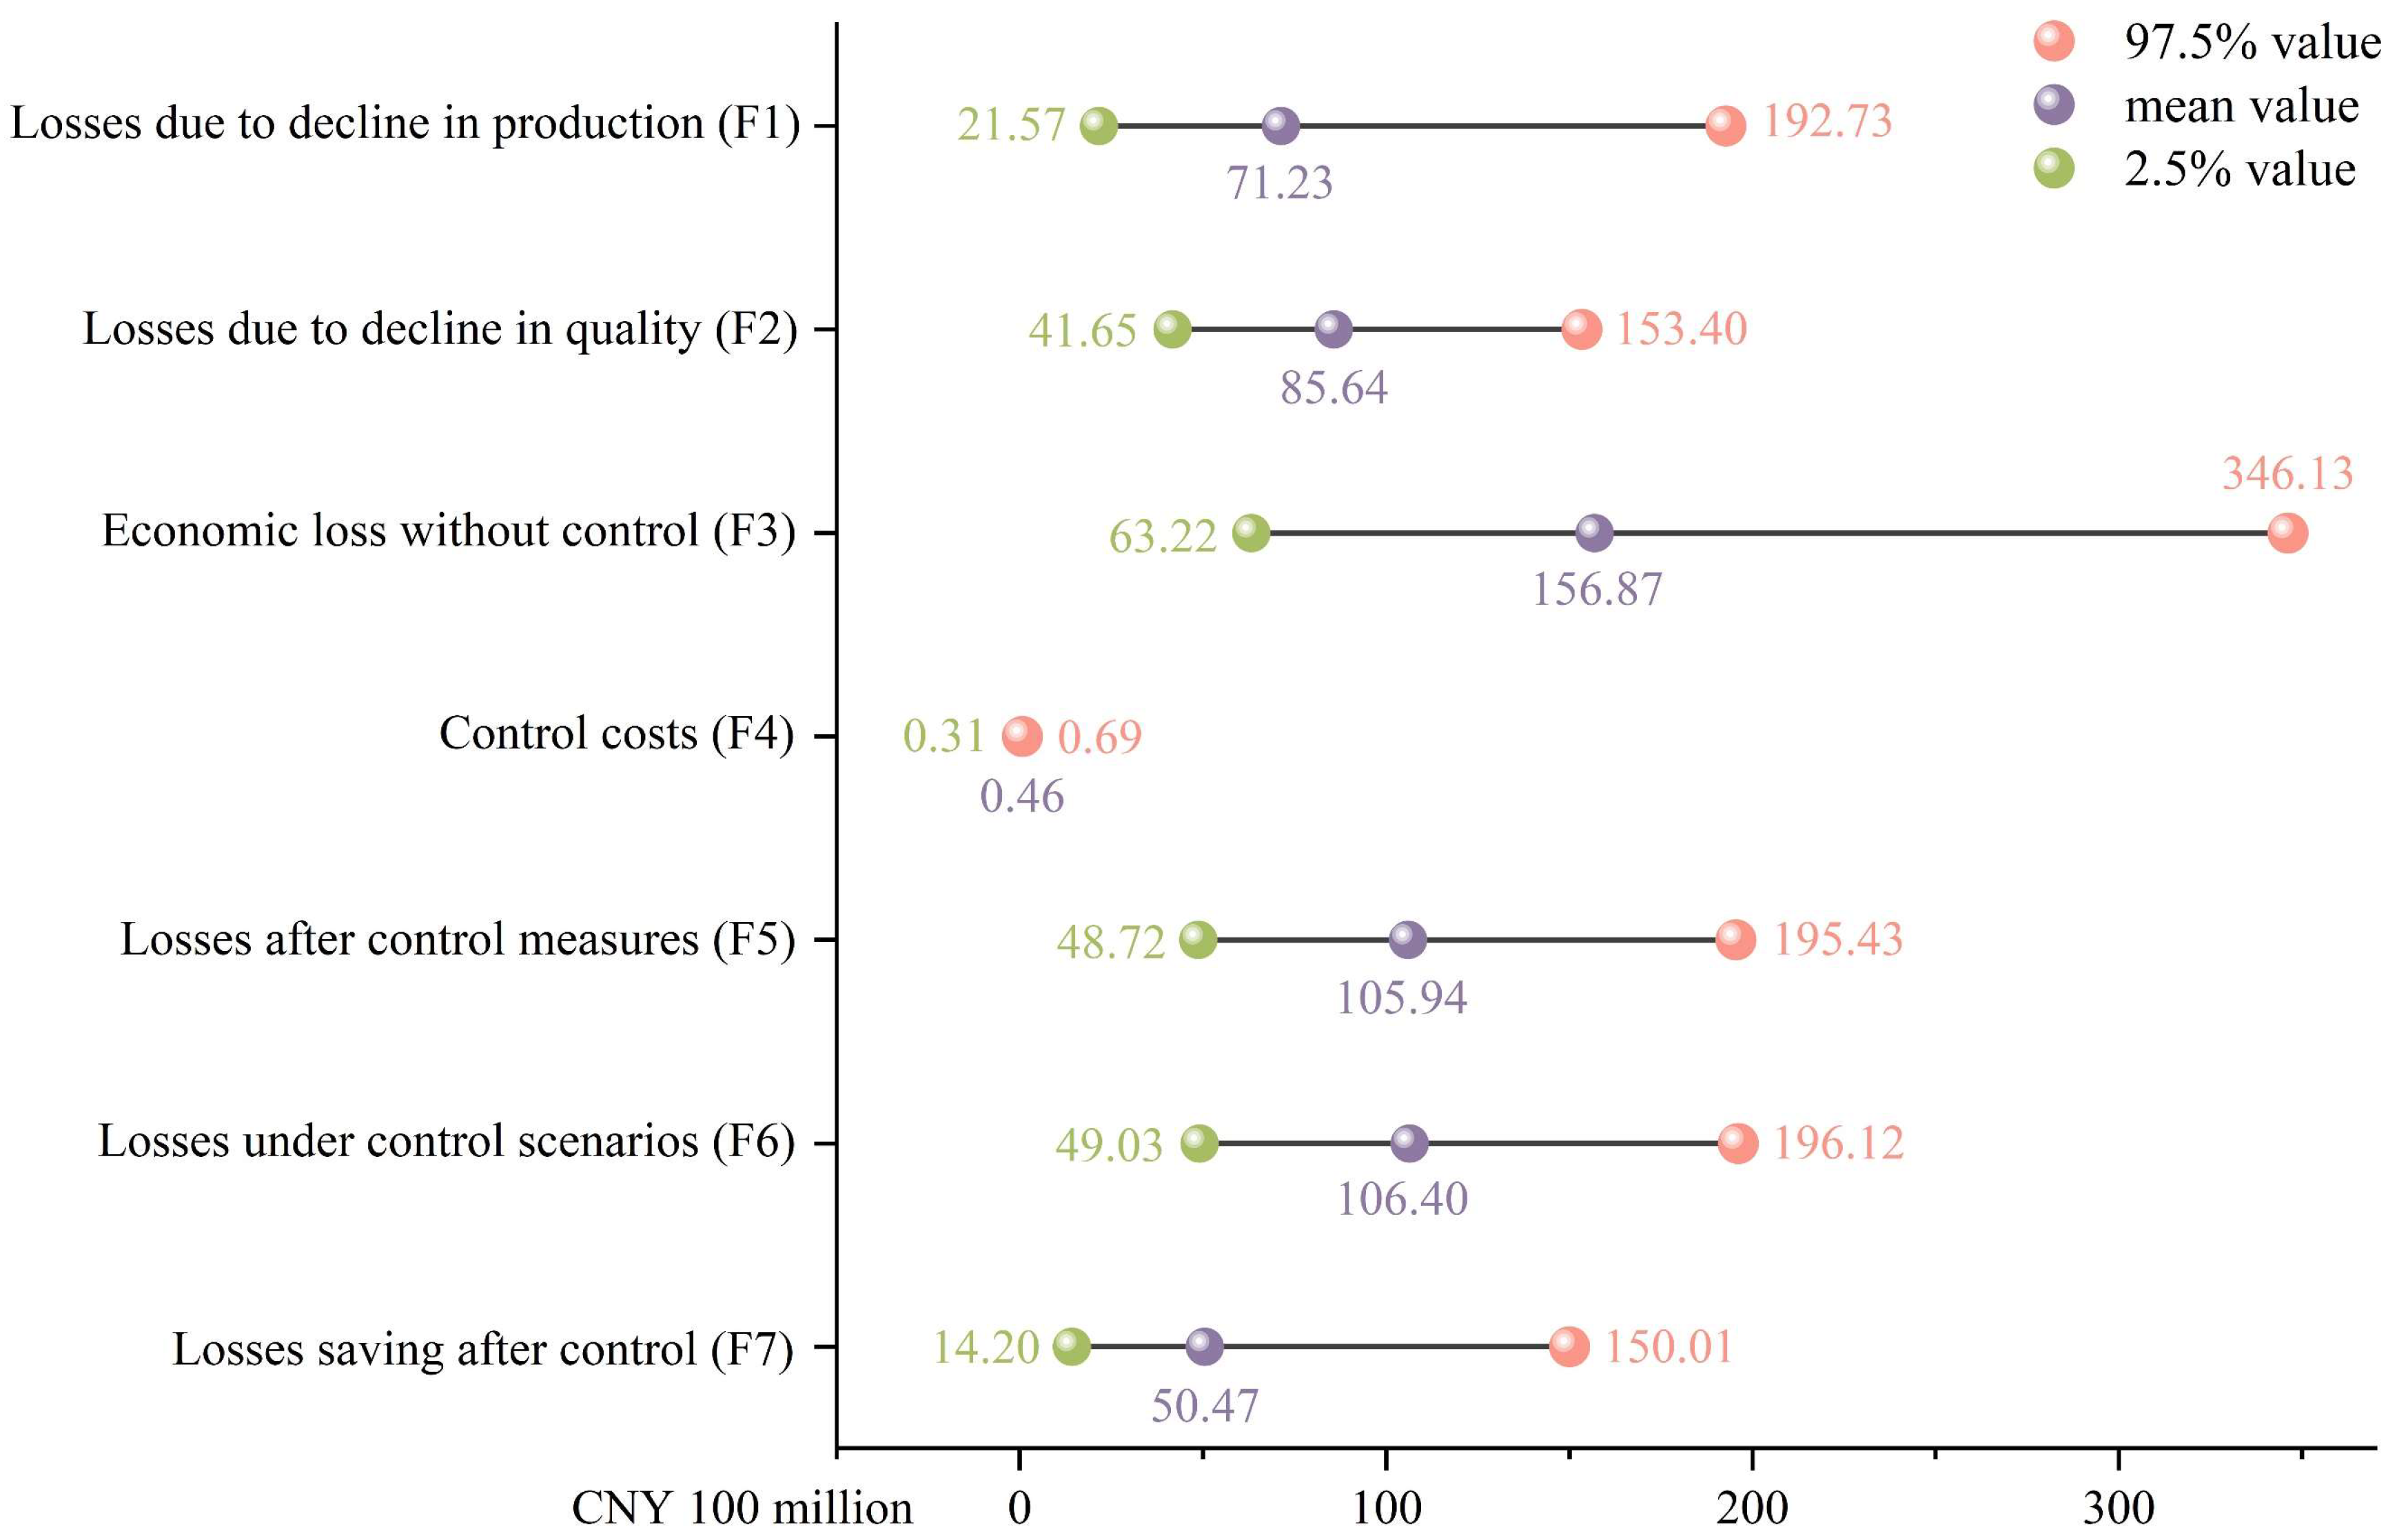
Under the no-control scenario, the total economic loss caused by C. vesuviana to the Chinese jujube industry was 6322–34,613 million CNY (95% confidence interval), with a mean value of 15,687 million CNY (Figure 7). Of these, the potential economic loss caused by the decline in production would be 2157–19,273 million CNY and the potential economic loss due to quality decline would be 4165–15,340 million CNY. Ranking the factors affecting potential economic losses by their importance (Figure S3), the market price of jujubes would have the greatest impact on the potential economic losses under the no-control scenario, followed by the infection rate for jujubes by C. vesuviana and the price of infected jujubes.
Under the control scenario, the total combined economic loss under the control scenario would be 4903–19,612 million CNY (95% confidence interval) (Figure 7). The expenditure on C. vesuviana control costs would range from 31 to 69 million CNY, and the potential economic loss to jujube due to C. vesuviana after control measures would be 4872–19,543 million CNY. The important factors affecting potential economic losses under the control scenario were the market price of jujubes and the price of infected jujubes (Figure S4). The potential economic losses that could be recovered after investing in prevention and treatment would range from 1420 to 15,001 million CNY (95% confidence interval) with a mean value of 5047 million CNY (Figure 7). The factor that would have the greatest impact on the potential economic losses that could be recovered was the loss rate after C. vesuviana infection, followed by the infection rate for jujubes and the market price of jujubes (Figure S5).

4. Discussion

Carpomya vesuviana is a highly destructive pest of jujube palm with strong adaptability [55], causing a 20–40% yield reduction, and is classified as a quarantine pest [56]. As global climate change alters insect PGDs, understanding C. vesuviana’s PGDs and economic impacts is crucial for developing scientific prevention and control strategies [57]. This study used an optimised MaxEnt model to predict PGDs under various climate scenarios and @RISK software to evaluate potential economic losses to the Chinese jujube industry. It also identified increased areas of C. vesuviana under climate change, which will help relevant authorities formulate corresponding preventive and control measures.

4.1. Significant Environmental Variables Influenced Potential Suitable Habitats of C. vesuviana

The potentially suitable habitats for C. vesuviana are influenced by a combination of climatic and human variables. Our results demonstrated that C. vesuviana is often distributed in places with high temperatures and seasonal variability in precipitation. Temperature affects insect growth and reproduction, and global warming has expanded some insects’ ranges by improving overwintering survival, accelerating growth, and allowing more generations during the growing season [58,59,60]. Our results also highlighted Bio8 and Bio4 as important environmental variables influencing the PGDs of C. vesuviana, which typically infests jujube fruits from late August to early October, with peak activity observed in mid-September. It exhibits heightened diurnal activity, particularly under sunny conditions [61]. Studies have indicated that the occurrence of C. vesuviana is positively correlates with temperature and negatively correlates with relative humidity [62]. In terms of precipitation, C. vesuviana faces difficulty colonising areas with high humidity, particularly those characterised by year-round heavy rainfall. However, its fitness is notably higher within a certain range of relatively dry environments, significantly increasing the likelihood of establishment and dispersal [63]. Precipitation plays a direct role in the pupal–adult transition of C. vesuviana. In India, high temperatures, coupled with elevated evaporation rates and intermittent showers during July and August, accelerate pupation and heightened adult activity, leading to damage levels of 63–80% [64,65]. Our results also indicated that Bio14 is an important environmental variable influencing the potential suitable habitats of C. vesuviana and that adequate rainfall promotes its growth and dispersal. These studies suggest that temperature and precipitation are important environmental variables that affect potentially suitable habitats for C. vesuviana.
The HII had a greater impact on the results of this study, reflecting those human activities (e.g., international trade and agricultural activities) play an important role in introducing IAS [66]. Carpomya vesuviana has limited long-distance dispersal ability, with spread mainly occurring through host plant movement [67]. Cross-regional transfer can occur through multiple pathways, including trading of infested jujubes, contaminated soil movement, seedling transport, and agricultural machinery crossing borders [68]. Recently, Guangzhou Customs DISTRICT P.R. China identified the first case of C. vesuviana in China’s ports, which was crucial for preventing IAS (http://guangzhou.customs.gov.cn/ (accessed on 6 November 2024)). It should be noted that in future projections, HII is treated as a static variable, as its changes depend on uncertain socioeconomic pathways rather than physical laws [69]. Future work will aim to obtain datasets predicting HII under current and future climate scenarios. Similarly, altitude changes negligibly from the 2050s to 2070s due to its geological stability and is treated as a static variable [70,71].

4.2. Current and Future Distribution Patterns

The distributions of C. vesuviana under current climatic scenarios are mainly in southern and western Asia (India, China, Iran, and Saudi Arabia), southern Europe (Spain and Italy), the Americas (United States, Mexico, and Brazil), and western Africa, which are areas with monsoon or continental climates that match its biological traits [14,72,73]. These regions also overlap with major jujube-growing areas; for example, in 2021, Xinjiang, China produced 381.24 × 10⁴ t of jujubes on 4134.95 km2, and in 2023, Iran produced 102.41 × 10⁴ t of jujubes on 1221.51 km2 (Statistic Bueau of Xijlang Uygur autonomous Reglon, https://tjj.xinjiang.gov.cn/ (accessed on 9 November 2024); FAO, https://www.fao.org/ (accessed on 10 November 2024)). Under future climate scenarios, the PGDs of C. vesuviana will expand toward mid-to high-latitudes in the Northern Hemisphere. Global warming is projected to exceed 1.5 °C in the next two decades, and C. vesuviana’s PGDs will expand to extend from 50° S to 60° N [74,75,76], confirming the results from this study. Under future climate scenarios, it is essential to focus on monitoring and controlling the increase in suitable areas (northwest China, southwest Russia, and United States) for C. vesuviana. Historical cases offer valuable insights into invasive pest management. In the United States, Anthonomus grandis was successfully eradicated from 98% of its range through an integrated program combining pheromone trapping, targeted pesticide application, and sustained monitoring [77]. Future control of C. vesuviana should combine targeted eradication based on occurrence data with strict quarantine in uninfected yet climatically suitable areas.

4.3. Economic Impact on the Jujube Industry

China is the world’s largest producer of jujubes, and the jujube industry is the country’s leading dried fruit producer [23,24]. Carpomya vesuviana is an economically important IAS that has devastated the jujube industry in China; it was first found on red jujubes in Xinjiang, resulting in a loss of more than 40% of the yield of jujube trees [74]. @RISK was used to simulate economic losses caused by species-related damage. Under the no-control scenario, it estimated potential losses without intervention, while under the control scenario, it quantified residual losses and the recoverable benefits from management [37]. We used @RISK software to calculate the impact of C. vesuviana on the Chinese jujube industry in both no-control and control scenarios. The potential economic loss under the no-control scenario was approximately 15,687 million CNY. Control measures could reduce the potential economic loss by 5047 million CNY. The price of jujubes, infection rate of jujubes by C. vesuviana, and loss rate after C. vesuviana infection had the greatest impact on economic loss. Although the price factor was important to the model results, price volatility made it difficult to assess. We should strengthen the integrated control of C. vesuviana, including agricultural control (removing wild sour jujubes and scattered jujube palms on the four sides), chemical control (organophosphorus and pyrethroid insecticides) [21], and biological control (parasitic natural enemies) [72], to reduce the infection rate of C. vesuviana in jujube fruits.

5. Conclusions

This study for the first time combines the MaxEnt model with @Risk software. Based on the species occurrence records and environmental data of C. vesuviana, it predicts the global potential distribution of the pest under current and future climate scenarios, and quantitatively assesses the potential economic losses caused by this pest to China’s jujube industry, providing critical reference for comprehensive management and control of target species across global jujube-growing regions. Under the current climatic scenarios, suitable habitats for C. vesuviana are mainly in southern and western Asia, southern Europe, central North America, western Africa, and eastern South America. Under future climate change scenarios, the potentially suitable habitats of C. vesuviana are projected to expand to the middle and high latitudes of the Northern Hemisphere, with additional habitats of focus, including eastern and western Asia (northwest China and Saudi Arabia), southern and eastern Europe (Turkey, Spain, and southwest Russia), the America (United States, central Mexico, and Brazil), and central Africa. The potential economic loss under the no-control scenario was 15,687 million CNY. The potential economic loss that could be recovered with control measures was 5047 million CNY. To prevent the further spread of C. vesuviana, we recommend enhanced quarantine in jujube-producing and trading countries, alongside targeted control in affected areas using pheromone traps and bait spraying. In regions at potential risk, early warning systems, real-time monitoring, risk modelling, and cross-border data sharing should be prioritized.

Supplementary Materials

The following supporting information can be downloaded at: https://www.mdpi.com/article/10.3390/agriculture15192081/s1, Figure S1: The correlaton analysis of 21 environmentl vaiables; Figure S2: Standard deviation map; Figure S3: Sensitivity analysis results of potential economic loss of jujube industry caused by Carpomya vesuviana under the non-control scenario; Figure S4: Sensitivity analysis results of potential economic loss of jujube industry caused by Carpomya vesuviana under the control scenario; Figure S5: Sensitivity analysis results of the retrievable potential economic loss of jujube industry caused by Carpomya vesuviana under the control scenario; Table S1: Environmental variables screened for model prediction; Table S2: Changes in suitable areas (×104 km2) for Carpomya vesuviana under three climate scenarios (2050s and 2070s).

Author Contributions

Conceptualization and methodology, J.N., W.L. and H.Z. (Haoxiang Zhao); acquisition of data, J.N., M.L. and Y.Q.; analysis and interpretation of data, J.N., M.L.; statistical analysis, J.N., H.Z. (Haoxiang Zhao) and Y.Q.; writing—original draft preparation, J.N. and M.L.; manuscript revision, X.X., J.G., N.Y., H.Z. (Hongxu Zhou) and W.L.; funding acquisition, W.L. All authors have read and agreed to the published version of the manuscript.

Funding

This work was supported by the National Key R&D Program of China (2023YFC2605200), Agricultural Science and Technology Innovation Program (ASTIP) (CAAS-ZDRW202505), Tian-Shan Talent Program (2022TSYCCX0084), and Central Public-interest Scientific Institution Basal Research Fund (S2025XM07).

Institutional Review Board Statement

Not applicable.

Informed Consent Statement

Not applicable.

Data Availability Statement

Data is contained within the article and supplementary material.

Conflicts of Interest

The authors declare no conflicts of interest.

References

  1. Paini, D.R.; Sheppard, A.W.; Cook, D.C.; De Barro, P.J.; Worner, S.P.; Thomas, M.B. Global threat to agriculture from invasive species. Proc. Natl. Acad. Sci. USA 2016, 113, 7575–7579. [Google Scholar] [CrossRef]
  2. Early, R.; Bradley, B.A.; Dukes, J.S.; Lawler, J.J.; Olden, J.D.; Blumenthal, D.M.; Gonzalez, P.; Grosholz, E.D.; Ibañez, I.; Miller, L.P.; et al. Global threats from invasive alien species in the twenty-first century and national response capacities. Nat. Commun. 2016, 7, 12485. [Google Scholar] [CrossRef]
  3. Chapman, D.; Purse, B.V.; Roy, H.E.; Bullock, J.M. Global trade networks determine the distribution of invasive non-native species. Global. Ecol. Biogeogr. 2017, 26, 907–917. [Google Scholar] [CrossRef]
  4. Hulme, P.E. Climate change and biological invasions: Evidence, expectations, and response options. Biol. Rev. 2017, 92, 1297–1313. [Google Scholar] [CrossRef] [PubMed]
  5. Robinson, T.B.; Martin, N.; Loureiro, T.G.; Matikinca, P.; Robertson, M.P. Double trouble: The implications of climate change for biological invasions. NeoBiota 2020, 62, 463–487. [Google Scholar] [CrossRef]
  6. Venette, R.C.; Hutchison, W.D. Invasive insect species: Global challenges, strategies & opportunities. Front. Insect Sci. 2021, 1, 650520. [Google Scholar] [CrossRef]
  7. Bradshaw, C.J.A.; Leroy, B.; Bellard, C.; Roiz, D.; Albert, C.; Fournier, A.; Barbet-Massin, M.; Salles, J.-M.; Simard, F.; Courchamp, F. Massive yet grossly underestimated global costs of invasive insects. Nat. Commun. 2016, 7, 12986. [Google Scholar] [CrossRef]
  8. Zhao, T.Y.; He, R.; Hua, Y.T. Progress and prospects in prevention and control of alien invasive species during the 13th five-year plan period in China. J. Biosaf. 2022, 31, 95–102. [Google Scholar]
  9. Zhang, X.; Zhao, J.J.; Yan, J.; Fang, G.F.; Huang, J.X. Economic loss assessment of pine wilt disease in mainland China in 2017. J. Beijing For. Univ. 2020, 42, 96–106. [Google Scholar]
  10. Paul, R.; Subudhi, D.K.; Sahoo, C.K.; Banerjee, K. Invasion of Lantana camara L. and its response to climate change in the mountains of Eastern Ghats. Biologia 2021, 76, 1391–1408. [Google Scholar] [CrossRef]
  11. Skendžíc, S.; Zovko, M.; Živkovíc, I.P.; Lešíc, V.; Lemíc, D. The impact of climate change on agricultural insect pests. Insects 2021, 12, 440. [Google Scholar] [CrossRef]
  12. CABI. Carpomya Vesuviana; CABI Compendium; CAB International: Wallingford, UK, 2024. [Google Scholar]
  13. Wang, Y.S.; Guan, H.H.; Liu, J.Z.; Ge, Y.C. Control Tchnology for Carpomya vesuviana. Prot. For. Sci. Technol. 2019, 2, 94–95. [Google Scholar]
  14. Stonehouse, J.; Mahmood, R.; Poswal, A.; Mumford, J.; Baloch, K.N.; Chaudhary, Z.M.; Makhdum, A.H.; Mustafa, G.; Huggett, D. Farm field assessments of fruit flies (Diptera: Tephritidae) in Pakistan: Distribution, damage and control. Crop Prot. 2002, 21, 661–669. [Google Scholar] [CrossRef]
  15. Azam, K.M.; Al-Ansari, M.S.; Al-Raeesi, A. Fruit flies of Oman with a new record of Carpomya vasuviana Costa (Diptera: Tephritidae). Res. Crops 2004, 5, 274–277. [Google Scholar]
  16. Farrar, N.; Asadi, G.H.; Golestaneh, S.R. Damage and host ranges of Ber fruit fly Carpomyia vesuviana Costa (Tephritidae) and its rate of parasitism. J. Agric. Sci. 2004, 5, 120–130. [Google Scholar]
  17. Sookar, P.; Permalloo, S.; Gungah, B.; Alleck, M.; Seewooruthun, S.I.; Soonnoo, A.R. An Area Wide Control of Fruit Flies in Mauritius; Biofabrica Moscamed Brasil: Juazeiro, Brazil, 2006. [Google Scholar]
  18. Adil, S.; He, S.; Tian, C.; Luo, Y.; Yu, F.; Feng, X. The occurrence of Carpomya vesuviana Costa in Turpan and the distribution of pupae. Plant Quar. 2008, 22, 295–297. [Google Scholar]
  19. EPPO. EPPO global database for Carpomya vesuviana—Distribution; European and Mediterranean Plant Protection Organization: Paris, France, 2024; Available online: https://gd.eppo.int/taxon/CARYVE (accessed on 28 October 2024).
  20. Farrar, N.; Mohamadi, M.; Golestaneh, S.R. Biology of the ber fruit fly, Carpomyia vesuviana Costa (Diptera: Tephritidae) and Identification of Natural Enemies in Bushehr Province. Iranian. J. For. Range Protec Res. 2003, 1, 1–23. [Google Scholar]
  21. He, S.Y.; Wen, J.B.; Satar, A.; Tian, C.M. Research progress of quarantine pest Carpomya vesuviana. Sci. Silvae Sin. 2010, 46, 147–154. [Google Scholar]
  22. Ding, J.T. Flight Capacity and Environmental Factors Adaptation of Carpomya vesuviana Costa. Master’s Thesis, Xinjiang Agricultural University, Ürümqi, China, 2015. [Google Scholar]
  23. Song, L.H.; Meinhardt, L.W.; Bailey, B.; Zhang, D.P. Genetic Improvement of Chinese jujube for Disease Resistances: Status, knowledge gaps and research needs. Crop Breed. Genet. Genom. 2019, 1, e190015. [Google Scholar]
  24. Yang, F.; Wang, S.N.; Wang, Z.H.; Yuan, W.Y.; Qin, W.T.; Zhao, J.; Wang, S. Current status of jujube pest, control techniques, and future research prospects. J. Environ. Entomol. 2024, 17, 1–19. [Google Scholar]
  25. He, S.Y.; Zhu, Y.F.; Adili, S.; Wen, J.B.; Chen, M.; Tian, C.M. Pest risk assessment of Carpomya vesuviana in China. Sci. Silvae Sin. 2011, 47, 107–116. [Google Scholar]
  26. Elith, J.; Leathwick, J.R. Species distribution models: Ecological explanation and prediction across space and time. Annu. Rev. Ecol. Evol. Syst. 2009, 40, 677–697. [Google Scholar] [CrossRef]
  27. Peterson, A.T.; Papeş, M.; Soberón, J. Mechanistic and correlative models of ecological niches. Eur. J. Ecol. 2015, 1, 28–38. [Google Scholar] [CrossRef]
  28. Phillips, S.J.; Dudík, M. Modeling of species distributions with Maxent: New extensions and a comprehensive evaluation. Ecography 2008, 31, 161–175. [Google Scholar] [CrossRef]
  29. Tang, C.Q.; Humphreys, A.M.; Fontaneto, D.; Barraclough, T.G.; Paradis, E. Effects of phylogenetic reconstruction method on the robustness of species delimitation using single-locus data. Methods Ecol. Evol. 2014, 5, 1086–1094. [Google Scholar] [CrossRef]
  30. Peterson, A.T.; Soberón, J.; Pearson, R.G.; Anderson, R.P.; Martínez-Meyer, E.; Nakamura, M.; Araújo, M.B. Ecological Niches and Geographic Distributions; Princeton University Press: Princeton, NJ, USA, 2011; (MPB-49). [Google Scholar]
  31. Gengping, Z.; Guoqing, L.; Wenjun, B.; Yubao, G. Ecological niche modeling and its applications in biodiversity conservation. Biodivers. Sci. 2013, 21, 90–98. [Google Scholar] [CrossRef]
  32. Kumar, S.; Neven, L.G.; Zhu, H.; Zhang, R. Assessing the global risk of establishment of Cydia pomonella (Lepidoptera: Tortricidae) using CLIMEX and MaxEnt niche models. J. Econ. Entomol. 2015, 108, 1708–1719. [Google Scholar] [CrossRef]
  33. Qin, Y.; Wang, C.; Zhao, Z.; Pan, X.; Li, Z. Climate change impacts on the global potential geographical distribution of the agricultural invasive pest, Bactrocera dorsalis (Hendel) (Diptera: Tephritidae). Clim. Change 2019, 155, 145–156. [Google Scholar] [CrossRef]
  34. Wang, X.L.; Qin, Y.J.; Xu, Y.L.; Feng, X.D.; Zhao, S.Q.; Lu, Y.Y.; Li, Z.H. Surveillance and invasive risk of the red imported fire ant, Solenopsis invicta Buren in China. Pest. Manag. Sci. 2023, 79, 1342–1351. [Google Scholar] [CrossRef] [PubMed]
  35. Wei, P.; Qin, Y.; Fan, Z.; Zhou, T.; Guo, S.K.; Li, Z.H. Assessment of potential economic loss of maize industry in China caused by maize chlorotic mottle virus using @ RISK software. J. Plant Prot. 2022, 49, 1377–1382. [Google Scholar]
  36. Papadopoulos, C.E.; Yeung, H. Uncertainty estimation and Monte Carlo simulation method. Flow Meas. Instrum. 2001, 12, 291–298. [Google Scholar] [CrossRef]
  37. Qin, Y.; Ullah, F.; Fang, Y.; Singh, S.; Zhao, Z.; Zhao, Z.; Li, Z. Prediction of potential economic impact of Bactrocera zonata (Diptera: Tephritidae) in China: Peaches as the example hosts. J. Asia Pac. Entomol. 2021, 24, 1101–1106. [Google Scholar] [CrossRef]
  38. Taylor, A.S.; Cook, D.C. An economic assessment of the impact on the Western Australian viticulture industry from the incursion of grapevine downy mildew. J. Plant Dis. Prot. 2018, 125, 397–403. [Google Scholar] [CrossRef]
  39. GBIF Occurrence Download. Available online: https://doi.org/10.15468/dl.ywze8k (accessed on 15 June 2024).
  40. Warren, D.L.; Glor, R.E.; Turelli, M. ENMTools: A toolbox for comparative studies of environmental niche models. Ecography 2010, 33, 607–611. [Google Scholar] [CrossRef]
  41. Jarnevich, C.S.; Reynolds, L.V. Challenges of predicting the potential distribution of a slow-spreading invader: A habitat suitability map for an invasive riparian tree. Biol. Invasions 2011, 13, 153–163. [Google Scholar] [CrossRef]
  42. Merow, C.; Smith, M.J.; Silander, J.A., Jr. A practical guide to MaxEnt for modeling species’ distributions: What it does, and why inputs and settings matter. Ecography 2013, 36, 1058–1069. [Google Scholar] [CrossRef]
  43. Altamiranda-Saavedra, M.; Amat, E.; Gómez-P, L.M. Influence of montane altitudinal ranges on species distribution models; evidence in Andean blow flies. PeerJ 2020, 8, e10370. [Google Scholar] [CrossRef]
  44. Jin, Z.; Yu, W.; Zhao, H.; Xian, X.; Jing, K.; Yang, N.; Lu, X.; Liu, W. Potential global distribution of invasive alien species, Anthonomus grandis Boheman, under current and future climate using optimal MaxEnt model. Agriculture 2022, 12, 1759. [Google Scholar] [CrossRef]
  45. Zlateva, I.; Raykov, V.; Slabakova, V.; Stefanova, E.; Stefanova, K. Habitat suitability models of five keynote Bulgarian Black Sea fish species relative to specific abiotic and biotic factors. Oceanologia 2022, 64, 665–674. [Google Scholar] [CrossRef]
  46. Franklin, J.; Miller, J.A. Mapping Species Distributions: Spatial Inference and Prediction; Cambridge University Press: Cambridge, UK, 2010. [Google Scholar] [CrossRef]
  47. Gyi, M.M.; Lai, O.P.; Dikshit, A.K.; Sharma, V.P. Eficacy of insecticides for controlling ber fruit fly. Ann. Plant Prot. Sci. 2003, 11, 152–153. [Google Scholar]
  48. Geng, X.; Zhao, X.Z.; Hou, J.M.; Han, H.Z. Biological characteristics of Carpomya vesuviana and its management. Hebei For. Sci. Technol. 2010, 5, 73–75. (In Chinese) [Google Scholar]
  49. Xu, H.D.; Lei, H.J.; Li, M.; Wang, J.; Dong, X.B. China’s jujube industry development status. China Rural Sci. Technol. 2022, 4, 49–52. (In Chinese) [Google Scholar]
  50. Pan, Y.Y. Remote Sensing Monitoring for Leaf Area Index and Yield Assessment of Jujube Orchards; Tarim University: Xinjiang, China, 2024. [Google Scholar]
  51. Adil, S.; Tian, C.M.; Luo, Y.Q.; Chen, M.; Memet, A. Preliminary report on control test of Carpomya vesuviana Costa. J. Xinjiang Agric. Univ. 2010, 33, 206–209. [Google Scholar]
  52. Abduwahap, E. Research on Orientation of Adult Carpomyia vesuviana Costa. Master’s Thesis, Xinjiang Agricultural University, Ürümqi, China, 2017. [Google Scholar]
  53. Yu, F.; Kong, W.J.; Ma, J.H.; Memet, N.; Ablik, A. Occurrence of Carpomya vesuviana in Turpan and its prevention and control measures. Plant Prot. 2011, 37, 166–167. (In Chinese) [Google Scholar]
  54. Pan, F.; Xiao, T.B.; Qin, S.; Chen, H.Y.; Lin, Z.F.; Xie, S.H. Study on yield of bitter gourd damaged by Bactrocera cucurbitae and its economic thresholds. China Plant Prot. 2014, 34, 12–15. (In Chinese) [Google Scholar]
  55. Vadivelu, K. Biology and Management of ber fruit fly, Carpomyia vesuviana Costa (Diptera: Tephritidae): A review. Afr. J. Agric. Res. 2014, 9, 1310–1317. [Google Scholar]
  56. Zhang, R.Z.; Wang, X.J.; Adil, S. Identification and precaution of the ber fruit fly, Carpomya vesuviana, a quarantine pest insect in China. Chin. Bull. Entomol. 2007, 44, 928–930. [Google Scholar]
  57. Schai-Braun, S.C.; Jenny, H.; Ruf, T.; Hackländer, K. Temperature increase and frost decrease driving upslope elevational range shifts in Alpine grouse and hares. Glob. Change Biol. 2021, 27, 6602–6614. [Google Scholar] [CrossRef]
  58. Colinet, H.; Sinclair, B.J.; Vernon, P.; Renault, D. Insects in fluctuating thermal environments. Annu. Rev. Entomol. 2015, 60, 123–140. [Google Scholar] [CrossRef]
  59. Lehmann, P.; Ammunét, T.; Barton, M.; Battisti, A.; Eigenbrode, S.D.; Jepsen, J.U.; Kalinkat, G.; Neuvonen, S.; Niemelä, P.; Terblanche, J.S.; et al. Complex responses of global insect pests to climate warming. Front. Ecol. Environ. 2020, 18, 141–150. [Google Scholar] [CrossRef]
  60. Abarca, M.; Spahn, R. Direct and indirect effects of altered temperature regimes and phenological mismatches on insect populations. Curr. Opin. Insect Sci. 2021, 47, 67–74. [Google Scholar] [CrossRef]
  61. Su, C.X.; Ping, F.; Liu, X.H. Carpomya vesuviana damage and control measures. Friends Fruit Farmers 2020, 12, 36–37. (In Chinese) [Google Scholar]
  62. Nandihalli, B.S.; Patil, D.R.; Jagginavar, S.B.; Biradar, A.P.; Guled, M.B.; Surkod, V.S. Incidence of fruit borer (Meridarchis scyrodes Meyr.) and fruit fly (Carpomyia vesuviana Costa) on different varieties of ber. Adv. Agric. Res. India 1996, 6, 13–18. [Google Scholar]
  63. Lv, W.G.; Lin, W.; Li, Z.H.; Geng, J.; Wan, F.H.; Wang, Z.L. Potential geographic distribution of Ber fruit fly, Carpomya vesuviana Costa. Plant Quar. 2008, 22, 343–347. [Google Scholar]
  64. Lakra, R.K.; Zile, S. Seasonal fluctuations in incidence of ber fruit fly Carpomyia vesuviana Costa (Diptera: Tephritidae) under agro-climatic conditions of Hisar. Haryana Agric. Univ. J. Res. 1985, 15, 42–50. [Google Scholar]
  65. Gaur, R.K.; Kumar, M.; Sharma, S.; Yadav, B.S. Survey studies on insects and non-insect pest associated with ber crop in South West Haryana. J. Entomol. Zool. Stud. 2020, 8, 856–863. [Google Scholar]
  66. Zimmermann, H.; Brandt, P.; Fischer, J.; Welk, E.; von Wehrden, H. The Human Release Hypothesis for biological invasions: Human activity as a determinant of the abundance of invasive plant species. F1000Research 2014, 3, 109. [Google Scholar] [CrossRef]
  67. Ding, J.T.; Adil, S.; Zhu, H.F.; Yu, F.; Alimasi, A.; Luo, L. Flight capacity of adults of the ber fruit fly, Carpomya vesuviana (Diptera: Tephritidae). Acta Entomol. Sin. 2014, 57, 1315–1320. [Google Scholar]
  68. Hulme, P.E. Unwelcome exchange: International trade as a direct and indirect driver of biological invasions worldwide. One Earth 2021, 4, 666–679. [Google Scholar] [CrossRef]
  69. Morris, J.; Sokolov, A.; Reilly, J.; Libardoni, A.; Forest, C.; Paltsev, S.; Schlosser, C.A.; Prinn, R.; Jacoby, H. Quantifying both socioeconomic and climate uncertainty in coupled human–Earth systems analysis. Nat. Commun. 2025, 16, 2703. [Google Scholar] [CrossRef]
  70. Sharma, H.; Ehlers, T.A.; Glotzbach, C.; Manuel, S.; Katja, T. Effect of rock uplift and Milankovitch timescale variations in precipitation and vegetation cover on catchment erosion rates. Earth Surf. Dynam. 2021, 9, 1045–1072. [Google Scholar] [CrossRef]
  71. Ahnert, F. Some comments on the quantitative formulation of geomorphological processes in a theoretical model. Earth Surf. Processes. 1977, 2, 191–201. [Google Scholar] [CrossRef]
  72. Amini, A.; Lotfalizadeh, H.; Peris-Felipo, F.J.; Rasplus, J.-Y. Potential parasitoids for biocontrol of the Ber fruit fly, Carpomya vesuviana Costa (Diptera: Tephritidae). Life 2023, 14, 50. [Google Scholar] [CrossRef] [PubMed]
  73. Basha, J.M.G. Experiments on the control of the fruit borers of jujube (Zizyphus spp.), Carpomyia vesuviana Costa and Meridarchia scyrodes Meyr. in South India. Indian J. Entomol. 1953, 14, 229–238. [Google Scholar]
  74. Bale, J.S.; Masters, G.J.; Hodkinson, I.D.; Awmack, C.; Bezemer, T.M.; Brown, V.K.; Butterfield, J.; Buse, A.; Coulson, J.C.; Farrar, J.; et al. Herbivory in global climate change research: Direct effects of rising temperature on insect herbivores. Glob. Change Biol. 2002, 8, 1–16. [Google Scholar] [CrossRef]
  75. Guo, S.; Ge, X.; Zou, Y.; Zhou, Y.; Wang, T.; Zong, S. Projecting the Potential Global Distribution of Carpomya vesuviana (Diptera: Tephritidae), Considering Climate Change and Irrigation Patterns. Forests 2019, 10, 355. [Google Scholar] [CrossRef]
  76. Masson-Delmotte, V.; Zhai, P.; Pirani, A.; Connors, S.L.; Péan, C.; Berger, S.; Caud, N.; Chen, Y.; Goldfarb, L.; Gomis, M.I.; et al. (Eds.) Climate Change 2021: The Physical Science Basis. Contribution of Working Group I to the Sixth Assessment Report of the Intergovernmental Panel on Climate Change; Cambridge University Press: Cambridge, UK; New York, NY, USA, 2021; p. 2391. [Google Scholar]
  77. De Lima, I.S.; Degrande, P.E.; Miranda, J.E.; dos Santos, W.J. Evaluation of the boll weevil Anthonomus grandis Boheman (Coleoptera: Curculionidae) suppression program in the State of Goiás, Brazil. Neotrop. Entomol. 2013, 42, 82–88. [Google Scholar] [CrossRef]
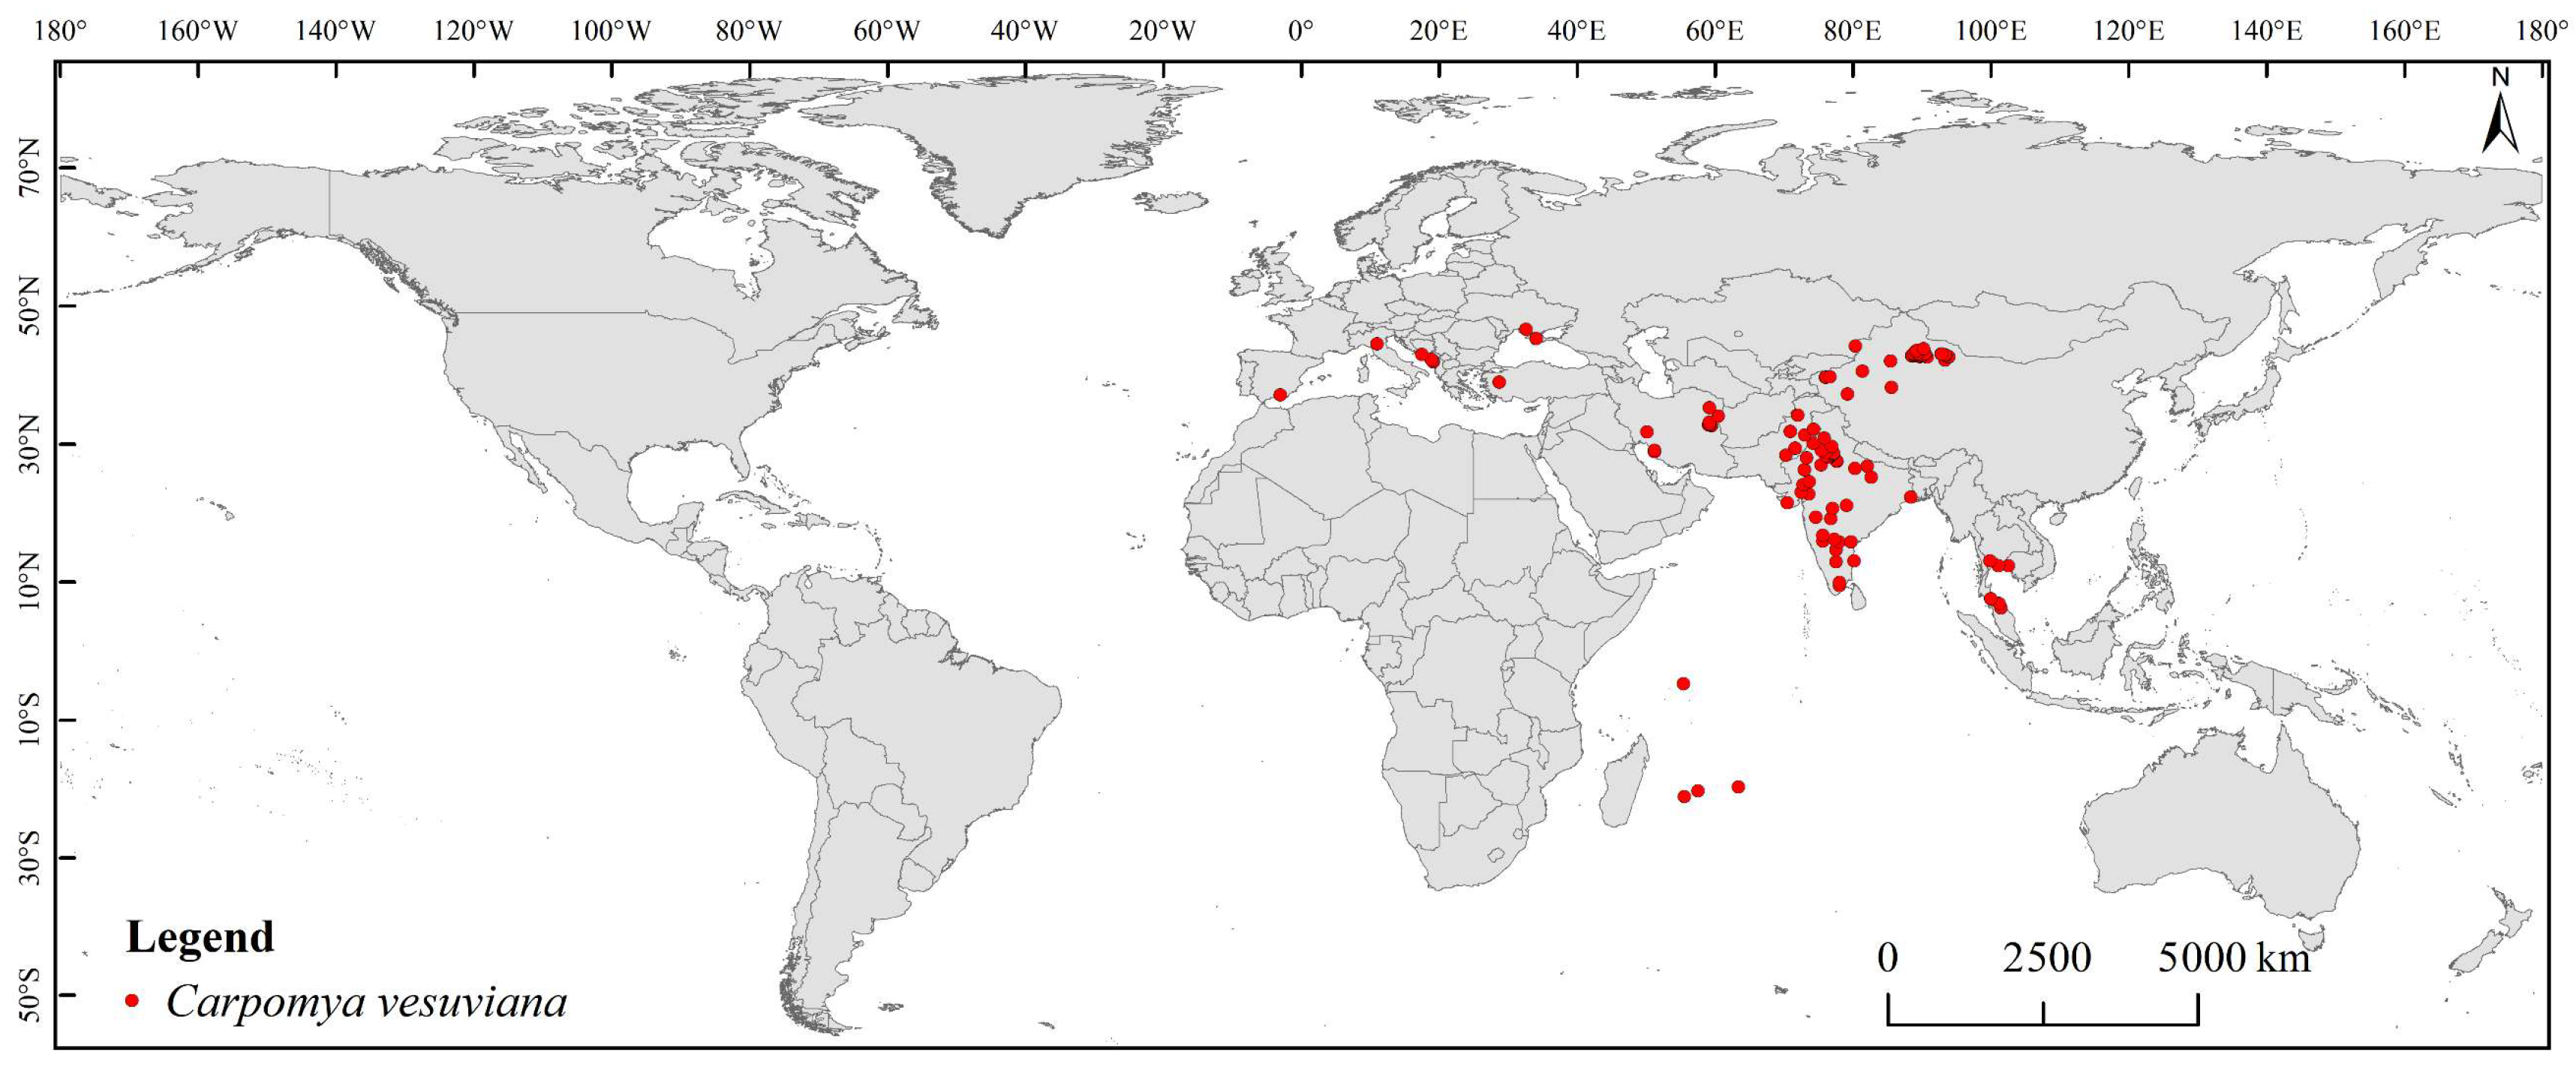
Figure 1. Global occurrence records of Carpomya vesuviana.
Agriculture 15 02081 g001
Figure 2. Optimization under different settings (L-linear, P-product, Q-quadratic, H-hinge) (A) and mean AUC values of Carpomya vesuviana MaxEnt model (B).
Agriculture 15 02081 g002
Figure 3. Percentage contribution (A) and jackknife method (B) for the ten influential factors affecting the presence probability of Carpomya vesuviana.
Agriculture 15 02081 g003
Figure 4. Potential suitable habitats of Carpomya vesuviana under current climate (A) and suitable habitat areas (B).
Agriculture 15 02081 g004
Figure 5. Potential suitable habitats of Carpomya vesuviana under future climatic scenarios: (A) 2050s, SSP1–2.6; (B) 2050s, SSP2–4.5; (C) 2050s, SSP5–8.5; (D) 2070s, SSP1–2.6; (E) 2070s, SSP2–4.5; (F) 2070s, SSP5–8.5.
Agriculture 15 02081 g005
Figure 6. Changes in potential suitable habitats of Carpomya vesuviana under future climatic scenarios: (A) 2050s, SSP1–2.6; (B) 2050s, SSP2–4.5; (C) 2050s, SSP5–8.5; (D) 2070s, SSP1–2.6; (E) 2070s, SSP2–4.5; (F) 2070s, SSP5–8.5.
Agriculture 15 02081 g006
Figure 7. Economic loss of the jujube industry caused by Carpomya vesuviana under the no-control and control scenarios and could be recovered after controlling (unit: CNY 100 million).
Agriculture 15 02081 g007
Table 1. Potential economic loss assessment model and parameters of Chinese jujube industry caused by Carpomya vesuviana.
ScenarioEvaluation ItemsInput VariableModel and Parameter
Non control scenarioEconomic loss caused by production decline (F1)Production of jujubes in suitable area (Q1)Pert (23.71, 24.31, 24.91) × 108 kg
Damage rate to jujubes (I)Pert (36.67%, 46.67%, 60.00%)
Loss rates after damage (R)Pert (20.00%, 30.00%, 40.00%)
Market price of jujubes (Pa)Pert (11.50, 18.00, 24.50) CNY/kg
Economic loss caused by production decline (F1)F1 = Q1 × I × R × Pa/(1 − IR)
Economic loss caused by quality decline (F2)Production of jujubes in suitable area (Q1)Pert (23.71, 24.31, 24.91) × 108 kg
Price of jujubes after the quality decline (Pb)Pert (5.95, 8.73, 11.50) CNY/kg
Economic loss caused by quality decline (F2)F2 = Q1 × I × (1 − R) (Pa − Pb)/(1 − IR)
Economic loss under the no control scenario (F3)F3 = F1 + F2
Control scenarioControl costs (F4)Planting area of jujubes in suitable area (S)Pert (48.33, 54.24, 60.15) × 104 hm2
Unit cost of control (C)Pert (175.21, 182.66, 190.10) CNY/hm2
Control costs (F4)F4 = S × I × C
Economic loss after control (F5)Unit yield of jujubes in suitable area (A)A = Q1/S kg/hm2
Control effects (M)Pert (92.37%, 93.69%, 95.00%)
Efficiency correction coefficient (D)2
Allowable level of economic damage (E)E = C/(A × Pa × M) × D × 100%
Economic loss after control (F5)F5 = Q1 × I × E × Pa/(1 − IE) + Q1 × I × (1 − E) × (Pa − Pb)/(1 − IE)
Economic loss under the control scenario (F6)F6 = F4 + F5
Losses saving after control (F7)F7 = F3 − F6
Disclaimer/Publisher’s Note: The statements, opinions and data contained in all publications are solely those of the individual author(s) and contributor(s) and not of MDPI and/or the editor(s). MDPI and/or the editor(s) disclaim responsibility for any injury to people or property resulting from any ideas, methods, instructions or products referred to in the content.