1. Introduction
Natural rubber milk is one of the four most important and scarce industrial materials, along with steel, oil, and coal, and it is a raw material used in more than 70,000 products due to its excellent resilience, electrical insulation, wear resistance, air tightness, and flexibility [
1]. Moreover, the global demand for natural rubber milk is still quickly rising, and it is not being satisfied by natural latex production [
2]. Natural rubber milk is obtained from the latex tubes of rubber trees through regular tapping, and rubber plantations are mostly located in hilly and mountainous areas with uneven terrain. In these regions, manual inspection and harvesting are limited by poor accessibility and high labor demands [
3]. However, traditional production processing remains heavily reliant on manual intensive labor for bark cutting and yield inspection, and it requires skilled tapping and collection workers under a bad working environment at night-time in the forest. Thus, the labor shortage corresponding with aging is a critical bottleneck in the natural rubber milk industry. Luckily, such challenges are typically addressed by replacing manual labor with automated agricultural robotic systems, like both “one tree one machine” (OTOM) fixed-position and mobile rubber tapping robots [
4].
Unmanned and automatic tapping robots are generally concentrated on the tapping procedure in terms of tapping depth, tracing, start points via RGB, and Lidar-based vision [
5]. The OTOM fixed robot is attached to one rubber tree and automatically taps the tree following the previous tapping tracing, lines, and depth [
6] every three or four days. Meanwhile, the mobile robot is carried by a tapping machine, and it travels among the trees, tapping a tree with the assistance of tapping line image recognition and spatial control [
7]. The tapping robots are triggered by fixed time-counter control, and they start the tapping operation guided by images [
8] or laser scanning 3D points to achieve precise trajectory fitting, with strong adaptability to trees with irregular diameters and complex surface structures [
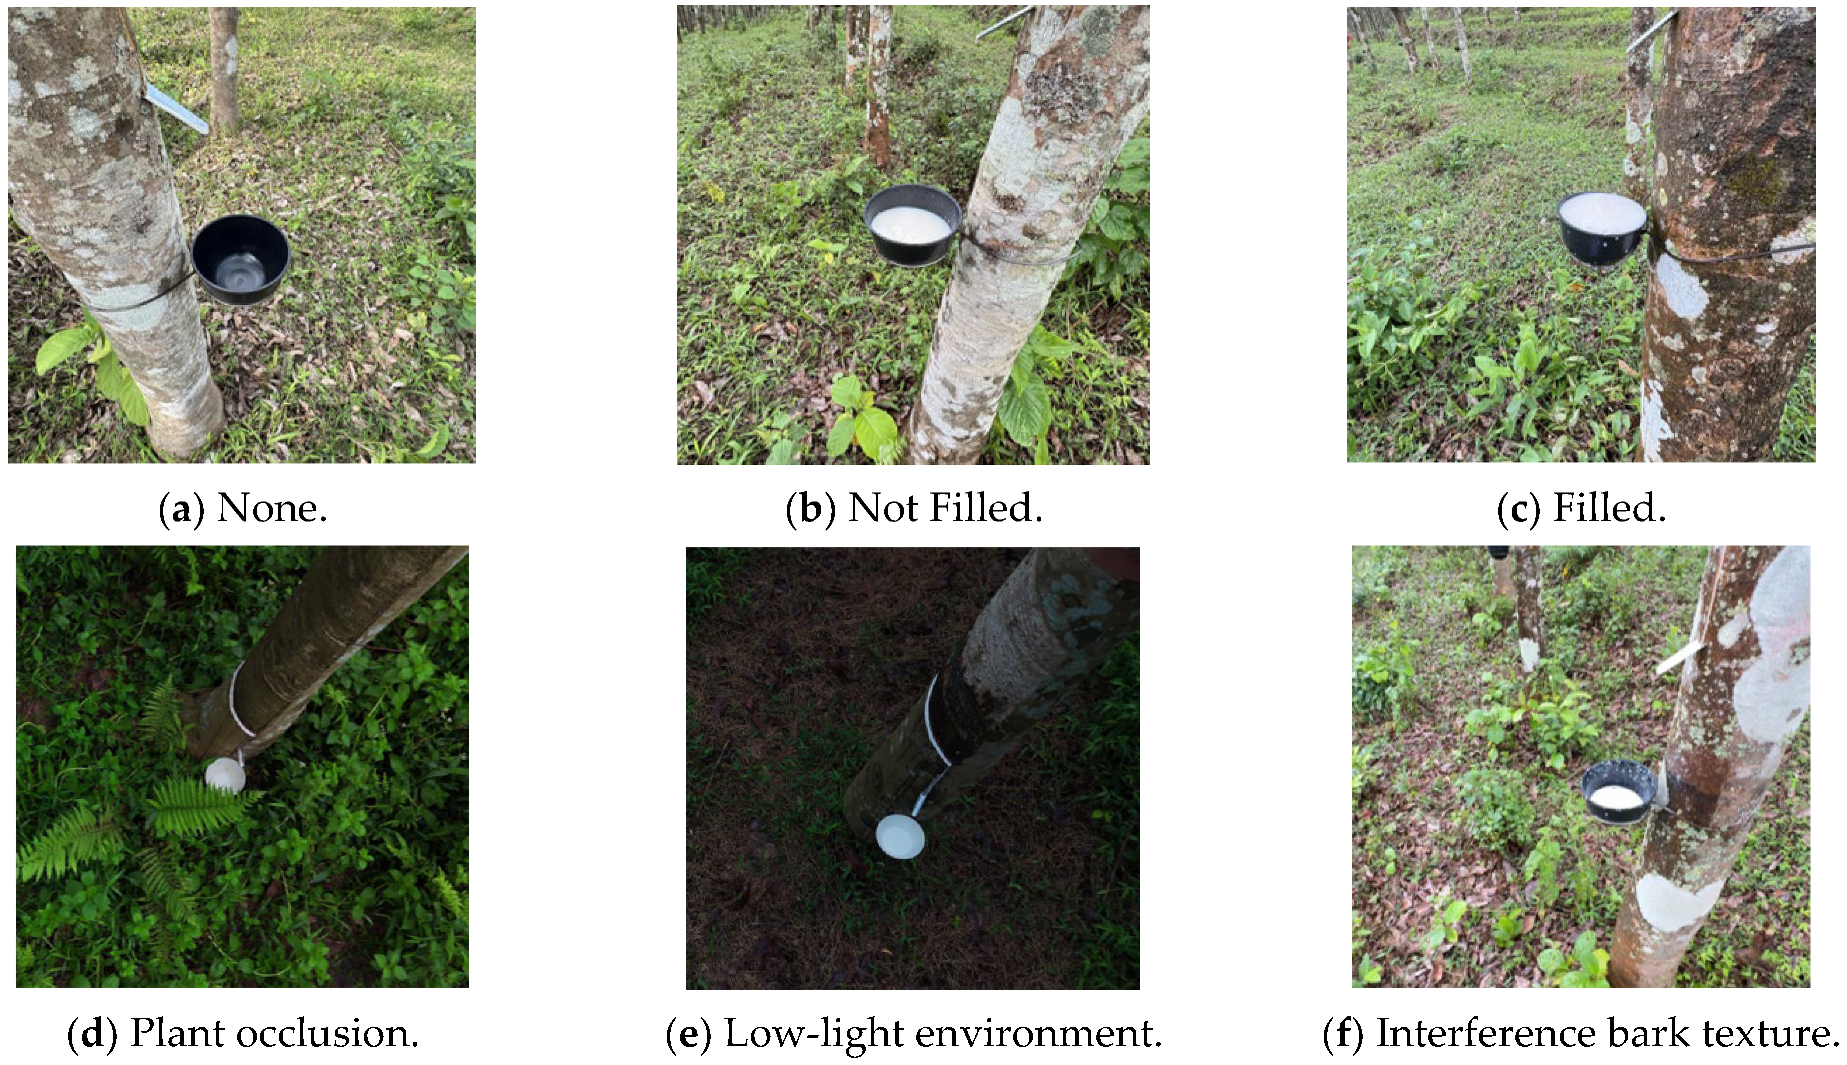
9]. However, current OTOM and mobile tapping robots primarily focus on tasks such as tapping path planning and initial line positioning, while the perception of rubber milk collection status remains underexplored. Actually, in a real scenario of large-scale robots, the failure to recognize the remaining rubber milk in the rubber milk bowl (RMB) may easily result in rubber milk overflow or the repeated tapping of trees, leading to resource waste and reduced production efficiency. After tapping, rubber milk naturally flows into the rubber milk bowl through the incision, forming a visible liquid level. Based on the height of the rubber milk, the yield status of each rubber milk bowl can be classified into three categories: empty, partially filled, and full. So, the state of RMB, like filled and unfilled, is one of the key issues facing unmanned robot tapping robot management, especially related to robots’ decision of the suitable time of starting and natural latex harvest.
The status of RMB can be determined by images from different scales of ground vehicles, satellites, and unmanned aerial vehicles (UAVs) [
10]. Conventional approaches to rubber milk bowl image recognition typically involve mounting cameras directly onto tapping machines. However, such configurations face practical challenges for both OTOM and Mobility. For example, each unit of OTOM with an independent vision system can significantly increase equipment costs and energy consumption in a large-scale plantation. And mobile tapping robots often encounter operational limitations in complex terrains, including difficulty in adjusting camera angles and frequent target occlusion. On the other hand, satellite-based imagery for the rubber yield prediction has been explored [
11] to estimate monthly rubber production at the plantation scale, with the overarching goal of stabilizing national rubber prices [
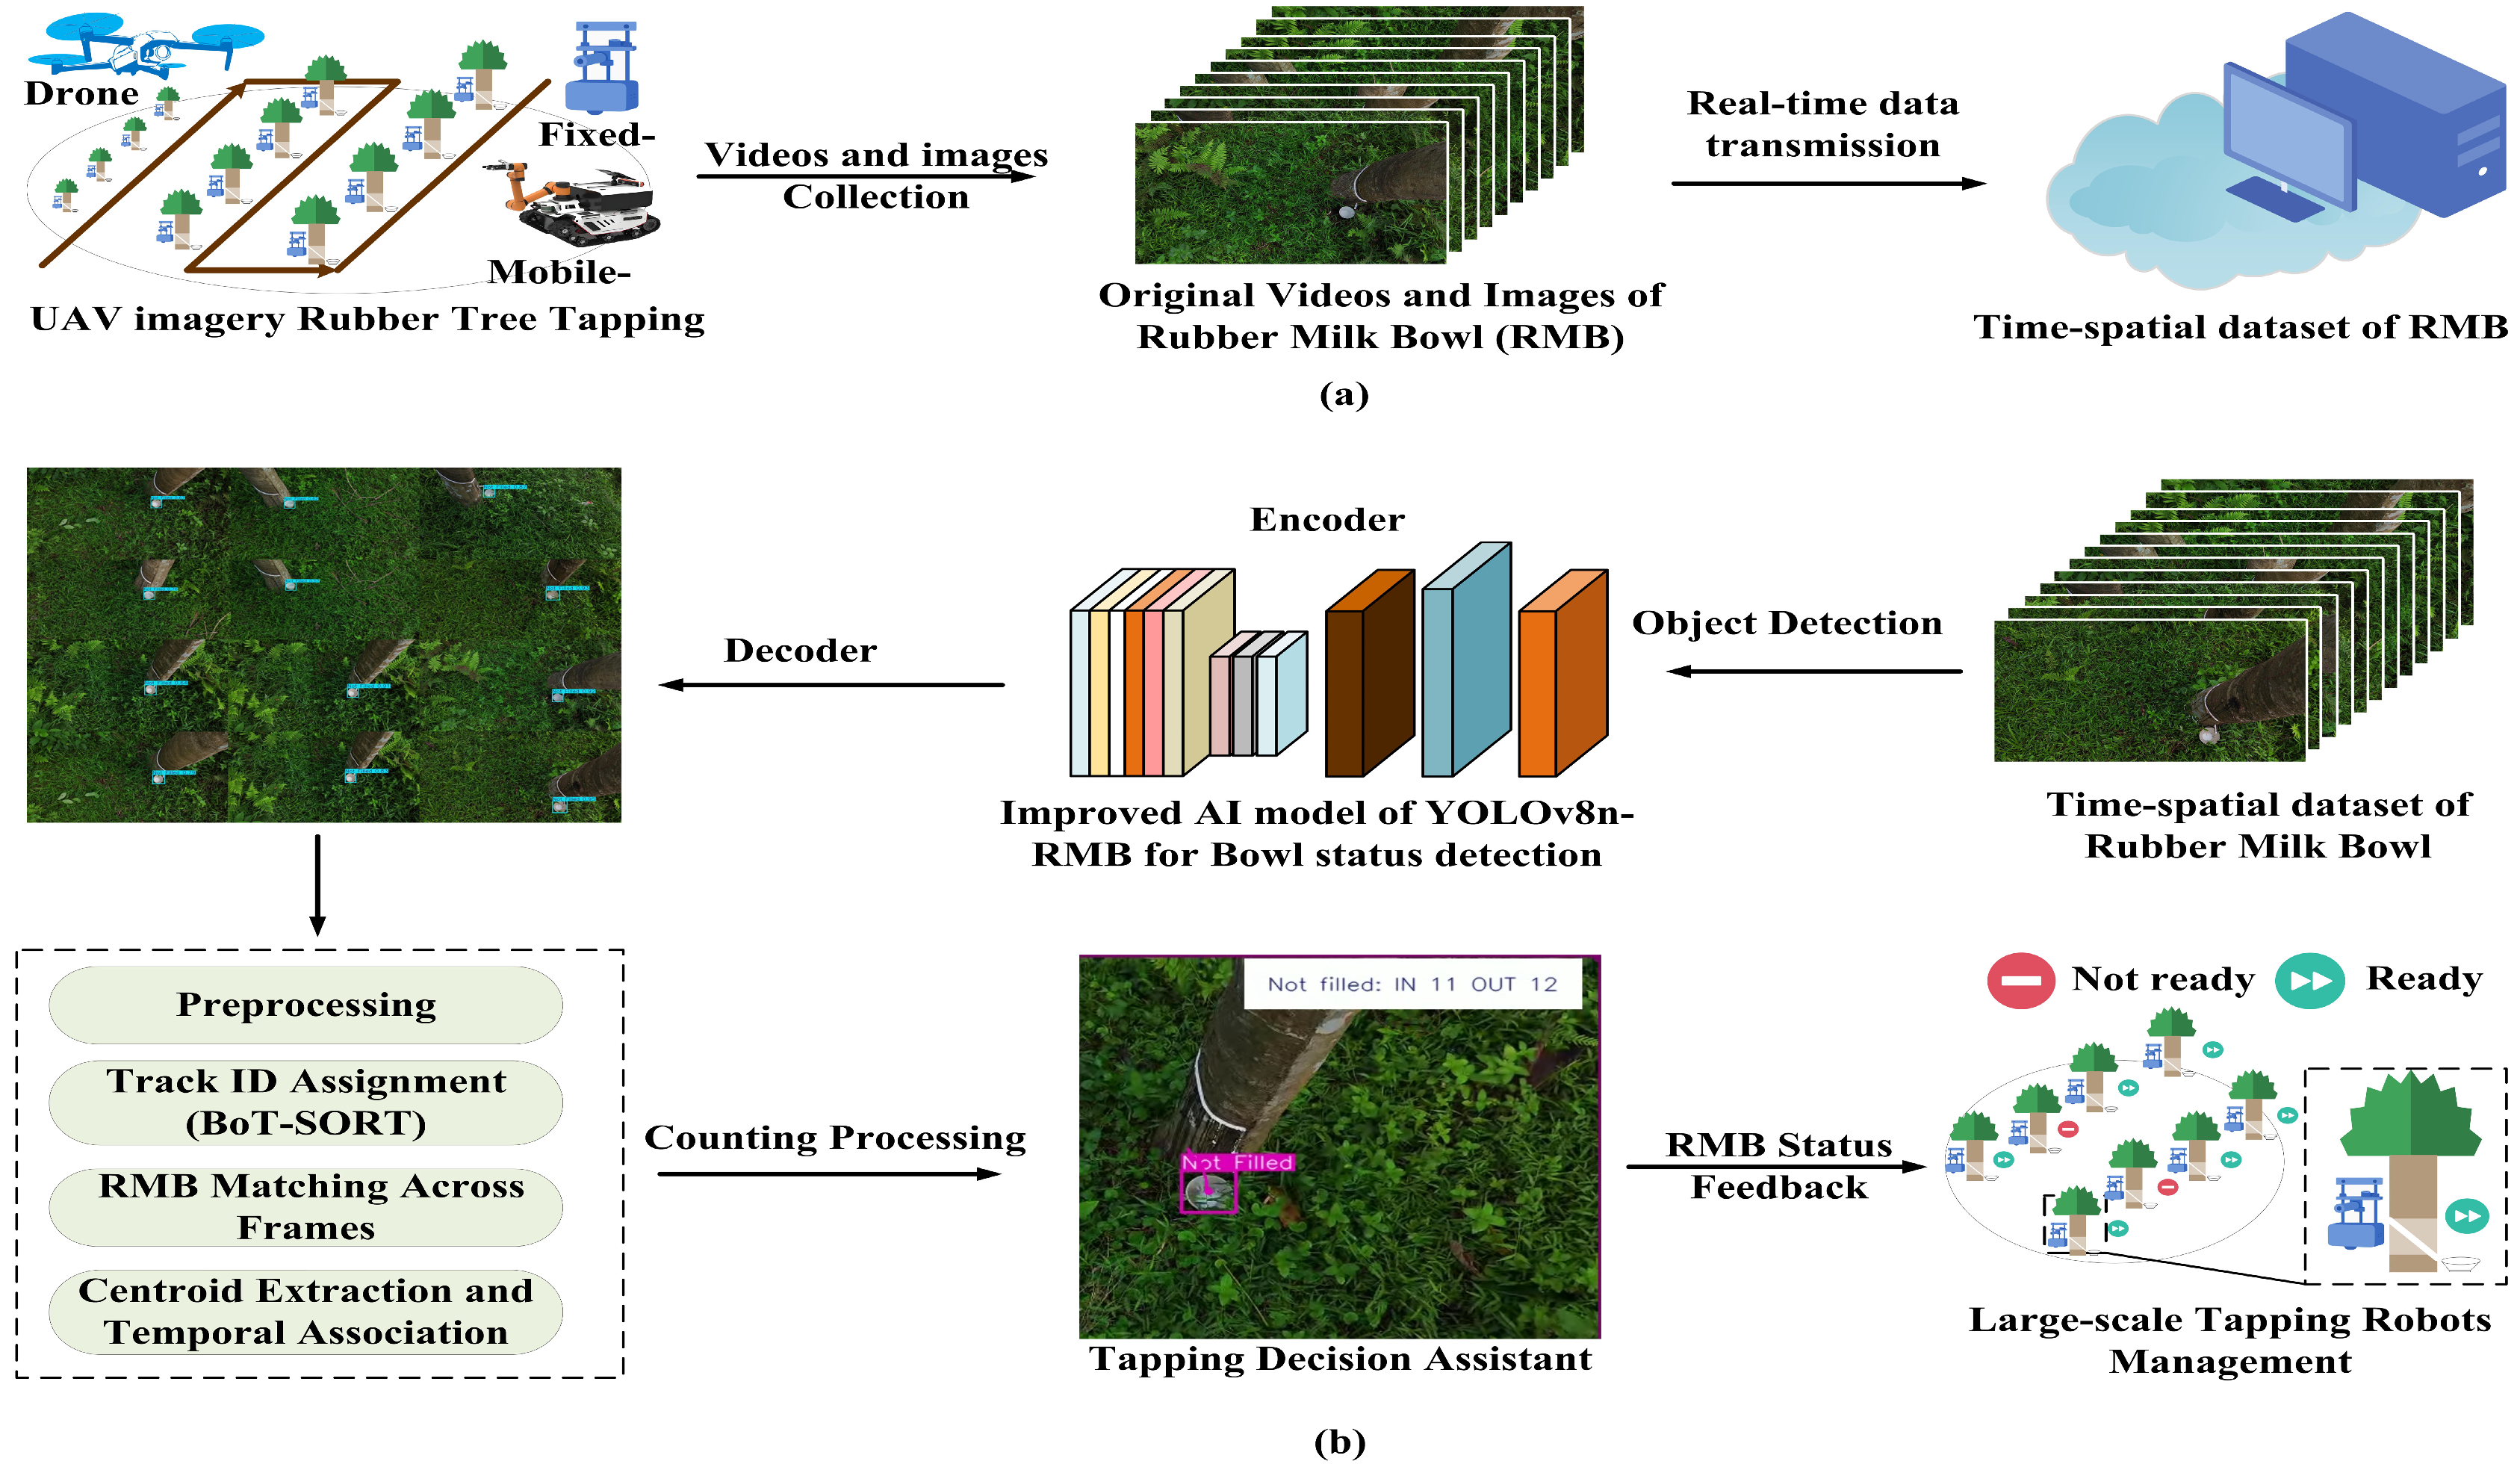
12]. But such methods suffer from limited real-time applicability and relatively low accuracy, rendering them unsuitable for daily rubber milk collection monitoring at the individual farmer level. To overcome these issues, a UAV-based low-altitude visible-light imaging could be a suitable potential solution for efficient, cost-effective, and non-contact yield recognition of rubber milk bowls in hilly and forested areas. The scenarios are shown in
Figure 1a. By integrating UAV imagery with computer vision algorithms to extract rubber milk level features, an artificial intelligence model can automatically determine the current yield status of each bowl. This enables precise localization and quantification of harvestable targets, providing robust perception support for intelligent rubber tapping systems.
UAV-imagery crop detection and counting by combining machine vision methods have been successfully applied, like tree crown defoliation by extracting vegetation indices from multispectral imagery [
13], and estimating equivalent water thickness in wheat under field conditions [
14]. These early works of target detection and counting exhibit poor robustness to complex backgrounds and varying lighting conditions, limited generalizability across crop varieties, and reduced computational efficiency in high-resolution imaging environments. And the base models of You Only Look Once (YOLO) have been improved to address these challenges by changing and modifying network structures. The UAV-based imaging method has been deployed in oil palm fruit detection [
15], cotton crop [
16], pine tree disease identification [
17], and pine tree disease detection [
18]; in improving YOLOv3 for strawberries flowering and fruit counting [
19]; and in localization and accurate counting of peanut seedlings through frame-by-frame analysis via improved YOLOv8 [
20]. These UAV imagery recognition works provide technical models and a base for rapid dynamic monitoring and large-scale rubber bowl detection and counting.
The UAV imagery and target detection models have specific requirements in terms of the features of procedures, robot control, RMB, and the environment, as shown in
Figure 1b. Generally, a rubber milk harvesting process contains several tasks: in Task 1, the UAV captures the images and video the RMB and recognizes the status; in Task 2, the tapping robots, including fixed and mobile, take action according to tapping decision from the Task1; in Task 3, the tapping robots are selected to start working and the harvest robots to collect the milk in RMB. In real scenarios, since RMBs typically have a dark color, visual confusion often arises between the bowls and background elements, such as fallen leaves and tree trunks, which share similar chromatic features. This color similarity increases the likelihood of false detections. Moreover, the subtle visual differences between the “Not Filled” and “Filled” states frequently lead to mutual misclassification, thereby complicating the accurate assessment of rubber yield status. Thus, this work is expected to explore the RMB yield status counting method based on the improved YOLOv8n-RMB model using real-time drone images to accurately identify the yield status under the influence of the complex background of rubber forests, for the unmanned tapping industry. The main contributions are listed below:
- (1)
An original and novel dataset for detecting rubber milk bowls to support large-scale tapping robot control is built and reported. As the best as we know from the literature review, this work is the first to capture and present UAV imagery of natural rubber milk in the hilly and mountainous forests.
- (2)
An improved YOLOv8n-RMB is presented for real-time natural rubber milk status recognition. The proposed model integrates the receptive field attention convolution (RFACONV) module, replaces the bidirectional feature pyramid network (BiFPN), and introduces the dynamic sampling module DySample into the upsampling stage.
- (3)
A pilot experiment of UAV imagery RMB target detection is implemented in real scenarios. The proposed YOLOv8n-RMB can be used in computing consumption devices and count and predict the rubber milk in real time.
3. Improvement in YOLOv8n-RMB Network
3.1. The Improved Network Architecture of YOLOv8n-RMB
The YOLOv8n-RMB integrates three core modules: RFACONV, BiFPN, and DySample. This design maintains model compactness while improving detection accuracy. The model performs well in identifying the three states of RMBs—empty, partially filled, and fully filled—under various complex field conditions. The overall network structure of YOLOv8n-RMB is shown in
Figure 5.
3.2. Improvement in Backbone Network
In YOLOv8, standard convolution operations use the same parameters for all receptive fields. Feature information is extracted through convolutional kernels without considering positional variation. This uniform approach often causes redundant information to appear in the extracted data. The introduction of spatial attention mechanisms allows models to focus on salient features [
23,
24,
25]. This improves the network’s ability to capture fine-grained feature representations.
At present, spatial attention mechanisms such as the Convolutional Block Attention Module (CBAM) and Channel Attention (CA) are widely used to improve the performance of convolutional neural networks. The structures of CA and CBAM are shown in
Figure 6. However, these spatial attention mechanisms mainly focus on spatial features and do not effectively handle the issue of parameter sharing in convolutional kernels.
To overcome the limitations of existing spatial attention approaches, this study introduces a novel receptive field attention convolution [
26] (RFAConv). RFAConv not only emphasizes the importance of distinct features within the receptive field window but also prioritizes the spatial features of receptive fields, effectively addressing the problem of parameter sharing in convolution operations [
27]. As shown in
Figure 7, the RFAConv structure uses 3 × 3 convolutional kernels. In this structure, C, H, and W represent the number of channels, input height, and input width, respectively. “3 × 3 Group Conv” refers to a 3 × 3 group convolution operation, and “AvgPool” represents an average pooling operation.
First, the convolution layer applies an initial convolution to the input features to extract low-level information and produce a preliminary feature map, and the model adjusts the contribution of each feature based on this map to better capture the most important information in the input. The feature weights are then updated through a reweighting mechanism. Next, average pooling is used to aggregate the global information of each receptive field to reduce the computational overhead caused by the interaction between features, nd a 1 × 1 group convolution is applied to enable information interaction, and Softmax is used afterward to emphasize the importance of features within each receptive field.
In general, the computation of receptive field attention (RFA) can be expressed as follows:
where
represents a grouped convolution of size
, and
represents the convolution kernel size, Norm represents normalization,
represents the input feature map, and
is obtained by multiplying the attention map Arf with the transformed receptive field space feature
. Compared with traditional convolutional attention modules, RFA generates attention maps for individual receptive field features.
3.3. Improvement in Neck Network
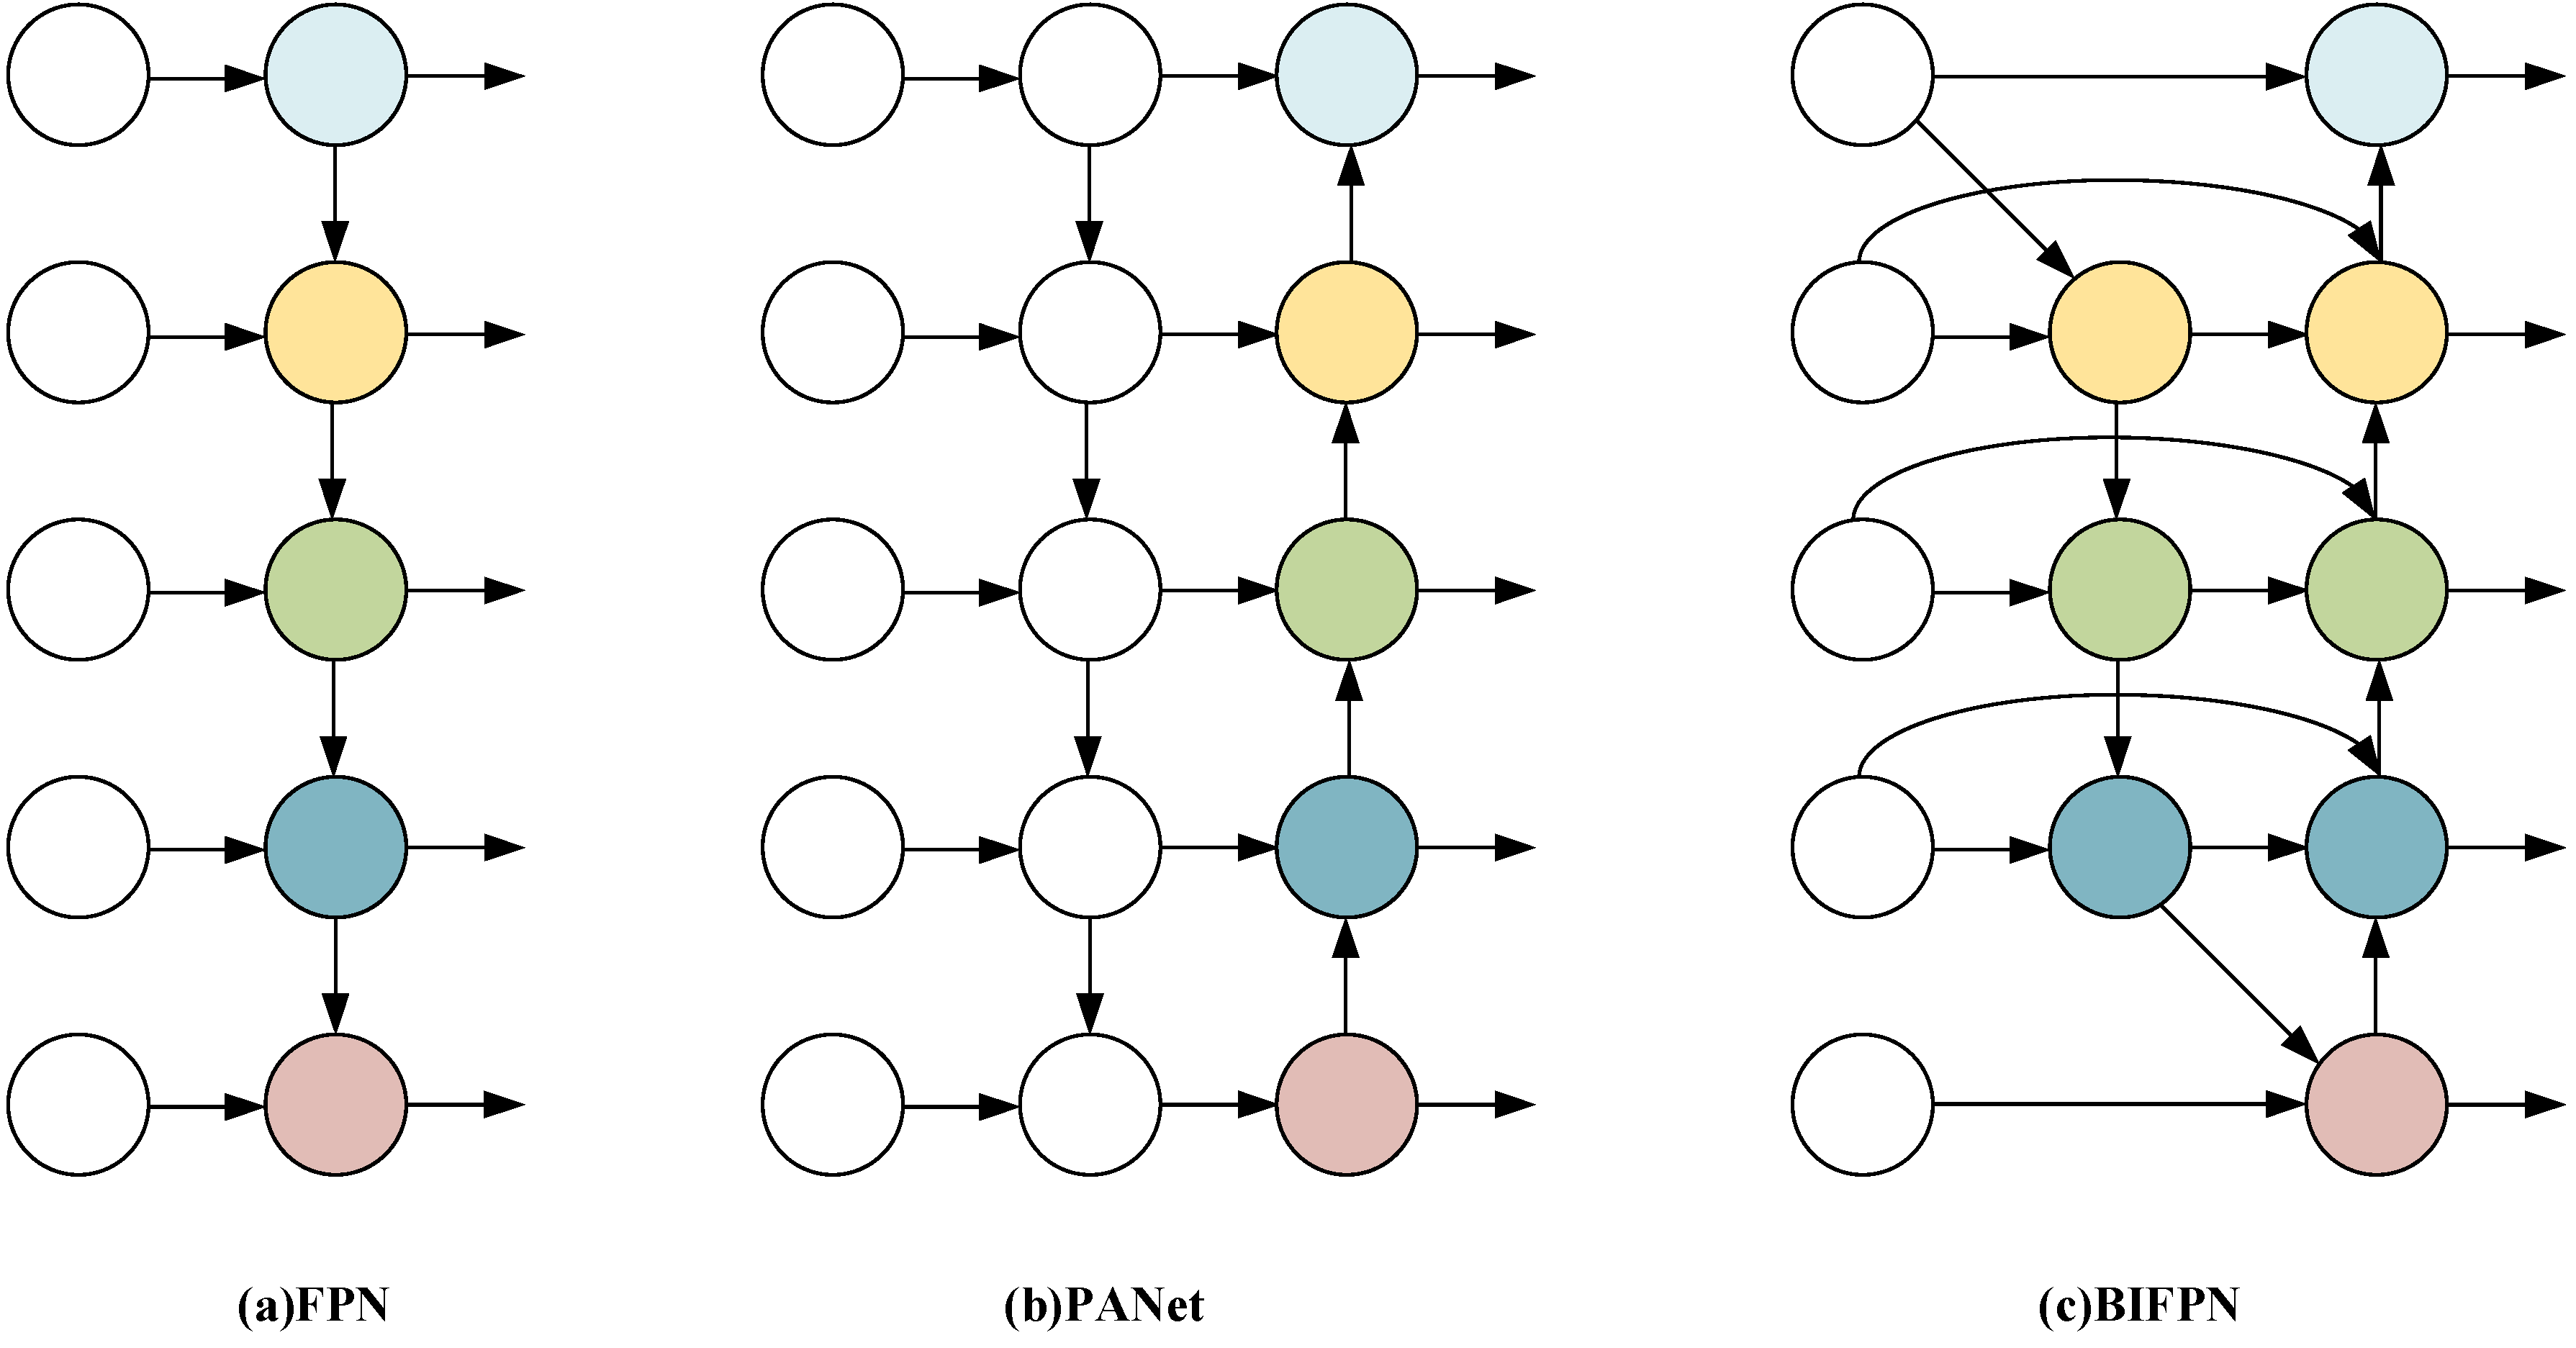
Feature fusion is important in target detection tasks and helps combine information from different scales to improve detection accuracy. Traditional FPN combines features across levels (P3 to P7) using a top-down information flow, as shown in
Figure 8a. However, due to the characteristics of unidirectional transmission, FPN has certain limitations in processing positioning information, which easily leads to the loss of spatial details. To this end, the path aggregation network (PANet) introduces a bottom-up path based on FPN to form a bidirectional information flow, as shown in
Figure 8b, which effectively compensates for the lack of positioning features and enriches semantic features. In YOLOv8, the feature extraction network adopts a combination of FPN and PANet, and improves the representation of the feature pyramid through feature fusion of P4-N4 and P5-N5. However, the PAN-FPN structure still suffers from several limitations in the context of RMB detection under complex background conditions, including feature redundancy, insufficient utilization of shallow features, and low feature reuse efficiency. These shortcomings reduce the model’s ability to capture key cues such as bowl edge contours and subtle differences in yield states.
To solve the above limitations, this paper introduces a bidirectional feature pyramid network [
28] (BiFPN), whose structure is shown in
Figure 8c. BiFPN was proposed by Google in EfficientDet to improve the transfer and combination of features across different scales. It introduces a bidirectional structure that allows information to move both upward and downward between layers and applies learnable weights to adjust the contribution of each input during feature merging. Compared with PANet, BiFPN uses a simpler structure and eliminates nodes that have only one input, which helps reduce unnecessary computations. At the same time, new paths are introduced that link input and output features within the same resolution layer, which further improves the diversity and quality of the fused features. In addition, BiFPN introduces a weighted fusion mechanism, which avoids the information loss problem caused by simple feature superposition by assigning learnable weights to different input features, and adopts a fast normalization method to improve training speed and data consistency.
The integration of BiFPN not only preserves the advantages of both FPN and PAN structures but also enhances feature interaction through the addition of two lateral pathways. The introduction of the P2 layer provides higher-resolution feature maps, which are beneficial for capturing fine-grained details such as RMB edges and yield states. Furthermore, the repeated two-way feature pathways in BiFPN support full multi-scale integration, which improves the model’s response to state changes and increases classification accuracy in complex background conditions. In summary, BiFPN offers a structurally simple yet computationally efficient feature fusion strategy, making it an effective architectural enhancement for addressing the challenges posed by environmental variability and inter-class similarity in rubber plantations. This provides essential support for intelligent agricultural tasks, including yield estimation and automated RMB counting.
3.4. Improvement in Upsampling Module
To effectively balance the semantic information of deep features with the spatial information of shallow features during the feature fusion stage, neural networks typically employ upsampling operations to restore spatial resolution. In the original YOLOv8 architecture, bilinear interpolation is commonly used for upsampling, where sampling locations are fixed and independent of the input image content. This static interpolation strategy presents limitations in complex scenes or for irregular objects, as it fails to adapt sampling based on the characteristics of the feature map, thereby compromising the precision and robustness of feature fusion.
To solve this problem, the DySample mechanism is introduced to adjust the upsampling process in YOLOv8 based on input feature characteristics [
29]. DySample dynamically generates sampling locations based on feature content. Its core concept lies in learning spatial offsets for each pixel in the input feature map to adaptively adjust sampling positions. Specifically, DySample first transforms the input features via a linear layer to generate displacement offsets, which are then multiplied by a scaling factor to compute relative coordinate shifts. These are embedded into the feature map using a pixel shuffle operation and added to the base sampling coordinates to obtain dynamic sampling positions. Feature resampling is subsequently performed using grid sampling based on these coordinates.
As illustrated in
Figure 9, the DySample module consists of key components such as the input feature map, linear transformation layer, offset computation, pixel shuffle, and grid sampling. Unlike fixed interpolation methods, DySample adjusts the upsampling strategy based on image content. This approach is effective in complex backgrounds, unstructured environments, and cases involving uneven target distribution. In rubber plantations and other natural environments, DySample improves the model’s ability to adapt to uneven terrain and detect edge objects. This leads to more accurate feature restoration and fusion, resulting in balanced and detailed feature representations.
3.5. Real-Time Video Counting Algorithm
This study developed a video analysis system that integrates the YOLOv8n-RMB model with the BoT-SORT algorithm to achieve automated detection, state recognition, and accurate counting of RMBs in UAV aerial videos. The system first establishes a stable video streaming platform by configuring an NGINX server with the RTMP module, which streams real-time plantation footage captured by the UAV to the server using the RTMP protocol, ensuring low-latency and high-frame-rate video input. Subsequently, the detection script utilizes multimedia processing libraries such as OpenCV and FFmpeg, and employs cv2. VideoCapture to continuously acquire frames from the RTMP stream, thereby providing real-time input for the target analysis module. For each frame, the optimized YOLOv8n-RMB model is applied to detect RMB targets and classify their yield status into three categories: empty, partially filled, and fully filled. The BoT-SORT (ByteTrack with Transformer-enhanced appearance features) multi-object tracking algorithm is then used to assign a unique identifier (ID) to each target. By leveraging motion trajectories and appearance features, the algorithm achieves robust cross-frame association and tracking, ensuring coherent and stable target trajectories under complex plantation backgrounds. Based on the identified status of each bowl, the model draws corresponding bounding boxes and labels while maintaining a record of its historical positions and recognition states.
To ensure accurate counting, the system predefines reference lines or zones in the video frames. When a detected target crosses these boundaries or is consistently classified as “Fully Filled” over consecutive frames, it is added to the count of RMBs ready for collection, effectively minimizing duplicate counting. All processed frames are displayed in real time on the front-end interface with detection and counting results and optionally stored as video files for traceability and accuracy verification. By integrating detection, recognition, tracking, and counting functionalities, this system provides a comprehensive and efficient video-based intelligent processing solution for unmanned rubber milk collection operations.
3.6. Experimental Environment and Model Evaluation Indicators
3.6.1. Experimental Environment
The experiments in this study were implemented using the open-source machine learning framework PyTorch 1.11. The hardware environment consisted of an Intel® Xeon® Platinum 8352V CPU @ 2.10 GHz, 64 GB of RAM, and an NVIDIA RTX 4090 GPU with 24 GB of video memory, operating under CUDA 11.3. The software platform was based on Ubuntu 18.04 with Python 3.8.
Model training was conducted over 100 epochs with a batch size of 32. The initial learning rate was set to 0.01, while the momentum parameter was configured at 0.937 to accelerate convergence and suppress oscillation. Furthermore, a weight decay coefficient of 0.0005 was applied to prevent overfitting by penalizing large weights during optimization.
3.6.2. Model Evaluation Indicators
The evaluation of model performance in this study is based on both detection accuracy and inference efficiency. Specifically, precision (P), recall (R), Average Precision (AP), and mean Average Precision (mAP) are adopted as the primary metrics to assess detection accuracy. In addition, to evaluate the inference speed with respect to hardware constraints, model parameters, floating point operations (GFLOPs), frames per second (FPS), and latency are used as the main speed-related indicators. The calculation formulas for precision, recall, AP, and mAP are defined as follows:
In the equations, is the number of true positives, is the number of false positives, and is the number of false negatives. Let be the precision at each recall level. is the total number of object classes, and is the average precision for class . is the ratio of true positives to all predicted positives—it reflects how well the model avoids false positives. is the ratio of true positives to all actual targets. It shows the model’s ability to reduce missed detections. is the area under the precision–recall curve. It is calculated by summing precision over different recall thresholds. is the average of over all classes. It is often used to measure object detection performance. A higher means better accuracy and stability.
4. Results and Discussion
4.1. Comparison of Model Before and After Improvement
To further evaluate the performance of the proposed YOLOv8n-RMB model, this study compares the training loss curves of the original YOLOv8n and the improved YOLOv8n-RMB. Loss curves show how the loss function changes across training epochs. They help assess the effect of each loss component and offer information about the model’s generalization and training stability on the validation set. The comparison results are shown in
Figure 10. The comparison results are shown in
Figure 10. Box_loss is the bounding box regression loss. It measures the error between predicted boxes and ground-truth boxes, and this value reflects the accuracy of object localization. Dfl_loss is the distribution focal loss. It captures uncertainty in classification and localization. cls_loss is the classification loss, measuring the model’s ability to correctly predict object categories. In general, lower and more stable loss values are indicative of better model performance.
As shown in
Figure 10, the YOLOv8n-RMB model gives lower box_loss and dfl_loss in most training epochs. This result indicates better bounding box regression and higher localization accuracy compared to the original YOLOv8n. Furthermore, the improved model exhibits smaller fluctuations, indicating enhanced training stability. Although the cls_loss curve of YOLOv8n-RMB shows minor oscillations during the initial training phase, it converges to a lower value in the later epochs, reflecting improved classification performance in distinguishing between the three RMB states—“ None”, “Not Filled”, and “Filled”—especially under complex background conditions. The comparative loss curves substantiate the performance advantage of the YOLOv8n-RMB model in the RMB state recognition task within visually challenging environments.
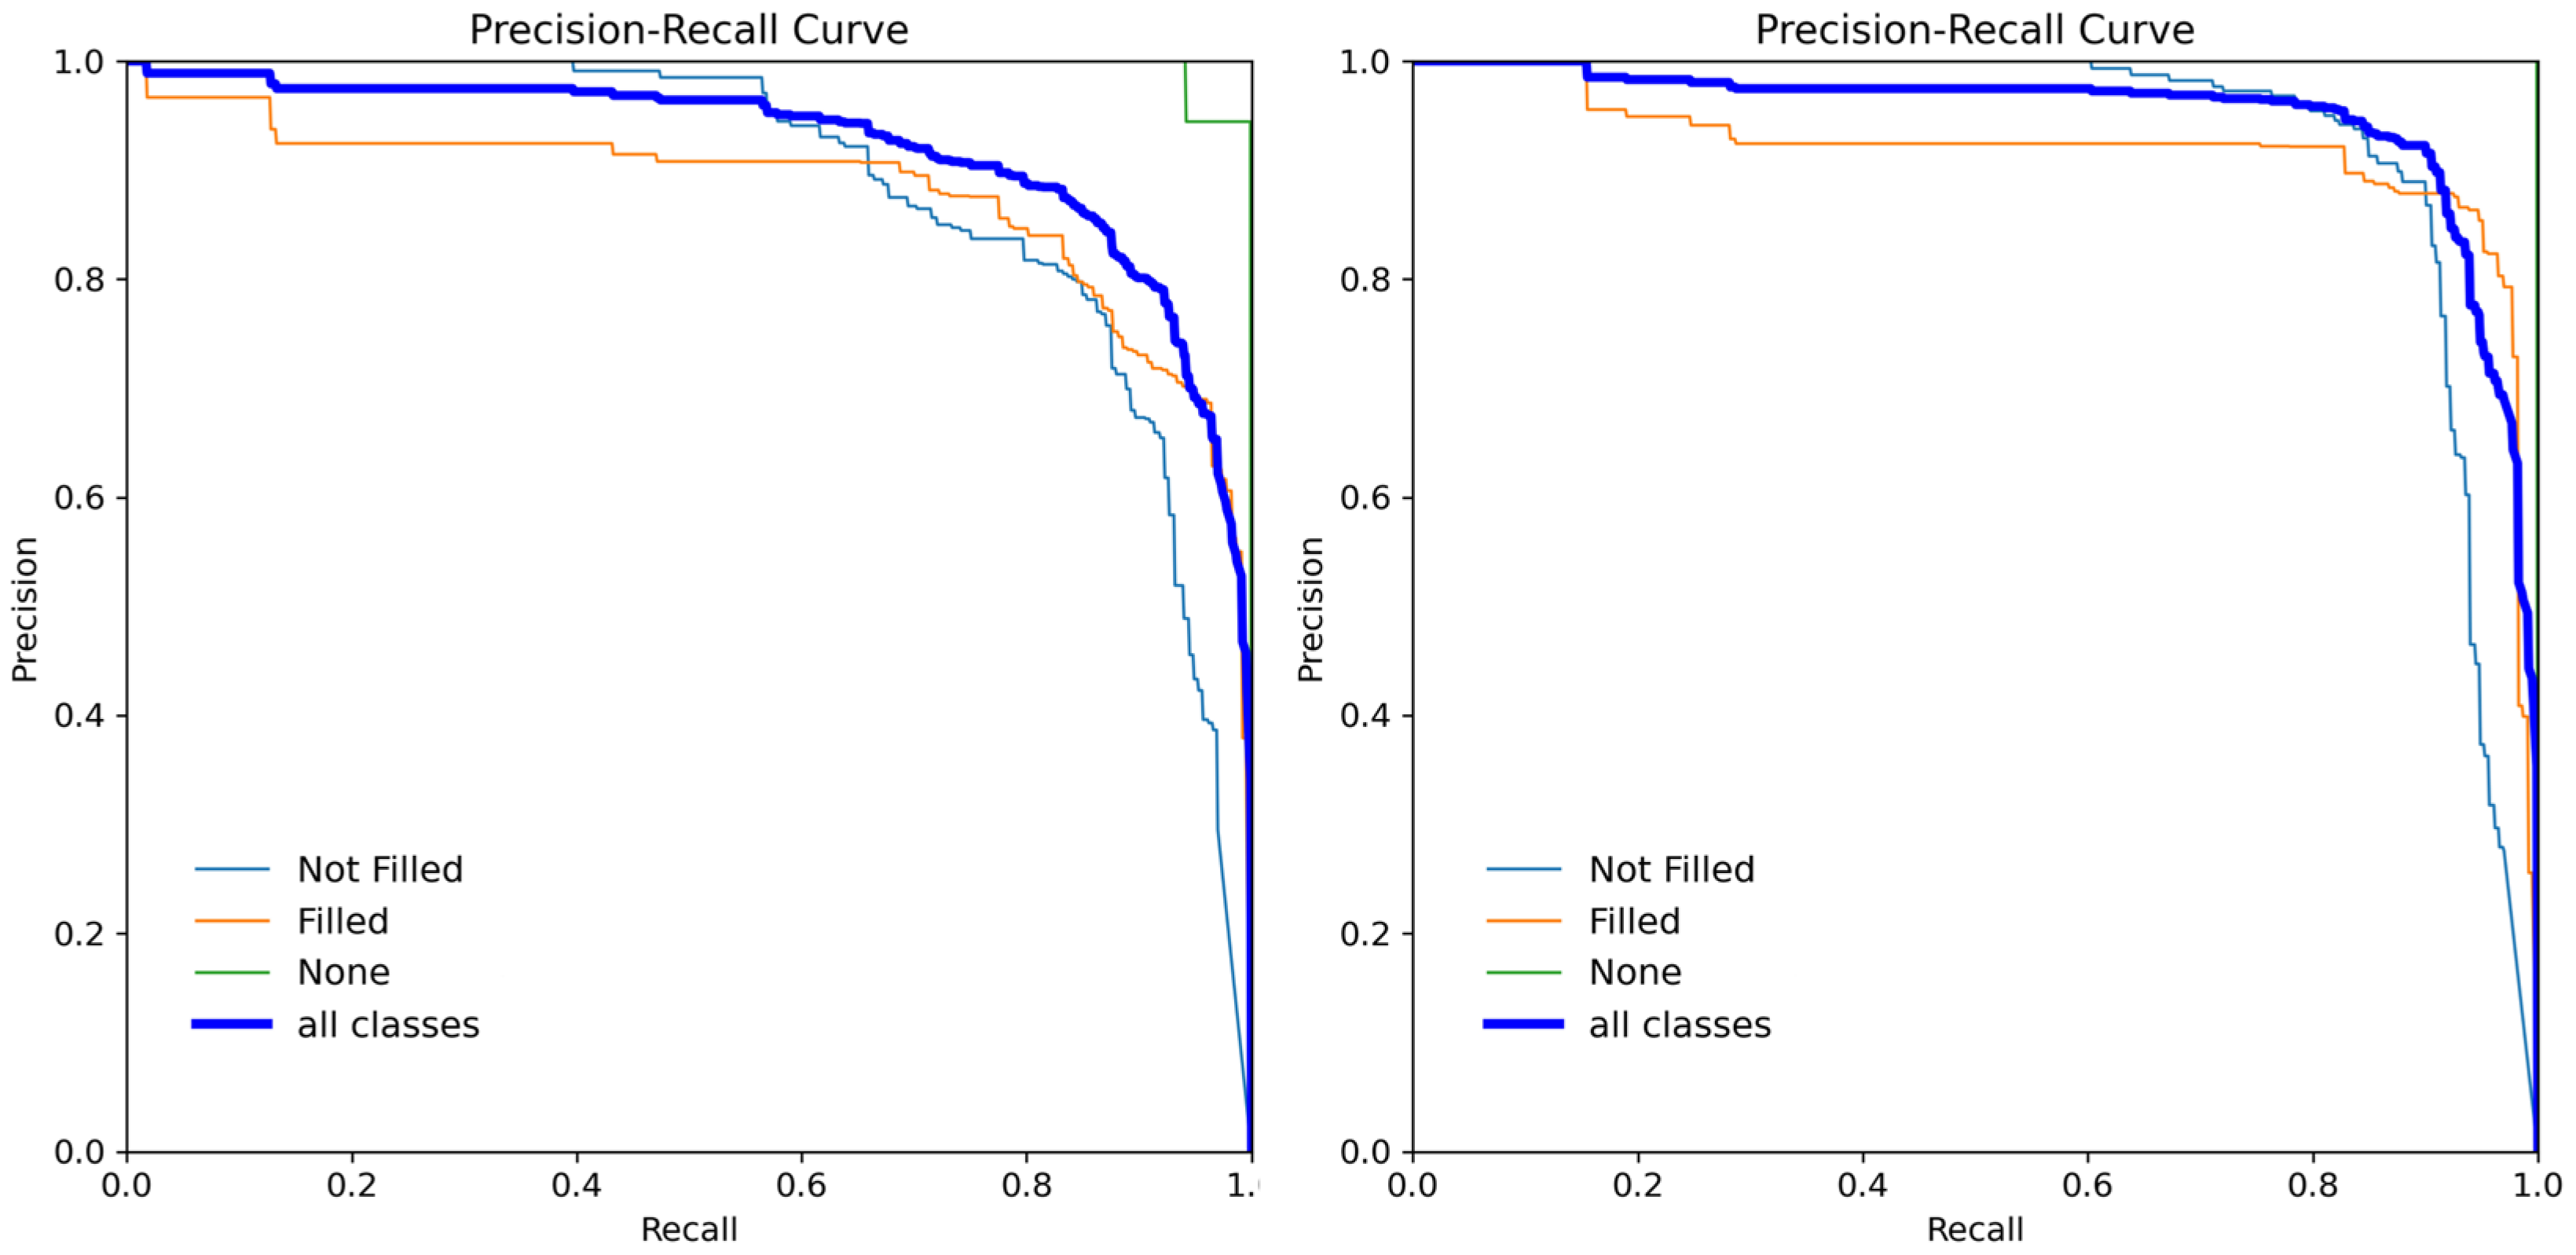
Figure 11 provides a visual comparison of the PR curves before and after model enhancements. AP measures the area under the PR curve, where a larger area indicates higher detection accuracy for a given class. (a) illustrates the performance of the original YOLOv8n model across the three RMB states, while (b) presents the PR curves of the improved YOLOv8n-RMB model incorporating RFA, BiFPN, and DySample modules. It is evident that YOLOv8n-RMB exhibits higher precision and recall across all classes, with significantly larger enclosed areas under the curves, particularly for the “Not Filled” and “Filled” categories, which are more prone to misclassification.
As shown in
Table 1, the proposed YOLOv8n-RMB model outperforms the baseline in terms of mAP across all three RMB states. Specifically, the mAP for the “None” class improved from 99.2% to 99.5%, marking a 0.3 percentage point gain. For the “Not Filled” category, mAP increased from 89.0% to 93.1%, and for the “Filled” class, it rose from 88.0% to 91.9%, representing improvements of 4.1 and 3.9 percentage points, respectively. These results underscore the enhanced discriminative capability of the improved model in fine-grained classification of RMB states.
Figure 12 presents a comparative analysis of detection results before and after model enhancement. As shown in
Figure 12b, the original model was prone to false positives in complex backgrounds and low light quality, often misled by visual interference from leaves and tree trunks. Additionally, it occasionally misclassified “Not Filled” bowls as “Filled”, indicating limitations in fine-grained state discrimination. In contrast, the improved YOLOv8n-RMB model substantially reduced the false detection rate and exhibited enhanced capability in distinguishing between different bowl states. As illustrated in
Figure 12c, the refined model produced more accurate and reliable detection results, demonstrating its robustness in challenging field conditions.
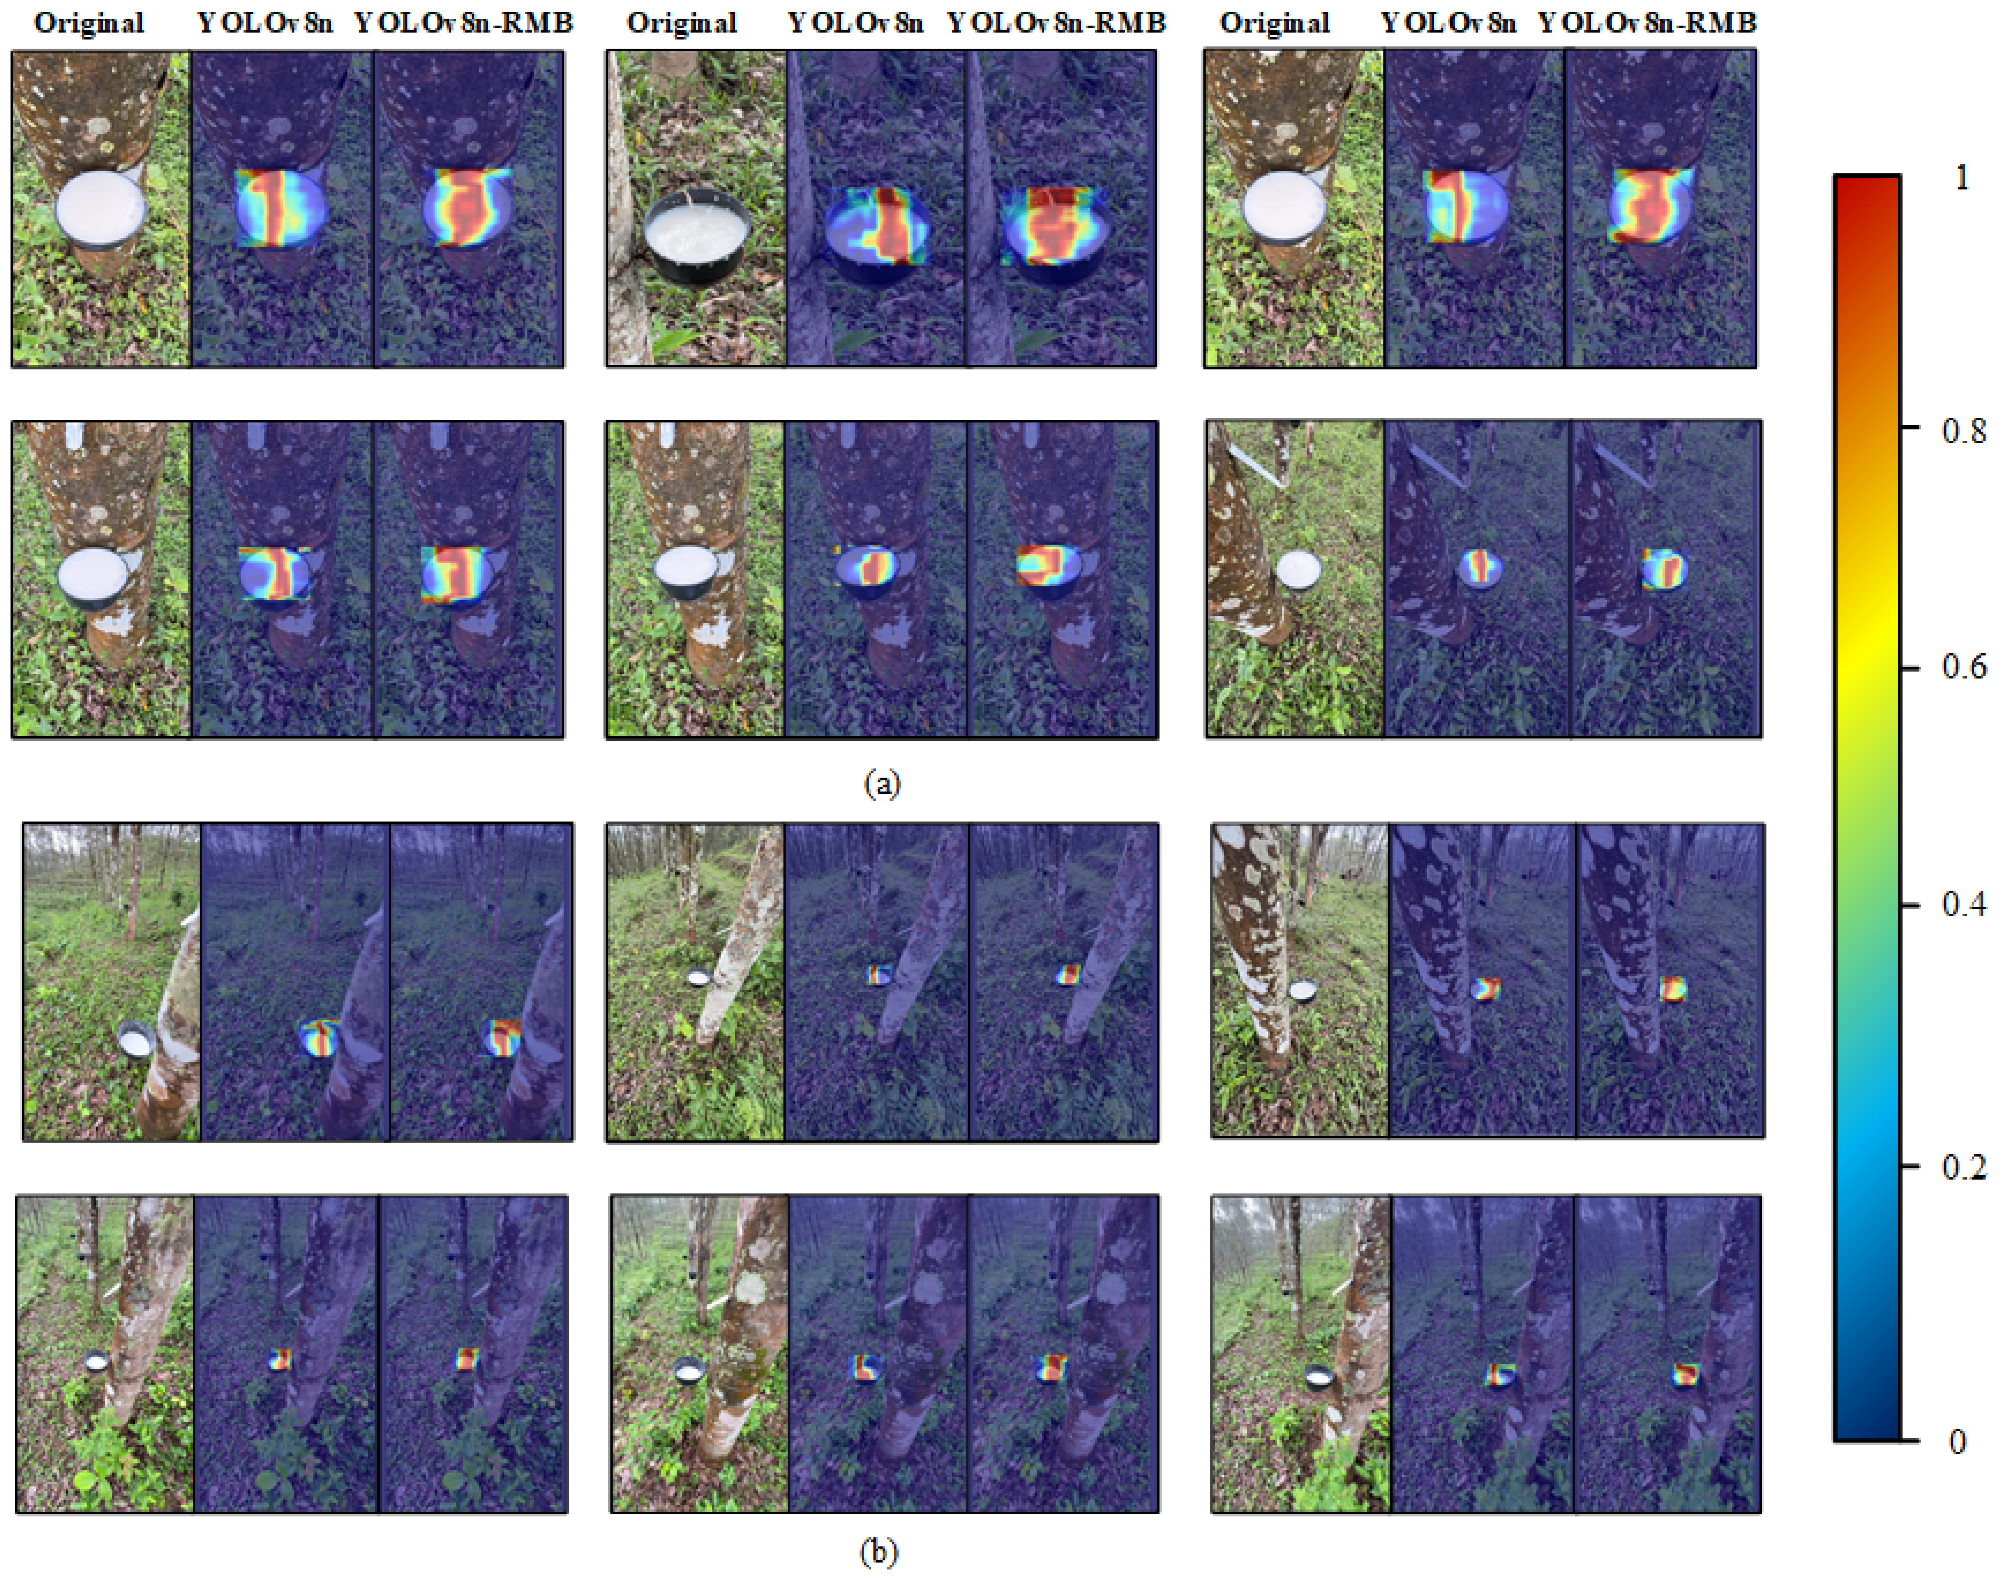
To intuitively analyze the differences in attention to RMB target regions before and after model improvement, we employed heatmap visualization to compare the feature response regions of the YOLOv8n and YOLOv8n-RMB models, with the results presented in
Figure 13. In the heatmaps, brighter colors represent regions with higher model attention, while darker colors indicate lower attention. A comparative analysis reveals that the original YOLOv8n model exhibits relatively limited attention regions, with some heat-activated areas failing to fully cover the RMB body and even misfocusing on background regions. In contrast, the improved YOLOv8n-RMB model demonstrates a broader and more concentrated attention range, with significantly enhanced focus on the RMB itself. The YOLOv8n-RMB model shows higher response intensity and more precise spatial localization of the target region. This result supports the effectiveness of the structural changes in improving detection accuracy and robustness under complex background conditions.
Overall, the proposed YOLOv8n-RMB model achieved optimal performance in the task of RMB and counting. Compared with the original YOLOv8n model, it showed increases of 2.8% in mAP\@0.5, 2.9% in mAP\@0.5:0.95, 3.9% in precision, and 9.7% in recall. These results reflect improvements in detection accuracy and robustness across multiple metrics. Notably, while maintaining high detection precision, the YOLOv8n-RMB model retained its lightweight architecture. This was achieved by embedding the RFACONV module to strengthen local feature extraction, introducing the BiFPN structure to adjust feature fusion across scales, and incorporating the Dysample module for high-quality upsampling. These structural enhancements collectively improved the model’s feature representation capacity while maintaining computational efficiency.
4.2. Ablation Experiment
Compared with the original YOLOv8n detection model, the RMB yield detection and RMB counting model proposed in this study has been improved in three aspects. Part I: the convolution RFAConv with a receptive field attention mechanism replaces the conventional convolution module in the backbone network; Part II: the neck network adopts an improved BIFPN structure to enhance the multi-scale feature fusion capability; Part III: in the head detection network, the DynamicHead detection head is introduced to improve detection accuracy and robustness. In order to verify the contribution of various improvements to the overall model performance, this study conducted ablation experiments on the RMB yield detection and RMB counting models under complex backgrounds. The results are shown in
Table 2.
After incorporating the RFA convolution module into the backbone network, the model exhibited a notable improvement in feature extraction under complex backgrounds. Compared to the unmodified baseline, the model enhanced with RFA convolution achieved an increase in recall from 82.2% to 83.0%, and an improvement in mAP@0.5 by 0.6%. Although the precision decreased slightly from 87.4% to 86.5%, the overall gain in recall indicates that RFA convolution effectively enlarges the receptive field and adaptively focuses on objects of varying scales and shapes. This enhancement is effective in scenes with strong background interference. It increases the model’s capacity to recognize detailed characteristics of RMBs. However, the increased feature sensitivity may have also led to a marginal rise in false positives, slightly lowering precision. Introducing the BiFPN structure into the neck network optimized multi-scale feature fusion and transmission. In experiments using only BiFPN, precision improved to 89.2%, mAP@0.5 reached 93.4%, and recall increased to 83.4%, all without increasing the model’s parameter GFlows. These results show that BiFPN, with its learnable fusion weights, effectively enhances the expressive power of features while maintaining computational efficiency. By adaptively weighting feature importance, BiFPN enables robust detection across varying scales. Further improvements were observed when the DySample module was integrated into the upsampling process. Both precision and recall increased significantly, reaching 90.4% and 85.4%, respectively. Moreover, improvements were also observed in mAP@0.5 and mAP@0.5:0.95. These gains affirm that DySample enhances feature resolution recovery and spatial alignment, especially under complex background conditions. The content-aware dynamic sampling mechanism significantly improves feature reconstruction and overall detection accuracy in challenging environments.
When submodules were combined, synergistic effects became more apparent. The integration of RFA and BiFPN further increased recall but caused a slight drop in precision, suggesting that while these modules jointly enhance fine-grained feature modeling and multi-scale fusion, further refinement is needed to balance false positive suppression. The combination of RFA and DySample yielded a precision of 90.4% and mAP@0.5 of 94.1%, demonstrating that the interplay between high-level feature extraction and adaptive upsampling substantially enhances detection performance in complex scenes. The BiFPN-DySample configuration significantly improved recall to 90.0%, underscoring the complementary strengths of feature fusion and dynamic sampling in recall-oriented tasks.
The fully integrated model incorporating RFA, BiFPN, and DySample achieved the best overall performance: mAP@0.5 reached 94.9%, mAP@0.5:0.95 achieved 89.7%, and precision and recall improved to 91.3% and 91.9%, respectively. These results confirm that the proposed YOLOv8n-RMB framework effectively optimizes feature extraction, feature fusion, and detection decision making across the backbone, neck, and head stages. The combined improvements significantly enhanced the model’s accuracy, robustness, and practical applicability in RMB detection and yield estimation under complex backgrounds, all while maintaining a low parameter of GFlows count and computational cost.
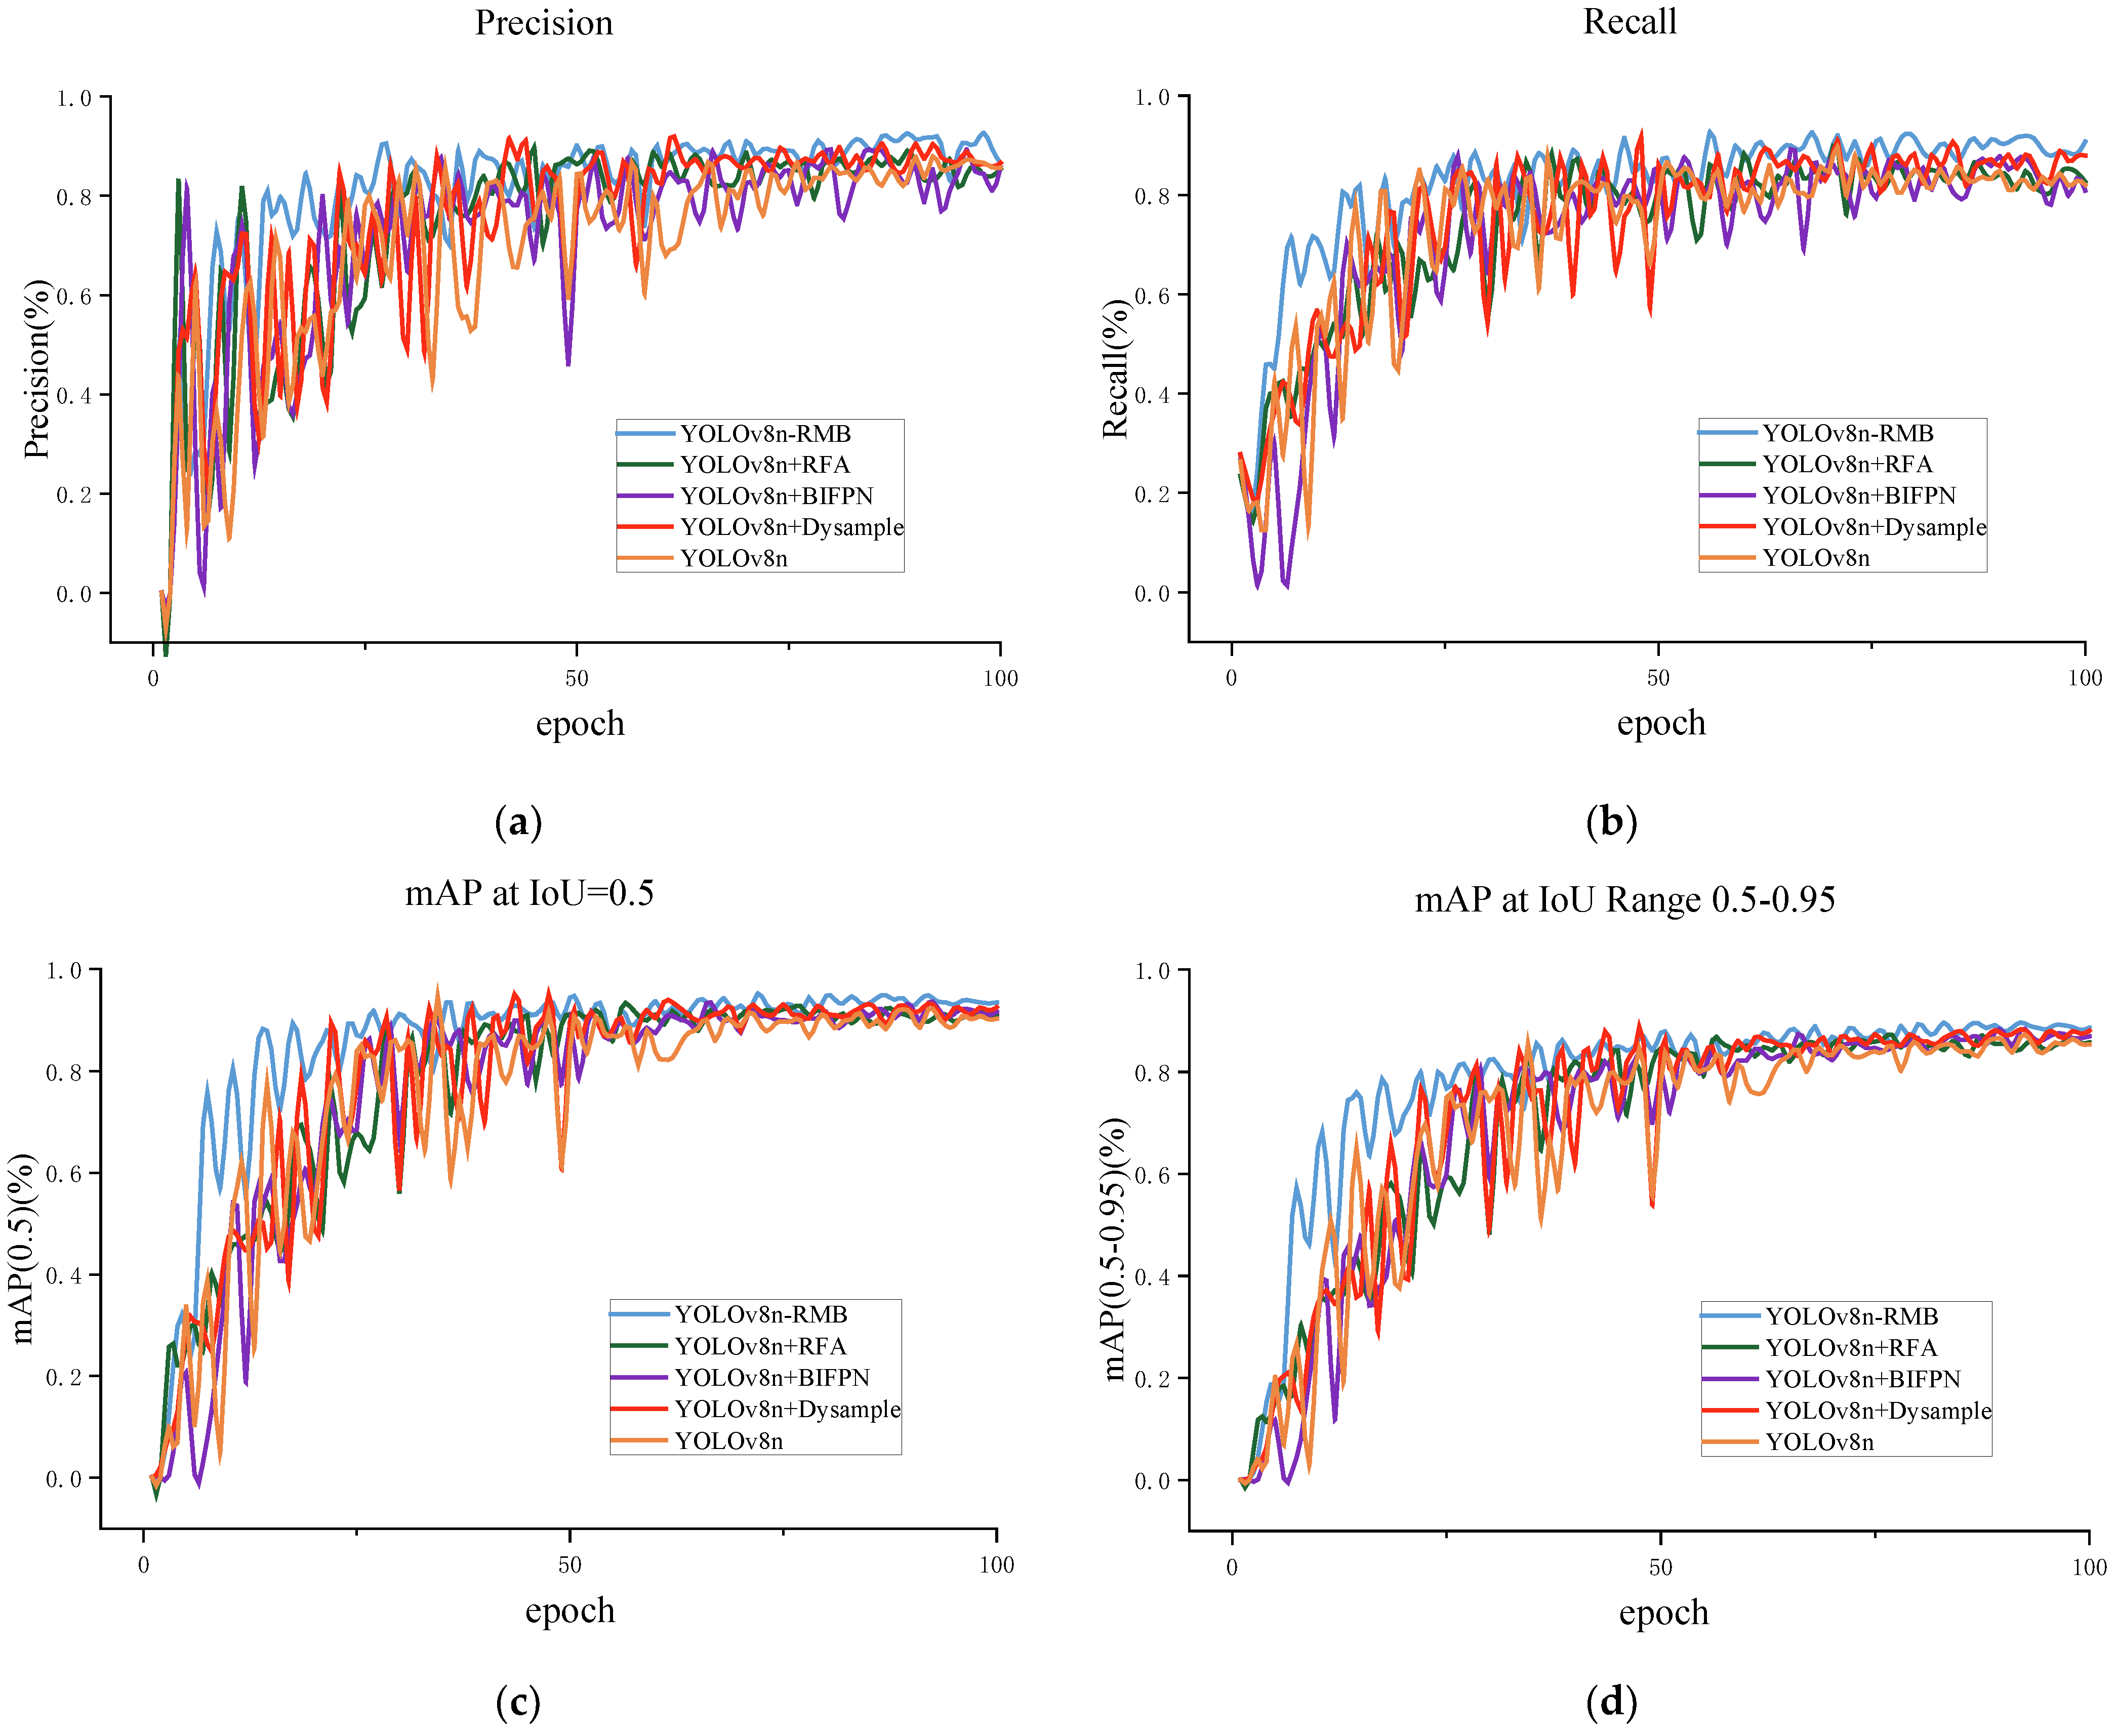
Figure 14 provides an intuitive visualization of performance trends across different model configurations during training. In the first 30 epochs, all metrics—including precision, recall, and mAP—rose rapidly, indicating strong convergence behavior. The improvements introduced did not cause training instability despite the increased architectural complexity. As shown in
Figure 14a, YOLOv8n-RMB consistently maintained the highest precision throughout training, with superior stability emerging after 50 epochs.
Figure 14b shows that YOLOv8n-RMB also achieved the highest recall, with earlier and more substantial gains, verifying the effectiveness of BiFPN and DySample in detecting small objects.
Figure 14d,c present the trends of mAP@0.5 and mAP@0.5:0.95, respectively. The full model incorporating RFA, BiFPN, and DySample not only attained rapid improvements under the looser mAP@0.5 criterion but also maintained its lead under the more stringent mAP@0.5:0.95 standard. This confirms its superiority in both localization accuracy and classification robustness. Furthermore, the volatility in early training stages was lower for all improved models compared to the baseline, indicating that the proposed architectural modifications improved convergence stability without introducing negative side effects during training.
4.3. Comparison Between Different Models
To comprehensively evaluate the effectiveness of the proposed YOLOv8n-RMB model in the RMB detection task, a comparative analysis was conducted against several state-of-the-art lightweight object detection models, including RT-DETR, YOLOv3-Tiny, YOLOv5n, YOLOv10n, and YOLOv8n. As shown in
Table 3, the YOLOv8n-RMB model outperformed all counterparts across all evaluation metrics, achieving a precision of 91.3%, a recall of 91.9%, mAP@0.5 of 94.9%, and mAP@0.5:0.95 of 89.7%. Compared to the baseline YOLOv8n, the YOLOv8n-RMB-enhanced variant achieved an improvement of 2.8% in mAP@0.5 and 2.8% in mAP@0.5:0.95, highlighting the significant gains in detection accuracy created by the proposed architectural enhancements.
Despite these improvements, the YOLOv8n-RMB model maintained a lightweight design, with a computational cost of only 8.3 GFLOPs, marginally higher than YOLOv8n (6.9 GFLOPs), but substantially lower than RT-DETR (103.4 GFLOPs), demonstrating its superior suitability for deployment in resource-constrained environments. While YOLOv5n and YOLOv3-Tiny showed moderate performance, both precision and recall were consistently lower than those of YOLOv8n-RMB, and a marked performance drop was observed under the stricter mAP@0.5:0.95 metric (79.6% and 81.4%, respectively), indicating reduced robustness in complex scenes and near-boundary object detection. YOLOv10n provided a balance between accuracy and complexity but showed lower mAP and recall compared to YOLOv8n-RMB. Notably, RT-DETR exhibited the highest computational cost among all models and failed to demonstrate any significant performance advantage in this task.
In summary, the YOLOv8n-RMB model provides high detection accuracy and robustness while keeping computational cost low. This makes it suitable for real-time, high-precision deployment in UAV-based RMB recognition tasks. Its strong performance under complex environmental conditions validates its effectiveness for intelligent rubber yield assessment and precision plantation management.
4.4. Rubber Bowl Production Status Counting Experiment
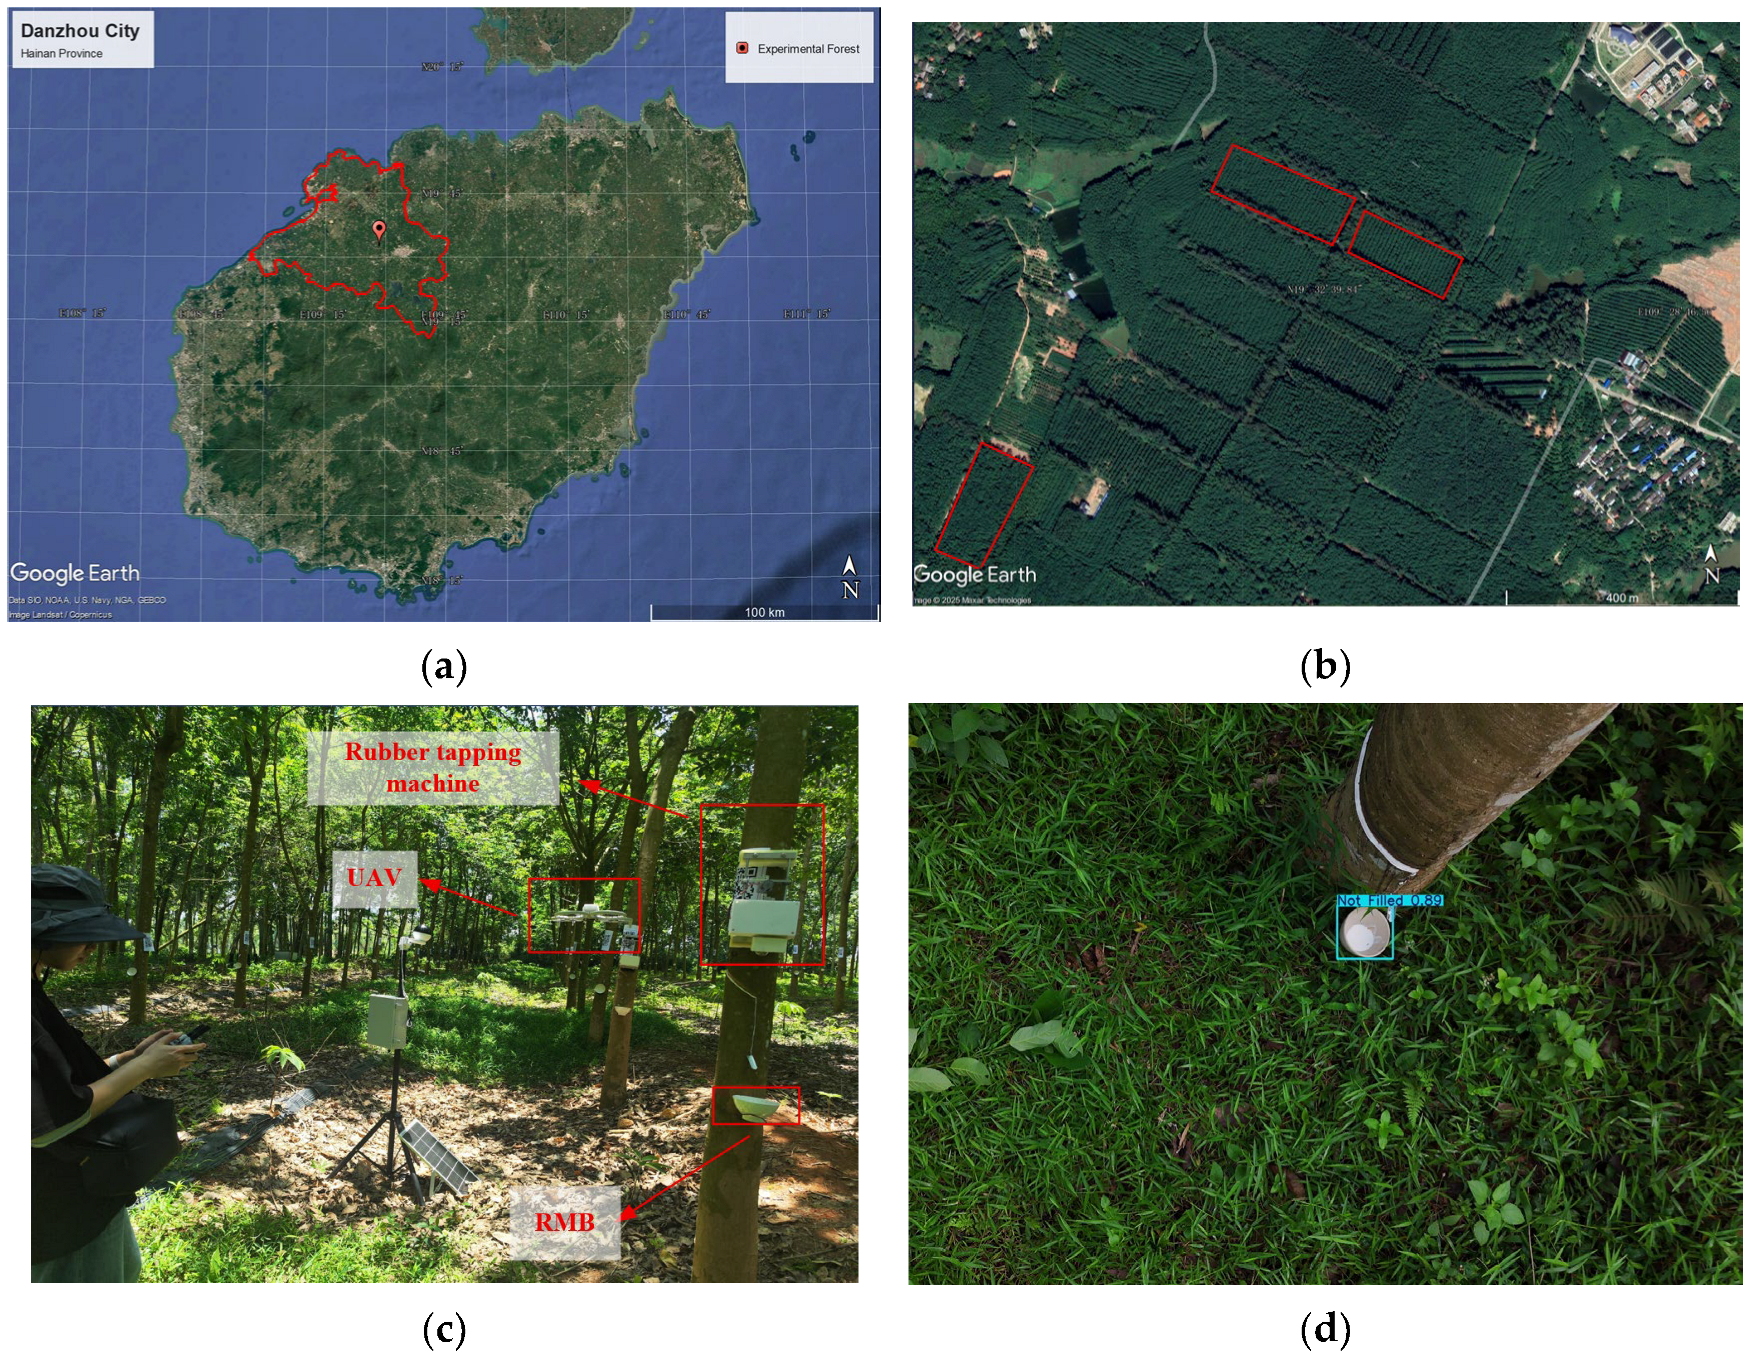
To evaluate the practical counting performance of the proposed RMB status detection and counting model, three field experiments were conducted in the same natural rubber plantation involving a total of 590 bowls. In each experiment, the number of RMBs in the three states, empty, not filled, and filled, was first recorded by manual counting, and the YOLOv8n-RMB-based detection and counting model was then used to automatically identify and count the same RMBs in real time using UAV images. The model’s output was compared with the manually recorded ground truth counts. The results of the experiment are listed in
Table 4.
The experimental results demonstrate that the proposed YOLOv8n-RMB model exhibits strong practicality and generalization capability in complex rubber plantation environments. Compared with manual counting, the model reached accuracy rates of 97.6%, 98.4%, and 97.6% in three field trials for identifying and counting RMB states. In terms of efficiency, the YOLOv8n-RMB model needed about 21 min on average to complete one full counting task per scene, while manual counting took around 43 min. This result shows more than twice the efficiency.
In addition, using real-time video streams from UAVs, the YOLOv8n-RMB model shows better adaptability and easier deployment compared to traditional methods based on static images. This makes the model suitable for large-scale unmanned rubber-tapping operations. The integration of RFACONV, BiFPN, and DySample modules significantly improves both accuracy and inference speed, confirming the model’s potential for real-world engineering applications. The deployment of this model offers technical support for rubber yield monitoring and intelligent tapping systems. It also supports the development of forestry informatization and the modernization of the rubber industry.
4.5. Discussion and Future Work
This study proposes a rubber milk bowl recognition and counting model based on an improved YOLOv8n-RMB algorithm. This model significantly improves upon the existing model’s performance, enhancing the accuracy of rubber bowl detection in complex backgrounds. And the experiments and testbed show that compared with the baseline YOLOv8n model, YOLOv8n-RMB achieves substantial improvements in all detection metrics, with mAP@0.5, mAP@0.5:0.95, precision, and recall increasing by 2.8%, 2.9%, 3.9%, and 9.7%, respectively. These gains are attributed to BiFPN’s enhanced feature expression via frequent bidirectional fusion and DySample’s dynamic sampling mechanism for optimized spatial reconstruction. Although the model’s parameters increased from 2.7 M to 3.0 M and FLOPs rose from 6.9 G to 8.3 G, the inference speed stayed high at 91 FPS. This meets the real-time detection needs in UAV-based rubber plantation monitoring. These results show that the model maintains a balance between detection accuracy and speed, indicating its applicability in real field conditions. Moreover, in comparison with several mainstream lightweight detectors, the YOLOv8n-RMB model achieves the highest mAP@0.5 and mAP@0.5:0.95 scores, at 94.9% and 89.7%, respectively. Visualized results demonstrate its ability to stably and accurately detect the three RMB states with clear target boundaries and a low false detection rate, outperforming baseline models such as YOLOv8n and YOLOv5n. While RT-DETR shows low detection accuracy (84.3% mAP@0.5, 78.3% mAP@0.95), its large computational cost (103.4 GFLOPs) makes it unsuitable for real-time UAV deployment on resource-constrained edge devices. Furthermore, in three field tests, the YOLOv8n-RMB model achieved recognition and counting accuracies of 97.6%, 98.4%, and 97.6%, respectively, demonstrating strong generalization and adaptability across real plantation conditions. Furthermore, the model significantly outperforms manual counting in terms of time efficiency, completing each task in an average of 21 min compared to 43 min manually—more than doubling the operational efficiency. By processing UAV video streams in real time and using the BoT-SORT multi-object tracking algorithm, the model performs automated detection and counting of RMBs in three states.
The proposed method is a possible and suitable solution for rubber yield counting tasks based on drone imagery, providing a basis for secondary tapping and rubber milk harvesting decisions by tappers. Previous research has demonstrated significant progress in tapping line detection [
30], tapping key point detection [
4], and tapping pose estimation [
1] using image recognition technology, providing strong technical support for intelligent rubber tapping robots. Their research complements ours, with the former addressing “tapping actions” and the latter completing “harvesting judgment,” jointly building a closed-loop perception system for the entire intelligent tapping process. By integrating our rubber bowl recognition system into the existing tapping robot’s perception module, the robot’s ability to determine operating timing and path planning can be effectively enhanced, laying a solid foundation for building a truly autonomous, efficient, and intelligent unmanned tapping system.
However, the proposed recognizing and counting method still suffers from false negatives and false positives. Furthermore, the current experiments were conducted only in rubber plantations in Hainan and Yunnan Provinces of China. Given the significant differences in planting density, tree trunk morphology, lighting conditions, and background interference across regions, the generalizability of the proposed model to other rubber plantations remains to be verified. In the future, some related directions may continue to expand the dataset to encompass a wider range of environmental conditions, thereby enhancing the model’s feature learning capabilities. Furthermore, we will further explore architectural improvements to reduce false positives and missed detections. In future research, the proposed YOLOv8n-RMB framework is expected to continue to expand in key procedures of harvesting, like being embedded in mobile rubber tapping robots to control the tapping time and duration, integrated in a digital twin system for rubber milk production prediction and simulation from the high-resolution RMB data, etc.
5. Conclusions
UAV imagery is an efficient way to manage natural rubber robot tapping and harvesting, via monitoring and tracking the status of RMB in hilly and mountainous forest environments. This study proposes a novel RMB yield recognition and counting model, YOLOv8n-RMB, designed for UAV imagery detection tasks in rubber plantations with complex forest backgrounds. First, RFACONV is added to the backbone to address the limited ability of standard shared-parameter convolution kernels in capturing long-range features. This significantly enhances the model’s ability to perceive edge details and subtle textures of RMB under complex conditions. Second, BiFPN is introduced to improve fusion between shallow and deep semantic features. This helps reduce feature degradation and remove redundant information. Finally, a content-aware dynamic resampling module, DySample, is incorporated during the upsampling stage to achieve precise recovery of fine-grained spatial details and clearer classification boundaries for RMB states. In real-world scenarios characterized by diverse backgrounds, variable object scales, and high visual similarity between RMBs and environmental elements, the proposed model successfully identifies and counts three distinct RMB states—empty, partially filled, and fully filled. This provides robust visual support for target selection and yield estimation in automated rubber tapping operations. The proposed method meets the real-time detection needs in UAV-based rubber plantation monitoring, and the experiment and pilot testbed show that the proposed lightweight model maintains a balance between detection accuracy and speed, indicating its applicability in real rubber forest conditions. It achieves substantial improvements in all detection metrics, with mAP@0.5, mAP@0.5:0.95, precision, and recall increasing by 2.8%, 2.9%, 3.9%, and 9.7%, respectively, compared with the baseline YOLOv8n model. In addition, the computational complexity of GFLOPs increased from 6.9 G to 8.3 G. Moreover, the model performs automated detection and counting of RMBs in three states by processing UAV video streams in real time and using the BoT-SORT multi-object tracking algorithm. The model provides a potential resolution for large-scale rubber robot observation and control.
