Article

Crop Disease Spore Detection Method Based on Au@Ag NRS

1
Basic Engineering Training Center, Jiangsu University, Zhenjiang 212013, China
2
School of Agricultural Engineering, Jiangsu University, Zhenjiang 212013, China
3
Department of Agricultural Engineering, Jiangsu University, Zhenjiang 212013, China
*
Author to whom correspondence should be addressed.
Agriculture 2025, 15(19), 2076; https://doi.org/10.3390/agriculture15192076
Submission received: 25 August 2025 / Revised: 19 September 2025 / Accepted: 1 October 2025 / Published: 3 October 2025
(This article belongs to the Special Issue Spectral Data Analytics for Crop Growth Information)

Abstract

Crop diseases cause significant losses in agricultural production; early capture and identification of disease spores enable disease monitoring and prevention. This study experimentally optimized the preparation of Au@Ag NRS (Gold core@Silver shell Nanorods) sol as a Surface-Enhanced Raman Scattering (SERS) enhancement reagent via a modified seed-mediated growth method. Using an existing microfluidic chip developed by the research group, disease spores were separated and enriched, followed by combining Au@Ag NRS with Crop Disease Spores through electrostatic adsorption. Raman spectroscopy was employed to collect SERS fingerprint spectra of Crop Disease Spores. The spectra underwent baseline correction using Adaptive Least Squares (ALS) and standardization via Standard Normal Variate (SNV). Dimensionality reduction preprocessing was performed using Principal Component Analysis (PCA) and Successive Projections Algorithm combined with Competitive Adaptive Reweighted Sampling (SCARS). Classification was then executed using Support Vector Machine (SVM) and Multilayer Perceptron (MLP). The SCARS-MLP model achieved the highest accuracy at 97.92% on the test set, while SCARS-SVM, PCA-SVM, and SCARS-MLP models attained test set accuracy of 95.83%, 95.24%, and 96.55%, respectively. Thus, the proposed Au@Ag NRS-based SERS technology can be applied to detect airborne disease spores, establishing an early and precise method for Crop Disease detection.

1. Introduction

When discussing agriculture and food security, crop diseases represent an issue that cannot be ignored [1]. These diseases can cause significant losses in crops, leading to famine and economic losses for humanity. The detection of disease spores, as a critical method for early disease diagnosis, is essential for disease prevention and control. Due to ongoing global climate change and continuous adjustments in crop industry structures and cultivation practices worldwide, fungal diseases are experiencing periodic outbreaks, leading to an estimated 10–20% annual reduction in grain yield [2]. Compared to traditional disease detection methods such as spectral imaging, the diffusion and aggregation of fungal pathogenic spores can provide earlier indications of disease outbreaks. Airborne fungal pathogens primarily spread through vast quantities of lightweight spores, which are easily dispersed by air currents [3,4]. If these spores can be detected in the air during the initial stages of transmission, early disease warnings can be issued, enabling proactive control measures to mitigate yield losses. Therefore, the accurate capture and precise identification of spores constitute a critical step in monitoring spore dissemination.
Traditional microscopic spore identification and counting primarily rely on manual observation. Due to the large quantity of captured spores, this method is labor-intensive, time-consuming, and inefficient. The accuracy of observation depends heavily on the operator’s expertise, often leading to significant errors [5,6,7]. In 2018, Lei et al. [8] employed a series of image processing techniques for automated detection and counting of rust spores, including a K-means clustering algorithm for image segmentation, identification based on shape factors and area, and rust spore contour segmentation via concavity analysis and contour segment merging. This algorithm demonstrated effective and accurate automated detection for rust spores, but image processing-based spore recognition is limited in the number of features it can incorporate. In 2021, Zhang et al. [9] proposed FSNet for fungal spore detection, enabling automatic identification and counting of fungal spores in microscopic images. However, methods based on images and deep learning remain insufficiently accurate for distinguishing spores with similar shapes and sizes. PCR is the gold standard method for microbial detection, frequently used for microbial identification with high accuracy. However, it requires professionals to lyse spores under stringent experimental conditions and involves cumbersome processing for fungal spore detection [10,11]. Existing microscopic image methods allow rapid detection and identification through morphology, but fail to accurately distinguish spores with similar shapes and sizes. PCR offers high accuracy but demands harsh detection conditions, destructive sampling, and suffers from poor timeliness and high costs. Therefore, there is an urgent need to develop a rapid and precise spore detection and identification technology. SERS technology, a light scattering technique, is low-cost and fast, capable of reflecting various vibrational frequencies and related energy levels of internal biological components. It can be used to identify the molecular composition and structure of biological samples and has been applied to bacterial identification and analysis [12,13]. However, direct detection using SERS spectra is challenging due to the low concentration of airborne spores and the presence of substantial impurities. Thus, a method for separation and enrichment is required to capture spores and enhance detection accuracy.
In recent years, microfluidic technology has emerged as a powerful tool for detection applications due to its portability, miniaturization, automation, multi-channel sample detection capabilities, and cost efficiency. Compared to traditional methods, its greatest advantage lies in creating a controllable micro-environment that enables precise driving and control of microfluidic flow within microchannels, thereby significantly enhancing detection sensitivity [14,15]. Among its applications, aerodynamically designed impactors are widely used for atmospheric particle separation with high efficacy [16]. Additionally, virtual impactor-based microfluidic chips achieve high collection efficiency for fungal spores with minimal consumable usage [17]. Furthermore, the integration of microfluidic chips with diffraction-based detection allows highly accurate identification of spores with substantial size and shape variations. This approach vastly expands the detection field of view compared to microscopic observation, substantially improving detection efficiency and speed [18].
In terms of data processing, machine learning methods have become key tools for handling complex SERS spectral data [19]. Commonly used algorithms include Support Vector Machines (SVM), Random Forests (RF), Multilayer Perceptrons (MLP), and Convolutional Neural Networks (CNN). SVM excels in high-dimensional, small-sample data scenarios; MLP effectively captures nonlinear features, while deep learning models like CNN are suitable for autonomous feature learning with large datasets. This study adopts a combined strategy of SVM and MLP, balancing classification accuracy and computational efficiency, aiming to achieve rapid and accurate identification of multiple pathogenic spores.
This study addresses the critical challenge of early detection and early warning of rice diseases. It innovatively proposes a method utilizing a microfluidic chip designed based on microfluidic dynamics for the separation, enrichment, and purification of Fusarium oxysporum spores, Ustilaginoidea virens spores, and Aspergillus niger spores [20]. By combining the enhancement of surface Raman spectroscopy by Au@Ag NRS (Au@Ag Nanostructures for Raman Scattering) and employing Surface-Enhanced Raman Spectroscopy (SERS) for in-situ detection of disease spores. The research provides a theoretical analysis of the Raman spectral response characteristics of these pathogenic fungal spores. This approach achieves accurate classification and identification of rice diseases caused by Fusarium oxysporum, Ustilaginoidea virens, and Aspergillus niger. The findings of this study hold certain scientific value for the prevention and management of crop fungal diseases.

2. Materials and Methods

2.1. Laboratory Reagents

The experimental reagents (Table 1) included hexadecyl trimethyl ammonium bromide (CTAB, 99%), hydrogen tetrachloroaurate (III) trihydrate (99%), sodium borohydride (99%), ascorbic acid (AA, 99%), silver nitrate (99%), hydrochloric acid (concentration: 38%), sulfuric acid (65%), and cetyltrimethylammonium chloride (CTAC, 99%). All solutions were prepared using deionized water (18 MΩ/cm). Experimental glassware was immersed in aqua regia, rinsed with ethanol, and then washed with deionized water. To ensure solution efficacy, silver nitrate, sodium borohydride, and ascorbic acid solutions must be freshly prepared before use. The experiment was conducted between 2024 and 2025.

2.2. Synthesis Method of Au@Ag NRS

The selection of silver (Ag) and gold (Au) as the SERS substrate materials in this study is particularly based on their optical properties, biocompatibility, and other critical performance parameters. This study selected gold-silver core-shell nanorods (Au@Ag NRs) over other morphologies (such as nanospheres, nanostars, or rough surfaces) primarily due to their tunable plasmonic resonance properties and their significant performance advantages in detecting complex biological samples. The one-dimensional structure of the nanorods facilitates tighter contact with spore surfaces via electrostatic adsorption (adsorption rate > 90%), whereas spherical particles are prone to unstable adsorption due to curvature mismatch (shedding rate > 30%). Furthermore, the directional flow characteristics of nanorods enable easier spatial alignment (orderliness > 80%) through inertial focusing in microfluidic chips, resulting in uniform SERS hotspots. In contrast, spherical particles tend to distribute randomly, leading to signal fluctuations.

2.2.1. Synthesis of Au NRS

Au NRS (Gold Nanorods) was prepared through an experimentally modified seed-mediated growth method [21,22,23]. The synthesis of Au NRS involves two steps, as shown in Figure 1.
  • Synthesis of Gold Seeds. In a constant-temperature water bath with magnetic stirring, 8 mL of 0.1 mol/L CTAB (Hexadecyl Trimethyl Ammonium Bromide) aqueous solution was added to a glass vial containing a magnetic stir bar. Under stirring at 640 r/min, 200 μL of 0.01 mol/L Chloroauric Acid (HAuCl4) aqueous solution was slowly added, resulting in a golden-yellow color. The stirring speed was then increased to 1200 r/min, and 480 μL of ice-cold 0.1 mol/L Sodium Borohydride (NaBH4) solution (stored at 0–4 °C) was added, turning the solution brownish yellow. After thorough mixing, the reaction mixture was statically incubated at 30 °C for 2 h in an oven, yielding a tea-brown gold seed solution.
  • Preparation of Growth Solution. To 20 mL of 0.1 mol/L CTAB aqueous solution, the following reagents were sequentially added: ① 1 mL of 0.01 mol/L HAuCl4 aqueous solution, ② 250 μL of 0.01 mol/L Silver Nitrate (AgNO3) aqueous solution, ③ 34 μL of 38% Hydrochloric Acid (HCl) aqueous solution (shifting the color to khaki), ④ 160 μL of 0.1 mol/L Ascorbic Acid (AA) aqueous solution, ⑤ The mixture was stirred at 1200 r/min for 30 s, resulting in a colorless transparent growth solution.
  • Growth of Au NRS. 10 μL of the gold seed solution was added to the growth solution and stirred at 700 r/min for 1 min. The mixture was then statically reacted at 30 °C for 12 h in an oven.
  • Centrifugal Washing. After reaction completion, centrifugal washing was performed to remove excess CTAB and AgNO3 impurities: ① Centrifugation at 10,000 r/min for 10 min (with centrifuge tubes symmetrically placed), ② The supernatant was discarded, and the pellet was resuspended in 15 mL of ultrapure water, ③ The colloid was ultrasonicated for 5 min to ensure homogeneous dispersion, ④ This washing cycle was repeated multiple times with minimal solvent volume, ⑤ the colloid was concentrated to 5 mL and stored at 4 °C.

2.2.2. Synthesis of Au@Ag NRS

Formation of Silver Shell on Au NRS via Reduction Method [24], the procedure was performed as follows:
  • Add 600 μL of 0.08 mol/L CTAC (Cetyltrimethylammonium Chloride) solution to a 10 mL centrifuge tube, followed by 200 μL of 0.01 mol/L Silver Nitrate (AgNO3) aqueous solution. Oscillate the mixture for homogenization and incubate at 30 °C for 10 min.
  • Remove the mixture from the oven, add 500 μL of concentrated Au NRS solution and 2 mL of ultrapure water. Oscillate for homogenization and incubate at 30 °C for 5 min.
  • Add 100 μL of 0.1 mol/L Ascorbic Acid (AA) solution to the mixture. Oscillate vigorously at 1000 r/min for 1 min, then react in a constant-temperature oscillating water bath at 30 °C for 4 h.
After the reaction, centrifugal washing is required to remove excess impurities such as CTAB and silver nitrate from the colloid. Centrifugation was performed at 10,000 r/min for 10 min, with centrifuge tubes symmetrically placed in the rotor. The supernatant was then removed, and the pellet was resuspended in 10 mL of ultrapure water, followed by ultrasonication for 5 min to complete one washing cycle. This process was repeated multiple times with minimal ultrapure water added per cycle. Finally, the colloid was concentrated into a concentrated Au@Ag NRS colloid and stored at 4 °C.

2.3. SERS-Based Detection Method for Crop Disease Spores

The equipment involved in this study included: (1) UV-Vis Spectrophotometer (UV-2600, Spectral bandwidth: 4 nm, Wavelength range: 200–1400 nm, Single beam, Shimadzu Corporation, Kyoto, Japan) for characterizing the optical properties of synthesized Au@Ag NRS. (2) High-Resolution Transmission Electron Microscope (HRTEM, JEM-2100 (HR), Point resolution: 0.23 nm, Line resolution: 0.14 nm, Magnification: 50~1,500,000×, JEOL Ltd., Kyoto, Japan) for nanoscale structural analysis. (3) Field-Emission Scanning Electron Microscope (FESEM, JSM-7800F, Resolution: 0.8 nm (at 15 kV), 1.2 nm (at 1 kV), Magnification: 25 ~ 1,000,000×, JEOL Ltd., Kyoto, Japan) for surface morphology characterization.
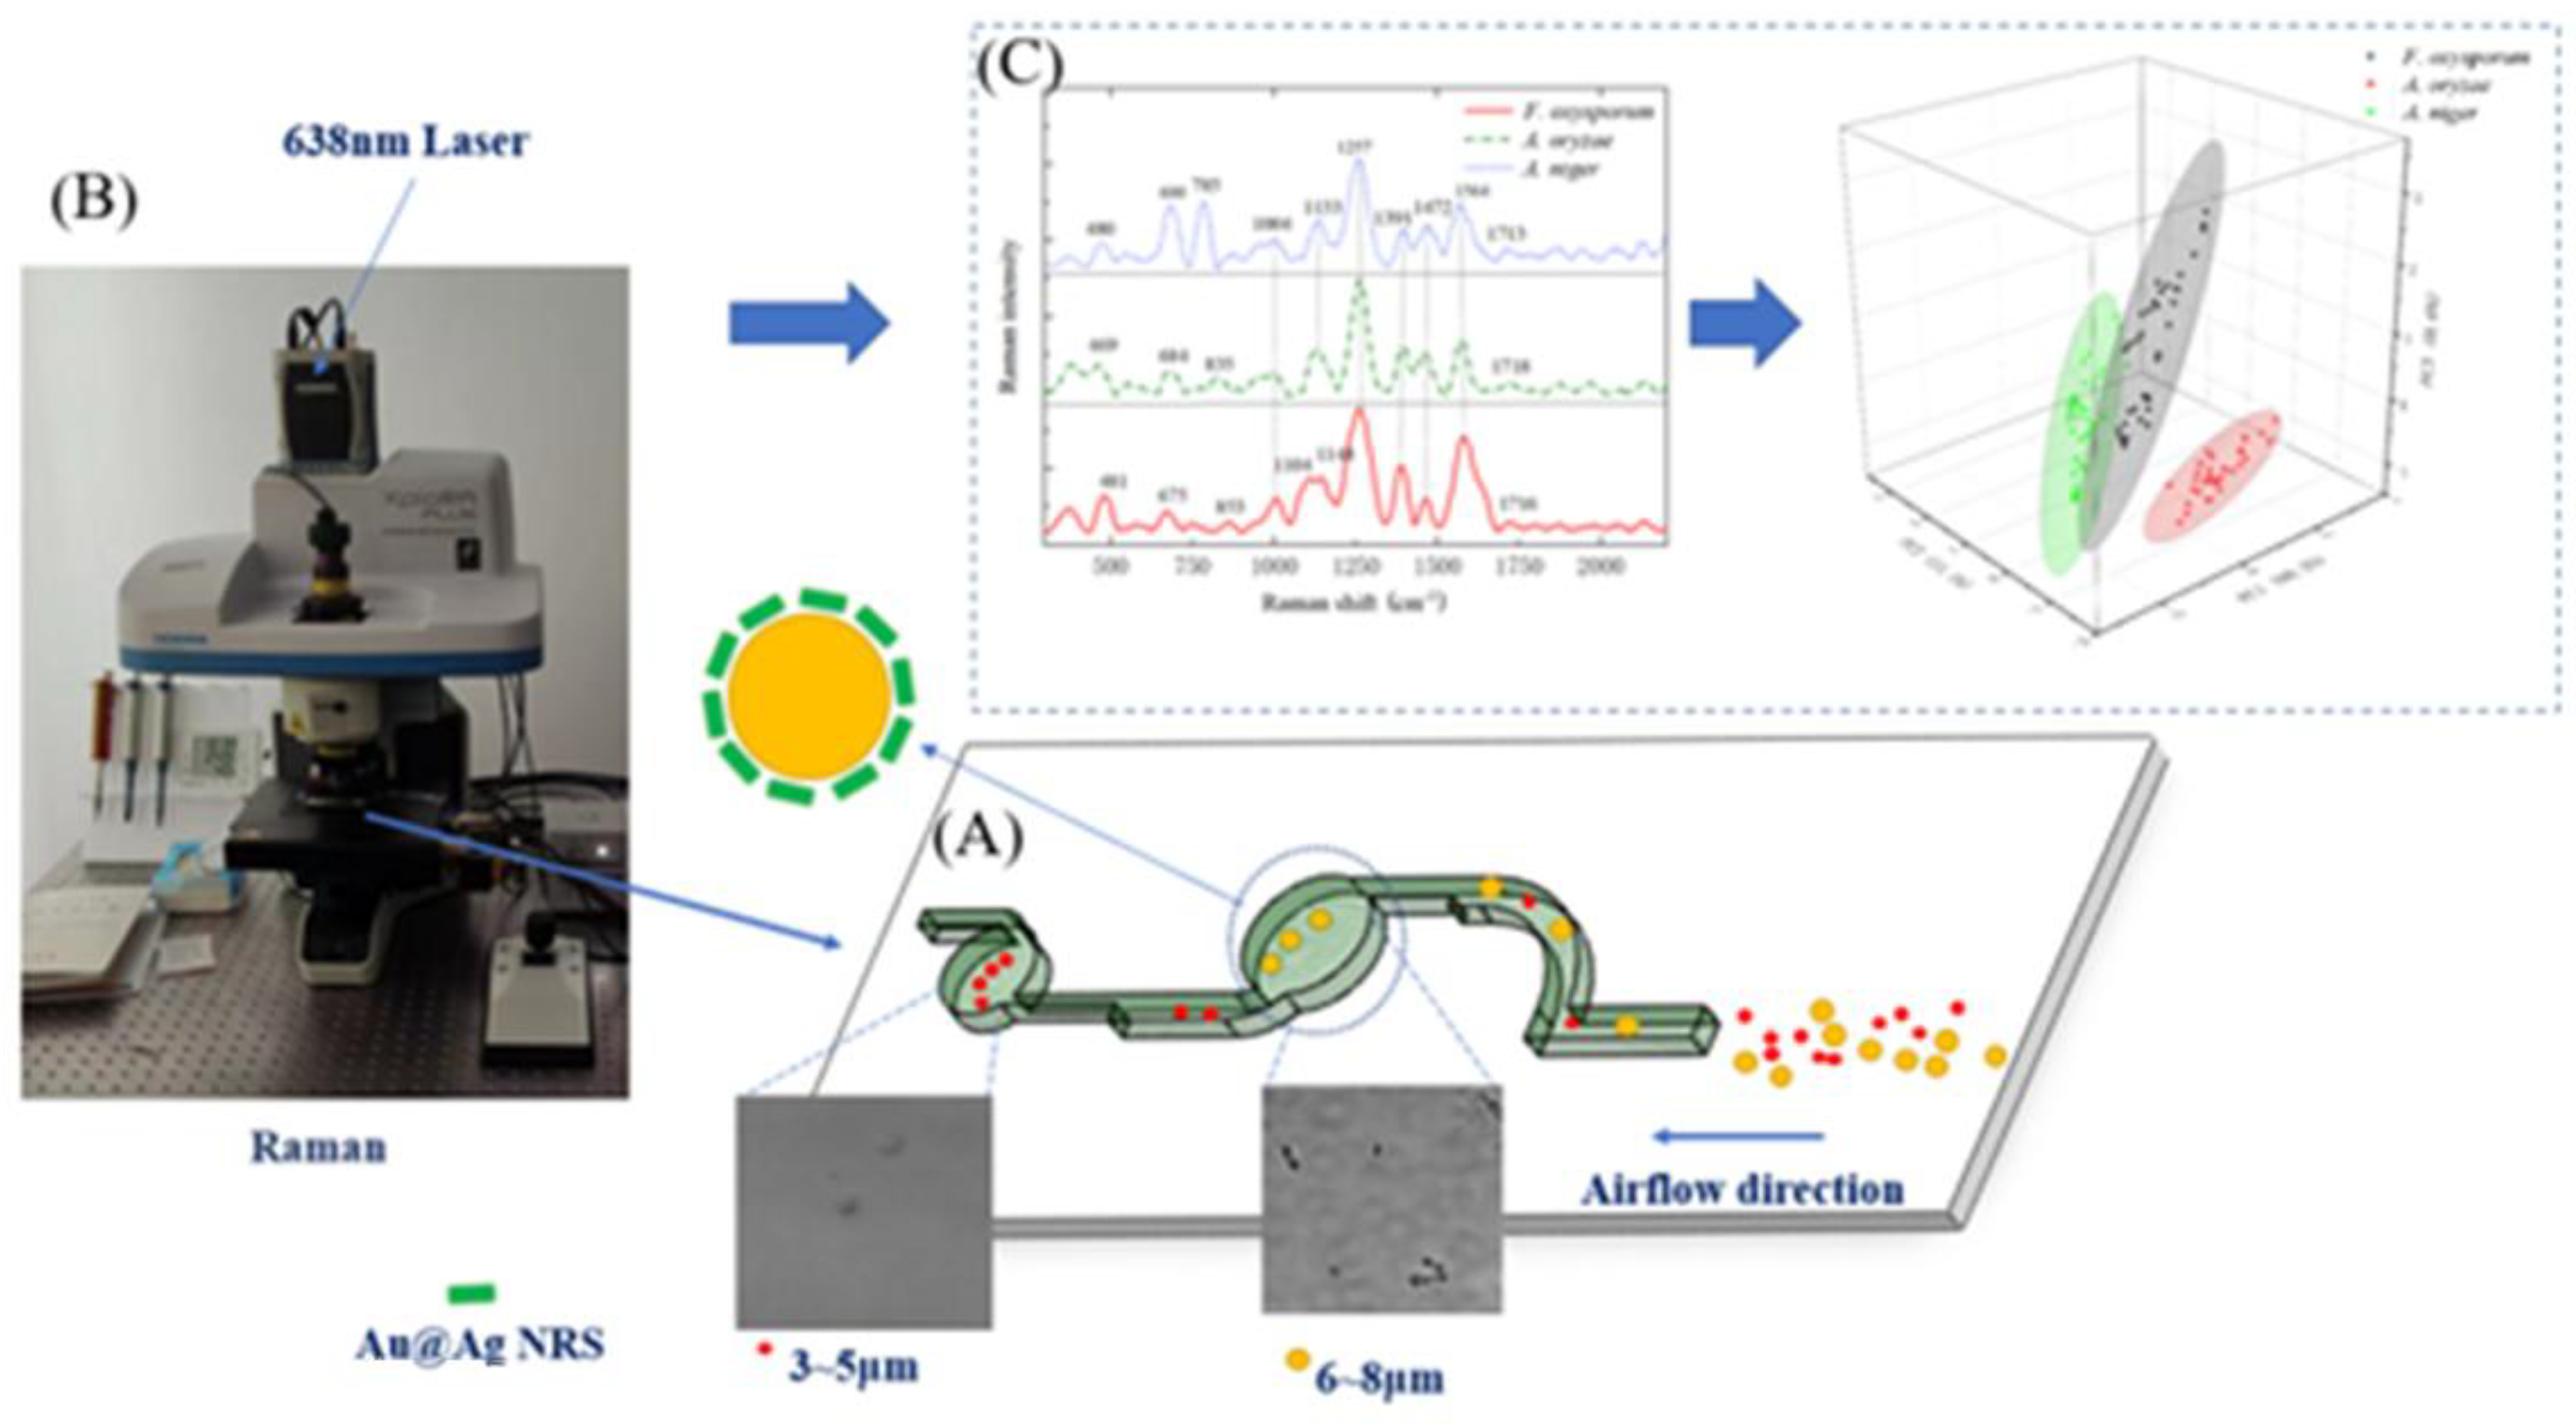
The Microfluidic Chip-integrated Raman Detection Method proposed in this study features rapidity, accuracy, and operational simplicity. As shown in Figure 2, this method comprises three main components: spore capture and separation/enrichment, SERS fingerprint spectra acquisition of crop disease spores, and Raman data processing and modeling.
In this study, three types of spore suspensions were mixed: Fusarium oxysporum (F. oxysporum) spores (6–8 μm), Aspergillus oryzae (A. oryzae) spores (3–4 μm), and Aspergillus niger (A. niger) spores (6–8 μm). To simulate real experimental conditions where spore concentrations are typically low, the mixed spores were loaded into an aerosol generator to produce aerosols, which were then released into the air to mimic natural environmental exposure. At the chip outlet, an air pump was used for suction to draw air into the microfluidic chip.
To enhance detection signals for enriched spores, customized micropunch needles (5 μm and 3.7 μm in diameter, matching the size of the enrichment zone) were used to perforate the enrichment zone, exposing the spore-concentrated area. The needle tip was vertically inserted at the channel entrance to prevent lateral fluid flow in subsequent steps. Then, 1 mL of Au@Ag NRS sol was added dropwise to the enrichment zone, ensuring complete coverage of the exposed area. The sample was air-dried naturally before SERS acquisition.
In this study, a total of 240 sets of SERS spectra were collected, comprising 80 sets for each of the three spore types. The SERS spectra acquisition was performed using an XploRA PLUS Raman spectrometer (HORIBA, Palaiseau, France) within the wave number shift range of 200–2000 cm−1. Prior to spectral acquisition, wave number calibration of the Raman spectrometer was conducted to ensure alignment between measured spectral data and true wave number values. For calibration, a silicon wafer was selected as the standard reference material, with its first-order Raman peak at 520.7 cm−1 [25]. The instrument was deemed calibrated when this peak was accurately detected at 520.7 cm−1. The Raman spectrometer parameters were configured as follows: excitation wavelength at 638 nm, objective magnification of 50×, laser power attenuation of 25%, integration time of 3 s, accumulation times of 3, spectral range of 200–2500 cm−1, and confocal aperture of 2 μm.

2.4. SERS Spectral Analysis of Crop Disease Spores

As observed in Figure 3, the raw Raman signals exhibit weak intensity with ill-defined spectral features. While Au NPs provide limited enhancement compared to the original spectra, Au@Ag NRS significantly amplifies the signals of Fusarium oxysporum spores. The SERS spectra of the three types of spores are shown in Figure 4.
The SERS spectra of all three types of Crop Disease Spores are shown in Figure 4.
The raw acquired data must undergo spectral smoothing, spectral standardization, and spectral baseline correction before further analysis can be conducted.
SG (Savitzky-Golay) smoothing is a polynomial fitting-based method for spectral data smoothing [26]. It estimates spectral curves by performing polynomial fitting on given data and uses the fitting results to smooth the data. SG smoothing effectively smooths spectral data while preserving the characteristic features of spectral curves, making it widely applicable in spectral preprocessing and signal processing domains.
Raman spectral standardization is a common preprocessing method utilized to eliminate systematic errors in spectra, thereby enhancing the comparability and interpretability of spectral data. Standard Normal Variate (SNV) standardization transforms data into a standard normal distribution, effectively removing intensity offsets and multiplicative scattering effects from spectra, which significantly improves data quality and reliability.
Fluorescence interference constitutes one of the most disruptive factors in Raman detection. It manifests as a broad, sloping background beneath the Raman spectrum, with an intensity potentially several orders of magnitude higher than that of Raman scattering signals. The primary aim of baseline correction is to eliminate such fluorescence interference [27]. Baseline correction methods for eliminating fluorescence interference are primarily categorized into two types: Mathematical Baseline Correction and Experimental Baseline Correction. Mathematical baseline correction involves constructing a fluorescence baseline model using mathematical functions and subtracting it from the Raman spectrum [28].

2.5. MLP Classification of Pathogenic Spores

The Multilayer Perceptron (MLP) consists of an input layer, multiple hidden layers, and an output layer. Its core principle involves propagating input data to each neuron in the network, then computing the final output by combining the outputs of these neurons through activation functions. During propagation, each neuron is fully connected to all neurons in the previous layer, with each connection assigned a weight. These weights are learned and updated via the backpropagation algorithm [29].
The advantages of the MLP include its capability to handle highly nonlinear data, strong adaptability to complex problems, and performance improvements through increasing the number of hidden layers and neurons. However, its disadvantages involve the need for substantial computational resources and large datasets, a tendency to converge to local optima, and potential issues such as overfitting.
During model training, 50 epochs and a batch size of 168 were employed, meaning the entire training set was processed 50 times through the neural network, with each iteration randomly selecting 168 samples for weight updates. After training, the model’s performance was evaluated on the test set.

3. Results and Discussion

3.1. Analysis of Preparation Results for Au NRS and Au@Ag NRS

3.1.1. Effect of Different Concentrations on Au NRS Formation

Based on the classical seed-mediated growth method, the amount of AgNO3 significantly influences the synthesis of Au NRS. To obtain gold nanorods (Au NRs) with optimal quality, the synthesis was conducted with reagent dosages specified in Table 2. Groups 1, 2, and 3 were designed to investigate the impact of AgNO3 volume variation, with 150 μL, 250 μL, and 350 μL of AgNO3 solution, respectively.
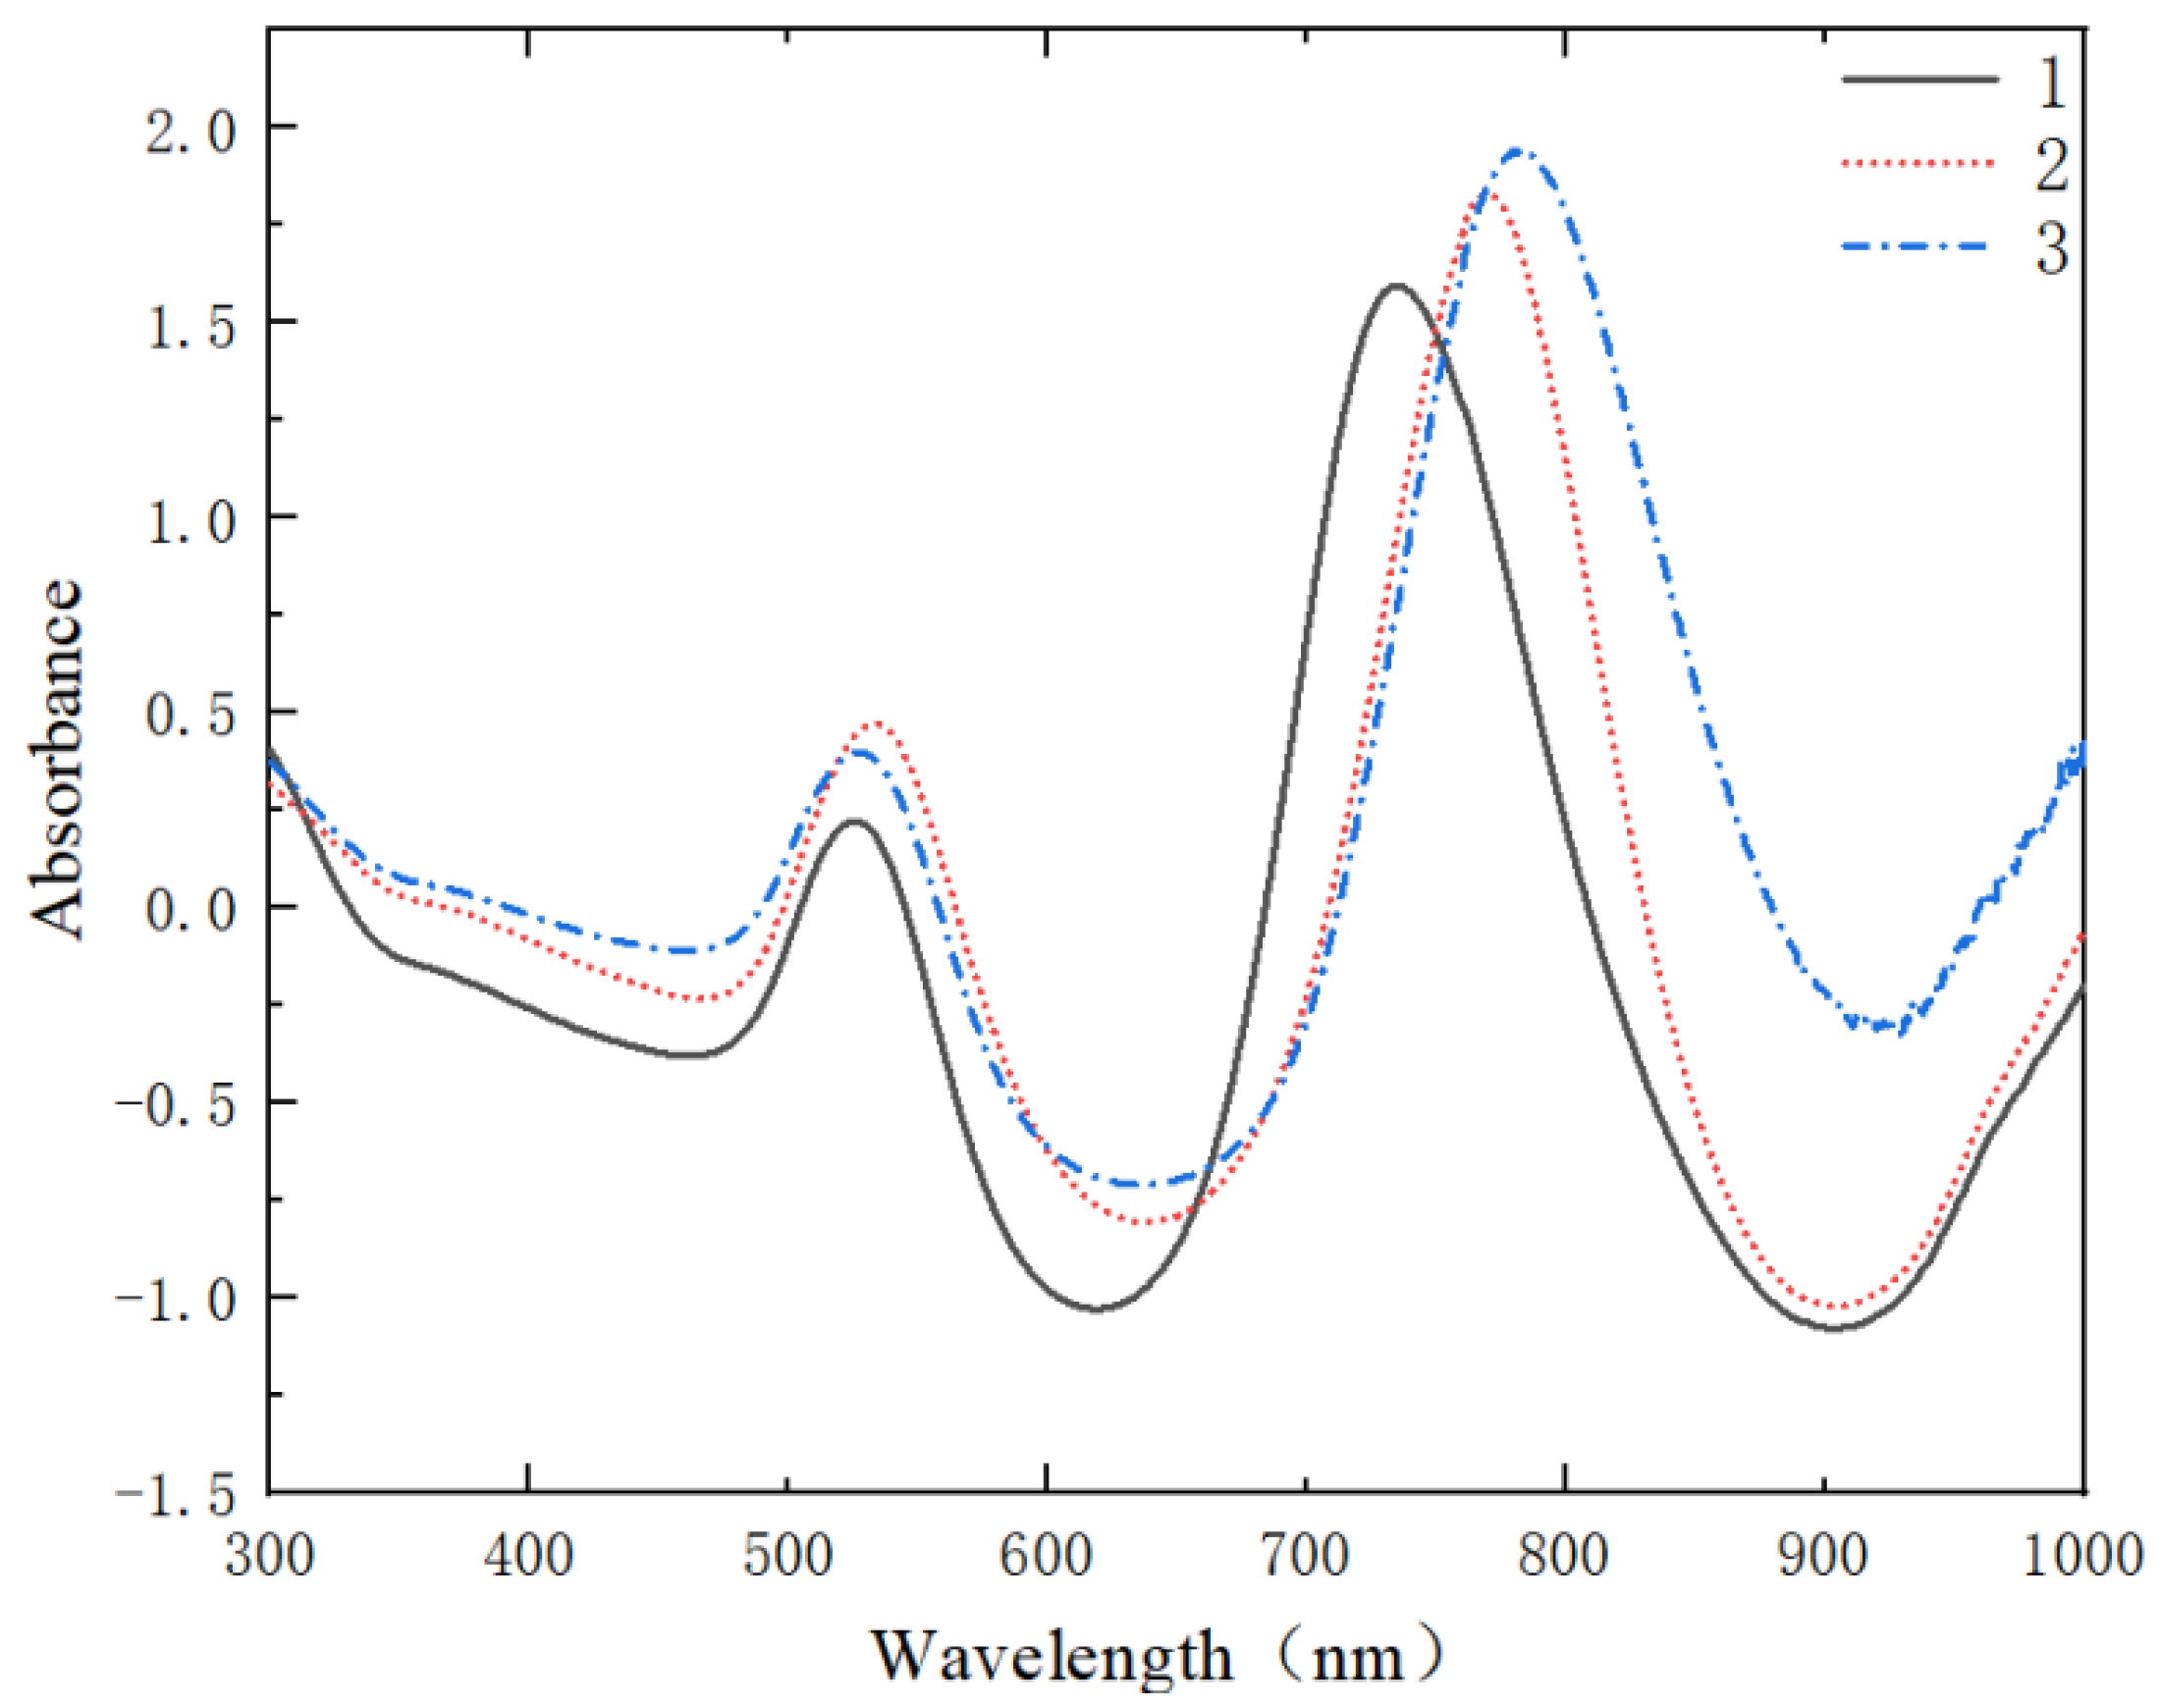
During the synthesis of Au NRS (Gold Nanorods), UV-vis-NIR spectroscopy is typically employed to monitor their morphology and size. As observed in Figure 5, the synthesized Au NRS exhibits two distinct peaks: the transverse surface plasmon resonance absorption peak and the longitudinal surface plasmon resonance absorption peak. For Groups 1–3, as the concentration of silver nitrate increases, the transverse surface plasmon resonance absorption peak undergoes a continuous red shift, indicating an increase in the length of Au NRS. In contrast, the longitudinal surface plasmon resonance absorption peak remains almost unchanged, suggesting that the diameter of the Au NRS remains constant. Therefore, the aspect ratio of Au NRS is primarily influenced by changes in length, and the UV-vis-NIR absorption spectra of Au NRS are primarily determined by variations in their aspect ratio.
An increase in silver nitrate (AgNO3) dosage induces a red shift and enhancement in the absorption peaks of gold nanorods (Au NRS). This is attributed to insufficient reduction of gold ions when AgNO3 is reduced, which slows or interrupts Au NR formation and broadens size distribution, thereby altering peak position and intensity (Figure 6). Within a specific range, higher AgNO3 concentrations yield Au NRS with larger aspect ratios. AgNO3 acts as an oxidant that promotes gold ion reduction and nucleation while modulating growth kinetics. Reduced AgNO3 lowers growth rates, leading to similar trends in length and diameter expansion—thus decreasing the aspect ratio.
As shown in the particle size distribution histograms for Groups 1–3 in Figure 7, the relative frequency and cumulative frequency were fitted using LogNormal and Boltzmann functions, respectively. The histograms statistically analyzed the relative frequency of particle sizes and the dimensions corresponding to cumulative frequencies of 10%, 50%, and 90% (d10, d50, d90). Nonlinear fitting yielded the geometric mean (μg) and standard deviation (σ): Group 1 exhibited d10 = 64.08 nm, d50 = 64.90 nm, d90 = 65.64 nm, μg = 65 nm, σ = 0.0781; Group 2 showed d10 = 68.99 nm, d50 = 69.81 nm, d90 = 70.50 nm, μg = 70 nm, σ = 0.0410; Group 3 displayed d10 = 72.16 nm, d50 = 72.94 nm, d90 = 73.70 nm, μg = 73 nm, σ = 0.0700. Therefore, the synthesized Au NRS demonstrated uniformity meeting experimental requirements, and Group 2 particles with a geometric mean length of 70 nm were selected for further synthesis.

3.1.2. Synthesis Analysis of Au@Ag NRS

As shown in Figure 8, the UV-vis-NIR absorption spectrum of the synthesized Au@Ag NRS was compared with that of Au NRS. The spectrum exhibited a blue shift of the characteristic peak and the emergence of an additional peak. The UV-vis-NIR absorption spectrum of Au@Ag NRS displayed three distinct peaks at 703 nm, 378 nm, and 342 nm. The peak at 703 nm arises from the transverse surface plasmon resonance (TSPR) of the nanorods, while the peak at 342 nm originates from their longitudinal surface plasmon resonance (LSPR) [30]. The peak at 378 nm is attributed to the localized surface plasmon resonance (LSPR) of the silver nanoshell [31].
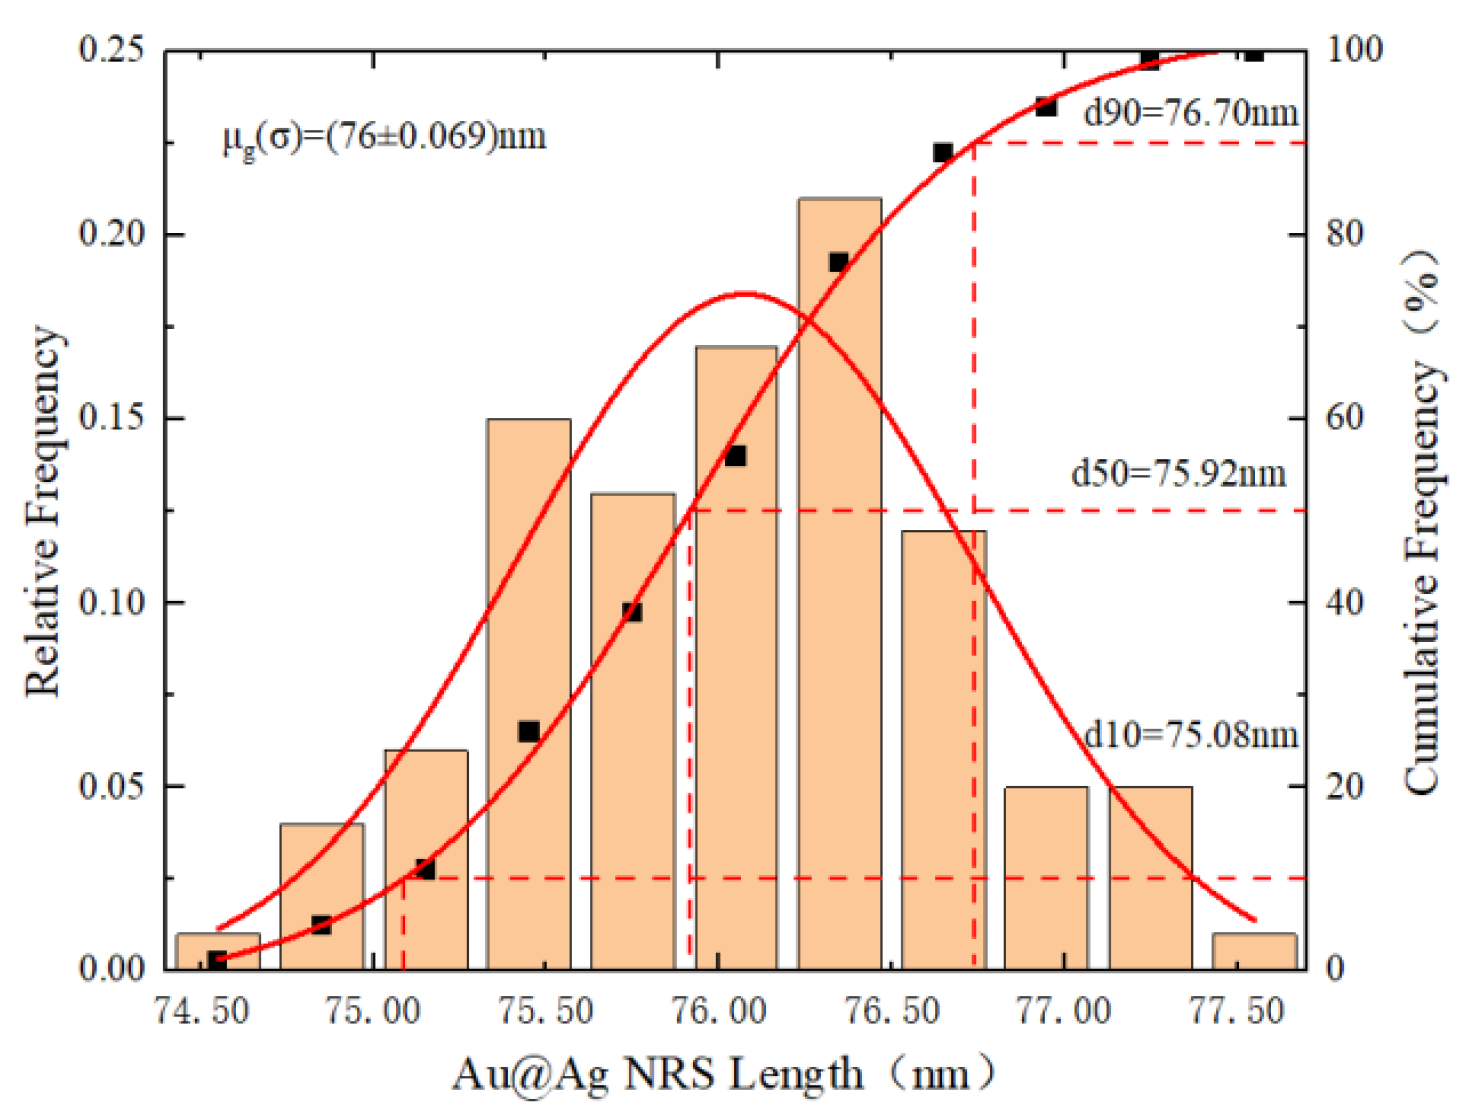
Figure 9 presents the TEM image of Au@Ag NRS, and Figure 10 shows the statistical distribution of their lengths. The geometric mean length of the nanorods was 76 nm with a diameter of 20 nm. The size distribution histogram and TEM images confirm that the synthesized nanorods are uniform and monodisperse. The TEM image clearly reveals a silver shell coating the surface of the Au NRS. Based on calculations using particle size analysis software, the shell thickness is approximately 3 nm per side. Both UV-vis-NIR and TEM results demonstrate the successful synthesis of Au@Ag NRS with an average size of 76 × 22 nm.

3.1.3. EDS Analysis of Au@Ag Core-Shell Structures

To further characterize the morphology of Au@Ag NRS, Energy Dispersive Spectroscopy (EDS) analysis was performed to determine its chemical composition, including the relative concentrations of the gold core and silver shell. Prior to EDS analysis, the sample was prepared as a thin film and placed in a transmission electron microscope. The resulting spectrum reveals the elements present in the sample and their relative concentrations. By analyzing the characteristic peaks of gold and silver, the composition and relative concentrations of the Au@Ag nanorods were determined [24].
The EDS elemental mapping of Au in Au@Ag NRS is shown in Figure 11A, while the Ag mapping is displayed in Figure 11B, with the corresponding TEM image in Figure 11C. The elemental composition ratios are summarized in Table 3. As illustrated in Figure 11, the core exhibits a rod-shaped morphology corresponding to Au, surrounded by a cylindrical shell composed of Ag. According to the EDS elemental distribution in Table 3, Au accounts for 33.83% and Ag for 9.89%. Notably, several elements beyond Au and Ag show significant percentages: C and Cu originated from the copper grid with carbon support film used during TEM sample preparation, O likely derived from atmospheric oxygen, and trace Si potentially from glassware components.

3.1.4. R6G Detection Using Au@Ag NRS

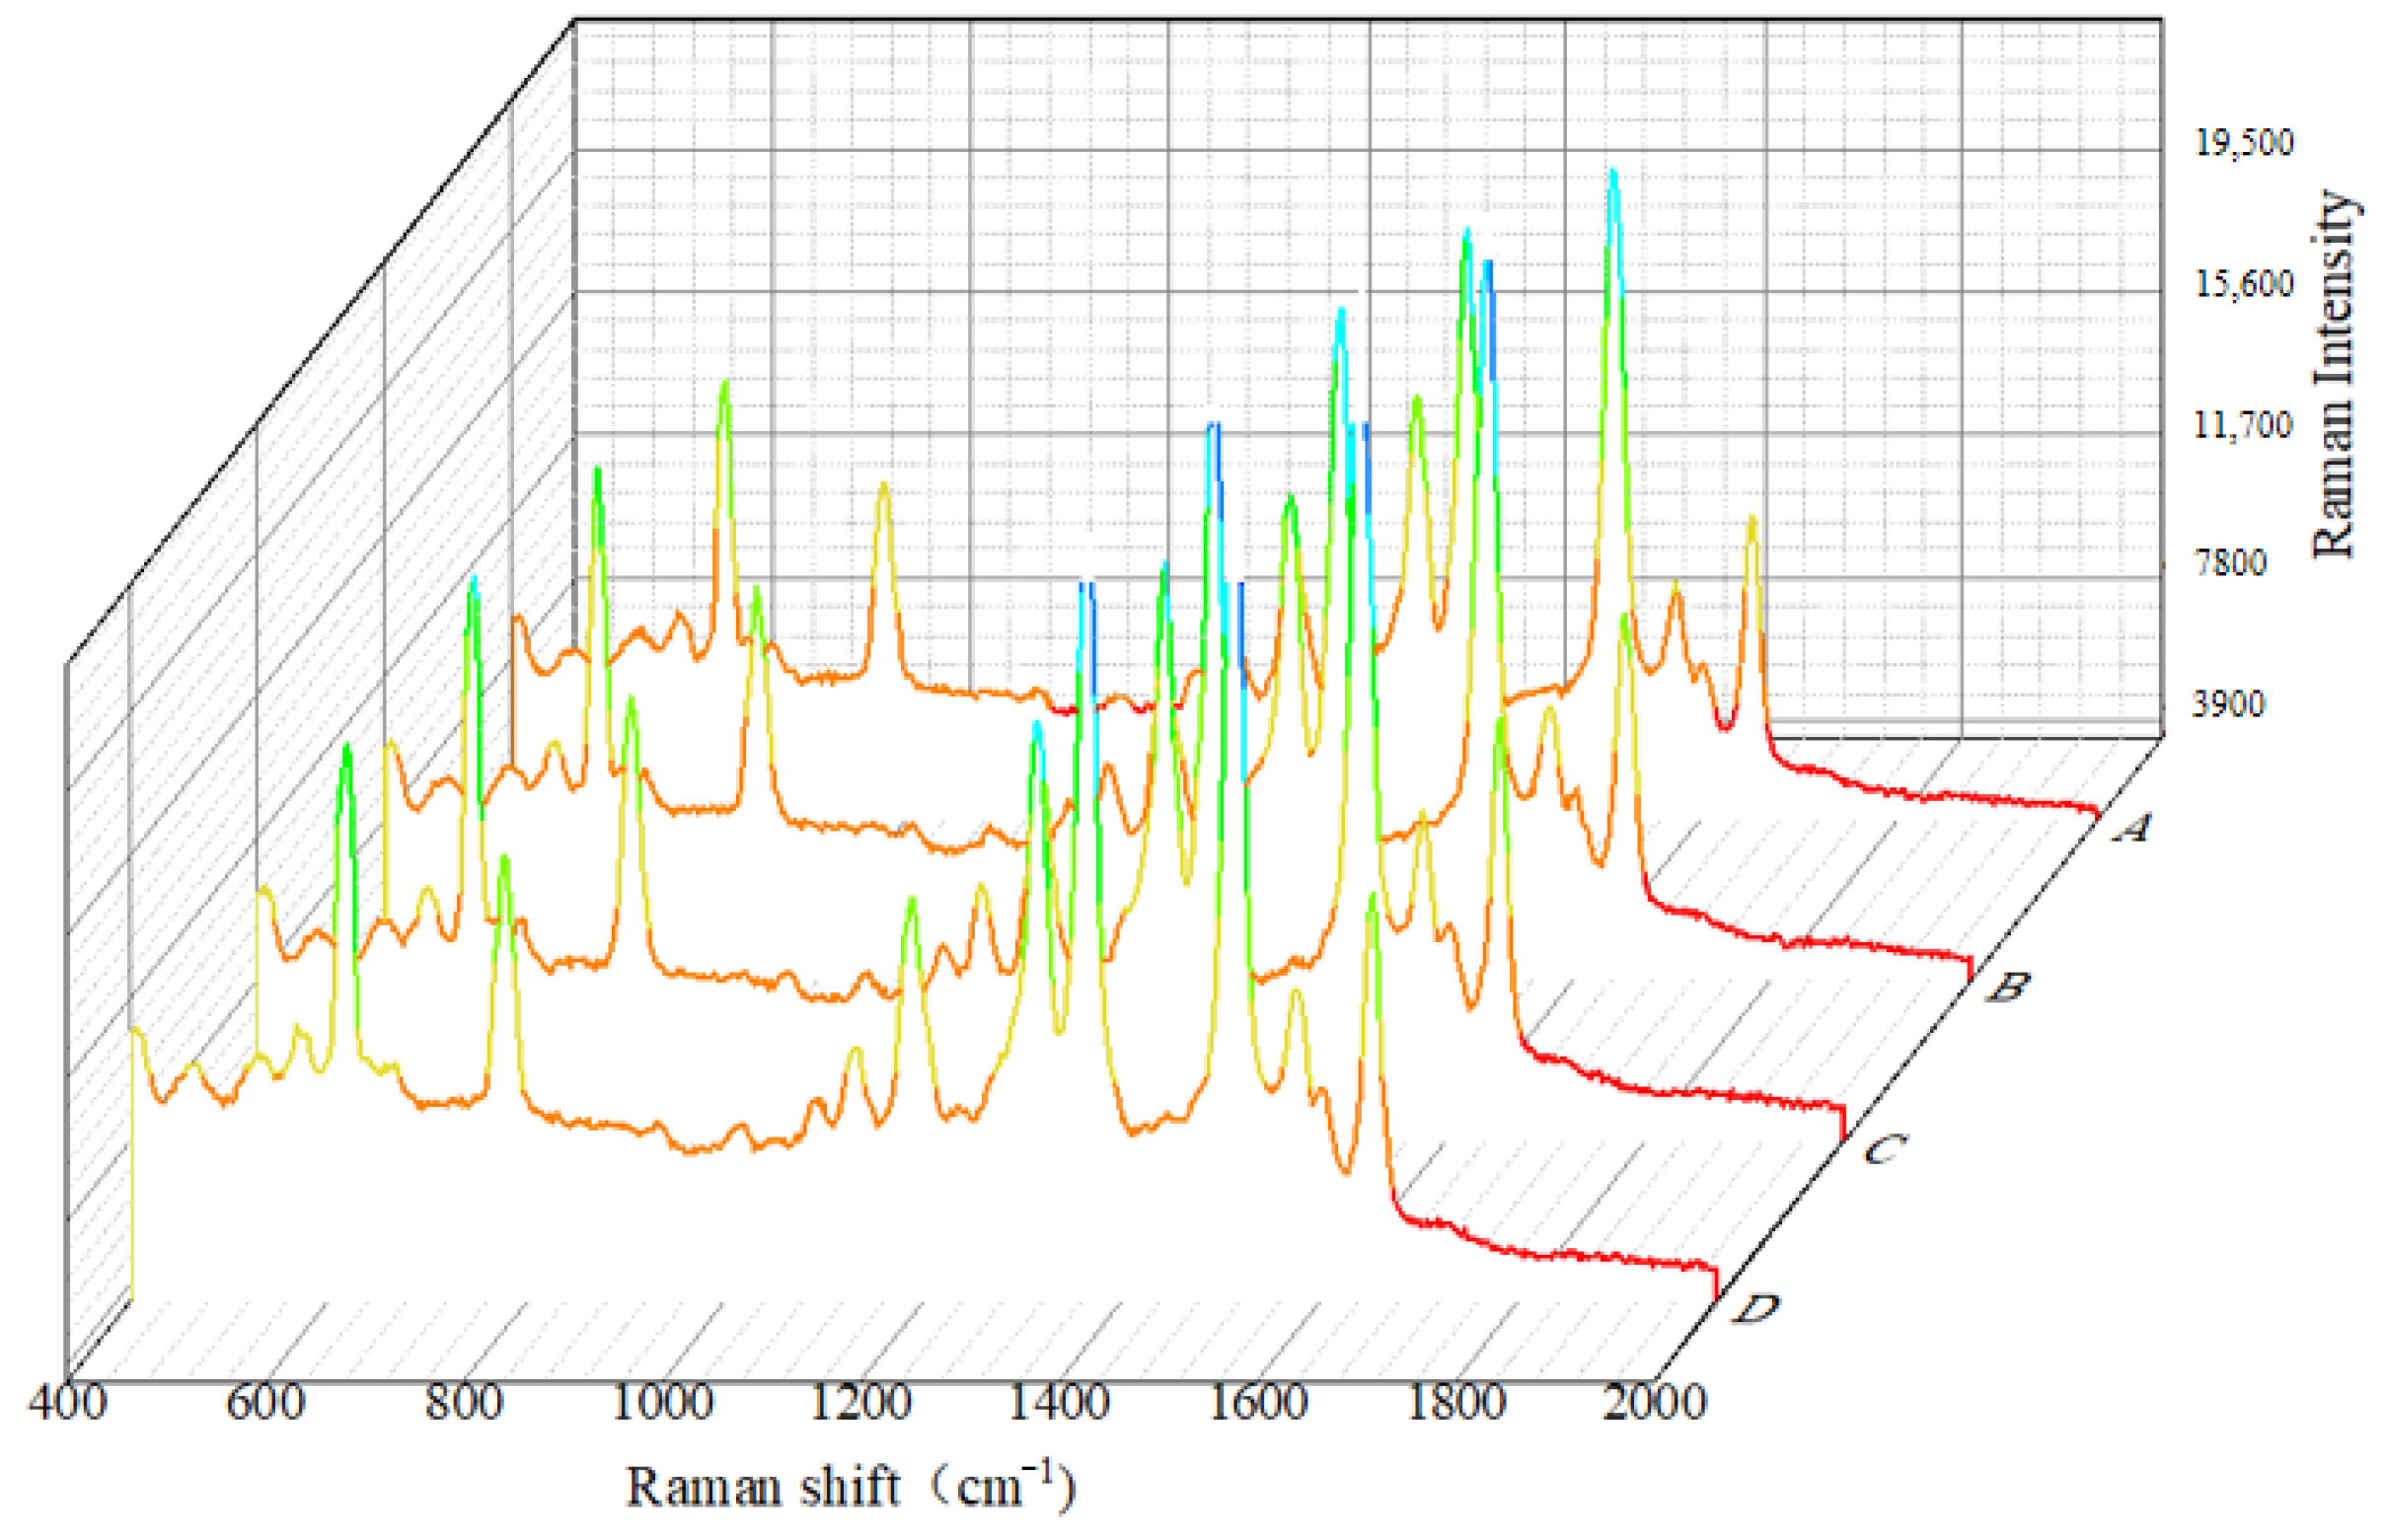
Research employed Rhodamine 6G (R6G) as a model molecule to evaluate the enhancement characteristics of Raman signals, primarily due to its large Raman scattering cross-section, distinct and rich Raman characteristic peaks, good chemical stability, and efficient adsorption onto the surfaces of metal nanostructures, making it a classic probe molecule in SERS studies [32]. Therefore, to assess the reproducibility of the Au@Ag NRS, four separate batches of Au@Ag NRS sol were taken and used for detection and analysis of the reproducibility against the same batch of R6G at a concentration of 10−3 mol/L. The detection results are shown in Figure 12.
To evaluate the enhancement effect of Au@Ag NRS, the Raman signals of Rhodamine 6G (R6G) at varying concentrations were analyzed using Au@Ag NRS. The intensity of the prominent 1514 cm−1 characteristic peak was selected for characterization [25], as illustrated in Figure 13.
As shown in Figure 11, a linear correlation exists between the logarithm of R6G concentration and the intensity of SERS characteristic peaks. The linear relationship is described by the equation y = 2396.4x + 27,497.8, with a coefficient of determination (R2) of 0.97, indicating an excellent fit of the model to the experimental data.
The enhancement factor (EF) in Raman spectroscopy is calculated using the following formula:
E F = I S E R S C R a m a n I R a m a n C S E R S
In the formula, ISERS and IRaman represent the SERS-enhanced intensity and non-enhanced Raman intensity of the analyte measured by the spectrometer, respectively, while CSERS and CRaman denote the corresponding analyte concentrations during SERS and non-enhanced measurements. Using the SERS and non-enhanced peak intensities of R6G at the 1514 cm−1 Raman shift for calculation, the results are as follows:
E F = 13,105 × 1 98 × 1 × 10 6 = 1.33 × 10 8
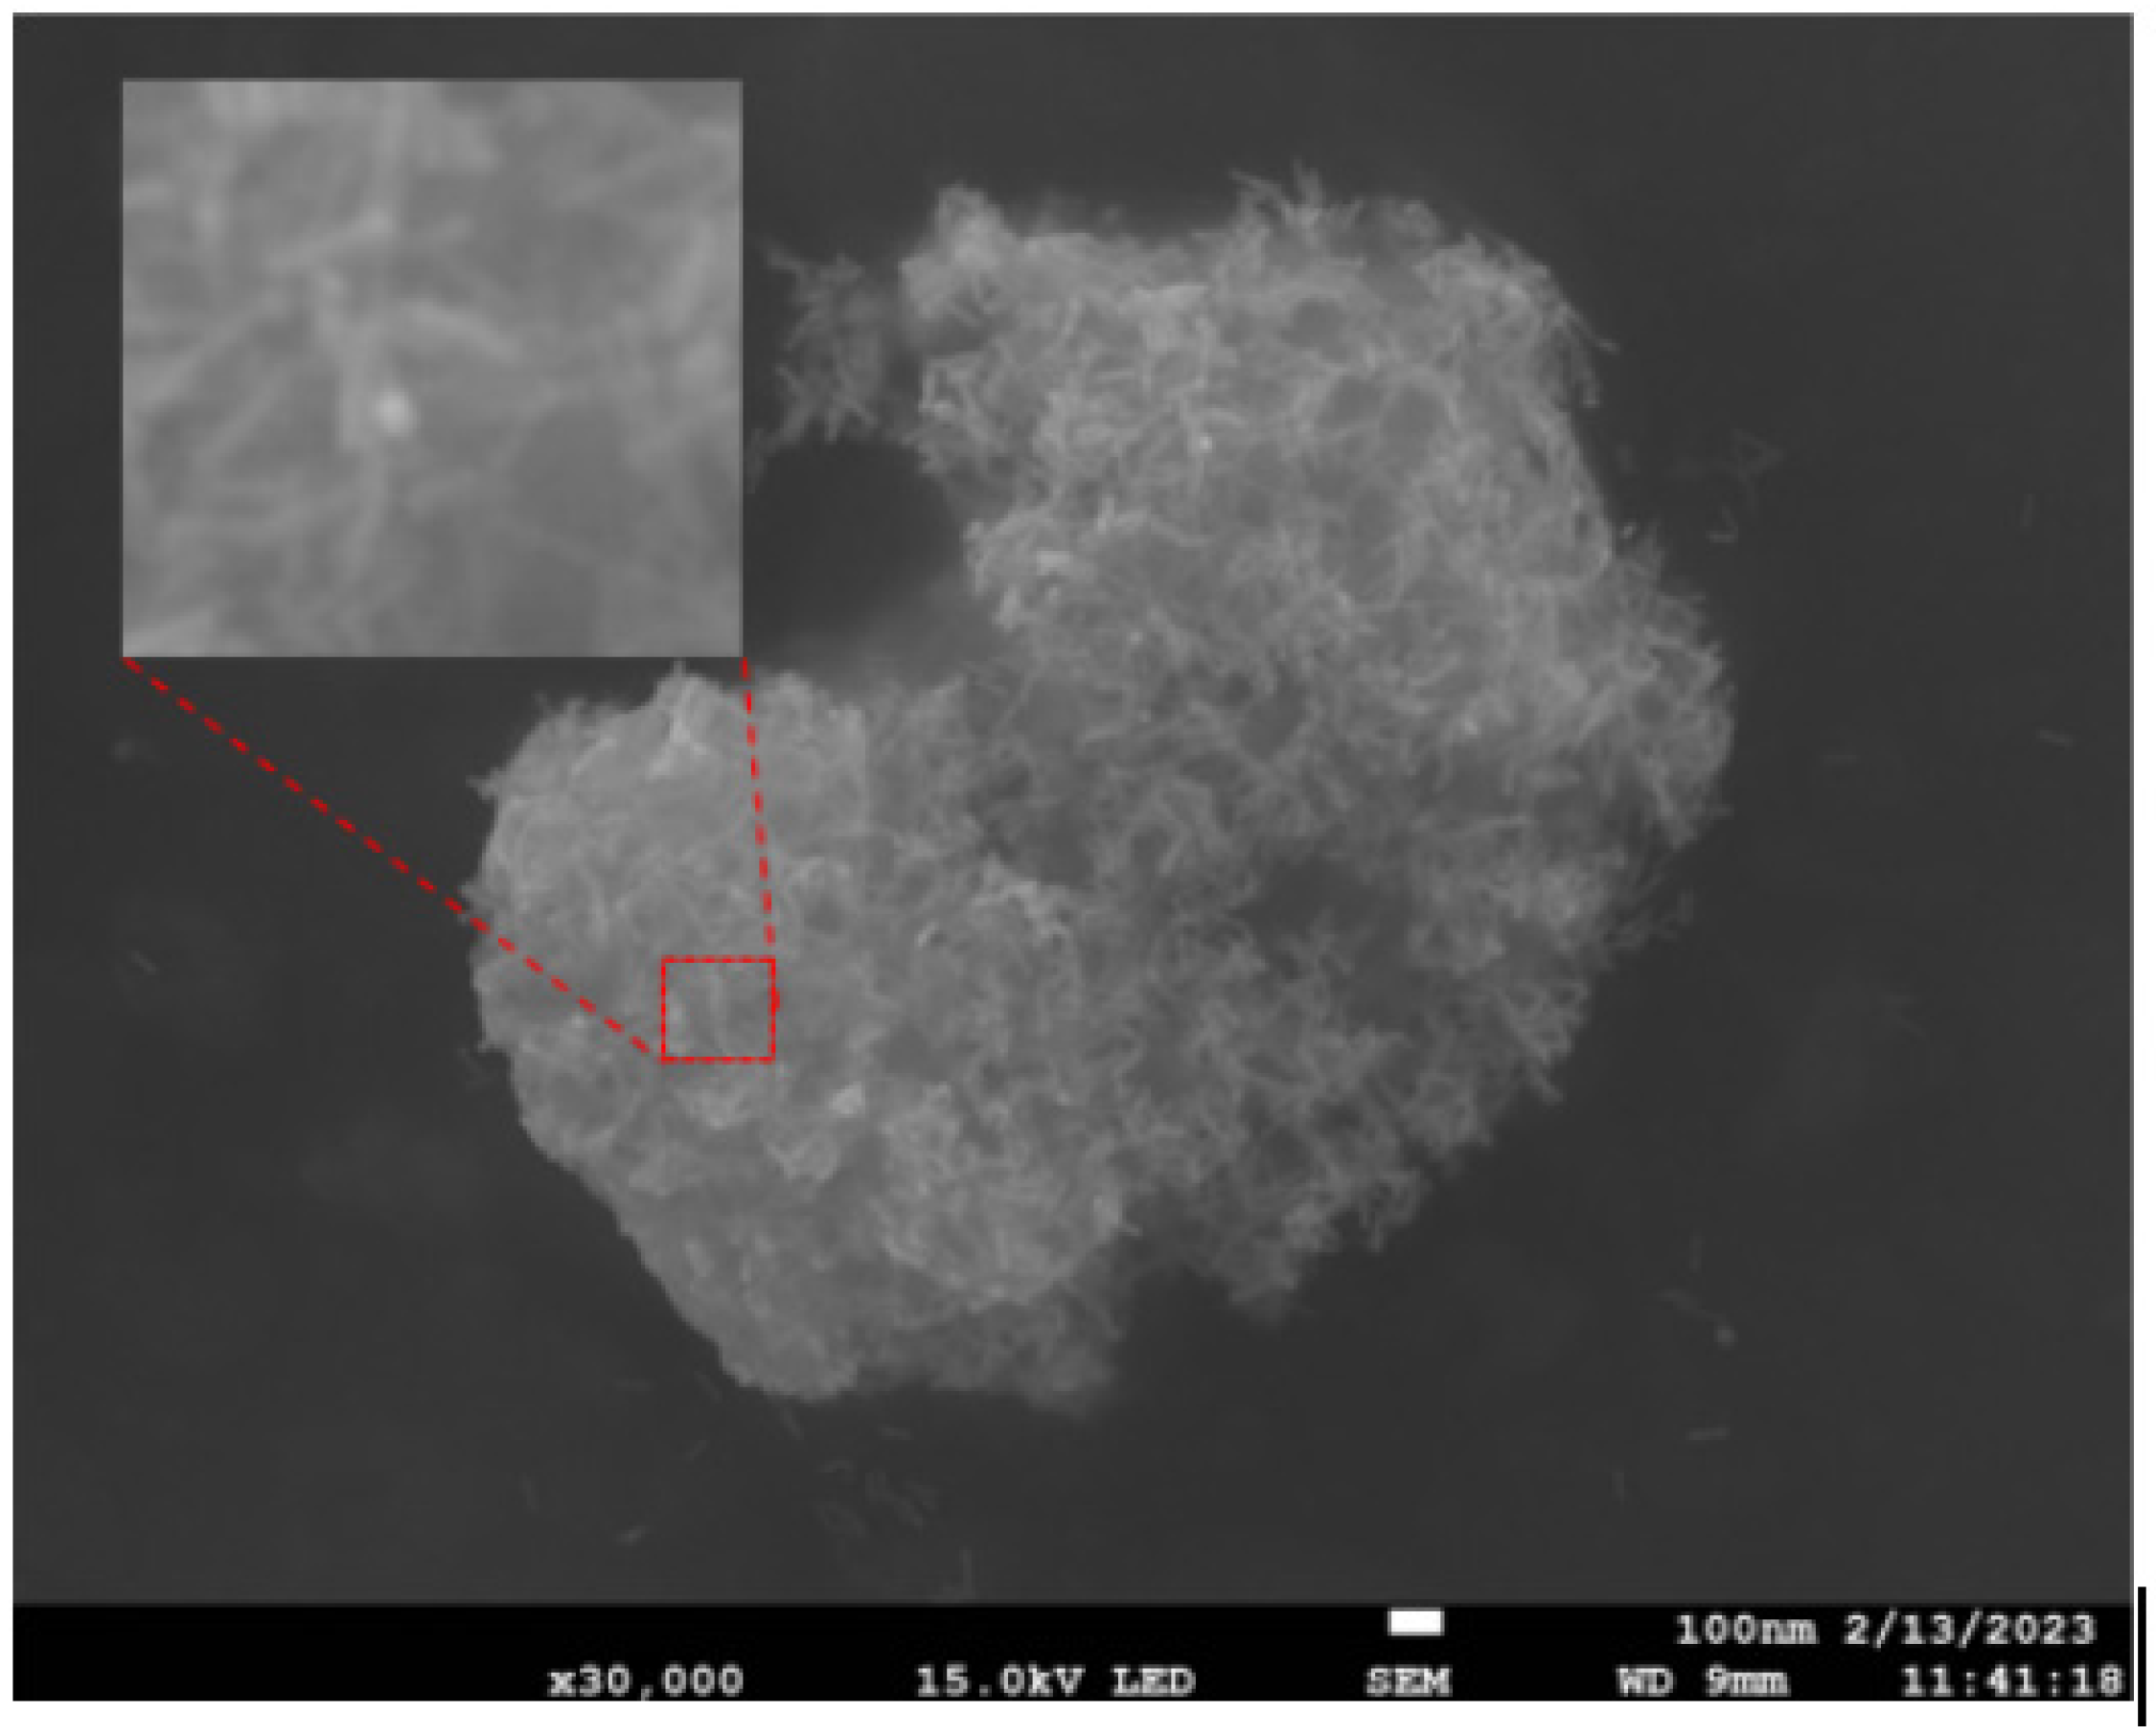
The binding mechanism between Au@Ag NRS and Crop Disease Spores is based on electrostatic adsorption. Typically, Au@Ag NRS particles carry a positive surface charge, while fungal spores possess a negative surface charge [25]. Thus, when Au@Ag NRS is applied to Crop Disease Spores, they bind effectively. Scanning electron microscopy (SEM) analysis of the combined enrichment zone revealed that the spore surfaces were densely covered with rod-shaped structures (Figure 14), identified as Au@Ag NRS. These structures significantly enhance the electromagnetic field for subsequent SERS detection of the spores.

3.2. SERS Spectral Analysis Results of Crop Disease Spores

3.2.1. Spectral Smoothing

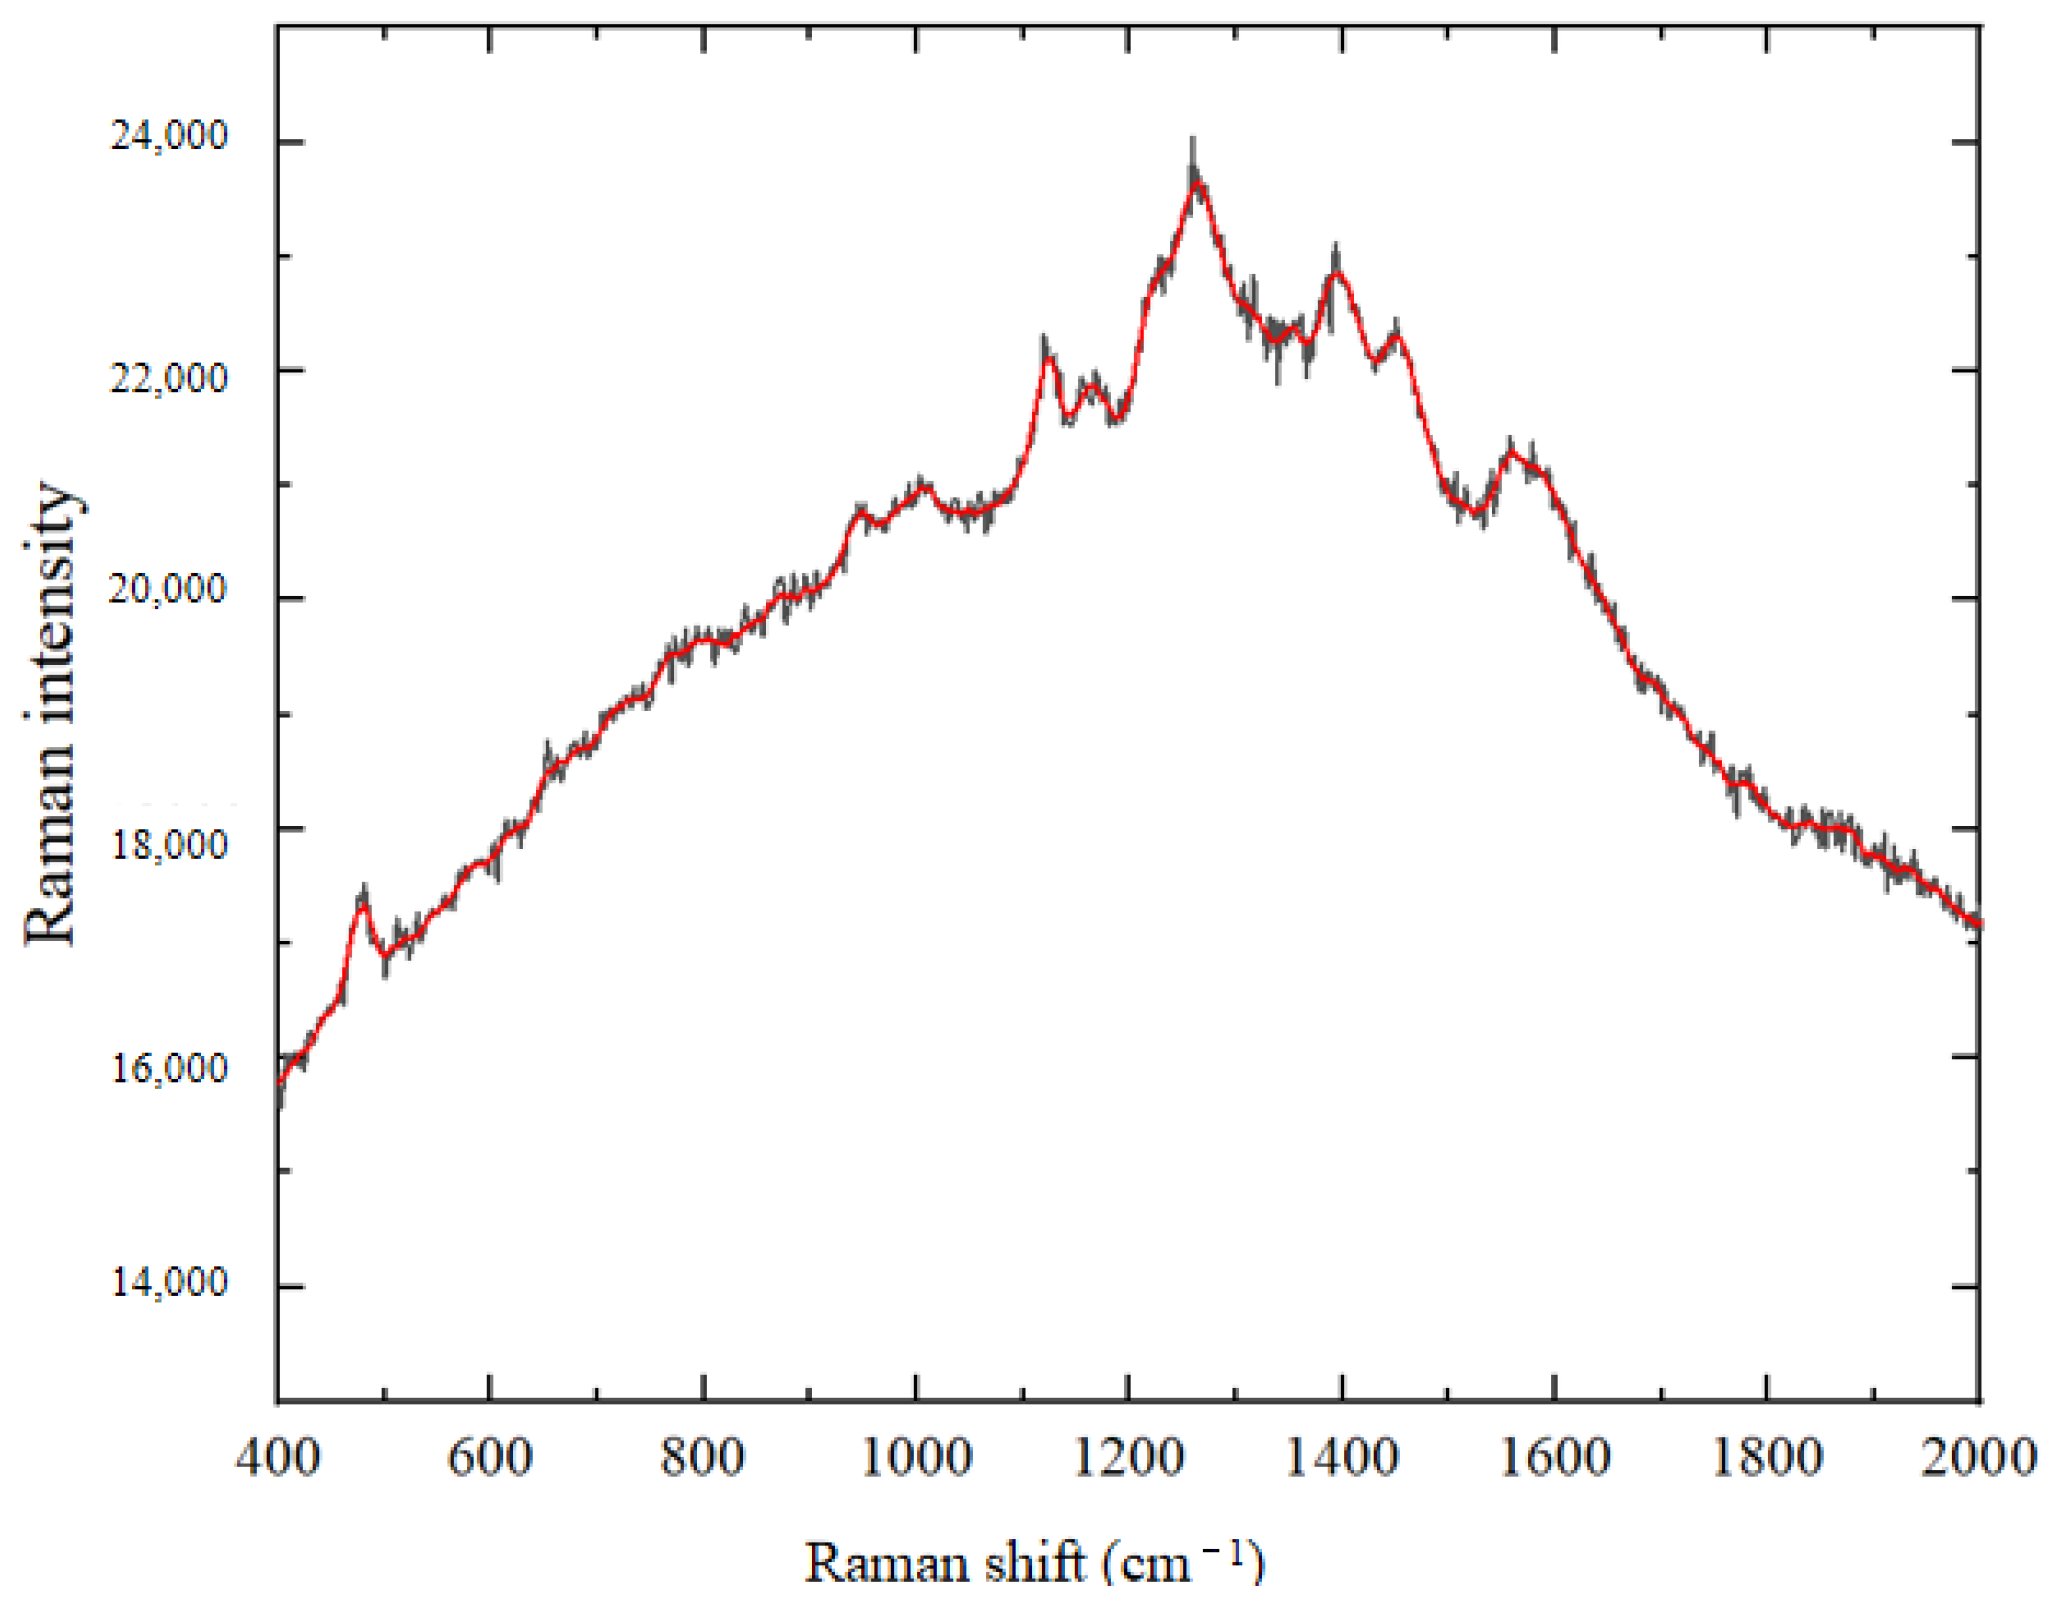
The processing results are shown in Figure 15.

3.2.2. Spectral Standardization

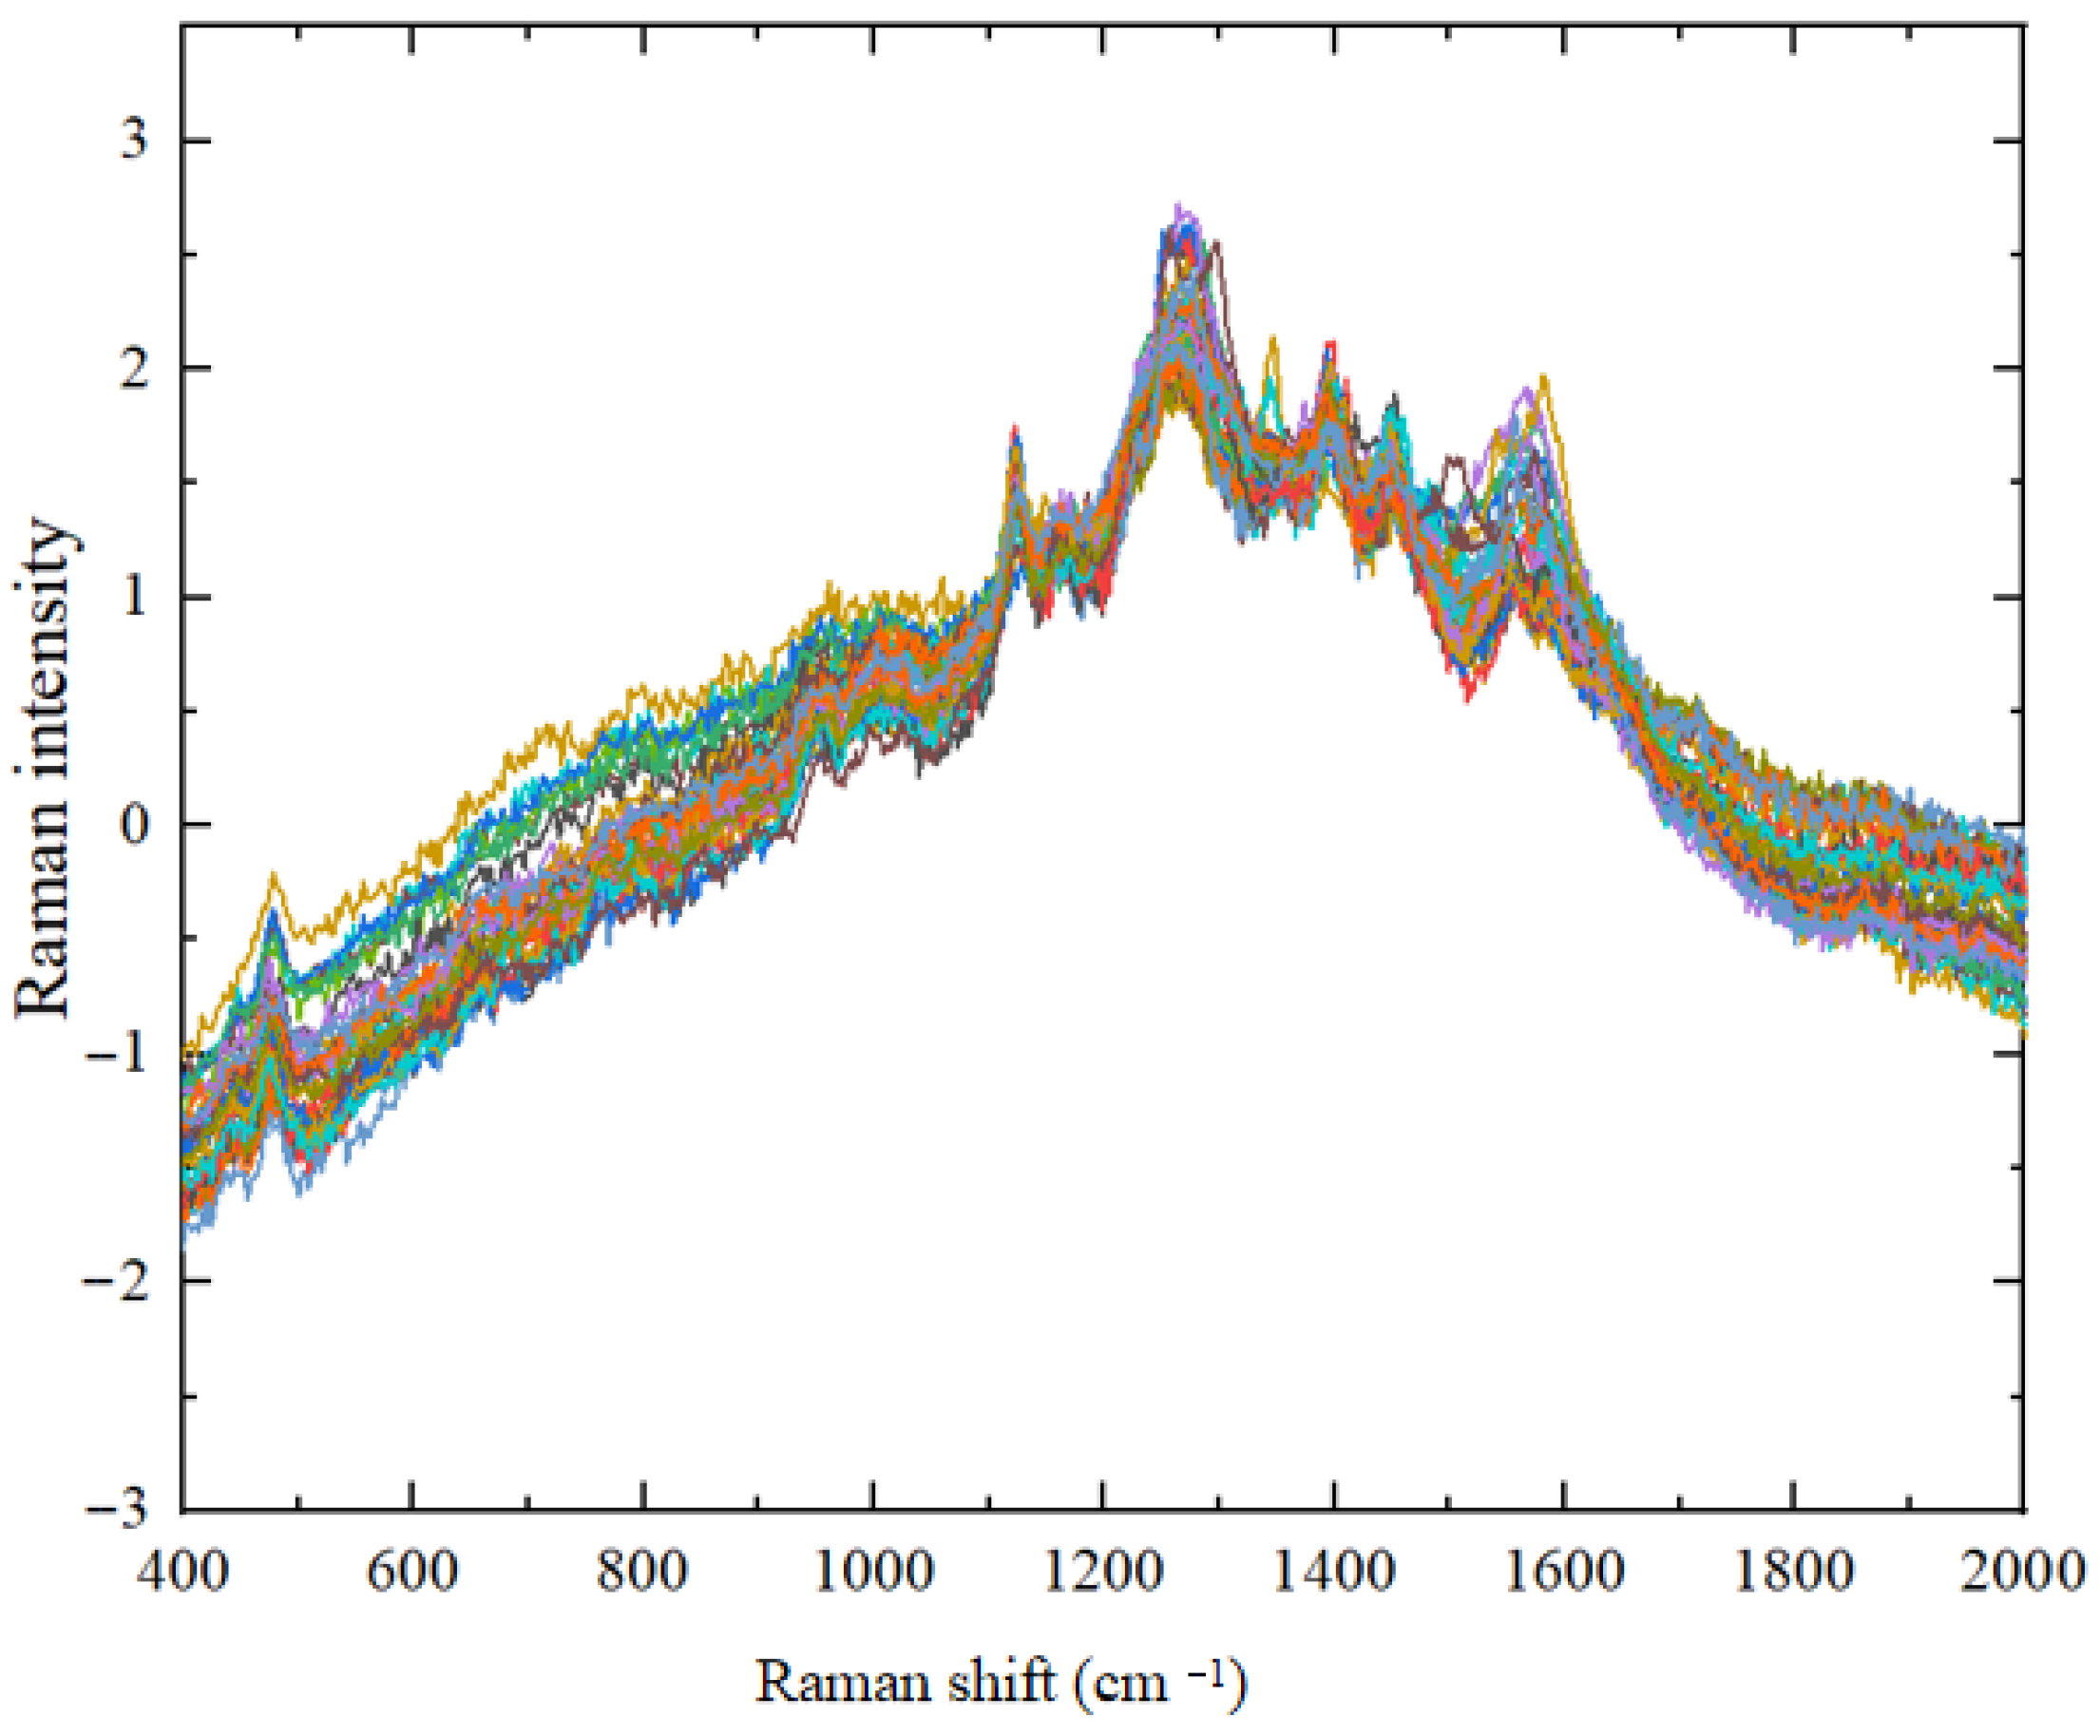
The processing results are illustrated in Figure 16.

3.2.3. Baseline Correction of Spectral Data for Crop Disease Spores

Asymmetric Least Squares (ALS), Polynomial Fitting Baseline Correction, and Locally Weighted Regression (LWR) were selected for baseline correction in this study, with the correction results shown in Figure 17.
As shown in Figure 17, the Adaptive Iteratively Reweighted Penalty Least Squares (ALS) baseline correction optimally preserved the original Raman peaks of Fusarium oxysporum spores using Au@Ag NRS while effectively eliminating fluorescence interference. Locally Weighted Regression (LWR) ranked second in performance. Compared to polynomial fitting and LWR, ALS demonstrated superior robustness and computational efficiency, more effectively removing noise and offset effects across diverse sample types. Therefore, ALS was selected as the baseline correction algorithm for this study.

3.3. Analysis of SERS Fingerprint Information for Crop Diseases

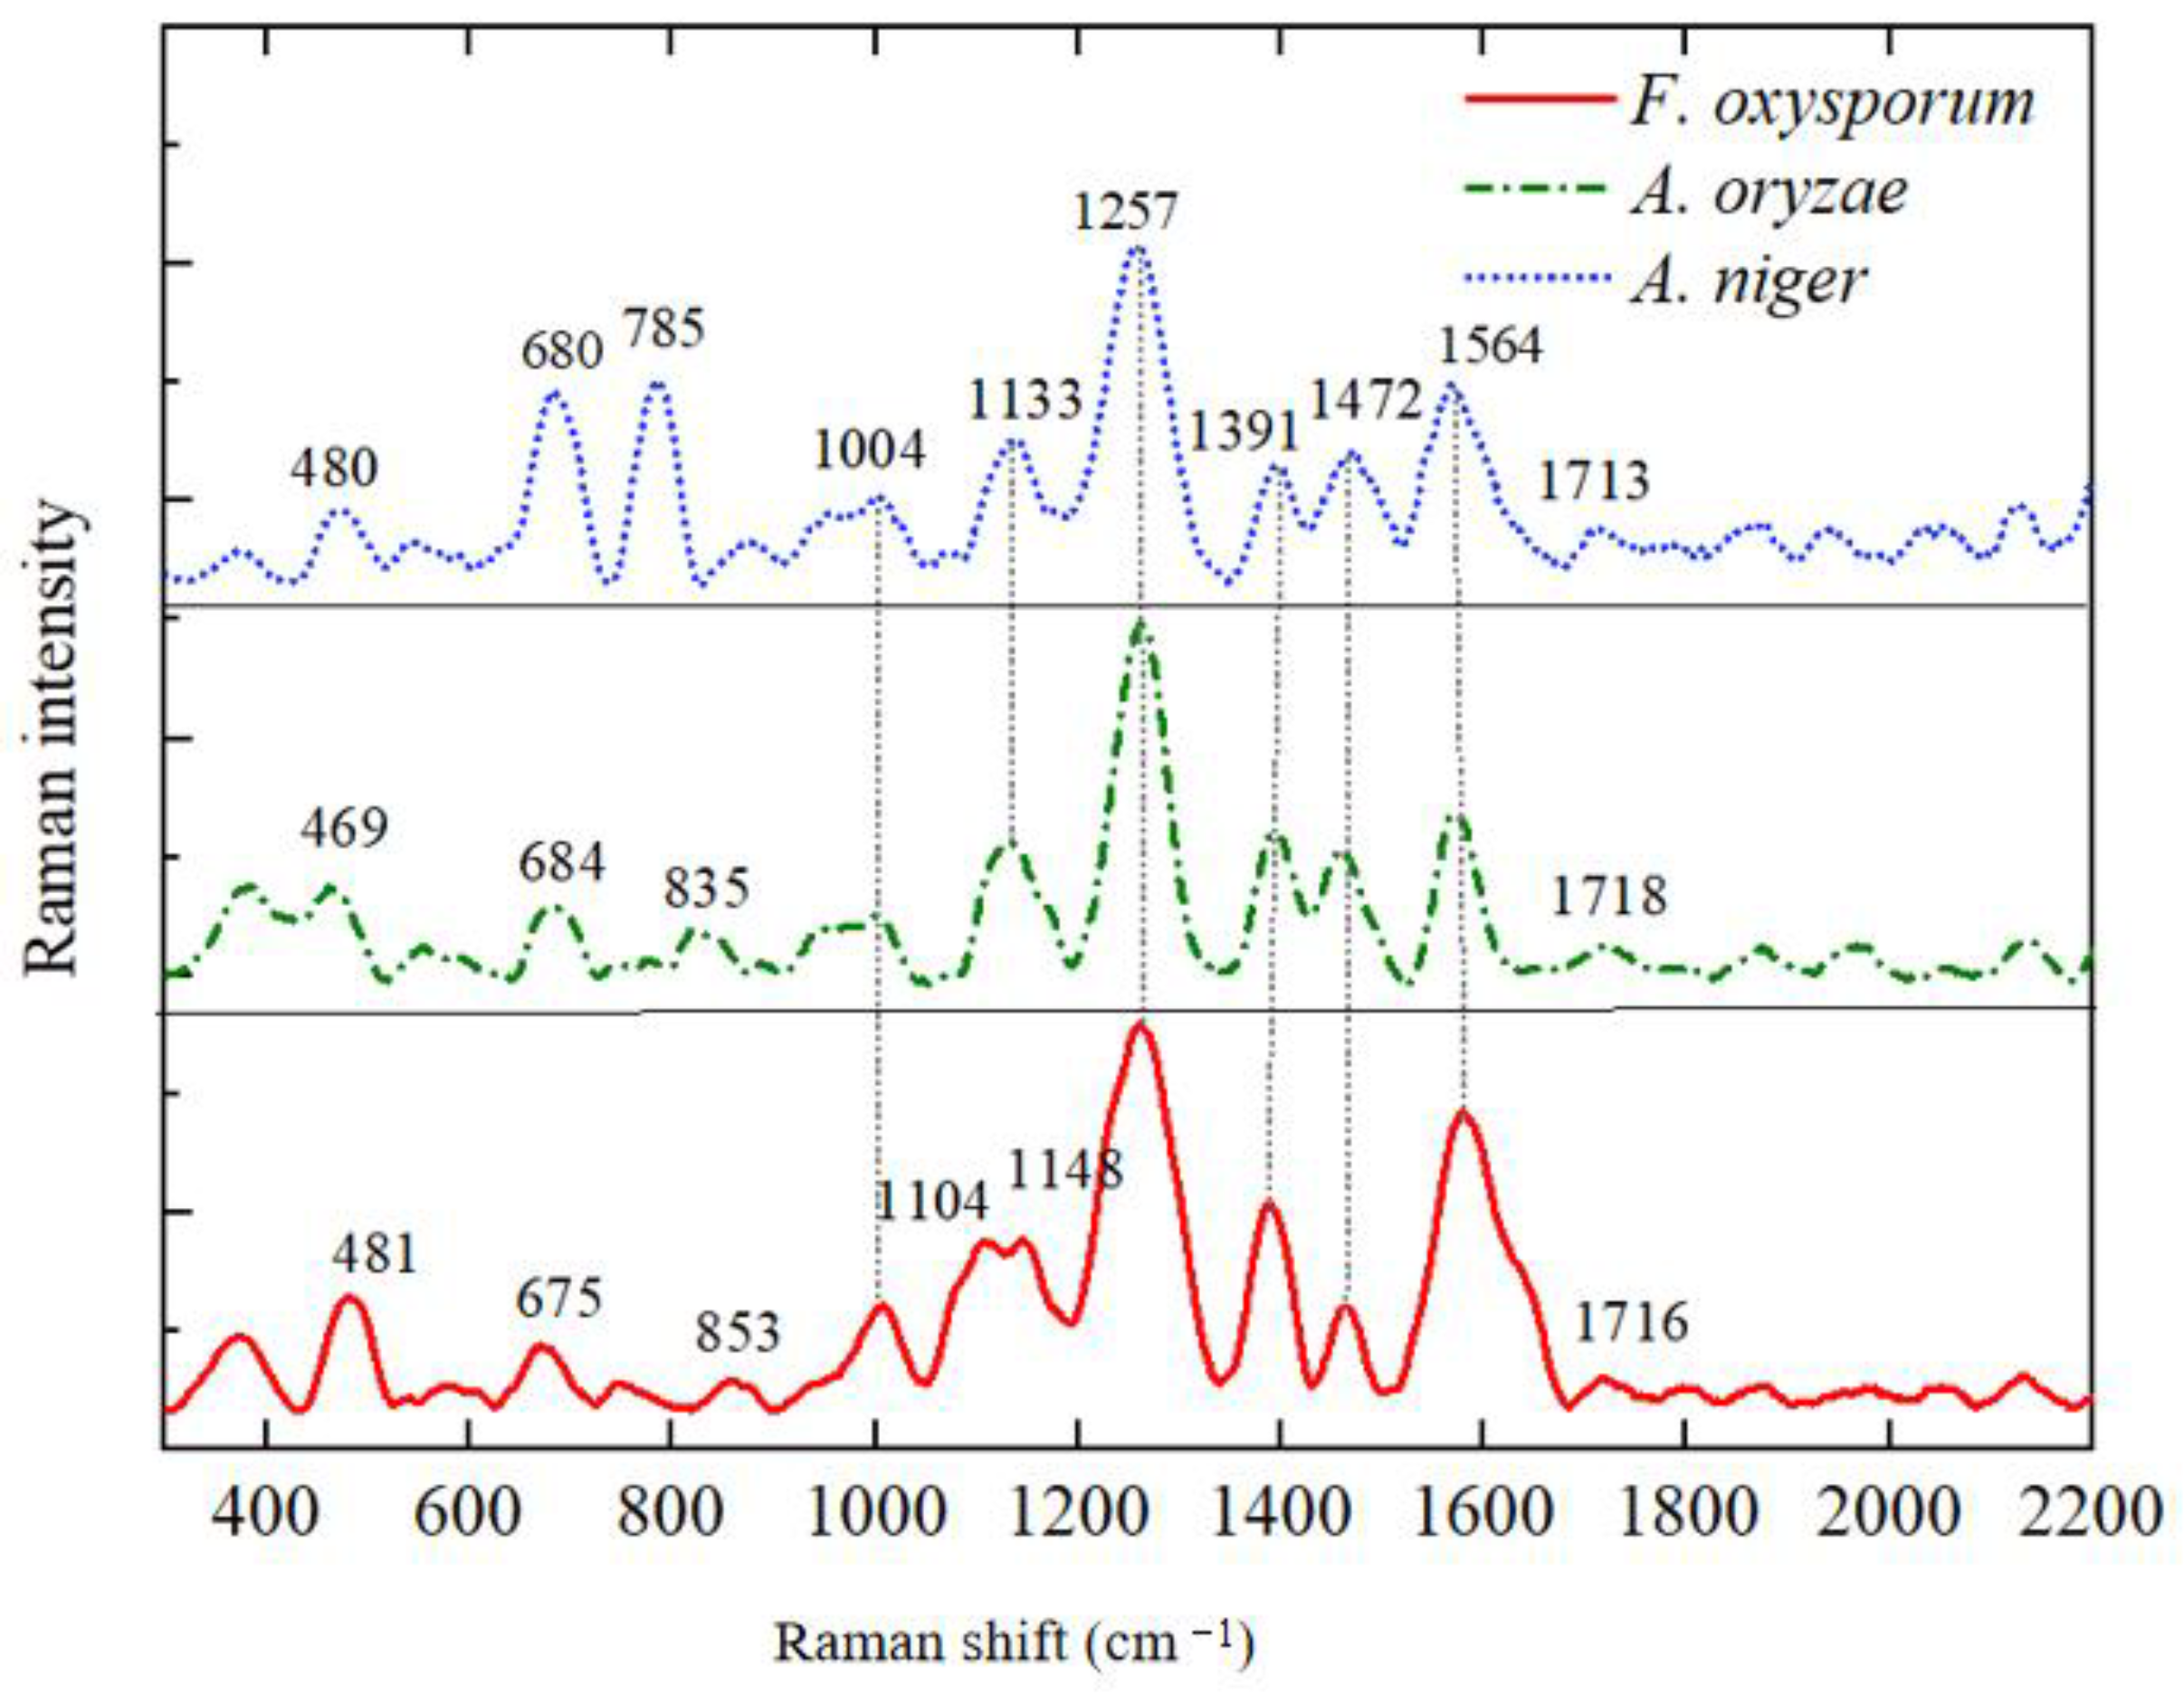
The primary principle of SERS for detecting crop disease spores lies in capturing the changes in molecular polarizability within these spores. After processing the raw Raman spectra through Standardization and Baseline Correction, the average spectra of three types of disease spores were analyzed, as shown in Figure 18.
As illustrated in Figure 18 and Table 4, the Raman fingerprint spectra of crop disease spores exhibit both similarities and differences. Merely relying on prominent characteristic peaks for spore classification modeling would lead to inaccuracies. Therefore, precise classification modeling of disease spores requires algorithmic screening of characteristic peaks across the full spectral range.

3.4. Classification of SERS Spectra

3.4.1. Dimensionality Reduction of SERS Spectra

Principal Component Analysis (PCA) is a widely used linear dimensionality reduction method that transforms high-dimensional data into a low-dimensional representation while preserving the maximum variance of the data. The core principle of PCA involves projecting the original data onto a new coordinate system, such that the variance of the projected data is maximized in this new coordinate system.
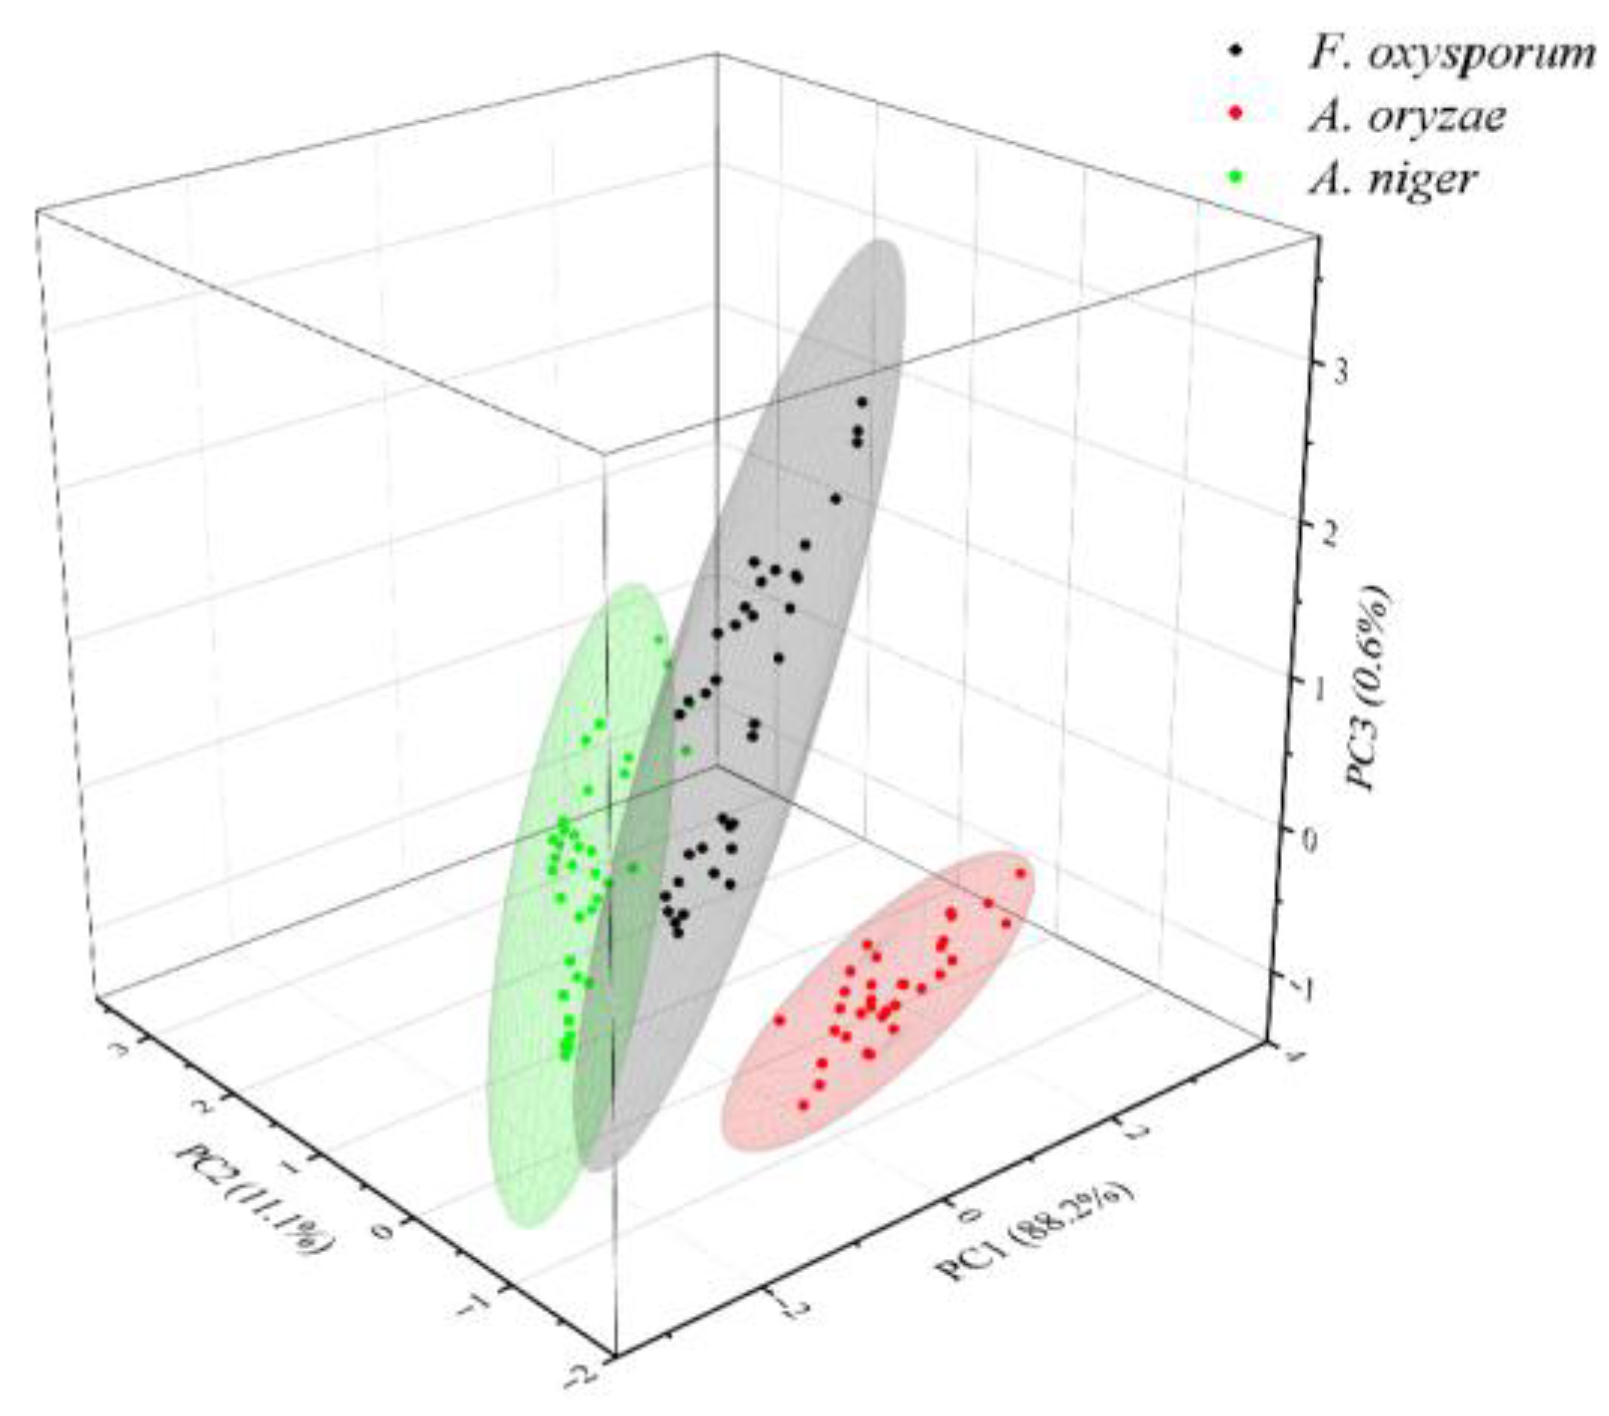
PCA selected principal components across the full spectral range. Figure 19 displays the PCA scatter plot for three types of fungal spores, demonstrating effective clustering. PCA1, PCA2, and PCA3 accounted for 88.2%, 11.1%, and 0.6% of the total variance, respectively, with the cumulative contribution rate of the first three principal components reaching 99.9%. This indicates that these components effectively capture the essential information of the original spectra [36].
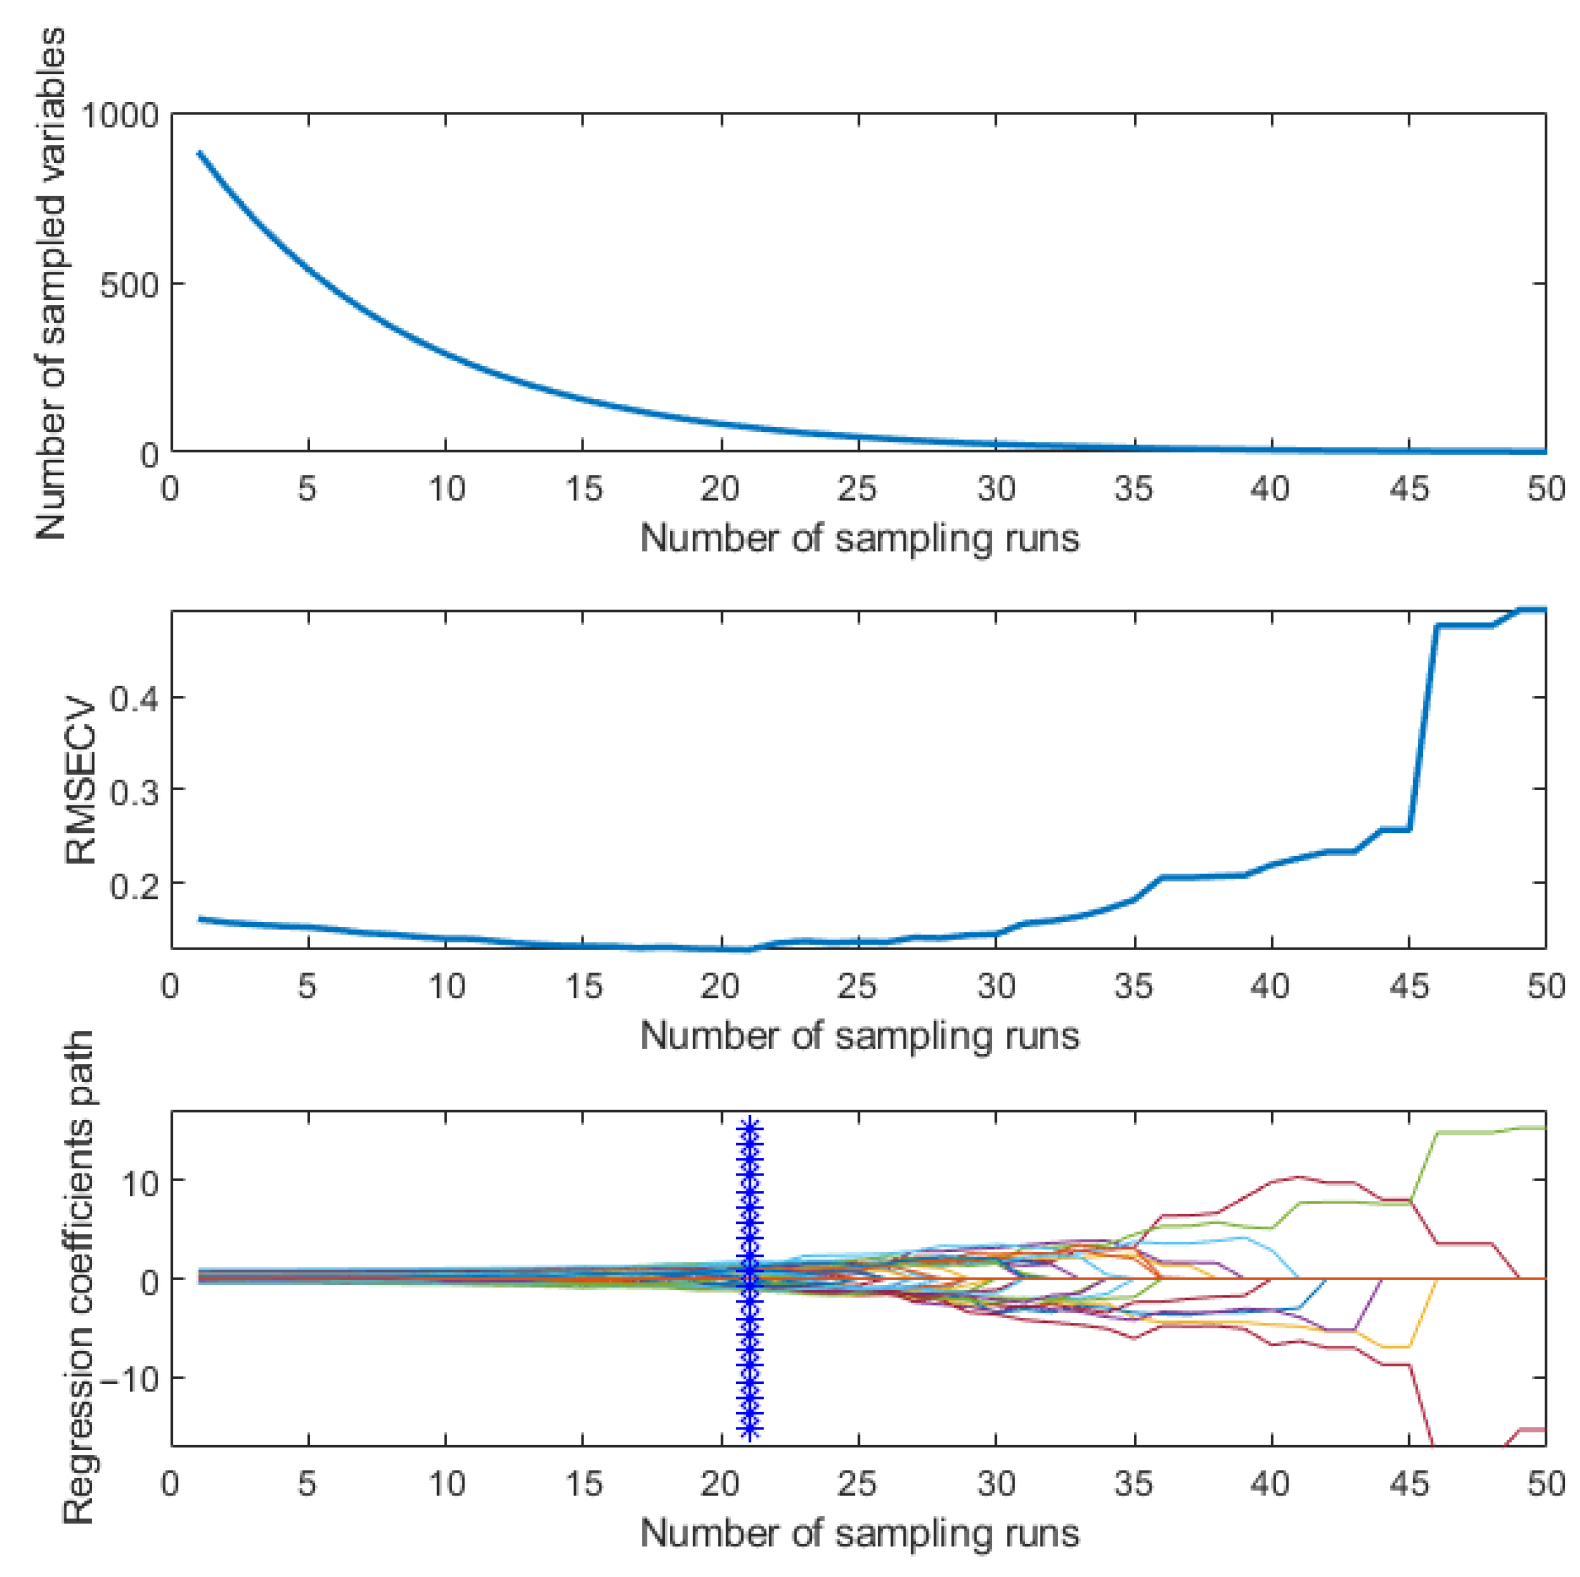
The SCARS algorithm achieves dataset balancing by iteratively adjusting sample weights and optimizing a least squares classifier, thereby enhancing classifier robustness and accuracy. This approach enables SCARS to excel in handling imbalanced datasets while ensuring stable and rapid variable selection [37]. When employing the Monte Carlo Cross Validation (MCCV) method for variable selection in spectral data, each iteration cycle yields an RMSECV (Root Mean Square Error of Cross Validation) value, which quantifies the predictive performance of the current feature band combination [38].
Due to the high number of sampling cycles required for accurate results, multiple iterations are necessary to achieve precision. In practice, various feature band combinations are repeatedly tested and their RMSECV values compared, ultimately selecting the subset combination with the minimum RMSECV as the optimal variable set. The number of sampling cycles is a critical parameter in this process: too few cycles lead to unstable results, while excessive cycles increase computational costs. Based on experimental results, the algorithm stabilizes when sampling cycles are set to 21, yielding a precise feature band combination. The algorithm screened 74 key bands, as shown in Figure 20.

3.4.2. SERS Spectrum Classification Model

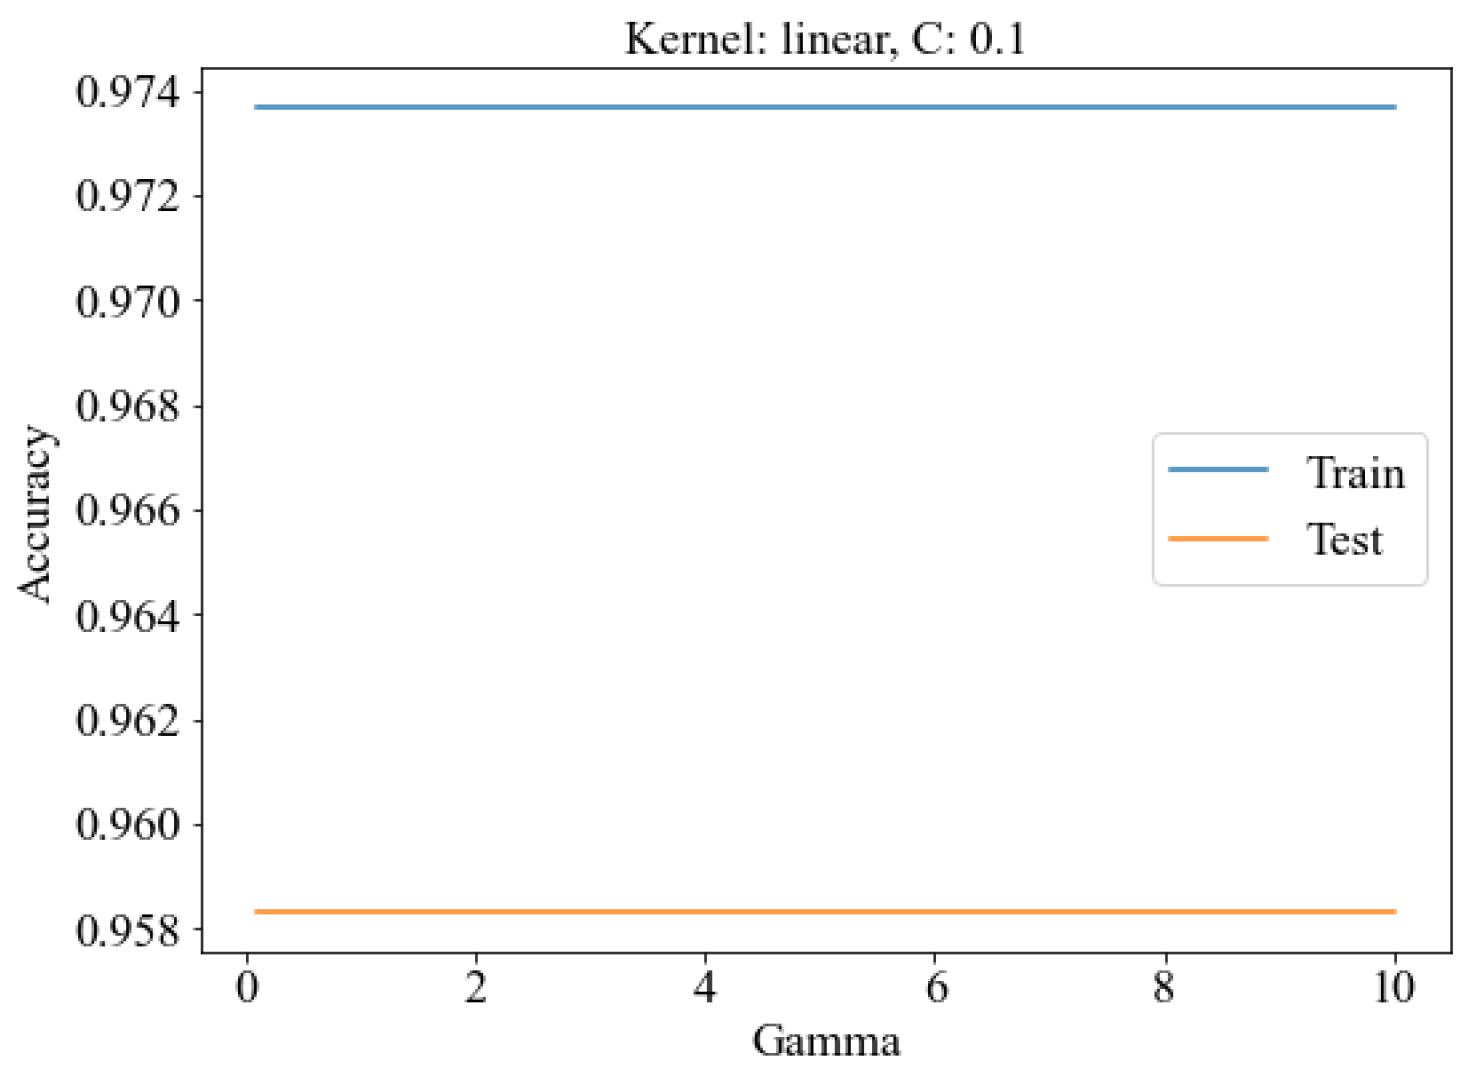
The core strength of Support Vector Machines (SVM) lies in their ability to map low-dimensional data into high-dimensional feature spaces via kernel functions, transforming originally linearly inseparable data into linearly separable forms. Furthermore, SVM adapts to diverse datasets and classification tasks by tuning parameters such as the penalty coefficient C, Gamma Parameter and kernel functions. To implement an SVM model, a suitable kernel function (e.g., linear kernel, polynomial kernel, or Gaussian kernel (RBF)) must be selected. Subsequently, the optimal hyperplane and decision boundaries are determined by minimizing classification errors on training data and model complexity [39]. During the optimization process, Support Vector Machines (SVM) select critical sample points as support vectors, which determine the position and orientation of the hyperplane. As shown in Figure 21, the SCARS-SVM algorithm with a linear kernel, C values of 0.1 and 1, and Gamma ranging from 0 to 10 achieved a training set accuracy of 97.37%, while the test set accuracy peaked at 95.83%.
MLP (Multi-Layer Perceptron) processes input data by propagating it through each neuron in the network, then computes the final output by combining the activation functions of these neurons [29]. Typically, the number of hidden layers and the number of neurons per layer are determined by the characteristics of the problem and the scale of the data [40].
For the MLP model applied in this section, an optimized neural network with three fully connected layers was empirically defined: the first layer contains 74 neurons, the second layer has 37 neurons, and the final layer is the output layer with 3 neurons. Each fully connected layer employs the ReLU (Rectified Linear Unit) activation function, a widely used nonlinear activation mechanism. The input layer size is determined by the feature dimensionality of the training data, specifically obtained via X_train.shape [1] to match the dataset’s feature count. The output layer utilizes the softmax activation function for multiclass classification, mapping outputs to the [0, 1] interval with a sum of 1, thereby representing probability distributions across categories.
During model compilation, the Adam optimizer was adopted, a widely used adaptive learning rate optimizer. The loss function employed Sparse Categorical Crossentropy, a common loss function suitable for multi-class classification problems. The evaluation metric utilized accuracy, representing the proportion of correctly predicted samples to the total samples in the test set.
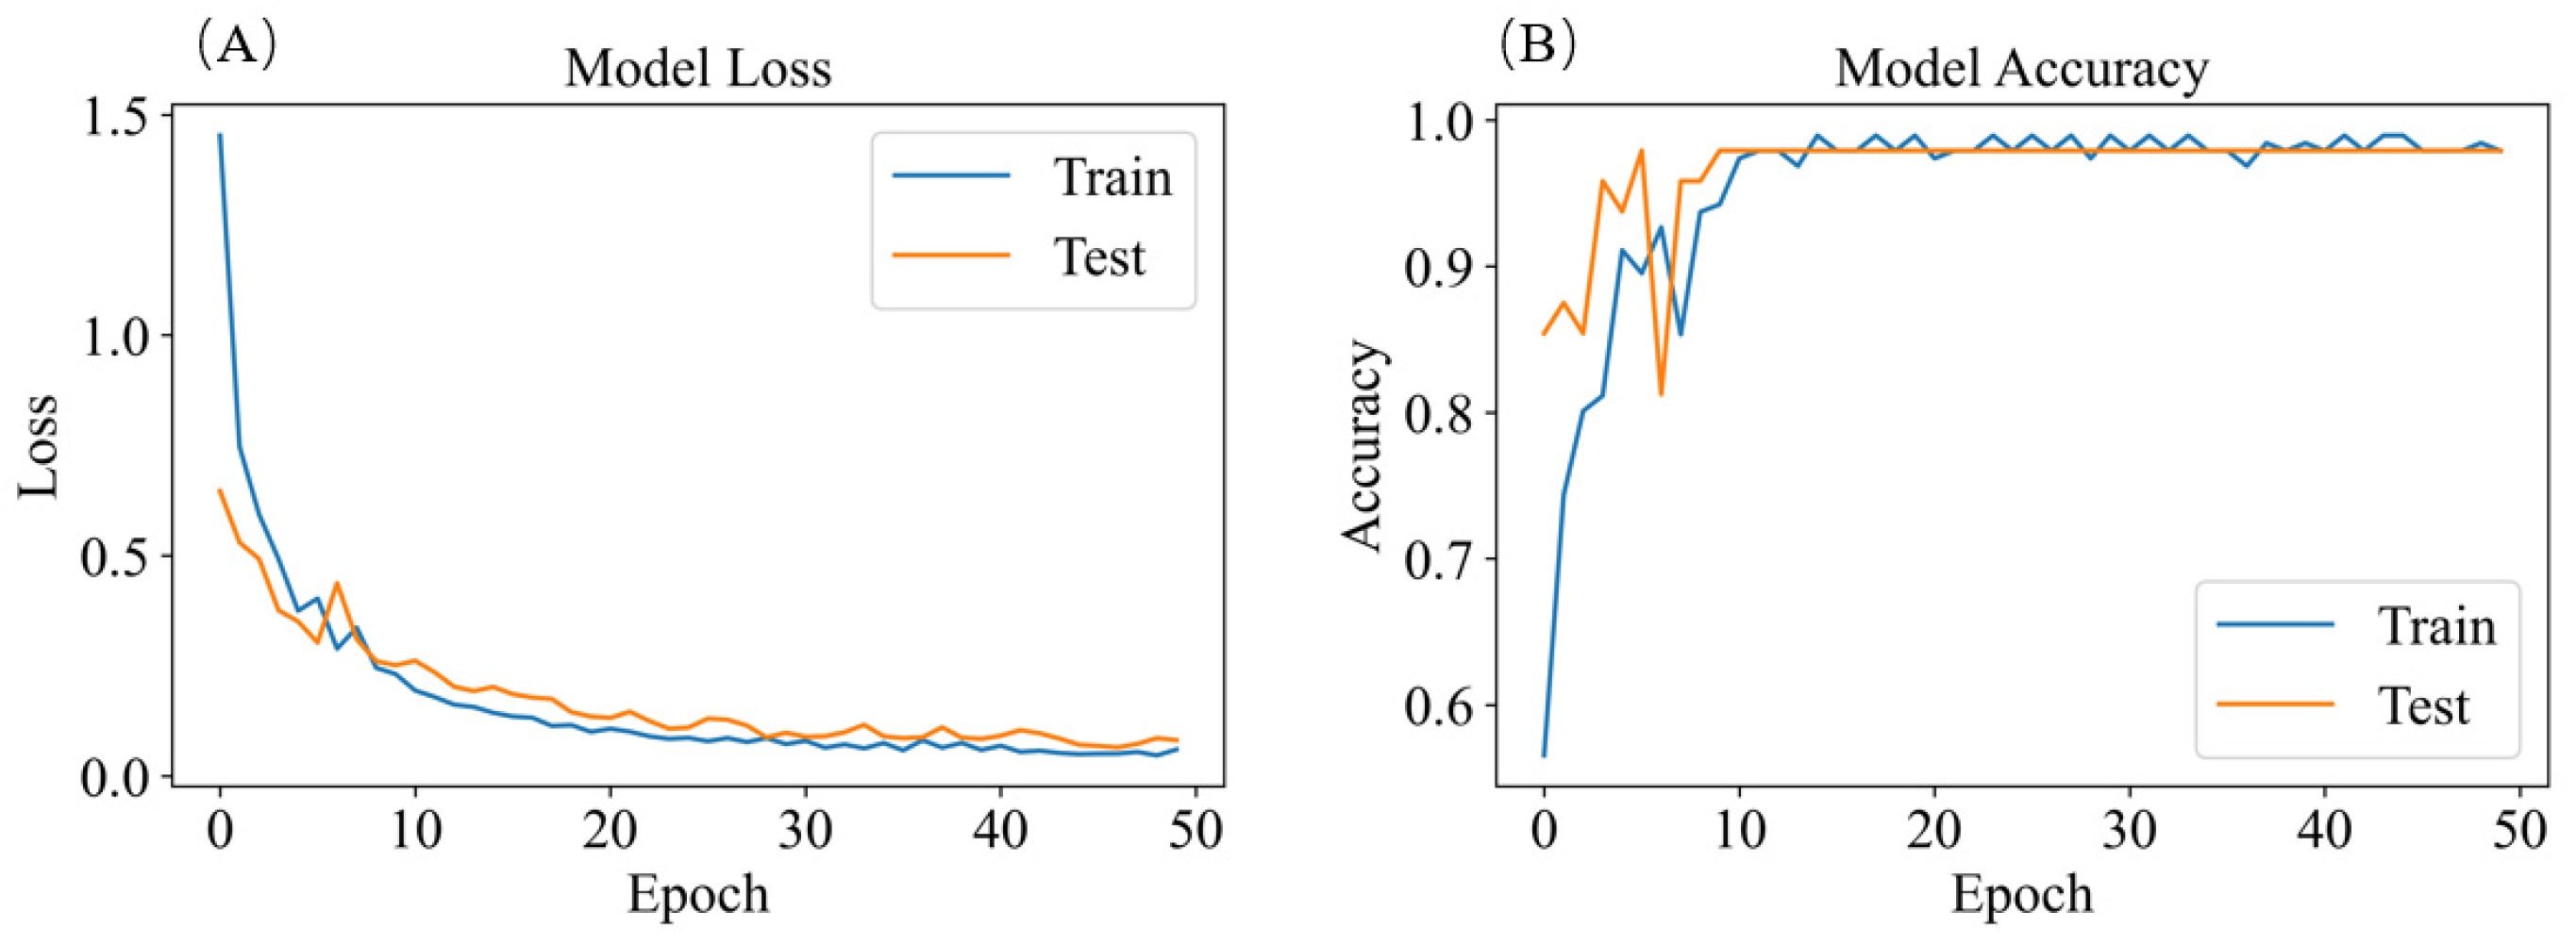
During model training, the dataset was first split into a training set (70%) and a test set (30%). The model was trained for 50 epochs with a batch size of 168, meaning the entire training set was processed 50 times, and each iteration randomly sampled 168 samples for weight updates. After training, the model’s performance was evaluated on the test set, with results shown in Figure 22.
To clearly evaluate the performance of the spore classification model, we adopted the following statistical metrics based on the Confusion Matrix:
True Positive (TP): The number of samples that are actually a specific spore type and are correctly classified by the model.
True Negative (TN): The number of samples that are not a specific spore type and are correctly excluded by the model.
False Positive (FP): The number of samples that are not a specific spore type but are incorrectly classified as that type by the model.
False Negative (FN): The number of samples that are actually a specific spore type but are missed (incorrectly excluded) by the model.
Based on these definitions, we further calculated the following metric:
Accuracy = (TP + TN)/(TP + TN + FP + FN), reflecting the overall correctness of the model (Table 5).
Finally, the classification accuracy rates for the training and test sets processed by SVM, MLP, PCA, and SCARS are summarized in Table 5. Among these, the SCARS-MLP model achieved the highest accuracy of 97.92% on the test set, while SCARS-SVM performed second-best with a test set accuracy of 95.83%.

4. Conclusions

This study employed the seed-mediated growth method—notable for its precise controllability and low cost—to synthesize Au NRs (Gold Nanorods), specifically investigating the effects of silver nitrate (AgNO3) and CTAB concentrations on particle dimensions. The synthesized Au NRs were characterized using TEM and UV-vis spectroscopy, with an in-depth analysis of the formation mechanism. Subsequently, a reduction method was applied to deposit a silver shell onto the Au NRs, yielding Au@Ag NRs (Gold-Silver Core-Shell Nanorods). The core-shell structures were rigorously characterized via TEM, UV-vis spectroscopy, and EDS. Furthermore, the SERS enhancement capability and signal reproducibility of Au@Ag NRs were quantitatively evaluated using Rhodamine 6G (R6G) as the probe molecule.
This study integrated a microfluidic chip with SERS technology to enrich airborne crop disease spores via the microfluidic chip, followed by the addition of Au@Ag NRs (Gold-Silver Core-Shell Nanorods) sol to facilitate automatic binding between the spores and Au@Ag NRs particles through electrostatic adsorption. This process enabled the Raman spectrometer to capture the fingerprint spectra of the crop disease spores. Subsequent baseline correction and standardization of the acquired Raman spectra significantly simplified the spectral data while retaining most critical information. The characteristic peaks of the spores were assigned to specific molecular vibrations. Classification was performed using SVM and MLP algorithms on both raw (non-dimensionality-reduced) and dimensionality-reduced SERS spectra. After dimensionality reduction, the SCARS-MLP model achieved the highest accuracy of 97.92%, followed by PCA-MLP at 96.55%, demonstrating excellent classification performance. This approach provides a feasible method for early monitoring of crop diseases.

Author Contributions

Conceptualization, F.B. and X.Z.; methodology, Y.Z., J.G. and J.Z.; validation, Y.Z. and C.G.; formal analysis, F.B. and Y.Z.; investigation, Z.L. and Y.Z.; resources, J.G. and J.Z.; data curation, Y.Z., F.B. and X.Z.; writing—original draft preparation, Y.Z., J.G. and J.Z.; writing—review and editing, Y.Z.; supervision, Y.Z. and X.Z.; funding acquisition, X.Z. All authors have read and agreed to the published version of the manuscript.

Funding

This research was funded by the project of the National Key Research and Development Program for Young Scientists (Grant Nos.2022YFD2000200); Jiangsu Province Industry Forward-looking Program Project (Grant Nos. BE2023017); Agricultural Equipment Department of Jiangsu University (Grant Nos. NZXB20210106); National Key Research and Development Program of China (Grant Nos.2022YFD2002302).

Data Availability Statement

The original contributions presented in the study are included in the article, further inquiries can be directed to the corresponding author.

Acknowledgments

We thank the School of Agricultural Engineering, Jiangsu University, for providing essential facilities and technical support. We sincerely appreciate the assistance provided by Tencent Yuanbao in translating the content of this article. We also sincerely acknowledge the valuable comments and kind attention of the anonymous reviewers and the editor, which have greatly improved the quality of this work.

Conflicts of Interest

The authors declare no conflicts of interest.

References

  1. Savary, S.; Willocquet, L.; Pethybridge, S.J.; Esker, P.; McRoberts, N.; Nelson, A. The global burden of pathogens and pests on major food crops. Nat. Ecol. Evol. 2019, 3, 430–439. [Google Scholar] [CrossRef]
  2. Ngolong Ngea, G.L.; Qian, X.; Yang, Q.; Dhanasekaran, S.; Ianiri, G.; Ballester, A.-R.; Zhang, X.; Castoria, R.; Zhang, H. Securing fruit production: Opportunities from the elucidation of the molecular mechanisms of postharvest fungal infections. Compr. Rev. Food Sci. Food Saf. 2021, 20, 2508–2533. [Google Scholar] [CrossRef] [PubMed]
  3. Li, X.; Liu, D.; Yao, J. Aerosolization of fungal spores in indoor environments. Sci. Total Environ. 2022, 820, 153003. [Google Scholar] [CrossRef] [PubMed]
  4. Walsh, N.M.; Botts, M.R.; McDermott, A.J.; Ortiz, S.C.; Wüthrich, M.; Klein, B.; Hull, C.M. Infectious particle identity determines dissemination and disease outcome for the inhaled human fungal pathogen Cryptococcus. PLoS Pathog. 2019, 15, e1007777. [Google Scholar] [CrossRef] [PubMed]
  5. Lee, S.; Lee, J. Beneficial bacteria and fungi in hydroponic systems: Types and characteristics of hydroponic food production methods. Sci. Hortic. 2015, 195, 206–215. [Google Scholar] [CrossRef]
  6. Ward, E. Plant pathogen diagnostics: Immunological and nucleic acid-based approaches. Ann. Appl. Biol. 2004, 145, 1–16. [Google Scholar] [CrossRef]
  7. Yang, N.; Ji, Y.; Wang, A.; Tang, J.; Liu, S.; Zhang, X.; Xu, L.; He, Y. An integrated nucleic acid detection method based on a microfluidic chip for collection and culture of rice false smut spores. Lab Chip 2022, 22, 4894–4904. [Google Scholar] [CrossRef]
  8. Lei, Y.; Yao, Z.; He, D. Automatic detection and counting of urediniospores of Puccinia striiformis f. sp. tritici using spore traps and image processing. Sci. Rep. 2018, 8, 13647. [Google Scholar] [CrossRef]
  9. Zhang, Y.; Li, J.; Tang, F.; Zhang, H.; Cui, Z.; Zhou, H. An Automatic Detector for Fungal Spores in Microscopic Images Based on Deep Learning. Appl. Eng. Agric. 2021, 37, 85–94. [Google Scholar] [CrossRef]
  10. Imbusch, F.; Liebe, S.; Erven, T.; Varrelmann, M. Dynamics of cercospora leaf spot disease determined by aerial spore dispersal in artificially inoculated sugar beet fields. Plant Pathol. 2021, 70, 853–861. [Google Scholar] [CrossRef]
  11. Munir, M.; Wang, H.; Dufault, N.S.; Anco, D.J. Early Detection of Airborne Inoculum of Nothopassalora personata in Spore Trap Samples from Peanut Fields Using Quantitative PCR. Plants 2020, 9, 1327. [Google Scholar] [CrossRef]
  12. Huayhongthong, S.; Khuntayaporn, P.; Thirapanmethee, K.; Wanapaisan, P.; Chomnawang, M.T. Raman spectroscopic analysis of food-borne microorganisms. LWT 2019, 114, 108419. [Google Scholar] [CrossRef]
  13. Breuch, R.; Klein, D.; Siefke, E.; Hebel, M.; Herbert, U.; Wickleder, C.; Kaul, P. Differentiation of meat-related microorganisms using paper-based surface-enhanced Raman spectroscopy combined with multivariate statistical analysis. Talanta 2020, 219, 121315. [Google Scholar] [CrossRef]
  14. Feng, J.; de la Fuente-Núñez, C.; Trimble, M.J.; Xu, J.; Hancock, R.E.; Lu, X. An in situ Raman spectroscopy-based microfluidic “lab-on-a-chip” platform for non-destructive and continuous characterization of Pseudomonas aeruginosa biofilms. Chem. Commun. 2015, 51, 8966–8969. [Google Scholar] [CrossRef]
  15. Gao, Y.; Pan, X.; Xu, S.; Liu, Z.; Wang, J.; Yu, K.; Wang, C.; Yuan, H.; Wu, S. Fluorescence-enhanced microfluidic sensor for highly sensitive in-situ detection of copper ions in lubricating oil. Mater. Des. 2020, 191, 108693. [Google Scholar] [CrossRef]
  16. Chen, T.; Sun, J.; Ma, T.; Li, T.; Liu, C.; Zhu, X.; Xue, N. Design and Analysis of Particulate Matter Air-Microfluidic Grading Chip Based on MEMS. Micromachines 2019, 10, 497. [Google Scholar] [CrossRef]
  17. Wang, P.; Yuan, S.; Yang, N.; Wang, A.; Fordjour, A.; Chen, S. The Collection Method for Crop Fungal Spores Based on an Efficient Microfluidic Device. Aerosol Air Qual. Res. 2020, 20, 72–79. [Google Scholar] [CrossRef]
  18. Yang, N.; Chen, C.; Li, T.; Li, Z.; Zou, L.; Zhang, R.; Mao, H. Portable Rice Disease Spores Capture and Detection Method Using Diffraction Fingerprints on Microfluidic Chip. Micromachines 2019, 10, 289. [Google Scholar] [CrossRef] [PubMed]
  19. Beeram, R.; Vepa, K.R.; Soma, V.R. Recent Trends in SERS-Based Plasmonic Sensors for Disease Diagnostics, Biomolecules Detection, and Machine Learning Techniques. Biosensors 2023, 13, 328. [Google Scholar] [CrossRef] [PubMed]
  20. Zhang, X.; Guo, B.; Wang, Y.; Hu, L.; Yang, N.; Mao, H. A Detection Method for Crop Fungal Spores Based on Microfluidic Separation Enrichment and AC Impedance Characteristics. J. Fungi 2022, 8, 1168. [Google Scholar] [CrossRef] [PubMed]
  21. Tian, F.; Bonnier, F.; Casey, A.; Shanahan, A.E.; Byrne, H.J. Surface enhanced Raman scattering with gold nanoparticles: Effect of particle shape. Anal. Methods 2014, 6, 9116–9123. [Google Scholar] [CrossRef]
  22. Zhou, X.; Liu, Q.; Shi, X.; Xu, C.; Li, B. Effect of aspect ratio on the chirality of gold nanorods prepared through conventional seed-mediated growth method. Anal. Chim. Acta 2021, 1152, 338277. [Google Scholar] [CrossRef] [PubMed]
  23. Fu, G.; Sun, D.-W.; Pu, H.; Wei, Q. Fabrication of gold nanorods for SERS detection of thiabendazole in apple. Talanta 2019, 195, 841–849. [Google Scholar] [CrossRef] [PubMed]
  24. Jiang, R.; Chen, H.; Shao, L.; Li, Q.; Wang, J. Unraveling the evolution and nature of the plasmons in (Au core)-(Ag shell) nanorods. Adv. Mater. 2012, 24, OP200–OP207. [Google Scholar] [CrossRef]
  25. Guo, Z.; Wang, M.; Barimah, A.O.; Chen, Q.; Li, H.; Shi, J.; El-Seedi, H.R.; Zou, X. Label-free surface enhanced Raman scattering spectroscopy for discrimination and detection of dominant apple spoilage fungus. Int. J. Food Microbiol. 2021, 338, 108990. [Google Scholar] [CrossRef]
  26. Guha, S.; Roy, S.; Banerjee, A. Fluorescent Au@Ag core-shell nanoparticles with controlled shell thickness and Hg(II) sensing. Langmuir 2011, 27, 13198–13205. [Google Scholar] [CrossRef]
  27. Guo, S.; Bocklitz, T.; Popp, J. Optimization of Raman-spectrum baseline correction in biological application. Analyst 2016, 141, 2396–2404. [Google Scholar] [CrossRef]
  28. Xu, Y.; Du, P.; Senger, R.; Robertson, J.; Pirkle, J.L. ISREA: An Efficient Peak-Preserving Baseline Correction Algorithm for Raman Spectra. Appl. Spectrosc. 2021, 75, 34–45. [Google Scholar] [CrossRef]
  29. Pinkus, A. Approximation theory of the MLP model in neural networks. Acta Numer. 1999, 8, 143–195. [Google Scholar] [CrossRef]
  30. Zheng, Y.; Zhong, X.; Li, Z.; Xia, Y. Successive, Seed-Mediated Growth for the Synthesis of Single-Crystal Gold Nanospheres with Uniform Diameters Controlled in the Range of 5–150 nm. Part. Part. Syst. Charact. 2014, 31, 266–273. [Google Scholar] [CrossRef]
  31. Okuno, Y.; Nishioka, K.; Kiya, A.; Nakashima, N.; Ishibashi, A.; Niidome, Y. Uniform and controllable preparation of Au–Ag core–shell nanorods using anisotropic silver shell formation on gold nanorods. Nanoscale 2010, 2, 1489–1493. [Google Scholar] [CrossRef]
  32. Garcia-Rico, E.; Alvarez-Puebla, R.A.; Guerrini, L. Direct surface-enhanced Raman scattering (SERS) spectroscopy of nucleic acids: From fundamental studies to real-life applications. Chem. Soc. Rev. 2018, 47, 4909–4923. [Google Scholar] [CrossRef]
  33. Lemma, T.; Wang, J.; Arstila, K.; Hytönen, V.P.; Toppari, J.J. Identifying yeasts using surface enhanced Raman spectroscopy. Spectrochim. Acta Part A Mol. Biomol. Spectrosc. 2019, 218, 299–307. [Google Scholar] [CrossRef]
  34. Gelder, J.D.; Gussem, K.D.; Vandenabeele, P.; Moens, L. Reference database of Raman spectra of biological molecules. J. Raman Spectrosc. 2007, 38, 1133–1147. [Google Scholar] [CrossRef]
  35. Lin, Y.J.; Lin, H.K.; Lin, Y.H. Construction of Raman spectroscopic fingerprints for the detection of Fusarium wilt of banana in Taiwan. PLoS ONE 2020, 15, e0230330. [Google Scholar] [CrossRef]
  36. Alsamad, F.; Gobinet, C.; Vuiblet, V.; Jaisson, S.; Piot, O. Towards normalization selection of Raman data in the context of protein glycation: Application of validity indices to PCA processed spectra. Analyst 2020, 145, 2945–2957. [Google Scholar] [CrossRef]
  37. Strycker, B.D.; Han, Z.; Commer, B.; Shaw, B.D.; Sokolov, A.V.; Scully, M.O. CARS spectroscopy of Aspergillus nidulans spores. Sci. Rep. 2019, 9, 1789. [Google Scholar] [CrossRef] [PubMed]
  38. Xing, Z.; Du, C.; Shen, Y.; Ma, F.; Zhou, J. A method combining FTIR-ATR and Raman spectroscopy to determine soil organic matter: Improvement of prediction accuracy using competitive adaptive reweighted sampling (CARS). Comput. Electron. Agric. 2021, 191, 106549. [Google Scholar] [CrossRef]
  39. Chauhan, V.K.; Dahiya, K.; Sharma, A. Problem formulations and solvers in linear SVM: A review. Artif. Intell. Rev. 2019, 52, 803–855. [Google Scholar] [CrossRef]
  40. Karlik, B.; Olgaç, A.V. Performance Analysis of Various Activation Functions in Generalized MLP Architectures of Neural Networks. Int. J. Artif. Intell. Expert Syst. 2011, 1, 111–122. [Google Scholar]
Figure 1. Schematic Diagram of Au@Ag NRS Synthesis Procedure.
Agriculture 15 02076 g001
Figure 2. Microfluidic chip composite micro-Raman detection method for crop disease spores. (A) Spore capture and separation/enrichment, (B) SERS fingerprint spectra acquisition of crop disease spores, (C) Raman data processing and modeling.
Agriculture 15 02076 g002
Figure 3. Raw Raman Spectra of Fusarium oxysporum Spores and SERS Spectra Using Au NRS vs. Au@Ag NRS.
Agriculture 15 02076 g003
Figure 4. Raw Spectra of Spores: (A) Fusarium oxysporum Raw Spectrum, (B) Aspergillus oryzae Raw Spectrum, (C) Aspergillus niger Raw Spectrum.
Agriculture 15 02076 g004
Figure 5. UV-vis-NIR Absorption Spectra of Au NRS for Three Groups.
Agriculture 15 02076 g005
Figure 6. TEM Images of Au NRS Synthesized with Different Silver Nitrate (AgNO3) Concentrations: (A)150 μL, (B) 250 μL, (C) 350 μL.
Agriculture 15 02076 g006
Figure 7. Length Distribution Statistics of Au NRS with Different Silver Nitrate (AgNO3) Concentrations: (A) 150 μL, (B) 250 μL, (C) 350 μL.
Agriculture 15 02076 g007
Figure 8. UV-vis-NIR Absorption Spectra Comparison of Au NRS vs. Au@Ag NRS.
Agriculture 15 02076 g008
Figure 9. TEM Images of Au@Ag NRS.
Agriculture 15 02076 g009
Figure 10. Length Distribution Histogram of Au@Ag NRS.
Agriculture 15 02076 g010
Figure 11. EDS Elemental Mapping of Au@Ag NRS: (A) Au Distribution, (B) Ag Distribution, and (C) TEM Image of Au@Ag NRS, (D) Au@Ag NRS EDS spectrum.
Agriculture 15 02076 g011
Figure 12. Results of repeated experiments on the enhancement effect of Au@Ag NRS nanoparticles.
Agriculture 15 02076 g012
Figure 13. Intensity Quantification at 1514 cm−1 for R6G Detection Spectra Using Au@Ag NRS Across Different Concentrations.
Agriculture 15 02076 g013
Figure 14. Binding Diagram of Crop Disease Spores with Au@Ag NRS.
Agriculture 15 02076 g014
Figure 15. SG Smoothing of Raw Spectrum of Fusarium oxysporum Using Au@Ag NRS.
Agriculture 15 02076 g015
Figure 16. SNV Processing of Raw Spectrum of Fusarium oxysporum Using Au@Ag.
Agriculture 15 02076 g016
Figure 17. Baseline Correction of Raw Spectrum of Fusarium oxysporumUsing Au@Ag NRS.
Agriculture 15 02076 g017
Figure 18. Average Spectra of Three Types of Crop Disease Spores Using Au@Ag NRS.
Agriculture 15 02076 g018
Figure 19. Three-Dimensional PCA Scatter Plot Based on the First Three Principal Components.
Agriculture 15 02076 g019
Figure 20. SCARS Algorithm Execution Results.
Agriculture 15 02076 g020
Figure 21. SVM Parameter Screening Results.
Agriculture 15 02076 g021
Figure 22. MLP Performance Results: (A) Loss Function Variation of SCARS-MLP, (B) Accuracy Variation of SCARS-MLP.
Agriculture 15 02076 g022
Table 1. List of experimental reagents.
Reagent NameCAS
Hexadecyl trimethyl ammonium Bromide (CTAB)57-09-0
Hydrogen tetrachloroaurate (III) trihydrate16961-25-4
Sodium borohydride16940-66-2
Ascorbic acid50-81-7
Silver nitrate7761-88-8
Hydrochloric acid7647-01-0
Sulfuric acid7664-93-9
Cetyltrimethylammonium chloride (CTAC)112-02-7
Table 2. Dosage of CTAB for Different Groups.
Group AgNO 3 /μLCTAB/mL
115020
225020
335020
Table 3. Elemental Composition (wt%) of Au@Ag NRS by EDS Analysis.
ElementLine Typek Factork Factor TypeAbsorption
Correction
Wt%Wt% Sigma
CK series2.760Theoretical1.0030.300.26
OK series2.013Theoretical1.002.760.08
SiK series1.000Theoretical1.003.030.07
CrK series1.117Theoretical1.000.240.03
FeK series1.150Theoretical1.000.150.03
CoK series1.194Theoretical1.000.210.03
CuK series1.261Theoretical1.0018.460.17
AgK series11.157Theoretical1.009.890.42
OsL series2.261Theoretical1.001.120.17
AuL series2.325Theoretical1.0033.830.30
Table 4. Main SERS peaks and their substance assignments of three crop disease spores.
Raman Shift
( cm 1 )
Fusarium oxysporumRice False SmutAspergillus nigerSpectral AssignmentReferences
469–481481469480Galactomannan, Chitin[25]
675–684675684680Guanine, Thymine (Hydrogen-Bonded Ring)[25,33]
785--785L-Histidine[34]
835853835-O-P-O Rotation in RNA[33]
1004–1008100810041004Phenylalanine[33]
1104–11171104-1117Galactomannan[25]
1133–1148114811331133C-O Ring Aromatic Amino Acids in Proteins[12]
1257–1260126012601257Amide III (Random), Thymine[33,35]
1386–1391138613911391D-Galactosamine[34]
1457–1472146414571472L-Histidine[34]
1564–1580158015741564Adenine, Guanine
(Ring Stretching Vibration)
[12,35]
1713–1718171617181713L-Arginine in Proteins[34]
Table 5. Spore Classification Model Accuracy.
NumberCombinationTPTNFPFNTraining Set Accuracy (%)Test Set Accuracy (%)
1SVM45175586.6586.32
2MPL46175488.4687.61
3PCA-SVM49202197.2595.24
4PCA-MPL49211197.3496.55
5SCARS-SVM49202197.3795.83
6SCARS-MLP50211098.997.92
Disclaimer/Publisher’s Note: The statements, opinions and data contained in all publications are solely those of the individual author(s) and contributor(s) and not of MDPI and/or the editor(s). MDPI and/or the editor(s) disclaim responsibility for any injury to people or property resulting from any ideas, methods, instructions or products referred to in the content.