3.1. Mortality Modeling
The generalized linear mixed model analyzing proportional mortality identified several statistically significant environmental and management predictors (
Table 3). The intercept of −4.48 (
p < 0.001) represents the baseline log-odds of mortality, or 1.1%, during the fall season when all scaled continuous predictors are set to zero.
Table 3 illustrates the mortality model factors, estimates, and
p-values, where Week denotes the number of weeks after placement, PropCapacity represents the percentage of the barn that was filled each week, Spring, Summer, and Winter describe Seasonal effects with Fall as the reference category. RH
FrontAvg and RH
FrontSD were the average and standard deviation of RH at the front of the barn. T
Back_DRTDiff is the difference between the measured temperature at the back of the barn and the DRT. CO
2_FrontSD refers to the standard deviation of CO
2 concentration at the front of the barn, while CO
2_BackAvg and CO
2_BackSD refer to the average and standard deviation of CO
2 concentration at the back of the barn.
Specifically, TBack_DRTDiff showed a significant association with mortality (p < 0.001), indicating that when the back of barn temperature exceeds the desired room DRT experienced significantly lower mortality. This suggests that cold stress was a greater challenge for pigs than heat stress. Therefore, maintaining temperatures at or above the DRT is better for survival than temperatures falling below. In the tunnel-style barns in this study, fresh air enters at the front curtain or ceiling inlets along the barn and travels toward the exhaust fans at the back, gaining heat as it moves along the length of the barn. This results in the back of the barn being warmer than the front, with a temperature gradient of less than 2 °C from front to back being desirable. Therefore, a back temperature below the DRT suggests that the entire barn is too cold, indicating a greater risk of cold stress. It is important to note that in this study, supplemental heat was provided via radiant tube heaters that function by raising surface (floor, comfort mat, or pig surface) temperatures rather than directly raising the air temperature.
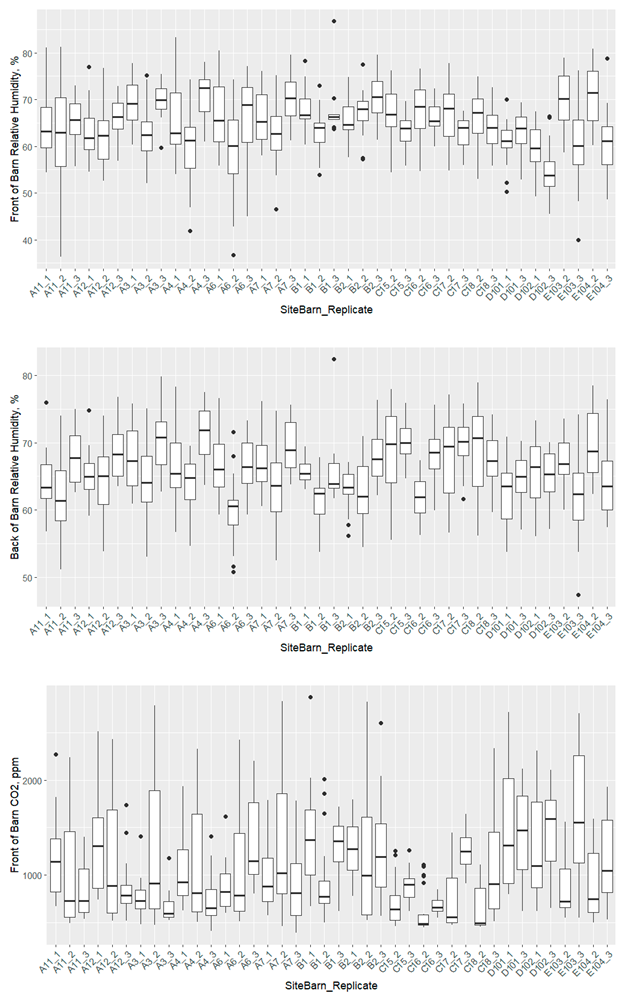
The analysis of air quality parameters involving RH and CO
2 on mortality revealed several significant associations. Among the RH variables, RH
Front_Avg was significantly associated with mortality (estimate = 1.15,
p < 0.001). The RH
Front_SD also showed a significant positive effect (estimate = 0.82,
p < 0.001), indicating that greater RH values and variability at the front of the barn are linked to greater mortality. Relative humidity variability could be associated with fluctuating environmental conditions, which may hinder the ability of the pig to maintain thermal comfort [
13].
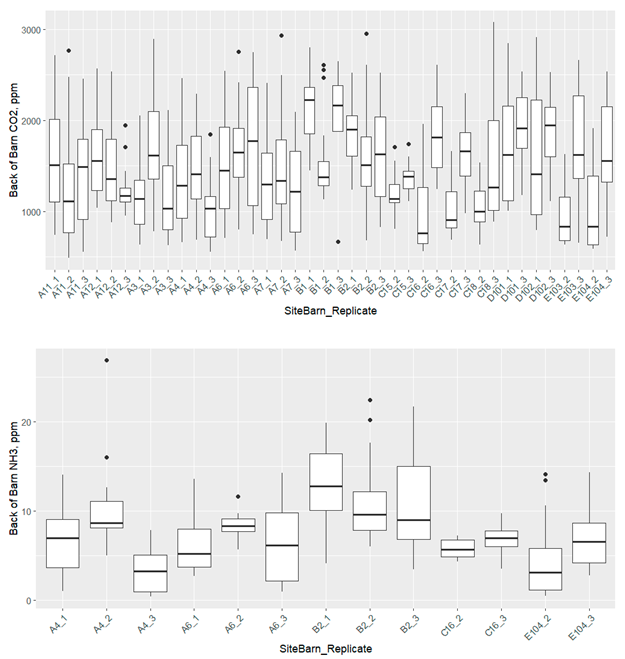
This interpretation is further supported by the positive association between CO
2_BackAvg and mortality (estimate = 0.38,
p = 0.014), meaning that greater CO
2 levels in the back zone, the farthest point from ventilation inlets, contribute to greater mortality. Similarly, CO
2_BackSD showed a significant positive association with mortality (estimate = 0.59,
p < 0.001), indicating that larger fluctuations in CO
2 levels at the back zone increase mortality. These results emphasize that inconsistent airflow and poor gas removal elevate the likelihood of mortalities [
14].
Conversely, CO
2_FrontSD demonstrated a significant negative association with mortality (estimate = −0.38,
p = 0.023). When the tunnel curtain is opened, the front end of the barn receives the largest volume of incoming fresh air, containing lower CO
2 levels compared to existing barn air. Across the study period, the globally averaged CO
2 concentration was 418 ppm [
15]. During minimum ventilation stages, ceiling inlets are utilized, and a lower rate of air exchange is prescribed to improve heat retention and manage moisture; thus, variability in CO
2 levels at the front of the barn should be minimized by reduced airflow volumes and more uniform distribution. However, during transitional and subsequent tunnel ventilation stages, the tunnel curtain periodically opens to allow an influx of lower CO
2 air, increasing variability in CO
2 concentrations at the front of the barn. It is expected that transitional ventilation would be more challenging for pigs, as RH results suggest; thus, the negative association between CO
2_FrontSD and mortality is surprising and warrants further investigation.
The findings emphasize the importance of maintaining consistent, controlled RH and CO
2 levels for reducing pig mortality. Moreover, the greater estimate magnitude for T
Back_DRTDiff highlights the influence of temperatures on pig productivity. Effective ventilation is essential to promoting thermal comfort and air quality, both of which are critical to reducing mortality in pigs. Temperature plays a crucial role in pig growth performance, with optimal results achieved within the pig thermoneutral zone [
3]. Proper ventilation is needed for maintaining appropriate RH and temperature levels as well. Inadequate ventilation can lead to greater morbidity and mortality, largely due to increased susceptibility to infectious agents, particularly respiratory diseases [
16].
Beyond ventilation parameters, seasonal variation was also a significant factor influencing pig mortality. Pairwise seasonal contrasts, adjusted using the Tukey method, revealed several significant differences in mortality risk and are presented in
Table 4.
Spring pig placement groups had the greatest mortality rates as compared to the other seasons. Summer had the lowest mortality, significantly lower than Spring and Winter. The difference between Fall and Summer showed a tendency of significance (
p = 0.061). Fall and Winter did not differ. These findings suggest that seasonal variations beyond ambient temperature, such as disease pressure, influence mortality rates in pigs. Seasonal variation is known to influence post-weaning pig health, with summer placements into grow-finish facilities typically associated with lower mortality compared to other times of the year [
4,
17]. This trend is largely driven by challenges in managing barn microenvironments amid daily temperature fluctuations [
13] and by seasonal patterns in infectious disease incidence, which tend to rise during colder months [
18,
19]. Infectious disease incidence also follows a seasonal pattern with increased incidence in colder months of the year, as highlighted by increased reported cases of PRRSV in grow-finish pigs during May 2025 and April 2018 [
20]. Other health challenges, including
Mycoplasma hyopneumoniae, influenza A virus, and porcine circovirus, also showed elevated or stable prevalence in Spring wean-to-market pigs, reinforcing the seasonal pressure on respiratory and enteric health. The findings underscore the combined effects of environmental stress and infectious disease on pig morbidity and mortality, emphasizing the need for strengthened biosecurity in colder months.
The effect of Week on mortality was found to be significant (estimate = −0.0244,
p = 0.0134), indicating a decrease in mortality with increasing pig age. Mortality in pigs decreases with age, largely due to the development of stronger immune systems and a reduced impact of early weaning stress [
21]. Young pigs are particularly vulnerable to environmental and physiological challenges immediately after weaning. However, as they grow and adapt to their surroundings, their immunity and ability to regulate body temperature improve, making them more resilient to stressors [
21]. In wean-to-finish systems, increasing the weaning age from 12 to 21 days has been shown to improve average daily gain (ADG) and tends to reduce mortality during the first 42 days post-weaning. Moreover, older weaning ages are associated with better finishing ADG, reinforcing the pattern of decreasing mortality and enhanced growth performance over time [
21]. National Pork Board (2024) reported 31.9% of total wean-to-finish mortality occurred during weeks 3 to 7 after placement, aligning with the present study results and highlighting this as a critical early period for pig losses in wean-to-finish production [
10].
The analysis of PropCapacity revealed a significant negative association with mortality (estimate = −1.514,
p = 0.001245), suggesting that greater barn fill capacities are associated with lower mortality. This outcome is unexpected, as overcrowding and increased stocking density are known to increase stress, competition for resources, and mortality rates in pigs [
22,
23,
24]. One possible explanation of this result is that only 3% of weekly PropCapacity observations exceeded barn design capacity. Furthermore, the variation in PropCapacity within the present study was relatively small, ranging from 0.674 to 1.035 for Sites A, C, D, E, with six weekly observations over capacity, while PropCapacity ranged from 0.897 to 1.044 for Site B with 19 weekly observations exceeding capacity. Another possible explanation for this result could be related to the initial health and quality of the pigs at placement. In pig placement groups with high overall health, it is expected that sow farm survivability would be greater and result in more total pigs weaned per week, resulting in more pigs per finishing barn. However, sow farm production data were not available for publication in this manuscript. Instead, the number of low-vitality pigs at placement was used as a potential indicator of pig quality; however, it was not a significant predictor in the final model. A more comprehensive measure of pig quality, including sow farm and weaning data, could be utilized to further improve the model characterization [
21,
25,
26].
The estimated random intercepts at the site level were zero for all sites, indicating an absence of detectable between-site variability in mortality rates after adjusting for the fixed effects. In contrast, the random intercepts at the barn-within-site level resulted in notable variation, suggesting the presence of additional barn-specific factors, such as local management practices or maintenance status, that influence mortality rates. These barn-level differences in mortality cannot be explained by the fixed effects or the broader site-level grouping.
Table 5 presents the predicted weekly baseline mortality percentages by barn.
The greatest predicted baseline weekly mortality rate was observed in Site A Barn 3, at 1.75%. Conversely, Site C Barn 16 had the lowest predicted rate of 0.71%, indicating substantial variation in baseline risk attributable to barn-level factors. These findings suggest that beyond air quality, barn-specific characteristics contribute meaningfully to mortality differences and warrant further investigation and targeted management strategies.
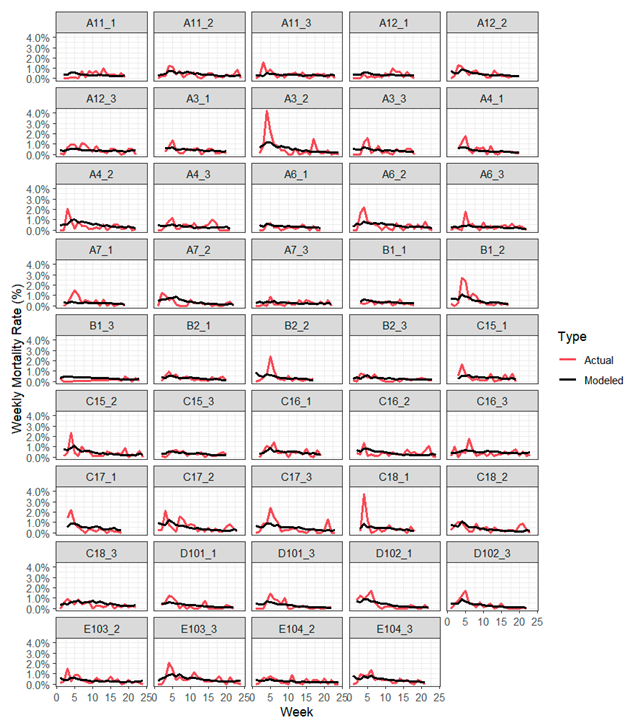
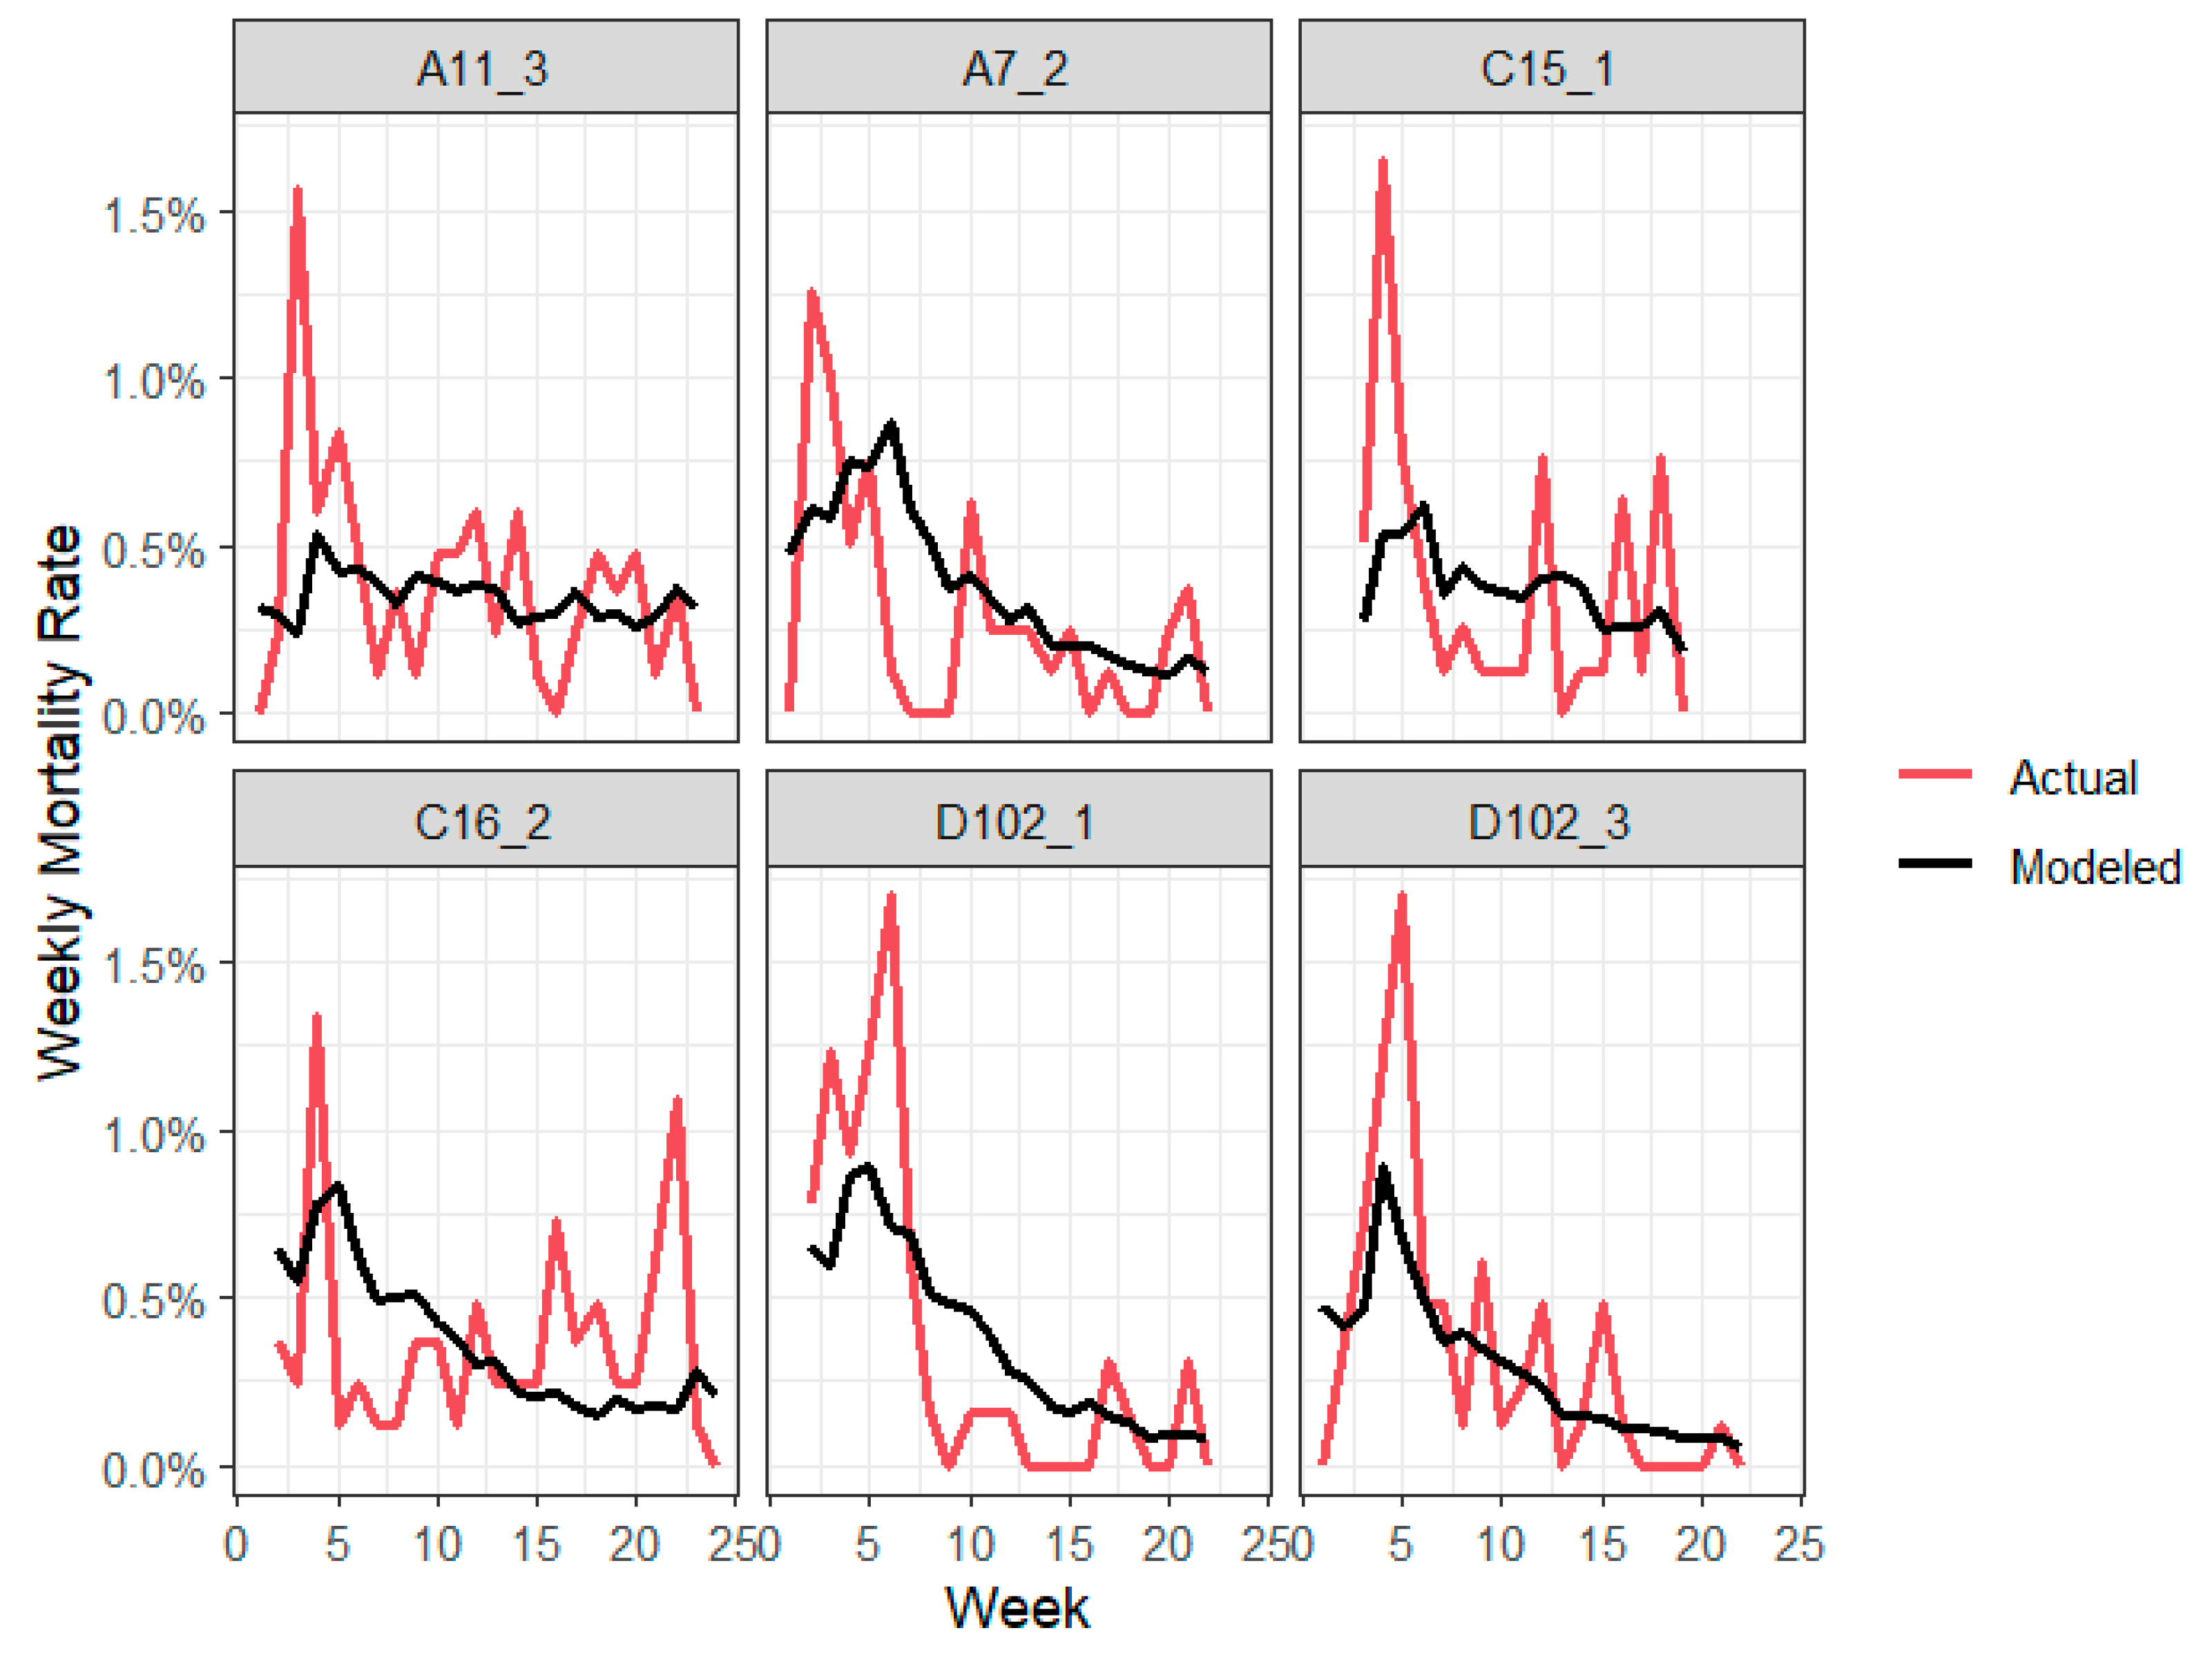
Figure 2 illustrates the comparison of actual vs. predicted cumulative weekly mortality for select turns representing a range of model performance based on RMSE and R
2 values. Overall, average R
2 = 0.24 and RMSE = 0.36% and all turns are presented in
Appendix A. The two greatest R
2 turns were D102_3 (RMSE = 0.295%, R
2 = 0.612) and D102_1 (RMSE = 0.332%, R
2 = 0.611). These results reflect consistent mortality patterns with a typical exponential mortality pattern in early finishing [
10].
Average predictive performing turns, such as A7_2 (RMSE = 0.333%, R2 = 0.192) and C15_1 (RMSE = 0.380%, R2 = 0.177), showed moderate predictive performance. The lowest fit turns were A11_3 (RMSE = 0.345%, R2 = 0.001) and C16_2 (RMSE = 0.367%, R2 = 0.001). These results highlight significant variability in mortality patterns and model performance across different pig groups, underlining the challenges in modeling outcomes where mortality signals may be weak, erratic, or influenced by unaccounted factors such as acute health challenges.
3.2. Ammonia Modeling
The fixed effects from the linear mixed model indicate several significant relationships between environmental and operational factors and NH
3 concentration at the back of the barn.
Table 6 reports model outcomes with only significant factors reported. Ammonia concentrations were significantly greater later in the production cycle, as shown by a positive estimate for days after placement (1.239). However, there was a negative association with Date (−0.987), suggesting seasonal effects.
Increased RH at the back of the barn (RHBackAvg) was associated with increased NH3 levels (estimate = 0.270, p < 0.001). Possible mechanisms include total air exchange rates, or potentially reduced evaporation and increased microbial activity in more humid conditions.
Temperature deviation from DRT (TBack_DRTDiff) had a negative effect (estimate = −0.326, p < 0.001), meaning that as the temperature at the back of the barn exceeded the desired room temperature, NH3 levels declined. Air exchange rates increase when the measured temperature exceeds DRT, increasing dilution of indoor gases. This concept is solidified by the significance of increasing CO2_BackAvg concentration and RHBackAvg with increased NH3 levels.
Interestingly, the proportion of barn capacity occupied (PropCapacity) had a significant negative relationship with NH3 concentration (estimate = −0.079, p < 0.001), indicating that more densely stocked barns were associated with slightly lower NH3.
The random effects in the model account for variability in NH3 concentrations that was not explained by the fixed effects, but rather due to the grouping structure of the data. The variance associated with Site was 1.61 (standard deviation = 1.27), indicating that average NH3 levels differ meaningfully across sites included in the study. Additionally, the Site–Barn grouping (barns nested within sites) had a variance of 0.85 (standard deviation = 0.92), reflecting further variability in NH3 levels among barns within each site. Compared to site and barn level variance, the residual variance is greater at 12.58 (standard deviation = 3.55); thus, while the specified fixed effects and site and barn account for some variability, a substantial portion of NH3 concentration variation remains unexplained.
Ammonia exposure has been shown to negatively impact both growth performance and respiratory health in pigs. Drummond et al. (1980) observed reduced ADG and signs of airway inflammation in pigs exposed to 50–150 ppm NH
3, with the most pronounced effects at 100 and 150 ppm [
8]. In contrast, Michiels et al. (2015) found no significant effect of NH
3 (average 27 ppm) on ADG during the finishing period but reported strong associations between NH
3 levels and respiratory issues, including pleurisy and
M. hyopneumoniae infection [
16]. The present study findings support the relevance of monitoring NH
3 levels in pig barns, as even moderate concentrations may contribute to respiratory pathology and coinfections without clearly affecting growth.


