Article

Computer Vision-Based Multi-Feature Extraction and Regression for Precise Egg Weight Measurement in Laying Hen Farms

1
College of Biosystems Engineering and Food Science, Zhejiang University, Hangzhou 310058, China
2
Agricultural Engineering Research Institute, Agricultural Research Center, Giza 12618, Egypt
3
State Key Laboratory of Agricultural Equipment Technology, Beijing 100083, China
4
Zhejiang Key Laboratory of Intelligent Sensing and Robotics for Agriculture, 866 Yuhangtang Road, Hangzhou 310058, China
*
Author to whom correspondence should be addressed.
Agriculture 2025, 15(19), 2035; https://doi.org/10.3390/agriculture15192035
Submission received: 4 September 2025 / Revised: 23 September 2025 / Accepted: 26 September 2025 / Published: 28 September 2025
(This article belongs to the Section Agricultural Product Quality and Safety)

Abstract

Egg weight monitoring provides critical data for calculating the feed-to-egg ratio, and improving poultry farming efficiency. Installing a computer vision monitoring system in egg collection systems enables efficient and low-cost automated egg weight measurement. However, its accuracy is compromised by egg clustering during transportation and low-contrast edges, which limits the widespread adoption of such methods. To address this, we propose an egg measurement method based on a computer vision and multi-feature extraction and regression approach. The proposed pipeline integrates two artificial neural networks: Central differential-EfficientViT YOLO (CEV-YOLO) and Egg Weight Measurement Network (EWM-Net). CEV-YOLO is an enhanced version of YOLOv11, incorporating central differential convolution (CDC) and efficient Vision Transformer (EfficientViT), enabling accurate pixel-level egg segmentation in the presence of occlusions and low-contrast edges. EWM-Net is a custom-designed neural network that utilizes the segmented egg masks to perform advanced feature extraction and precise weight estimation. Experimental results show that CEV-YOLO outperforms other YOLO-based models in egg segmentation, with a precision of 98.9%, a recall of 97.5%, and an Average Precision (AP) at an Intersection over Union (IoU) threshold of 0.9 (AP90) of 89.8%. EWM-Net achieves a mean absolute error (MAE) of 0.88 g and an R2 of 0.926 in egg weight measurement, outperforming six mainstream regression models. This study provides a practical and automated solution for precise egg weight measurement in practical production scenarios, which is expected to improve the accuracy and efficiency of feed-to-egg ratio measurement in laying hen farms.

1. Introduction

Laying hen farming is fundamental in the agricultural sector [1,2]. Over the past few years, the demand for eggs has been on a continuous increase among consumers [3,4]. Large-scale egg weighing is necessary for calculating the feed-to-egg ratio of a laying hen farm, reflecting the feed utilization rate and helping farmers optimize feed formulations and adjust feeding management to improve production efficiency. The traditional manual egg-weighing method requires substantial human labor input [5]. With the expanding scale of the egg production industry, there is an urgent need for an automated egg weight measurement method [6].
Recently, automated approaches based on computer vision and deep learning methodologies have been widely implemented in intelligent poultry farming [7]. These advancements have provided a revolutionary solution for automatic egg weight measurement. Indeed, several computer vision-based automated systems have already been developed for weight measurement applications in agricultural engineering. For example. Rao et al. [8] employed color threshold segmentation on eggs, extracted features such as the transverse diameter and longitudinal diameter of eggs, and established a polynomial regression model, with an R2 of 0.898 and an absolute error of ±3 g. Aragua and Mabayo [6] proposed an egg weight estimation method based on a computer vision system and traditional image analysis methods. They tested 15 eggs with an average accuracy of 96.31% and proposed the possibility of further improvement. Thipakorn [9], after segmenting eggs, extracted 13 geometric features to develop a linear regression model, which achieved an R2 of 0.983. Most existing studies extract geometric features directly from egg segmentation results; however, the edge segmentation results are often unsmooth, which introduces errors into the extracted geometric features and thereby affects the weight estimation accuracy [10]. Furthermore, the author utilized support vector machine (SVM) for egg weight grading, yielding a grading accuracy of 87.58%. Zalhan et al. [11] and Ab Nasir et al. [12] directly used geometric parameters of eggs, such as diameter, perimeter, and area, for egg grading, with grading accuracies of 96% and 94.16%, respectively. Yang et al. [5] segmented eggs using RTMDet, extracted the lengths of the major axis and minor axis of the eggs, and then employed the Random Forest (RF) algorithm to predict egg weight, achieving an R2 of 96%.
The research suggests that computer vision-based approaches hold significant potential for enabling efficient egg weight measurement. However, while the aforementioned research was conducted in a laboratory setting, the practical implementation of such solutions poses several critical challenges. (1) In egg collection transmission lines, eggs are often clustered together, leading to potential occlusions or mutual compression that may tilt them relative to the horizontal plane. As a result, eggs appear as oblique projections (non-orthogonal projections) in the camera installed from a top-down perspective. These complexities make high-precision weight measurement an exceptionally challenging task under such conditions. (2) From a user perspective, most farm owners strongly prefer convenient, cost-effective, and plug-and-play monitoring systems requiring no additional peripheral connections. This preference makes it difficult to standardize image acquisition conditions, thereby imposing stricter demands on the algorithm’s generalizability and robustness. (3) Most existing studies extract geometric features directly from egg segmentation results; however, the edge segmentation results are often unsmooth, which introduces errors into the extracted geometric features and thereby affects the weight estimation accuracy [10]. This is because traditional convolution operators tend to inadvertently blur and smooth boundaries with low contrast [13], leading to inaccurate contour segmentation of eggs with varying quality. Although these inaccuracies may be negligible for generic object detection, they prove particularly detrimental to our framework, where subpixel-level mask precision is paramount for weight prediction. Due to the above difficulties, the current vision-based egg-weighing method remains in the laboratory scenario stage, largely inconsistent with the actual production scenario (as shown in Figure 1a). Installing monitoring equipment on the egg-laying area transmission line (Figure 1b) is another potential solution, but this would necessitate dozens of monitoring equipment for a single laying hen house. Compared with monitoring egg collection transmission lines (Figure 1c), this significantly increases costs, which is unacceptable to farmers.
To address the above issues and promote the technology to practical production, we propose a computer vision-based multi-feature extraction and regression algorithm for precise egg weight measurement. We introduced two artificial neural networks and specialized data processing methods to enhance the robustness and accuracy of the algorithm. In our algorithmic pipeline, we present Central differential-EfficientViT YOLO (CEV-YOLO): an enhanced variant of YOLOv11 specifically optimized for stronger edge extraction and more robust anti-occlusion capabilities. Integrated with the ByteTrack algorithm, our framework generates continuous mask output across video streams. These segmented masks are subsequently fed into our proprietary egg weight measurement network (EWM-Net), which performs advanced multi-feature extraction and precise weight prediction from the masks. We constructed an egg image dataset and an egg weight dataset separately, which are used to train and validate CEV-YOLO and EWM-Net, respectively. The detailed design of the algorithm, model training and dataset construction are elaborated in the Materials and Methods section.
The main contributions of this paper can be summarized as follows:
  • Optimize the YOLOv11 architecture by integrating a Central Differential Convolution (CDC) block and EfficientViT backbone to develop a new model (CEV-YOLO), aiming to enhance the accuracy of pixel-level egg image segmentation for complex real-world scenarios.
  • Design a high-precision Egg Weight Measurement Network (EWM-Net) that enables efficient feature extraction and weight estimation based on egg masks (after ellipse fitting and outlier filtering), with the goal of improving the reliability of egg weight prediction.
  • Construct a novel technical pipeline that combines image segmentation (CEV-YOLO + ByteTrack) and mask-based weight prediction (EWM-Net), which can process video data collected by customized devices to realize automated, high-precision egg weight measurement.

2. Materials and Methods

2.1. Overall Technical Approach

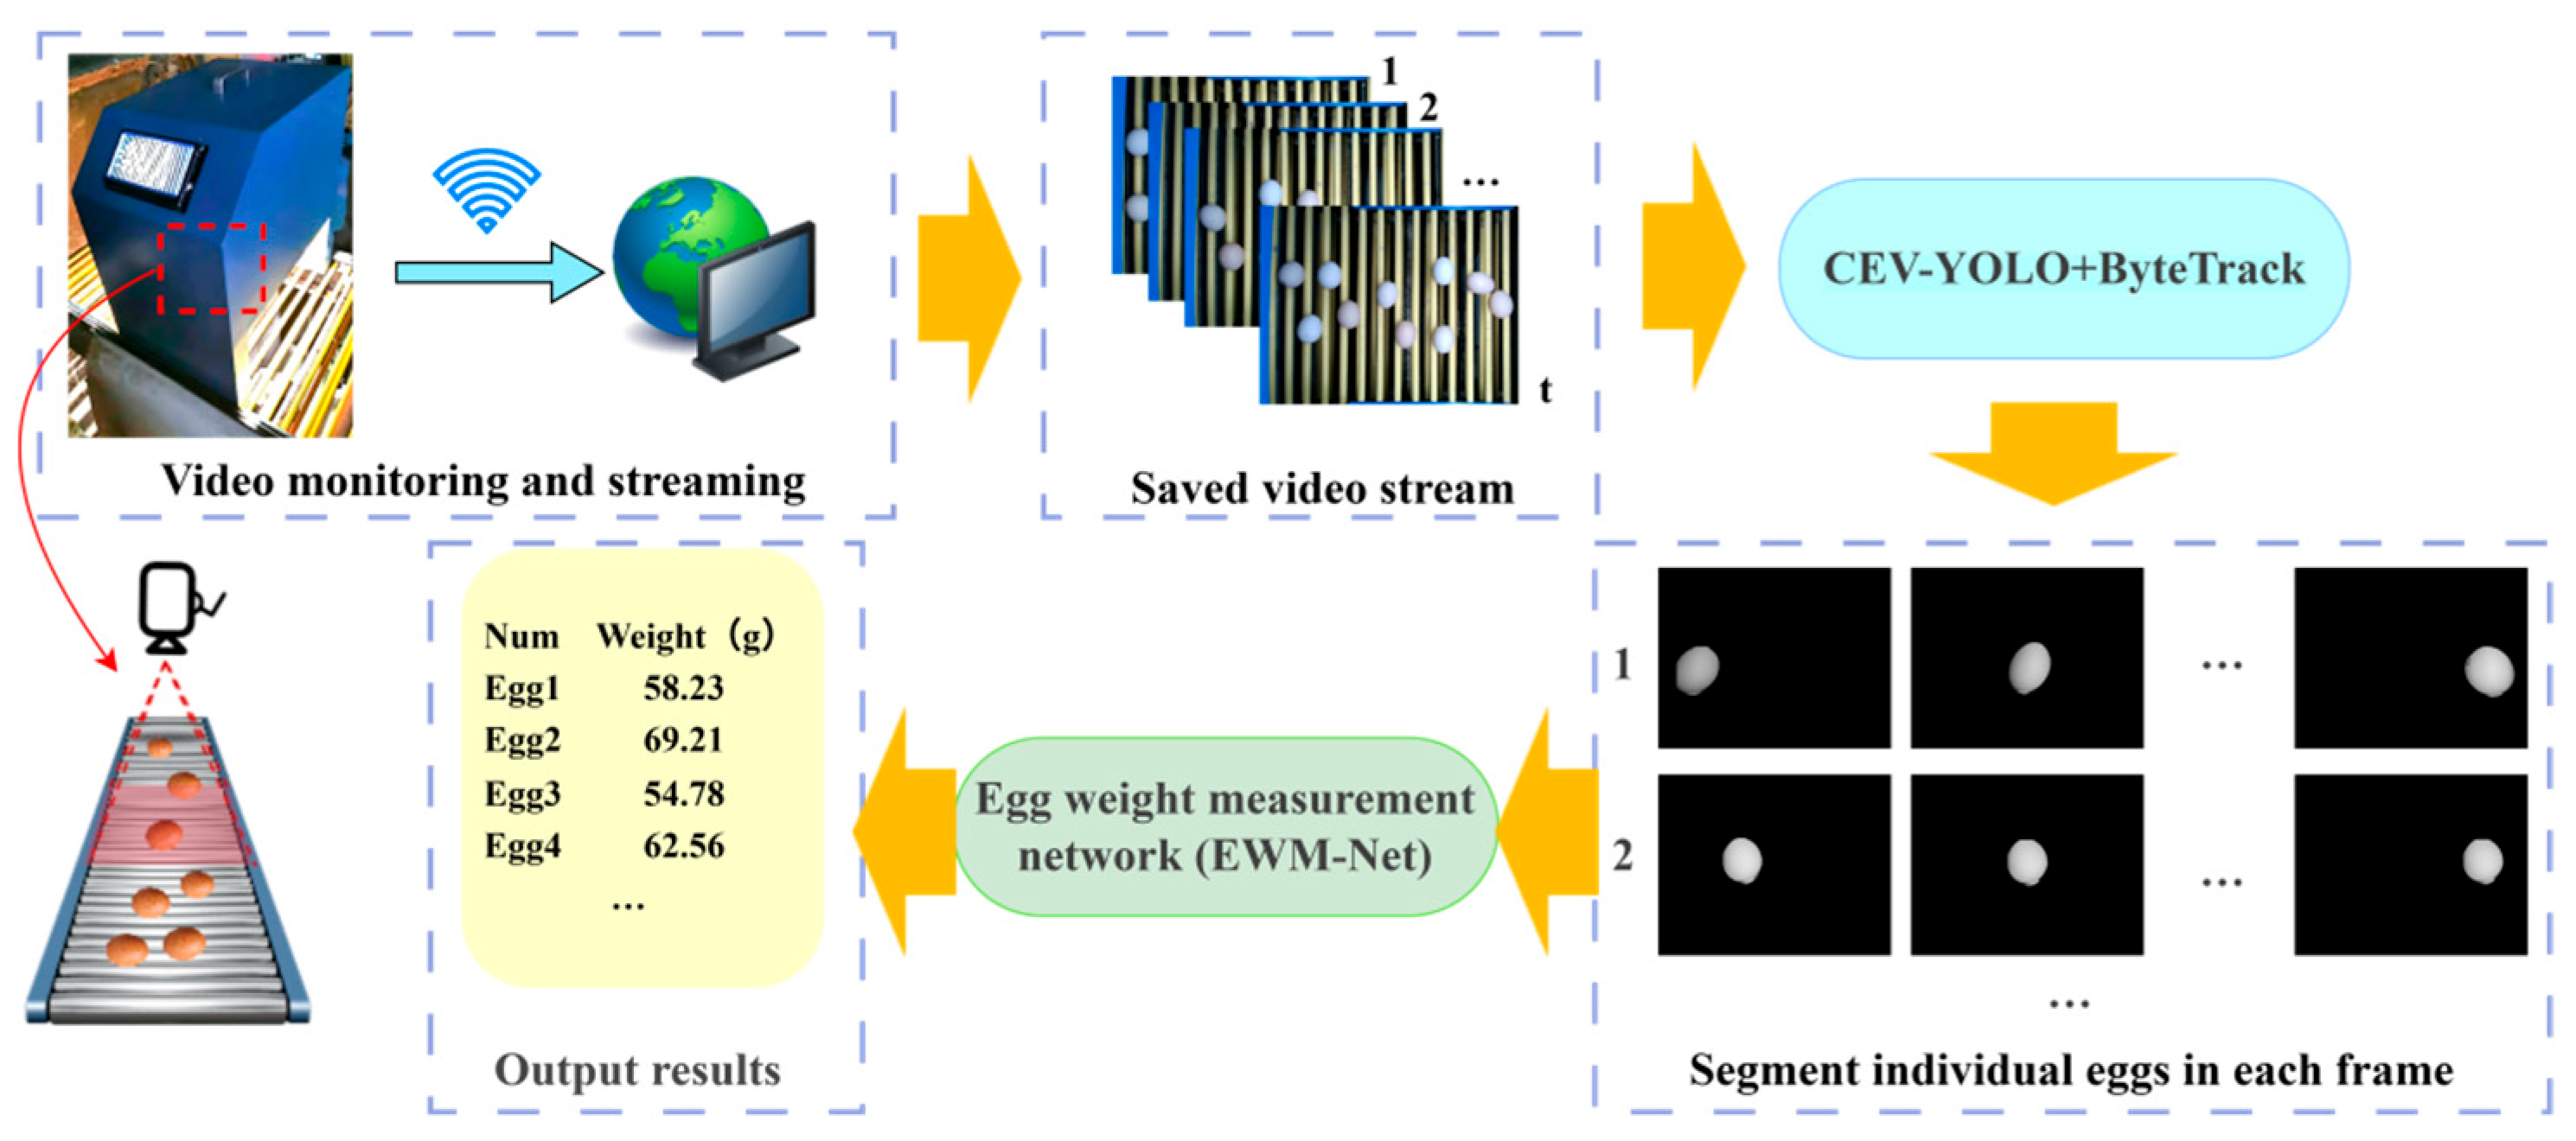
We present a video-based high-precision egg weight measurement algorithm developed for egg collection transmission lines. The overall pipeline is shown in Figure 2. We developed a monitoring device that can be installed above the egg collection transmission line, equipped with surveillance cameras and supplementary lighting modules, enabling continuous video monitoring with local storage or cloud transmission capabilities.
The acquired video data are processed by our proposed CEV-YOLO+Bytetrack model to obtain per-frame instance masks of individual eggs. These segmentation masks are then fed into our developed EWM-Net for egg weight prediction. The technical details of the CEV-YOLO+Bytetrack and EVE-Net architectures will be elaborated in the following two subsections.

2.2. Efficiency Segmentation Based on CEV-YOLO

Recent advances at the intersection of computer vision and agriculture have ushered in a new era of precision farming, with you only look once (YOLO)-based object detection emerging as a pivotal technology due to its unique balance of efficiency and accuracy [14,15]. The YOLO-series models were initially proposed by Redmon et al. [16] in 2015. The eleventh-generation version, YOLOv11, demonstrates enhanced utility across broader contexts by improving performance in computer vision tasks, including instance segmentation, pose estimation, and oriented object detection [17,18,19,20,21]. YOLOv11 adds the C3k2 block, SPPF (Spatial Pyramid Pooling-Fast), and C2PSA (Convolutional Block with Parallel Spatial Attention) components, which enable it to achieve superior feature extraction and object recognition capabilities [22]. Based on YOLOv11, we develop CEV-YOLO with architectural improvements and combine it with Bytetrack [23] to achieve persistent egg segmentation across video frames. The algorithmic pipeline is illustrated in Figure 3.

2.2.1. Improving Dense Prediction Tasks in YOLOv11 Using EfficientViT

In egg collection systems, eggs frequently appear in dense clusters on transmission lines. To address the challenge of pixel-accurate instance segmentation under such conditions, we integrate EfficientViT with YOLOv11 to boost its dense prediction performance, particularly for overlapping objects.
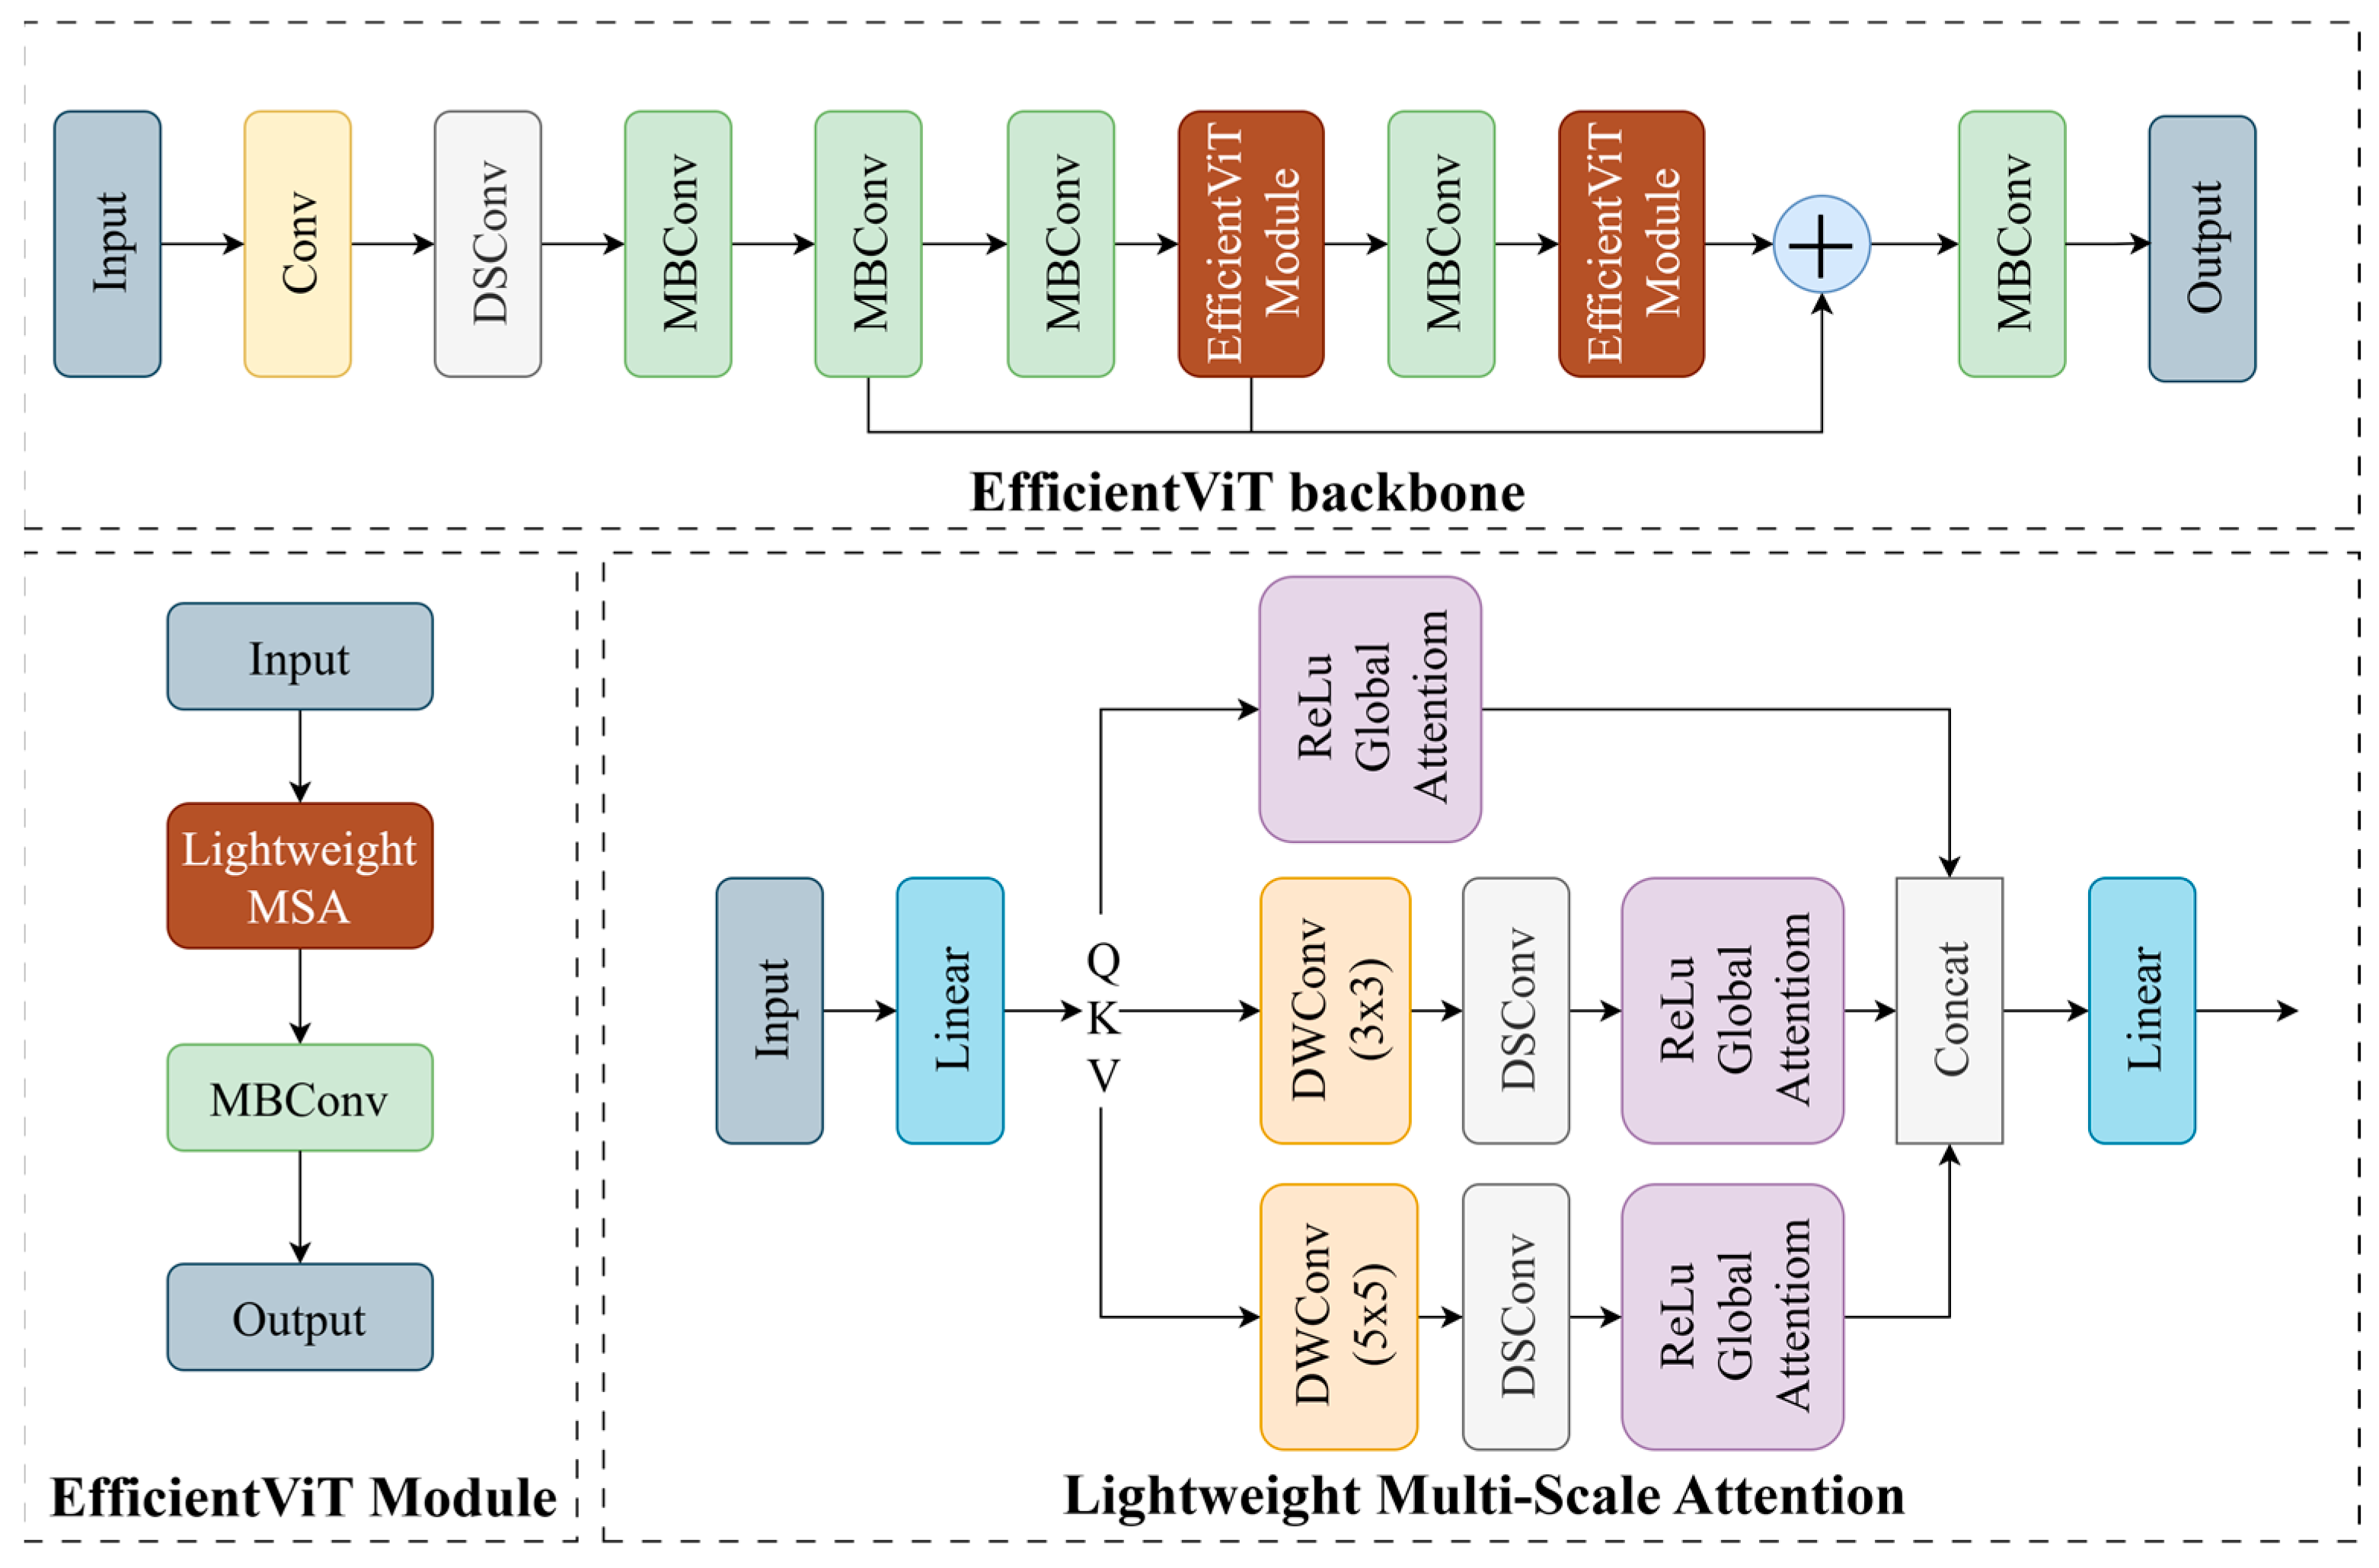
Previous high-precision dense prediction tasks typically relied on complex self-attention mechanisms or sophisticated topological structures [24]. In contrast, EfficientViT achieves global receptive fields and multi-scale learning through lightweight multi-scale attention modules [24,25,26,27]. The architecture of EfficientViT is shown in Figure 4 [24]. Compared to conventional Transformer blocks, EfficientViT performs better in dense prediction tasks while significantly reducing computational overhead [28]. Therefore, we replace the original backbone network of YOLOv11 with EfficientViT. Compared to the previous backbone, EfficientViT provides the YOLO network with multi-scale information and global receptive fields attributed to the self-attention mechanism in Transformers. These advantages significantly enhance the precise segmentation capability for densely distributed eggs. In addition, in contrast to conventional Transformers, EfficientViT substantially reduces computational complexity, enabling the potential deployment of our algorithm on edge devices and supporting real-time computation in subsequent implementations.

2.2.2. Enhancing Edge Feature Extraction Using Central Difference Convolution

Eggs in images typically exhibit smooth and low-contrast edges, whereas traditional convolution operations tend to blur edge details, leading to segmentation errors in egg boundaries. While such errors are often overlooked in general scenarios, they can be catastrophic for our task because precise egg weight estimation requires highly accurate segmentation masks. To address this, we integrate Central Difference Convolution (CDC) into the YOLO network.
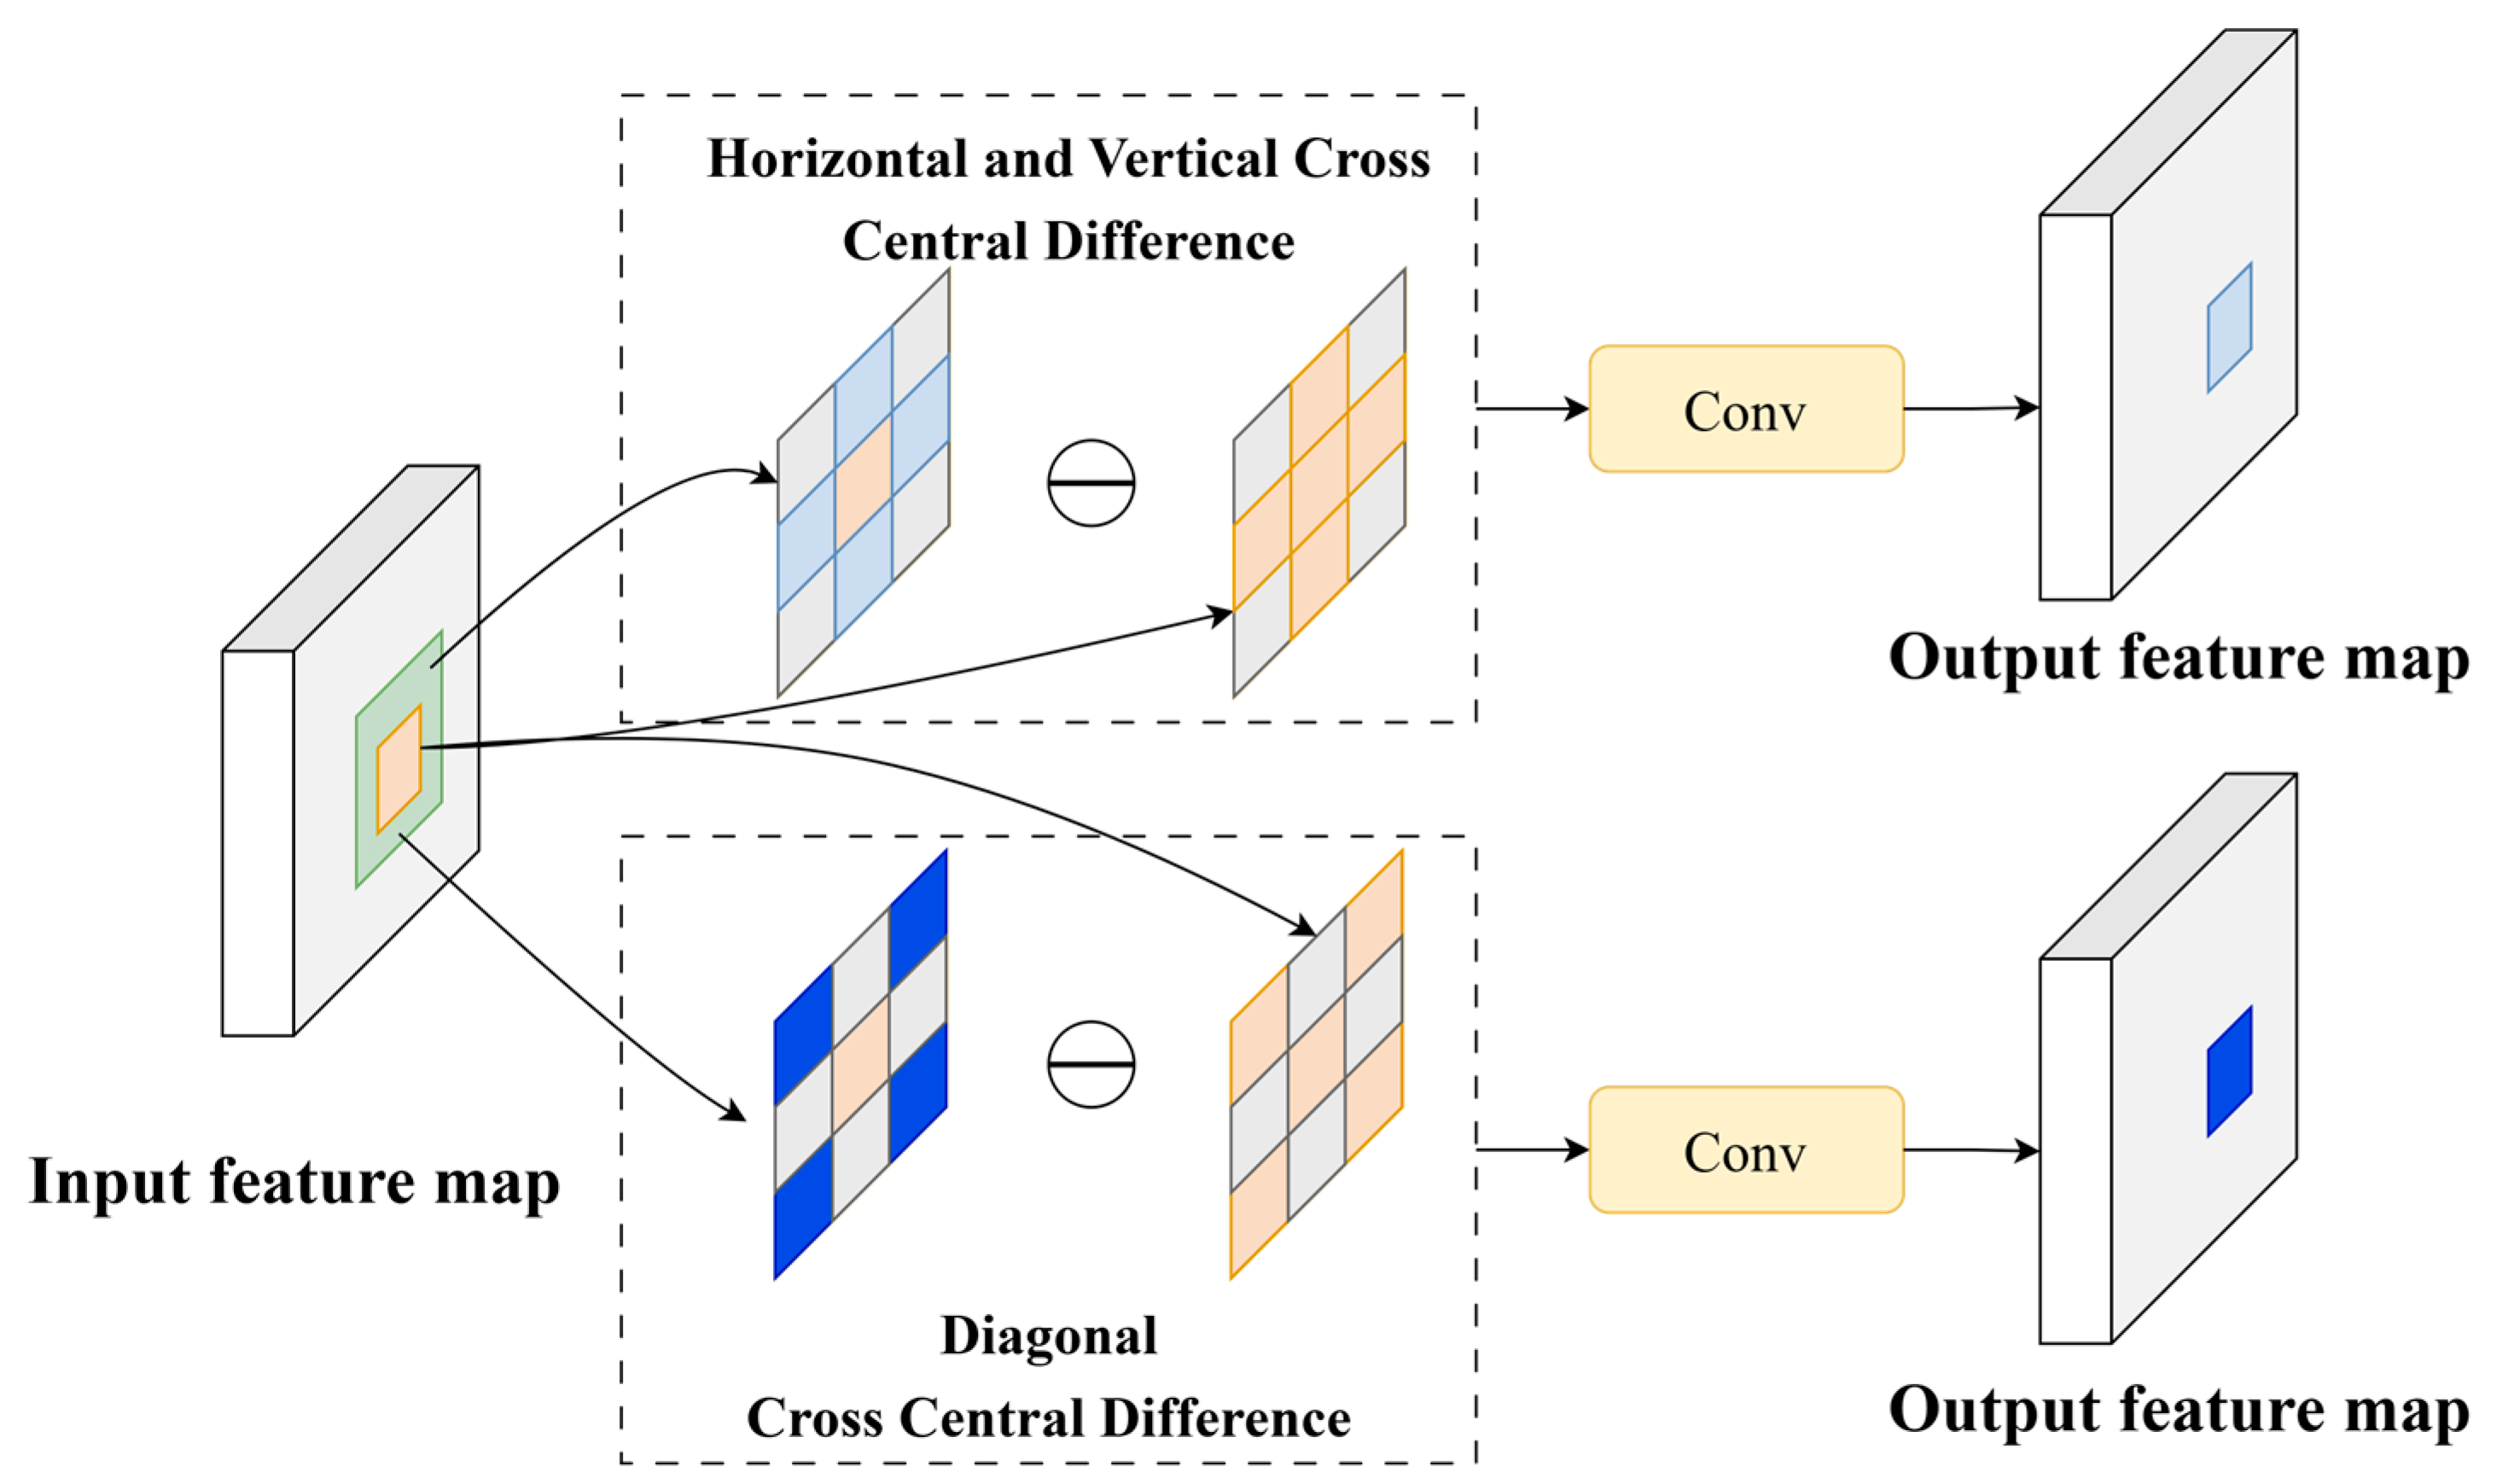
The computational principle of CDC is illustrated in Figure 5 [13]. Compared to vanilla convolution, CDC incorporates gradient features to enhance representational and generalization capabilities, which improves the neural network’s ability to extract edge features of objects [13,29]. Specifically, CDC introduces additional contrast information by computing differences between the central point and surrounding pixels within the convolutional window. The mathematical description of this process is as follows:
f ( x , y ) = ( i , j R ) w ( i , j ) ( F ( x + i , y + j ) F ( x , y ) )
Practically, CDC is typically combined with vanilla convolution in a weighted manner, ensuring that the neural network maintains effective feature extraction while enhancing sensitivity to edge information, and the whole process can be expressed as:
C D C ( x , y ) = α ( i , j R ) w ( i , j ) ( F ( x + i , y + j ) F ( x , y ) ) + ( 1 α ) ( i , j R ) w ( i , j ) F ( x + i , y + j )
The hyperparameter α ( 0 , 1 ) is used to determine the contribution between CDC and vanilla convolution. The window size R used to calculate the difference is equal to the convolution kernel size [13].
Compared to the baseline YOLOv11 network, our CDC-enhanced YOLO architecture achieves more accurate egg segmentation masks. This enables precise measurement of top-view egg characteristics such as projected area and shape index, which are critical for subsequent weight estimation.

2.3. Precise Egg Weight Measurement Based on EWM-Net

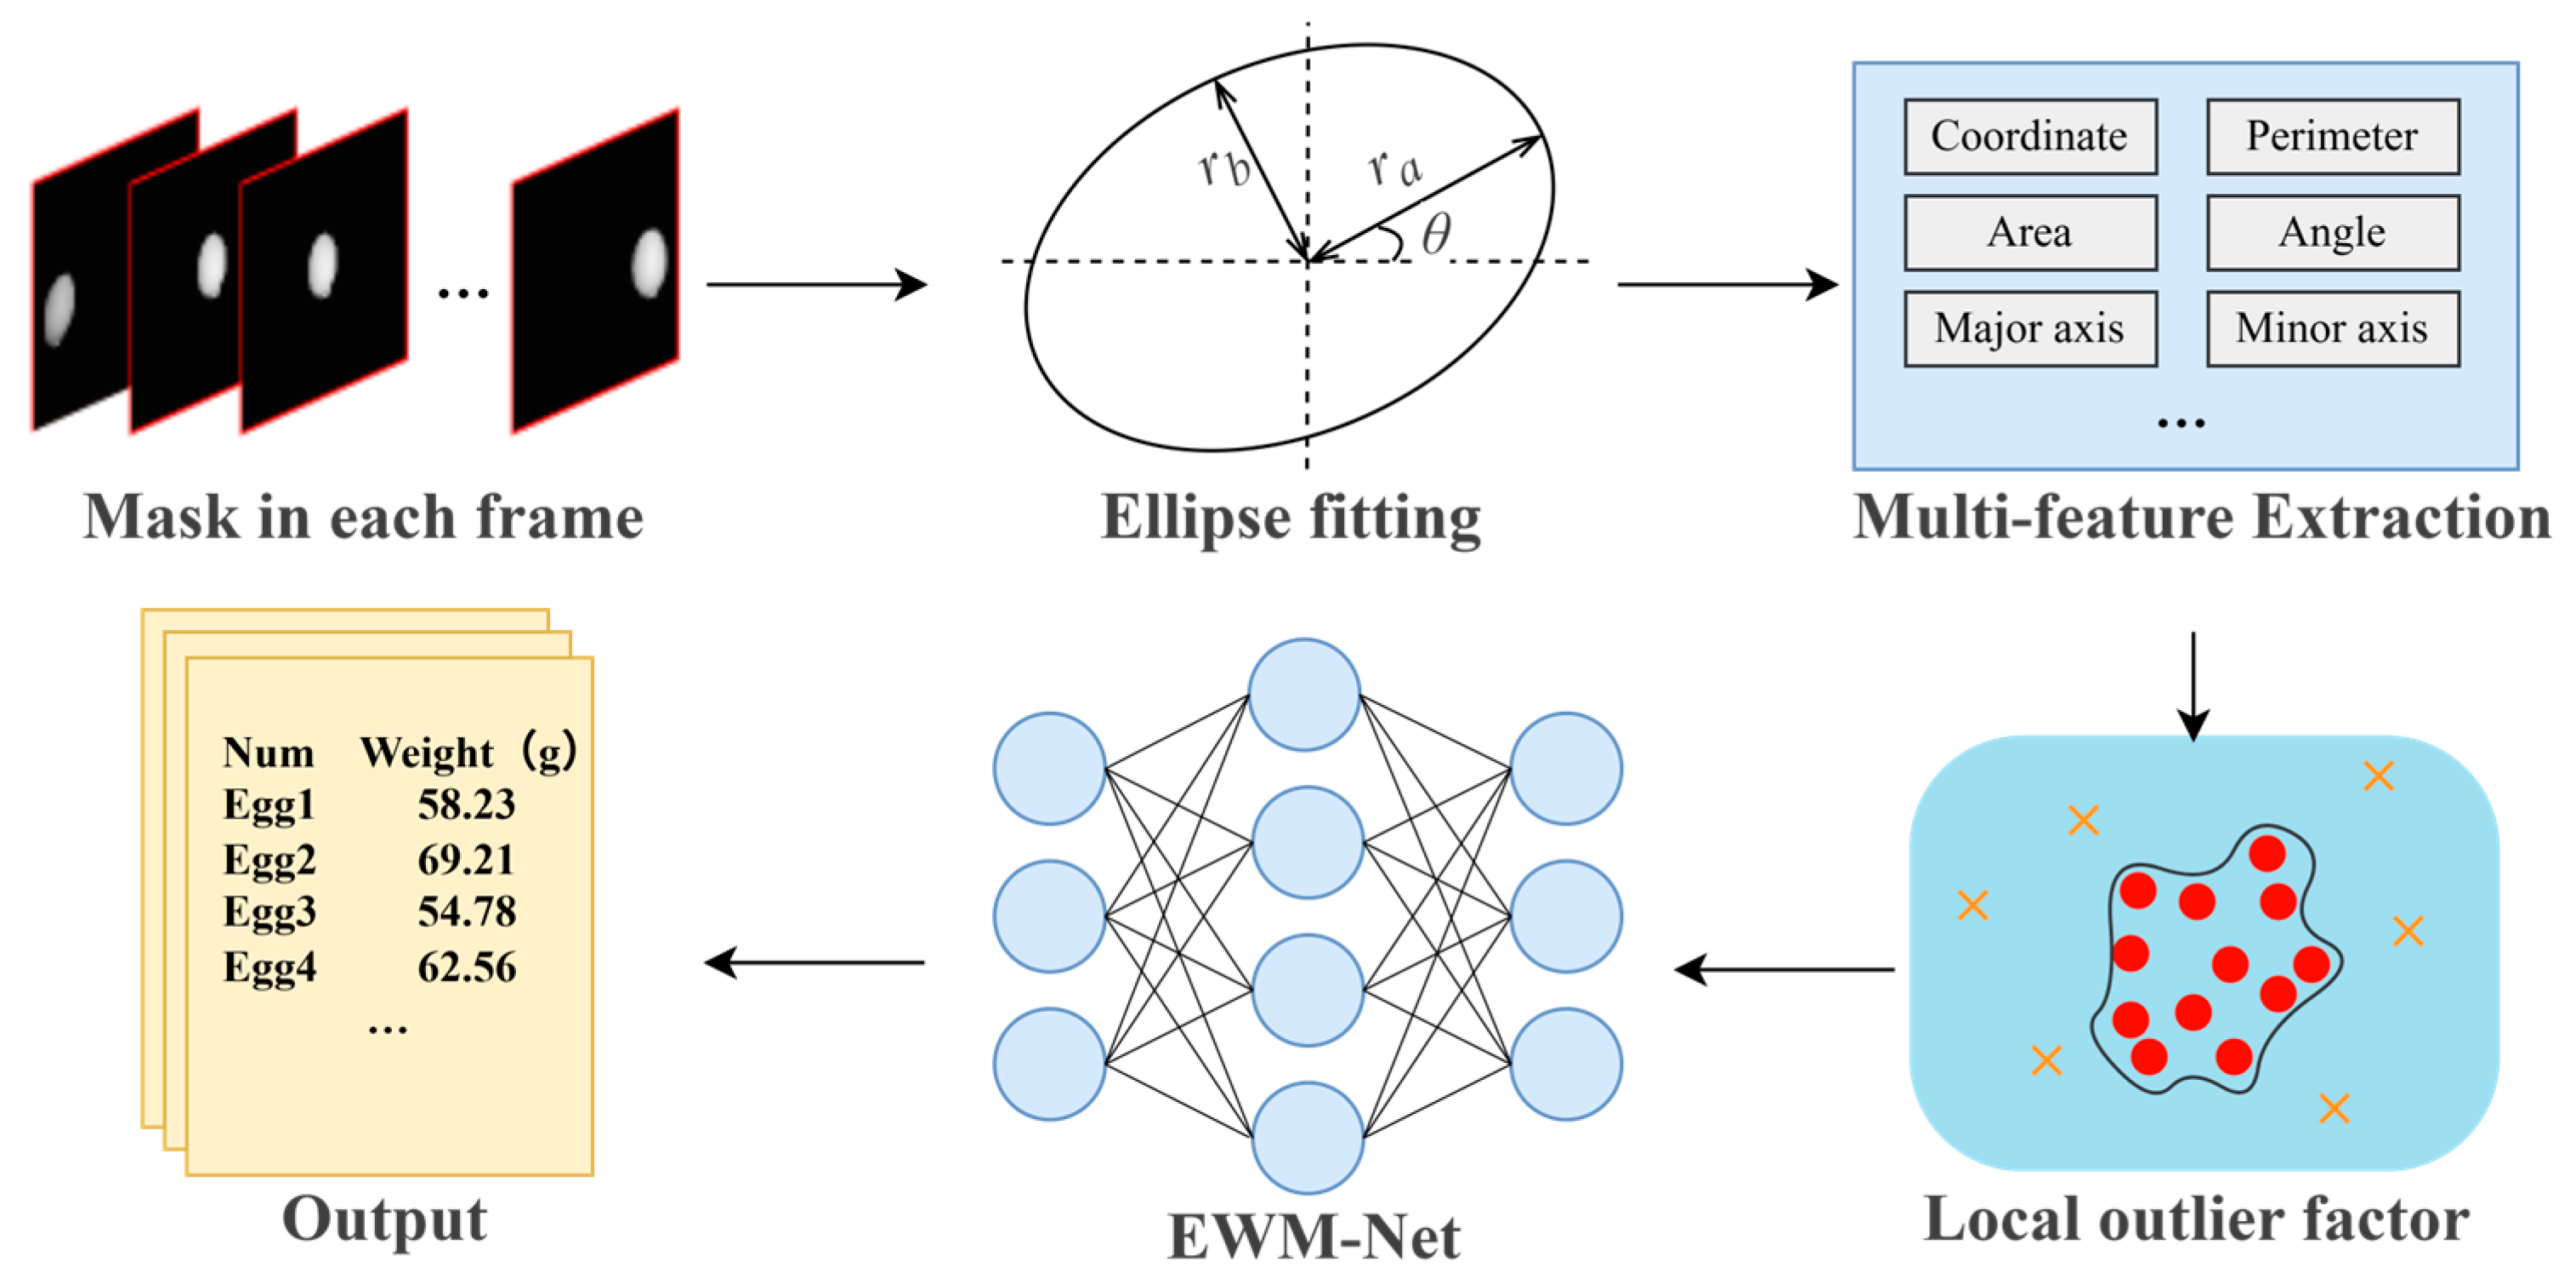
Based on the segmented masks of individual eggs in each frame, we further develop a multi-frame egg weight estimation technique. First, we perform ellipse fitting via least squares to extract multi-features of the egg, achieving feature dimensionality reduction. Subsequently, the Local Outlier Factor (LOF) algorithm is applied to eliminate potential anomalies in the results. Finally, the processed data are fed into our proposed EWM-Net for egg weight prediction, with results stored in the egg weight database. The overall process is shown in Figure 6.

2.3.1. Multi-Feature Extraction by Least Squares

Notably, for the obtained mask, we can directly use a neural network to predict the egg weight of the whole mask image. But this might incur substantial computational overhead and memory burden, potentially hindering deployment on edge devices in subsequent research. To address this, we propose a dimensionality reduction strategy through geometric fitting by extracting multiple compact features of the egg before the processing of the neural network. Narushin et al. [30] proved that an ellipsoid is one of the most reasonable geometric shapes used to fit eggs. In previous studies, the egg is also usually approximated to an ellipsoid [31,32,33,34,35]. Moreover, fitting primitive models represents a well-established practice in computer vision, offering significant advantages for data simplification [36]. However, direct extraction of ellipse parameters (e.g., major/minor axes and area) from the masks may be compromised by segmentation errors or mutual occlusion between clustered eggs. To mitigate these effects, we first perform least-squares-based ellipse fitting [36] on the egg segmentation results before parameter extraction. In other words, our methodology incorporates an ellipse-fitting refinement step prior to feature dimensionality reduction.
In our implemented least-squares ellipse fitting algorithm, the processing pipeline comprises (1) binarization of the egg mask image, (2) edge detection on the resultant binary image to extract target contour point clusters, ( x 1 , y 1 ) ,   ( x 2 , y 2 ) ,   ( x 3 , y 3 ) …… ( x n , y n ) , and (3) solving the general ellipse equation through iterative minimization of the summed squared algebraic distances between all contour points and the ellipse boundary to derive the optimal fitted ellipse, the mathematical model can be described as:
m i n i = 1 n ( A x i 2 + B x i y i + C y i 2 + D x i + E y i + F ) 2 | B 2 4 A C < 0
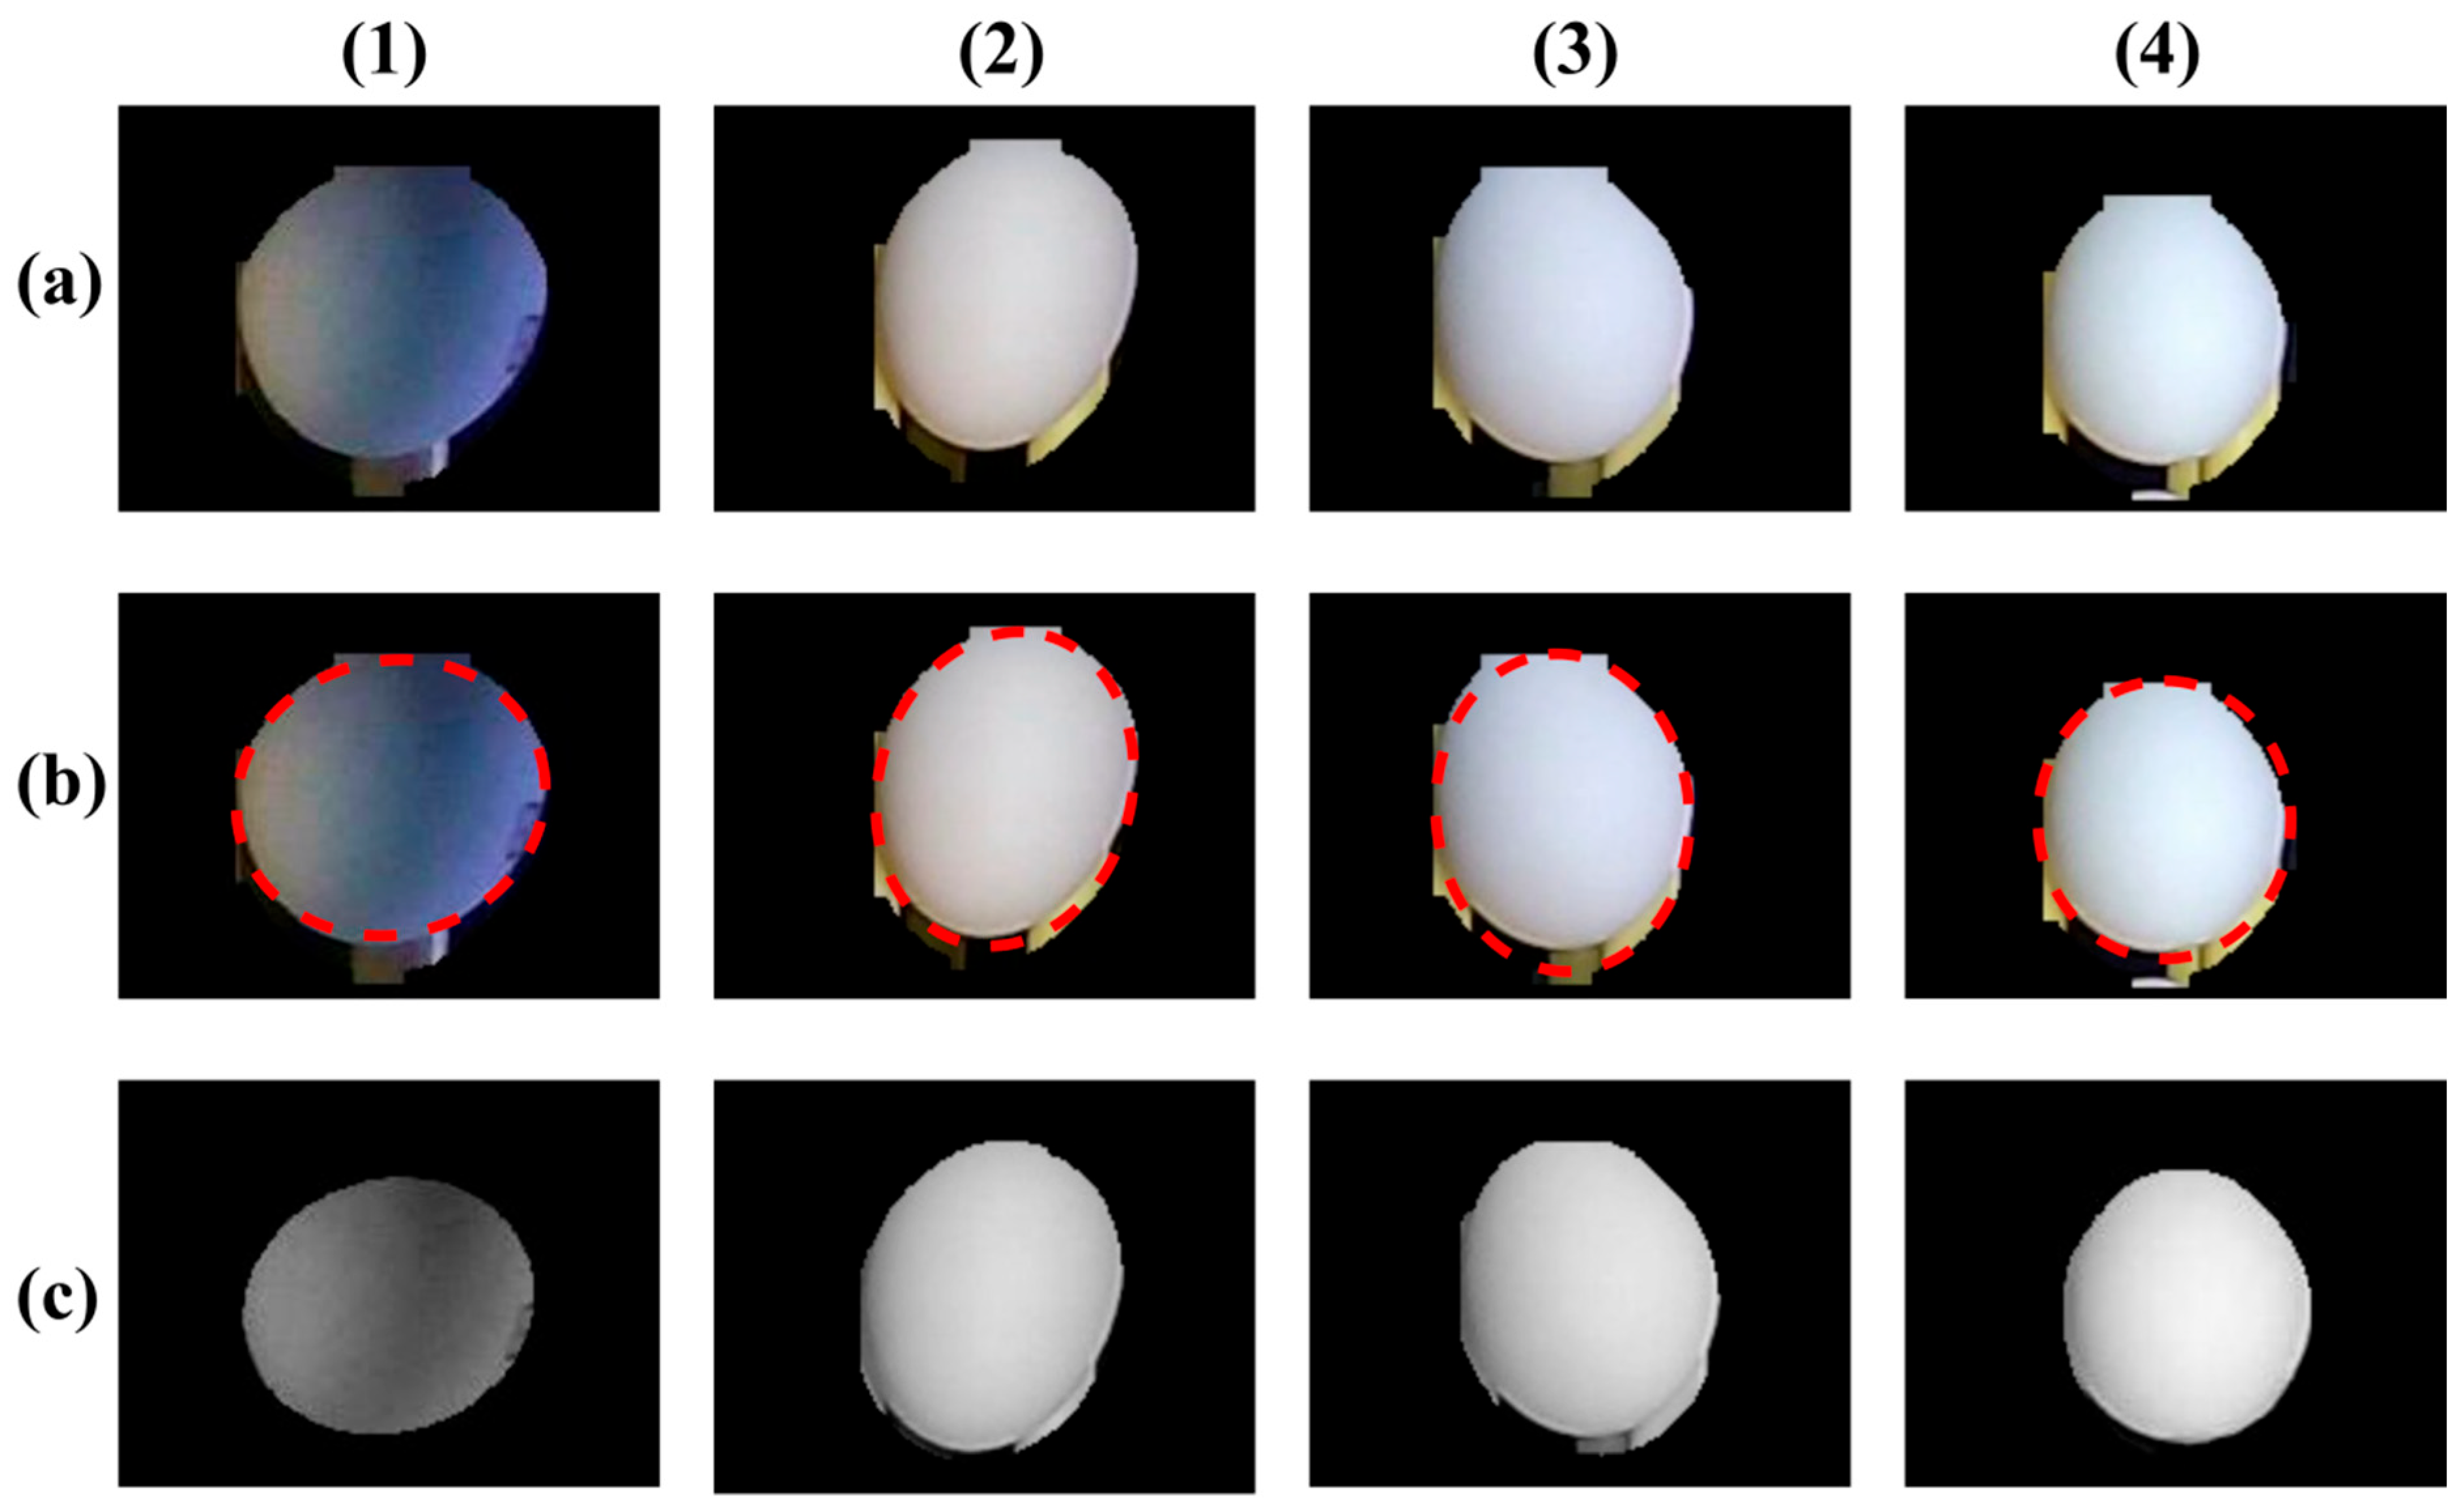
The effect of correcting egg masks by ellipse fitting is shown in Figure 7. Figure 7 reveals that although minor segmentation artifacts remain after ellipse fitting (columns 2–3), the least-squares optimization yields substantially more accurate masks than the raw segmentation. Obviously, using these improved templates to extract ellipse parameters significantly improves the precision of the masks.

2.3.2. LOF-Based Outlier Filtering for Egg Masks

Although we have improved the egg segmentation precision through enhancements to the YOLO-based instance segmentation network and the least-squares ellipse fitting algorithm, certain unavoidable segmentation errors persist in practical scenarios. These include segmentation inaccuracies caused by egg stacking and incomplete segmentation at image boundaries, as illustrated in Figure 8. These significantly deviated masks would introduce substantial bias into the egg weight estimation network. Based on our algorithm’s capability of performing consistent segmentation and ellipse fitting on the same egg across consecutive frames, we implement the Local Outlier Factor (LOF) algorithm [37] to detect and eliminate anomalous masks through multi-frame analysis of ellipse characteristics (major/minor axes and area), effectively mitigating their adverse impact on weight estimation precision. As shown in (4)–(6), the LOF algorithm first calculates the k-distance for each object p and identifies its k-nearest neighborhood N k ( p ) . Secondly, for p and each object within its neighborhood, the reachability distance is computed. The local reachability density (LRD) of p is then derived as the reciprocal of the average reachability distance within the neighborhood. Finally, the LOF value of p is obtained by comparing the ratio of the average LRD of its neighboring points to its own LRD. A higher LOF value indicates a greater likelihood of the point being an outlier [37].
r e a c h d i s t k ( p , o ) = m a x ( k d i s t a n c e ( o ) , d ( p , o ) )
L R D k ( p ) = 1 / ( o ϵ N k ( p ) r e a c e d i s t k ( p , o ) | N k ( p ) | )
L O F k ( p ) = o ϵ N k ( p ) L R D k ( o ) | N k ( p ) | L R D k ( p )
The advantage of this outlier detection method lies in its effectiveness even when significant density variations exist between clusters. Moreover, as a non-parametric approach, LOF is well-suited for complex data distributions. However, its limitations include high computational complexity and poor scalability to high-dimensional data, where distance metrics become unreliable due to the curse of dimensionality.
Therefore, instead of directly applying the LOF algorithm to detect anomalies in egg mask images, we first fitted ellipses to the eggs and extracted features such as major/minor axis lengths and projected areas. This feature dimensionality reduction step not only reduces computational costs but also mitigates algorithm failure caused by high-dimensional spaces. Experimental results also demonstrate that this processing strategy is both simple and highly effective.

2.3.3. Egg Weight Measurement Network

Egg weight prediction can be formulated as a nonlinear regression problem, which is commonly addressed using machine learning methods. Compared to traditional learning approaches, neural networks exhibit superior capabilities in automatic feature extraction and modeling complex nonlinear relationships. Therefore, we developed an EWM-Net to establish the correlation between the images of eggs and their corresponding weights. As previously described, we performed least-squares ellipse fitting on egg masks for feature dimensionality reduction. Based on this, six key features were selected for weight estimation: the Cartesian coordinates of the center point ( x , y ) of the fitted egg in the image (representing different camera perspectives relative to the egg), major axis length r a , minor axis length r b , horizontal tilt angle θ , perimeter, and area, as shown in Figure 9.
The design requirements for our proposed EWM-Net focus on predicting egg weight from six geometric parameters, which does not require excessive network complexity. An overly complex neural architecture would lead to overfitting, causing the model to learn spurious noise and residual variation that should not be captured. This would consequently degrade the model’s generalization capability and robustness [38,39]. Furthermore, an excessively deep network would dramatically increase computational costs, imposing additional burdens on hardware resources and memory capacity. Therefore, we implemented EWM-Net with only five layers. The detailed architectural parameters are provided in Table 1, and the other related parameters are in Table 2. In EWM-Net, all convolutional kernels adopt a 3 × 3 size, while the loss function and activation function employ the widely used L1 Loss and LeakyReLU, respectively. Additionally, a dropout rate of 0.2 is implemented to further mitigate overfitting.

2.4. Data Acquisition

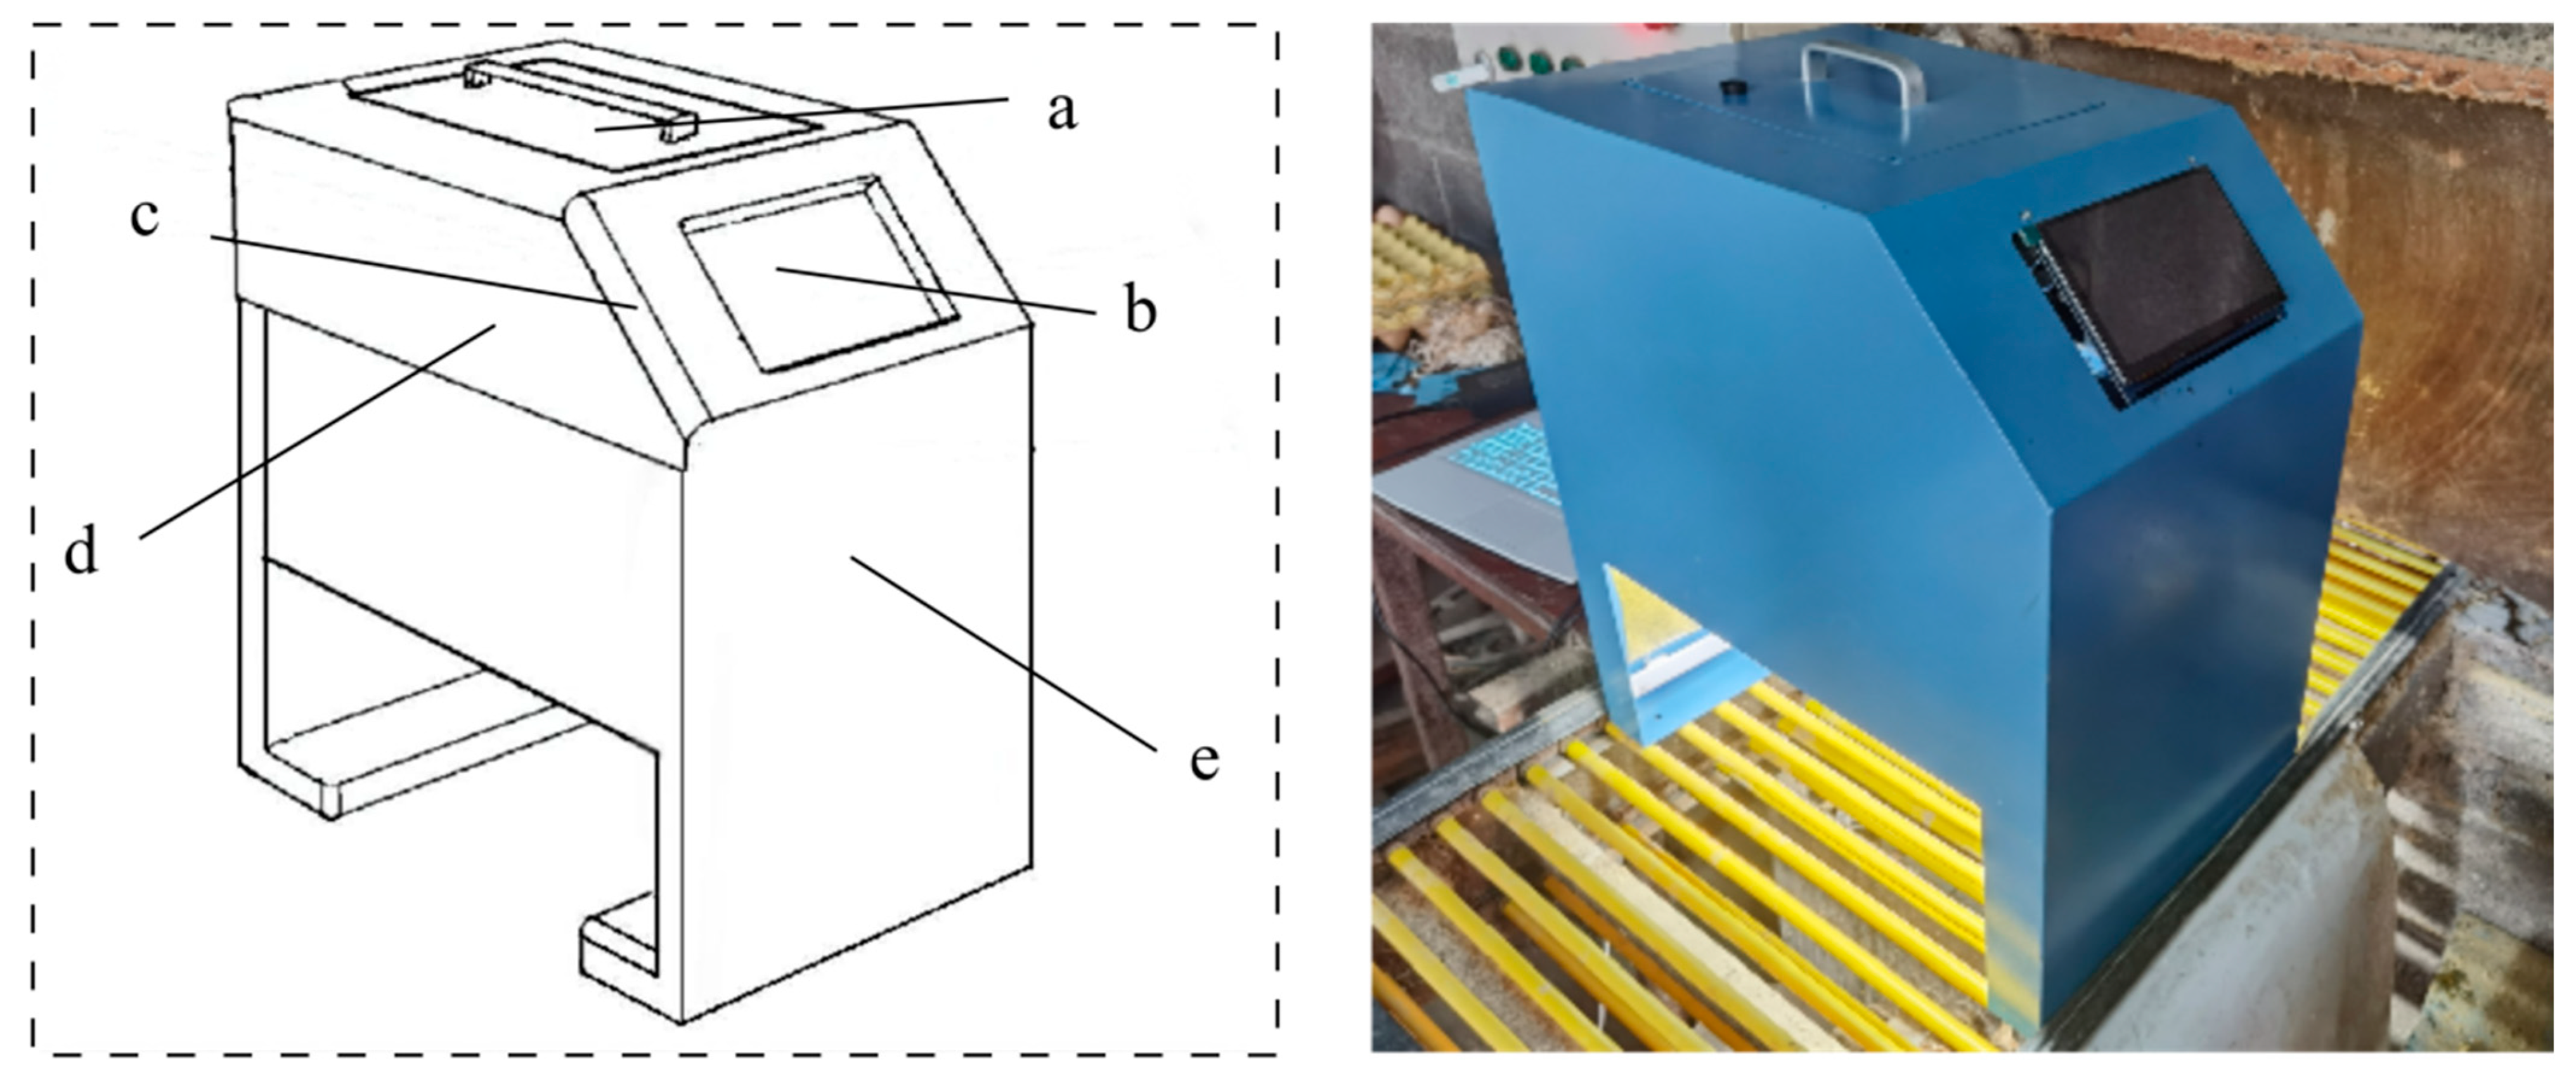
Two distinct datasets are required for training and testing CEV-YOLO and EVE-Net, Respectively. We developed a customized data acquisition device directly deployable on an egg collection transmission line, equipped with an industrial surveillance camera and integrated lighting system. The device diagram is shown in Figure 10, and the camera specifications are detailed in Table 3.
All the image and video data in this study were collected using the device, and the weight data were collected by a high-precision electronic scale (accuracy: ±0.01 g). The data acquisition was conducted at a local laying hen farm in Quzhou, Zhejiang Province, China, during July and August 2024.

2.5. Dataset Construction

2.5.1. Egg Segmentation Dataset

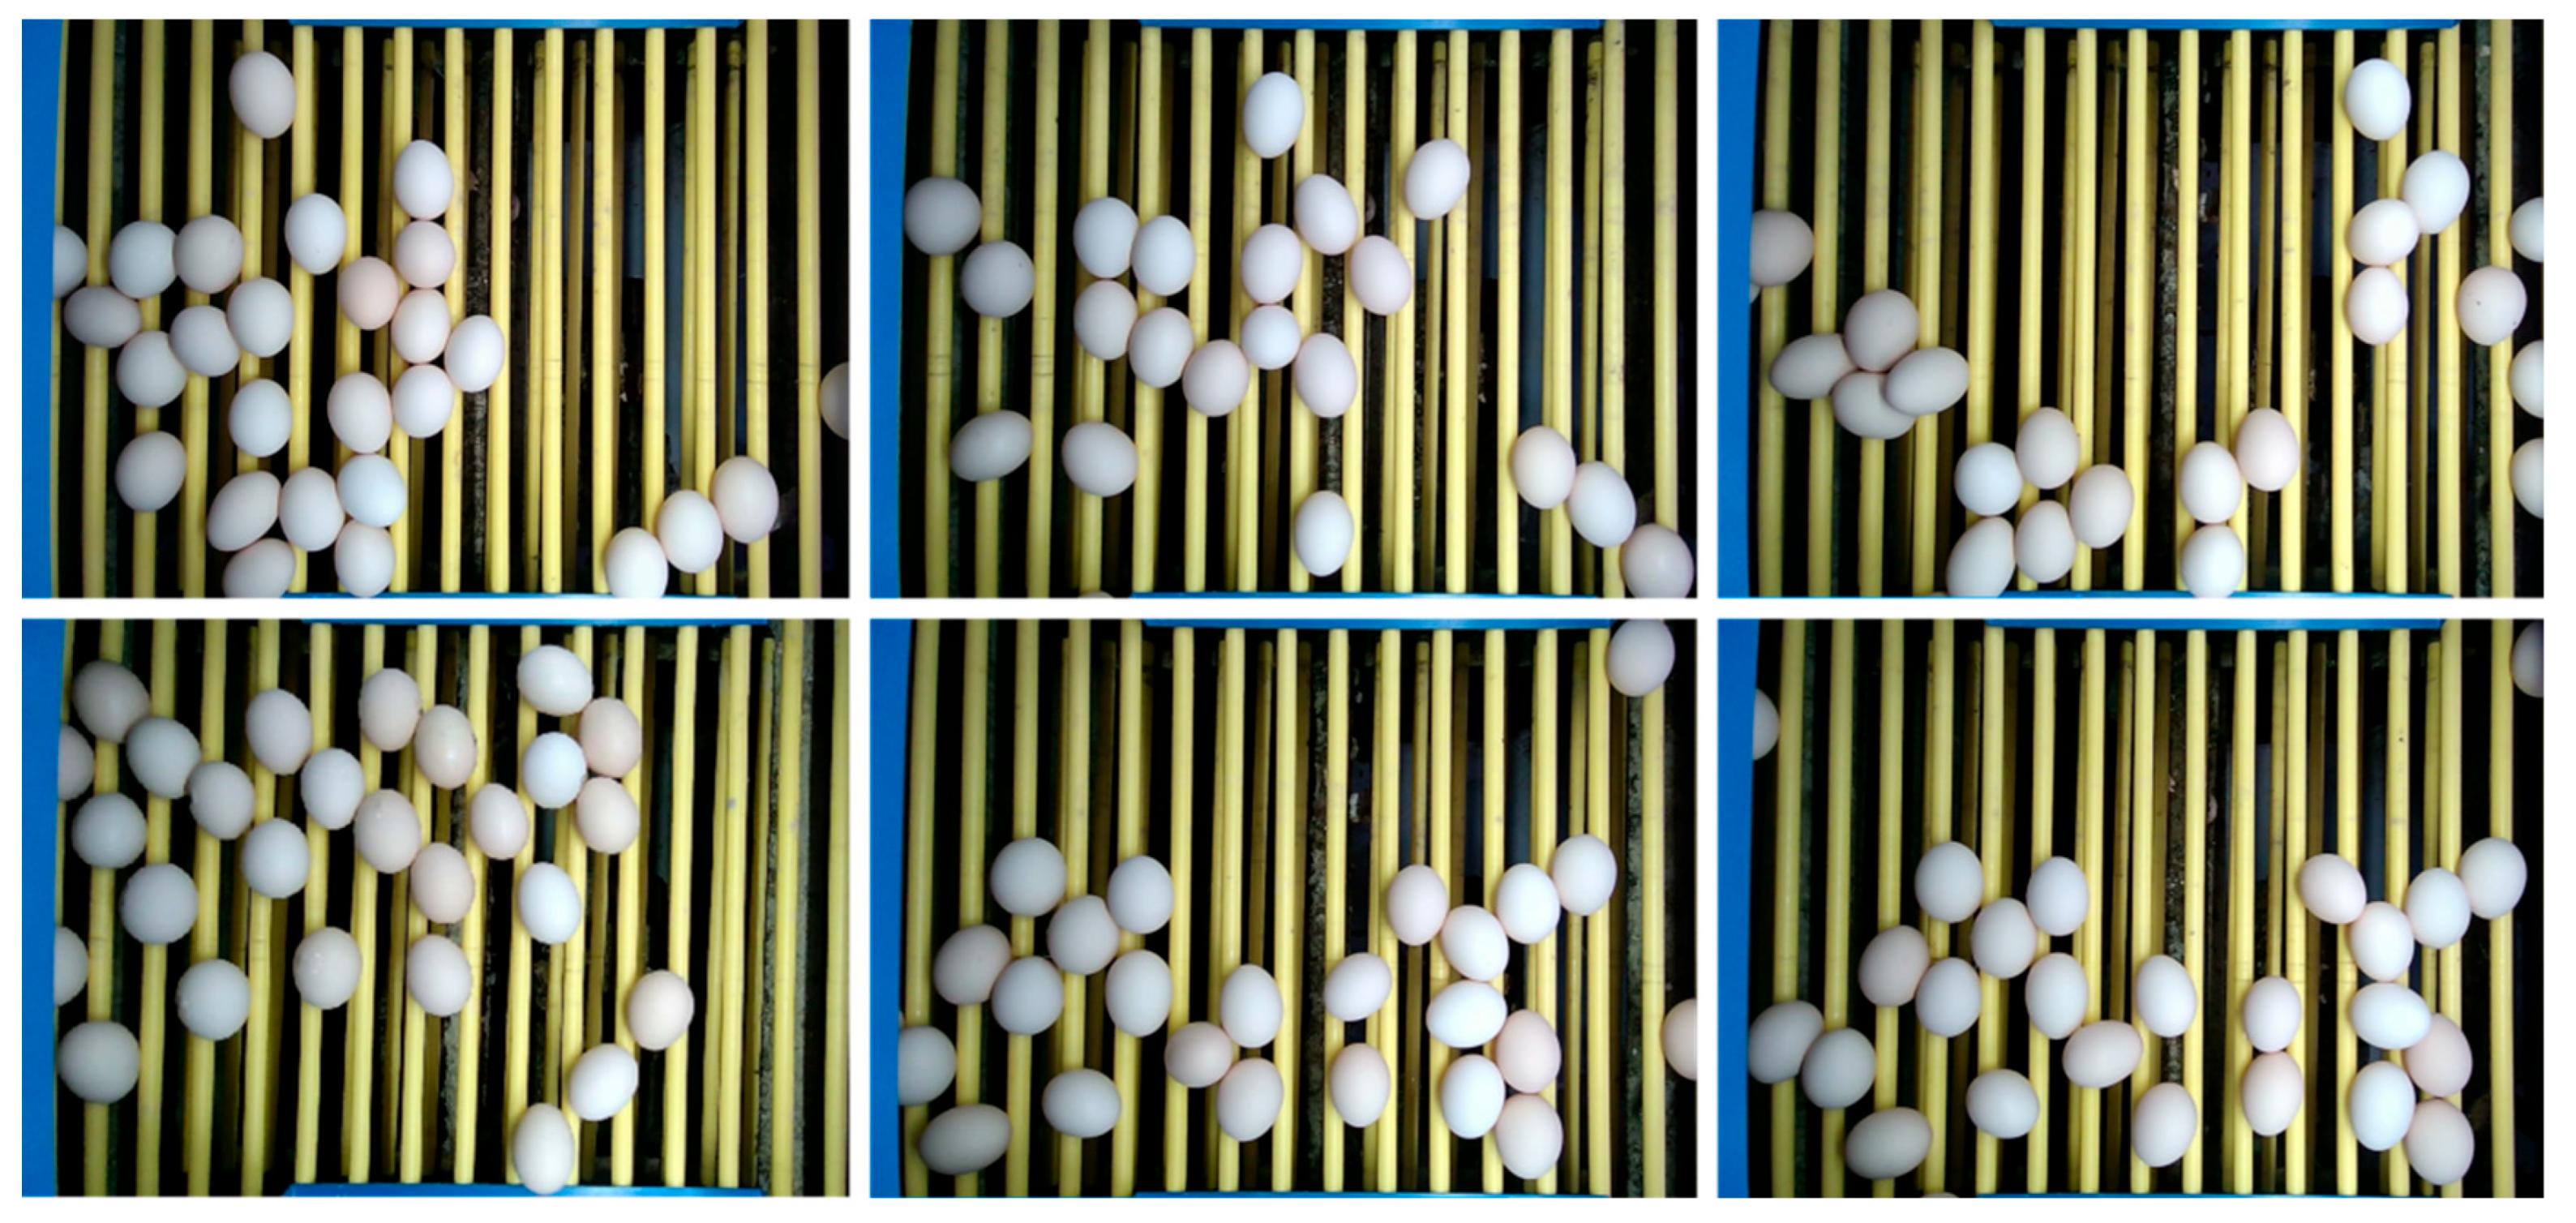
Using our monitoring system installed above the egg collection transmission line, we captured 34 video clips totaling 557 s of footage. From these recordings, we extracted 353 keyframes and performed manual instance segmentation annotations, resulting in a dataset containing 6783 egg instances. This dataset was randomly split into training, validation, and test sets at a 7:1:2 ratio for CEV-YOLO model development. Figure 11 shows some examples from the dataset.

2.5.2. Egg Weight Dataset

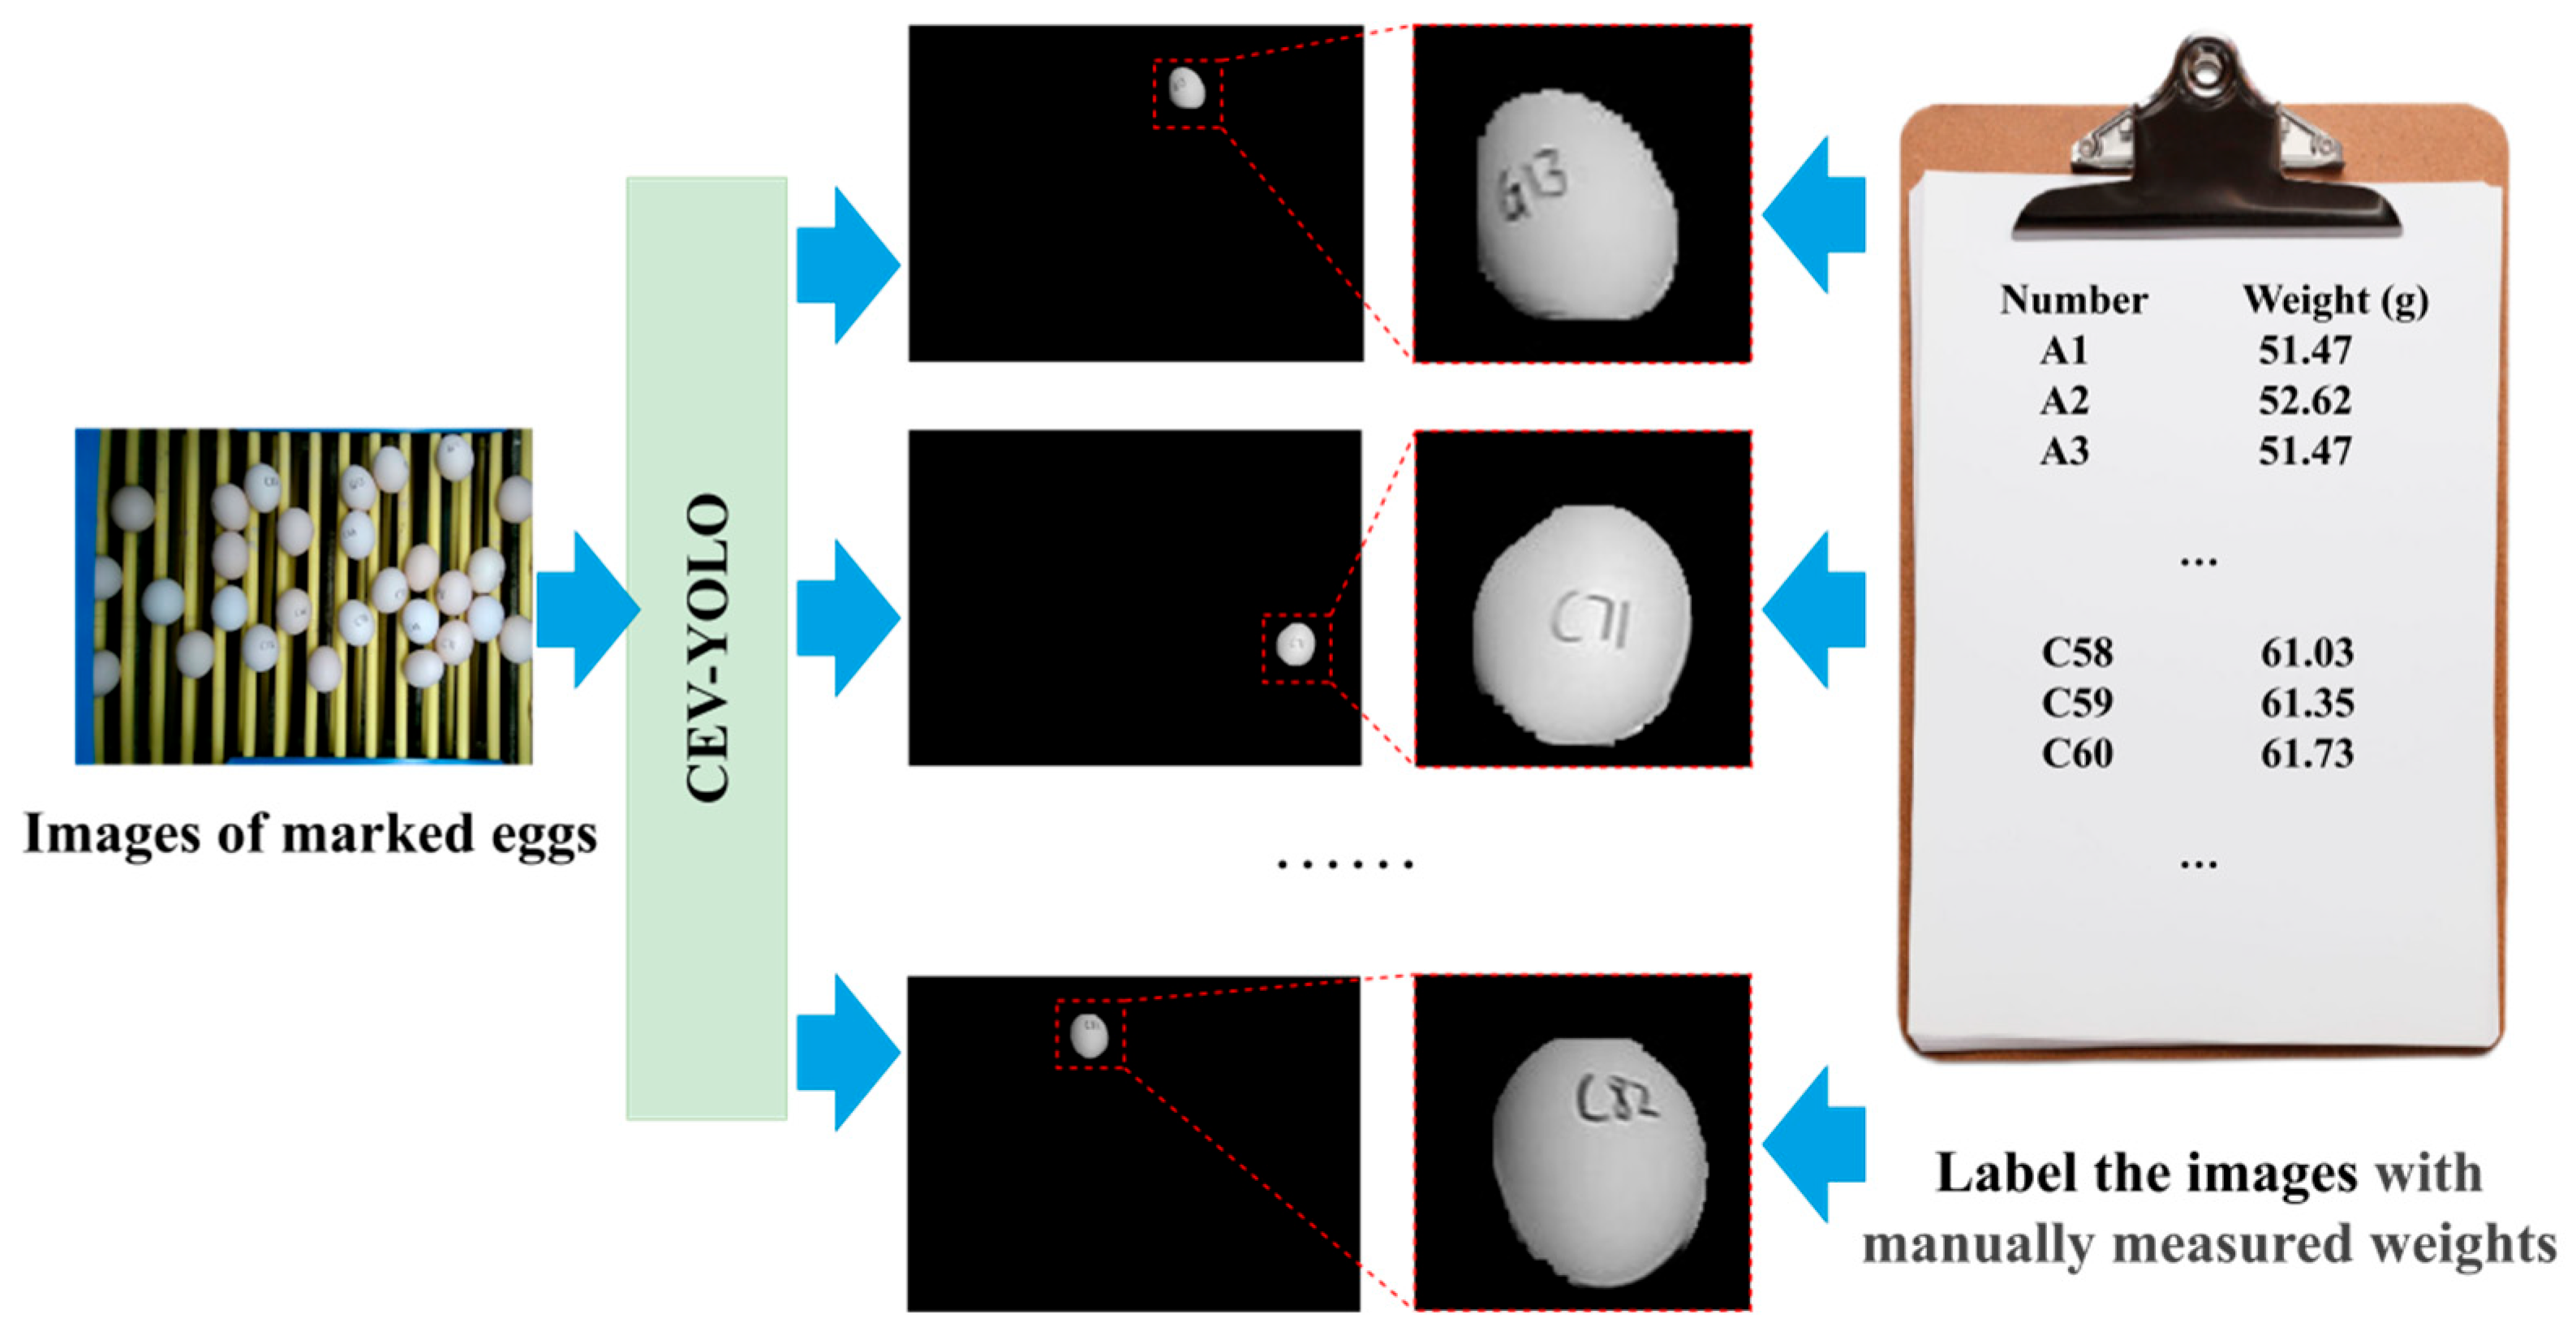
For egg weight measurement, we manually weighed and then labeled 669 eggs with a marker pen. These marked eggs were then arranged into 18 naturalistic clusters (mimicking real production conditions) and transported twice through the conveyor under camera surveillance. After subsampling videos at 5-frame intervals, we employed the trained CEV-YOLO model to extract individual egg masks and correlate each egg with its weight as the label. The final weight-annotated dataset comprises 669 eggs with 37,361 images. Figure 12 is an illustrative example of the process of annotating the egg weight dataset.
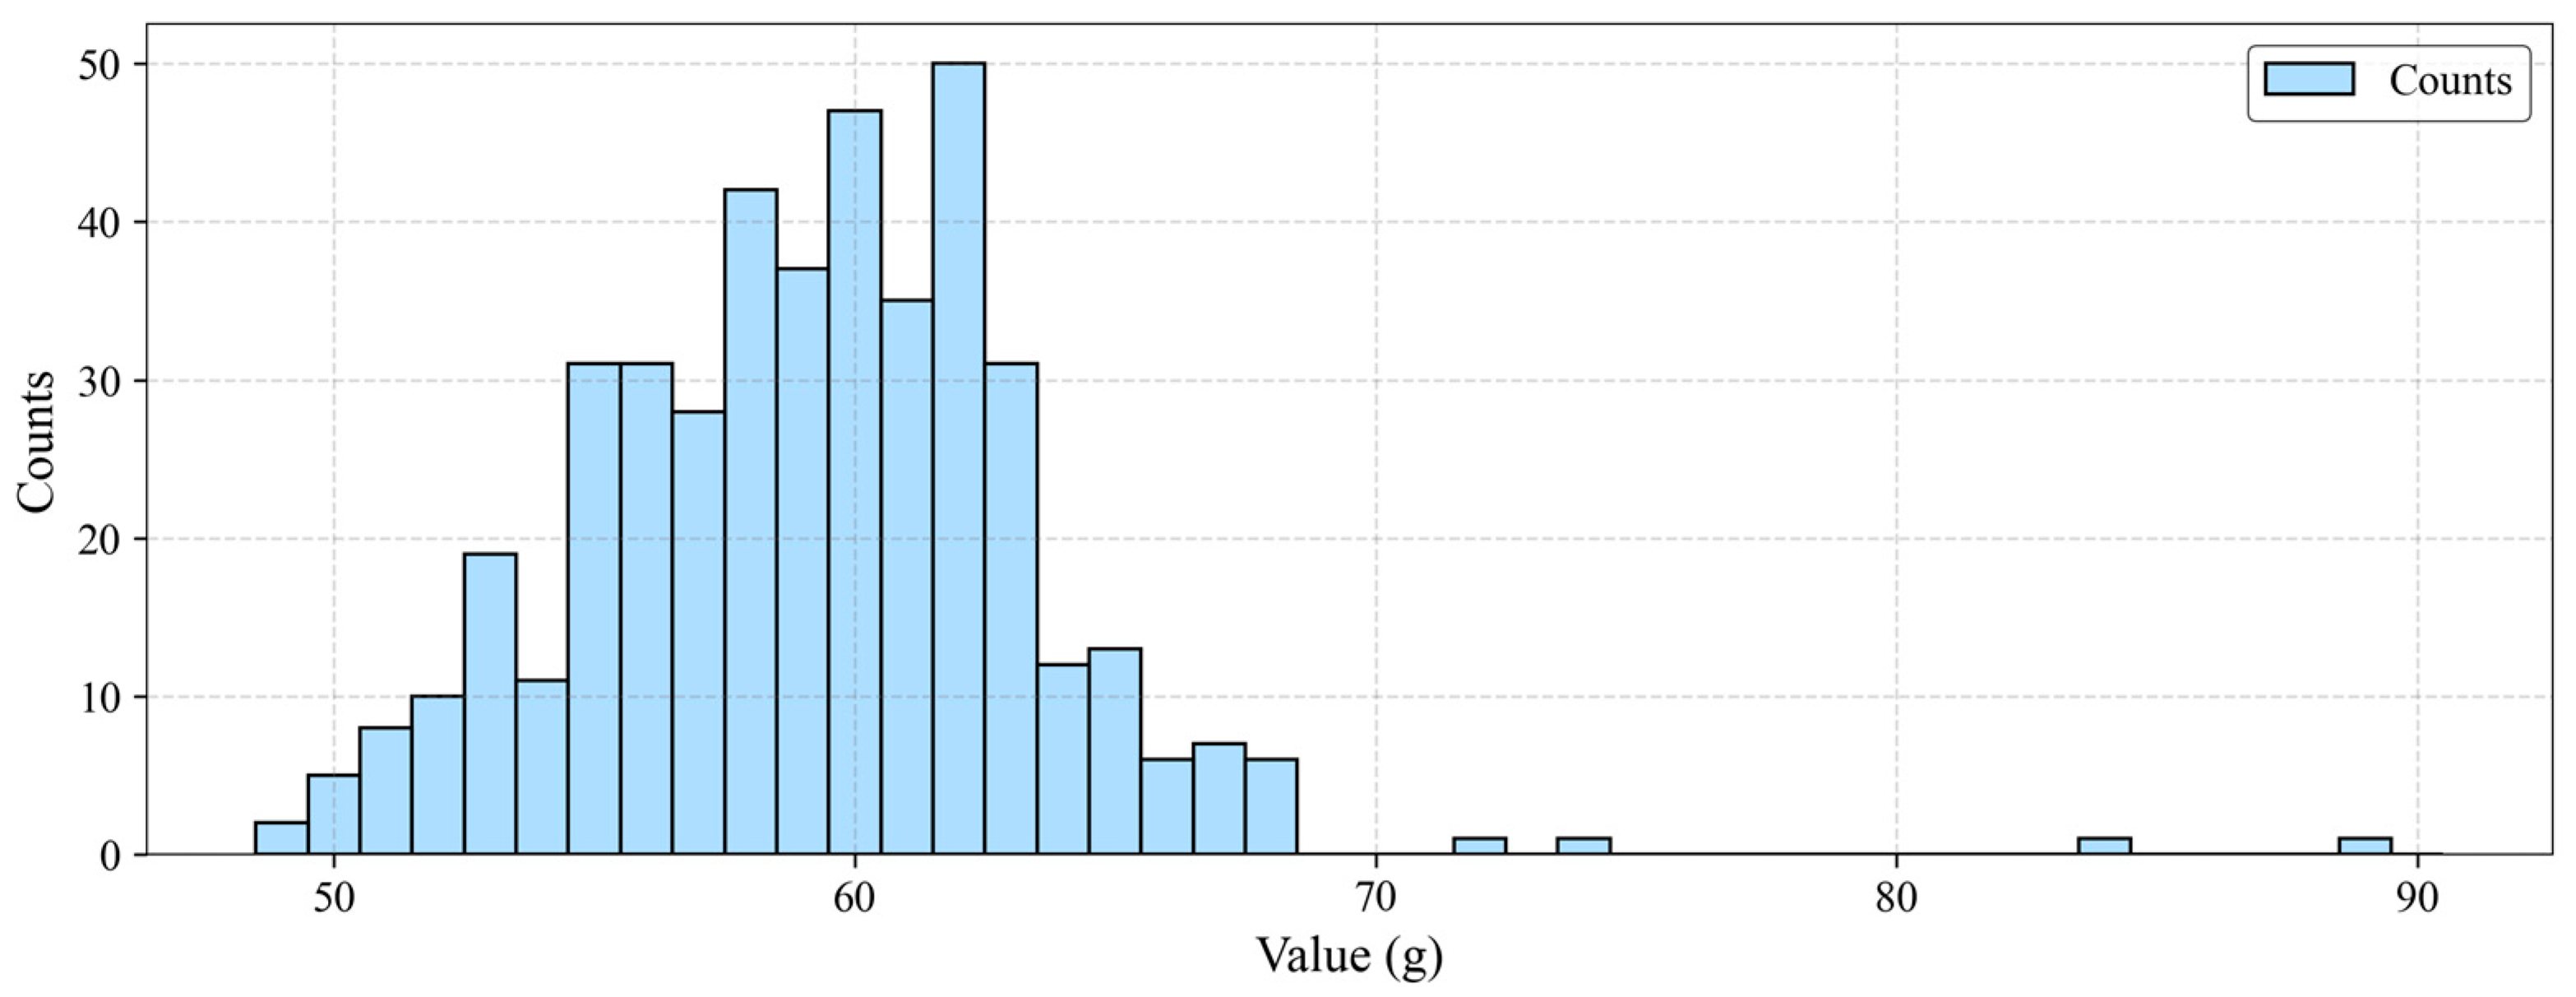
Notably, our test dataset comprises 447 eggs representing the entire daily production from a layer hen farm. We deliberately avoided artificial influence of weight ranges in the test set. This sampling strategy better reflects the intrinsic weight distribution in commercial production environments, thereby providing a more accurate evaluation of our method’s practical performance. The egg weights in the dataset follow a natural normal distribution ranging from 49.13 g (minimum) to 89.19 g (maximum). The average value of all egg weight data is 60.78 g, with a standard deviation of 7.34 g. The histogram of the test set data distribution is shown in Figure 13.
Building on the 447 eggs (used for the test set), an additional 222 eggs were collected at other times to form the training and validation datasets. These 222 eggs were split at an 8:2 ratio, resulting in 178 eggs for the training set and 44 eggs for the validation set. Each egg was labeled with a unique serial number, and the dataset division was performed on a per-egg basis—ensuring that images of the same egg did not appear simultaneously across the training, test, and validation sets.

2.6. Experimental Environment

All model training and testing in this study were conducted on a deep learning workstation. The detailed workstation specifications are provided in Table 4. For the software environment, we utilized Python 3.10.16 and PyTorch 2.6.0 with CUDA and cuDNN acceleration for GPU computing, employing PyCharm 2024.2.2 as our integrated development environment.
For CEV-YOLO training, we standardized the input image resolution at 1280 × 720 pixels. The model was optimized using AdamW (Adam with Weight Decay) with a learning rate of 0.002 and momentum of 0.9. The training epoch was set to 60 with a batch size of 8. Related parameters of training the CEV-YOLO are shown in Table 5.
For the EWM-Net training, we utilized a dataset comprising 37,361 images. Given the scale of the dataset, we adopted the SGD (Stochastic Gradient Descent) optimizer for its demonstrated efficiency with large-scale data [40]. The network accepts a 1 × 6 feature vector as input and exhibits low computational complexity, enabling a larger batch size of 32 and 200 training epochs. We employed the standard L1 loss as the objective function. The calculation process of L1 loss is shown in Equation (7). Related parameters of training the CEV-YOLO are shown in Table 6.
L 1 L o s s = 1 n i = 1 n | y i y i ^ |

2.7. Evaluation Metrics

2.7.1. Metrics for Egg Segmentation

In the egg segmentation task, we adopted evaluation metrics commonly used in computer vision as proposed in the COCO dataset [41], including Precision (P), Recall (R), and AP. The calculation formulas are as follows:
P = T P T P + F P
R = T P T P + F N
A P = 0 1 P ( R ) d R
where TP (True Positive) and FP (False Positive) represent the correctly detected and mistaken samples, respectively, and FN (False Negative) symbolizes the number of undetected samples. In computing the AP, the conventional Intersection-over-Union (IoU) threshold of 0.5 (denoted as AP50) was replaced with a more stringent threshold of 0.9 (AP90). This adjustment enables a more rigorous evaluation of the model’s precise segmentation capability. Additionally, we introduced computational efficiency metrics, including number of giga floating point operations (GFLOPs), parameter count, and Frames Per Second (FPS) to assess model inference speed, establishing a foundation for future deployment on edge devices.

2.7.2. Metrics for Egg Weight Prediction

Egg weight prediction is a nonlinear regression problem. Consequently, we employ standard regression metrics, including MAE, Root Mean Squared Error (RMSE), and the coefficient of determination (R2). Additionally, we define a mean accuracy metric (Acc) expressed as (1—mean absolute percentage error). The calculation formulas are as follows:
M A E = 1 n i = 1 n | y i y i ^ |
R M S E = 1 n i = 1 n ( y i y i ^ ) 2
R 2 = 1 ( y i y i ^ ) 2 ( y i y i ¯ ) 2
A c c = 1 100 % n i = 1 n | y i y i ^ | y i

3. Results and Discussion

3.1. Comparison of Precision of Different Segmentation Models

Computer vision technology is an important component in agricultural engineering. In recent years, the YOLO network has become one of the most popular visual neural networks in the agricultural field due to its advanced performance in terms of accuracy, speed, and network scale [42]. Our CEV-YOLO is also constructed based on the YOLO algorithm network framework.
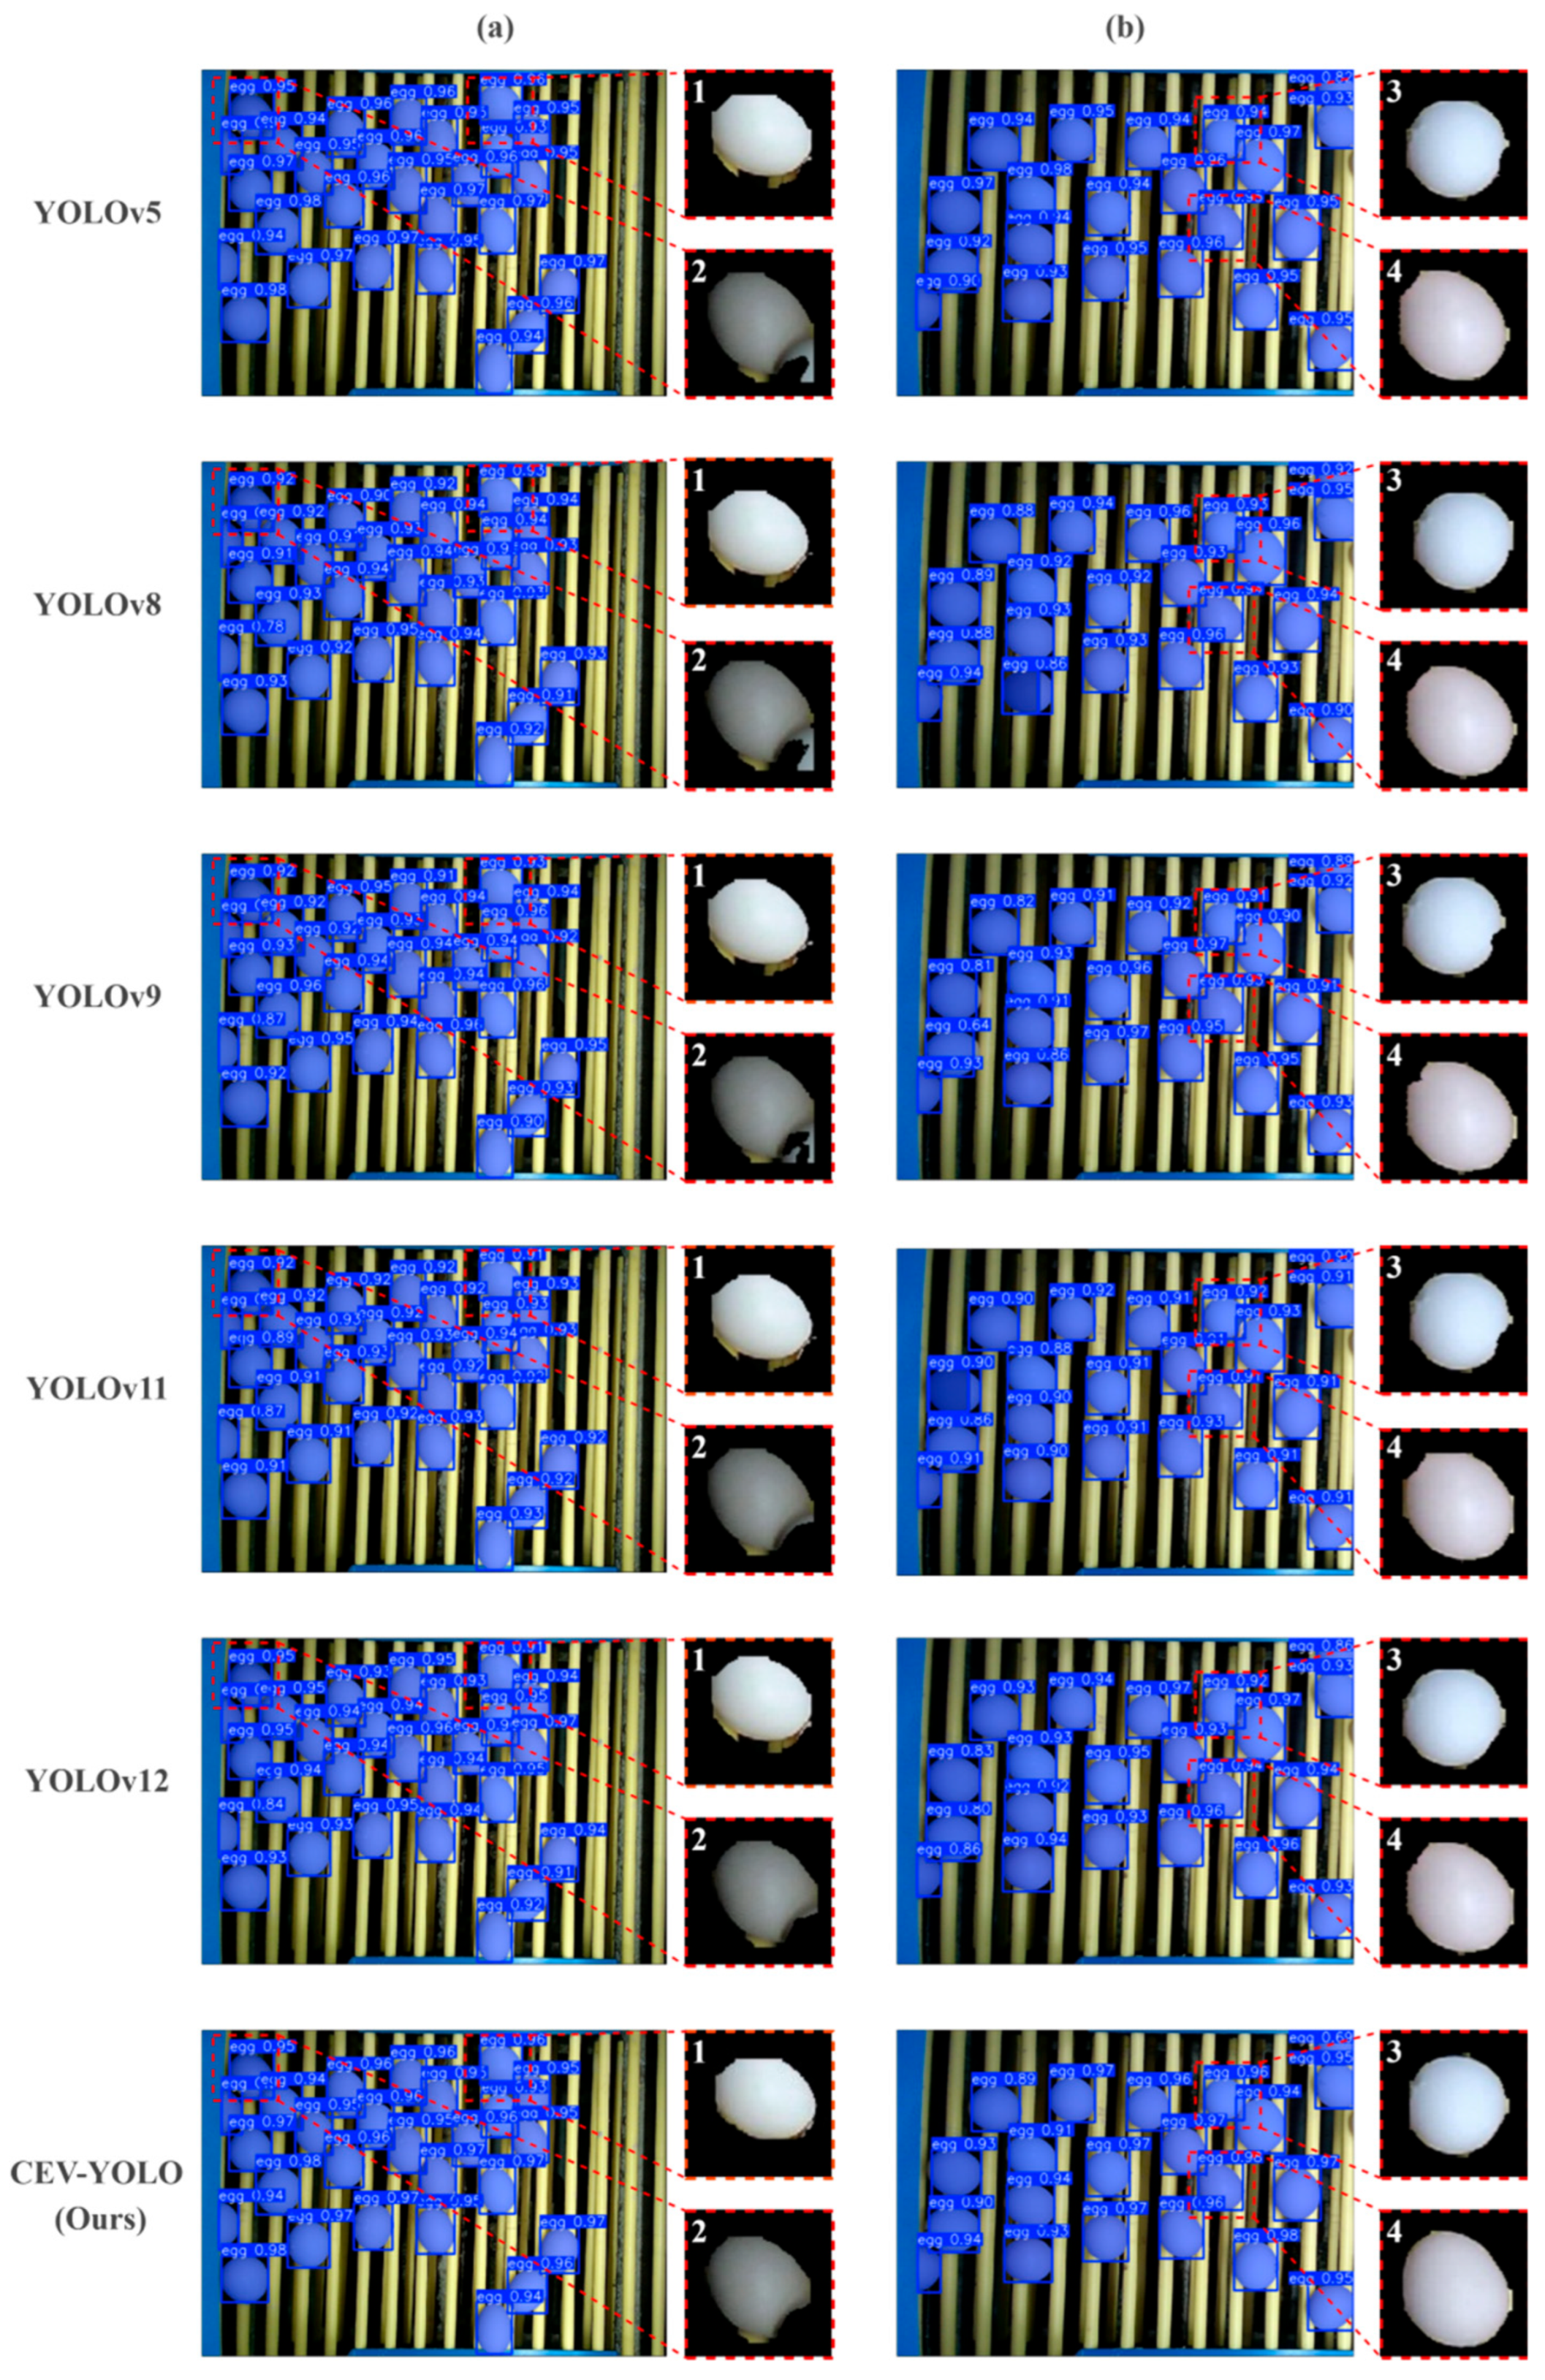
To demonstrate the effectiveness of CEV-YOLO, we compared it with five other advanced YOLO models [43,44,45,46,47], and the visualization results are shown in Figure 14.
Figure 14 compares the egg segmentation results of different models. We selected two representative images from the test set as examples and let six models generate the operation results, respectively (Column a and Column b). Then, we further selected four targets from the images, extracted their corresponding masks, and carried out local magnifications (within the red dashed boxes) to more intuitively display the comparison results.
In Column a, most models mistakenly segmented the background into the mask when segmenting Target 1, while in contrast, the segmentation result of CEV-YOLO is much more accurate. For Target 2, due to the stacking and occlusion of eggs, most models mistakenly segmented another egg overlapping on the target into the egg mask, but CEV-YOLO did not have this problem. In Column b, the smoothness and accuracy of the edge segmentation of the targets (targets 3 and 4) by different algorithms are compared. It also can be observed that the segmentation results of CEV-YOLO are superior. As we have previously stated, although the segmentation results of Column b from different models seem to only exhibit very few differences at the edges, since we need to utilize the segmented masks for ellipse fitting and weight estimation, even a tiny segmentation deviation may lead to a significant weight error. A more precise segmentation result implies that the feature values we input into the weight estimation network are closer to the actual situation of the eggs.
Table 7 provides a quantitative comparison of the above models.
It should be emphasized that although each iteration of YOLO implies an improvement over its predecessor in performance on the COCO dataset [41], this does not guarantee its superior performance in specific applications. The performance of the YOLO-series networks largely depends on the specific characteristics of the dataset [48,49]. For instance, as shown in Table 7, the AP90 of YOLOv9 in the field of egg segmentation is much lower than that of YOLOv8.
As in Table 7, the number of parameters, GFLOPs, and FPS of the proposed CEV-YOLO are 3.99, 11.8, and 39.4, respectively. In terms of running speed, our algorithm’s performance is slightly lower than that of YOLOv5 and YOLOv11 and is close to that of YOLOv12. However, CEV-YOLO has a significant advantage in segmentation accuracy (precision of 98.9%, recall of 97.5%, and AP90 of 89.8%). In general, our algorithm achieves a better balance between running speed and egg segmentation accuracy.
When considering both the visualization results and quantitative comparisons, our model exhibits greater advantages over other models in handling occlusions, as well as in the precision and smoothness of edge segmentation for eggs. This superiority in segmentation performance constitutes a critical prerequisite for achieving highly accurate weight estimation.

3.2. Ablation Experiment of CEV-YOLO

Compared with the baseline model YOLOv11, our CEV-YOLO has made some improvements to the network structure for egg segmentation. To verify the effectiveness of these improvements, we conducted a network ablation study by replacing the modules one by one in the baseline network. The results of the ablation experiment are shown in Table 8.
As can be seen from Table 8, the AP90 of the baseline model is only 85.7%. When we replaced the backbone network of the model with EfficientViT, the AP90 significantly increased by 2.6%, demonstrating the advantages of EfficientViT in dealing with occlusion and dense segmentation. However, this improvement increased the parameters, and the FPS of the model dropped from 53.97 to 41.27. When we further replaced the conventional convolutions in the network with CDC, the AP90 was greatly improved to 90.9% without significantly affecting the computational complexity and running speed of the model. This result indicates that CDC can indeed enhance the model’s ability to segment edge contours and can effectively address the issues of blurred and low-contrast egg edge contours. Ultimately, our CEV-YOLO demonstrates a remarkable improvement, achieving an increase of 5.2% in AP90 compared to the baseline model. Although there is an increase in the GFLOPs and the number of parameters of the model, which has caused the FPS to decrease from 53.97 to 39.38, we consider this acceptable. Evidently, in our task, the segmentation precision is more crucial than a slight reduction in the running speed.

3.3. Comparison of Weight Measurement Accuracy Between Different Regression Models

The measurement of the egg weight can be regarded as a regression task. To demonstrate the superiority of our model in precision, we select six mainstream algorithms in machine learning and deep learning for comparison with our EWM-Net. The models include SVM (Support Vector Machine) [50], KRR (Kernel Ridge Regression) [51], RF (Random Forest) [52], DT (Decision Tree) [53], MLP (Multi-Layer Perceptron) [54], and RNN (Recurrent Neural Network) [55]. The comparison results are shown in Table 9. Figure 15 shows the scatter plot of the test results, where the red dashed line represents the ground truth and the blue dots denote the predicted values. The closer the blue dots are to the red dashed line, the more accurate the weight prediction of the egg is. In Figure 15, the display range is set between 50 g and 68 g for better visual clarity.
In Table 9, among several machine learning models, the accuracy of SVM and KRR (96.17% and 93.53%) is significantly lower than RF and DT (98.18% and 98.01%). In deep learning models, the accuracy of the RNN with a relatively complex structure (94.67%) is also significantly lower than the MLP (98.20%). This result also proves that when predicting the weight based on the egg features after dimensionality reduction, it is not suitable to use a network structure that is too complex. A complex network structure will cause the network to learn the noise and outliers in the data, resulting in overfitting, a decrease in the generalization ability of the algorithm, and poor accuracy.
However, an overly simple network is also not suitable. Our dataset contains 37,361 data records from 669 eggs; an overly simple network structure will have difficulty dealing with such a large amount of data, leading to underfitting. As can be seen from the results, our EWM-Net meets the appropriate network complexity very well.
Building upon the aforementioned experiments, we further conduct replicate experiments on the results to verify its reliability. Specifically, we perform 5 training and validation runs using different random seeds. The average values of MAE, RMSE, R2, and Acc of EWM-Net across these runs are 0.898, 1.176, 0.926, and 98.48%, respectively, with corresponding standard deviations of 0.01, 0.01, 0.01, and 0.02. These results are consistent with the reported point metrics. Further t-tests are conducted to compare the results of 5 repeated experiments of our algorithm with those of 6 other models, using MAE as the evaluation metric. All obtained p-values are less than 0.05: specifically, the p-values for SVM, KRR, and RNN each fall below 0.0001, with that for RF being 0.0015, for DT 0.0004, and for MLP 0.029. These results fully demonstrate the superiority of our algorithm over the other compared algorithms.
It can also be intuitively seen from Figure 15 that the predicted weight values of EWM-Net are closer to the true value line (red dotted line) compared with other methods, demonstrating the robustness and accuracy of our model. Additionally, EWM-Net is the only model with an MAE of less than 1 g (0.88 g), the R2 reaches 0.926, and the accuracy is 98.52%. We conduct statistics on the results of this experiment, revealing that 74.8% of the outcomes exhibit small errors (with relative errors less than 2%), while 4% show larger errors (with relative errors exceeding 4%). The maximum error value is 4.59 g, occurring in a case where the true value is 59.40 g but the predicted value is 54.81 g. A review indicates that this error arises because the egg in question is squeezed by other eggs, causing it to be placed non-horizontally under the camera, which results in smaller characteristic values such as its mask area. However, overall, our algorithm demonstrates certain advantages over other algorithms.

3.4. Impact of Geometric Fitting and LOF Filtering on Weight Prediction

Our model employs ellipse fitting on egg segmentation masks to extract morphological features, which are EWM-Net then processes for weight prediction. Regarding the geometric representation of eggs, Narushin et al. [30] demonstrated that both ellipse fitting and oval curve fitting provide optimal mathematical representations for eggs in 2D images. To systematically evaluate this, we implemented three distinct fitting approaches for comparative accuracy analysis: (1) direct prediction without geometric fitting, (2) oval curve fitting, and (3) ellipse fitting. For each approach, we further examined the impact of Local Outlier Factor (LOF) filtering through controlled experiments. The comprehensive comparison results are presented in Table 10.
As shown in Table 10, the EWM-Net achieves an MAE of only 1.35 g in egg weight estimation without any curve fitting, and the Local Outlier Factor (LOF) further reduces this error to 1.10 g. This result demonstrates that with precise segmentation, EWM-Nets can achieve relatively accurate weight prediction using the feature of the egg mask. However, when an oval (egg-shaped) curve fitting is applied, the MAE increases to 1.96 g and remains at 1.81 g even after LOF optimization. In contrast, elliptical fitting improves accuracy, reducing the MAE by 0.11 g (to 1.24 g) compared to the no-fitting baseline. With LOF refinement, the error drops to 0.88 g, accompanied by an RMSE of 1.16, an R2 of 0.926, and an Acc of 98.52%, making it the best-performing approach among all compared methods.
These results indicate that while ellipse fitting enhances the precision of weight prediction, oval fitting leads to degradation in performance. This discrepancy suggests that the oval equation does not provide an optimal fit for egg contours, likely due to its higher complexity and greater number of parameters, making it more susceptible to noise and segmentation errors. In comparison, elliptical fitting benefits from a more constrained and regularized shape, exhibiting greater robustness to minor mask imperfections. Moreover, elliptical fitting effectively corrects segmentation inaccuracies and better captures the morphological characteristics of egg masks. Thus, it proves more suitable for our application.
Regarding LOF, all three fitting methods exhibit significant MAE reductions (by 0.25 g, 0.15 g, and 0.36 g, respectively) when incorporating this preprocessing step. This demonstrates LOF’s effectiveness in filtering out outliers in egg segmentation results, which may arise from occlusions, edge effects, or artifacts introduced during segmentation and fitting. By removing such anomalies, LOF provides more reliable input data, enabling the model to better learn the underlying weight–contour relationship and ultimately improving weight prediction accuracy.

3.5. Impact of Multi-Feature Extraction on Weight Prediction

Our approach uses six parameters for multi-feature regression compared to traditional vision-based egg weight prediction methods. It is worth mentioning that to ensure the camera vision covers the egg collection transmission line, the camera must be positioned at a relatively high altitude. This configuration implies that when eggs are at different positions in the image, their linear distance from the camera varies significantly. So, in addition to the characteristic information of the egg itself (including the lengths of the major and minor axes, perimeter, projected area, and horizontal tilt angle), we have also incorporated the coordinates of the egg’s center point in the image as a feature for weight regression. For these features, we conduct ablation experiments to investigate their impact on the accuracy of weight prediction. The results are shown in Table 11.
Initially, we only used the perimeter of the egg’s projection plane for weight regression prediction, resulting in a relatively large MAE of 2.19 g. When the projection area was added as a feature, the MAE significantly decreased to 1.74 g, representing a 0.45 g reduction compared to single-feature regression. Subsequently, by incorporating the egg’s tilt angle and the lengths of its major and minor axes as regression features, the MAE further decreased by 0.1 g. Most importantly, after inputting the central coordinates of the egg in the image as a feature into EWM-Net, the model learned the influence of the egg’s different positions on its projection relationship and linear distance. At this point, the MAE of weight measurement was only 0.88 g, with an accuracy of 98.52%.
This result indicates that single features have limited representational ability for the egg image–weight relationship. By introducing multi-feature extraction methods, especially the inclusion of coordinate information, the model’s capability to construct projection geometric relationships and environmental perception is enhanced, significantly improving the accuracy of egg weight prediction.

4. Conclusions

This study develops a computer vision-based multi-feature extraction and regression method to address the challenges of efficient and automated egg weight measurement in the production industry. Specifically, by integrating the CDC block and EfficientViT backbone into YOLOv11 to develop CEV-YOLO, the improved model significantly enhances the pixel-level egg segmentation accuracy in images. It effectively handles occlusion and dense segmentation issues while maintaining an acceptable running speed. The proposed EWM-Net, with its optimized network structure, accurately establishes the correlation between egg features and weights, outperforming other mainstream regression models in precision. Moreover, adopting ellipse fitting and LOF filtering further improves weight estimation accuracy by effectively extracting features and removing outliers. The experimental results, with an MAE of 0.88 g and an R2 of 0.926, demonstrate the high precision of this method. This research provides a practical and efficient solution for automated egg weight measurement in laying hen farms. It is expected to improve production efficiency, reduce labor costs and offer valuable references for similar research in other agricultural product weight estimation fields.
However, our model has not yet undergone generalization testing and validation across different breeds or laying hen farms. In future work, we will focus on addressing this limitation. Also, we will further refine the model to enhance the accuracy of egg weight prediction and deploy it on edge devices. By integrating it with our custom monitoring system, this implementation will support offline computation while storing results in an online database. Additionally, we will further develop other functionalities to meet farmers’ needs, such as detecting dirty or cracked eggs and an automated sorting system based on computer vision.

Author Contributions

Writing—original draft, writing—review and editing, visualization, software, methodology, investigation, and data curation, Y.J. Writing—review and editing and validation, E.M.A. Methodology, investigation, software, and data curation, P.H. Investigation and data curation, J.Z. Investigation and data curation, M.D. Supervision and Resources, J.P. Conceptualization, writing—review and editing, supervision, project administration, and funding acquisition, H.L. All authors have read and agreed to the published version of the manuscript.

Funding

This research was funded by the National Key R&D Program of China (Grant No. 2023YFD20008).

Data Availability Statement

Dataset available on request from the authors.

Acknowledgments

The authors appreciate the experimental equipment support provided by Xuan Luo and Yonghua Yu from the Key Laboratory of On-Site Processing Equipment for Agricultural Products, Ministry of Agriculture, China.

Conflicts of Interest

The authors declare no conflicts of interest.

Abbreviations

The following abbreviations are used in this manuscript:
AdamWAdam with Weight Decay
AccMean Accuracy Metric
AdamAdaptive Moment Estimation
APAverage precision
C2fC2-Faster
C2PSAConvolutional Block with Parallel Spatial Attention
CDCCentral Differential Convolution
CEV-YOLOCentral differential-EfficientViT YOLO
DSConvDSConv: Depthwise Separable Convolution
DTDecision Tree
EfficientViTEfficient Vision Transformer
EWM-NetEgg Weight Measurement Network
FNFalse Negative
FPFalse Positive
FPSFrames Per Second
GFLOPsGiga Floating Point Operations
IoUIntersection over Union
KRRKernel Ridge Regression
LaWELightweight Network-based Cattle Weight Estimation
LOFLocal Outlier Factor
LRDLocal Reachability Density
MAEMean Absolute Error
MAPEMean Absolute Percentage Error
MBConvMobile inverted Bottleneck Convolution
MLPMulti-Layer Perceptron
MSAMulti-Scale Attention
PPrecision
RRecall
RFRandom Forest
RMSERoot Mean Squared Error
RNNRecurrent Neural Network
SGDStochastic Gradient Descent
SPPFSpatial Pyramid Pooling-Fast
SVMSupport Vector Machine
TPTrue Positive
YOLOYou Only Look Once (object detection algorithm)
α Hyperparameter for determining the contribution between CDC and vanilla convolution
R Window size of CDC
N k K-nearest neighborhood
reach - dist k Reachability distance
θ Horizontal Tilt Angle
r a Major axis length
r b Minor axis length

References

  1. Wu, R.; He, P.G.; He, Y.F.; Dou, J.; Di, M.Z.; He, S.P.; Hayat, K.; Zhou, Y.; Yu, L.; Pan, J.M.; et al. Egg production monitoring in commercial laying cages via the StrongSort-EGG tracking-by-detection model. Comput. Electron. Agric. 2024, 227, 109508. [Google Scholar] [CrossRef]
  2. Yang, N. Egg production in China: Current status and outlook. Front. Agric. Sci. Eng. 2021, 8, 25–34. [Google Scholar] [CrossRef]
  3. Wang, Y.C.; Cuan, K.; Pei, W.; Yan, X.J.; Lin, W.Y.; Shi, W.Q.; Wang, K.Y. A two-stage deep learning approach for identifying low-yield hens in stacked cage systems. Comput. Electron. Agric. 2025, 231, 109958. [Google Scholar] [CrossRef]
  4. Pacure Angelia, H.L.; Bolo, J.M.U.; Eliot, C.J.I.; Gelicania, G. Grade Classification of Chicken Eggs Through Computer Vision. In Proceedings of the 2021 10th International Conference on Computing and Pattern Recognition, Shanghai, China, 15–17 October 2021; pp. 149–156. [Google Scholar]
  5. Yang, X.; Bist, R.B.; Subedi, S.; Chai, L.L. A Computer Vision-Based Automatic System for Egg Grading and Defect Detection. Animals 2023, 13, 2354. [Google Scholar] [CrossRef]
  6. Aragua, A.; Mabayo, V.İ. A cost-effective approach for chicken egg weight estimation through computer vision. Int. J. Agric. Environ. Food Sci. 2018, 2, 82–87. [Google Scholar] [CrossRef]
  7. Yang, X.; Bist, R.B.; Paneru, B.; Liu, T.M.; Applegate, T.; Ritz, C.; Kim, W.; Regmi, P.; Chai, L.L. Computer Vision-Based cybernetics systems for promoting modern poultry Farming: A critical review. Comput. Electron. Agric. 2024, 225, 109339. [Google Scholar] [CrossRef]
  8. Rao, X.; Cen, Y.; Ying, Y. Study on the Model of Egg Weight Detecting Based on its Geometry. China Poult. 2007, 29, 18–20. [Google Scholar]
  9. Thipakorn, J.; Waranusast, R.; Riyamongkol, P. Egg Weight Prediction and Egg Size Classification using Image Processing and Machine Learning. In Proceedings of the 2017 14th International Conference on Electrical Engineering/Electronics, Computer, Telecommunications and Information Technology (ECTI-CON), Phuket, Thailand, 27–30 June 2017; pp. 477–480. [Google Scholar]
  10. Duan, Y.; Wang, Q.; Li, X.; Tang, Y. High-throughput online detection method of egg size and shape based on convex hull algorithm. Trans. Chin. Soc. Agric. Eng. 2016, 32, 15. [Google Scholar]
  11. Zalhan, M.Z.; Sera Syannila, S.; Mohd Nazri, I.; Mohd Taha, I. Vision-based Egg Grade Classifier. In Proceedings of the 2016 International Conference on Information and Communication Technology (ICICTM), Kuala Lumpur, Malaysia, 16–17 May 2016; pp. 31–35. [Google Scholar]
  12. Ab Nasir, A.F.; Sabarudin, S.S.; Majeed, A.P.P.A.; Ghani, A.S.A. Automated egg grading system using computer vision: Investigation on weight measure versus shape parameters. In Proceedings of the IOP Conference Series: Materials Science and Engineering, Singapore, 22–24 June 2018; Volume 342, p. 012003. [Google Scholar] [CrossRef]
  13. Yu, Z.T.; Qin, Y.X.; Zhao, H.S.; Li, X.B.; Zhao, G.Y. Dual-Cross Central Difference Network for Face Anti-Spoofing. In Proceedings of the Thirtieth International Joint Conference on Artificial Intelligence (IJCAI-21), Online, 19–26 August 2021; pp. 1281–1287. [Google Scholar]
  14. Ariana, D.P.; Lu, R.F.; Guyer, D.E. Near-infrared hyperspectral. reflectance imaging for detection of bruises on pickling cucumbers. Comput. Electron. Agric. 2006, 53, 60–70. [Google Scholar] [CrossRef]
  15. Alif, M.A.R.; Hussain, M. YOLOv1 to YOLOv10: A comprehensive review of YOLO variants and their application in the agricultural domain. arXiv 2024, arXiv:2406.10139. [Google Scholar]
  16. Redmon, J.; Divvala, S.; Girshick, R.; Farhadi, A. You Only Look Once: Unified, Real-Time Object Detection. In Proceedings of the 2016 IEEE Conference on Computer Vision and Pattern Recognition (CVPR), Las Vegas, NV, USA, 27–30 June 2016; pp. 779–788. [Google Scholar] [CrossRef]
  17. Khanam, R.; Hussain, M. Yolov11: An overview of the key architectural enhancements. arXiv 2024, arXiv:2410.17725. [Google Scholar]
  18. Alif, M.A.R. Yolov11 for vehicle detection: Advancements, performance, and applications in intelligent transportation systems. arXiv 2024, arXiv:2410.22898. [Google Scholar]
  19. Wang, D.R.; Tan, J.S.; Wang, H.; Kong, L.J.; Zhang, C.; Pan, D.X.; Li, T.; Liu, J.B. SDS-YOLO: An improved vibratory position detection algorithm based on YOLOv11. Measurement 2025, 244, 116518. [Google Scholar] [CrossRef]
  20. He, L.H.; Zhou, Y.Z.; Liu, L.; Zhang, Y.Q.; Ma, J.H. Application of the YOLOv11-seg algorithm for AI-based landslide detection and recognition. Sci. Rep. 2025, 15, 12421. [Google Scholar] [CrossRef]
  21. Sharma, A.; Kumar, V.; Longchamps, L. Comparative performance of YOLOv8, YOLOv9, YOLOv10, YOLOv11 and Faster R-CNN models for detection of multiple weed species. Smart Agric. Technol. 2024, 9, 100648. [Google Scholar] [CrossRef]
  22. Hidayatullah, P.; Syakrani, N.; Sholahuddin, M.R.; Gelar, T.; Tubagus, R. YOLOv8 to YOLO11: A Comprehensive Architecture In-depth Comparative Review. arXiv 2025, arXiv:2501.13400. [Google Scholar]
  23. Zhang, Y.F.; Sun, P.Z.; Jiang, Y.; Yu, D.D.; Weng, F.C.; Yuan, Z.H.; Luo, P.; Liu, W.Y.; Wang, X.G. ByteTrack: Multi-object Tracking by Associating Every Detection Box. In Proceedings of the Computer Vision—ECCV 2022, Lecture Notes in Computer Science, Tel Aviv, Israel, 23–27 October 2022; Volume 13682, pp. 1–21. [Google Scholar] [CrossRef]
  24. Cai, H.; Li, J.Y.; Hu, M.Y.; Gan, C.; Han, S. EfficientViT: Lightweight Multi-Scale Attention for High-Resolution Dense Prediction. In Proceedings of the 2023 IEEE/CVF International Conference on Computer Vision (ICCV), Paris, France, 1–6 October 2023; pp. 17256–17267. [Google Scholar] [CrossRef]
  25. Yuan, Y.H.; Chen, X.L.; Wang, J.D. Object-Contextual Representations for Semantic Segmentation. Lect. Notes Comput. Sci. 2020, 12351, 173–190. [Google Scholar] [CrossRef]
  26. Zhao, H.S.; Shi, J.P.; Qi, X.J.; Wang, X.G.; Jia, J.Y. Pyramid Scene Parsing Network. In Proceedings of the 2017 IEEE Conference on Computer Vision and Pattern Recognition (CVPR), Honolulu, HI, USA, 21–26 July 2017; pp. 6230–6239. [Google Scholar] [CrossRef]
  27. Xie, E.Z.; Wang, W.H.; Yu, Z.D.; Anandkumar, A.; Alvarez, J.M.; Luo, P. SegFormer: Simple and Efficient Design for Semantic Segmentation with Transformers. In Proceedings of the NIPS’21: Proceedings of the 35th International Conference on Neural Information Processing System, Online, 6–14 December 2021; p. 34. [Google Scholar]
  28. Nauen, T.C.; Palacio, S.; Raue, F.; Dengel, A. Which Transformer to Favor: A Comparative Analysis of Efficiency in Vision Transformers. arXiv 2023, arXiv:2308.09372. [Google Scholar]
  29. Jiang, Y.X.; Tang, Y.J.; Ying, C.C. Finding a Needle in a Haystack: Faint and Small Space Object Detection in 16-Bit Astronomical Images Using a Deep Learning-Based Approach. Electronics 2023, 12, 4820. [Google Scholar] [CrossRef]
  30. Narushin, V.G.; Lu, G.; Cugley, J.; Romanov, M.N.; Griffin, D.K. A 2-D imaging-assisted geometrical transformation method for non-destructive evaluation of the volume and surface area of avian eggs. Food Control 2020, 112, 107112. [Google Scholar] [CrossRef]
  31. Troscianko, J. A simple tool for calculating egg shape, volume and surface area from digital images. Ibis 2014, 156, 874–878. [Google Scholar] [CrossRef]
  32. Hladuvka, J.; KropatFclt, W.G. Fitting Egg-Shapes to Discretized Object Boundaries. Discret. Geom. Math. Morphol. 2024, 14605, 107–119. [Google Scholar] [CrossRef]
  33. Narushin, V.G.; Romanov, M.N.; Lu, G.; Cugley, J.; Griffin, D.K. Digital imaging assisted geometry of chicken eggs using Hugelschaffer’s model. Biosyst. Eng. 2020, 197, 45–55. [Google Scholar] [CrossRef]
  34. Meng, R.H.; Tian, Y.X.; Huang, S.W. Structural design and optimization of egg carrier for dynamic egg slit detection platforms. PLoS ONE 2025, 20, e0320848. [Google Scholar] [CrossRef]
  35. Pourreza, H.R.; Naebi, A.H.; Fazeli, S.; Taghizade, B. Automatic Detection of Eggshell Defects Based on Machine Vision. J. Anim. Vet. Adv. 2008, 7, 1200–1203. [Google Scholar]
  36. Fitzgibbon, A.; Pilu, M.; Fisher, R.B. Direct least square fitting of ellipses. IEEE Trans. Pattern Anal. Mach. Intell. 1999, 21, 476–480. [Google Scholar] [CrossRef]
  37. Breunig, M.M.; Kriegel, H.P.; Ng, R.T.; Sander, J. LOF: Identifying density-based local outliers. In Proceedings of the 2000 ACM SIGMOD international conference on Management of data, Dallas, TX, USA, 15–18 May 2000; Volume 29, pp. 93–104. [Google Scholar] [CrossRef]
  38. Ying, X. An Overview of Overfitting and its Solutions. In Proceedings of the Journal of Physics: Conference Series, Hangzhou, China, 22–24 May 2019; Volume 1168, p. 022022. [Google Scholar] [CrossRef]
  39. Mutasa, S.; Sun, S.; Ha, R. Understanding artificial intelligence based radiology studies: What is overfitting? Clin. Imaging 2020, 65, 96–99. [Google Scholar] [CrossRef]
  40. Bottou, L. Large-Scale Machine Learning with Stochastic Gradient Descent. In Proceedings of the Compstat’2010: 19th International Conference on Computational Statistics, Paris, France, 22–27 August 2010; pp. 177–186. [Google Scholar] [CrossRef]
  41. Lin, T.Y.; Maire, M.; Belongie, S.; Hays, J.; Perona, P.; Ramanan, D.; Dollár, P.; Zitnick, C.L. Microsoft COCO: Common Objects in Context. Comput. Vis.-ECCV 2014, 8693, 740–755. [Google Scholar] [CrossRef]
  42. Badgujar, C.M.; Poulose, A.; Gan, H. Agricultural object detection with You Only Look Once (YOLO) Algorithm: A bibliometric and systematic literature review. Comput. Electron. Agric. 2024, 223, 109090. [Google Scholar] [CrossRef]
  43. Wang, C.Y.; Yeh, J.; Liao, H.Y.M. YOLOv9: Learning What You Want to Learn Using Programmable Gradient Information. Comput. Vis.-ECCV 2025, 15089, 1–21. [Google Scholar] [CrossRef]
  44. Tian, Y.; Ye, Q.; Doermann, D. Yolov12: Attention-centric real-time object detectors. arXiv 2025, arXiv:2502.12524. [Google Scholar]
  45. Jocher, G.; Chaurasia, A.; Qiu, J. Ultralytics YOLOv5. Available online: https://docs.ultralytics.com/zh/models/yolov5/ (accessed on 1 May 2025).
  46. Jocher, G.; Chaurasia, A.; Qiu, J. Ultralytics YOLOv8. Available online: https://docs.ultralytics.com/zh/models/yolov8/ (accessed on 15 May 2025).
  47. Jocher, G.; Chaurasia, A.; Qiu, J. Ultralytics YOLOv11. Available online: https://docs.ultralytics.com/zh/models/yolov11/ (accessed on 20 May 2025).
  48. Wu, D.H.; Cui, D.; Zhou, M.C.; Wang, Y.N.; Pan, J.M.; Ying, Y.B. Using YOLOv5-DSE for Egg Counting in Conventional Scale Layer Farms. IEEE Trans. Ind. Inform. 2025, 21, 405–414. [Google Scholar] [CrossRef]
  49. Gašparović, B.; Mauša, G.; Rukavina, J.; Lerga, J. Evaluating Yolov5, Yolov6, Yolov7, and Yolov8 in underwater environment: Is there real improvement? In Proceedings of the 2023 8th International Conference on Smart and Sustainable Technologies (SpliTech), Split and Bol (Island of Brac), Croatia, 20–23 June 2023; pp. 1–4. [Google Scholar]
  50. Chang, C.C.; Lin, C.J. LIBSVM: A Library for Support Vector Machines. ACM Trans. Intell. Syst. Technol. 2011, 2, 27. [Google Scholar] [CrossRef]
  51. Murphy, K.P. Machine Learning: A Probabilistic Perspective; The MIT Press: Cambridge, MA, USA, 2012; Volume 14.4.3. [Google Scholar]
  52. Breiman, L. Random Forests; Machine Learning; McGraw-Hill: New York, USA, 2001; Volume 45, pp. 5–32. [Google Scholar]
  53. Loh, W.Y. Fifty Years of Classification and Regression Trees. Int. Stat. Rev. 2014, 82, 329–348. [Google Scholar] [CrossRef]
  54. Rumelhart, D.E.; Hinton, G.E.; Williams, R.J. Learning Representations by Back-Propagating Errors. Nature 1986, 323, 533–536. [Google Scholar] [CrossRef]
  55. Zaremba, W.; Sutskever, I.; Vinyals, O. Recurrent neural network regularization. arXiv 2014, arXiv:1409.2329. [Google Scholar]
Figure 1. Egg images in different scenarios and (a) under laboratory conditions, (b) in the egg-laying area transmission line, and (c) in the egg collection transmission line.
Agriculture 15 02035 g001
Figure 2. Technical route of the proposed method.
Agriculture 15 02035 g002
Figure 3. Architectural diagram of CEV-YOLO (C2f: C2-Faster; PSABlock: Pyramid Squeeze Attention Block; C2PSA: Convolutional Block with Parallel Spatial Attention; SPPF: Spatial Pyramid Pooling-Fast; CDC: Central Differential Convolution).
Agriculture 15 02035 g003
Figure 4. Architecture of EfficientViT (DSConv: Depthwise Separable Convolution; MBConv: Mobile inverted Bottleneck Convolution; MSA: Multi-Scale Attention).
Agriculture 15 02035 g004
Figure 5. Architecture of central differential convolution [13]. The upper pathway calculates central gradients using horizontal and vertical neighboring pixels, whereas the lower pathway leverages diagonal neighbors for the same purpose. Integration with conventional convolution further strengthens the network’s ability to extract edge features.
Agriculture 15 02035 g005
Figure 6. Overall process of egg weight estimation.
Agriculture 15 02035 g006
Figure 7. Egg masks refinement through ellipse fitting. (a) Original masks, (b) fitted ellipse contours (red dashed lines) superimposed on original eggs, (c) ellipse-regularized masks.
Agriculture 15 02035 g007
Figure 8. Schematic diagram of segmentation errors with corresponding egg close-up views and their binarized masks. (a) Segmentation error caused by stacked eggs; (b) incomplete segmentation due to eggs at the visual field edge.
Agriculture 15 02035 g008
Figure 9. Schematic diagram of multi-feature extraction.
Agriculture 15 02035 g009
Figure 10. Data acquisition device schematic. Left: Structural diagram of the device; Right: Physical prototype. Key components in the schematic: (a) access cover, (b) result presentation and interactive interface, (c) peripheral equipment bay, (d) camera mounting position, and (e) auxiliary lighting module.
Agriculture 15 02035 g010
Figure 11. Example images of the egg segmentation dataset.
Agriculture 15 02035 g011
Figure 12. An illustrative example of the process of annotating the egg weight dataset.
Agriculture 15 02035 g012
Figure 13. Histogram of data distribution for egg weight test set.
Agriculture 15 02035 g013
Figure 14. Comparison of egg segmentation results of various models.
Agriculture 15 02035 g014
Figure 15. Scatter plots of predicted weight using different models.
Agriculture 15 02035 g015
Table 1. Architectural parameters of EWM-Net.
LayerLayer TypeNumber of Neurons/KernelsStride
1Linear24-
2Conv1d162
3Conv1d322
4Conv1d162
5Linear1-
Table 2. Other related parameters of EWM-Net.
ParametersValue
OptimizerAdam
Loss functionL1 Loss
Activation functionLeaky ReLu
Learning rate0.001
Dropout rate0.2
Epoch200
Batch size16
Table 3. Parameters of the camera used.
Parameter CategorySpecification
Sensor type1/2.7-inch advanced CMOS
Effective pixels1920 × 1080
Pixel size3.0 × 3.0 μm
Signal-to-noise ratio41 dB
Dynamic range82 dB
Focal length8 mm
Horizontal field of view60°
Table 4. Deep learning workstation specification.
ComponentsSpecification
CPUIntel(R) Core (TM) i7-14700KF 3.40 GHz
GPUNVIDIA GeForce RTX 4090 (24 GB)
RAMKingSton DDR5 4800 MHz 32 GB × 3
OSWindows 11 Pro × 64
Table 5. Parameter settings of training the CEV-YOLO.
ParameterValue
Image size1280 × 720
OptimizerAdamW
Learning rate0.002
Momentum0.9
Class1
Epoch60
Batch size8
Table 6. Parameter settings of training the EVE-Net.
ParameterValue
OptimizerSGD
Learning rate0.001
Momentum0.9
Epoch200
Batch size32
Loss functionL1 loss
Table 7. Performance of YOLO-series models on egg segmentation dataset (P: Precision; R: Recall; AP90: Average Precision at an Intersection over Union threshold of 0.9; GFLOPs: Giga Floating Point Operations; FPS: Frames Per Second).
ModelP (%)R (%)AP90 (%)Parameters (M)GFLOPsFPS
YOLOv5n-seg98.096.184.52.439.761.5
YOLOv8n98.996.888.12.9410.737.9
YOLOv9c98.996.783.023.45138.029.78
YOLOv11n97.195.385.72.8310.253.9
YOLOv12n98.295.987.12.769.741.3
CEV-YOLO (Ours)98.997.589.83.9911.839.4
Table 8. Results of ablation experiment.
Module UsedAP90 (%)Parameters (M)GFLOPsFPS
EfficientViTCDC
--85.72.8310.253.97
-88.33.9911.841.27
90.93.9911.839.38
Table 9. Comparison of weight prediction precision between different regression models.
ModelMAE (g)RMSE (g)R2Acc (%)
SVM2.282.810.56996.17
KRR3.634.440.27493.53
RF1.191.510.87698.18
DT1.201.530.87298.01
MLP1.071.380.89698.20
RNN3.154.280.21194.67
EWM-Net (Ours)0.881.160.92698.52
Table 10. Comparison of different fitting methods.
Method UsedMAE (g)RMSE (g)R2Acc (%)
Fitting MethodLOF
Without fitting-1.352.040.77497.71
1.101.450.88598.15
Oval curve fitting-1.962.620.62496.64
1.812.410.68496.90
Ellipse fitting-1.241.630.85697.98
0.881.160.92698.52
Table 11. Ablation study on the impact of different features on egg weight prediction accuracy.
Feature UsedMAE (g)Acc (%)
PerimeterAreaAngleMajor/Minor Axis LengthsCoordinates
2.1996.30
1.7497.07
1.7097.14
1.6497.20
0.8898.52
Disclaimer/Publisher’s Note: The statements, opinions and data contained in all publications are solely those of the individual author(s) and contributor(s) and not of MDPI and/or the editor(s). MDPI and/or the editor(s) disclaim responsibility for any injury to people or property resulting from any ideas, methods, instructions or products referred to in the content.