Abstract
The pharmacological quality of Astragalus membranaceus var. mongholicus (AMM) is determined by its bioactive compounds, and developing a rapid prediction method is essential for quality assessment. This study proposes a predictive model for AMM bioactive compounds using hyperspectral imaging (HSI) and wavelet domain multivariate features. The model employs techniques such as the first-order derivative (FD) algorithm and the continuum removal (CR) algorithm for initial feature extraction. Unlike existing models that primarily focus on a single-feature extraction algorithm, the proposed tree-structured feature extraction module based on discrete wavelet transform and one-dimensional convolutional neural network (1D-CNN) integrates FD and CR, enabling robust multivariate feature extraction. Subsequently, the multivariate feature cross-fusion module is introduced to implement multivariate feature interaction, facilitating mutual enhancement between high- and low-frequency features through hierarchical recombination. Additionally, a multi-objective prediction mechanism is proposed to simultaneously predict the contents of flavonoids, saponins, and polysaccharides in AMM, effectively leveraging the enhanced, recombined spectral features. During testing, the model achieved excellent predictive performance with R2 values of 0.981 for flavonoids, 0.992 for saponins, and 0.992 for polysaccharides. The corresponding RMSE values were 0.37, 0.04, and 0.86; RPD values reached 7.30, 10.97, and 11.16; while MAE values were 0.14, 0.02, and 0.38, respectively. These results demonstrate that integrating multivariate features extracted through diverse methods with 1D-CNN enables efficient prediction of AMM bioactive compounds using HSI.
1. Introduction
Astragalus membranaceus var. mongholicus (AMM), a leguminous herb widely distributed across Inner Mongolia, Ningxia, Shaanxi, and Shanxi, serves as a cornerstone of traditional Chinese medicine due to its high concentrations of pharmacologically bioactive compounds, including polysaccharides, saponins, and flavonoids [1]. These compounds exhibit immunomodulatory, antioxidative, and bone metabolism-regulating properties, necessitating precise quantification for effective quality control and optimized cultivation practices [2,3].
Conventional analytical techniques, such as ultraviolet spectrophotometry, high-performance liquid chromatography, and gas chromatography–mass spectrometry [4,5,6], provide accurate measurements but involve destructive sampling, extensive laboratory preparation, and require specialized expertise [7]. These limitations hinder large-scale screening and real-time monitoring, highlighting the need for rapid and non-destructive alternatives [8].
Hyperspectral technology has emerged as one of the most prominent cutting-edge tools in precision agriculture, enabling comprehensive analysis of optical reflectance spectra. It allows for precise identification and characterization of plants and their health indicators. Neri et al. developed and implemented a real-time AI-assisted push-broom hyperspectral system for plant recognition, which provides unprecedented detail and accuracy in crop monitoring and achieves high-precision classification of lettuce and arugula leaves [9]. Hyperspectral imaging (HSI), which integrates spatial and spectral data across hundreds of contiguous bands, has emerged as a transformative tool for non-invasive chemical analysis. Its applications span agricultural quality assessment, environmental surveillance, and pharmaceutical research, and it is increasingly adopted in traditional Chinese medicine for the quantification of bioactive compounds [10].
Recent advances in HSI applications for traditional Chinese medicine analysis have demonstrated promising results in compound prediction for various medicinal plants [11,12,13,14]. Yet, these methods face a fundamental challenge in processing high-dimensional spectral data characterized by inherent feature redundancy. This dual characteristic of hyperspectral datasets not only increases computational complexity but also impairs analytical performance because of strong inter-band correlations and overlapping information among adjacent spectral bands [15,16].
To overcome these limitations, recent studies have demonstrated various spectral preprocessing approaches for medicinal plant analysis. Wang et al. employed second derivative processing of attenuated total reflectance–Fourier transform infrared spectroscopy to achieve rapid species identification and polysaccharide prediction in Polygonatum [17]. Hao et al. systematically compared multiple preprocessing methods for analyzing different target components (e.g., total flavonoid content and antioxidant activity) in plum fruits [18]. In another study, Wang et al. applied standard normal variate transformation to preprocess near-infrared (NIR) spectra of Hypericum perforatum [19]. Ma et al. utilized orthogonal signal correction for NIR spectral processing, enabling rapid prediction of rosmarinic acid, tanshinones, and salvianolic acids in Salvia miltiorrhiza [20]. Furthermore, Liu et al. identified Savitzky–Golay smoothing and detrending as optimal preprocessing methods for the analysis of gentiopicroside and loganic acid, respectively, using Fourier transform infrared photoacoustic spectroscopy coupled with chemometric analysis for the quality evaluation of Gentiana macrophylla [21]. However, these methods typically rely on single-feature extraction, failing to fully utilize the multidimensional feature information of hyperspectral data.
Integrating multivariate feature extraction with deep learning presents an opportunity to improve prediction accuracy. Discrete wavelet transform (DWT), for instance, can decompose spectra into high- and low-frequency components, while cross-fusion networks can enhance hierarchical feature representation. Such advancements could enable non-destructive root compound prediction via leaf spectral analysis, supporting precision agriculture and intelligent phenotyping.
For indirect root bioactive compound prediction in AMM based on leaf hyperspectral data, this study proposes a custom-designed Wavelet and Cross-Fused Multivariate Feature Network (WCT-MCFNet), based on a one-dimensional convolutional neural network (1D-CNN). Specifically, the model combines first-order derivative (FD) and continuum removal (CR) algorithms with DWT to extract multivariate spectral features, processes these features through parallel cross-fusion branches for high- and low-frequency components, followed by feature fusion and a multi-objective prediction mechanism that simultaneously estimates flavonoid, saponin, and polysaccharide concentrations.
This study aims to develop an indirect and non-destructive method based on leaf HSI to achieve simultaneous and accurate prediction of multiple bioactive compound contents in the roots of AMM. To this end, this study proposes to integrate traditional feature extraction methods with deep learning techniques to construct an end-to-end predictive model. By combining multiple feature extraction algorithms and enhancing spectral response features using DWT, a parallel cross-fusion strategy is further designed to effectively integrate multi-scale spectral information for the synchronous prediction of the three target components. This approach offers a novel and reliable computational framework for high-throughput and high-precision quality prediction of traditional Chinese medicinal materials. The key contributions are as follows: (1) a non-destructive prediction model based on leaf HSI, thereby eliminating the need for destructive sampling of AMM roots; (2) a DWT-based and 1D-CNN-based tree-structured (WCT) feature extraction module that integrates FD and CR to enhance the robustness of feature extraction; (3) multi-feature-based cross-fusion (MCF), in which the proposed MCF feature fusion module leverages complementary spectral features to improve prediction accuracy.
2. Materials and Methods
2.1. Data Acquisition
2.1.1. Bioactive Compounds Measurement
AMM plants for this study were collected in late October 2023 from the AMM planting demonstration base in Guyang County, Inner Mongolia Autonomous Region (41°16′55.17″ N, 109°58′46.56″ E). Figure 1 displays the geographical locations where AMM samples were collected. Taking into account the spatial distribution characteristics of the planting area, a grid-based sampling method was employed. The study area is characterized by a typical mid-temperate semi-arid continental climate, with significant diurnal temperature variations. The mean annual temperature ranges from 2 to 5 °C, and the annual precipitation averages approximately 290 mm. The dominant soil types are Kastanozems and Calcisols, with an organic matter content of 19.30 g/kg. The total nitrogen, available phosphorus, and available potassium contents are 1.12 g/kg, 10.30 mg/kg, and 156.00 mg/kg, respectively. These climatic and soil conditions collectively facilitate the synthesis and accumulation of bioactive compounds in the roots of AMM, providing a sufficient nutritional foundation and creating favorable conditions for its growth and development [22].
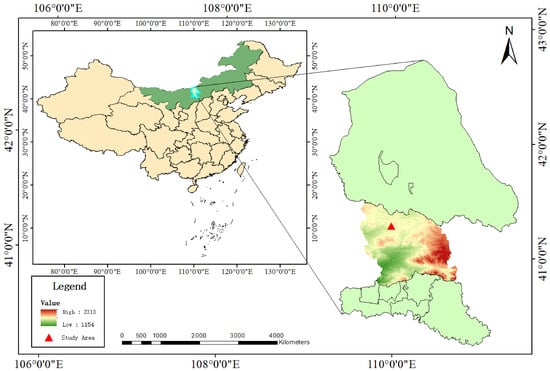
Figure 1.
Geographical location of the AMM research demonstration base.
After collection, the AMM plants were sealed, labeled, and transported to the laboratory for subsequent analysis. Representative samples of the collected AMM leaves and roots are shown in Figure 2a,b.
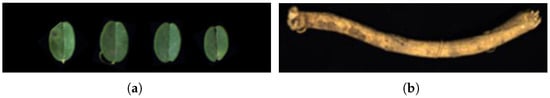
Figure 2.
AMM leaf samples and medicinal root samples. (a) Leaf samples of AMM. (b) Root samples of AMM.
The labeled AMM roots were stored in refrigeration cabinets and sent to Shanghai Dingtai Testing Technology Co., Ltd., for the analysis of their bioactive compounds, including flavonoids, saponins, and polysaccharides. Table 1 displays the statistical summary of flavonoid, saponin, and polysaccharide concentrations measured in AMM.

Table 1.
Statistics on the contents of 3 bioactive compounds in AMM samples.
2.1.2. Acquisition of Hyperspectral Data from AMM Leaves
A handheld Specim IQ hyperspectral imaging system was used to capture images of AMM leaves. The acquired hyperspectral data had a spatial resolution of pixels, a spectral resolution of approximately 3 nm, and covered a spectral range of 400–1000 nm. During the acquisition process, a vertical incidence approach was adopted, utilizing a fixed support to maintain a consistent 90° angle between the sensor and the leaf surface, thereby minimizing the influence of incidence angle variations on reflectance measurements. Meanwhile, to minimize the influence of ambient lighting on the leaf spectra, image acquisition was performed in a controlled, darkened indoor setting. Two halogen lamps were employed to provide consistent illumination of the AMM leaves. To ensure lighting stability, the halogen lamps were preheated for approximately 20 min after their angles were fixed, prior to image acquisition. Additionally, white–black panel calibration was conducted before imaging to mitigate the effects of background noise and uneven illumination.
In this study, all samples were collected uniformly when the plants had reached physiological maturity and were in the vigorous growth stage. To comprehensively represent the overall physiological status of the plants and minimize within-individual variation, a systematic stratified sampling strategy was adopted. According to the vertical structure of the canopy, 16 healthy, fully expanded leaves free from pests and diseases were selected from each of the upper, middle, and lower layers of every AMM plant. A total of 720 leaf samples were collected from 15 plants. This sampling approach effectively enhanced data reliability and ecological validity by intensifying sampling effort per plant while maintaining a limited number of sampled individuals. The SPXY algorithm [23] was used to allocate 80% of the leaf spectral data, along with corresponding bioactive compounds content (576 datasets), to the training set. The remaining 20% was divided equally into the validation and test sets, each comprising 72 datasets.
2.1.3. Preprocessing of Leaf Hyperspectral Data
Due to the small area of AMM leaves, the acquired hyperspectral data includes leaf information and considerable background information. This study selected the mid-lateral regions of the leaf samples as the regions of interest (ROIs), deliberately avoiding areas such as the leaf tip, base, and midrib where compositional heterogeneity is likely to occur. This strategy ensured that the acquired reflectance data were representative of the overall biochemical characteristics of the leaf, reducing measurement bias caused by spatial heterogeneity. In this study, the “LabelMe” annotation tool was used to outline the leaf contours, and ROIs were manually defined. The obtained masks were multiplied by the original hyperspectral data to separate the leaf hyperspectral data from the background. The pixel values within the ROI were averaged across the spatial dimension to calculate the average value for each wavelength, resulting in representative spectral curves. This process resulted in the spectral data for each leaf sample [24]. The corresponding spectral curves of the leaf samples are shown in Figure 3a.
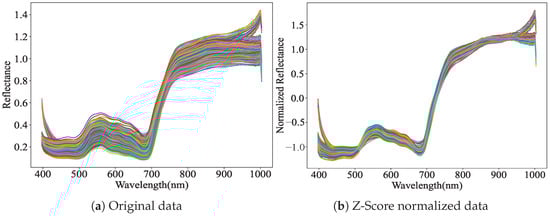
Figure 3.
Comparison of original leaf samples and standardized hyperspectral curves. (a) Spectral curve of original data. (b) Spectral curve by Z-Score standardization.
Subsequently, the Z-Score normalization method was employed to standardize the leaf spectral data [25]. For spectral bands at both the lower and upper ends of the wavelength range, where the signal-to-noise ratio (SNR) is relatively low, this standardization yielded a more uniform and smoother data distribution. As shown in Figure 3b, it effectively enhanced the SNR and mitigated the influence of high-frequency noise. This preprocessing step facilitates faster convergence of gradient descent algorithms and improves the ability of deep learning to fit the data accurately [26]. The calculation formula of Z-Score normalization is presented in Equation (1):
where represents the value of the ith sample at the jth band in the original data, denotes the standardized data, and n is the total number of samples.
2.2. Feature Extraction from Leaf Hyperspectral Data
This study uses FD and CR algorithms with DWT to extract informative features from the hyperspectral data of AMM leaves. DWT decomposes spectral features into low-frequency and high-frequency components. The low-frequency component typically captures the main constituents and overall trends of the spectral data, while the high-frequency component preserves detailed and localized spectral features [27]. The corresponding calculations are presented in Equations (2) and (3) [28]:
where and represent the obtained low-frequency and high-frequency components, respectively; denotes the original signal; and represent the high-pass and low-pass filter coefficients, respectively; and indicates downsampling by a factor of 2.
The FD algorithm is primarily used to compute the rate of spectral change at each wavelength point, facilitating clearer identification and analysis of spectral absorption and reflection peaks. By enhancing subtle variations in the spectrum, FD improves the accuracy of compound identification. The corresponding calculation is expressed in Equation (4) [29]:
where , , and represent adjacent wavelengths, and denotes the first-order derivative reflectance at wavelength .
The CR algorithm effectively eliminates background interference, thereby clarifying the overall absorption and reflection characteristics of the spectrum. By emphasizing the dominant features within the spectral data, CR significantly enhances the contrast of the spectral curve. The calculation described by Equation (5) can be expressed as follows [30]:
where represents the continuum-removed spectral reflectance, denotes the original spectral reflectance, and is the continuum line reflectance.
The application of multiple feature extraction methods to spectral data enables the capture of diverse and complementary characteristics. The FD algorithm enhances spectral detail and highlights abrupt changes, thereby extracting more discriminative features. In contrast, the CR algorithm emphasizes dominant spectral components, facilitating the extraction of key features. DWT further decomposes the spectral data into high- and low-frequency components, where high-frequency features capture localized detail, and low-frequency features reflect the global spectral trend. As illustrated in Figure 4 and Figure 5, the combination of FD and CR with DWT effectively separates refined high- and low-frequency features. This decomposition strategy lays a solid foundation for subsequent multi-feature fusion and significantly improves the prediction accuracy of key bioactive compounds—flavonoids, saponins, and polysaccharides—in AMM.
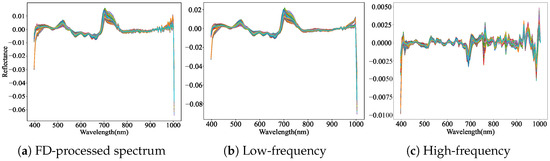
Figure 4.
High-frequency features and low-frequency features obtained by combining FD with DWT. (a) FD-processed spectral curve derived from standardized data. (b) DWT-extracted low-frequency features from FD-processed signals. (c) DWT-extracted high-frequency features from FD-processed signals.
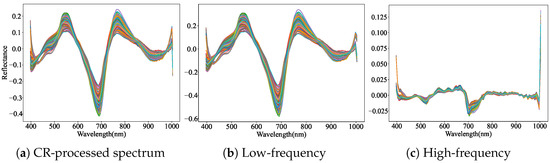
Figure 5.
High-frequency features and low-frequency features obtained by combining CR with DWT. (a) CR-processed spectral curve derived from standardized data. (b) DWT-extracted low-frequency features from CR-processed signals. (c) DWT-extracted high-frequency features from CR-processed signals.
2.3. Overall Structure of WCT-MCFNet
The proposed WCT-MCFNet model is made up of three parts, including the WCT feature extraction module, the MCF feature fusion module, and the SF prediction module integrating 1D-CNN with a fully connected (FC) layer, as illustrated in Figure 6. First, the WCT feature extraction module extracts features from the hyperspectral data of AMM leaves, resulting in two distinct sets of high- and low-frequency features. Next, the MCF feature fusion module performs cross-fusion of the extracted high- and low-frequency features. Finally, the SF prediction module is applied to estimate the contents of the bioactive compounds flavonoids, saponins, and polysaccharides in AMM.
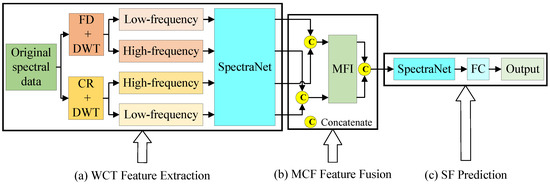
Figure 6.
WCT-MCFNet’s structural diagram. (a) WCT feature extraction module. (b) MCF feature fusion module. (c) SF prediction module.
2.3.1. WCT Feature Extraction Module
Using a single-feature extraction method alone may not capture all the valuable information in the spectral data. Features extracted by different methods can exhibit complementarity, and fusing these complementary features allows for a more comprehensive identification of key characteristics, significantly enhancing the model’s accuracy. In this study, the proposed WCT feature extraction module combines the FD and CR algorithms with DWT and the spectral feature extraction network (SpectraNet) for feature extraction, resulting in a four-branch set of high- and low-frequency multivariate features.
The structural diagram of the WCT feature extraction module is shown in Figure 5a. Initially, the FD algorithm is applied to preprocess the original spectral information of AMM leaves, enhancing the detailed features in the spectrum. DWT is then used to decompose the spectral data into its high- and low-frequency components. These extracted features are fed into SpectraNet for further feature extraction. Similarly, the CR algorithm is applied to preprocess the original spectral data, emphasizing the primary features. After DWT’s decomposition into high- and low-frequency components, these features are also passed into SpectraNet for extraction.
SpectraNet is inspired by the core architecture of the 1D-CNN hyperspectral image classification model (1DCNN-HSI) proposed by Hu et al. [31]. This model consists of an input layer, a convolutional layer (C1), a pooling layer (M2), a fully connected layer (F3), and an output layer. In this framework, the C1 and M2 layers serve as trainable feature extractors for the input data, while the F3 layer functions as the classifier for the extracted features. The kernel size and number of kernels in the C1 layer are set to (where , and is the number of input features) and 20, respectively. The M2 layer uses max pooling with a kernel size of (where ). After pooling, the resulting multidimensional data is flattened, ensuring a smooth transition from the C1 layer to the F3 layer. The hyperbolic tangent function (Tanh) is used as the activation function for both the C1 and F3 layers [31]. SpectraNet retains the C1, M2, and F3 layers from the 1DCNN-HSI model, further processing the extracted high- and low-frequency features. The structural diagram of SpectraNet is illustrated in Figure 7.
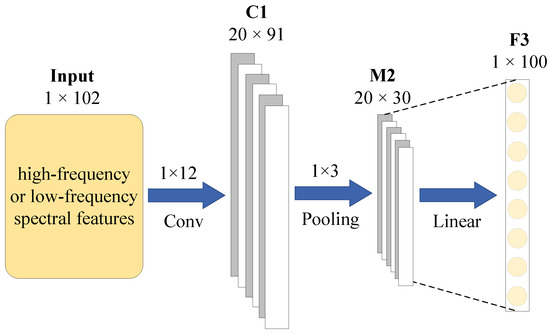
Figure 7.
SpectraNet’s structural diagram.
2.3.2. MCF Feature Fusion Module
Fusing the high- and low-frequency features obtained through DWT enhances the model’s sensitivity to detailed changes while preserving the primary characteristics of the data. By cross-fusing the high- and low-frequency features extracted using two different algorithms, the strengths of each algorithm can be fully leveraged. This fusion improves the expressive power of the features, enhancing the overall effectiveness of data analysis and model construction.
The proposed MCF feature fusion module effectively integrates the multivariate features extracted from the WCT feature extraction module. The detailed analysis is provided in Figure 6b; the process begins with the cross-fusion of low-frequency features derived from the FD-DWT combination and high-frequency features obtained from the CR-DWT combination through multi-feature concatenation. Similarly, the high-frequency features from the FD-DWT combination and the low-frequency features from the CR-DWT combination are also cross-fused. Next, a multivariate feature integrator (MFI), implemented through a fully connected layer, is used to further extract features from the fused multivariate features. Finally, the features are concatenated once again to enhance their representation before being passed to the next stages of the model.
2.3.3. SF Prediction Module
In this study, an enhanced version of SpectraNet is employed as the prediction module for estimating the bioactive compounds of AMM. To obtain the final prediction results, an additional FC is appended to the original SpectraNet architecture. Specifically, the fused features generated by the MCF feature fusion module are first input into SpectraNet for further feature extraction. Subsequently, the extracted features are fed into the FC layer to perform the regression prediction. The output of the FC layer comprises three real-valued predictions, corresponding to the concentrations of the three bioactive compounds—flavonoids, saponins, and polysaccharides—in AMM. The architecture of the SF prediction module, incorporating SpectraNet and the FC layer, is illustrated in Figure 8.
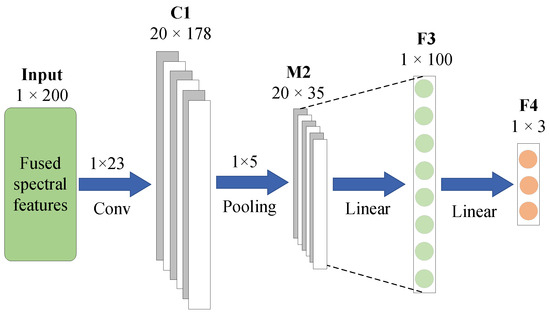
Figure 8.
SF structure diagram.
2.4. Evaluation Metrics
To evaluate the prediction performance of the proposed model in predicting the concentrations of bioactive compounds in AMM, this study adopts four quantitative metrics, including the coefficient of determination (R2), root mean square error (RMSE), relative percentage deviation (RPD), and mean absolute error (MAE). These metrics collectively assess the model’s predictive accuracy and robustness. The formulas for R2, RMSE, and RPD are provided in Equation (6), Equation (7), and Equation (8), respectively [32,33,34], while the calculation for MAE is presented in Equation (9) [35].
where is the true value of the ith sample, is the predicted value of the ith sample, is the average of all predicted values, and n is the total number of samples.
A higher value of R2 (closer to 1) and a lower value of RMSE (closer to 0) indicate the superior predictive accuracy of the model. Conversely, a larger MAE reflects poorer model performance. The RPD metric evaluates the consistency between the predicted and true values, with higher RPD values signifying stronger predictive capability [36,37].
2.5. Technical Roadmap
The technical roadmap of this study is illustrated in Figure 9. Using AMM as the subject of research, we developed a prediction model for bioactive compound content based on HSI. First, white–black panel calibration was performed on the hyperspectral camera to acquire hyperspectral data of the AMM leaves, from which the average spectral curves of ROIs were extracted and standardized. Simultaneously, the contents of bioactive compounds in the roots were determined through chemical analytical methods. Subsequently, the obtained leaf spectral data and bioactive compound data were divided into training, validation, and test sets. The spectral data were then subjected to feature extraction using a combination of FD, CR, and DWT algorithms, and the resulting multivariate features were fully utilized through cross-fusion to exploit their complementary information. Finally, a prediction module was employed to predict the contents of three bioactive compounds (flavonoids, saponins, and polysaccharides) in AMM. The model performance was evaluated using R2, RMSE, RPD, and MAE metrics, and the optimized model was applied to predict the bioactive compound contents in the test set.
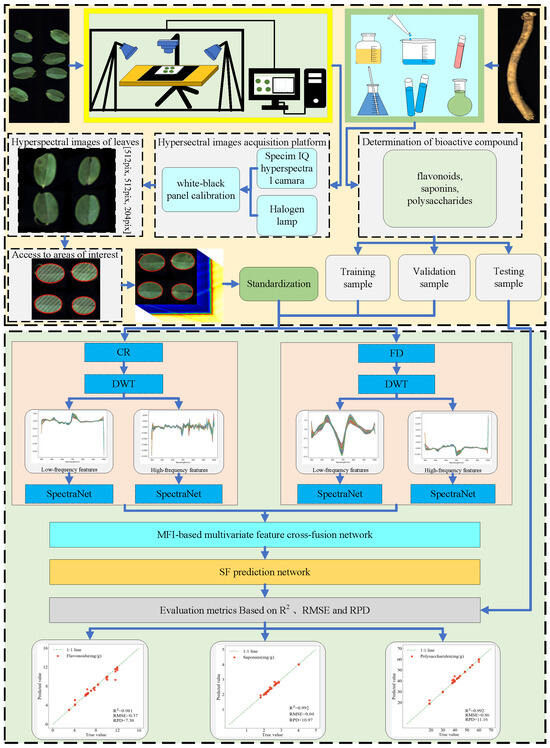
Figure 9.
Technical roadmap for the prediction of bioactive compounds of AMM.
3. Results
3.1. Experimental Environment and Parameter Configuration
The experiments for the WCT-MCFNet model were conducted on a workstation with an AMD Ryzen Threadripper PRO 3945WX CPU, an NVIDIA RTX A4000 GPU (16 GB memory), and 128 GB of RAM. The operating system was Windows Server 2022 Datacenter. The model was trained using the Adam optimizer, with a batch size of 8, a learning rate of 0.001, and a total of 300 epochs. Table 2 lists a comparison of the prediction results for the three bioactive compounds in the test set, evaluated under different parameter configurations.
Table 2.
Prediction results of flavonoid, saponin, and polysaccharide contents under different parameter conditions.
3.2. Training Results
The prediction results for the contents of flavonoids, saponins, and polysaccharides in AMM, obtained from the test set, are shown in Figure 10. The scatter points for all three bioactive compounds are closely aligned with the 1:1 line, with R2 values of 0.981, 0.992, and 0.992, respectively. These results indicate that the WCT-MCFNet model can accurately predict the bioactive compounds of AMM.
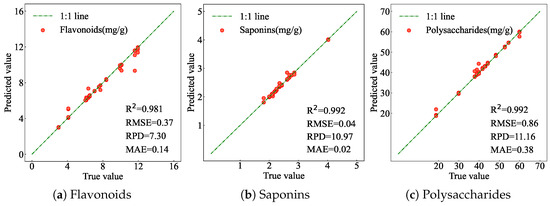
Figure 10.
Prediction results of bioactive compounds of AMM. (a) Prediction results of flavonoids. (b) Prediction results of saponins. (c) Prediction results of polysaccharides.
Figure 11 displays the distribution of prediction residuals for the contents of three compounds—flavonoids, saponins, and polysaccharides—in the test set. As can be seen from the figure, the prediction error for flavonoid content is within ±1.0, the prediction error for saponins does not exceed ±0.1, and the prediction error for polysaccharide content falls within ±0.6. These results indicate that the predicted values of the three bioactive compounds are in strong agreement with the measured values, demonstrating the excellent predictive performance of the model.
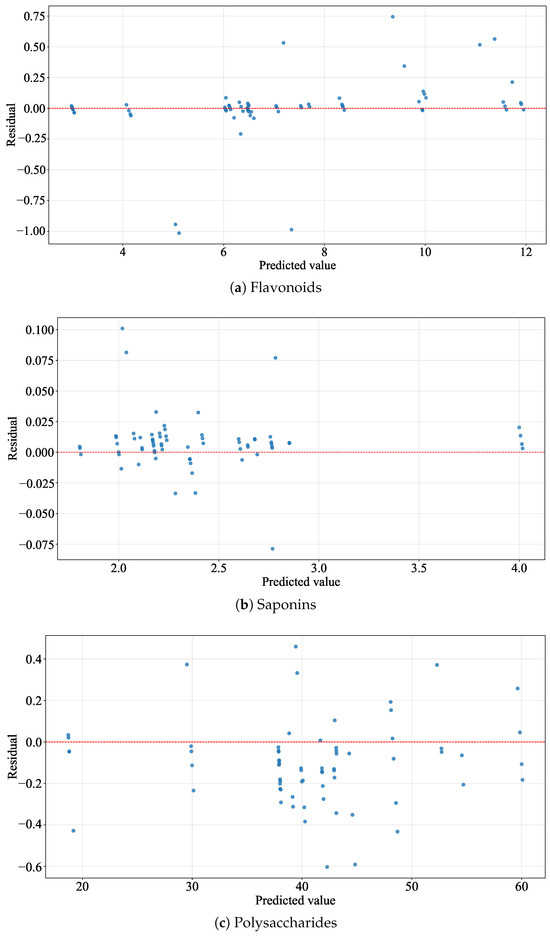
Figure 11.
The distribution of residuals for the contents of bioactive compounds of AMM. (a) The distribution of residuals for the contents of flavonoids of AMM. (b) The distribution of residuals for the contents of saponins of AMM. (c) The distribution of residuals for the contents of polysaccharides of AMM.
3.3. Comparative Experiments
The predictive performance of the proposed WCT-MCFNet model for bioactive compound contents in AMM was rigorously evaluated through a series of carefully designed comparative experiments. The hyperspectral data of AMM leaves were used as input, and the predicted contents of flavonoids, saponins, and polysaccharides served as the output.
To validate the effectiveness of using leaf HSI for indirectly predicting root bioactive compounds, this study compared it with the direct prediction approach based on root HSI. Table 3 indicates that the prediction accuracy achieved by the two methods was comparable. Although root HSI provided a slightly higher accuracy, the difference was not statistically significant. However, the root-based method exhibited clear limitations in data acquisition efficiency, whereas the use of leaf HSI significantly improved efficiency while maintaining comparable precision. As the primary photosynthetic organs, leaves can systematically reflect biochemical changes at the whole-plant level. Leaf spectra are closely related to the overall physiological status of the plant, and their non-destructive nature allows for continuous dynamic monitoring of the same individual. In contrast, acquiring root HSI requires destructive sampling and is further constrained by soil adhesion interference and excavation difficulties, which considerably reduce the efficiency of spectral collection and analysis. Therefore, this study demonstrates that leaf HSI serves as an efficient and reliable alternative technique for non-destructive monitoring and assessment of internal biochemical constituents in plants.
Table 3.
Comparison of prediction results using HSI of different organs.
The predictive effectiveness of WCT-MCFNet was systematically validated through benchmarking against established traditional prediction models, including logistic regression (LR), partial least squares regression (PLSR), and support vector regression (SVR). According to the experimental comparison results summarized in Table 4, the R2 values obtained using these traditional regression models for predicting the content of bioactive compounds in AMM did not exceed 0.8. This is mainly because traditional machine learning algorithms are generally limited to predicting the content of a single substance without considering the intrinsic correlations among multiple compounds. In contrast, the WCT-MCFNet model can simultaneously predict the contents of flavonoids, saponins, and polysaccharides, leveraging the interrelationships between different compounds. This enhances both prediction accuracy and the model’s generalization ability.
Table 4.
Comparison of prediction results using traditional models.
To demonstrate the superiority of the WCT-MCFNet model, it was compared with two recently proposed models for bioactive compound prediction, TCNA [32] and CSAM-CNN [38]. Full-band original spectral data were used as input variables for establishing comparison models. According to the data provided in Table 5, the WCT-MCFNet model achieved the best prediction performance, with an average R2 value close to 0.99, demonstrating the effectiveness of cross-fusing complementary features obtained from different feature extraction methods. In contrast, the TCNA model showed the lowest R2 values for the three compounds, none exceeding 0.7, and RPD values less than 2, indicating that this model provides only rough predictions for the bioactive compounds of AMM. The CSAM-CNN model, while superior to TCNA, still fell short of the WCT-MCFNet model in terms of prediction accuracy.
Table 5.
Comparison of prediction results using latest models.
The advantages of the lightweight network were demonstrated by employing spatial–spectral joint information derived from AMM leaf hyperspectral data as the control group. Prediction modeling was performed using the ResMorCNN (3D) model [39] and the 3D-2DCNN-CA model [40]. The comparison results are summarized in Table 6; the WCT-MCFNet model requires significantly less training time, making it more suitable for deployment on mobile devices or embedded systems. This feature is particularly advantageous for real-time applications and large-scale data analysis.
Table 6.
Comparison of prediction results using different dimensional models.
This study employed a comparative framework incorporating both early and late fusion strategies to systematically evaluate the superiority of intermediate fusion for multivariate feature integration. Figure A1 illustrates the structural diagram of early fusion applied to the hyperspectral data of AMM leaves. Compared to intermediate fusion, early fusion advances the fusion point, directly concatenating the multivariate features obtained after wavelet decomposition into four branches. It then uses SpectraNet for feature extraction. Figure A2 shows the structural diagram of late fusion. Compared to intermediate fusion, late fusion delays the fusion point, allowing each branch to undergo further feature extraction through MFI before concatenating the multivariate features.
According to the data provided in Table 7, the R2 value obtained using intermediate fusion is significantly higher than that of early fusion, indicating that early fusion may combine features before key features are fully extracted. This premature fusion leads to combined features that still contain a large amount of redundant or noisy information. The R2 value for late fusion is also lower than that of the WCT-MCFNet model, suggesting that performing multiple feature extractions on each branch may result in the loss of effective information. This makes it challenging to capture the correlations between branches and fully utilize complementary information among multivariate features. In contrast to early and late fusion, intermediate fusion more effectively leverages the correlations and complementarity between features while extracting useful information and minimizing redundancy.
Table 7.
Comparison of prediction results using different fusion strategies.
To evaluate the correlation between the multivariate features obtained by combining different feature extraction methods with wavelet decomposition, an ablation experiment was conducted. Two control groups were established, a single-branch group and a multi-branch group. The single-branch group consists of scenarios without feature extraction and those using only a single-feature extraction method, while the multi-branch group includes combinations of original data with a single-feature extraction method, excluding the SpectraNet model. The structural diagrams for using a single-feature extraction method and for excluding SpectraNet are illustrated in Figure A3 and Figure A4, respectively.
As shown in Table 8, in the single-branch group, the use of a single-feature extraction method improved the model’s accuracy compared to the scenario without feature extraction. However, due to the limitations of a single model, it could only capture a limited set of spectral features, missing some that are strongly correlated with the bioactive compounds of AMM, thus failing to achieve optimal results.
Table 8.
Comparison of results obtained using single-branch model.
The experimental comparison results are summarized in Table 9. In the multi-branch group, combining original data with a single-feature extraction method did not significantly improve model performance. In fact, some models showed a decline in effectiveness, suggesting that noise in the original data interfered with the model’s training process. When compared to the WCT-MCFNet model, the prediction performance deteriorated after removing SpectraNet, with R2 values for all three bioactive compounds decreasing, particularly for polysaccharides, which dropped by 0.08. This indicates that SpectraNet, as a feature extraction method, plays a crucial role in enhancing the prediction accuracy of bioactive compounds in AMM.
Table 9.
Comparison of results obtained using multi-branch model.
4. Discussion
AMM holds significant medicinal value in both traditional Chinese medicine and modern medicine. Traditional methods for detecting its bioactive compounds typically require destructive sampling and chemical analysis of the roots, which are complex, time-consuming, and costly [41,42]. However, research on indirectly predicting the content of bioactive compounds in the roots using hyperspectral data from AMM leaves remains limited. The WCT-MCFNet model proposed in this study, based on hyperspectral data from AMM leaves, successfully achieved high-precision prediction of flavonoid, saponin, and polysaccharide contents in the roots. This model innovatively integrates detailed and global spectral features from various feature extraction algorithms, with R2 values exceeding 0.98 and RPD metrics greater than 7, significantly outperforming single-feature extraction methods. These results highlight the correlation between leaf hyperspectral features and root bioactive compound content, offering a new, non-destructive approach to monitoring medicinal plant compounds, thus breaking away from traditional methods that rely on direct root analysis.
Table 8 and Table 9 compare the performance of different feature extraction strategies. As shown, the WCT-MCFNet model, which combines the FD and CR algorithms, outperforms other methods, achieving the highest R2 and RPD values, as well as the lowest RMSE and MAE for the prediction of the three bioactive compounds. Due to the high dimensionality and redundancy of hyperspectral data, directly using original spectral data for modeling often leads to interference from noise and irrelevant information. In contrast, feature extraction algorithms can effectively enhance model performance [43,44,45]. The results in Table 8 demonstrate that, compared to models without feature extraction, introducing a single-feature extraction algorithm significantly improves the R2 values for flavonoids, saponins, and polysaccharides. This indicates that feature extraction algorithms can effectively highlight the key spectral features sensitive to the bioactive compounds of AMM, underscoring the importance of feature extraction in hyperspectral data analysis [46,47,48].
Feature extraction methods can effectively enhance and extract key information from the spectrum that is sensitive to target parameters, reducing interference from background noise and redundant data [49,50,51,52]. However, most existing prediction models based on hyperspectral data typically rely on a single-feature extraction algorithm, overlooking the limitations of this approach and the complementary information that multiple feature extraction methods can provide [53,54,55]. By comparing the performance of single-feature extraction methods with the combined use of multiple methods, this study found that the fusion of multiple feature extraction techniques significantly outperforms individual methods in the prediction of flavonoids, saponins, and polysaccharides. The joint application of multiple feature extraction methods enables the capture of diverse spectral information, fully exploiting the complementarity between features to enhance model prediction accuracy [56,57,58,59]. According to the data provided in Table 9, multi-branch models using original data or data processed by a single-feature extraction algorithm did not show significant improvement in prediction performance compared to single-branch models using only one extraction method, with some even experiencing a decline in accuracy. This confirms that directly using original hyperspectral data for modeling may introduce background noise and redundant information, which interferes with the model’s ability to identify effective features, thereby obscuring the key information extracted by feature extraction algorithms and reducing model performance [60,61,62].
The high-precision prediction performance of the WCT-MCFNet model is primarily attributed to the feature enhancement provided by different feature extraction methods and the scientifically designed multi-level feature fusion strategy. At the data input stage, the FD and CR algorithms enhance the detailed and global features of the spectrum, respectively. Subsequently, DWT further decomposes these features into high- and low-frequency sub-components, which are then combined with SpectraNet for feature extraction. This approach effectively addresses the challenges of high dimensionality and redundancy in hyperspectral data. Meanwhile, the MFI leverages the complementarity of multi-branch features through a cross-fusion network. Compared to traditional serial or parallel fusion methods, such as PCA or simple CNN stacking, this design better aligns with the complex, multi-factor synergistic effects in plant physiological metabolism, significantly improving the prediction accuracy of bioactive compounds like flavonoids, saponins, and polysaccharides in AMM.
Although the WCT-MCFNet model proposed in this study makes significant advancements in detecting the content of bioactive compounds in AMM, it still has some limitations. First, the hyperspectral data used for model input was collected from AMM leaves grown in a specific environment and at a single growth stage. As a result, the model’s generalization ability to plants from different growing regions or stages has not been validated. Second, the model relies solely on spectral information from hyperspectral data and does not fully utilize the accompanying image data. This limitation may result in the loss of some key features, which could hinder further optimization. Additionally, the model has not yet explored the correlation between specific spectral bands and particular bioactive compounds, which may require validation using dynamic chemical composition monitoring data. Furthermore, the relatively small amount of experimental data poses a risk of overfitting, particularly in deep learning, which require large datasets to support the many parameters involved in achieving adequate model fitting.
This study aimed to indirectly estimate the content of bioactive compounds in the roots of AMM using hyperspectral data from its leaves combined with deep learning. The proposed WCT-MCFNet model achieved high-precision prediction of three key bioactive compounds in AMM roots—flavonoids, saponins, and polysaccharides—providing a rapid and non-destructive solution for the quality detection of traditional Chinese medicinal materials. Future research could enhance the model’s generalizability by constructing a large-scale hyperspectral-component database that spans different regions and multiple growth stages. Additionally, incorporating image information from hyperspectral data (such as texture and structural features) and combining it with three-dimensional convolutional neural networks or spatial–spectral joint analysis methods could fully leverage the synergistic effects of spectral and spatial features, improving model accuracy. Further research could also explore the development of lightweight embedded models based on the WCT-MCFNet model, integrating hyperspectral sensors with mobile computing devices to enable real-time field detection, thus facilitating the transition of this technology from the laboratory to industrial applications.
5. Conclusions
To effectively and non-destructively predict the bioactive compound content of AMM, a cross-fusion network integrating HSI and deep learning was developed. To address the limitation of conventional feature extraction methods in fully utilizing spectral information, both the FD algorithm and CR algorithm were introduced for preprocessing and feature extraction. The results demonstrated that the combined use of different feature extraction methods leveraged their respective advantages, significantly enhancing the capability to extract effective spectral features. Furthermore, considering the complementary information among different features, a multivariate feature cross-fusion network based on DWT was proposed. Comparative results showed that the cross-fusion network comprehensively captured the information related to bioactive compound content in the hyperspectral data of AMM leaves, achieving outstanding prediction performance with an average R2 of 0.988 for the three bioactive compounds. These findings strongly demonstrate the high performance and reliability of the proposed method in predicting AMM bioactive compound content using hyperspectral data.
This study also confirmed the feasibility of using leaf-based hyperspectral data to predict root-derived bioactive compounds (flavonoids, saponins, and polysaccharides) in AMM. It advances the application of hyperspectral technology combined with deep learning for bioactive compound prediction and provides a new reference for the rapid and effective estimation of other bioactive compounds using leaf hyperspectral data.
Looking ahead, HSI holds significant potential for applications in precision agriculture and research on traditional Chinese medicine resources. On one hand, future efforts could focus on integrating HSI with unmanned aerial vehicles or near-ground mobile platforms to achieve synchronous and integrated monitoring of physiological and biochemical parameters across multiple plant organs at field scale. On the other hand, developing multi-source data fusion strategies—incorporating environmental factors and growth models—may enable the construction of more robust prediction models for medicinal constituent accumulation across multiple growing years. These innovative directions are expected to overcome the current limitations of single-organ and static analyses, thereby advancing HSI technology from mere component retrieval toward holistic physiological diagnostics of plants and end-to-end quality tracking of medicinal materials.
Author Contributions
Conceptualization, Z.X. and Y.Z.; methodology, S.S.; software, S.S. and Y.Z.; validation, S.S., Z.X., and Y.Z.; formal analysis, S.S. and Y.Z.; investigation, Z.X.; resources, Z.X.; data curation, S.S. and Y.Z.; writing—original draft preparation, S.S.; writing—review and editing, S.S., Z.X., and Y.Z.; visualization, S.S. and Z.X.; supervision, Z.X.; project administration, Z.X.; funding acquisition, Z.X. All authors have read and agreed to the published version of the manuscript.
Funding
This research was funded by the Inner Mongolia Autonomous Region Science and Technology Program, grant number 2021GG0345; the Natural Science Foundation of Inner Mongolia Autonomous Region, grant number 2021MS06020; and the Inner Mongolia Natural Science Foundation, grant number 2024QN04013.
Data Availability Statement
The dataset supporting the conclusions of this article is available in the GitHub repository, https://github.com/SSNssn123/AMM/blob/d8f0a11e7d6786e4c9ab3b6ff5b15b8a 4a026993/Output.xlsx (accessed on 8 August 2025). The code supporting the conclusions of this article is available in the GitHub repository, https://github.com/SSNssn123/AMM.git (accessed on 8 August 2025).
Conflicts of Interest
The authors declare no conflicts of interest.
Abbreviations
The following abbreviations are used in this manuscript:
| AMM | Astragalus membranaceus var. mongholicus |
| HSI | hyperspectral imaging |
| FD | first-order derivative algorithm |
| CR | continuum removal algorithm |
| DWT | discrete wavelet transform |
| SNR | signal-to-noise ratio |
| LR | logistic regression |
| SVR | support vector regression |
| PLSR | partial least squares regression |
| SpectraNet | spectral feature extraction network |
| FC | fully connected layer |
| MFI | multivariate feature integrator |
| WCT | DWT-based and SpectraNet-based tree-structured feature extraction module |
| MCF | MFI-based cross-fusion of multivariate features fusion module |
| SF | prediction module integrating SpectraNet with FC |
| WCT-MCFNet | prediction network for multiple bioactive compounds in AMM, integrating FD, CR, and DWT algorithms with cross-fusion architecture. |
Appendix A. Fusion Strategy
Appendix A.1. Early Fusion
Figure A1 illustrates the early multi-feature fusion-based model structure for predicting bioactive compounds in AMM.

Figure A1.
Early fusion.
Appendix A.2. Late Fusion
Figure A2 illustrates the late multi-feature fusion-based model structure for predicting bioactive compounds in AMM.

Figure A2.
Late fusion.
Appendix B. Ablation Experiment
Appendix B.1. Single-Feature Extraction
Figure A3 shows the prediction model of bioactive compounds of AMM with single-feature extraction method.

Figure A3.
Single-feature extraction.
Appendix B.2. Remove SpectraNet
Figure A4 shows the prediction model of bioactive compounds of AMM based on SpectraNet-ablated WCT-MCFNet.

Figure A4.
Remove SpectraNet.
References
- Chang, X.; Chen, X.; Guo, Y.; Gong, P.; Pei, S.; Wang, D.; Wang, P.; Wang, M.; Chen, F. Advances in chemical composition, extraction techniques, analytical methods, and biological activity of Astragali radix. Molecules 2022, 27, 1058. [Google Scholar] [CrossRef] [PubMed]
- Ramadan, R.M.; Youssef, F.S.; Fouad, E.A.; Orabi, A.; Khalifa, M.M. The pharmacological impact of against coccidial and bacterial infection. Egypt. Pharm. J. 2023, 22, 324–335. [Google Scholar] [CrossRef]
- Yan, X.; Miao, J.; Zhang, B.; Liu, H.; Ma, H.; Sun, Y.; Liu, P.; Zhang, X.; Wang, R.; Kan, J.; et al. Study on semi-bionic extraction of Astragalus polysaccharide and its anti-aging activity in vivo. Front. Nutr. 2023, 10, 1201919. [Google Scholar] [CrossRef]
- Zaukuu, J.L.Z.; Abaidoo-Ayin, L.; Bimpong, D.; Amponsah, L.A.; Mensah, E.T. Predictive techniques for authenticating and quantifying crude palm oil adulterated with leaf extract and food color—An ultra-violet visible spectrophotometric approach. J. Food Compos. Anal. 2024, 126, 105895. [Google Scholar] [CrossRef]
- Salih, A.M.; Qahtan, A.A.; Al-Qurainy, F. Phytochemicals identification and bioactive compounds estimation of Artemisia Species grown in Saudia Arabia. Metabolites 2023, 13, 443. [Google Scholar] [CrossRef] [PubMed]
- Gündeşli, M.A.; Ugur, R.; Urün, I.; Ercisli, S.; Kafkas, N.E.; Ilhan, G.; Spalevic, V.; Ullah, R.; Bari, A. Evaluation of the total phenolic content, sugar, organic acid, volatile compounds and antioxidant capacities of fig (Ficus carica L.) genotypes selected from the Mediterranean region of Türkiye. Hortic. Sci. 2024, 51, 111–126. [Google Scholar] [CrossRef]
- Yue, L.; Ni-Ni, J.; Long, W.; Xing-Yu, Z.; Shuai, W.; Meng-Jun, P.; Xiang, L.; Xiao-Qin, C. Chemical detection and analysis of Astragalus-Cassia twig drug pair using UHPLC-Q-TOF-MS and HPLC-UV methods. Fitoterapia 2024, 177, 106129. [Google Scholar] [CrossRef]
- Upton, R.; David, B.; Gafner, S.; Glasl, S. Botanical ingredient identification and quality assessment: Strengths and limitations of analytical techniques. Phytochem. Rev. 2020, 19, 1157–1177. [Google Scholar] [CrossRef]
- Neri, I.; Caponi, S.; Bonacci, F.; Clementi, G.; Cottone, F.; Gammaitoni, L.; Figorilli, S.; Ortenzi, L.; Aisa, S.; Pallottino, F.; et al. Real-Time AI-Assisted Push-Broom Hyperspectral System for Precision Agriculture. Sensors 2024, 24, 344. [Google Scholar] [CrossRef]
- Riefolo, C.; D’Andrea, L. A non-destructive approach in proximal sensing to assess the performance distribution of SPAD prediction models using hyperspectral analysis in apricot trees. Exp. Agric. 2024, 60, e25. [Google Scholar] [CrossRef]
- Yoon, H.I.; Ryu, D.; Park, J.E.; Kim, H.Y.; Park, S.H.; Yang, J.S. Non-destructive prediction of rosmarinic acid content in basil plants using a portable hyperspectral imaging system and ensemble learning algorithms. Horticulturae 2024, 10, 1156. [Google Scholar] [CrossRef]
- Lu, J.; Jiang, Y.; Jin, B.; Sun, C.; Wang, L. Hyperspectral Imaging Combined with Deep Transfer Learning to Evaluate Flavonoids Content in Ginkgo biloba Leaves. Int. J. Mol. Sci. 2024, 25, 9584. [Google Scholar] [CrossRef]
- Sun, J.; Yao, K.; Cheng, J.; Xu, M.; Zhou, X. Nondestructive detection of saponin content in Panax notoginseng powder based on hyperspectral imaging. J. Pharm. Biomed. Anal. 2024, 242, 116015. [Google Scholar] [CrossRef]
- Hu, H.; Wang, T.; Wei, Y.; Xu, Z.; Cao, S.; Fu, L.; Xu, H.; Mao, X.; Huang, L. Non-destructive prediction of isoflavone and starch by hyperspectral imaging and deep learning in Puerariae thomsonii Radix. Front. Plant Sci. 2023, 14, 1271320. [Google Scholar] [CrossRef] [PubMed]
- Zhang, J.; Cheng, J.; Liu, C.; Wu, Q.; Xiong, S.; Yang, H.; Chang, S.; Fu, Y.; Yang, M.; Zhang, S.; et al. Enhanced crop leaf area index estimation via random forest regression: Bayesian optimization and feature selection approach. Remote Sens. 2024, 16, 3917. [Google Scholar] [CrossRef]
- Ye, Z.; Tan, X.; Dai, M.; Chen, X.; Zhong, Y.; Zhang, Y.; Ruan, Y.; Kong, D. A hyperspectral deep learning attention model for predicting lettuce chlorophyll content. Plant Methods 2024, 20, 22. [Google Scholar] [CrossRef] [PubMed]
- Wang, Y.; Li, Z.; Li, W.; Wang, Y. Rapid Identification of Medicinal Polygonatum Species and Predictive of Polysaccharides Using ATR-FTIR Spectroscopy Combined With Multivariate Analysis. Phytochem. Anal. 2024, 36, 677–692. [Google Scholar] [CrossRef]
- Hao, J.W.; Chen, N.D.; Fan, X.X.; Wang, W.T.; Jiang, H.H.; Zhang, Z.Y.; Gong, R.Z.; Ruan, X.L.; Chen, X. Rapid determination of total flavonoid content, xanthine oxidase inhibitory activities, and antioxidant activity in Prunus mume by near-infrared spectroscopy. J. Pharm. Biomed. Anal. 2024, 246, 116164. [Google Scholar] [CrossRef]
- Wang, F.; Jia, B.; Song, X.; Dai, J.; Li, X.; Gao, H.; Pan, H.; Yan, H.; Han, B. Rapid identification of Peucedanum praeruptorum dunn and its adulterants by Hand-Held Near-Infrared Spectroscopy. J. AOAC Int. 2022, 105, 928–933. [Google Scholar] [CrossRef]
- Ma, H.; Zhao, Y.; He, W.; Wang, J.; Hu, Q.; Chen, K.; Yang, L.; Ma, Y. Quantitative analysis of three ingredients in Salvia miltiorrhiza by near infrared spectroscopy combined with hybrid variable selection strategy. Spectrochim. Acta Part A Mol. Biomol. Spectrosc. 2024, 315, 124273. [Google Scholar] [CrossRef]
- Liu, X.; Huang, J.; Li, W.; Chen, R.; Cao, L.; Pan, T.; Liu, F. Fast quality assessment and origin identification of Gentianae Macrophyllae Radix using fourier transform infrared photoacoustic spectroscopy coupled with chemometrics. J. Pharm. Biomed. Anal. 2025, 259, 116774. [Google Scholar] [CrossRef]
- Yang, M.; Li, Z.; Liu, L.; Bo, A.; Zhang, C.; Li, M. Ecological niche modeling of Astragalus membranaceus var. mongholicus medicinal plants in Inner Mongolia, China. Sci. Rep. 2020, 10, 12482. [Google Scholar]
- Shao, Y.; Ji, S.; Shi, Y.; Xuan, G.; Jia, H.; Guan, X.; Chen, L. Growth period determination and color coordinates visual analysis of tomato using hyperspectral imaging technology. Spectrochim. Acta Part A Mol. Biomol. Spectrosc. 2024, 319, 124538. [Google Scholar] [CrossRef]
- Al Siam, A.; Salehin, M.M.; Alam, M.S.; Ahamed, S.; Islam, M.H.; Rahman, A. Paddy seed viability prediction based on feature fusion of color and hyperspectral image with multivariate analysis. Heliyon 2024, 10, e36999. [Google Scholar] [CrossRef] [PubMed]
- Jiang, Y.; Zhang, D.; Yang, L.; Cui, T.; He, X.; Wu, D.; Dong, J.; Li, C.; Xing, S. Design and experiment of non-destructive testing system for moisture content of in-situ maize ear kernels based on VIS-NIR. J. Food Compos. Anal. 2024, 133, 106369. [Google Scholar] [CrossRef]
- Wang, P.; Xiong, Y.; Zhang, H. Maize leaf disease recognition based on improved MSRCR and OSCRNet. Crop Prot. 2024, 183, 106757. [Google Scholar] [CrossRef]
- Wei, G.; Xu, J.; Yan, W.; Chong, Q.; Xing, H.; Ni, M. Dual-domain fusion network based on wavelet frequency decomposition and fuzzy spatial constraint for remote sensing image segmentation. Remote Sens. 2024, 16, 3594. [Google Scholar] [CrossRef]
- Kavitha, K.; Banu, D.S. Genetic Algorithm Framework for 3D Discrete Wavelet Transform based Hyperspectral Image Classification. J. Indian Soc. Remote Sens. 2024, 52, 645–657. [Google Scholar] [CrossRef]
- Du, L.; Luo, S. Spectral-Frequency Conversion Derived from Hyperspectral Data Combined with Deep Learning for Estimating Chlorophyll Content in Rice. Agriculture 2024, 14, 1186. [Google Scholar] [CrossRef]
- Qian, D.; Li, Q.; Fan, B.; Zhou, H.; Du, Y.; Guo, X. Spectral Characteristics and Identification of Degraded Alpine Meadow in Qinghai–Tibetan Plateau Based on Hyperspectral Data. Remote Sens. 2024, 16, 3884. [Google Scholar] [CrossRef]
- Hu, W.; Huang, Y.; Wei, L.; Zhang, F.; Li, H. Deep convolutional neural networks for hyperspectral image classification. J. Sens. 2015, 2015, 258619. [Google Scholar]
- Wang, Y.; Wang, S.; Yuan, Y.; Li, X.; Bai, R.; Wan, X.; Nan, T.; Yang, J.; Huang, L. Fast prediction of diverse rare ginsenoside contents in Panax ginseng through hyperspectral imaging assisted with the temporal convolutional network-attention mechanism (TCNA) deep learning. Food Control 2024, 162, 110455. [Google Scholar] [CrossRef]
- Bao, J.; Yu, M.; Li, J.; Wang, G.; Tang, Z.; Zhi, J. Determination of leaf nitrogen content in apple and jujube by near-infrared spectroscopy. Sci. Rep. 2024, 14, 20884. [Google Scholar] [CrossRef] [PubMed]
- Yang, Y.; Sun, R.; Li, H.; Qin, Y.; Zhang, Q.; Lv, P.; Pan, Q. Lightweight deep learning algorithm for real-time wheat flour quality detection via NIR spectroscopy. Spectrochim. Acta Part A Mol. Biomol. Spectrosc. 2025, 330, 125653. [Google Scholar] [CrossRef]
- Chen, Z.; Wang, X.; Qiao, S.; Liu, H.; Shi, M.; Chen, X.; Jiang, H.; Zou, H. A Leaf Chlorophyll Content Estimation Method for Populus deltoides (Populus deltoides Marshall) Using Ensembled Feature Selection Framework and Unmanned Aerial Vehicle Hyperspectral Data. Forests 2024, 15, 1971. [Google Scholar] [CrossRef]
- Li, P.; Wang, S.; Yu, L.; Liu, A.; Zhai, D.; Yang, Z.; Qin, Y.; Yang, Y. Non-destructive origin and ginsenoside analysis of American ginseng via NIR and deep learning. Spectrochim. Acta Part A Mol. Biomol. Spectrosc. 2025, 334, 125913. [Google Scholar]
- Gao, C.; Tang, T.; Wu, W.; Zhang, F.; Luo, Y.; Wu, W.; Yao, B.; Li, J. Hyperspectral prediction model of nitrogen content in citrus leaves based on the CEEMDAN–SR algorithm. Remote Sens. 2023, 15, 5013. [Google Scholar]
- Hu, H.; Mei, Y.; Wei, Y.; Xu, Z.; Zhao, Y.; Xu, H.; Mao, X.; Huang, L. Chemical composition prediction in goji (Lycium barbarum) using hyperspectral imaging and multi-task 1DCNN with attention mechanism. LWT 2024, 204, 116436. [Google Scholar] [CrossRef]
- Esmaeili, M.; Abbasi-Moghadam, D.; Sharifi, A.; Tariq, A.; Li, Q. ResMorCNN model: Hyperspectral images classification using residual-injection morphological features and 3DCNN layers. IEEE J. Sel. Top. Appl. Earth Obs. Remote Sens. 2023, 17, 219–243. [Google Scholar] [CrossRef]
- Xu, L.; Lu, C.; Zhou, T.; Wu, J.; Feng, H. A 3D-2DCNN-CA approach for enhanced classification of hickory tree species using UAV-based hyperspectral imaging. Microchem. J. 2024, 199, 109981. [Google Scholar]
- Tan, J.Y.; Zhao, J.X.; Zang, Y.; Li, P.; Yang, S.Q.; Li, X.M.; Wang, Y.L.; Cheng, Y.G. New flavonoid glycosides from the stems and leaves of Astragalus membranaceus. Fitoterapia 2025, 180, 106321. [Google Scholar] [CrossRef] [PubMed]
- Ji, B.; Xuan, L.; Zhang, Y.; Zhang, G.; Meng, J.; Mu, W.; Liu, J.; Paek, K.Y.; Park, S.Y.; Wang, J.; et al. Advances in biotechnological production and metabolic regulation of Astragalus membranaceus. Plants 2023, 12, 1858. [Google Scholar] [CrossRef] [PubMed]
- Du, P.; Yang, W.; Song, C.; Wang, Q.; Zhao, D.; Gao, X. Identification of Sorghum Variety Using Hyperspectral Technology with Squeeze-and-Excitation Convolutional Neural Network Algorithms. Anal. Methods 2025, 17, 3836–3844. [Google Scholar] [CrossRef]
- Wen, H.; Zhang, Y.; Wang, X.; Wang, R.; Wu, W.; Dong, J. Inversion study of the meadow steppe above-ground biomass based on ground and airborne hyperspectral data. Geocarto Int. 2024, 39, 2370304. [Google Scholar] [CrossRef]
- Liu, Y.; Jiang, S.; Liu, Y.; Mu, C. Spatial Feature Enhancement and Attention-Guided Bidirectional Sequential Spectral Feature Extraction for Hyperspectral Image Classification. Remote Sens. 2024, 16, 3124. [Google Scholar] [CrossRef]
- Xue, H.; Xu, X.; Yang, Y.; Hu, D.; Niu, G. Rapid and non-destructive prediction of moisture content in maize seeds using hyperspectral imaging. Sensors 2024, 24, 1855. [Google Scholar] [CrossRef]
- Park, S.J.; Yoon, H.I.; Lee, H.; Kim, M.C.; Yang, J.S.; Jung, D.H.; Ahn, J.Y.; Park, S.H. Evaluating the Accuracy of Machine Learning Classification Models for Similar Herbal Medicine Using Hyperspectral Imaging. J. Biosyst. Eng. 2024, 49, 156–166. [Google Scholar] [CrossRef]
- Zhong, H.; Chai, J.; Yu, C.; Wang, K.; Wang, K.; Lin, P. Rapid detection of oil content in Camellia oleifera kernels based on hyperspectral imaging and machine learning. J. Food Compos. Anal. 2025, 137, 106899. [Google Scholar] [CrossRef]
- Zhao, J.; Li, H.; Chen, C.; Pang, Y.; Zhu, X. Detection of water content in lettuce canopies based on hyperspectral imaging technology under outdoor conditions. Agriculture 2022, 12, 1796. [Google Scholar] [CrossRef]
- Jiang, X.; Bu, Y.; Han, L.; Tian, J.; Hu, X.; Zhang, X.; Huang, D.; Luo, H. Rapid nondestructive detecting of wheat varieties and mixing ratio by combining hyperspectral imaging and ensemble learning. Food Control 2023, 150, 109740. [Google Scholar] [CrossRef]
- Cheng, T.; Chen, G.; Wang, Z.; Hu, R.; She, B.; Pan, Z.; Zhou, X.G.; Zhang, G.; Zhang, D. Hyperspectral and imagery integrated analysis for vegetable seed vigor detection. Infrared Phys. Technol. 2023, 131, 104605. [Google Scholar] [CrossRef]
- Nian, Y.; Su, X.; Yue, H.; Anwar, S.; Li, J.; Wang, W.; Sheng, Y.; Ma, Q.; Liu, J.; Li, X. Winter Wheat SPAD Prediction Based on Multiple Preprocessing, Sequential Module Fusion, and Feature Mining Methods. Agriculture 2024, 14, 2258. [Google Scholar] [CrossRef]
- Feng, H.; Chen, Y.; Song, J.; Lu, B.; Shu, C.; Qiao, J.; Liao, Y.; Yang, W. Maturity classification of rapeseed using hyperspectral image combined with machine learning. Plant Phenom. 2024, 6, 0139. [Google Scholar] [CrossRef]
- Xuan, G.; Jia, H.; Shao, Y.; Shi, C. Protein content prediction of rice grains based on hyperspectral imaging. Spectrochim. Acta Part A Mol. Biomol. Spectrosc. 2024, 320, 124589. [Google Scholar] [CrossRef]
- Xu, Y.; Wang, Y.; Cheng, P.; Zhang, C.; Huang, Y. A lightweight neural network approach for identifying geographical origins and predicting nutrient contents of dried wolfberries based on hyperspectral data. J. Food Meas. Charact. 2024, 18, 7519–7532. [Google Scholar] [CrossRef]
- Zhang, L.; Zhang, S.; Liu, J.; Wei, Y.; An, D.; Wu, J. Maize seed variety identification using hyperspectral imaging and self-supervised learning: A two-stage training approach without spectral preprocessing. Expert Syst. Appl. 2024, 238, 122113. [Google Scholar] [CrossRef]
- Liu, Y.; Pan, X.; Liu, J.; Zhang, S.; Yan, W. Research on near-ground forage hyperspectral imagery classification based on fusion preprocessing process. Int. J. Digit. Earth 2023, 16, 4707–4725. [Google Scholar] [CrossRef]
- Cui, Y.; Lv, Z.; Fan, Y.; Song, Y.; Wu, Y.; Zhao, X.; Diao, C.; Zhao, C.; Xu, Z.; Wang, W. Spatial-spectral joint preprocessing for hyperspectral image analysis using 3D-ResNet: Application to coal ash content estimation. Measurement 2025, 246, 116535. [Google Scholar] [CrossRef]
- Jiachen, H.; Jing, H.; Gang, L.; Weile, L.; Zhe, L.; Zhi, L. Inversion analysis of soil nitrogen content using hyperspectral images with different preprocessing methods. Ecol. Inform. 2023, 78, 102381. [Google Scholar] [CrossRef]
- Wonggasem, K.; Wongchaisuwat, P.; Chakranon, P.; Onwimol, D. Utilization of Machine Learning and Hyperspectral Imaging Technologies for Classifying Coated Maize Seed Vigor: A Case Study on the Assessment of Seed DNA Repair Capability. Agronomy 2024, 14, 1991. [Google Scholar] [CrossRef]
- Tu, C.; Liu, W.; Jiang, W.; Zhao, L. Hyperspectral image classification based on residual dense and dilated convolution. Infrared Phys. Technol. 2023, 131, 104706. [Google Scholar] [CrossRef]
- Mahmoodi, J.; Abbasi-Moghadam, D.; Sharifi, A.; Esmaeili, H.N.P.M.; Vafaeinejad, A. DESSA-Net Model: Hyperspectral Image Classification Using an Entropy Filter with Spatial and Spectral Attention Modules on DeepNet. IEEE J. Sel. Top. Appl. Earth Obs. Remote Sens. 2024, 17, 14588–14613. [Google Scholar] [CrossRef]
Disclaimer/Publisher’s Note: The statements, opinions and data contained in all publications are solely those of the individual author(s) and contributor(s) and not of MDPI and/or the editor(s). MDPI and/or the editor(s) disclaim responsibility for any injury to people or property resulting from any ideas, methods, instructions or products referred to in the content. |
© 2025 by the authors. Licensee MDPI, Basel, Switzerland. This article is an open access article distributed under the terms and conditions of the Creative Commons Attribution (CC BY) license (https://creativecommons.org/licenses/by/4.0/).