Article

Distribution Characteristics of Rotor Airflow and Droplet Deposition of Plant Protection UAVs Under Varying Rotor–Nozzle Distances

1
College of Electronic Engineering (College of Artificial Intelligence), South China Agricultural University, Guangzhou 510642, China
2
National Center for International Collaboration Research on Precision Agricultural Aviation Pesticides Spraying Technology, South China Agricultural University, Guangzhou 510642, China
*
Authors to whom correspondence should be addressed.
Agriculture 2025, 15(19), 1995; https://doi.org/10.3390/agriculture15191995
Submission received: 5 June 2025 / Revised: 17 July 2025 / Accepted: 25 July 2025 / Published: 23 September 2025

Abstract

The rotor airflow intensity and distribution characteristics of plant protection UAVs vary significantly with spatial positions below the rotor. Consequently, changes in the rotor–nozzle distance directly affect droplet motion and deposition patterns. To optimize the spraying effect of UAVs, this study combined a numerical simulation of rotor airflow and droplet deposition at different vertical distances between rotor and nozzle with field validation tests. The simulation results revealed that airflow intensity initially increases and then decreases with greater rotor–nozzle distance, peaking at 300–400 mm below the rotor with a maximum airflow velocity of 8.1 m/s. At 360 mm, the droplet swarm achieved its highest average velocity, corresponding to optimal deposition effect. Field tests confirmed a non-linear relationship between rotor–nozzle distance and droplet deposition. Droplet deposition first increased but declined sharply beyond the optimal range. When the distance was 360 mm, the target area exhibited the highest droplet deposition of 0.766 μL·cm−2 and the lowest drift rate of 23.31%. Although a certain deviation existed between numerical simulation results and field test values, both methods consistently identified 360 mm as the ideal distance for balancing deposition efficiency and drift control. These findings provide actionable insights for field trial design and advance precision spraying strategies for plant protection UAVs.

1. Introduction

In recent years, UAV technology has advanced rapidly, with plant protection applications gaining significant attention in agriculture [1]. As an innovative spraying method, plant protection UAVs employ low- or ultra-low-volume spray systems, offering high efficiency, intelligent operation, and rapid response to pest outbreaks. These capabilities make UAVs particularly effective for challenging terrains, such as tall crops, paddy fields, and hilly areas, where traditional machinery struggles [2]. Today, plant protection UAVs have become an indispensable component of modern agriculture, widely used for crops including rice, corn, wheat, fruit trees, and cotton, demonstrating their vital role in contemporary farming practices [3,4,5].
As an emerging agricultural technology, plant protection UAVs face challenges in maintaining consistent operation quality due to diverse product types and complex, variable working conditions [6]. Consequently, spraying effectiveness has become a primary concern for users. Initial studies on plant protection UAV spray technology identified flight operation parameters or spray components as the primary determinants of aerial spraying performance [7]. Researchers have conducted extensive experimental studies on plant protection UAV operational parameters and spray components to optimize performance and enhance spraying efficacy [8,9]. Zhang et al. [10] employed a thermal infrared camera in combination with a plant protection UAV to monitor the crop canopy temperature variations before and after spraying. The innovative approach enabled quantitative assessment of droplet deposition effects on rice canopies, facilitating investigation of how flight parameters influence spray deposition and subsequent optimization of plant protection UAV operational parameters. Qiu et al. [11] conducted a multi-level orthogonal test to evaluate the effects of flight speed and height on droplet deposition in plant protection UAV applications. Their experimental design systematically analyzed the influence of these operational parameters on spraying performance. Subsequently, the study established quantitative relationships between flight parameters (speed and height) and droplet deposition patterns for single-rotor UAVs, providing a basis for operational optimization. To provide practical guidance for agricultural applications, Qin et al. [12] investigated how the operating height of an N-3 oil-powered single-rotor UAV affects droplet deposition distribution in corn canopies. Their study determined optimal operational parameters of 7 m flight altitude and 3 m/s flight speed based on deposition analysis. Furthermore, employing Box–Behnken central composite design methodology, the researchers systematically analyzed the relationship between spray parameters and deposition performance. Through modeling, they identified the optimal parameter combination for the P20 plant protection UAV: 2.0 m flight height, 3.7 m/s flight speed, and 430 mL/min nozzle flow rate [13]. Similarly, in order to evaluate application potential for fruit tree spraying, Zhang et al. [14] conducted numerical simulations on the downwash airflow field of a six-rotor plant protection UAV during hover-based application in fruit trees; the airflow distribution characteristics under different hovering altitudes, various fruit tree growth stages, and varying natural wind speeds were analyzed. Lian et al. [15] proposed seven nozzle layout configurations for plant protection UAVs. Experimental spray tests revealed that the optimal deposition performance was achieved with two rear-mounted nozzles combined with outward-rotating propellers positioned above the nozzles. Xie et al. [16] conducted a comparative study of droplet deposition characteristics between DG11003 and SX11001VS nozzles using a DJI T20 plant protection UAV. The experimental results demonstrated that the DG11003 nozzle achieved superior droplet deposition distribution at higher application flow rates.
With the continuous deepening of the research on spraying technology of plant protection UAVs, the rotor airflow field generated by rotor rotation was gradually regarded as the most fundamental factor affecting droplet deposition distribution in aerial spraying [17]. The aerial spray operation is the process of pesticide droplet deposition under the action of rotor airflow. Therefore, Chen et al. [18] used a UAV wind field wireless measurement system to obtain and analyze the rotor airflow distribution of single-rotor and multi-rotor plant protection UAVs under varying flight conditions, and investigated the influence of rotor airflow on the characteristics of droplet deposition and drift. Yang et al. [19] simulated the rotor flow field and droplet movement of a six-rotor plant protection UAV in hovering state by using the computational fluid dynamics (CFD) method, and established a three-dimensional two-phase flow model. Zhan et al. [20] investigated the influence of the variable rotor airflow caused by progressively decreasing liquid loading on droplet deposition during the UAV-based spray operation.
As evidenced by these studies, the growing recognition of rotor airflow’s role in plant protection UAVs has led to extensive research on its impact on droplet deposition. However, these studies primarily conducted measurements and analyses under fixed experimental conditions, where nozzle positions remained static beneath the rotor at constant distances [21]. In practice, both the intensity and distribution characteristics of rotor airflow vary significantly with different spatial positions under the rotor [22]. Variations in nozzle–rotor vertical spacing alter droplet motion and deposition distribution through rotor airflow interactions [23]. Therefore, to enhance the spraying performance of plant protection UAVs, this paper takes the nozzle–rotor vertical distance as the research object. The spatial distribution of rotor airflow and droplet deposition for a quadrotor plant protection UAV at varying nozzle–rotor distances were simulated based on CFD. Moreover, the influence of rotor airflow on droplet deposition and the simulation results were further analyzed and verified through field spraying tests. These results provide actionable insights for optimizing field trial design and advancing precision spraying strategies in plant protection UAV applications.

2. Physical Model

2.1. UAV Structure and Operating Parameters

In this study, a self-assembled EFT-410S four-rotor plant protection UAV was adopted. The parameters of this model are shown in Table 1.
This model mainly includes a UAV frame, U-shaped pesticide liquid tank, micro water pump, retractable spray rod, pipeline, and four flat spray nozzles. The Lu120-02 fan-shaped nozzle (Lechler GmbH, Metzingen, Germany) was used for spraying with a spray angle of 120°. When operated at 0.3 MPa, the nozzle produced spray droplets exhibiting a median volumetric diameter (DV50) of 134.36 ± 1.74 μm [1]. As shown in Figure 1, different flight height, speed, and vertical distance between nozzle and rotor can be set according to the test requirements. To systematically evaluate effects, the nozzle–rotor vertical distance was controlled by using interchangeable connecting rods. The following image illustrates the vertical distance between the nozzle and rotor.

2.2. Modeling and Rotor Scanning

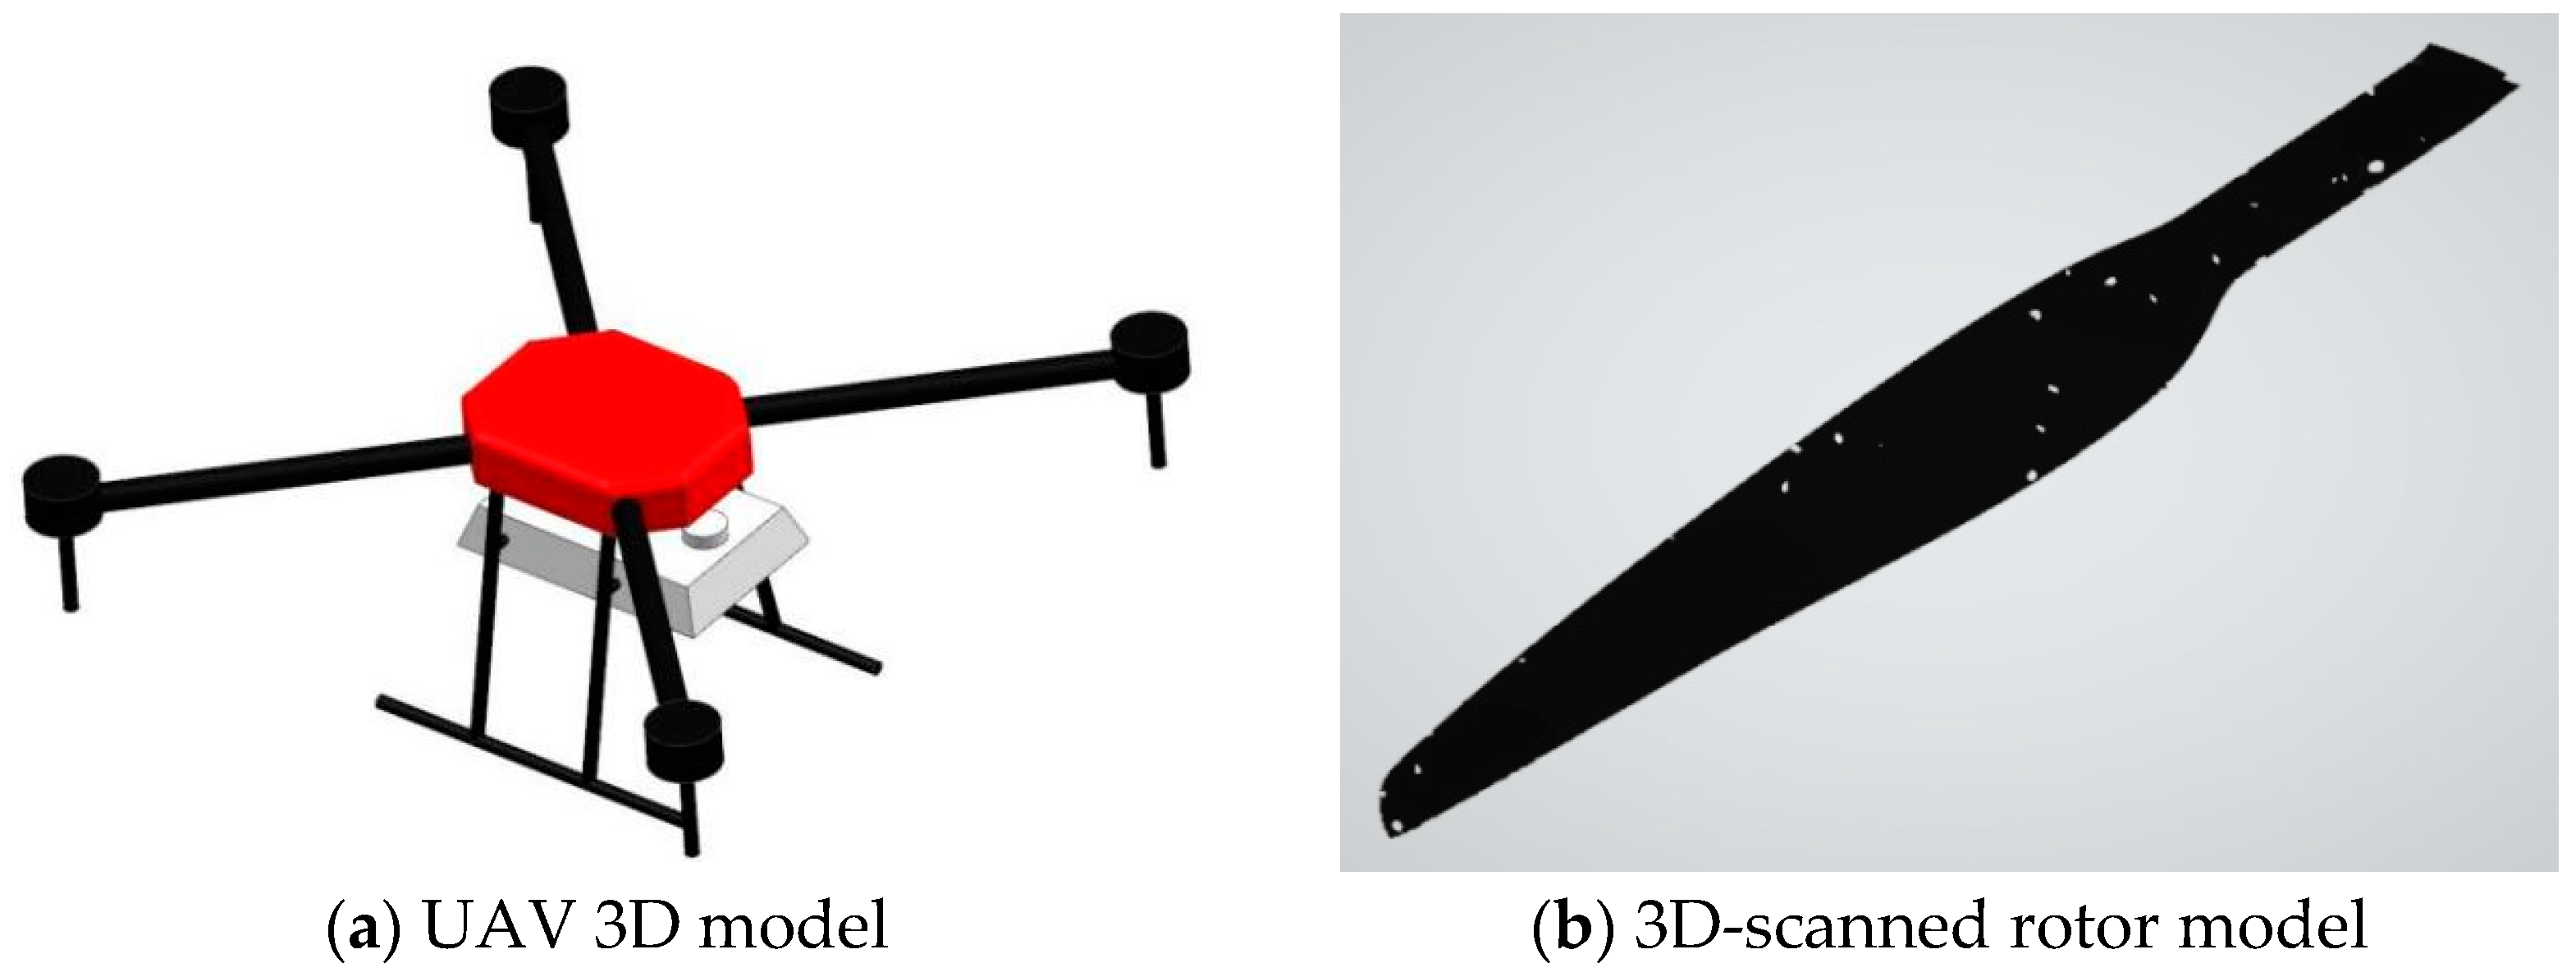
The modeling of the plant protection UAV is divided into two parts: the body and the rotor. First, the fuselage model is established according to the actual size of the UAV. Because the body part has little influence on the simulation results and its complex structure has a great influence on the difficulty of the numerical calculation process, the body part is appropriately simplified. Through the measurement of the fuselage entity, UG modeling software (v12.0) is used to draw the three-dimensional fuselage entity model, as shown in Figure 2a.
Due to the critical role of rotor airfoil structure in air flow, all rotors were scanned by 3D scanning instruments, and reverse modeling was performed using Geomagic Design X software (v2019.0.1). The principle is that three-point matrix recognition is based on the three-dimensional spatial information of the scanned object, and the three-dimensional model of the scanned object is formed by the identification of 3 or more spatial matrix points. The modeling steps of the rotor are as follows: spray reflective enhancer into the rotor, paste the marking points on the complex area, and conduct three-dimensional scanning of the rotor using a GOM Optical Measuring Techniques scanner (GOM mbH, Braunschweig, Germany) and its supporting software, ATOS Professional (v2019), as shown in Figure 2b. Import the scanned point cloud data into the Geomagic Design X software, inversely build a 3D solid model according to the point cloud data, import the rotor model part and the body part into the UG 3D software for assembly, and output the stp format 3D model.

3. Numerical Simulation

CFD is the study of the interaction and flow of fluids at rest and in motion due to the relative motion of the fluid and the wall. As an important branch of modern fluid mechanics, CFD numerical simulation is based on the mass conservation equation, momentum conservation equation, and energy conservation. The three conservation laws form the basis of the continuity equation, the momentum equation (N-S equation), and the energy equation. In this paper, CFD theory and computational fluid dynamics software Fluent (v2020 R2) were used to conduct numerical simulations. For different rotor–nozzle distances, the movement of spray droplets and the deposition distribution of droplets were numerically simulated.

3.1. Computing Domain Construction

In order to simulate the airflow distribution characteristics at different flight speeds and the influence of airflow on the droplet deposition distribution under different rotor–nozzle distances, and to facilitate the comparison and verification of later tests, it is necessary to first import the plant protection UAV body model, output in stp format and assembled in UG 3D software, into the workbench DM. The model calculation domain is constructed. Based on computational requirements, wrapping and Boolean operations were performed. Specifically, the entire fuselage was enveloped using a box-shaped domain, which was designed to balance computational performance while closely approximating the operational range of the agricultural UAV. A cylinder is used to wrap the four rotor parts, and the requirements for the rotation axis of the rotor and the central axis of the cylinder are consistent. According to the simulation requirements, the diameter of the rotor cylinder is 50 mm larger than the direct rotor and the thickness is 20 mm larger than the rotor pitch. The four rotor wings and the fuselage part of the UAV have independent spatial domains.

3.2. Turbulence Model

According to the simulation requirements, this paper adopts the transient simulation solution based on pressure and sets the gravity direction as -Z and the size as 9.81 m/s2. In order to accurately simulate and describe the details of the flow field in the fluid domain from the perspective of airflow characteristics, the continuous phase turbulence model in the fluid domain uses the standard k-ε model, which is the standard for most practical engineering models in Fluent (v2020 R2) and has become the main modeling tool for computational fluid mechanics. The k-ε standard model establishes the model of turbulent kinetic energy (k) and its dissipation rate (ε) according to the continuity equation. In Reynolds (Ensemble) Averaging, the instantaneous N-S equation divides the velocity variable into mean and wave components, and the expression of the velocity component is as follows:
u = u ¯ i + u i
where u ¯ i is the average velocity, u i is the fluctuation velocity, and (i = 1, 2, 3). The corresponding expression for a scalar quantity is as follows:
φ = φ ¯ + φ i
where φ is the scalar. The flow rate is substituted into the instantaneous continuity equation and momentum equation, and the overall average momentum equation is derived as follows:
ρ t + x i ( ρ u i ) = 0
t ( ρ u i ) + x j ( ρ u i u j ) = ρ t + t μ ( u i t + u j t 2 3 δ i j u i x i ) + t ( ρ u i u j )
Equations (3) and (4) mean that Reynolds-averaged Navier–Stokes (RANS) and N-S equations have the same expression. The value of k is derived from the continuity equation and the value of ε is derived from the energy equation. In the process of obtaining the two parameters, it is assumed that the fluid in the fluid domain is completely turbulent, so the simulation effect will be accurate and reliable. On this basis, the RNG k-ε model and Realizable k-ε model are derived, and the turbulence kinetic energy k and dissipation rate ε can be deduced by the following equation:
t ( ρ k ) + x i ( ρ k u i ) = x j ( μ + u t σ k ) k x j + G k + G b ρ ε Y m + S K
t ( ρ ε ) + x i ( ρ ε u i ) = x j ( μ + u t σ ε ) ε x j + C 1 ε ε k ( G k + C 3 ε G b ) C 2 ε ρ ε 2 k + S ε
where G K represents the turbulent kinetic energy of the average velocity; G b represents the turbulent kinetic energy of the buoyancy; Y m represents the total dissipation rate of the wave expansion in compressible turbulence; C 1 ε , C 2 ε , and C 3 ε are constants; σ k and σ ε are the Prandtl number of k and ε; and S K and S ε are user-defined.
The turbulent (or eddy) viscosity is calculated by the following combination:
μ t = ρ C μ k 2 ε
where C μ is a constant.

3.3. Discrete Phase Model

In view of the movement and distribution of droplets under different distances from rotor to nozzle, Fluent selected the Discrete Phase Model to simulate the spraying of nozzle droplets. The DPM model could well simulate the separation and deposition of nozzle droplets. The Euler–Lagrange method provided in the DPM model is selected in this study. By solving the N-S equation, the fluid in the fluid domain is regarded as a continuous phase, while the discrete phase tracks its trajectory at unit time interval by exchanging momentum, mass, and energy with the continuous phase. Due to the continuous interaction energy between discrete phase droplets and continuous phase air, the continuous phase is set to be updated once every iteration. The droplet continuity equation adopts the form of Unsteady Particle dispersion and enables the Unsteady Particle Tracking discrete phase droplet continuity equation. The step size of the discrete phase particles is set to 0.001 s, and the solution method adopts the Euler–Lagrange method. The equation of motion of the discrete phase particles is expressed as follows:
d u p d t = 18 μ ρ p d p 2 C D R e 24 ( u u p ) + g y ( ρ p ρ ) ρ p + ρ d 2 ρ p d t ( u u p )
where u is the continuous phase velocity; u p is particle velocity; ρ p is the particle density; d p is the particle diameter; g y is the gravitational acceleration; R e is the relative Reynolds number; and C D is the drag coefficient.
The spray numerical simulation also needs to consider the fragmentation and aggregation of droplets, and judge whether droplets merge and rebound. The judgment is mainly based on whether they reach the critical value of collision given by Rourke, which is a function of the collision Weber number and the radius of small droplets. The calculation formula is as follows:
b c r i t = ( r 1 + r 2 ) min ( 1 , 2.4 f W e )
where bcrit is the critical value for judging the collision, merger, or rebound of droplets; r1 and r2 are the radius of small droplets; f is the ratio of r1/r2; and We is the collision Weber number.

3.4. Boundary Condition

The established computing domain model was imported into Fluent meshing (v2020 R2), and the computing domain model was meshed. In the process of meshing, the quality of the grid is particularly important. Due to the geometric complexity of both the external airflow field around the fuselage and the rotational domain, a tetrahedral mesh (Tetrahedrons) with Patch Conforming method was employed for grid generation. The physics preference was set to CFD with 100% relevance. The Relevance Center was set to Fine, Smoothing to Medium, and Span Angle Center to Fine to ensure computational accuracy. The mesh density of the outer drainage basin gradually decreases from the fuselage outward and the mesh size gradually increases from the fuselage outward. The mesh density of the rotation domain remains unchanged and the mesh size is uniform. The total number of mesh elements obtained is 14,628,887. The cell mass of the grid is 0.8453, and the average orthogonal mass of the grid is 0.78831, both of which meet the mesh division standards.
In order to simulate the air flow distribution characteristics under a certain flight speed and rotor speed, and the influence of air flow on the deposition distribution of droplets under different rotor–nozzle distances, the outer basin was designated as still fluid in the parameter setting of Fluent (Cell Zone Condition). The rotation domain of the four rotors were also divided into four fluids (fluid1, fluid2, fluid3, and fluid4). The rotation mode was set as the grid motion method, and the rotation center, rotation axis direction, and rotation speed of the four rotors were set according to the model size and numerical simulation requirements of the plant protection UAV. In order to simulate the flight speed of the four-rotor plant protection UAV, the upper, lower, front, and rear surfaces of the outer basin were set as walls. When the UAV was simulated in hover state, the left side of the outer basin was set as Pressure-inlet, and when different flight speeds were simulated, it was set as Velocity-inlet. The rear boundary was set as a pressure-outlet boundary with a gauge pressure of 0 Pa. Interfaces were defined between internal flow domains. Both the fuselage and rotor boundaries were configured as wall boundaries, where the fuselage remained stationary while the rotor wall moved at the same velocity as the rotating domain.
This simulation was mainly aimed at the research on the distribution characteristics of droplet deposition under the rotor–nozzle distance. Considering the requirements of later test verification, the flight speed of the UAV was 3 m/s and the rotor speed was 2000 r/min in the simulation test, and the mainstream model DJI-T30 plant protection UAV (Shenzhen DJI Innovation Technology Co., Ltd., Shenzhen, China) in the market was taken as a reference. The vertical rotor–nozzle distances were selected as 200, 280, 360, and 440 mm for the simulation test.

4. Simulation Result Analysis

4.1. Spatial Distribution Analysis of Rotor Airflow

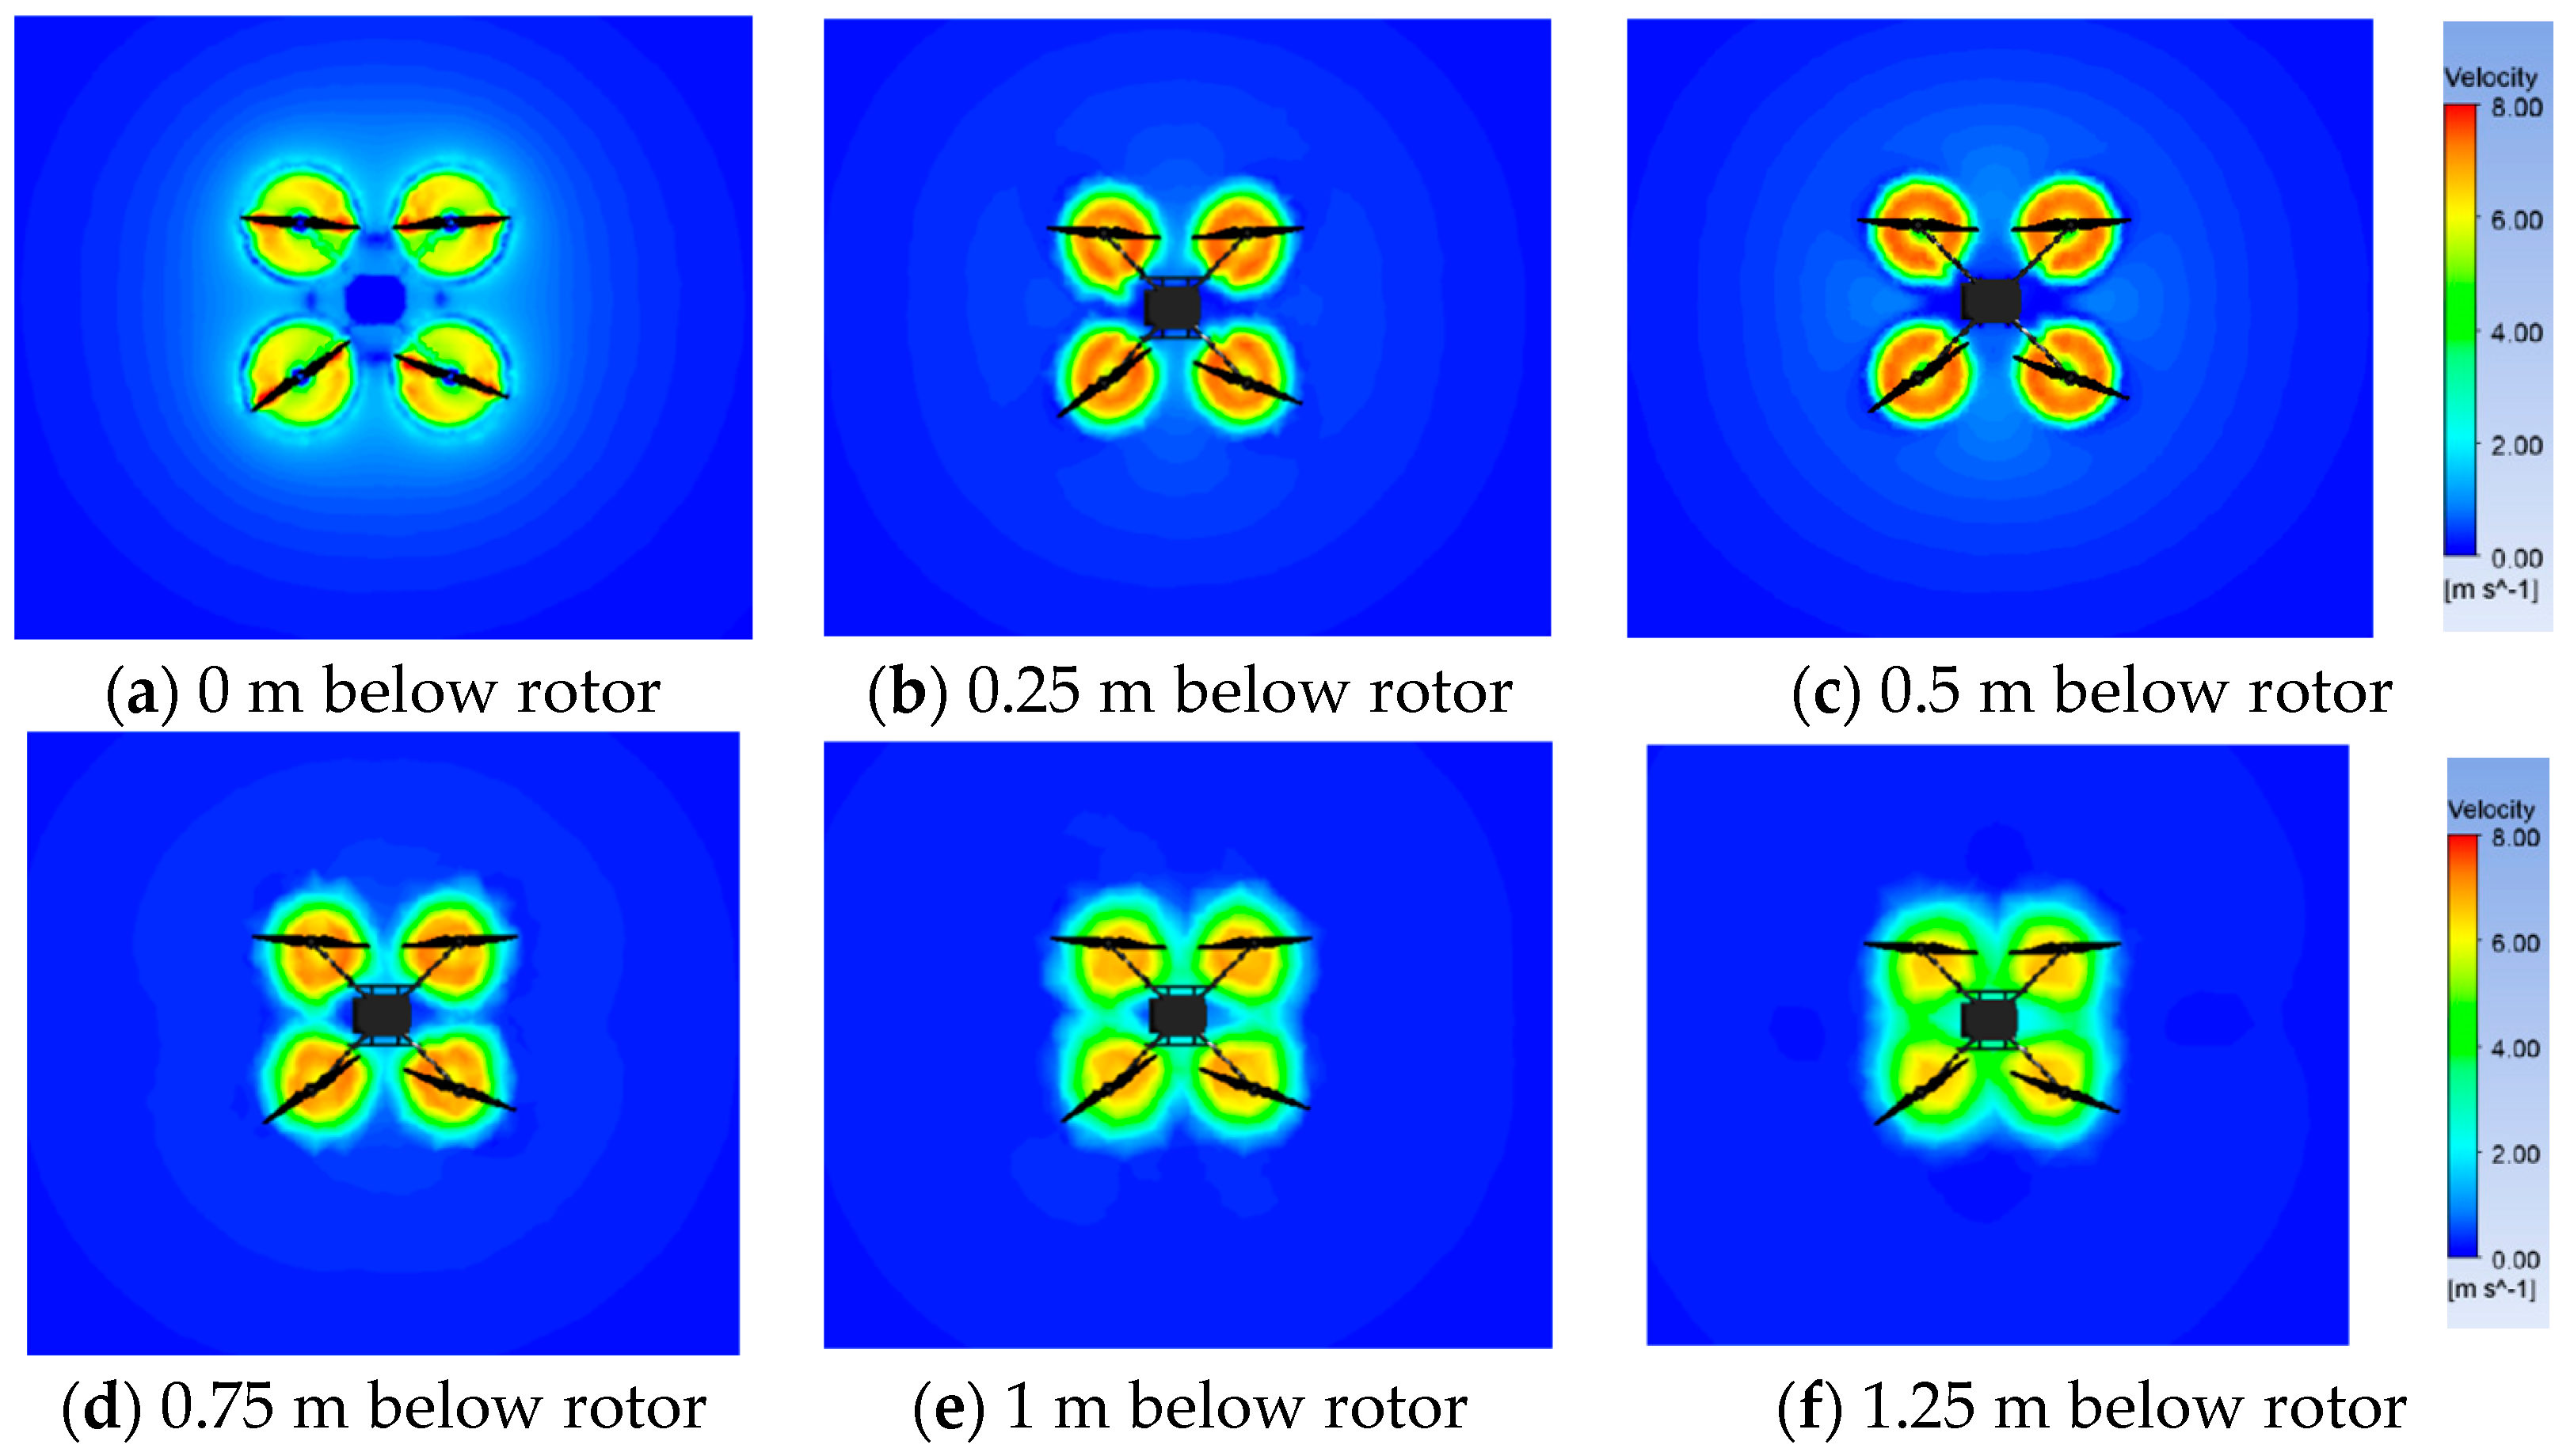
The rotor airflow of a UAV can effectively promote the deposition movement of droplets and reduce drift. In order to study the intensity distribution of rotor airflow, the spatial airflow velocity distribution at 0, 0.25, 0.5, 0.75, 1.0, and 1.25 m directly below the rotor was selected at an interval of 0.25 m, as shown in Figure 3.
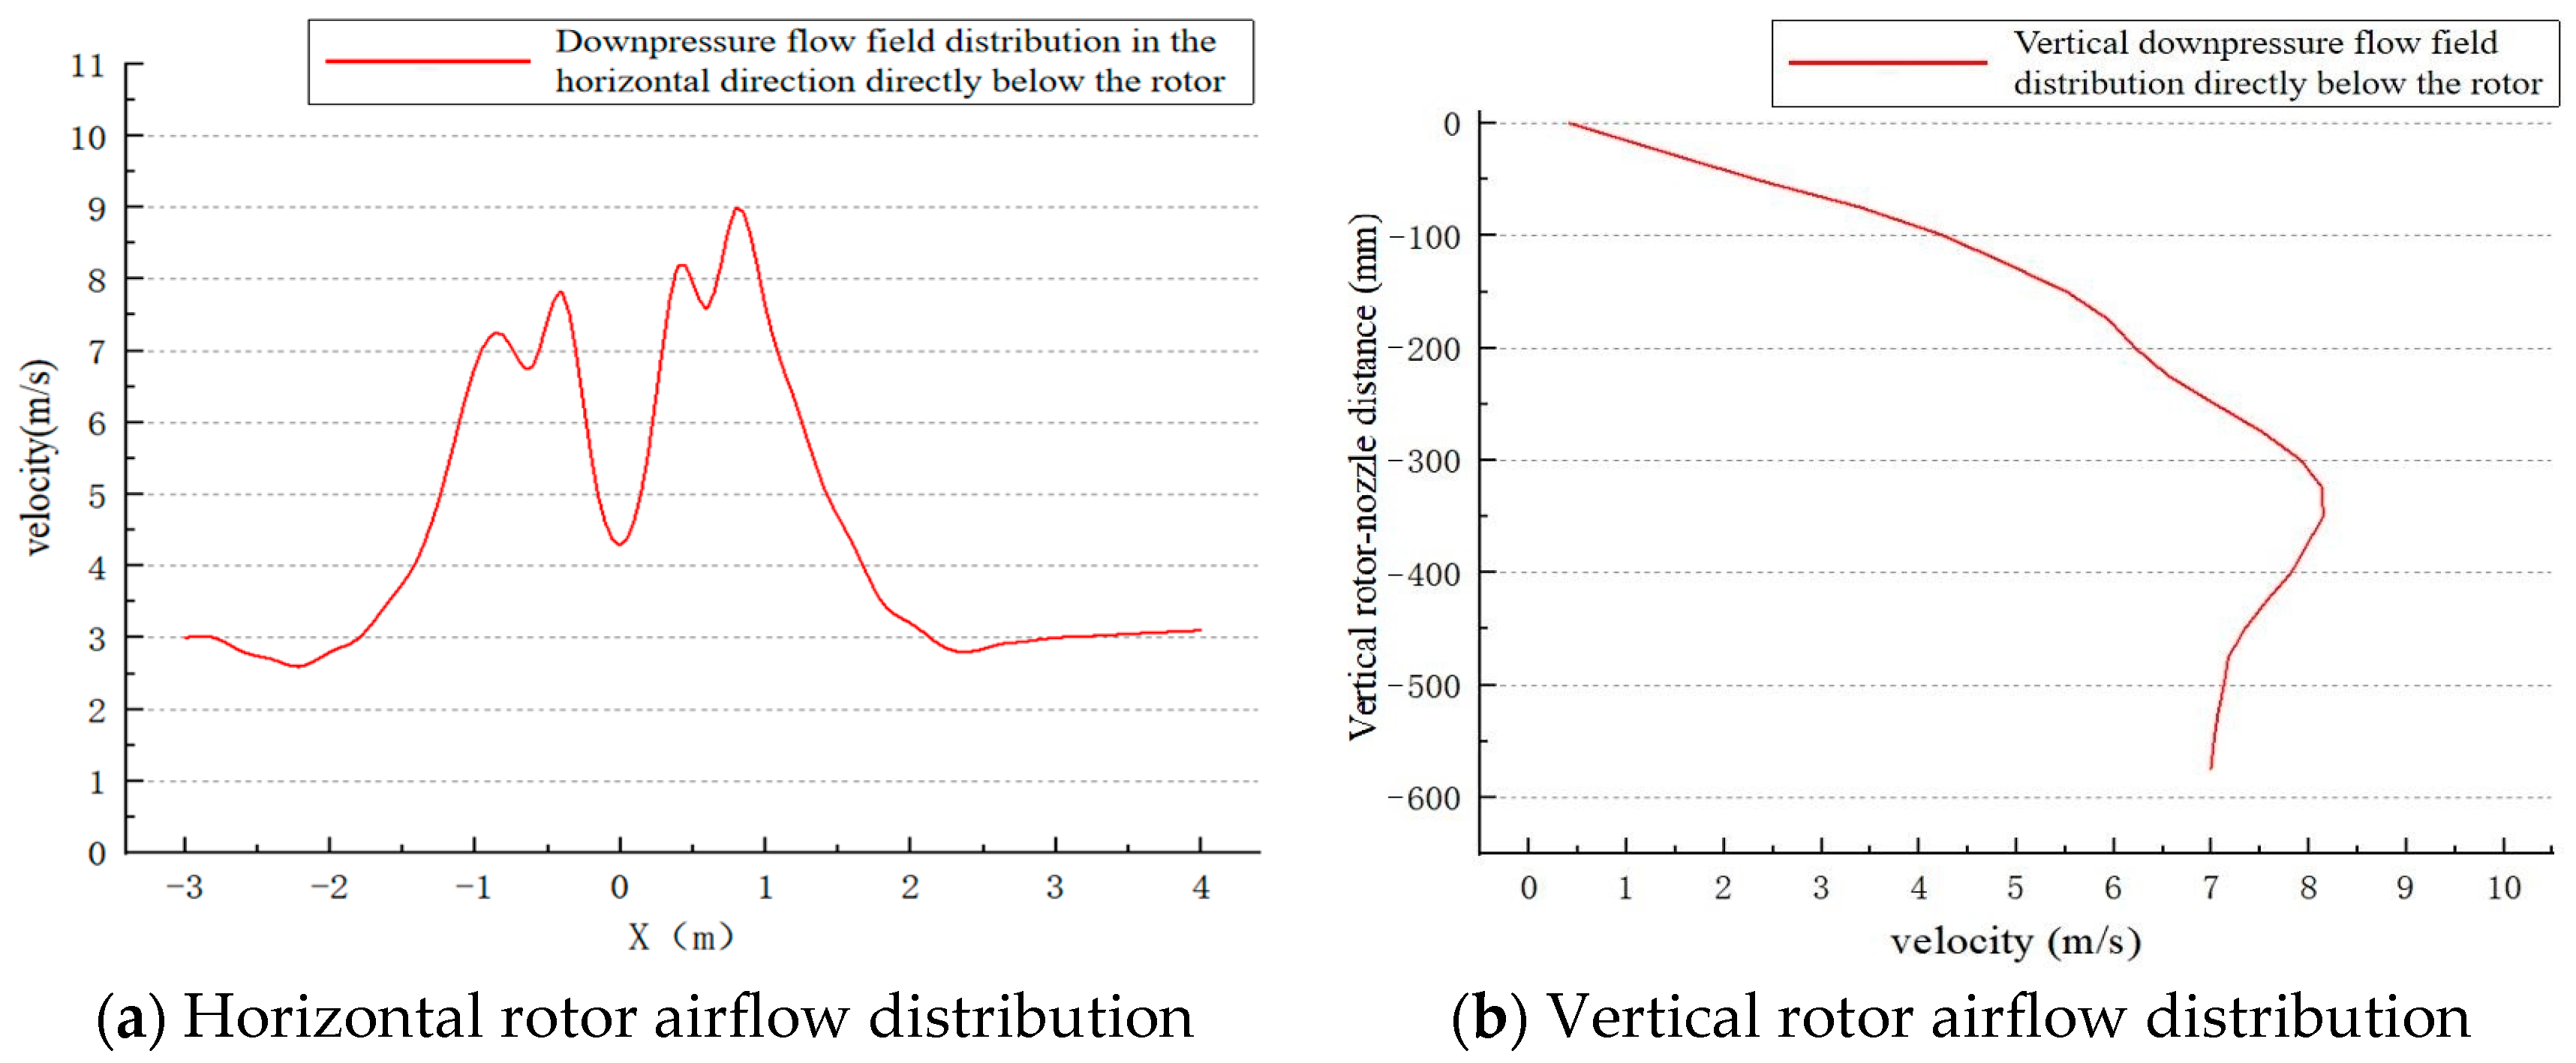
According to the distribution law of rotor airflow, it can be seen that the airflow around the center of the rotor was larger, decreasing from the center to the surrounding area. In addition, with the decrease of the space height, the rotor airflow first strengthened and then gradually weakened. Under the rotor within the range of 0.25–0.5 m, the rotor airflow intensity reaches its maximum value, with an airflow velocity of approximately 8 m/s. However, when the space height drops to 0.75 m, the rotor airflow intensity becomes significantly weaker. In order to accurately reflect the intensity distribution of rotor airflow in the horizontal direction, a horizontal coordinate line was set below rotor, and the diagram was drawn according to the speed results (Figure 4a). It can be seen that the intensity of airflow generated by the rear rotor was greater than that of the front rotor during the forward flight of the UAV, and the maximum difference of airflow intensity could reach 1.33 m/s. In addition, the airflow intensity below the center of the fuselage was significantly weaker than it was directly below the rotor; the difference between the airflow intensity below the fuselage and that of the rear rotor reached more than 4.89 m/s. Similarly, in order to accurately reflect the intensity distribution of rotor airflow in the vertical direction, the distribution of airflow intensity vertically downwards starting from the rotor plane was output, and the distribution of airflow velocity with spatial height was plotted. As can be seen from Figure 4b, the intensity of rotor airflow presented a trend of first strengthening and then weakening within a vertical spatial range of 600 mm directly below the rotor, which is consistent with the airflow velocity distribution in Figure 4. In the range of 0–360 mm directly below the rotor, the rotor airflow speed gradually increased, with the maximum airflow velocity reaching 8.1 m/s. When the vertical distance exceeded 360 mm, the rotor airflow velocity gradually decreased. Therefore, according to the preliminary analysis of the spatial distribution of rotor airflow, in order to obtain a large initial downward movement velocity of droplets sprayed by the nozzle for aerial spraying operation, the optimal installation position of the nozzle should be within the range of 300–400 mm directly below the rotor.

4.2. Analysis of Droplet Deposition Movement

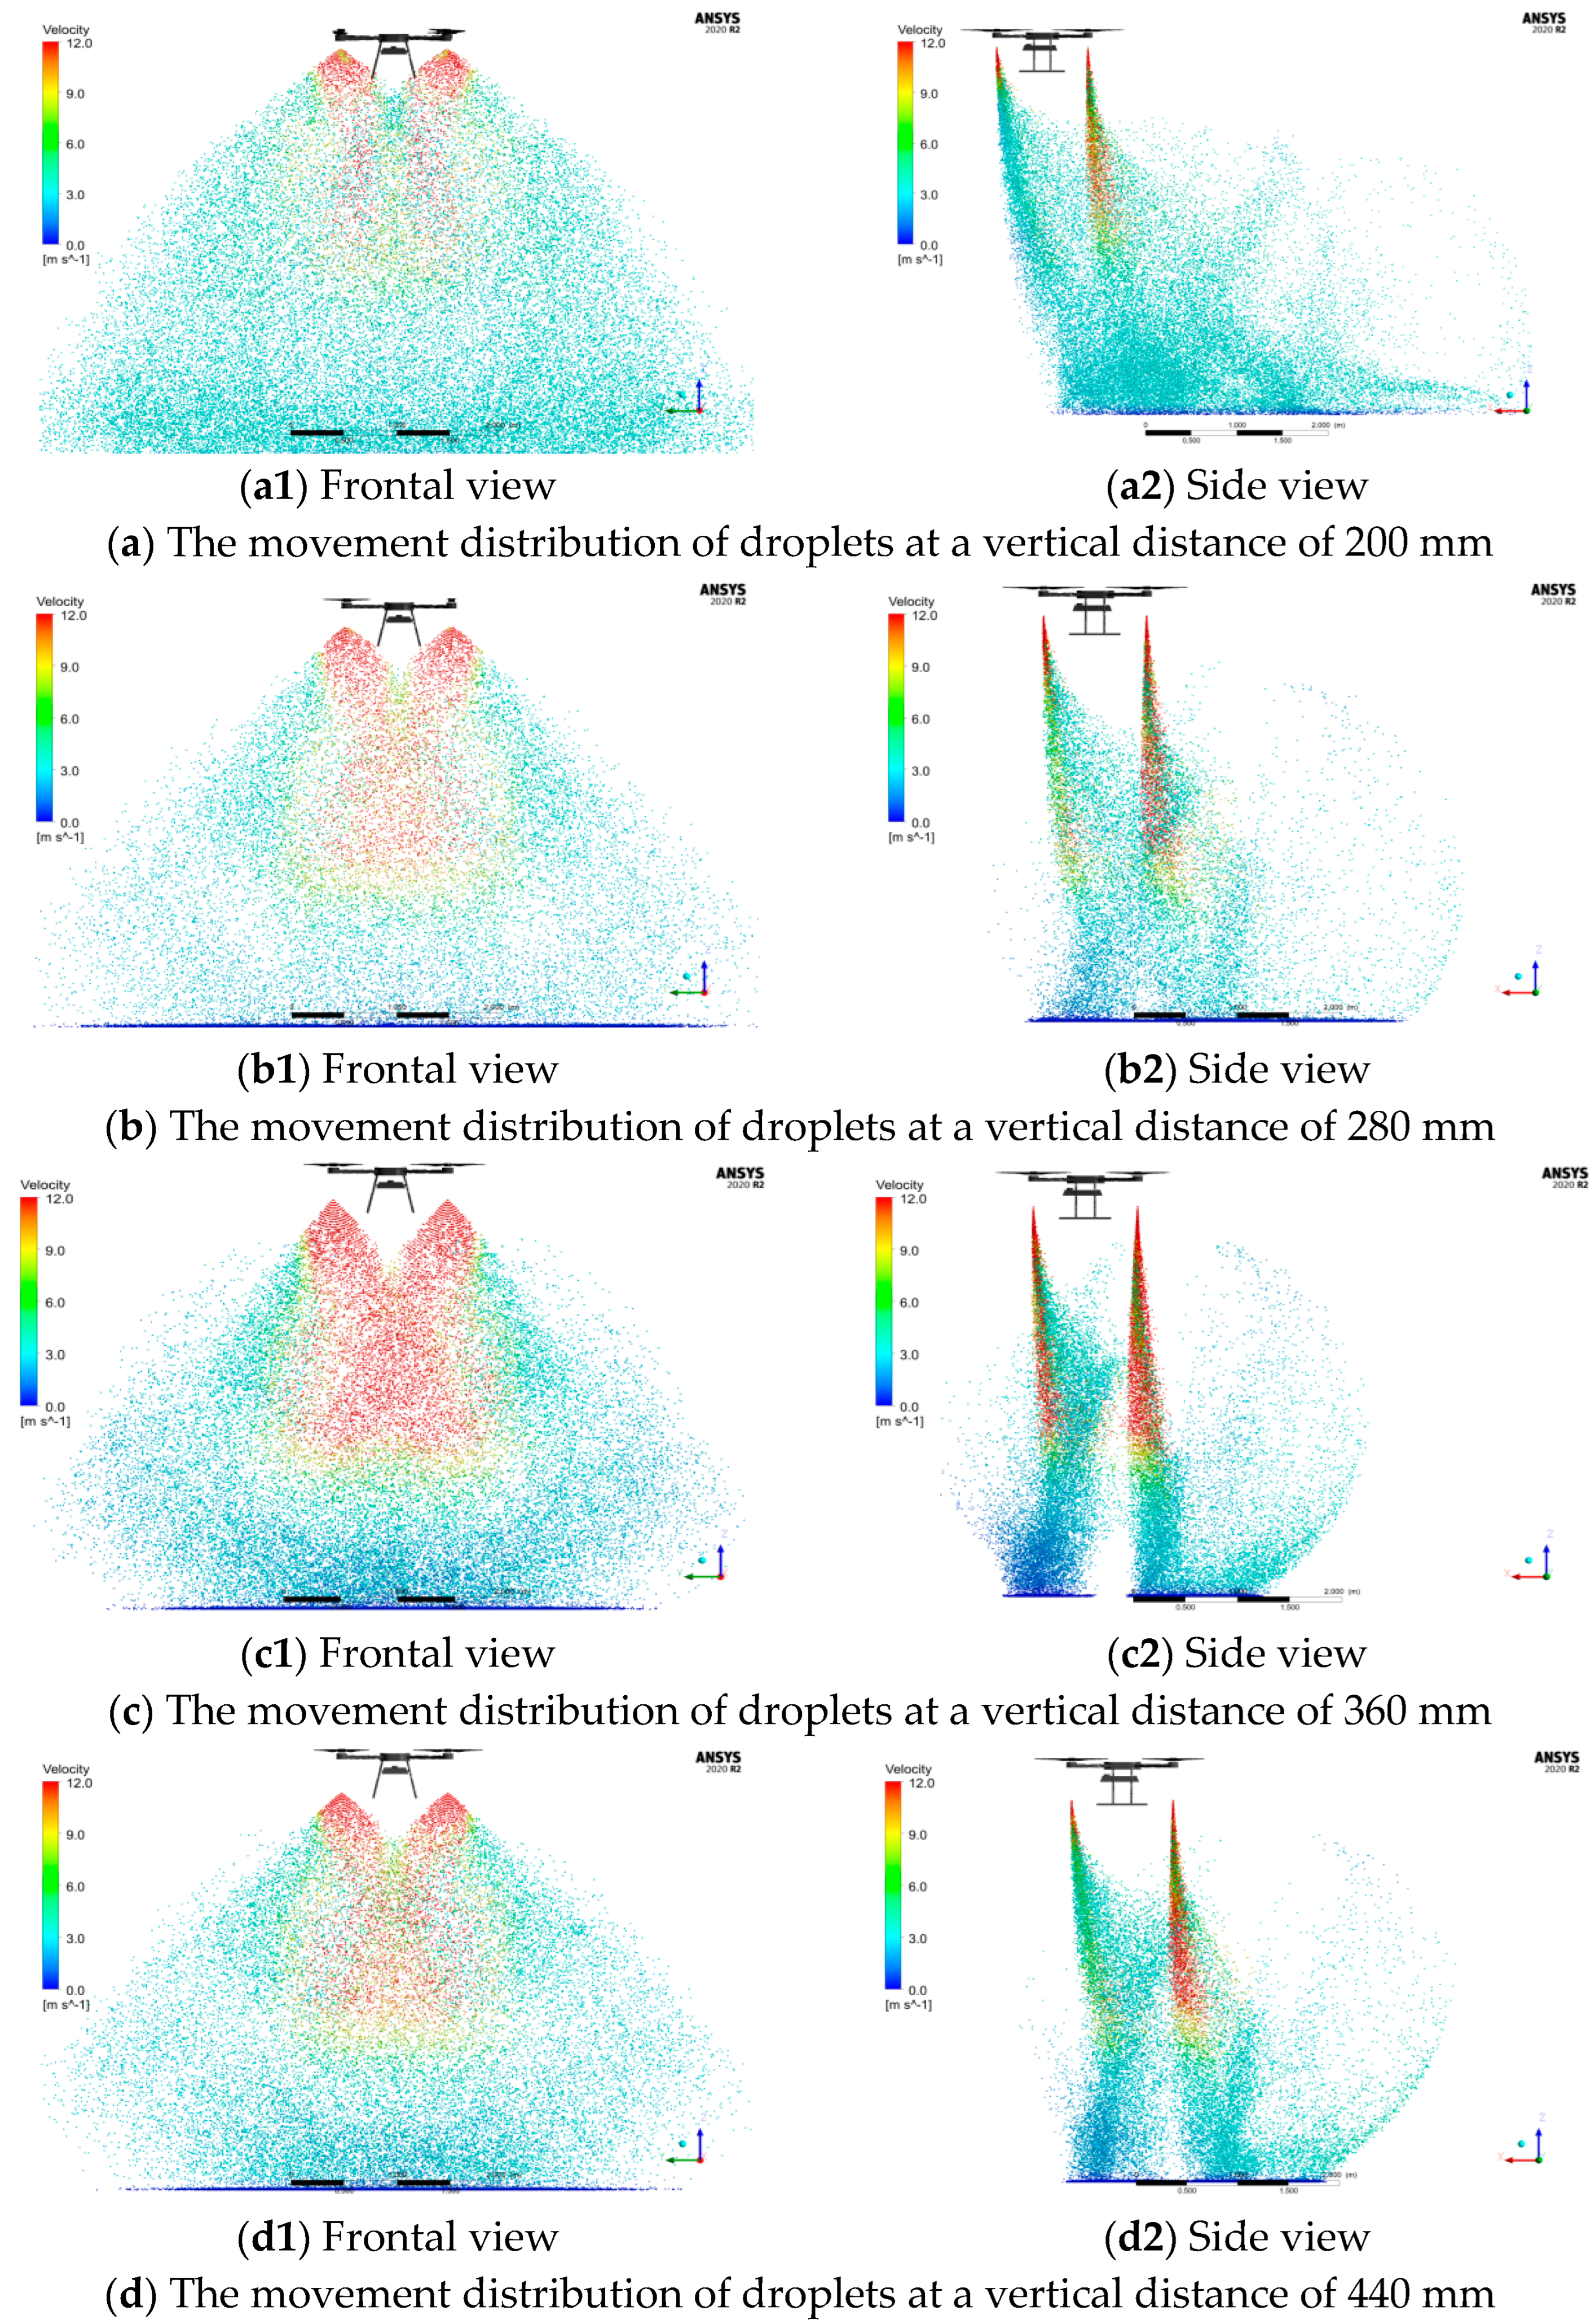
In the simulation test of the droplet movement process, the rotor airflow distribution reached a stable state after 2 s, and an appropriate nozzle spraying time was set. Droplets were immediately entrained by rotor airflow and drifted towards the ground after being ejected by the nozzle, while also being affected by the relative wind field generated by the flight motion and moving backwards. As shown in Figure 5, the movement distribution of the droplet deposition at four different rotor–nozzle distances was simulated, including main view, side view, top view, and full view.
It can be seen from Figure 5 that the velocity of droplets after leaving the nozzle was mainly affected by rotor airflow, and the velocity of droplets moving closer to the center of the rotor was the highest. With the further deposition of droplets to the ground, the influence of rotor airflow on the movement of droplets was weakened, and the movement speed of droplets gradually decreased under the influence of air resistance. By comparing the four side views of the movement of droplets, it can be seen that with the increase of rotor–nozzle distance, the average velocity of the droplet group nearest to right below the rotor increased first and then decreased. At the distances of 200, 280, 360, and 440 mm, the average velocities of droplets were 7.35, 8.12, 8.9, and 8.42 m/s, respectively. Combined with the simulation results of airflow distribution under different spatial heights, it can be seen that the airflow first increased and then gradually decreased, and the airflow intensity reached the maximum near the vertical distance of 350 mm, at which time droplets deposited on the ground under the stress of rotor airflow.
To sum up, the deposition movement of droplets would be affected by factors such as the rotor airflow, the relative wind field, and air resistance generated by flight movement. In order to ensure that droplets can obtain a satisfactory deposition effect, it can be seen that the rotor–nozzle distance should be selected as about 360 mm based on the above analysis. Droplets have a larger motion speed after leaving the nozzle and a minimal degree of drift in this condition.

4.3. Cloud Map Analysis of Droplet Deposition Concentration

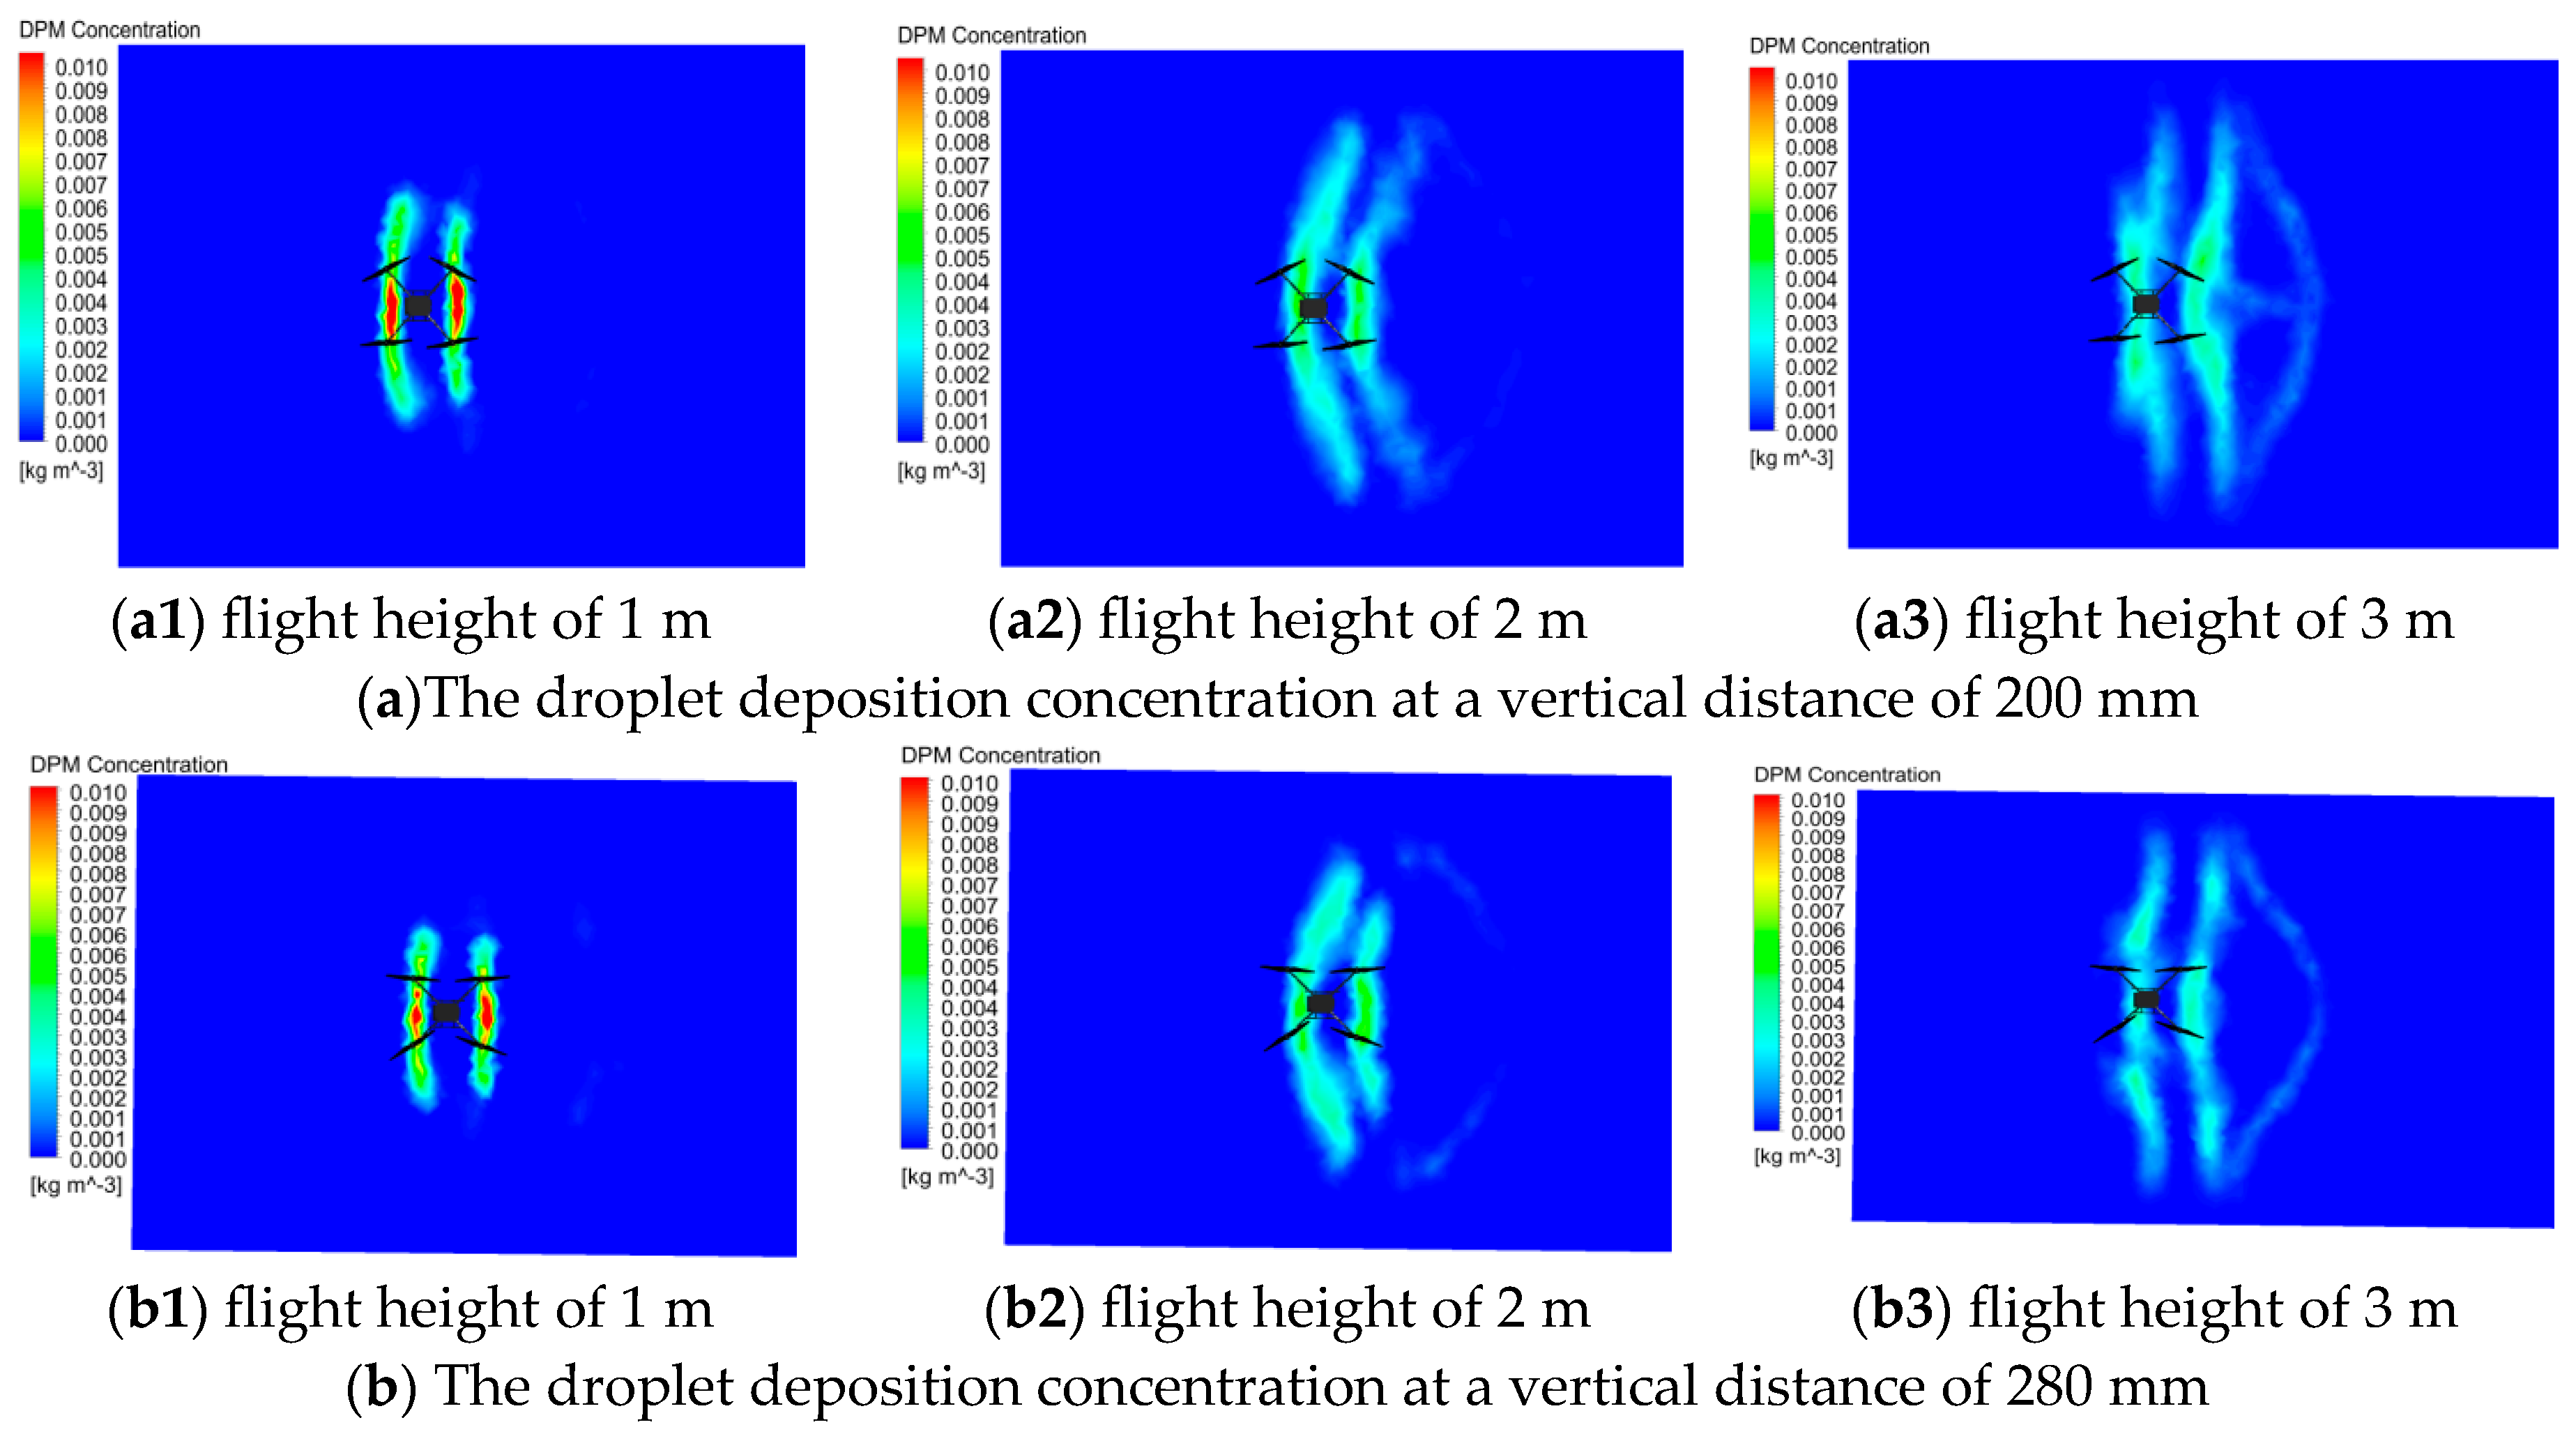
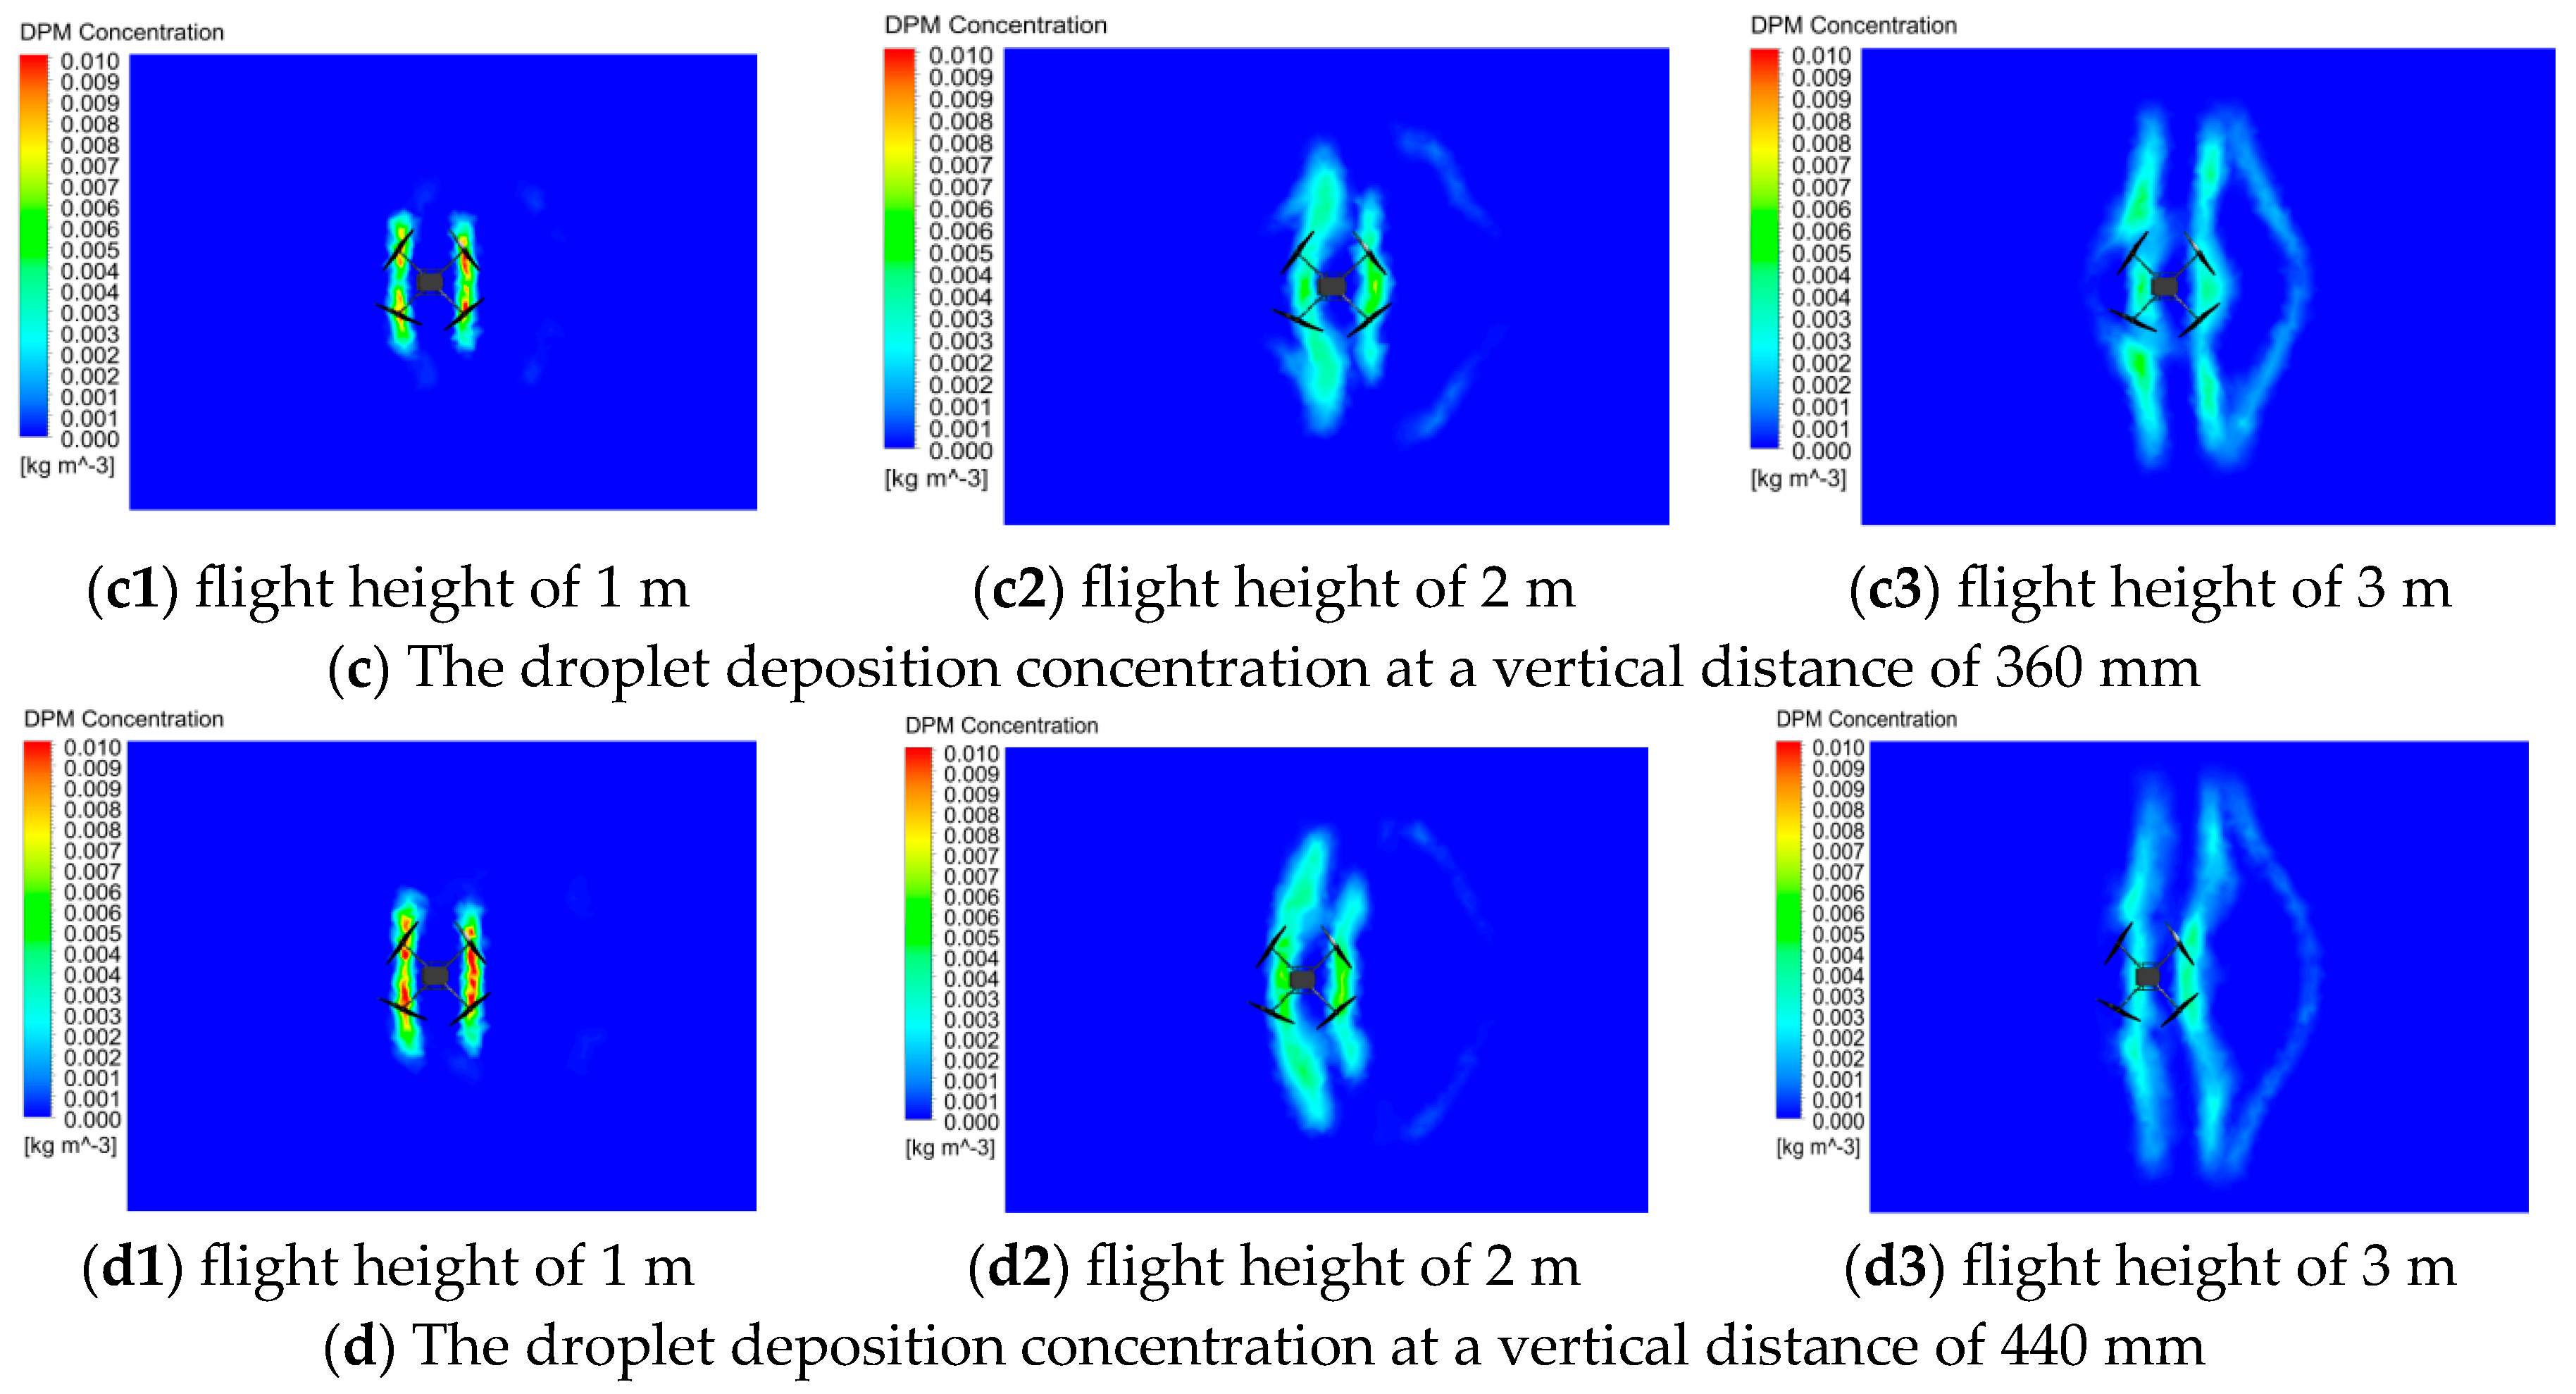
In order to calculate the droplet deposition at different crop canopy heights under different rotor–nozzle distances of plant protection UAVs, the cloud map of droplet deposition concentration at different flight heights was simulated by CFD. Figure 6 shows the cloud map of droplet deposition concentration under the condition of flight heights of 1, 2, 3, and 4 m. The change in color of the icon on the left from red to blue indicates the change in the level of droplet deposition concentration. It can be seen from the figure that there were great differences in the distribution of droplet deposition concentration at different rotor–nozzle distances. In the condition of a flight height of 1 m, the cloud pattern of droplet deposition concentration at four different vertical distances between rotor and nozzle presents a narrow strip shape, indicating that the distribution range of droplets is small and mainly concentrated right below the fuselage. Furthermore, the maximum concentration of droplet deposition exceeds 0.010 kg/m3, indicating poor distribution uniformity of droplet deposition. The main reason is that droplets cannot fully diffuse under the action of rotor airflow due to the limited space for droplet deposition. When the flight height increases to 2 m, it can be found from the cloud map of droplet deposition concentration that with the increase of deposit space, droplets begin to spread to both sides of the fuselage, which enlarges the effective deposition distribution range and improves the uniformity of droplet deposition. However, the comparison of the cloud pattern of droplet deposition concentration at four different vertical distances between rotor and nozzle showed that the droplet deposition distribution appeared in a circular arc shape along the flight direction and drifted backward in the flight direction due to the influence of the relative airflow when the vertical distance was 200, 280, and 440 mm. However, at the vertical distance of 360 mm, the droplet deposition distribution still remained in an elongated shape, with the maximum concentration of droplet deposition reaching 0.0073 kg/m3, indicating that droplets can maintain a good deposition effect under the influence of the rotor downwash airflow. Compared with the cloud map of droplet deposition at a flight height of 3 m, it can be seen that the shape of deposition distribution changed less, but droplets were further diffused. Droplets began to drift to both sides of the fuselage, and the concentration of droplets decreased significantly at the vertical distances of 200 and 440 mm. Only a small volume of droplets gathered under the fuselage, and most of the droplets had drifted, so the spraying effect was poor.
At present, for the spraying operations of rice, corn, wheat, and other major crops, the suitable flight height recommended by the UAV enterprise is generally 2 m. In this condition, the effective deposition distribution range of droplets sprayed by plant protection UAVs is relatively large, and the deposition uniformity of droplets is better. However, due to the influence of rotor downwash airflow and relative wind field caused by flight motion, droplets will still drift partially. According to the analysis of droplet deposition concentration at different rotor–nozzle distances, it can be seen that the effect of droplet deposition distribution was better at the vertical distance of about 360 mm, with the droplets on both sides drifting less, which would result in a better spraying effect.

5. Field Trial Validation

5.1. Materials and Methods

5.1.1. Instrument and Equipment

In order to verify the simulation results, the EFT-410S four-rotor plant protection UAV was used for the field spray test, which was consistent with the simulation model. The nozzles were installed directly below the rotor and connected through a vertical spray rod. According to the requirements of the test parameter setting, the spray rod can be extended or shortened in the vertical direction to adjust the rotor–nozzle distance. In the test, the Lu120-02 fan-shaped nozzle was used for spraying, and the spray flow rate was 2.0 L/min.
In the test, droplet deposition data were collected using water-sensitive paper (Syngenta Plant Protection Co., Ltd., Basel, Switzerland) as droplet collection cards, with a size of 26 mm × 76 mm. A HP Scanjet200 flatbed scanner (Hewlett-Packard, Palo Alto, California, USA) was used to scan the collected water-sensitive paper to obtain a gray image of the droplets. The DepositScan software (v1.0) was used to analyze the gray image and obtain the data of droplet deposition on water-sensitive paper, including droplet deposition rate, deposition density, coverage rate, etc.
The Kestrel NK-5500 weather station (Nielsen Kellerman Company, Chandler, AZ, USA) was used to collect environmental meteorological data during the test, which was used to monitor and record environmental parameters such as ambient wind speed and wind direction in the field. In addition, the droplet collection equipment also included PVC pipe (1 m), a double-ended universal clamp, rubber gloves, sealed bags, etc.

5.1.2. Test Method

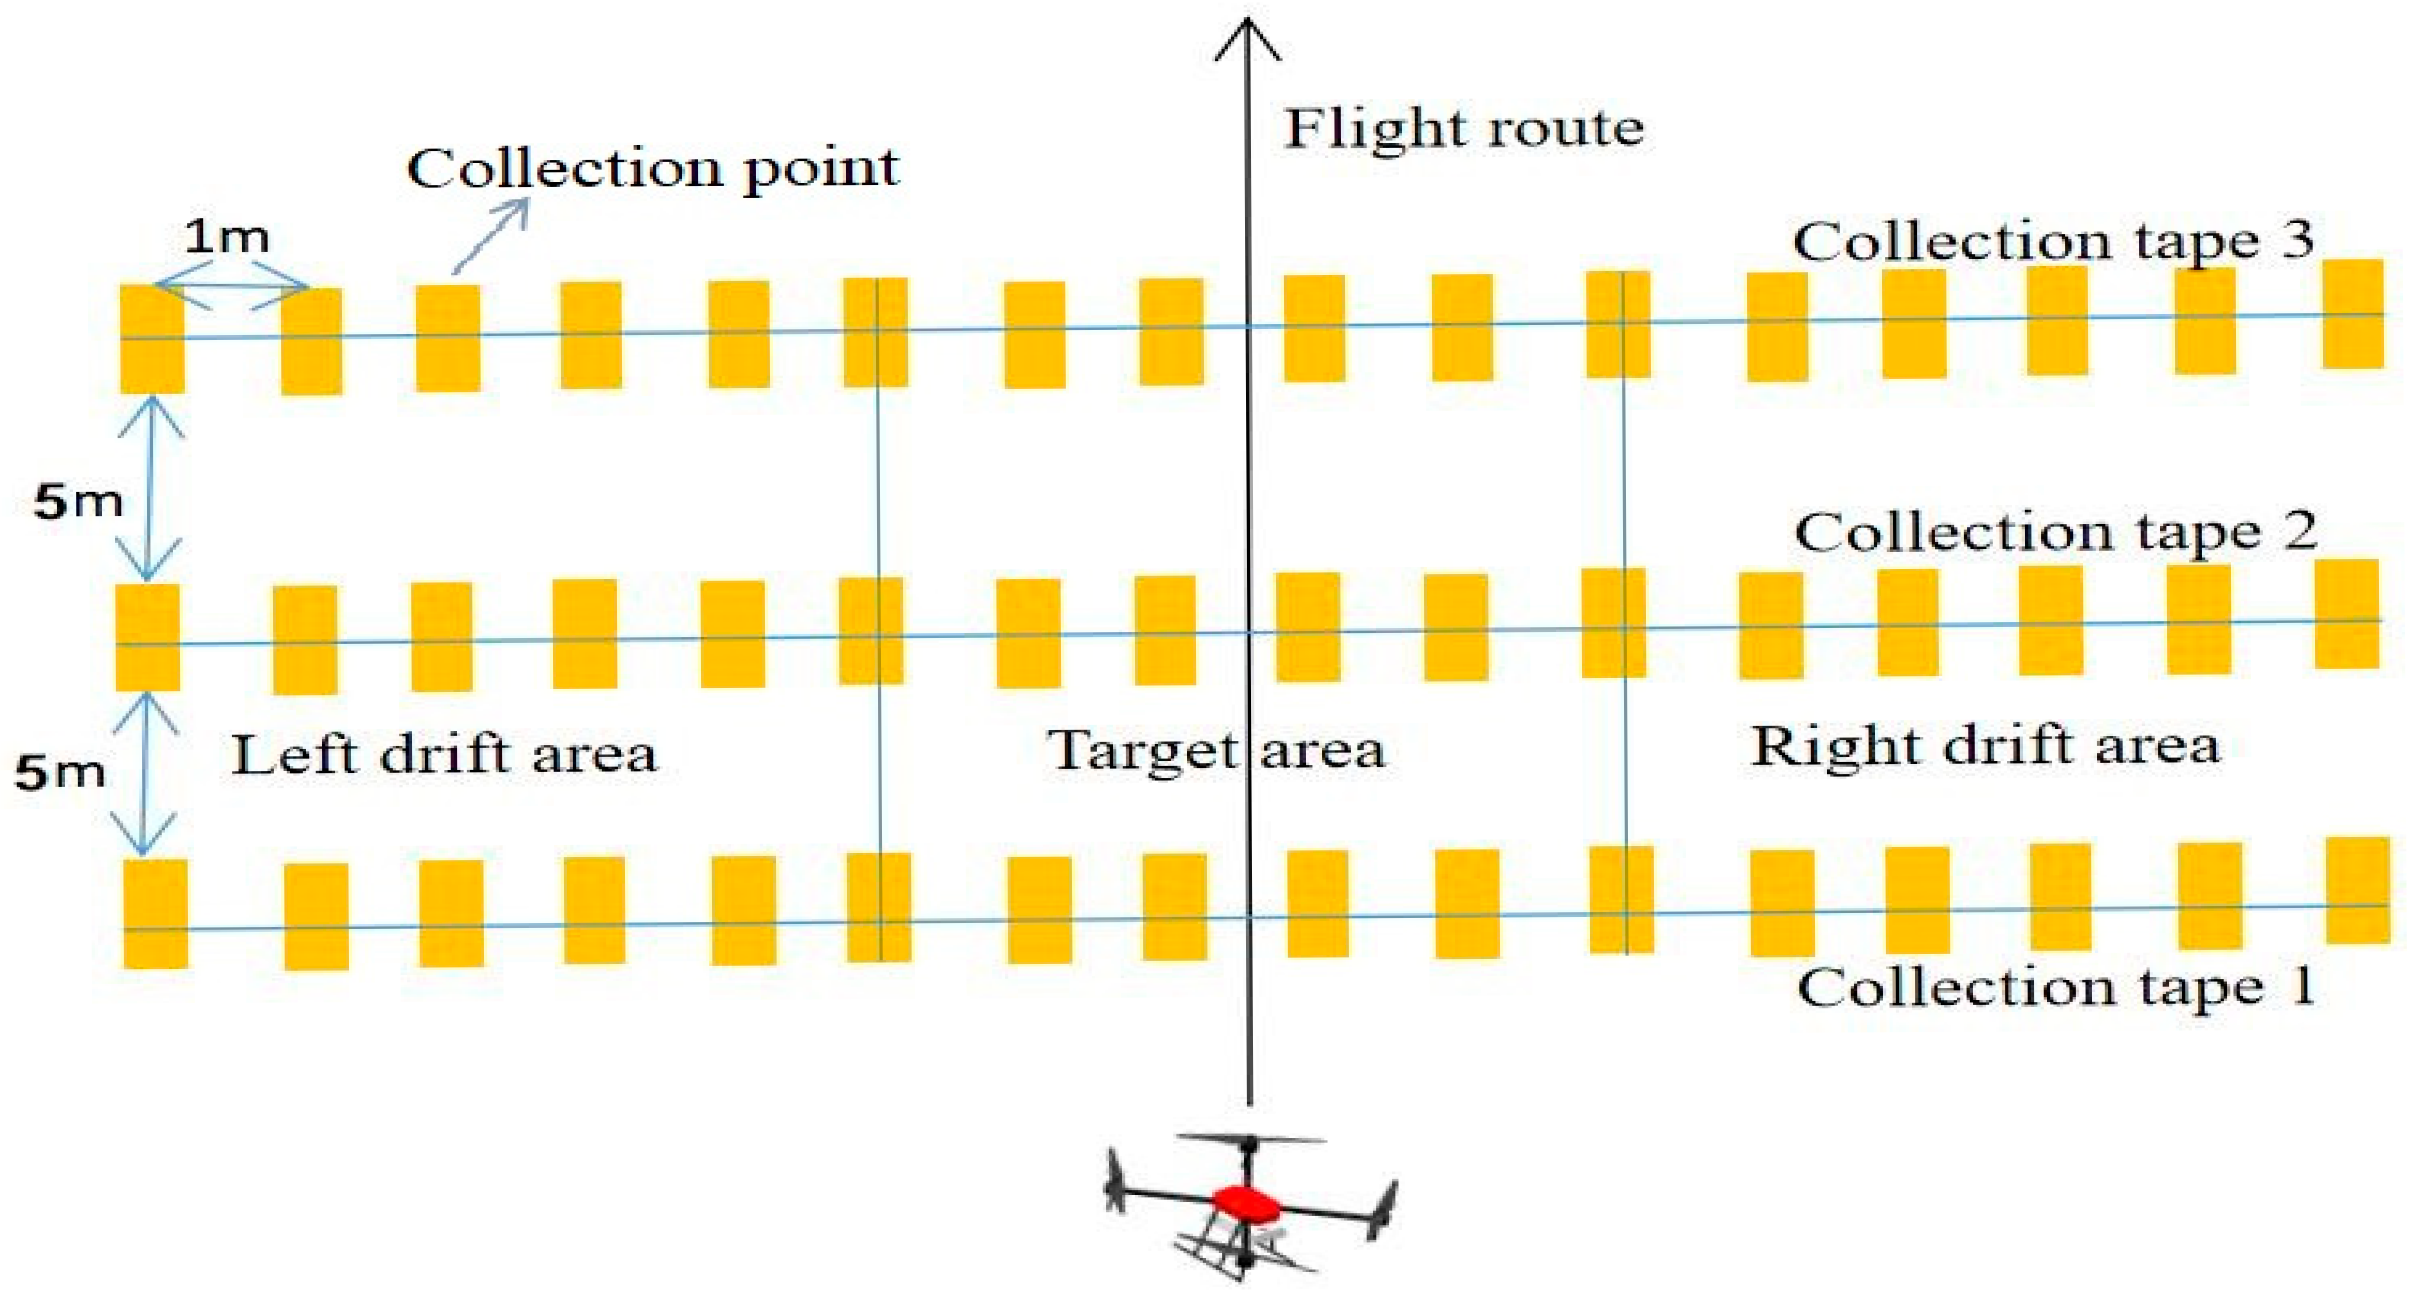
The test was conducted on 27 September 2023 and test site was located in the teaching and research base of South China Agricultural University, Guangzhou, Guangdong Province. The test scheme is shown in Figure 7. A droplet collection tape with a length of 15 m was arranged perpendicular to the flight direction of the UAV in a sufficiently large field. A target area with a width of 5 m was set in the middle of the collection tape with reference to the effective spray width of plant protection UAVs provided by the manufacturer, and 5 m wide drift areas were set on both sides of the target area. Droplet collection points with an interval of 1 m were set on the droplet collection tape. At each collection point, water-sensitive paper was fixed on a PVC round pipe with double-end clips. The water-sensitive paper was placed about 1 m away from the ground to simulate the height of a crop canopy. According to the above collection and distribution method, each collection tape had a total of 16 collection points for droplets, numbered 1#~16# from left to right. In addition, in order to reduce the possible test errors in the spraying process, three replicates of the collection tape were used, and the interval distance between each collection tape was 5 m.
The weather station was placed next to the test area, and the frequency of environmental meteorological data collection was set at 1 Hz. During the test, the ambient temperature was about 21 °C and the relative humidity of the air was 60%–63%. In particular, in order to avoid the influence of ambient wind on droplet deposition distribution, the spray test was carried out under the conditions of no wind or wind speed less than 2 m/s.

5.1.3. Operation Parameters

The test was to study the influence of rotor airflow on droplet deposition distribution of plant protection UAVs at different rotor–nozzle distances. Therefore, the test was mainly designed for the parameter of rotor–nozzle distance. Consistent with the parameters in the simulation of Section 3, the rotor–nozzle distances were set to four groups of 200, 280, 360, and 440 mm for the field spray test. Based on the recommendation of spray operation parameters, the flight height was set to 2.5 m and the flight speed was set to 5 m/s.
During the test, the spray system was turned on when the plant protection UAV flew to a distance of about 10 m away from the first collection tape, and the spraying was stopped after flying over the droplet collection area according to the designated route, so as to reduce the impact of non-test liquid droplets on the test results. The rotor–nozzle distance was adjusted to 200, 280, 360, and 440 mm in sequence, and the spray test was repeated until these tests were completed.

5.1.4. Data Processing and Analysis

After the completion of each spray test, it is necessary to wait for the droplets on the water-sensitive paper to dry fully. These water-sensitive papers were packed in a sealed bag with a label according to the sequence of collection points and brought back to the laboratory for data processing. These water-sensitive papers were scanned by a scanner one by one. Then the scanned images were processed and analyzed by the image processing software DepositScan.
In order to characterize the droplet drift of plant protection UAVs at different rotor–nozzle distances, the droplet drift rate was used to assess droplet drift volume. The calculation formula for droplet drift rate is as follows:
R d = T N / T E + T N × 100 %
where Rd represents the droplet drift rate, %; TN represents the total volume of droplets deposited in the non-target area, μL·cm−2; and TE represents the total volume of droplets deposited in the target area, μL·cm−2.
In addition, to further demonstrate the influence of rotor airflow at different rotor–nozzle distances on the deposition distribution of droplets in aerial spraying, significance of difference analysis and one-way ANOVA were conducted on the test results using SPSS software (v25.0), and their significance was tested (p < 0.05).

5.2. Test Results and Analysis

5.2.1. Analysis of Droplet Deposition Distribution in the Target Area

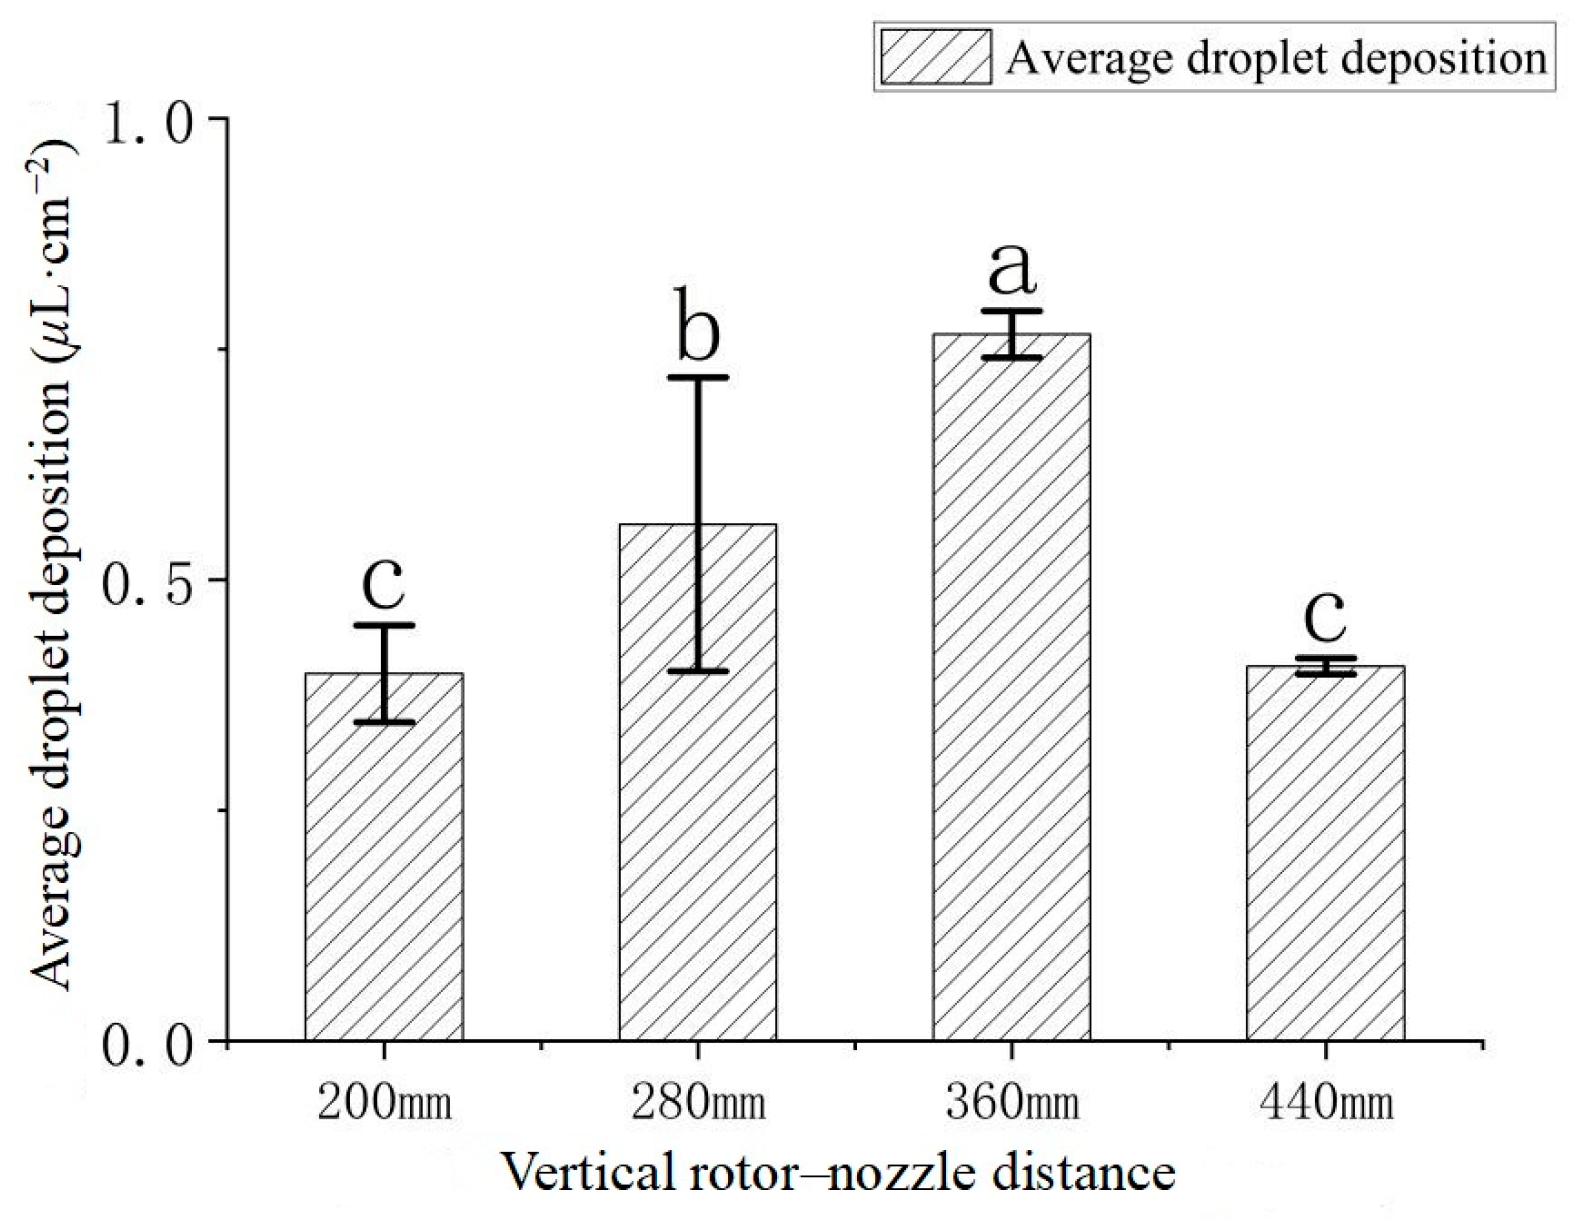
As shown in Table 2, the results of droplet deposition collected in the target area in four group tests with the rotor–nozzle distances of 200, 280, 360, and 440 mm are presented. The average volume of droplets deposited in the target area in the four group tests were 0.398, 0.560, 0.766, and 0.406 μL·cm−2, respectively. The amount of droplet deposition varied with the different rotor–nozzle distances. With the increase in vertical distance, the number of droplets deposited in the target area increased first. However, when the distance increased from 360 mm to 440 mm, the amount of droplet deposition decreased sharply from 0.766 μL·cm−2 to 0.406 μL·cm−2, a decrease of about 47%. Based on the analysis of the simulation results in Section 3, it can be concluded that the reason for this phenomenon is the difference in airflow intensity under the rotor. In the range of 0–350 mm below the rotor, the rotor downwash airflow velocity gradually increases, while when the vertical distance exceeds 350 mm, the rotor downwash airflow velocity gradually decreases. The velocity of droplet deposition was affected by the rotor airflow intensity, and droplets with greater velocity were deposited in the target area in a shorter time, thereby affecting the distribution characteristics of droplet deposition. With the increase of the rotor–nozzle distance, the airflow forcing the downward movement of droplets first increased and then weakened, and the amount of droplet deposition in the target area also first increased and then decreased. The maximum airflow intensity was located at about 350 mm below the rotor, which forced more droplets to deposit in the target area.
In order to further analyze whether there are significant differences in the droplet deposition at different rotor–nozzle distances, a significant analysis was conducted on the average amount of droplet deposition in the target area, and the results are shown in Figure 8. As can be seen from the figure, there were significant differences in droplet deposition between the vertical distances of 200, 280, and 360 mm, (p < 0.05) while there was no significant difference in droplet deposition between the vertical distances of 200 and 440 mm (p > 0.05). The results were consistent with the above analysis; that is, the different rotor–nozzle distances led to a different intensity of rotor downwash airflow, which resulted in a difference in the volume of droplets deposited in the target area.

5.2.2. Analysis of Droplet Drift

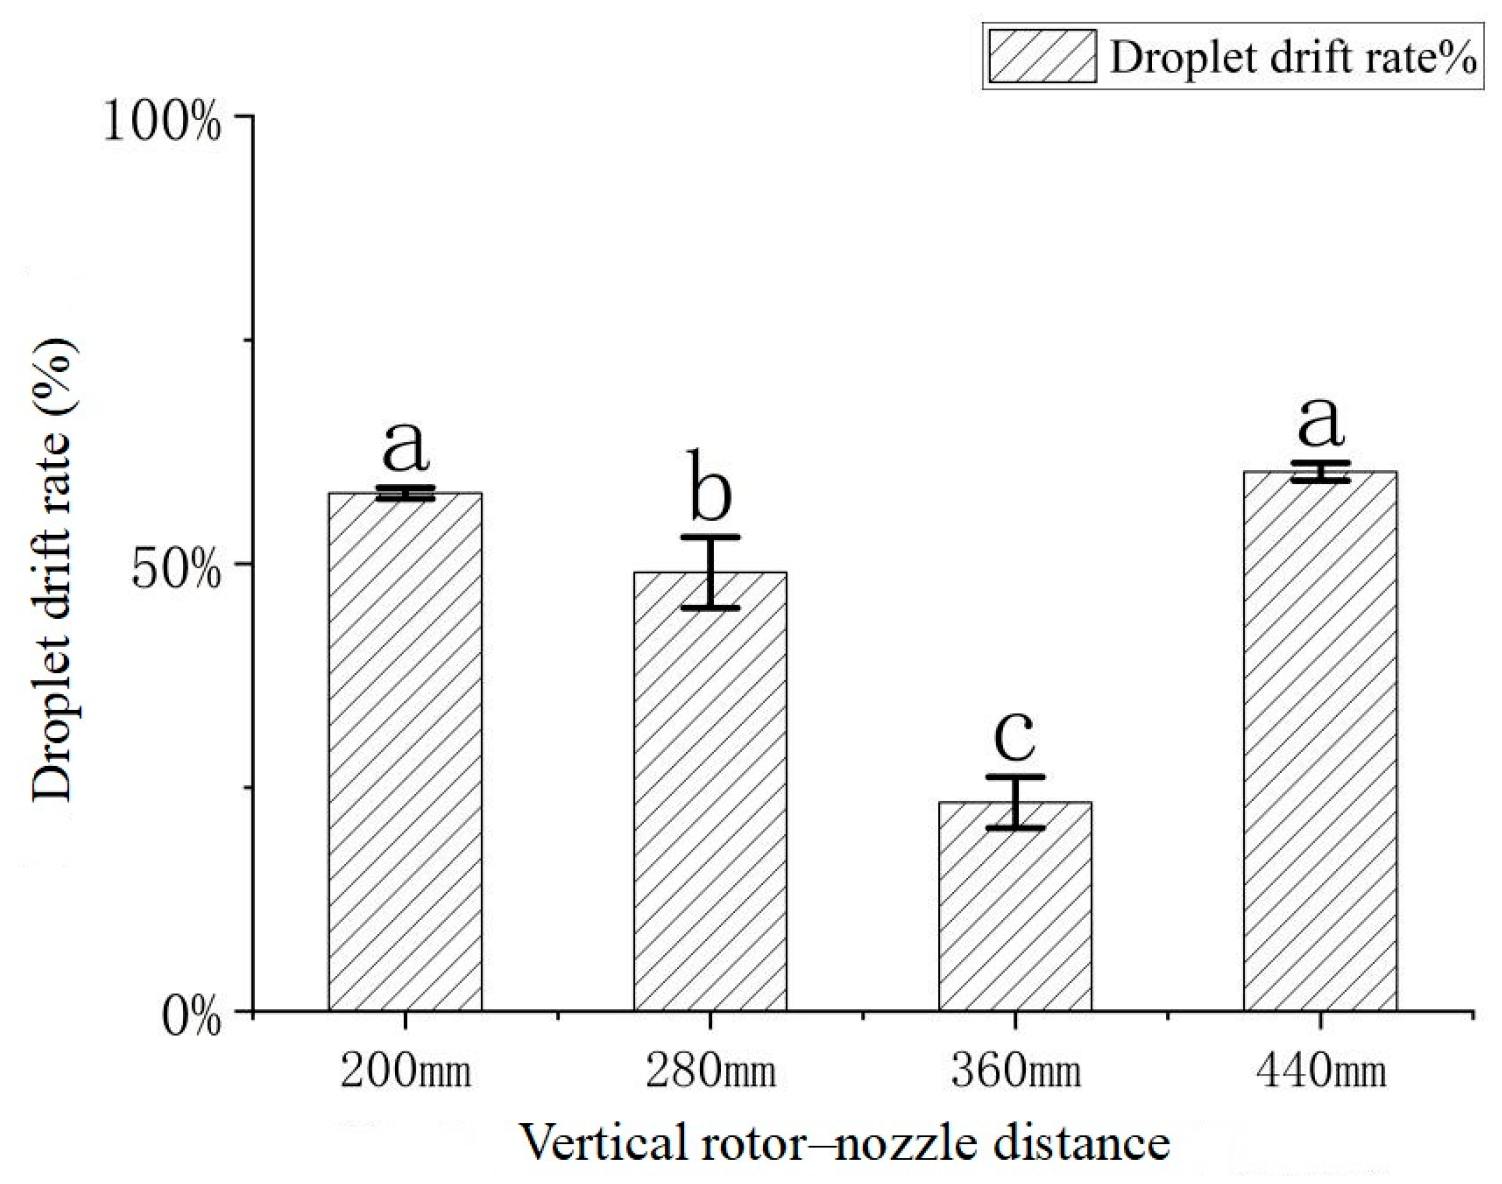
Table 3 shows the droplet drift of plant protection UAVs at four different rotor–nozzle distances. It can be seen that the volume of droplets deposited in the drift area was different at different vertical distances. In the four tests, the average amount of droplet drift in the drift area was 0.546, 0.536, 0.235 and 0.617 μL·cm−2, respectively. With the increase of rotor–nozzle distance, the volume of droplets deposited in the drift area first decreased and then increased. When the vertical distance increased from 200 to 360 mm, the drift rate of droplets decreased from 57.87% to 23.31%. As the vertical distance increased to 440 mm, the drift rate of droplets increased to 60.27%, and the maximum amount of droplet drift was reached. The phenomenon of droplet drift was consistent with the droplet deposition in the target area. Based on the simulation results of rotor airflow distribution and the droplet deposition cloud map in Section 3, it can be seen that the rotor airflow intensity was enhanced when the vertical distance increased to 360 mm. The enhanced rotor airflow significantly promoted the downward movement of droplets, resulting in more droplets depositing in the target area and fewer droplets drifting. However, as the vertical distance increased to 440 mm, the rotor airflow intensity and the downward movement of droplets were also weakened. The result was that droplets easily drifted a lot under the influence of various external wind fields or airflows.
Similarly, in order to further analyze whether there are significant differences in the droplet drift at different rotor–nozzle distances, a significance analysis was conducted on the average drift rate of droplets in the drift area, and the results are shown in Figure 9. It can be seen that there were significant differences in droplet drift between the vertical distances of 200, 280, and 360 mm (p < 0.05), while there was no significant difference in droplet drift between the vertical distances of 200 and 440 mm (p > 0.05). The results were consistent with the analysis of droplet deposition in the target area; there were significant differences in droplet deposition and drift at different rotor–nozzle distances.

5.3. Comparison of Simulation and Field Test Results

Combined with the simulated results of droplet deposition concentration, the simulation data of droplet deposition on the cross-section with the effective spray width of 5 m and the spray height of 3 m in the numerical simulation were statistically analyzed, and the simulation results were compared with the field test results, as shown in Figure 10. There was a certain deviation between the droplet deposition results of the field test and that of the numerical simulation at different rotor–nozzle distances, and the amount of droplet deposition in the numerical simulation was lower than that of field test. The main cause of the deviation is primarily the difference in spray application rates, and field trials are susceptible to interference from multiple factors. However, it can be seen from the line chart that the droplet deposition trends of the two have a good consistency. As the rotor–nozzle distance increased from 200 to 360 mm, the volume of droplets deposited in the target area increased. However, when the distance increased to 440 mm, the volume of droplets deposited in the target area decreased sharply. Although the numerical simulation results of droplet deposition have some deviation from the field test results, they can still guide the development of field tests and the reasonable setting of operation parameters to a certain extent, thereby achieving the goal of precise spray operation.

6. Conclusions

In this study, the rotor–nozzle distance of plant protection UAVs was taken as the research object; the distribution of rotor airflow and its effects on the droplet deposition of plant protection UAVs under various rotor–nozzle distances were analyzed and verified by numerical simulation and field tests. The main conclusions were as follows:
(1) The intensity of rotor airflow showed a trend of first strengthening and then weakening with the increase of the distance from the rotor, which was relatively high within the range of 300–400 mm below the rotor, and the maximum velocity of airflow could reach 8.1 m/s.
(2) The average velocity of the droplet groups followed a unimodal distribution with increasing rotor–nozzle distance, peaking at 8.9 m/s with a 360 mm vertical distance. At this optimal distance, enhanced deposition velocity near the ground promoted target crop coverage while minimizing drift losses.
(3) Droplet deposition concentration varied significantly across rotor–nozzle distances (p < 0.05). Optimal deposition efficiency was achieved at 360 mm, with a minimum drift rate of 23.31%.
(4) There was a certain deviation between the droplet deposition results of the field test and that of the numerical simulation, but the droplet deposition trends have a good consistency. Consequently, the simulation results can effectively inform field test design and operational parameter optimization to enhance precision spraying performance.

Author Contributions

Conceptualization, S.C. and Y.L.; methodology, X.X. and Z.L.; validation, X.X. and Z.W.; formal analysis, X.X. and Y.T.; investigation, X.X. and S.H.; resources, S.C. and Y.L.; writing—original draft preparation, X.X.; writing—review and editing, S.C.; visualization, Z.W., Y.T., and S.H.; supervision, S.C. and Y.L.; project administration, S.C.; funding acquisition, Y.L. All authors have read and agreed to the published version of the manuscript.

Funding

This study was funded by the Key R&D Project of Ningxia Hui Autonomous Region (2024BBF01013), the National Key Research and Development Plan Project (2023YFD2000200), and the 111 Project (D18019).

Institutional Review Board Statement

Not applicable for studies not involving humans or animals.

Data Availability Statement

The raw data supporting the conclusions of this article will be made available by the authors on request.

Acknowledgments

We deeply thank reviewers and editors for giving relevant revision advice for improvement of the paper.

Conflicts of Interest

The authors declare no conflicts of interest.

References

  1. Hu, S.; Xu, X.; Liu, J.; Guo, J.; Guan, R.; Zhou, Z.; Lan, Y.; Chen, S. Movement Characteristics of Droplet Deposition in Flat Spray Nozzle for Agricultural UAVs. Agriculture 2024, 14, 1994. [Google Scholar] [CrossRef]
  2. Zhou, Q.; Zhang, S.; Lin, T.; Jiao, Y.; Cai, C.; Xue, C.; Ye, J.; Xue, X. The Impact of Fluroxypyr Drift on Soybean Phytotoxicity and the Safety Drift Thresholds. Agriculture 2024, 14, 2203. [Google Scholar] [CrossRef]
  3. Tang, Q.; Zhang, R.; Chen, L.; Xu, G.; Deng, W.; Ding, C.; Xu, M.; Yi, T.; Wen, Y.; Li, L. High-accuracy, high-resolution downwash flow field measurements of an unmanned helicopter for precision agriculture. Comput. Electron. Agric. 2020, 173, 105390. [Google Scholar] [CrossRef]
  4. Jin, Z.; Guo, S.; Li, S.; Yu, F.; Xu, T. Research on the rice fertiliser decision-making method based on UAV remote sensing data assimilation. Comput. Electron. Agric. 2024, 216, 108508. [Google Scholar] [CrossRef]
  5. Yu, F.; Xiang, S.; Xu, C.; Jin, Z. PIOSL-PRO: Construction of the PIOSL Model Considering the Distribution of Multiple Elements. IEEE T. Geosci. Remote. 2024, 62, 1–12. [Google Scholar]
  6. Huang, J.; He, W.; Yang, D.; Lin, J.; Ou, Y.; Jiang, R.; Zhou, Z. Quantity Monitor Based on Differential Weighing Sensors for Storage Tank of Agricultural UAV. Drones 2024, 8, 92. [Google Scholar] [CrossRef]
  7. Zhang, H.; Qi, L.; Wu, Y.; Musiu, E.; Cheng, Z.; Wang, P. Numerical simulation of airflow field from a six–rotor plant protection drone using lattice Boltzmann method. Biosyst. Eng. 2020, 197, 336–351. [Google Scholar] [CrossRef]
  8. Fan, G.; Liu, Z.; Qin, Y.; Long, B.; Li, H.; Li, J. Airflow characteristics of rotorcraft plant protection UAV operating in rice fields. Biosyst. Eng. 2023, 226, 209–222. [Google Scholar] [CrossRef]
  9. Wei, X.; Zhang, Z.; Li, H.; Wu, H.; Lv, J.; Wu, L.; Zhou, M.; Li, J. Influences of wind vortex intensity of rotor UAV on rice morphology and yield. Precis. Agric. 2023, 24, 1766–1791. [Google Scholar] [CrossRef]
  10. Zhang, J.; He, X.; Song, J.; Zeng, A.; Liu, Y.; Li, X. Influence of spraying parameters of unmanned aircraft on droplets deposition. Trans. Chin. Soc. Agric. Mach. 2012, 43, 94–96, (In Chinese with English Abstract). [Google Scholar]
  11. Qiu, B.; Wang, L.; Cai, D.; Wu, J.; Ding, G.; Guan, X. Effects of flight altitude and speed of unmanned helicopter on spray deposition uniform. Trans. Chin. Soc. Agric. Eng. 2013, 29, 25–32, (In Chinese with English Abstract). [Google Scholar]
  12. Qin, W.; Xue, X.; Zhou, L.; Zhang, S.; Sun, Z.; Kong, W.; Wang, B. Effects of spraying parameters of unmanned aerial vehicle on droplets deposition distribution of maize canopies. Trans. Chin. Soc. Agric. Eng. 2014, 30, 50–56, (In Chinese with English Abstract). [Google Scholar]
  13. Qin, W.; Xue, X.; Zhang, S.; Gu, W.; Chen, C. Optimization and test of spraying parameters for P20 multi-rotor electric unmanned aerial vehicle based on response surface method. J. Jiangsu Univ. 2016, 37, 548–555, (In Chinese with English Abstract). [Google Scholar]
  14. Zhang, H.; Qi, L.; Wu, Y.; Cheng, Z.; Liu, W.; Elizabeth, M.; Xiao, Y.; Yang, Z. Distribution characteristics of rotor downwash airflow field under spraying on orchard using unmanned aerial vehicle. Trans. Chin. Soc. Agric. Eng. 2019, 35, 44–54, (In Chinese with English Abstract). [Google Scholar]
  15. Lian, Q. Study on the Variation of Downwash and the Installation Position of Nozzles in a Six-Rotor Plant Protection Drone; Heilongjiang Bayi Agricultural University: Mishan, China, 2019. [Google Scholar]
  16. Xie, Y.; Wang, G.; Wang, B.; Shang, C.; Lan, Y. Selection of nozzle type and parameter optimization in herbicide spraying process of plant protection UAV. J. Chin. Agric. Mach. 2021, 42, 61–69, (In Chinese with English Abstract). [Google Scholar]
  17. Wang, C.; He, X.; Bonds, J.; Qi, P.; Yang, Y.; Gao, W. Effect of Downwash Airflow Field of 8-rotor Unmanned Aerial Vehicle on Spray Deposition Distribution Characteristics under Different Flight Parameters. Smart Agric. 2020, 2, 124–136, (In Chinese with English Abstract). [Google Scholar]
  18. Chen, S.; Lan, Y.; Li, J.; Zhou, Z.; Liu, A.; Mao, Y. Effect of wind field below unmanned helicopter on droplet deposition distribution of aerial spraying. Int. J. Agric. Biol. Eng. 2017, 10, 67–77. [Google Scholar]
  19. Yang, F.; Xue, X.; Cai, C.; Zhou, Q. Effect of down wash airflow in hover on droplet motion law for multi-rotor unmanned plant protection machine. Trans. Chin. Soc. Agric. Eng. 2018, 34, 64–73, (In Chinese with English Abstract). [Google Scholar]
  20. Zhan, Y.; Chen, P.; Xu, W.; Chen, S.; Han, Y.; Lan, Y.; Wang, G. Influence of the downwash airflow distribution characteristics of a plant protection UAV on spray deposit distribution. Biosyst. Eng. 2022, 216, 32–45. [Google Scholar] [CrossRef]
  21. Wang, L.; Zhang, Q.; Hou, Q.; Chen, D.; Wang, S. Vertical distribution law of six-rotor plant protection UAV based on multi-feature parameters. Trans. Chin. Soc. Agric. Mach. 2022, 53, 75–83, (In Chinese with English Abstract). [Google Scholar]
  22. Li, J.; Guo, S.; Yao, W.; Zhan, Y.; Li, Y. Distribution characteristics of droplet size in rice field and wind tunnel simulation test under airflow operation. Trans. Chin. Soc. Agric. Mach. 2019, 50, 148–156, (In Chinese with English Abstract). [Google Scholar]
  23. He, Y.; Xiao, S.; Fang, H.; Dong, T.; Tang, Y.; Nie, P.; Wu, J.; Luo, S. Development situation and spraying decision of spray nozzle for plant protection UAV. Trans. Chin. Soc. Agric. Eng. 2018, 34, 113–124, (In Chinese with English Abstract). [Google Scholar]
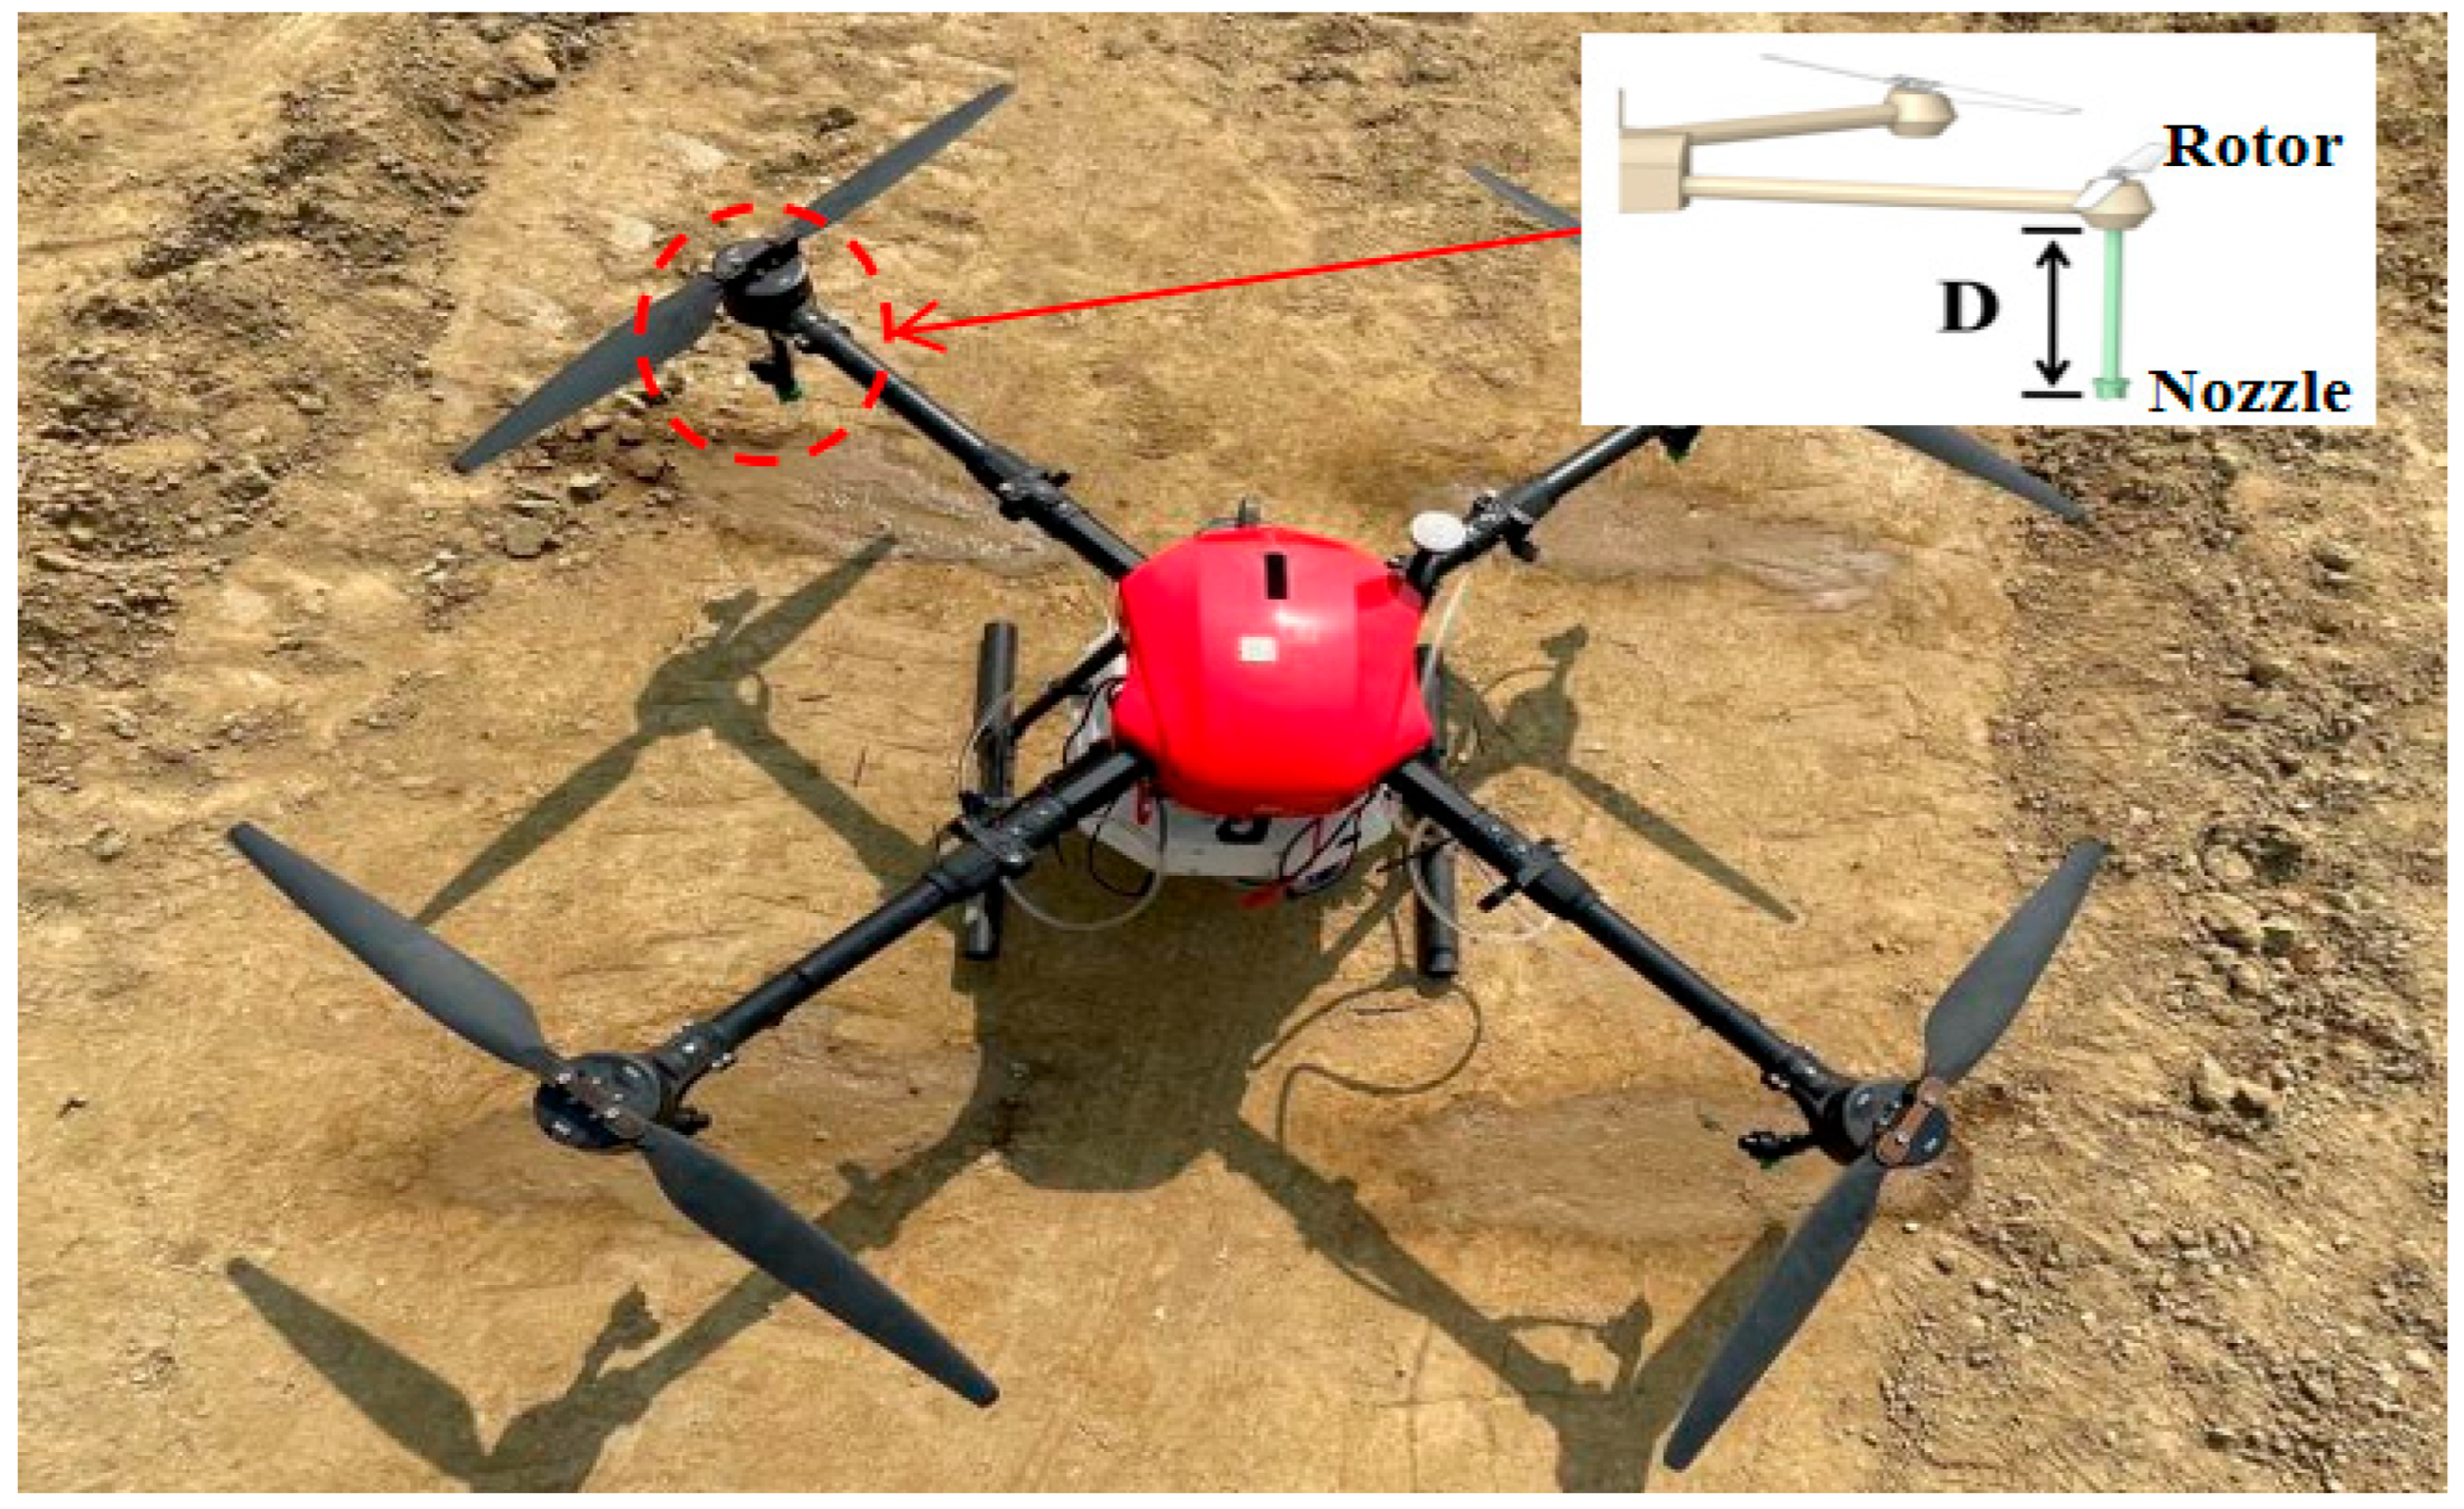
Figure 1. The vertical distance between the nozzle and rotor.
Agriculture 15 01995 g001
Figure 2. UAV 3D model and rotor scanning.
Agriculture 15 01995 g002
Figure 3. Airflow velocity distribution of cross-sections at different heights.
Agriculture 15 01995 g003
Figure 4. Distribution of rotor airflow intensity.
Agriculture 15 01995 g004
Figure 5. The movement distribution of droplets at different vertical distances.
Agriculture 15 01995 g005
Figure 6. Cloud map of droplet deposition mass concentration at different conditions.
Agriculture 15 01995 g006aAgriculture 15 01995 g006b
Figure 7. Schematic diagram of the test scheme.
Agriculture 15 01995 g007
Figure 8. Droplet deposition at different rotor–nozzle distances. Note: Letters a, b, and c are used to indicate statistically significant differences between experimental groups.
Agriculture 15 01995 g008
Figure 9. Droplet drift at different rotor–nozzle distances. Note: Letters a, b, and c are used to indicate statistically significant differences between experimental groups.
Agriculture 15 01995 g009
Figure 10. Comparison of simulation and field test results.
Agriculture 15 01995 g010
Table 1. The main parameters of the plant protection UAV.
Main ParameterSpecifications and Values
Overall dimension1470 × 1470 × 482 mm
Paddle size21 inches (540 mm)
Operating height1–5 m
Maximum drug load10 L
Operating speed0–8 m/s
Spray flow2.1 L/min
Spray width2–6 m
Table 2. Droplet deposition in the target area.
Distance/mmCollection TapeTotal Droplet Deposition/(μL·cm−2)Average Droplet Deposition/(μL·cm−2)
20010.4250.398 ± 0.025
20.404
30.365
28010.5890.560 ± 0.075
20.634
30.457
36010.7610.766 ± 0.012
20.754
30.782
44010.4010.406 ± 0.004
20.411
30.407
Note: The mean ± SD (standard deviation) is used to describe the central tendency and dispersion of the data.
Table 3. Droplet deposition in drift area.
Distance/mmCollection TapeTotal Droplet Drift/(μL·cm−2)Average Droplet Drift/(μL·cm−2)Drift Rate/%
20010.5600.546 ± 0.01557.87
20.553
30.525
28010.4970.536 ± 0.04849.12
20.507
30.603
36010.2990.235 ± 0.05123.31
20.231
30.175
44010.6250.617 ± 0.03160.27
20.576
30.652
Note: The mean ± SD (standard deviation) is used to describe the central tendency and dispersion of the data.
Disclaimer/Publisher’s Note: The statements, opinions and data contained in all publications are solely those of the individual author(s) and contributor(s) and not of MDPI and/or the editor(s). MDPI and/or the editor(s) disclaim responsibility for any injury to people or property resulting from any ideas, methods, instructions or products referred to in the content.