Article

Molecular and Phytopathological Characterization of Fusarium Wilt-Resistant Chickpea Genotypes for Breeding Applications

by
Raushan Yerzhebayeva
*,
Alfiya Abekova
,
Kuralay Baitarakova
,
Mukhtar Kudaibergenov
,
Aydarkhan Yesserkenov
,
Bekzhan Maikotov
and
Svetlana Didorenko
Kazakh Research Institute of Agriculture and Plant Growing, Almaty District, Almalybak 040909, Kazakhstan
*
Author to whom correspondence should be addressed.
Agriculture 2025, 15(19), 1992; https://doi.org/10.3390/agriculture15191992
Submission received: 2 August 2025 / Revised: 16 September 2025 / Accepted: 21 September 2025 / Published: 23 September 2025
(This article belongs to the Section Crop Protection, Diseases, Pests and Weeds)

Abstract

Fusarium wilt, caused by Fusarium oxysporum f. sp. ciceris (Foc), is a devastating disease of chickpea (Cicer arietinum L.), leading to vascular necrosis and plant death. This study evaluated 120 chickpea genotypes under natural infection field conditions during spring sowing in southeastern Kazakhstan, assessing disease incidence (DI) and severity (DS) to identify resistant germplasm. Molecular screening using eight SSR markers linked to Foc-1, Foc-2, Foc-3, and Foc-5 loci detected resistant alleles in 18, 26, 19, and 42 genotypes, respectively. The correlation between molecular marker data and phenotypic resistance evaluations confirmed UBC-170 (Foc-2) and TA-194 (Foc-5) as the most predictive diagnostic markers (p < 0.01). Ten genotypes showed complete disease resistance (DI < 5%, R), corresponding to the resistant control (cultivar “WR-315”), with confirmed presence of multiple Foc resistance genes. The results of this study revealed valuable genetic resources for marker-assisted breeding programs aimed at developing Fusarium wilt-resistant chickpea cultivars adapted to Central Asian agroclimatic conditions.

1. Introduction

Chickpea (Cicer arietinum L.) is a vital pulse crop, with its center of origin widely recognized as the Near East region [1]. The primary uses of chickpea include human nutrition, medicinal applications, high-quality livestock feed, and soil fertility enhancement; however, its predominant role remains as a food crop [2]. Chickpea seeds are a rich source of dietary energy and plant-based protein, as well as essential vitamins, minerals, dietary fiber, and bioactive compounds with demonstrated health benefits [3]. Chickpea protein is characterized by a balanced amino acid profile and higher carbohydrate content compared with soybean meal, offering a cost-effective plant-based alternative to animal protein [4]. Chickpea flour is utilized in infant nutrition, both as a standalone ingredient and as a component of dairy-based formulas [5]. Moreover, the addition of 10–20% chickpea flour to wheat flour significantly improves the quality of final food products [6].
Chickpeas also serve as a high-energy, protein-rich feed component for livestock and poultry, significantly improving productivity in milk, meat, and egg production [7,8].
Due to their versatility, chickpeas are cultivated in over 50 countries across South Asia (Indian subcontinent), North Africa, the Middle East, Southern Europe, the Americas, and Australia [9]. As a globally important pulse crop, chickpea occupies 14.09 million hectares worldwide, with an annual production of 16.5 million metric tons and an average yield of 1.2 t/ha [10].
Chickpea cultivation is receiving increasing attention in Kazakhstan due to its drought tolerance, nitrogen-fixing ability, and consistent yield under limited water availability [11,12]. Optimal agroclimatic conditions for chickpea cultivation are found in the southern and southeastern regions of the country—specifically in Zhambyl, Turkistan, and Almaty—where it is traditionally grown under rainfed conditions. However, as cultivation expanded, chickpeas were increasingly adopted in the arid steppe regions of Central Kazakhstan. By 2024, the total chickpea cultivation area in Kazakhstan had reached 20,000 hectares [13]. Kazakhstan’s chickpea production totaled 7000 metric tons, demonstrating an increase in production volumes in response to export market demands, particularly from Turkey, Afghanistan, Pakistan, and other Central Asian countries [14].
Despite the high production potential in regions where chickpea serves as a key agricultural crop, Fusarium wilt remains the primary yield-limiting factor [15,16]. The disease affects the vascular system of plants, causing tissue death and plant death. The causal agent of the disease is the fungi Fusarium oxysporum f. sp. ciceris (Foc) [17]. F. oxysporum f. sp. ciceris is one of the few formae species of monophyletic origin in the F. oxysporum complex of the Gibberella clade, most of which are polyphyletic [18,19]. This fungus is pathogenic only on Cicer spp. of which chickpea is the only cultivated species [17]. F. oxysporum f. sp. ciceris exhibits extensive pathogenic variability despite being monophyletic. Two pathotypes have been distinguished based on the distinct yellowing or wilting syndromes with brown vascular discoloration [17]. The yellowing syndrome is characterized by a slow, progressive foliar yellowing and late death of the plant, while the wilting syndrome is characterized by a fast and severe chlorosis, flaccidity, and early plant death [17,20,21].
The two indicated pathotypes of F. oxysporum f. sp. include eight pathogenic races (0, 1A, 1B/C, 2, 3, 4, 5 и 6) [16]. Their identification can be carried out on a special set of differential grades according to the disease severity [22]. Races 0 and 1B/C belong to the yellowing pathotypes, while races 1A and 2–6 belong to the wilting pathotypes and they are the most harmful from an economic point of view [16,17].
Spikes of Fusarium wilting of chickpeas can lead to both partial and complete death of chickpea crops. Depending on the genotype and species of F. oxysporum f. sp., chickpea seed yield losses ranged from 10 to 30% and also a complete loss of yield of up to 100% in India [23,24], from 20 to 40% in Pakistan [25], and from 6.6% to 100% in experimental studies in Spain [26].
Pathogen transmission occurs via infected soil or seed material, significantly reducing the efficacy of chemical control measures, including fungicides [17]. Plants show peak susceptibility during flowering and pod development stages [17].
Multiple management strategies have been proposed to control Fusarium wilt (a) application of rhizosphere microbiota as biocontrol agents, (b) adjustment of sowing dates (e.g., fall planting), (c) crop rotation, and (d) most critically, deployment of resistant cultivars [16,27,28,29]. Implementation of Fusarium wilt-resistant chickpea genotypes has proven to be the most effective. Therefore, identification and utilization of resistance sources are key objectives in breeding programs.
DNA markers associated with Foc resistance alleles have been developed and successfully validated across both chickpea germplasm accessions and breeding populations [30,31,32]. The use of DNA markers to select resistant genotypes as parents in breeding enables the development of Fusarium wilt-resistant cultivars and improves the efficiency of resistance breeding programs.
Fusarium wilt resistance resources have been identified and used in breeding programs, such as the National Agricultural Research System (NARS) [33] and International Crops Research Institute for the Semi-Arid Tropics (ICRISAT) [34], which significantly increased chickpea productivity in semi-arid parts of Africa and Asia. However, the resources of resistance are quite limited, and environmental factors have a significant impact on the manifestation of the resistance of chickpea samples [35].
There is a growing problem of damage to chickpea crops by Fusarium wilt in Kazakhstan. Consequently, there is a need to search for genetically resistant resources in the existing gene pool, for further use in crosses and the development of local high-resistance varieties. In this regard, the aim of this study was to identify chickpea genotypes with a high resistance to Fusarium wilt using both phenotypic and genotypic analysis.

2. Materials and Methods

2.1. Plant Material

The plant materials included 120 chickpea (Cicer arietinum L.) experimental accessions obtained from the Genebank collection of Kazakh Scientific Research Institute of Agriculture and Plant Growing (KRIAPG; 43°13′ N, 76°41′ E). The germplasm collection included experimental lines FLIP 09, FLIP 10 provided by the International Center for Agricultural Research in the Dry Areas (ICARDA, Beirut, Lebanon; 33°53′ N, 35°29′ E), and the N.I. Vavilov All-Russian Institute of Plant Genetic Resources (VIR, St. Petersburg, Russia; 59°56′ N, 30°19′ E). In the present study, chickpea accessions with high adaptability to the conditions of southeastern Kazakhstan were selected. They mainly belong to the Kabuli type with maturation periods of 80–100 days. They are also characterized by the weight of seeds, corresponding to the medium and medium-to-high categories, according to the UPOV classification [36].
The Fusarium wilt-resistant chickpea cultivar WR-315 (accessions AGG40710/ICC08933) was used as a resistant control and the susceptible cultivar C-104 (accessions AGG40374/ICC04928) as a susceptible control [37]. Both cultivars were obtained from the Australian Grains Genebank (AGG, Horsham, Victoria, Australia; 36°43′ S, 142°10′ E). The complete list of studied accessions is provided in Supplementary Table S1.

2.2. Research Field Experiments and Field Trials

Field experiments with chickpea cultivars were carried out at KRIAPG in the period 2022–2024. The field site was in the Almaty region at an altitude of 740 m above sea level at 43°15′ N and 76°54′ E. Seeds of all chickpea accessions were sown in April. All chickpea seed samples were sown and grown in four-row plots, 1 m × 1 m = 1 m2. The susceptible control line JG 62 and the resistant control line WR 315 were sown every ten genotypes under rainfed conditions.
General plant growing, measuring, and recording of productivity were conducted according to the following recommendations [38]. Seed yield (SY) was determined for each plot. For yield measurement, seeds from each plot were collected at harvesting, threshed, and weighed [38]. Thousand-seed weight (TSW) was measured for 1000 counted seeds [39] and recorded after being weighed on a calibrated analytical balance (RV3102, Ohaus Adventurer, Shanghai, China).

2.3. Identification of the Pathogen

During the pod filling stage of chickpea, aerial parts of plants (sprout, leaves, pods, roots) with symptoms of Fusarium wilt were selected in field trials. Five individual plant samples were collected from four points within the field in a zigzag pattern.
Stimulation of microorganism’s growth and development on infected parts of plants was carried out by the biological method of analyzing the material in a moist chamber [40].
During the sporulation of the fungus, the mycelium was placed in a drop of water on a slide. Microscopic analysis of Fusarium material (micro-, macroconidia, conidiophores) was performed using a MIS-8000 trinocular microscope (Micros, Vienna, Austria) at 40× magnification (10× lens) and fixed with a Digital Microscope Eyepiece MA88-500.5 Megapixel digital camera [41].
Fusarium isolates were identified based on morphological characteristics according to generally accepted identification guides [42,43,44].
Additionally, the references [45,46] were used to confirm F. oxysporum f. sp. ciceris affiliation.

2.4. Evaluation of Fusarium Wilt Resistance

The evaluation of Fusarium wilt resistance was conducted under natural field infection conditions. Disease assessments were carried out 4 times during stages of: (a) bud formation, (b) flowering, (c) pod filling, and (d) seed maturation [38].
Disease incidence (DI) was expressed as the percentage of wilted plants (wilting and drooping of leaves, chlorosis, and necrosis of leaf blades, followed by complete drying of the aerial parts) per total number of plants of each genotype [37].
According to the DI values, the following resistance categories were established: <10% (resistant, R), 10.1–20% (moderately resistant, MR), 20.1–40% (moderately susceptible, MS), and >40% [37].
Disease severity (DS) of affected plants was assessed using a 0–4 rating scale according to percentage of foliage with necrosis (dead areas of leaf and stem tissue, characterized by yellowing and drying): 0 (0%), 1 (1–33%), 2 (34–66%), 3 (67–100%), and 4 (dead plant), following the methodology described by Trapero-Casas and Jiménez-Díaz (1985) [26,47].

2.5. Evaluation of Normalized Difference Vegetation Index (NDVI)

Normalized Difference Vegetation Index (NDVI) measurements were conducted on chickpea accessions using a GreenSeeker® Handheld sensor (Trimble, Westminster, CO, USA) following the manufacturer’s guidelines [48]. The Trimble GreenSeeker handheld crop sensor is an affordable, easy-to-use measurement device to assess the health—or vigor—of a crop. The sensor displays the measured value as an NDVI index (in the range from 0.00 to 0.99) on its LCD display. The intensity of the detected light is a direct indicator of a plant’s health; the higher the indicator, the healthier the plant. Optical sensor-based leaf diagnostics were performed at four main growth stages (bud formation, flowering, pod filling, and seed maturation) within defined plot areas between 11:00 and 13:00 h. Seasonal mean NDVI values were calculated for each genotype during the growing period [48].

2.6. Meteorological Conditions During the Study Period

According to the Köppen–Geiger climate classification system [49], the experimental site in the Almaty Region of Kazakhstan belong to the Dfa type (humid continental climate with hot summers). The average annual air temperature in the region is 6.5 °C, and the average annual precipitation is 400–600 mm [50]. The soils are of the light chestnut type, with low organic matter content (1.6–1.9% humus in the arable layer). The soil is slightly alkaline (pH 7.8) and contains 34.9% clay particles.
Meteorological data were collected by an automatic weather station iMetos (Model IMT300USW, Pessl Instruments, Weiz, Austria) located 800 m from the experimental site.

2.7. Hydrothermal Coefficient (HTC) Determination

The hydrothermal coefficient (HTC) was used to reveal the growing conditions, moisture balance, and temperature during the chickpea growing season. This index is defined as the ratio of the total precipitation to one-tenth of the sum of active temperatures (≥10 °C) for the same period [51]. HTC was calculated using Equation (1) [52]:
HTC = Σx/Σt × 10,
where Σx is the total precipitation (mm), and Σt is the sum of the temperatures (°C) during the period when the temperature was above 10 °C [51].

2.8. Molecular Analyses

Chickpea seedlings were grown in pots filled with peat soil. After 14 days, leaves were collected from three typical seedlings per genotype. Genomic DNA was extracted from fresh leaf tissue using the Dellaporta method [53].
Standard PCR analysis was carried out in 20 μL of reaction mixture containing 5 ng DNA template, 1× Taq Buffer with KCl, 0.2 μM of each dNTP, 0.25 mM of each primer (sequences are present in Supplementary Table S2), 2.5 mM MgCl2, 2.5% DMSO, and 1 U E-3050 Taq polymerase. All primers and molecular reagents were purchased from Biosan, Novosibirsk, Russia. PCR amplification was performed using a Thermal Mastercycler Pro (Eppendorf, Hamburg, Germany) to identify alleles of four Fusarium wilt resistance genes (Foc-1, Foc-2, Foc-3, and Foc-5).
The PCR products were separated in an 8% polyacrylamide gel (Merck, Darmstadt, Germany) and stained with ethidium bromide. Quantum-ST4 documentation system (France) was used for visualization and Step50 Plus DNA ladder (Biolabmix, Novosibirsk, Russia) for molecular weight identification of PCR products.

2.9. Statistical Treatments

Statistical data processing was carried out with the JASP program (version 0.19.3.0) [54]. A one-way analysis of variance (ANOVA) was used to assess the effect of genotype factors and seasonal conditions on yield, TSW, and rate and percentage of Fusarium wilt. The Chi-square (χ2) independence criterion was used to evaluate the associations between the results of DNA markers for genotype identification by resistance (R) and susceptibility (S) alleles and their resistance categories in the field (R, MR, MS, S) [55,56]. To determine the linear relationship between all quantitative indicators of experience, the Pearson correlation criteria were assessed [57]. The Cohen’s kappa (κ) coefficient of agreement was used to assess the level of agreement between molecular results of DNA markers [58].
A binary matrix was constructed for evaluation the genetic diversity of chickpea samples, based on the presence (1) or absence (0) of the amplified fragment, associated with resistance genes to Fusarium oxysporum f. sp. ciceris (Foc).
The PAST program (version 5.09) [59] was used for principal component analysis (PCA) [60], scatter plots, dendrogram construction by unweighted pair group method with arithmetic mean (UPGMA) based on a binary matrix, and calculation of Jaccard genetic distances.
Various types of DNA markers, including two dominant (CS-27, UBC-170) and six codominant (TA37, TA110, TA194, TA96, TA27, TA59) were used for the study.
The polymorphism information content (PIC) value of codominant markers was calculated by Equation (2) [61], as follows:
P I C = 1 p i 2   p i 2 p j
where pi and pj denote the population frequency of the ith and jth alleles. The first summation is over the total number of alleles, whereas the two subsequent summations denote all the i and j values where i ≠ j.
The PIC value of dominant markers was calculated by Equation (3) [62], as follows:
P I C = 2 f i ( 1 f i )
where fi is the frequency of the amplified allele (the band is present) and (1 − fi) is the frequency of the null allele (the band is absent).

3. Results

3.1. Meteorological Conditions and HTC During the Study Period

The April–July precipitation totals for the chickpea growing season in 2022, 2023, and 2024 were 243 mm, 149.5 mm, and 337 mm, respectively. Compared to the long-term average (1991–2020; 326 mm), the years 2022 and 2023 were extremely dry. The average monthly temperatures for the same periods ranged from 16.7–26.5 °C in 2022, 11.8–27.1° C in 2023, and 12.8–24.5 °C in 2024.
The calculated HTC values for June–July in 2022 and 2023 indicated a very low moisture availability, reflecting pronounced drought conditions during a major part of the study period (Table 1).

3.2. Fusarium Wilt Resistance Assessment

A three-year study (2022–2024) assessed Fusarium wilt resistance in 120 chickpea accessions under natural field conditions in southeastern Kazakhstan.
Phenological observation revealed the absence of visible disease symptoms during the bud formation and flowering stages. Initial symptoms (lower leaf yellowing) first appear at early pod formation, followed by progressive shoot desiccation leading to complete yield loss and plant death in severe cases (Figure 1).
The susceptible control C-104 showed a high scale (2–3) of DS, while DI ranged from 35.0 to 78.0% (average DI 54.3% ± 17.8%) across trial years, with an even spread of the disease throughout the experimental site.
At the same time, the resistant control WR-315 showed a high scale of DS = 0–1. The percentage of DI ranged from 0 to 5.0% and was observed mainly in the full ripeness phase.
The rate of affection of plants in 120 chickpea samples ranged from 0 to 3 scales (Supplementary Table S1). The average value of the DS for the studied samples was 1.57 ± 0.51 in 2022, 1.35 ± 0.57 in 2023, and 1.58 ± 0.60 in 2024.
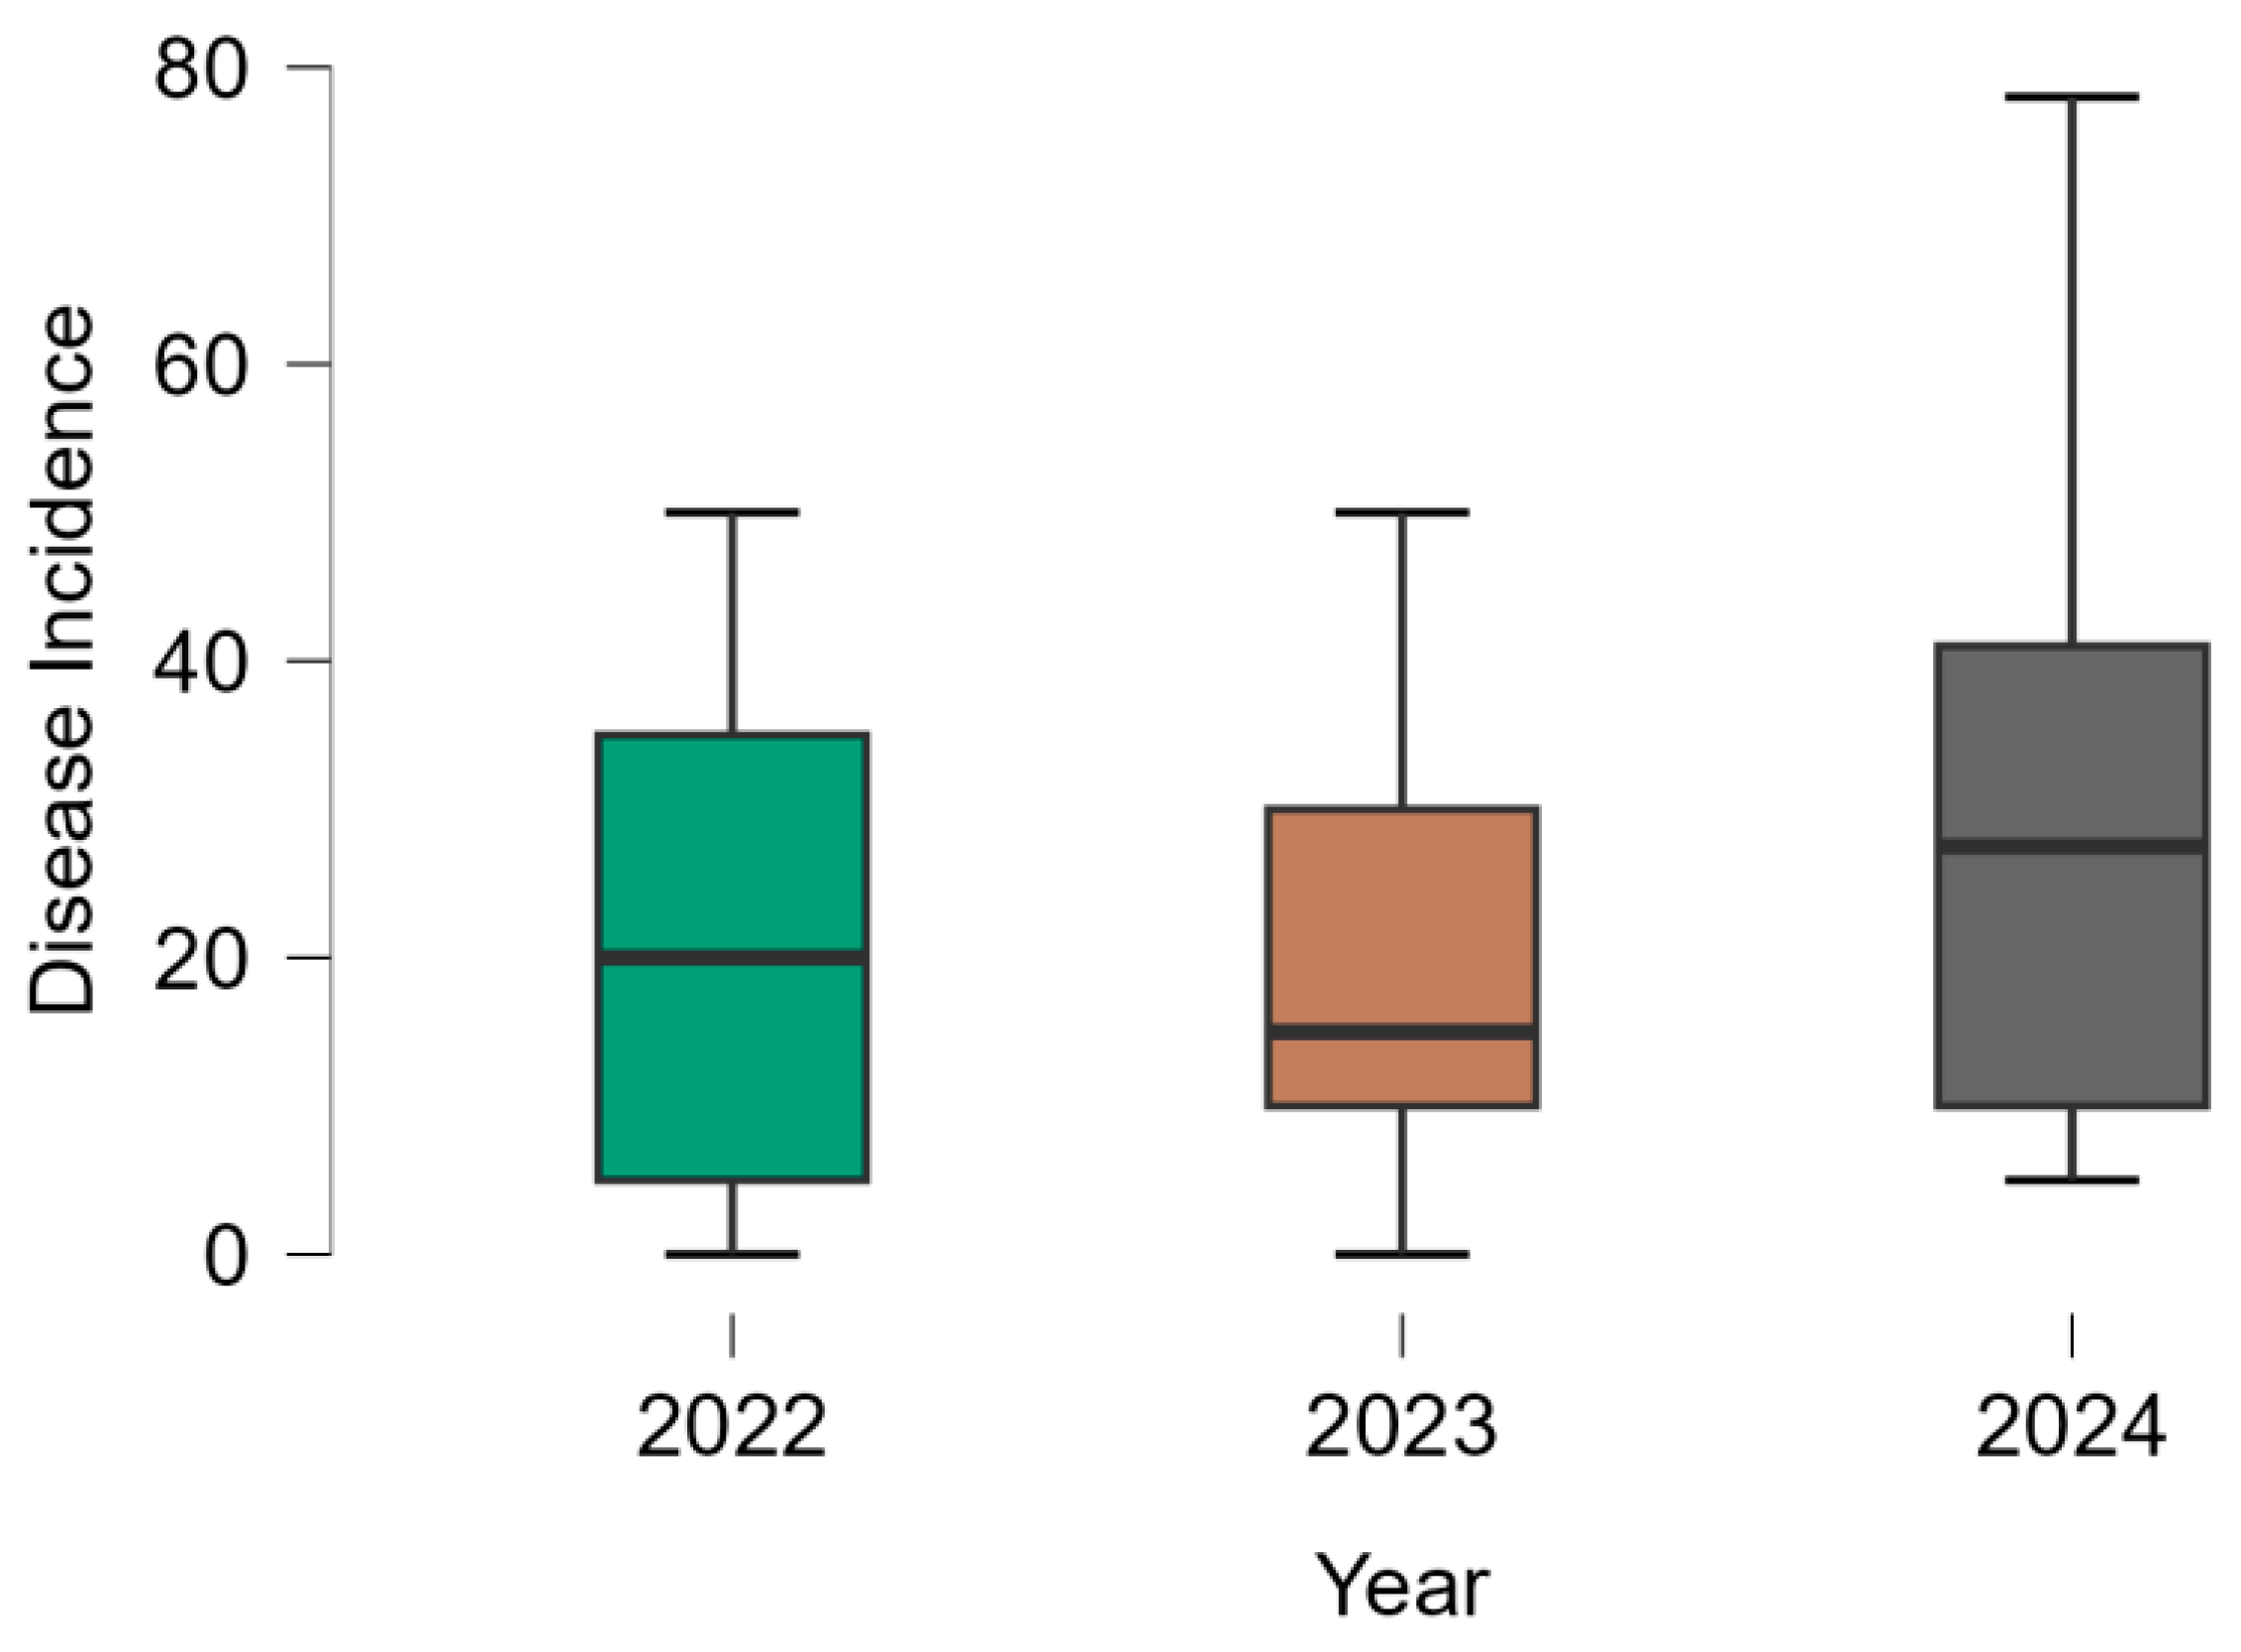
The average DI of Fusarium wilt in chickpea samples ranged from 18.0 ± 12.5% to 26.8% ± 18% (Table 2). The lowest prevalence of the disease was recorded in 2023 (18.0%), while the highest percentage was 26.8% in 2024 (Figure 2).
A one-way ANOVA revealed that there was a statistically significant difference in DI percentages among study years (F = 10.3; p < 0.001), which confirms the influence of annual weather variations and/or agroecological conditions on disease development (Table 3).
According to the results of a three-year field screening, 32 resistant (R), 23 moderately resistant (MR), 54 moderately susceptible (MS), and 11 susceptible (S) samples to Fusarium wilt were identified among 120 chickpea samples. Fourteen accessions (28-B, FLIP09-287C, Vektor, k118, k612, k1222, k2412, k2956, k546, Luch, Mal’hotra, Sfera, Nurly 80, and Tassaj) showed high resistance (<5% DI) (Supplementary Table S1).

3.3. Pathogen Identification and Characterization

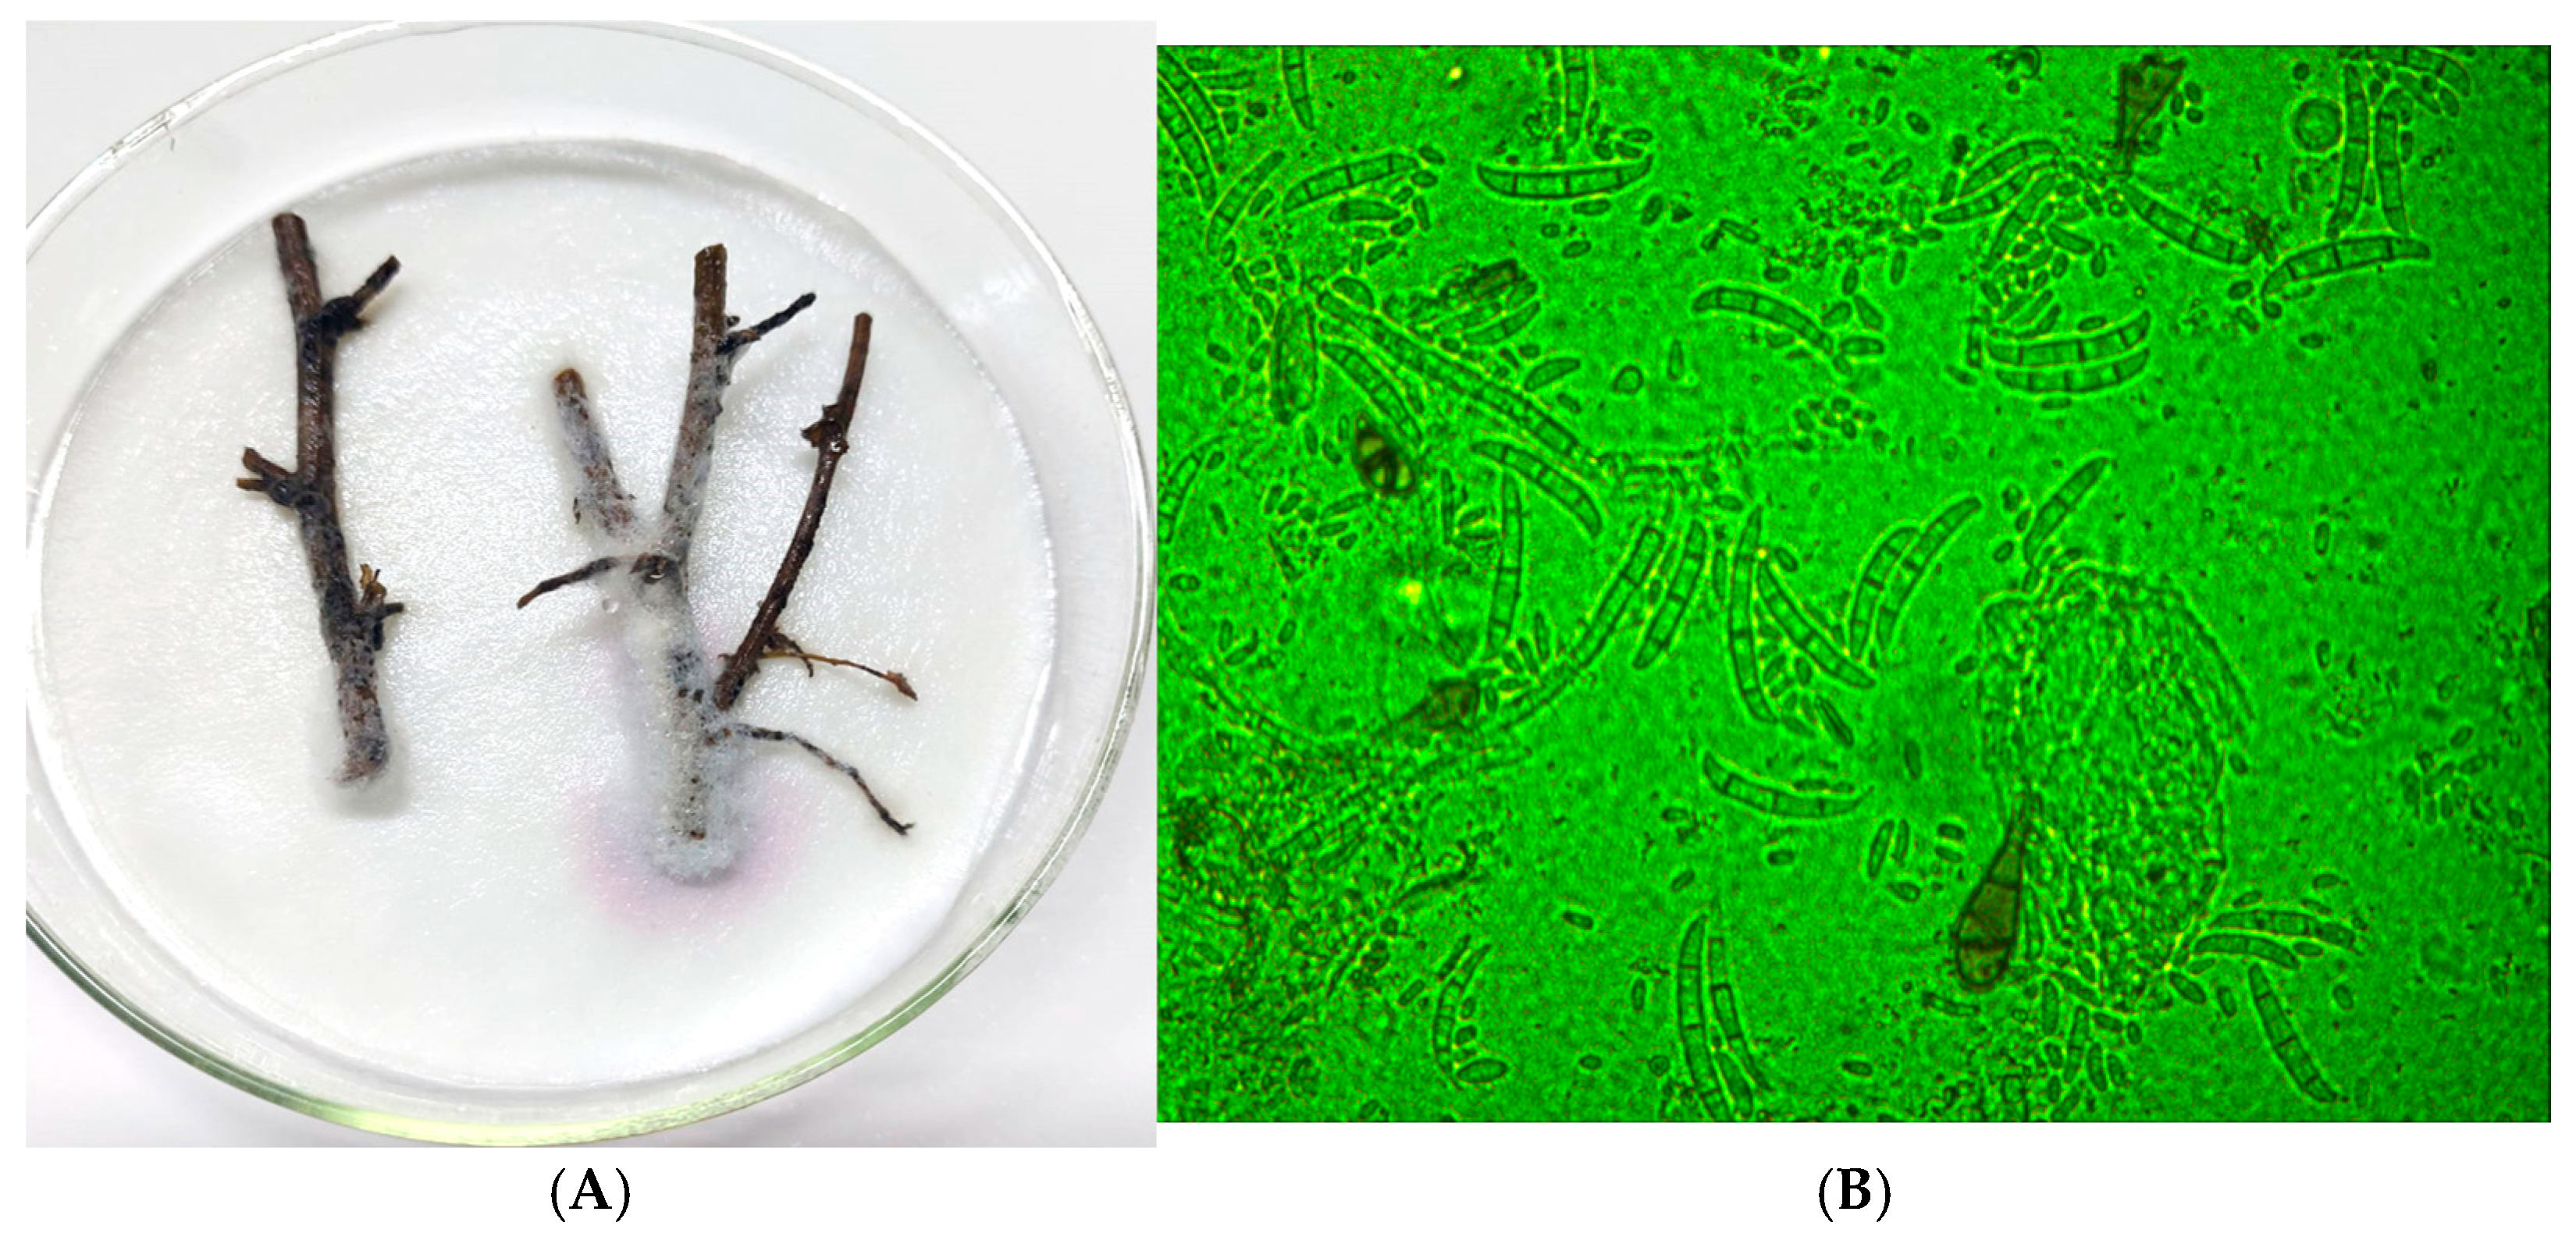
Identification of the causal agent of chickpea disease was crucial for correct diagnosis. Morphological characterization of fungi isolated from the affected areas of chickpea plant stems was performed. As a result, different types and forms of fungi were identified. The identified pathogens included Fusarium spp. (F. oxysporum, F. avenaceum), Ascochyta rabiei, Alternaria spp., and Verticillium spp. Fungi of the species F. oxysporum dominated (Figure 3). The analysis confirmed that the cause of the wilting of chickpea plants was Fusarium wilt disease caused by Fusarium oxysporum.

3.4. SY and TSW Evaluation Under Natural Field Conditions

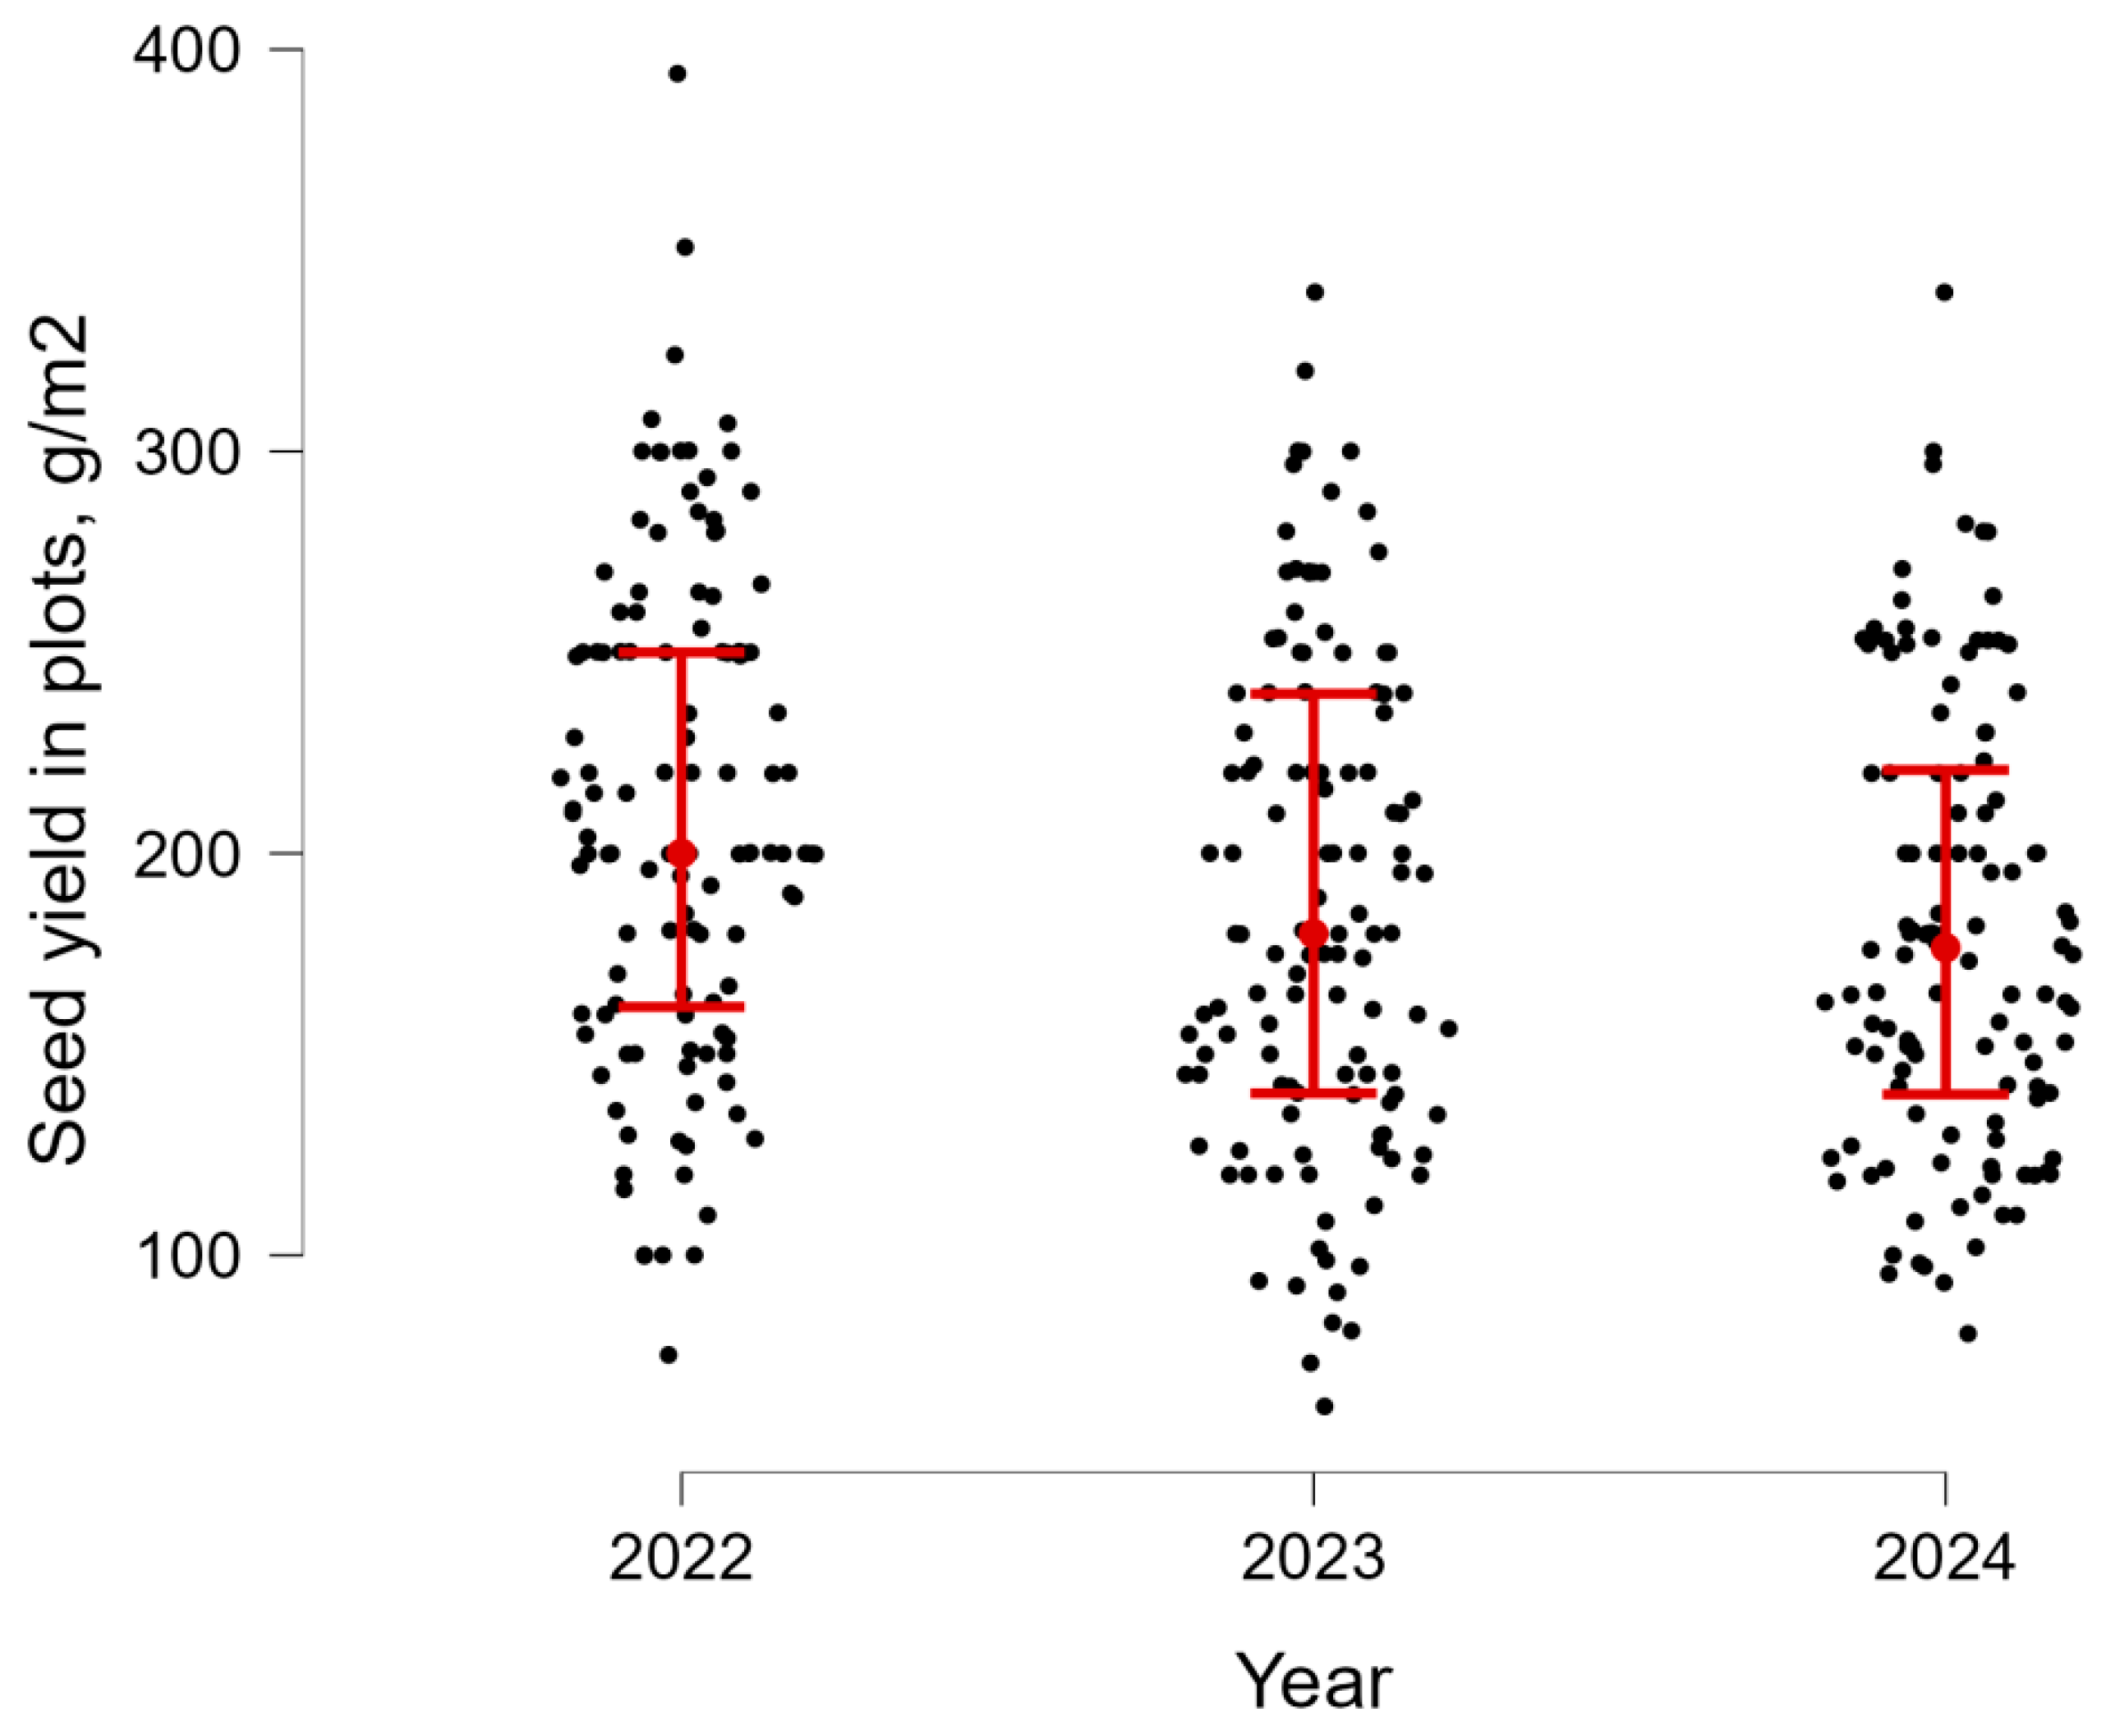
SY was assessed from 1 m2 plots at the end of the growing season. The average of SY were 209.9 g/m2 in 2022, 187.1 g/m2 in 2023, and 181.8 g/m2 in 2024 (Table 2). The highest SY was recorded in 2022, and the lowest in 2024 (Figure 4). The results of ANOVA confirmed the statistically significant influence (F = 7.6; p < 0.001) of the annual conditions on the chickpea yield (Table 2). Six accessions among the 120 evaluated samples: k2483 (358 g/m2), k2956 (315 g/m2), 5850 (300 g/m2), 10,520 (284 g/m2), 28-B (281 g/m2), and 5832 (280 g/m2) demonstrated high average SY value over three years of study.
The TSW ranged widely, from 176 to 398 g, depending on the genotype. ANOVA revealed the highly significant effects (F = 25.2; p < 0.001) of the genotype on TSW. The average TSW value over the years was 285.1 g in 2022, 286.2 g in 2023, and 283.0 g in 2024 (Table 2). The stability of that indicator over time has been noted: no statistically significant differences between the years (F = 0.13; p > 0.87).
Among the 120 evaluated samples, ten accessions: 10,518 (350 g), к543 (354 g), к1783 (357 g), Zolotoj yubilejnyj (361 g), к546 (364 g), Nurly 80 (368 g), Sfera (370 g), к130 (370 g), к118 (377 g), and к288 (378 g) demonstrated high average TSW value over three years of study. The average yield value was compared between four resistance categories (R, MR, MS, S). The ANOVA showed no significant differences between the groups (F = 0.7; p > 0.5).

3.5. Normalized Difference Vegetation Index (NDVI)

The Normalized Difference Vegetation Index (NDVI), an indicator of plant greenness and photosynthetic activity, was analyzed four times during the growing season for 120 chickpea samples. Average NDVI values ranged from 0.28 to 0.78 in 2022, from 0.24 to 0.75 in 2023, and from 0.36 to 0.84 in 2024 (Table 2). The highest NDVI values were recorded in 2024 (the average value was 0.62), which was characterized by increased moisture availability (HTC = 1.2). The analysis of variance demonstrated statistically significant influence of the annual weather conditions on this indicator (F = 29.2, p < 0.001) (Table 3). The average NDVI values for all the research years (2022–2024) are shown in Supplementary Table S1.
Correlation analysis revealed a weak but statistically significant negative correlation between NDVI values and both DS (r = −0.25, p < 0.001) and DI (r = −0.33, p < 0.001). These results indicate a relationship: the higher the rate and percentage of damage to the plant, the lower the photosynthetic activity, reflected in NDVI value.

3.6. Genotyping of Foc Genes

Identification of the Foc-1 gene (H1 locus). The Foc-1 locus, associated with Fusarium wilt resistance, was identified by using DNA markers CS-27 and UBC-170 [63,64].
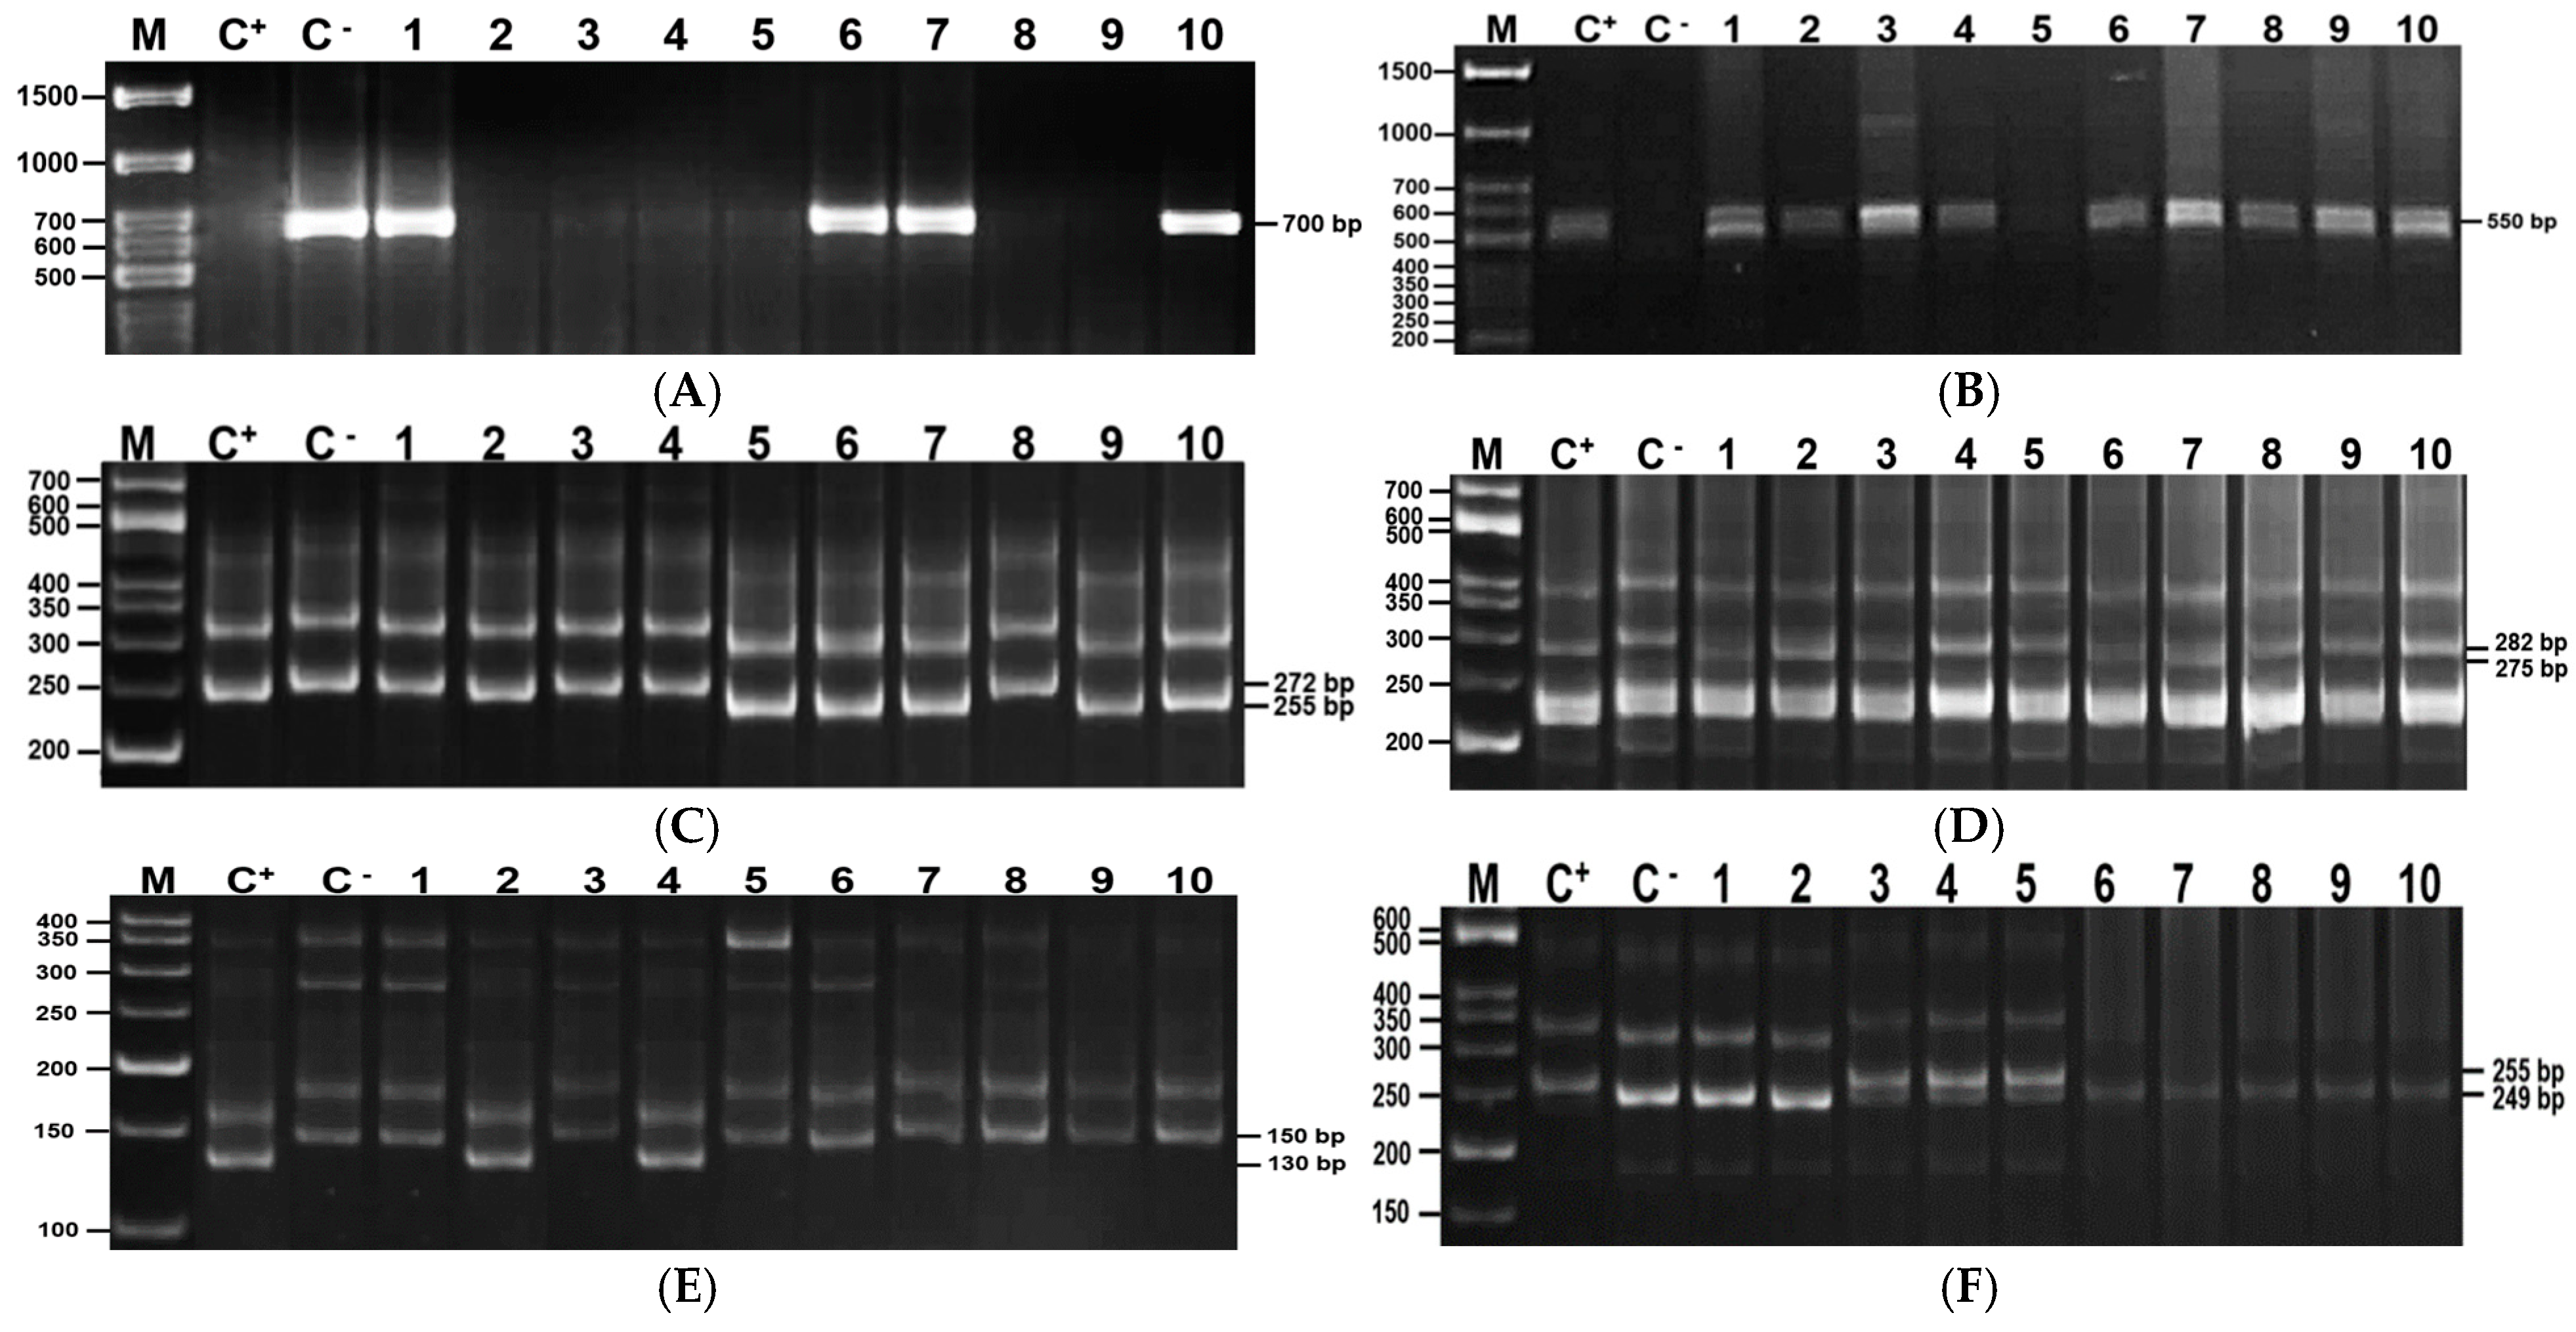
Molecular screening of the H1 loci using the marker CS-27 successfully amplified a band with the weight of 700 bp in 91 out of the 42 tested chickpea accessions, which confirmed the presence of dominant H1H1 genotype associated with susceptibility to Fusarium wilt [63,64]. The absence of this band in 29 samples was recorded as the recessive h1h1 alleles, potentially related to the resistance [63] (Supplementary Table S1). PCR amplification results of H1 locus susceptibility alleles are presented in Figure 5A.
The second molecular marker UBC-170 [63] is closely associated with Foc-1. PCR with this marker amplified a 550 bp band linked to Fusarium resistance in 93 accessions (Supplementary Table S1; Figure 5B). Concordance between UBC-170 and CS-27 markers was observed in only 15.8% of samples. Nominal data statistical analysis results of two markers (resistant allele—R, susceptible allele—S) using Cohen’s kappa agreement coefficient evaluation showed k = −0.09, SE (standard error) = 0.05, which indicated the disagreement of the results. The presence of valuable recessive H1 alleles corresponded to the concordance results of two markers (UBC-170 and CS 27) and the resistant control WR-315. Based on the results of Foc-1 gene analysis, 18 accessions that potentially have late Fusarium wilting after infection were identified (Table 4).
To identify the Foc-2 resistance alleles, two well-characterized molecular markers TA37 and TA110 were used [65]. PCR analysis results with the TA37 marker showed a band 275 bp, associated with Foc 2 race resistance in 50 chickpea samples [66]. This band was identical to the length in the resistant control WR-315 (Supplementary Table S1). A band 282 bp was amplified in 70 samples, which corresponds to a susceptible allele (see Supplementary Table S1). An example of amplification of PCR products using the TA37 marker is shown in Figure 5D.
Complementary analysis with the TA110 marker detected the characteristic 255 bp resistance amplicon in 68 accessions (Figure 5C). Statistical analysis of the results of two molecular markers (TA110 and TA37) using the Cohen’s kappa agreement coefficient also showed disagreement at the level of k = −0.04, SE = 0.06. Integrative marker analysis (TA37 and TA110) identified 26 germplasm accessions possessing the Foc-2 resistance alleles, with complete genotypic data presented in Table 4.
Identification of the Foc-3 gene. To identify the Foc-3 gene, molecular markers TA96 [65,67] and TA194 [65,68] were employed. The PCR products using the results of the first marker, TA96, demonstrated the amplification of 280 bp, associated with resistance to race 3, and were recorded in 64 accessions (Figure 5; Supplementary Table S1). Another fragment, 260 bp, which was unrelated to resistance, was amplified in 54 samples. Results of PCR with the second marker, TA194, showed the amplification of 130 bp, associated with resistance, and were found in 36 accessions (Figure 6; Supplementary Table S1). Based on the concordance results of the two markers, 19 chickpea samples corresponding to the resistant control WR-315 were isolated (Table 4).
Analysis of the results of two molecular markers (TA96 and TA194) using the Cohen’s kappa agreement coefficient showed a slight agreement at the level of k = 0.06, SE = 0.08.
Identification of the Foc-5 gene. Genetic screening for Foc-5 resistance was performed using two previously validated markers: TA27 [65] and TA59 [69]. Marker TA27 identified the 255 bp resistance-associated fragment in 81 accessions [67], associated with resistance to race 5, while 39 accessions contained the fragment 249 bp, which were unrelated to resistance (Supplementary Table S1). The identification of the Foc-5 gene using the TA59 marker allowed isolation of 45 samples with a fragment of 258 bp, which corresponds to the allele associated with resistance [69] (Table 4). Results analysis of two molecular markers (TA27 and TA59) using Cohen’s kappa agreement coefficient showed moderate agreement at the level of k = 0.45, SE = 0.06. Comparative analysis of both markers confirmed 42 chickpea accessions with resistance alleles matching the positive control WR-315 (Table 4).
Thus, out of 120 studied accessions, 18 with the Foc-1 resistance allele, 26 with the Foc-2 gene, 19 with the Foc-3 gene, and 42 with the Foc-5 gene were identified (Table 4).

3.7. Comparison of Genotypic and Phenotypic Data of Chickpea Accessions

In this study, eight DNA markers were used to identify chickpea genotypes with Foc-1, Foc-2, Foc-3, and Foc-5 resistance alleles. A statistical analysis was performed using the chi-square criterion to evaluate the associations between genotypes with resistance (R) and susceptibility (S) alleles and their resistance categories in the field (R, MR, MS, S). The analysis was performed separately for each DNA marker (Supplementary Table S3).
A highly significant correlation was found between the results of the markers UBC-170 and TA-194. The highest probability of coincidence of the marker results and resistance categories was established for marker UBC-170 (χ2 = 13.9, p < 0.003). For the second marker TA194, the chi-square was χ2 = 9.4, p < 0.02. For the remaining markers, chi-square values were not significant (Supplementary Table S1). Ten accessions demonstrated both molecular resistance alleles and field-level resistance (R): WR-315 (Foc-1,3,5), 28-B (Foc-1,3), FLIP09-287C (Foc-3,5), FLIP10-15C (Foc-1,3), k107 (Foc-2,3,5), k118 (Foc-3,5), Sfera (Foc-1,3,5), k612 (Foc-3,5), k1221 (Foc-2,3), and Tassaj (Foc-1,5).
Among the resistant accessions, the cultivar Sfera (Foc-1,3,5) showed high TSW value (370 g) and complete field resistance (5% R). A breeding Line 28-B (Foc-1,3) with a yield of 281 g/m2 and a resistance of 5% R has been isolated.

3.8. Analysis of Genetic Diversity

Based on the results of a molecular genetic analysis of loci associated with Fusarium oxysporum f. sp. ciceris (Foc) resistance genes, the genetic diversity of 120 chickpea genotypes was assessed. All markers showed polymorphism, which confirms suitability for analyzing the diversity of the collection. In total, 17 alleles were identified, with an average of 2.12 alleles per locus. The largest number of alleles (3) was recorded to the TA194 marker, while the remaining markers revealed two alleles each (Supplementary Table S4).
The PIC values of the markers ranged from 0.361 (CS-27 marker) to 0.498 (TA96 marker). All applied markers are classified as medium-informative according to the classification of Botstein et al. (1980) [61]. The maximum PIC values were recorded for TA96 (0.498) and TA194 (0.495) (Supplementary Table S4).
To identify structural differences within a collection of 120 samples, the PCA was performed after evaluating the informative value of the markers and allelic diversity. The first five main components explain a significant part of the total genetic variation based on the PCA results. Their contribution ranged from 11.2% to 23.6% (Table 5).
The first five main components explain, in total, over 82% of the overall variation. Additional components (PC6–PC9) make a comparatively smaller contribution (from 2.3% to 6.0%); however, their informative value can be useful in an extended analysis. According to the confidence intervals of the eigenvalues (Eig 2.5%–Eig 97.5%), the lower bound for each component remains significantly above zero, which indicates their statistical significance.
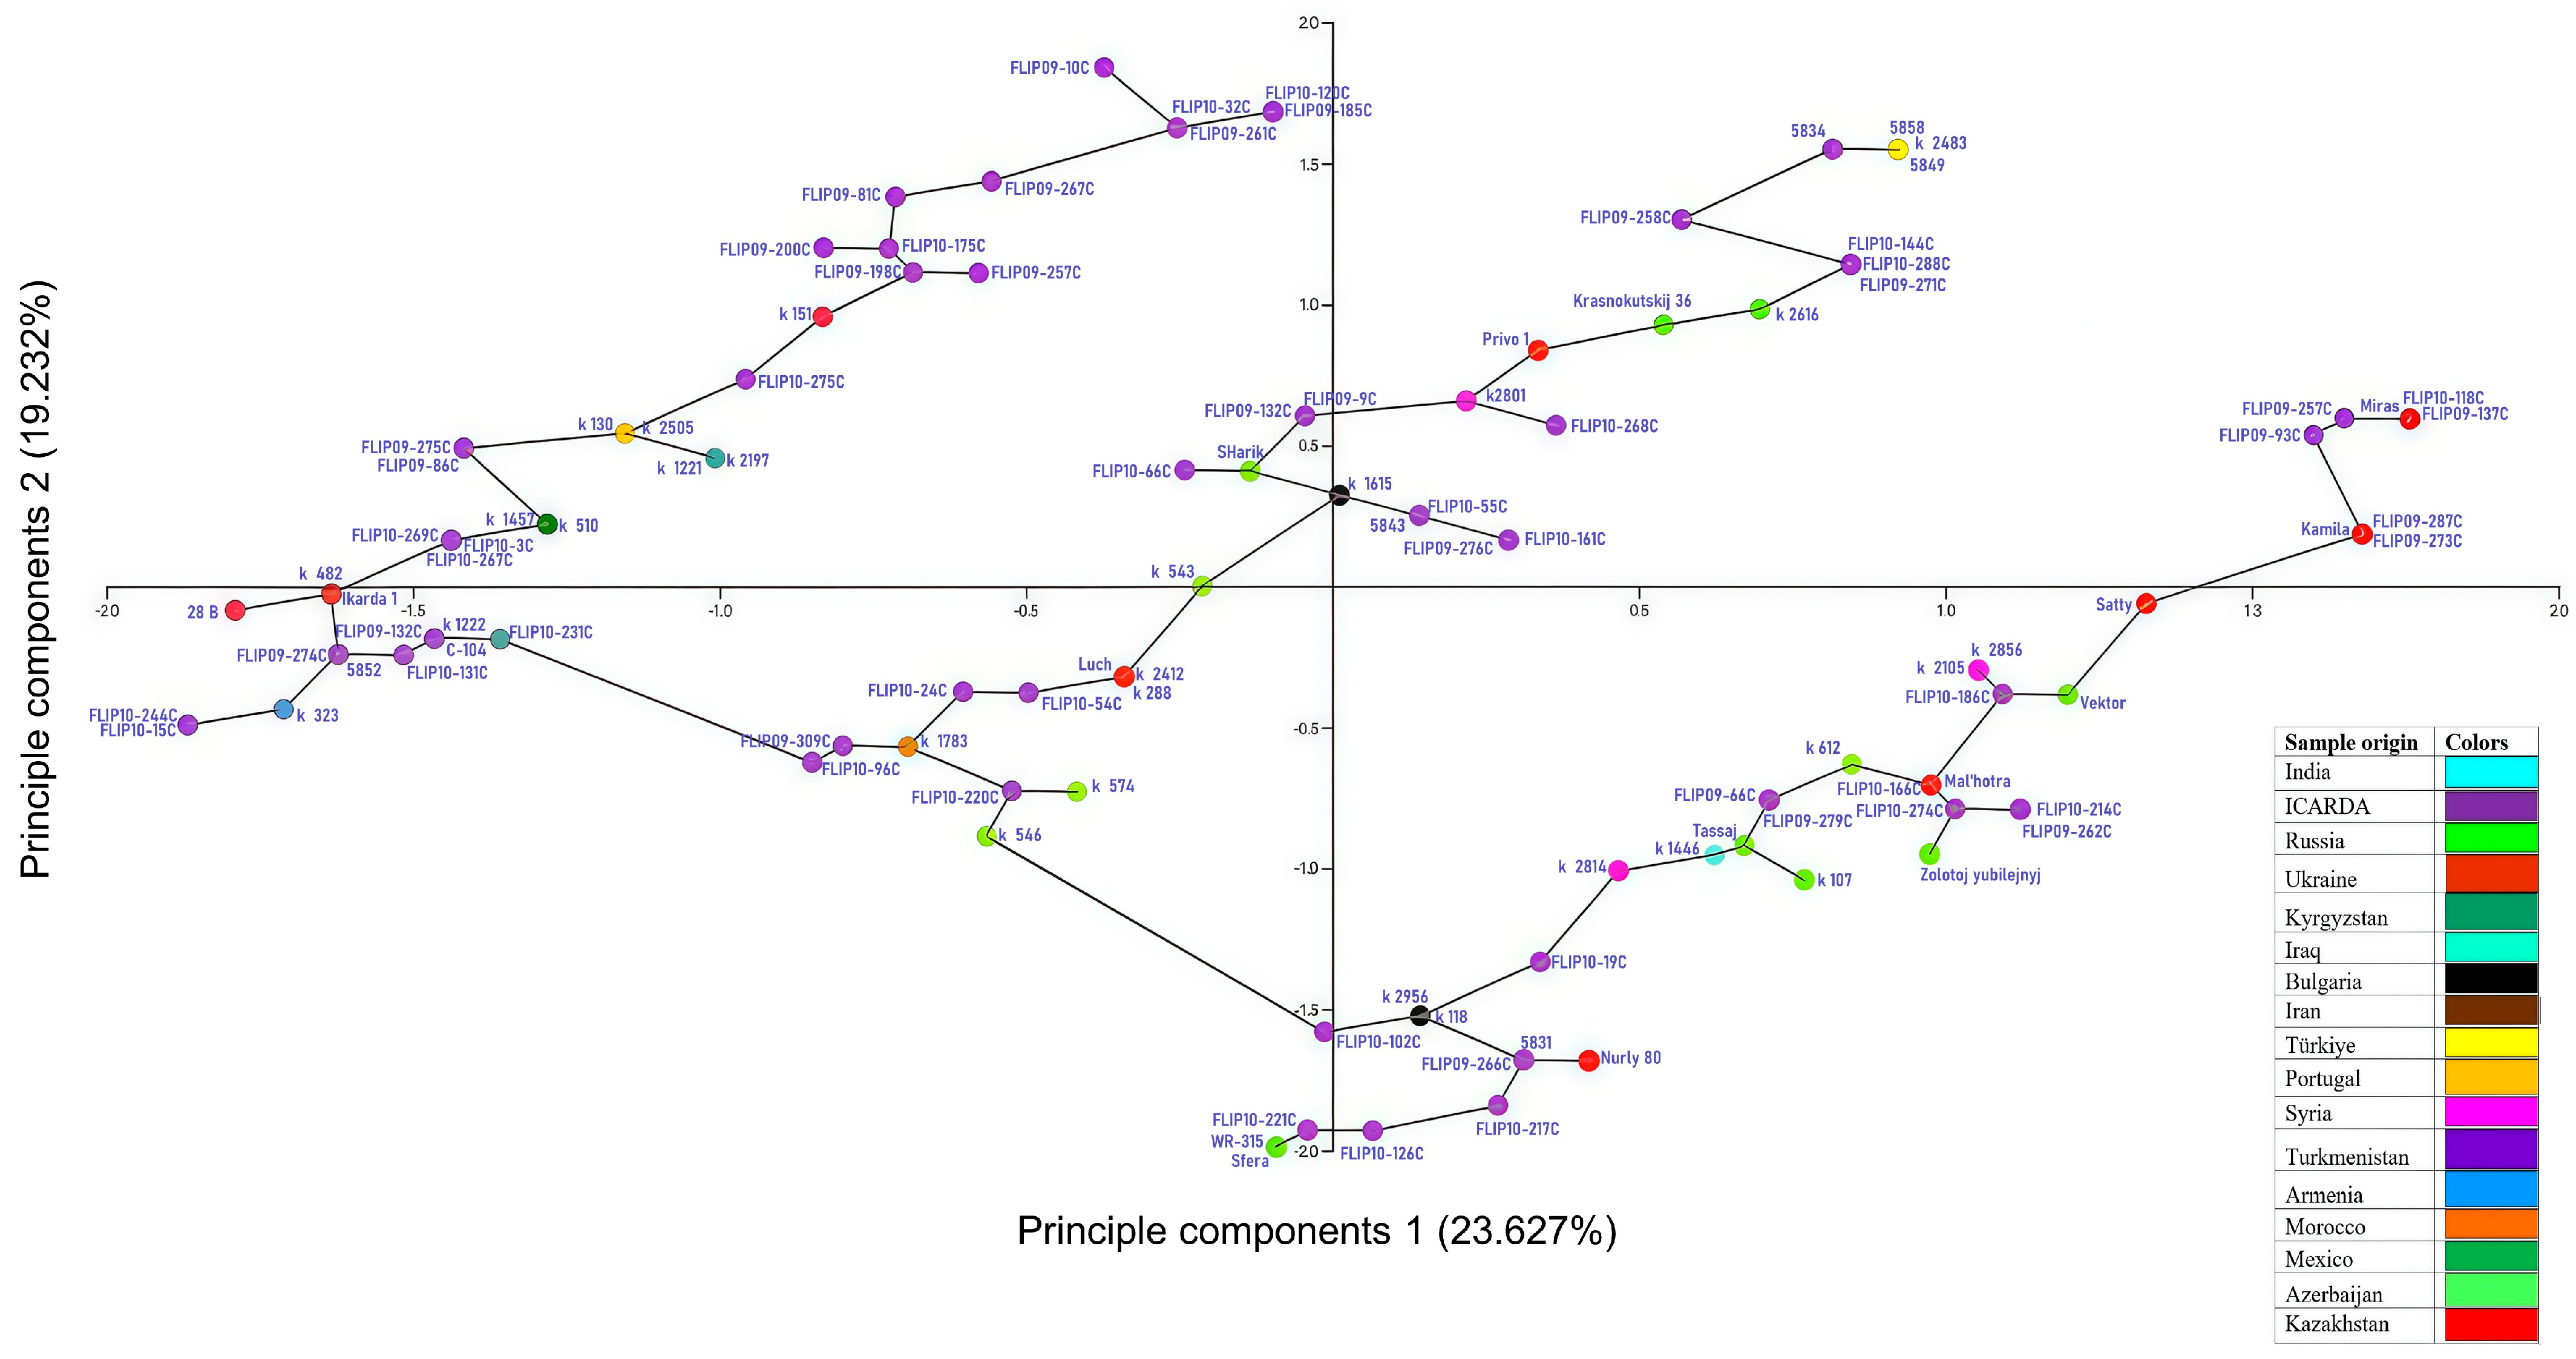
The PCA results, presented as a scatter plot, show the formation of three main clusters of genotypes. Some of the samples are located in isolation from the main groups, which indicates their genetic remoteness and potential breeding value.
Genotypes FLIP10-221C, FLIP10-126C, and Sfera, characterized by the presence of two or more valuable Foc alleles, with the resistant WR-315 line, were joined to a separate small branch (Figure 6). They can be used as donors of resistance alleles to Fusarium oxysporum f. sp. ciceris.
The ICARDA samples were located in all three clusters, which indicates their genetic diversity. Chickpea samples from Central Asia and Russia are also found in all three clusters, which indicates their genetic heterogeneity and lack of a clear geographical grouping.
The constructed dendrogram (Complementary Figure S1) divided 120 genotypes into five clusters, which are grouped into three large clusters. It indicated the presence of genetic proximity among a significant proportion of the studied material. The common clusters included samples carrying similar Foc resistance alleles.
The results comparison of dendrogram analysis and PCA show their consistency. The samples included two separated groups on the dendrogram and also had an isolated position in the space of the main components. Thus, a comprehensive approach with PIC, PCA analysis, and the UP-GMA clustering method confirmed the presence of both genetically close and remote genotypes in the collection.

4. Discussion

Fusarium wilt, caused by Fusarium oxysporum f. sp. ciceris, is a major disease in chickpeas, resulting in significant yield losses [24,70]. Genetic resistance to pathogens is the most effective practical and cost-efficient individual method to protect chickpeas from Fusarium wilt disease [17]. The development of chickpea varieties resistant to Fusarium wilt is one of the sustainable strategies adopted by breeders as part of the integrated management of chickpea diseases. The present study aimed to evaluate and genetically screen the resistance to Fusarium wilt disease in the field. Combining these two types of screening is valuable for identifying genetically resistant genotypes with proven stable phenotypic resistance.
In the study, the assessment of the resistance of 120 chickpea genotypes to the causal agent of Fusarium wilt was carried out under natural soil contamination conditions for three years for spring sowing. This approach was chosen for two reasons. Firstly, the natural infection background allows the reaction of genotypes in conditions close to real agricultural production to be shown more objectively, where the disease manifestation mostly depends on a complex of environmental factors. Secondly, the natural infection conditions make it possible to identify genotypes with resistance, manifested in individual isolates of the pathogen and their totality in the local population. This is especially important in the case of high genetic variability of Fusarium oxysporum f. sp. ciceris populations. Similar approaches based on tests in natural field conditions are also described in the literature [29,71].
The percentage of DI during the study period ranged from 18.5% to 26.8%. DS rate of chickpea plants ranged in scale from 0 to 3, and the average value was 1.5. In our studies, the active development of Fusarium wilt disease was observed in 2024, and was characterized by increased moisture availability (HTC = 1.2). In 2024, the average value of DI among studied 120 chickpea samples was 26.8%. These results contrast with previously reported data of disease development in India and Pakistan, the major chickpea-producing regions. Previous studies have shown that Fusarium wilt develops more actively in dry and hot weather [25,29]. Our study area involved two dry years (2022 and 2023), and the active growth and development period of chickpea (June and July) HTC was 0.33 and 0.23, respectively. These HTC values correspond to extremely dry conditions. Under these hydrothermal conditions, in the period from June to July, the average percentage of Fusarium wilt DI was 21.5% in 2022 and 18.5% in 2023. Perhaps, such extremely arid conditions can slow down the spread of the pathogen [72].
Such differences may be caused by a complex of climatic conditions. Climatic conditions vary significantly across regions. Kazakhstan is located in a zone with a sharply continental climate, significantly distant from oceans, and with pronouncedly dry summers [50]. Soils lose moisture quickly, and the upper layer soil moisture (0–20 cm) reaches a minimum (3–5% by weight) in years of drought [73]. Whereas in South Asia (India, Pakistan, Iran), due to the ocean proximity and the monsoon climate, even in dry years sufficient atmospheric moisture (51.5–61.3%) [29] and soil moisture (8.7–9.5%) remain [74]. Precipitation in the dry season is 262–492 mm [29]. This creates conditions for the development of fusarium wilt in chickpeas during dry and hot seasons. Sharma et al. reported that environmental factors such as temperature, air humidity, and soil moisture can significantly influence the severity of Fusarium wilt progression [37]. Landa et al. showed that early stages of wilting symptoms developed more rapidly with increasing temperatures, and precipitation became a key factor in disease progression. Further studies have shown that changes in soil moisture and temperature can cause annual fluctuations in the incidence of Fusarium wilt [75].
Many researchers have identified elite genotypes through field screening of germplasm for resistance to Fusarium wilt [76]. However, resistance is often limited to the wilt races that are common in a particular region and can only be used for breeding programs in that region [29]. Screening allowed the identification of 32 samples with high stable resistance (R) under the conditions of southeast Kazakhstan. Highly resistant samples with less than 5% affection: 28-B, FLIP09-287C, Vektor, k118, k612, k1222, k2412, k2956, k546, Luch, Mal’hotra, Sfera, and Tassaj were identified. These samples can be used in local breeding programs under the conditions of the southern region of Kazakhstan.
Eight DNA markers were tested to implement DNA screening methods in practical chickpea breeding on 120 samples of collection material. The selected markers were previously validated by a number of researchers as effective for identifying resistance and susceptibility to the pathogen Fusarium oxysporum f. sp. ciceris [30,31,77,78,79]. According to concordance results, two markers per target gene identified 18 accessions carrying Foc1, 26 with Foc2, 19 with Foc3, and 42 with Foc5 resistance alleles. Notably, several accessions contained multiple resistance genes, representing valuable genetic material for breeding programs, aiming to develop durable wilt-resistant cultivars.
In this work, inconsistencies were found between marker results targeting the same locus of resistance to Fusarium oxysporum f. sp. ciceris. Such a discrepancy is common when working with a variety of collection materials and can be explained by several factors: (a) the position difference of markers in the genome, (b) the degree of linkage to the target gene, (c) the presence of various resistant alleles (allelic heterogeneity), (d) recombination, which weakens the linkage between the marker and the causal mutation, and (e) structural variations (insertions/deletions or duplications), as well as polymorphism at the primer attachment sites.
Comparative analysis of molecular screening and field resistance evaluations identified three markers—UBC-170, TA194, and aTA59—as the most reliable and reproducible. According to Maisuria, H. J. (2017) [30], the UBC-170 marker demonstrated high efficiency across genotypes with varying resistance levels and is recommended for breeding programs. The TA194 marker was also confirmed as highly diagnostic in studies by Ahmad et al. (2014) [80] and Rani et al. (2022) [81]. The effectiveness of the TA59 marker was confirmed by a number of studies on the Foc-5 gene [69,82]. The chi-square test (χ2) values for the five markers (CS 27, TA37, TA110, TA96, TA27) were not significant. The discrepancies between genotyping and phenotyping data are also associated with issues of linkage to the target gene and the occurrence of recombination. Such discrepancies have been reported in other studies assessing chickpea resistance to Fusarium wilt [31,59,67].
An integrated analysis of field screening and molecular diagnostics resulted in the selection of ten resistant genotypes. These genotypes are recommended as resistance donors for future hybridization and backcrossing programs aimed at developing locally adapted chickpea cultivars with improved resistance to Fusarium wilt [83].

5. Conclusions

A comprehensive three-year evaluation (2022–2024) of 120 chickpea accessions under natural Fusarium wilt pressure in southeastern Kazakhstan revealed variation in resistance levels. Field screening categorized the accessions as follows: 32 resistant (R, <10% infection), 23 moderately resistant (MR, 10–25% infection), 55 moderately susceptible (MS, 26–50% infection), and 10 susceptible (S, >50% infection). Notably, high levels of resistance (DI < 5%) were observed in accessions 28-B, FLIP09-287C, Vektor, K118, K612, K1222, K2412, K2956, K546, Luch, Mal’hotra, Sfera, and Tassaj.
Genetic screening using eight SSR markers revealed significant associations between three markers: UBC170, TA194, and TA59, and field resistance categories, confirming their reliability for marker-assisted selection. The analysis of allelic variation identified 18 accessions with Foc-1, 26 with Foc-2, 19 with Foc-3, and 45 with Foc-5 resistance alleles. Importantly, results of field screening and genotyping revealed that 10 samples, including WR-315 (Foc-1,3,5), Sfera (Foc-1,3,5), and 28-B (Foc-1,3), combined multiple resistance alleles with confirmed resistance R level in the field. The study characterized several superior genotypes with combined agronomic and resistance traits. Notably, the cultivar Sfera (Foc-1,3,5, TSW = 370 g) and breeding line 28-B (Foc-1,3, yield = 281 g/m2) both exhibit complete field resistance (<5% DI) and carry multiple resistance alleles. These genotypes, along with other identified resistant accessions, represent valuable genetic resources for developing Fusarium wilt-resistant chickpea cultivars adapted to Central Asian growing conditions, combining disease resistance with superior agronomic traits.
An important area of further research is to determine the racial composition of F. oxysporum f. sp. ciceris populations in Kazakhstan using differential lines and chickpea varieties. This will allow more accurate prediction of the effectiveness of the identified resistance genes. The selected resistance donors are interesting for the pyramiding of several genes (Foc-1, Foc-2, Foc-3, Foc-5, etc.) in order to develop varieties with long-term and broad resistance. Further development of research should be aimed at integrating molecular methods, phytopathological analysis, and traditional breeding to specific identified races in order to develop productive and resistant chickpea varieties adapted to the conditions of Kazakhstan.

Supplementary Materials

The following supporting information can be downloaded at: https://www.mdpi.com/article/10.3390/agriculture15191992/s1. Table S1: Germplasm collection of varieties and advanced breeding lines of chickpea. Table S2: The used molecular markers, sequences of corresponding primers, and conditions of PCR amplification. Table S3: Chi-square test (χ2) results of chickpea germplasm samples for genotyping resistance and susceptibility alleles using 8 markers and phenotyping for Fusarium wilt resistance under conditions of southeastern Kazakhstan. Table S4: PIC values for chickpea accessions using eight SSR markers. Complementary Figure S1 is a dendrogram of 120 chickpea samples, constructed by the UPGMA method based on the molecular data of markers associated with resistance genes to Fusarium oxysporum f. sp. ciceris (Foc).

Author Contributions

Supervision and writing—original draft preparation, editing, R.Y.; methodology and data curation, A.A. and A.Y.; investigation and visualization, B.M.; investigation, K.B. and A.A.; project administration, funding acquisition and writing—review and editing, M.K.; resources, K.B. and S.D. All authors have read and agreed to the published version of the manuscript.

Funding

This research was funded by the Ministry of Agriculture of the Republic of Kazakhstan within the framework of the 267 budget program for Program No. BR22885414 «Development of high-yielding grain legume varieties using modern biological methods, creation of their varietal cultivation technologies, and primary seed production» and Program No. BR-22885305 “Breeding and genetic technology for the development of long-term storage systems, restoration, monitoring, and rational use of agrobiodiversity, as a basic basis for improving selection programs in the Republic of Kazakhstan”.

Institutional Review Board Statement

Not applicable.

Data Availability Statement

The original contributions presented in this study are included in the Supplementary Material. Further inquiries can be directed to the corresponding author.

Acknowledgments

We want to extend special thanks to the researcher Taskinbayeva Raushan and head of the gene pool laboratory Yessimbekova Minura of our Research Institute for providing the chickpea collection material.

Conflicts of Interest

The authors declare no conflicts of interest. The funders had no role in the design of the study; in the collection, analyses, or interpretation of data; in the writing of the manuscript; or in the decision to publish the results.

References

  1. Zhang, J.; Wang, J.; Zhu, C.; Singh, R.P.; Chen, W. Chickpea: Its origin, distribution, nutrition, benefits, breeding, and symbiotic relationship with Mesorhizobium species. Plants 2024, 13, 429. [Google Scholar] [CrossRef]
  2. Jha, U.C.; Nayyar, H.; Thudi, M.; Beena, R.; Vara Prasad, P.V.; Siddique, K.H. Unlocking the nutritional potential of chickpea: Strategies for biofortification and enhanced multinutrient quality. Front. Plant Sci. 2024, 15, 1391496. [Google Scholar] [CrossRef]
  3. Sandhu, J.S.; Tripathi, S.; Chaturvedi, S.K. Chickpea Nutritional Status and Value Chain for Sustainable Development. In Sustainable Food Value Chain Development; Narula, S.A., Raj, S.P., Eds.; Springer: Singapore, 2023; pp. 175–183. [Google Scholar] [CrossRef]
  4. Iqbal, A.; Ateeq, N.; Khalil, I.A.; Perveen, S.; Saleemullah, S. Physicochemical characteristics and amino acid profile of chickpea cultivars grown in Pakistan. J. Foodserv. 2010, 17, 94–101. [Google Scholar] [CrossRef]
  5. Anwar, R.; Borbi, M.; Rakha, A. Significance and the use of legumes in developing weaning foods with a balanced nutrition—A review. Legume Sci. 2024, 6, e249. [Google Scholar] [CrossRef]
  6. Delgado-Andrade, C.; Olías, R.; Marín-Manzano, M.C.; Seiquer, I.; Clemente, A. Chickpea seed flours improve the nutritional and the antioxidant profiles of traditional shortbread biscuits: Effects of in vitro gastrointestinal digestion. Antioxidants 2024, 13, 118. [Google Scholar] [CrossRef]
  7. David, L.S.; Nalle, C.L.; Abdollahi, M.R.; Ravindran, V. Feeding value of lupins, field peas, faba beans and chickpeas for poultry: An overview. Animals 2024, 14, 619. [Google Scholar] [CrossRef] [PubMed]
  8. Bampidis, V.A.; Christodoulou, V. Chickpeas (Cicer arietinum L.) in animal nutrition: A review. Anim. Feed Sci. Technol. 2011, 168, 1–20. [Google Scholar] [CrossRef]
  9. Muehlbauer, F.J.; Sarker, A. Economic Importance of Chickpea: Production, Value, and World Trade. In The Chickpea Genome; Varshney, R., Thudi, M., Muehlbauer, F., Eds.; Springer: Cham, Switzerland, 2017; pp. 5–12. [Google Scholar] [CrossRef]
  10. FAO. FAOSTAT. Available online: https://www.fao.org/faostat/en/#data/QCL (accessed on 28 June 2025).
  11. Mazkirat, S.; Baitarakova, K.; Kudaybergenov, M.; Babissekova, D.; Bastaubayeva, S.; Bulatova, K.; Shavrukov, Y. SSR genotyping and marker–trait association with yield components in a Kazakh germplasm collection of Chickpea (Cicer arietinum L.). Biomolecules 2023, 13, 1722. [Google Scholar] [CrossRef] [PubMed]
  12. Kudaibergenov, M.S.; Baitarakova, K.; Saikenova, A.; Kanatkyzy, M.; Abdrakhmanov, K.A.; Saken, G.S. Chickpea genotype selection based on economically valuable traits to develop high-yielding types. SABRAO J. Breed. Genet. 2024, 56, 1. [Google Scholar] [CrossRef]
  13. Bureau of National Statistics of the Agency for Strategic Planning and Reforms of the Republic of Kazakhstan. Available online: https://stat.gov.kz/ (accessed on 14 July 2025).
  14. Bolatova, Z.; Bulkhairova, Z.; Kulshigashova, M. Modeling scenarios of climate change impacts on leguminous crop production: A case study in Kazakhstan. Int. J. Agric. Biosci. 2024, 13, 367–377. [Google Scholar] [CrossRef]
  15. Verma, S.; Gupta, S.; Nitesh, B.; Kumar, T.; Bharadwaj, C.; Bhatia, S. High-density linkage map construction and mapping of seed trait QTLs in chickpea (Cicer arietinum L.) using Genotyping-by-Sequencing (GBS). Sci. Rep. 2015, 5, 17512. [Google Scholar] [CrossRef]
  16. Jendoubi, W.; Bouhadida, M.; Boukteb, A.; Béji, M.; Kharrat, M. Fusarium wilt affecting chickpea crop. Agriculture 2017, 7, 23. [Google Scholar] [CrossRef]
  17. Jiménez-Díaz, R.M.; Castillo, P.; Jiménez-Gasco, M.M.; Landa, B.B.; Navas-Cortés, J.A. Fusarium wilt of chickpeas: Biology, ecology and management. Crop Prot. 2015, 73, 16–27. [Google Scholar] [CrossRef]
  18. Jiménez-Gasco, M.M.; Milgroom, M.G.; Jiménez-Díaz, R.M. Gene genealogies support Fusarium oxysporum f. sp. ciceris as a monophyletic group. Plant Pathol. 2002, 51, 72–77. [Google Scholar] [CrossRef]
  19. Demers, J.E.; Garzón, C.D.; Jiménez-Gasco, M.M. Striking genetic similarity between races of Fusarium oxysporum f. sp. ciceris confirms a monophyletic origin and clonal evolution of the chickpea vascular wilt pathogen. Eur. J. Plant Pathol. 2014, 139, 309–324. [Google Scholar] [CrossRef]
  20. Jiménez-Gasco, M.M.; Navas-Cortés, J.A.; Jiménez-Díaz, R.M. The Fusarium oxysporum f. sp. ciceris/Cicer arietinum pathosystem: A case study of the evolution of plant-pathogenic fungi into races and pathotypes. Int. Microbiol. 2004, 7, 95–104. [Google Scholar] [PubMed]
  21. Jiménez-Fernández, D.; Landa, B.B.; Kang, S.; Jiménez-Díaz, R.M.; Navas-Cortés, J.A. Quantitative and microscopic assessment of compatible and incompatible interactions between chickpea cultivars and Fusarium oxysporum f. sp. ciceris races. PLoS ONE 2013, 8, e61360. [Google Scholar] [CrossRef] [PubMed]
  22. Haware, M.P.; Nene, Y.L. Races of Fusarium oxysporum f. sp. ciceri. Plant Dis. 1982, 66, 809–810. [Google Scholar] [CrossRef]
  23. Ahmad, M.A.; Iqbal, S.M.; Ayub, N.; Yasmin, A.; Akram, A. Identification of resistant sources in chickpea against Fusarium wilt. Pak. J. Bot. 2010, 42, 417–426. [Google Scholar]
  24. Navas-Cortés, J.A.; Hau, B.; Jiménez-Díaz, R.M. Yield loss in chickpeas in relation to development of Fusarium wilt epidemics. Phytopathology 2000, 90, 1269–1278. [Google Scholar] [CrossRef]
  25. Sunkad, G.; Deepa, H.; Shruthi, T.H.; Singh, D. Chickpea wilt: Status, diagnostics and management. Indian Phytopathol. 2019, 72, 619–627. [Google Scholar] [CrossRef]
  26. Dhawale, S.N.; Dhale, D.A. Effects of Fusarium wilt on chickpea in India: A review. Int. J. Bot. Stud. 2021, 6, 884–890. [Google Scholar]
  27. Sampaio, A.M.; Araujo, S.D.S.; Rubiales, D.; Vaz Patto, M.C. Fusarium wilt management in legume crops. Agronomy 2020, 10, 1073. [Google Scholar] [CrossRef]
  28. Amine, E.; Douira, A.; Ilyass, M.; Ahmed, S. Integrating sowing date with chickpea genotypes in managing Fusarium wilt in Morocco. Agriculture 2022, 12, 773. [Google Scholar] [CrossRef]
  29. Maleki, H.H.; Pouralibaba, H.R.; Ghiasi, R.; Mahmodi, F.; Sabaghnia, N.; Samadi, S.; Pellegrini, M. Exploring resistant sources of chickpea against Fusarium oxysporum f. sp. ciceris in dryland areas. Agriculture 2024, 14, 824. [Google Scholar] [CrossRef]
  30. Maisuria, H.J.; Patel, R.M.; Suthar, K.P. Validation of molecular markers linked to Fusarium wilt resistance in chickpea genotypes. Int. J. Pure Appl. Biosci. 2017, 5, 254–260. [Google Scholar] [CrossRef]
  31. Padaliya, R.V.; Suthar, K.P.; Singh, D.; Mahatma, M.K.; Patil, V.R. Marker assisted characterization of chickpea genotypes for wilt resistance. Afr. J. Biotechnol. 2013, 12, 6907. [Google Scholar]
  32. Jha, U.C.; Bohra, A.; Pandey, S.; Parida, S.K. Breeding, genetics, and genomics approaches for improving Fusarium wilt resistance in major grain legumes. Front. Genet. 2020, 11, 1001. [Google Scholar] [CrossRef]
  33. Fikre, A.; Korbu, L.; Eshete, M.; Bekele, D.; Girma, N.; Mohamed, R.; Assefe, S.; Admasu, D.; Tilahun, G.; Tesfaye, T. A decade of research progress in chickpea and lentil breeding and genetics. Ethiop. J. Crop Sci. 2018, 6, 101–113. [Google Scholar]
  34. Sharma, M.; Babu, T.K.; Gaur, P.; Ghosh, R.; Rameshwar, T.; Chaudhary, R.; Upadhyay, J.; Gupta, O.; Saxena, D.; Kaur, L.; et al. Identification and multi-environment validation of resistance to Fusarium oxysporum f. sp. ciceris in chickpea. Field Crop. Res. 2012, 135, 82–88. [Google Scholar] [CrossRef]
  35. Yadav, R.K.; Tripathi, M.K.; Tiwari, S.; Tripathi, N.; Asati, R.; Patel, V.; Sikarwar, R.S.; Payasi, D.K. Breeding and Genomic Approaches towards Development of Fusarium Wilt Resistance in Chickpea. Life 2023, 13, 988. [Google Scholar] [CrossRef]
  36. International Union for the Protection of New Varieties of Plants (UPOV). Chickpea (Cicer arietinum L.), UPOV Code: CICER_ARI. Available online: https://www.upov.int (accessed on 14 September 2025).
  37. Sharma, M.; Ghosh, R.; Tarafdar, A.; Rathore, A.; Chobe, D.R.; Kumar, A.V.; Harer, P.N. Exploring the genetic cipher of chickpea (Cicer arietinum L.) through identification and multi-environment validation of resistant sources against Fusarium wilt (Fusarium oxysporum f. sp. ciceris). Front. Plant Sci. 2019, 10, 963. [Google Scholar] [CrossRef]
  38. Vishniyakova, M.A.; Seferova, I.V.; Buravtseva, T.V.; Burlyaeva, M.O.; Semenova, E.V.; Filipenko, G.I.; Aleksandrova, T.G.; Egorova, G.P.; Yankov, I.I.; Bulyntsev, S.V. VIR Global Collection of Grain Legume Crop Genetic Resources: Replenishment, Conservation and Studying; Ministry of Science and Higher Education: St. Petersburg, Russia, 2018; 143p. (In Russian) [Google Scholar]
  39. International Seed Testing Association (ISTA). International Rules for Seed Testing; ISTA: Bassersdorf, Switzerland, 2024; Available online: https://www.seedtest.org/api/rm/882F39FEQGF349B/ista-rules-2024-00-introduction-final.pdf (accessed on 14 September 2025).
  40. GOST 12044-93; Interstate Standard. Seeds of Agricultural Crops. Methods for Determining Disease Infection. Russian GOST Committee: Moscow, Russia, 1996. (In Russian)
  41. Moss Instruments Co., Ltd. Available online: https://www.nhm.uio.no/english/research/resources/past/ (accessed on 14 September 2025).
  42. Nelson, P.E.; Toussoun, T.A.; Marasas, W.F.O. Fusarium Species: An Illustrated Manual for Identification; Pennsylvania State University Press: University Park, PA, USA, 1983. [Google Scholar]
  43. Leslie, J.F.; Summerell, B.A. The Fusarium Laboratory Manual; Blackwell Publishing: Ames, IA, USA, 2006. [Google Scholar]
  44. Shahjahan, M.; Inam-ul-Haq, M.; Mukhtar, T.; Khalid, A. Incidence of major fungal root diseases of chickpea in Layyah and Bhakkar districts of Punjab, Pakistan. Pak. J. Phytopathol. 2016, 28, 75–79. [Google Scholar]
  45. Haware, M.P.; Nene, Y.L. Symptomless carriers of the chickpea wilt Fusarium. Phytopathology 1982, 72, 193–195. [Google Scholar]
  46. Maheshwari, S.K.; Satyavir, S.; Chauhan, R. Morphological and molecular characterization of Fusarium oxysporum f. sp. ciceris causing wilt in chickpea (Cicer arietinum L.). Afr. J. Biotechnol. 2013, 12, 2630–2635. [Google Scholar]
  47. Trapero-Casas, A.; Jiménez-Díaz, R.M. Fungal wilt and root rot diseases of chickpea in southern Spain. Phytopathology 1985, 75, 1146–1151. [Google Scholar] [CrossRef]
  48. GreenSeeker Handheld Crop Sensor. Available online: https://ww2.agriculture.trimble.com/product/greenseeker-handheld-crop-sensor/ (accessed on 7 July 2025).
  49. Beck, H.E.; McVicar, T.R.; Vergopolan, N.; Berg, A.; Lutsko, N.J.; Dufour, A.; Zeng, Z.; Jiang, X.; van Dijk, A.I.J.M.; Miralles, D.G. High-resolution (1 km) Köppen-Geiger maps for 1901–2099 based on constrained CMIP6 projections. Sci. Data 2023, 10, 724. [Google Scholar] [CrossRef] [PubMed]
  50. Climate in Kazakhstan. Climate Data. Available online: https://ru.climate-data.org (accessed on 17 July 2024).
  51. Evarte-Bundere, G.; Evarts-Bunders, P. Using of the hydrothermal coefficient (HTC) for interpretation of distribution of non-native tree species in Latvia on example of cultivated species of genus Tilia. Acta Biol. Univ. Daugavp. 2012, 12, 135–148. [Google Scholar]
  52. Selyaninov, G.L. About the agricultural evaluation of the climate. Trudy GGO 1928, 20, 177–185. (In Russian) [Google Scholar]
  53. Dellaporta, S.L.; Wood, J.; Hicks, J.B. A plant DNA minipreparation: Version II. Plant Mol. Biol. Rep. 1983, 1, 19–21. [Google Scholar] [CrossRef]
  54. JASP Version 0.19.3. Available online: https://jasp-stats.org/ (accessed on 12 May 2025).
  55. McDonald, J.H. Handbook of Biological Statistics, 3rd ed.; Sparky House Publishing: Baltimore, MD, USA, 2014. [Google Scholar]
  56. Altay, Y.A.; Kremlev, A.S.; Gandalipov, E.R.; Yerzhebayeva, R.S. On the use of the statistical methods for biomedical signals and data processing. In Proceedings of the 2019 IEEE Conference of Russian Young Researchers in Electrical and Electronic Engineering (EIConRus), Moscow, Russia; Saint Petersburg, Russia, 28–31 January 2019; pp. 1129–1134. [Google Scholar]
  57. Zar, J.H. Biostatistical Analysis, 5th ed.; Pearson Education: Upper Saddle River, NJ, USA, 2010. [Google Scholar]
  58. Cohen’s Kappa. Available online: https://datatab.net/tutorial/cohens-kappa (accessed on 15 September 2025).
  59. Past 5—The Past of the Future, Version 4.09. Available online: https://www.chinamedevice.com/ChinaSuppliers/5815/ (accessed on 5 September 2025).
  60. Jolliffe, I.T. Principal Component Analysis; Springer Series in Statistics; Springer: New York, NY, USA, 2002. [Google Scholar]
  61. Botstein, D.; White, R.L.; Skolnick, M.H.; Davies, R.W. Construction of a genetic linkage map in man using restriction fragment length polymorphism. Am. J. Hum. Genet. 1980, 32, 314–331. [Google Scholar]
  62. Serrote, C.M.L.; Reiniger, L.R.S.; Silva, K.B.; dos Santos Rabaiolli, S.M.; Stefanel, C.M. Determining the polymorphism information content of a molecular marker. Gene 2020, 726, 144175. [Google Scholar] [CrossRef] [PubMed]
  63. Mayer, M.S.; Tullu, A.; Simon, C.J.; Kumar, J.; Kaiser, W.J.; Kraft, J.M.; Muehlbauer, F.J. Development of a DNA marker for Fusarium wilt resistance in chickpea. Crop Sci. 1997, 37, 1625–1629. [Google Scholar] [CrossRef]
  64. Soregaon, C.D.; Ravikumar, R.L. Marker assisted characterization of wilt resistance in productive chickpea genotypes. Electron. J. Plant Breed. 2010, 1, 1159–1163. [Google Scholar]
  65. Winter, P.; Pfaff, T.; Udupa, S.M.; Huttel, B.; Sharma, P.C.; Sahi, S.; Arreguin-Espinoza, R.; Weigand, F.; Muehlbauer, F.J.; Kahl, G. Characterization and mapping of sequence-tagged microsatellite sites in the chickpea (Cicer arietinum L.) genome. Mol. Gen. Genet. 1999, 262, 90–101. [Google Scholar] [CrossRef]
  66. Pratap, A.; Chaturvedi, S.K.; Tomar, R.; Rajan, N.; Malviya, N.; Thudi, M.; Saabale, P.R.; Prajapati, U.; Varshney, R.K.; Singh, N.P. Marker assisted introgression of resistance to Fusarium wilt race 2 in Pusa 256, an elite cultivar of desi chickpea. Mol. Genet. Genom. 2017, 292, 1237–1245. [Google Scholar] [CrossRef]
  67. Sharma, K.D.; Winter, P.; Kahl, G.; Muehlbauer, F.J. Molecular mapping of Fusarium oxysporum f. sp. ciceris race 3 resistance gene in chickpea. Theor. Appl. Genet. 2004, 108, 1243–1248. [Google Scholar] [CrossRef]
  68. Ali, H.; Haq, M.A.; Shah, T.M.; Mehboob, R.; Chen, W. Validation of molecular markers for resistance among Pakistani chickpea germplasm to races of Fusarium oxysporum f. sp. ciceris. Eur. J. Plant Pathol. 2012, 132, 237–244. [Google Scholar] [CrossRef]
  69. Castro, P.; Pistón, F.; Madrid, E.; Millan, T.; Gil, J.; Rubio, J. Development of chickpea near-isogenic lines for Fusarium wilt. Theor. Appl. Genet. 2010, 121, 1519–1526. [Google Scholar] [CrossRef]
  70. Kukreja, S.; Singh, K.; Sharma, K.D.; Bhatia, S.; Kaur, J. Identification and validation of candidate genes associated with resistance to Fusarium wilt in chickpea using comparative transcriptome analysis. Front. Plant Sci. 2018, 9, 909. [Google Scholar] [CrossRef]
  71. Meriem Wafa, K.; Hannane, A.; Noureddine, R. Screening for chickpea germplasm resistant to Fusarium wilt disease under natural conditions of infection. J. Crop Prot. 2022, 11, 229–242. [Google Scholar]
  72. Kapoor, P.; Khichar, M.L.; Dhankar, S.; Al, A.M.G. Assessing the Suitability of Different Modeling Techniques for Meteorological Forecasting on Chickpea Wilt. Mausam 2025, 76, 351–364. [Google Scholar] [CrossRef]
  73. Wang, Q.; Xu, C.; Long, J.; Zhang, Q.; Luo, Y.; Li, L. Soil moisture deficits triggered by increasing compound drought and heat events during the growing season in Arid Central Asia. J. Hydrol. 2025, 660, 133397. [Google Scholar] [CrossRef]
  74. Mina, U.; Dubey, S.C. Effect of environmental variables on development of Fusarium wilt in chickpea (Cicer arietinum) cultivars. Indian J. Agric. Sci. 2010, 80, 231–234. [Google Scholar]
  75. Landa, B.B.; Navas-Cortés, J.A.; Hervás, A.; Jiménez-Díaz, R.M. Influence of Temperature and Inoculum Density of Fusarium oxysporum f. sp. ciceris on Suppression of Fusarium Wilt of Chickpea by Rhizosphere Bacteria. Phytopathology 2001, 91, 807–816. [Google Scholar] [CrossRef]
  76. Dubey, S.C.; Singh, B.; Srinivasa, N. Evaluation of Chickpea Genotypes against Fusarium Wilt for Resistant Sources. Indian Phytopathol. 2017, 70, 254–255. [Google Scholar] [CrossRef]
  77. Samiksha, K.S.; Goyal, V.; Kumar, S. Screening of Chickpea Genotypes from Different Agro-Climatic Areas against Fusarium oxysporum f. sp. ciceris (Race 3) Using Morphological and Molecular Marker. Plant Sci. Today 2023, 10, 335–342. [Google Scholar] [CrossRef]
  78. Yadav, R.K.; Tripathi, M.K.; Asati, R.; Tripathi, N. Microsatellite Markers-Based Genotyping, Population Structure Analysis and Field Screening of Chickpea (Cicer arietinum L.) Genotypes against Fusarium Wilt. Horizon 2025, 12, 1–11. [Google Scholar] [CrossRef]
  79. Maisuria, H.J.; Patel, R.M.; Suthar, K.P. Assessment of Genetic Diversity among Chickpea (Cicer arietinum L.) Genotypes Using Seed Storage Protein Profiling and RAPD Markers. Appl. Biol. Res. 2017, 19, 248–256. [Google Scholar] [CrossRef]
  80. Ahmad, Z.; Mumtaz, A.S.; Ghafoor, A.; Ali, A.; Nisar, M. Marker Assisted Selection (MAS) for Chickpea Fusarium oxysporum Wilt Resistant Genotypes Using PCR Based Molecular Markers. Mol. Biol. Rep. 2014, 41, 6755–6762. [Google Scholar] [CrossRef]
  81. Rani, R.; Tripathi, S.; Srinivasa, N.; Kumari, N.; Singh, G. Genetic Resistance in Chickpea (Cicer arietinum L.) against Race 3 and 4 of Fusarium Wilt. Indian Phytopathol. 2022, 75, 713–721. [Google Scholar] [CrossRef]
  82. Iruela, M.; Castro, P.; Rubio, J.; Cubero, J.I.; Jacinto, C.; Millán, T.; Gil, J. Validation of a QTL for resistance to ascochyta blight linked to resistance to fusarium wilt race 5 in chickpea (Cicer arietinum L.). Eur. J. Plant Pathol. 2007, 119, 29–37. [Google Scholar] [CrossRef]
  83. Yadav, S.; Kumar, S. Screening and Evaluation of Cicer arietinum Genotypes against Fusarium Wilt under Sick Field and Artificial Condition. Asian J. Microbiol. Biotechnol. Environ. Sci. 2019, 21, 1068–1075. [Google Scholar]
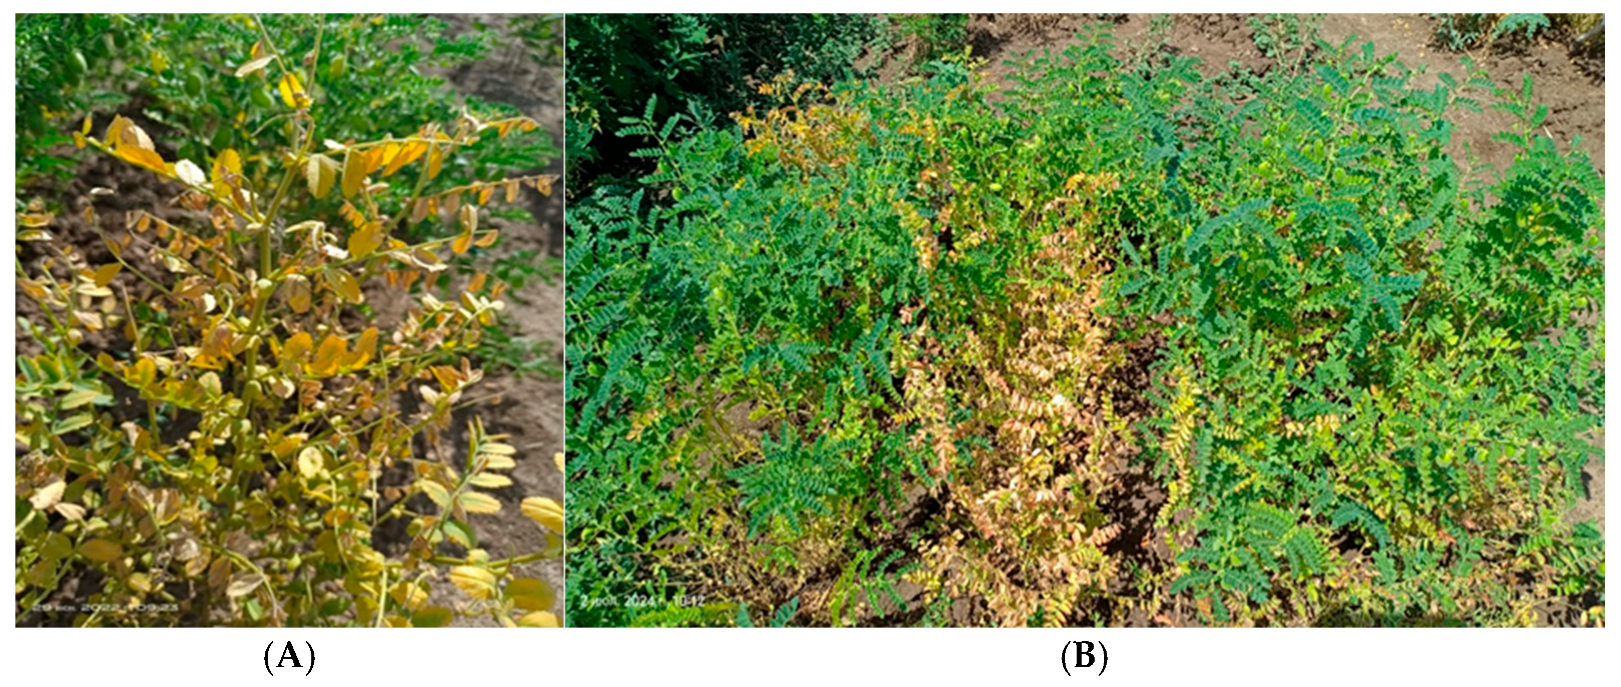
Figure 1. Evaluation of chickpea plants during the seed filling stage in naturally infected field in 1 m2 four-row plots in the Almaty region, southeastern Kazakhstan: (A) chickpea plants of the FLIP10-24C col-lection affected by Fusarium wilt; (B) germplasm accession 5858 showing the 40% Fusarium wilt affection.
Agriculture 15 01992 g001
Figure 2. Boxplot distribution of Fusarium wilt DI (%) across contrasting hydro-thermal conditions (2022–2024) in field trials conducted in southeastern Kazakhstan.
Agriculture 15 01992 g002
Figure 3. Morphological identification of chickpea pathogens isolated from infected stems: (A) mycelial growth of Fusarium oxysporum emerging from diseased chickpea stems; (B) characteristic conidia of Fusarium oxysporum. Microscope magnification ×400.
Agriculture 15 01992 g003
Figure 4. The SY flexplot of chickpea varieties grown under different hydrothermal conditions.
Agriculture 15 01992 g004
Figure 5. Molecular marker identification of Foc alleles. M, 50 bp step molecular ladder; C+, resistant control (chickpea cultivar WR-315); C−, susceptible control (chickpea cultivar C-104); (A) Foc-1 allele identification using marker CS-27 (lanes 1–10: 1, FLIP09-262C; 2, FLIP10-3C; 3, FLIP10-15C; 4, FLIP10-19C; 5, FLIP10-24C; 6, FLIP10-55C; 7, FLIP10-66C; 8, FLIP10-96C; 9, FLIP10-102C; 10, FLIP10-118C); (B) Foc-1 allele identification using marker UBC-170 (lanes 1–10: 1, FLIP09-185C; 2, FLIP09-74C; 3, 5855; 4, FLIP09-257C; 5, FLIP09-267C; 6, 5858; 7, FLIP09-61C; 8, FLIP09-262C; 9, FLIP10-3C; 10, FLIP10-15C); (C) Foc-2 allele identification using marker TA-110 (lanes 1–10: 1, Ikarda 1; 2, k107; 3, k118; 4, k1457; 5, k1221; 6, k1222; 7, k130; 8, k1457; 9, k2505; 10, k2616); (D) Foc-2 allele identification using marker TA-37 (lanes 1–10: 1, FLIP10-32C; 2, FLIP10-118C; 3, FLIP10-120C; 4, FLIP10-126C; 5, FLIP10-131C; 6, FLIP10-144C; 7, FLIP10-161C; 8, FLIP10-166C; 9, FLIP10-175C; 10, FLIP10-217C); (E) Foc-3 allele identification using marker TA-194 (lanes 1–10: 1, FLIP09-137C; 2, FLIP09-275C; 3, FLIP09-66C; 4, FLIP09-309C; 5, FLIP09-287C; 6, FLIP09-309C; 7, FLIP09-273C; 8, FLIP09-132C; 9, FLIP09-271C; 10, FLIP09-94C); (F) Foc-5 allele identification using marker TA-27 (lanes 1–10: 1, FLIP09-275C; 2, 5813; 3, FLIP09-66C; 4, FLIP09-287C; 5, FLIP09-309C; 6, 5852; 7, FLIP09-185C; 8, FLIP09-74C; 9, FLIP09-257C; 10, FLIP09-267C).
Agriculture 15 01992 g005
Figure 6. Scatter plots of principal component analyses (PCAs) for 120 chickpea (Cicer arietinum L.) genotypes on the basis of DNA marker data.
Agriculture 15 01992 g006
Table 1. Hydrothermal conditions during the study trial periods.
Month202220232024Average
May2.470.812.221.83
June0.490.060.270.27
July0.180.401.100.56
Average1.040.421.20
Table 2. Descriptive statistics of agronomic and disease resistance traits in 120 chickpea (Cicer arietinum L.) accessions under field conditions in southeastern Kazakhstan. Disease severity (DS), 0–3 scale; disease incidence (DI), %; seed yield (SY), g/m2, 1000-seed weight (TSW), g; NDVI values.
TraitYearStatistical Parameters of Chickpea Accessions
MeanStd.DCVMinMax
DI202221.514.20.66050
202318.012.50.69050
202426.818.00.67578
DS20221.570.510.3313
20231.350.570.4303
20241.580.600.3813
SY2022209.960.80.2975.2394.0
2023187.161.10.3162.4339.6
2024181.955.10.3180.5340.7
TSW2022284.148.10.16162.0384.0
2023284.251.70.18175.0391.0
2024284.348.30.17168.0389.0
NDVI20220.580.090.160.280.78
20230.520.090.180.240.75
20240.620.100.160.360.84
Table 3. Analysis of variance of the effects of year and genotype factors on Fusarium wilt resistance traits and yield in chickpea. SS, sum of squares; MS, mean square; F, statistic; df, degrees of freedom.
ParameterYearGenotype
SSMSFSSMSF
SY 53,427.226,713.67.6 ***1.007 × 1069008.69.2 ***
TSW657.5328.80.13 ns809,724.36804.425.2 ***
NDVI0.530.2729.2 ***1.70.011.6 ***
DI4703.52351.710.3 ***53,200.8447.13.2 ***
DS4.026.3 **68.60.572.8 ***
df = 2df = 119
Note(s): Significance levels are designated by asterisks (** and ***), and they correspond to probabilities p < 0.01 and p < 0.001, respectively; ns, no significant differences.
Table 4. Chickpea accessions with valuable Foc resistance alleles.
Resistant GeneChickpea Accessions
Foc-1WR-315, FLIP09-261C, FLIP09-93C, FLIP10-3C, FLIP10-15C, FLIP10-19C, FLIP10-54C, FLIP10-96C, FLIP10-102C, FLIP10-131C, FLIP10-267C, FLIP10-269C, FLIP10-275C, 28-B, Tassaj, Privo 1, Krasnokutskij 36, Sfera and k2814
Foc-2WR-315, FLIP09-81C, FLIP09-276C, FLIP09-287C, FLIP09-309C, FLIP09-273C, FLIP09-271C, FLIP09-261C, FLIP09-185C, FLIP09-74C, FLIP09-267C, FLIP09-61C, FLIP10-32C, FLIP10-120C, FLIP10-144C, FLIP10-161C, FLIP10-214C, FLIP10-274C, FLIP10-288C, k107, k1221, k2197, k 2616, Kamila, Krasnokutskij 36, Privo 1, Satty
Foc-3WR-315, 28-B, FLIP09-309C, FLIP10-15C, FLIP10-102C, FLIP10-126C, FLIP10-221C, FLIP10-244C, Ikarda 1, k107, k118, k1221, k1615, k1783, k2197, k2956, k323, k482, k612, Sfera
Foc-5WR-315, FLIP0-255C, FLIP09-137C, FLIP09-66C, FLIP09-287C, FLIP09-309C, FLIP09-273C, FLIP09-94C, 5831, FLIP09-279C, FLIP09-265C, 5846, 5849, FLIP09-93C, 5852, 5855, 5859, FLIP09-262C, FLIP10-19C, FLIP10-66C, FLIP10-102C, FLIP10-118C, FLIP10-126C, FLIP10-186C, FLIP10-214C, FLIP10-217C, FLIP10-221C, FLIP10-274C, Vektor, Zolotoj yubilejnyj, k107, k118, k1446, k2105, k2814, k2856, k612, Mal’hotra, Miras, Nurly 80, Satty, Sfera, Tassaj
Foc-1, Foc-25832, Krasnokutskij 36, Privo 1
Foc-1, Foc-3WR-315, 28-B, FLIP10-15C, FLIP10-102C, Sfera
Foc-1, Foc-5WR-315, FLIP09-93C, FLIP10-19C, FLIP10-102C, к2814, Sfera, Tassaj
Foc-2, Foc-3WR-315, k107, k1221, k2197
Foc-2, Foc-5WR-315, Satty, k 107, FLIP10-214C, FLIP09-61C, FLIP09-273C, FLIP09-309C, FLIP09-287C
Foc-3, Foc-5WR-315, FLIP09-287C, Sfera, k612, k107, k118, FLIP10-221C, FLIP10-126C, FLIP10-1, FLIP10-102C
Foc-1, Foc-3, Foc-5Sfera, FLIP10-102C
Table 5. Results of five principal component analyses (PCAs) based on DNA marker data.
PCEigenvalue% VarianceEig 2.5%Eig 97.5%
10.7723.619.628.3
20.6319.615.624.8
30.5215.812.519.0
40.4012.28.515.9
50.3711.28.814.2
Disclaimer/Publisher’s Note: The statements, opinions and data contained in all publications are solely those of the individual author(s) and contributor(s) and not of MDPI and/or the editor(s). MDPI and/or the editor(s) disclaim responsibility for any injury to people or property resulting from any ideas, methods, instructions or products referred to in the content.