Abstract
Wheat germplasm resources are an important material foundation for genetic improvement. In this study, 170 wheat germplasm resources were used from China, the International Maize and Wheat Improvement Center (CIMMYT), Europe (France, Finland, and Sweden), the United States, Canada, and Australia. Seven nutritional quality traits were evaluated for the 2019–2020 and 2020–2021 cropping seasons. The coefficient of variability for seven nutritional quality traits ranged from 6.99% to 30.65%. The average of genetic diversity (Shannon–Wiener diversity index, H′) was 1.87. The results showed that the average frequency of high-throughput competitive allele-specific PCR (KASP) markers was 69.4% on 17 KASP markers related to seven nutritional quality traits, the average of polymorphic information content (PIC) was 0.308, and the genetic effects were from 0.01% to 18.46%. One hundred and seventy wheat germplasm resources were classified into five groups at ΔK = 5 by genetic structure analysis. The first group comprised 62 germplasm resources (36.47%), the second group included 41 germplasm resources (24.11%), the third group contained 20 germplasm resources (11.76%), the fourth group contained 20 germplasm resources (11.76%), and the fifth group had 29 germplasm resources (17.06%). Germplasm resources from CIMMYT and China were found in the first group and the second group, accounting for 56.45% and 65.85%, respectively, while European germplasm resources constituted 50% of those within the fourth group. Five favorable haplotypes were identified, which were located on chromosomes 4A, 6A, 6B, and 7A: G4A1, G4A2, G6A, G6B, and G7A. Their genetic effects were 8.71%, 8.41%, 1.00%, 18.20%, and 1.16%, respectively. In the meantime, we found 12 significant SNPs of seven nutritional quality traits using haplotype analysis. The frequency of favorable haplotypes in the population ranged from 3.53% to 62.35%. Five haplotypes, G4A1, G4A2, G6A, G6B, and G7A, were beneficial, and their genetic effects were positive. Furthermore, the results offered favorable haplotypes and germplasm resources for enhancing nutritional quality.
1. Introduction
Wheat is the most widely grown and consumed crop in the world. Wheat is produced in large quantities all over the world [1]. It occupies about 30% of the global cereal crop area [2] and supplies around 20% of human nutrition [3]. At present, people are paying increasing attention to improving the nutritional quality of wheat grains and increasing production to meet different dietary needs [4]. Germplasm resources are fundamental to wheat genetic enhancement [5,6]. It is important to note that modern growing environments are complex, market demands are varied, and the utilization or innovation of wheat germplasm resources is being developed and improved [7]. Thus, the precise identification and assessment of genetic polymorphisms in wheat germplasm resources is essential for enhancing breeding efficiency and developing new wheat varieties with improved nutritional quality [8].
The rapid advancements in molecular biology have led to widely available single-nucleotide polymorphism (SNP) markers in analyzing wheat genetic diversity, identifying varieties, and mapping genes [9,10]. KASP (competitive allele-specific PCR) is a homogeneous, fluorescence-based genotyping technology that allows for the precise detection of single-nucleotide polymorphisms (SNPs) at specific loci in a genome [11]. KASP markers are widely used in marker-assisted breeding as valuable tools for genetic relationships, diversity, and the genotypic identification of germplasm resources [12]. These markers provide substantial technical support for wheat genetic enhancement and new variety development, improving both efficiency and precision in breeding [13]. A whole-genome sequencing of 428 winter wheat cultivars assessed genetic diversity, structure, principal components, clustering, and varietal relationships using the 55K SNP chip [14]. The SNP loci covered multiple chromosomes, with a polymorphism rate of 45.60%. Kou [15] employed 660K wheat chips to conduct a whole-genome sequencing of a natural population from Henan Province, identifying favorable haplotypes for preharvest sprouting resistance and discovering 38 high-quality resistant materials, including Bai xian tiao, Zhengzhou 5, Yumai 13, and Yumai 33. Furthermore, several quantitative trait loci (QTLs) of five major quality traits with pleiotropic effects were identified, where beneficial haplotypes could improve wheat protein content, wet gluten content, and sedimentation value concurrently [16]. Haplotype distribution across different wheat regions showed a significant decrease in the frequency of haplotype B in the Huang-Huai wheat region, which corresponded with a reduction in protein content. Dong et al. [17] studied five quality traits (protein content, wet gluten content, starch content, sedimentation value, and grain hardness) in 259 winter wheat varieties and found four significant haplotypes (Hap1, Hap2, Hap3, and Hap4) on chromosome 5D. Hap1 was linked to high starch content (p < 0.001), while Hap2 and Hap3 were associated with high protein content and sedimentation value (p < 0.05). The frequency of the Hap2 varied among sources, with a decreasing order: Huang-Huai winter wheat region > northern winter wheat region > foreign varieties > Yangtze River middle and lower reaches winter wheat region > southwestern winter wheat region. Regional classification facilitated the improvement of wheat genetic diversity. The Huang-Huai winter wheat region was hailed as “the granary within China’s granary”; the northern winter wheat region served as a high-latitude, high-yield model; foreign winter wheat varieties constituted an external gene and technology reservoir; the middle–lower Yangtze winter wheat region was a high-value area for rice–wheat rotation; and the southwest winter wheat region was a three-dimensional ecological gene bank. Thus, molecular markers are crucial for genotyping and evaluating wheat germplasm resources and serve as effective tools for assessing germplasm collections and exploring genetic diversity [18].
High-throughput competitive allele-specific PCR (KASP) markers are vital for improving molecular breeding, understanding genetic diversity in germplasm resources, studying population genetic structure, and classifying germplasm resources [19]. However, there has been no report on the use of KASP markers combined with favorable haplotypes for the evaluation of germplasm resources. In this study, our objective was to (1) identify 170 wheat germplasm resources from China, CIMMYT, Europe, the United States, Canada, and Australia using KASP markers and favorable haplotypes; (2) find significant SNPs of seven nutritional quality traits using haplotype analysis; (3) evaluate their contributions to genetic diversity and population structure of five favorable haplotypes. The results offer a theoretical foundation for the genetic enhancement of wheat’s nutritional quality.
2. Materials and Methods
2.1. Plant Materials
A total of 170 wheat germplasm resources were provided by the Wheat Molecular and Germplasm Innovation Research Group of Henan University of Science and Technology and the University of Melbourne. Among them, 56 materials came from China, 44 materials were from CIMMYT, and 70 materials were from the United States, the United Kingdom, and other countries and regions (France, Finland, and Sweden, etc.) (Supplementary Table S1).
2.2. Experimental Design
The 170 wheat germplasm resources were planted at the experimental field in Henan University of Science and Technology, located at Luoyang, Henan Province, China, during the 2019–2020 and 2020–2021 cropping seasons (E1, 35°02′ N, 112°45′ E). Population was planted in randomized complete block designs with three replications. Each plot consisted of a single 2.0 m row, spaced 20 cm apart, with a plant spacing of 8 cm and 25 seeds in each row. Field trials were managed according to standard practices. In 2019–2020, the content of alkali-hydrolyzable nitrogen, available zinc, and available iron in the experimental field of Henan University of Science and Technology was 66.25 mg/kg, 1.52 mg/kg, and 4.35 mg/kg, respectively. In 2020–2021, the content was 63.25 mg/kg, 1.94 mg/kg, and 4.07 mg/kg, respectively.
2.3. Phenotypic Evaluation
The determination of relevant traits of wheat germplasm resources refers to the “Technical Regulations for Regional Trials of Crop Varieties-Wheat” [20]. The protein content (GPC), wet gluten content (WCG), and sedimentation value (SV) of each germplasm resource were measured by using a near-infrared analyzer (Swedish, Perten Instruments AB., DA 7250, Hägersten, Sweden) [21]. For each material, about 50 g of grains were taken, and each germplasm resource was measured 3 times. The content of zinc (Zn) and iron (Fe) elements in wheat grains was determined by Ren et al. [22]. The content of fructan and water-soluble arabinoxylan (WE-AX) in wheat grains was determined using the method described by Zeng et al. [23].
2.4. Development of KASP Markers
KASP markers were designed based on the consensus SNP sequences from the 55K and 660K arrays and were submitted to PolyMarker (http://www.polymarker.info/ (accessed on 15 May 2024)). The detailed information on the markers is provided in Supplementary Table S2. These markers were developed based on the research of our team [24,25]. This study selected specific SNPs and used 17 KASP markers based on flanking sequences. The phenotypic traits related to the markers are shown in Supplementary Table S3. Seventeen KASP markers associated with phenotypic traits were verified in 170 materials. The reaction volume of KASP was 4.045 μL. In total, 2 μL of the DNA template was added to the 384-well plate and placed in an oven at 60 °C to dry for 30 to 40 min. Then, the remaining system was added: 2 × KASP Master mix (V4.0) 2.0 μL, mixed primers (F1 12 μmol/L, F2 12 μmol/L, R 30 μmol/L), 0.045 μL, and ddH2O 2.0 μL, dried DNA (DNA concentration approximately 30 ng/mL).
For PCR amplification: preheat at 95 °C for 15 min; denaturation at 95 °C for 15 s, annealing at 61 °C for 55 s (0.6 °C per cycle), for a total of 9 cycles; denaturation at 95 °C for 15 s, annealing at 55 °C for 60 s, for 38 cycles. The data of the amplified products were read using the BIO-RAD CFX384TM real-time PCR system (BIO-RAD, C1000 Touch, Singapore).
2.5. Data Analysis
Data analysis was conducted using Excel 2013, SPSS v16.0, PowerMarker V3.25, Origin 22b, Structure 2.3, R 4.4.1 ((ggplot2) https://cloud.r-project.org/web/packages/ggplot2/index.html (accessed on 26 July 2024)), and Haploview 4.2. (1) Data organization was conducted using Excel 2013; (2) statistical analyses, including coefficient of variation calculation, were performed using SPSS v16.0; (3) polymorphism information content (PIC) analysis of KASP primers was carried out using PowerMarker 3.25; (4) Origin 22b was used for generating favorable allele significance results and clustered heatmaps; (5) genetic diversity analysis was conducted using STRUCTURE 2.3; (6) frequency distribution analysis of germplasm resource traits and regional division were performed using R 4.4.1 (ggplot2); (7) haplotypes were analyzed using Haploview 4.2 (https://www.broadinstitute.org/haploview/downloads#JAR (accessed on 8 October 2024)).
The calculation of genetic effects is as follows:
In the formula, , , , and n represent the genotype variance, the variance of the interaction between genotype and environment, the environment variance, and the number of environments, respectively. To characterize the Shannon–Wiener diversity index (H′), each trait was separated into ten levels, from level 1 to level 10, alongside a difference of 0.5 days for each level. In the above formula, X represents the mean, and d is the standard deviation. To determine H′, the following formula was applied [26]:
where Pi represents the probability of occurrence of the i-th level of a particular trait, and Ln is the natural logarithm.
Statistical analysis was performed for the major allele frequency (MAF), gene diversity (GD), availability (Ava), and polymorphic information content (PIC) values using PowerMarker V3.25. The formula is shown below [27]:
Among them, Pi and Pj represent the frequencies of allele i and allele j, respectively, and n is the number of alleles:
ΔK was calculated based on the formula proposed by Evanno et al. [28]:
Each component of the formula is as follows: L(K): It is the value obtained for representing the model selection criterion after calculating the logarithmic likelihood value of the data at each step and undergoing a series of processing. L(K + 1): It indicates the logarithmic likelihood value at K + 1. L(K − 1): It represents the logarithmic likelihood value at K − 1. (m (|L(K + 1) − 2L(K) + L(K − 1)|): It represents the average value of the absolute value of |L(K + 1) − 2L (K) + L(K − 1)| in 20 runs. S[L(K)]: It indicates the standard deviation of L(K). This formula helps determine the actual number of clusters by calculating the changes in the logarithmic likelihood value under different K values.
3. Results
3.1. Phenotypic Variation and Diversity Analysis of Nutritional Quality Trait
The coefficient of variation (CV) for the seven nutritional quality traits of the 170 wheat germplasm resources varied from 6.99% to 30.65%, with the highest CV observed for WE-AX at 30.65% and the lowest for WCG at 6.99% (Figure 1 and Table 1). Genetic diversity (H′) of these traits ranged from 1.70 to 2.04, with Fe exhibiting the lowest H′ of 1.70 and fructan content showing the highest H′ of 2.04 (Table 1).
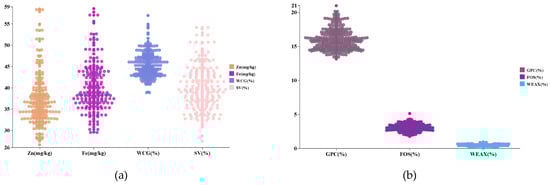
Figure 1.
Frequency distribution of nutritional quality traits in 170 germplasm resources. Note: (a) Frequency distribution of Zn, Fe, WCG, and SV; (b) Frequency distribution of GPC, FOS, and WE-AX.

Table 1.
Diversity analysis of nutritional quality traits of wheat germplasm resources.
3.2. Genetic Diversity Analysis of KASP Markers
Genetic diversity analysis was conducted on 17 KASP markers. These results revealed that all the markers exhibited polymorphisms (Table 2). The average frequency of the primary effect loci for the 17 markers was 0.694, with a minimum of 0.524 and a maximum of 0.857. The gene diversity index varied from 0.245 (KASP-4A-1) to 0.499 (KASP-7A-2), with an average of 0.388. Heterozygosity ranges from 0.429 (KASP-4A-2) to 0.924 (KASP-6A-1), with an average of 0.799. Additionally, the average PIC is 0.308, with values ranging from 0.215 (KASP-4A-1) to 0.374 (KASP-7A-4).
Table 2.
Genetic diversity analysis of 17 KASP markers.
3.3. Favorable Alleles or Haplotypes for Nutritional Quality Traits Based on KASP Markers
Seventeen KASP markers (Supplementary Table S2) were analyzed for the nutritional quality traits of the 170 wheat germplasm resources (Figure 2) (p < 0.01 or p < 0.05). Among the 170 germplasm resources (Table 3), SNP loci significantly associated with Zn content include AX-108893009, AX-110622803, AX-108932708, and AX-109957561, with favorable allele types CC, AA, GG, and GG, respectively. Germplasm resources with the advantageous alleles AX-108893009 and AX-108932708 are more common, representing 63.53% and 33.53%, respectively. The favorable allele type CC of AX-1229622, which was significantly associated with Zn and Fe contents of 40 germplasm resources, accounted for 23.52% of the total. The SNP loci significantly associated with GPC were AX-109042664 and AX-94591230, both with favorable CC allele types of 99 and 94 germplasm resources, representing 58.23% and 55.29%, respectively. The SNP loci significantly linked to WE-AX were AX-110105960, AX-110982448, and AX-110496461, with favorable allele types AA, CC, and TT of 92, 89, and 87 germplasm resources, respectively, accounting for 54.12%, 52.35%, and 51.18%. For fructan content, the significant SNP loci were AX-94578828, AX-86184295, AX-95245654, AX-95008425, AX-110954829, AX-94848105, and AX-94803120, with favorable allele types TT, TT, GG, TT, AA, GG, and GG. Among these, 119 germplasm resources had the favorable allele type AX-94578828, representing 70.00%. Moreover, 106 germplasm resources carried AX-86184295, accounting for 62.35%, and 119 germplasm resources carried AX-94848105, accounting for 70.00% of the 170 materials. Additionally, 74 germplasm resources had the favorable allele type AX-110954829, constituting 43.53%.
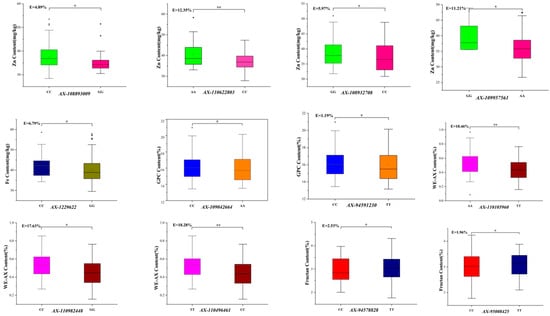
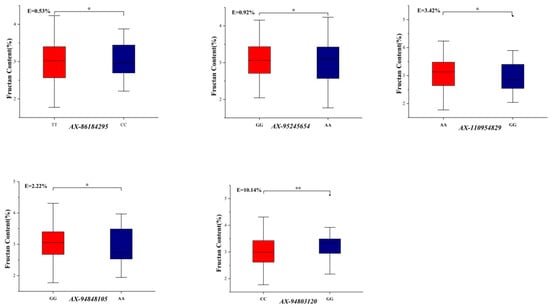
Figure 2.
Genetic effects and favorable alleles of significant markers in 170 germplasm resources. Note: * indicates p < 0.05; ** indicates p < 0.01.
Table 3.
Favorable alleles and their genetic effects in 170 germplasm resources.
Additionally, the genetic effects of the 17 significant SNP loci for the seven nutritional quality traits ranged from 0.01% to 18.46% in Table 4. The genetic effects of AX-110622803, AX-109957561, AX-1229622, AX-110105960, AX-110982448, AX-110496461, and AX-94803120 are 12.35%, 11.21%, 10.75%, 18.46%, 17.63%, 18.28%, and 10.14%, respectively.
Table 4.
Haplotypes and significant markers in 170 germplasm resources.
3.4. Genetic Structure Analysis of 170 Wheat Germplasm Resources Based on KASP Markers
The genetic structure of the wheat germplasm resources was analyzed using Structure V2.3.4 software, where K represents the assumed number of populations (clusters). One hundred and seventy germplasm resources can be categorized into five primary groups at the optimal threshold ΔK = 5, as shown in Figure 3a. The first group comprised 62 germplasm resources (36.47%), including Mazhamai, ROELFS F2007, and HOPE. The second group included 41 germplasm resources (24.11%), such as Dongfanghong 3, SONALIKA, and aphids. The third group contained 20 germplasm resources (11.76%), including WESTONIA, PEWTER, and IG 43422; the fourth group also contained 20 germplasm resources (11.76%), such as E’en 1, FRANCOLIN #1, and ZERNOGRADKA 8; and the fifth group had 29 germplasm resources (17.06%), including Biyumai, Yanda 1817, and BURT.
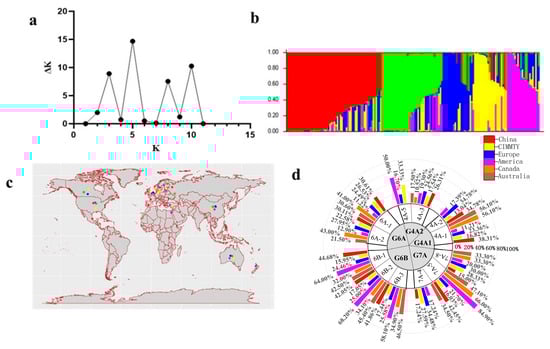
Figure 3.
Genetic structure analysis of germplasm resources based on KASP markers. Note: (a) indicates optimal ΔK value analysis; (b) shows the genetic structure analysis of germplasm resources using KASP markers; (c) shows the national distribution of germplasm resources using KASP markers; (d) shows the national classification of five haplotypes among germplasm resources. In (b,c), red, green, blue, yellow, and purple represent the groups first, second, third, fourth, and fifth, respectively.
Moreover, germplasm resources were classified by country and geographic region. Haplotype analysis could effectively differentiate between germplasm resources in China, CIMMYT, European countries, the United States, Canada, and Australia, as shown in Figure 3d. The distribution of haplotypes was consistent across different countries with the geographic classifications and the genetic structure analysis, as shown in Figure 3b. This regional division helps to gain a deeper understanding of the evolutionary dynamics of germplasm resources.
3.5. Cluster Analysis of 170 Wheat Germplasm Resources Based on KASP Markers
One hundred and seventy wheat germplasm resources were evaluated using a 0/1 matrix derived from KASP markers, as shown in Figure 4. The germplasm resources were classified into five groups based on squared Euclidean distance. Group 1 (n= 68) showed the highest GPC (16.11%) and WE-AX (Mean 0.52 mg/kg), such as Biyumai, Yanda 1817, and CAPA, in China and Europe. Group 2 (n = 20) showed maxima for fructans, WE-AX (0.57 mg/kg), GPC (16.57%), WCG (46.11%), SV (41.22%), and Fe (41.18 mg/kg), such as Chuanmai 47, PRL/2*PASTOR//KACHU, and Zernogradka 8 in CIMMYT and Europe. Group 3 (n = 54) exhibited relatively high WE-AX (0.46%) and SV (39.89%) content, such as Beijing 10, Nongda 139, and Siete Cerros T66, in China and CIMMYT. Group 4 (n = 22) exhibited relatively high fructan (3.10%), GPC (16.06%), WCG (45.58%), and SV (39.34%) in the USA and Australia, such as YEKTAY 406, RED CHIEF, and WESTONIA. Group 5 (n = 2) only contained two germplasm resources, ZIMDAR and KANRED. They exhibited superior characteristics in all respects.
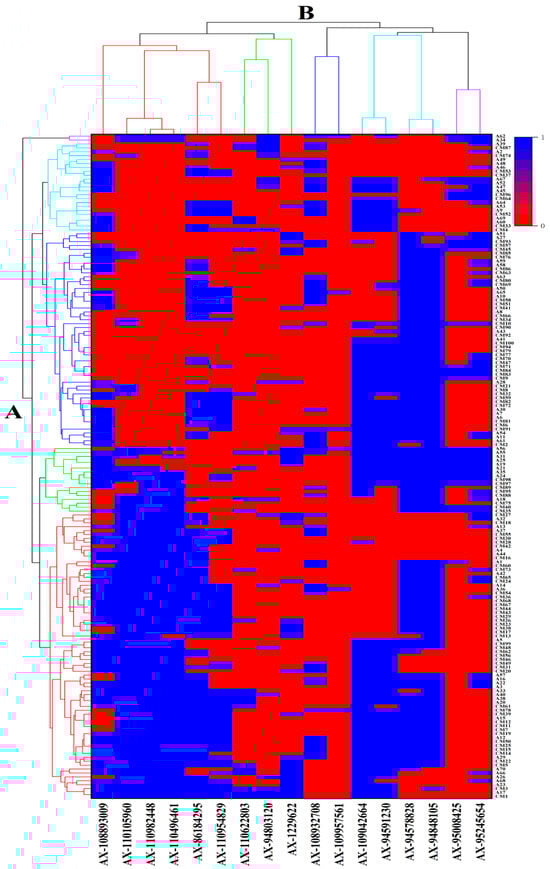
Figure 4.
Cluster heat map of germplasm resources on molecular markers. Note: A—The clustering analysis of germplasm resources was conducted based on molecular markers, using a 0–1 matrix format, where red represents 1 and blue represents 0. B—The clustering results of 17 KASP markers for different traits.
Furthermore, the advantageous alleles are designated as “1”, while the heterozygous and inferior alleles are designated as “0”. Based on the information shown in Figure 4, the alleles present in various germplasms at different SNP loci can be determined. Simultaneously, there existed interconnections among the various loci. Taking specific markers and traits as instances, a correlation existed between markers 4A-3 and 4A-5, and a correlation was present between 6A-1 and 6A-2. The clustering analysis conducted using molecular markers is in accordance with the previous haplotype analysis.
3.6. Detection and Validation of Favorable Alleles or Haplotypes in Germplasm Resources
Five advantageous haplotypes located on chromosomes 4A, 6A, 6B, and 7A were identified across the 170 wheat germplasm resources in Figure 5 and Table 4. A total of 12 significant SNPs constructed five haplotypes, with genetic effects ranging from 0.01% to 18.46% in Table 4. The frequency of advantageous haplotypes in the population varied between 3.53% and 62.35%. Except for AX-109957561, AX-1229622 and AX-95008425 exhibited frequencies below 30%; the remaining haplotype markers demonstrated relatively high frequencies. For instance, the markers AX-109042664, AX-94591230, AX-110105960, AX-110982448, AX-110496461, AX-86184295, and AX-108893009 had frequencies surpassing 50% among the 170 germplasm resources.
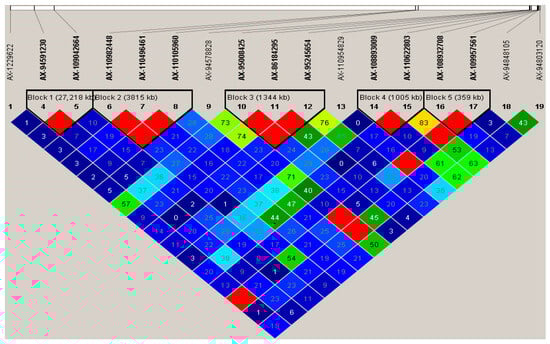
Figure 5.
Analysis of advantageous haplotypes using KASP markers.
3.7. Effects Analysis of Germplasm Resource Based on Haplotypes and Genetic Distance
The effects of 170 wheat germplasm resources on five haplotypes and genetic distances were evaluated, as shown in Figure 6, in which five haplotypes were advantageous and displayed positive genetic effects. The germplasm resources with high Zn content carrying two advantageous haplotypes, G4A1 and G4A2, with genetic effects of 8.71% and 8.41% (Figure 6E), included RED FIFE, VIKING, and PASTOR, which had higher Zn content. Germplasms with high GPC and G6A haplotypes, which had a genetic effect of 1% (Figure 6F), included CAPA and DENMARK 1, both of which showed higher GPC. Germplasms with high WE-AX content carrying the advantageous haplotype G6B, with a genetic effect of 18.20% (Figure 6G), included ZERNOGRADKA 8, Moro, and FYLGIA. Germplasms containing the advantageous haplotype G7A, the genetic effect of which was 1.16% (Figure 6H), included Zhoumai 16, VOLCANI DD1, and RELIANCE, which had higher fructan content. In conclusion, there were 19 germplasms containing all five advantageous haplotypes, including Biyu wheat, Yan Da 1817, Beijing 8, YITPI, PROVENCE, CAILLOUX, Moro, and FYLGIA, among others. (Figure 6I).
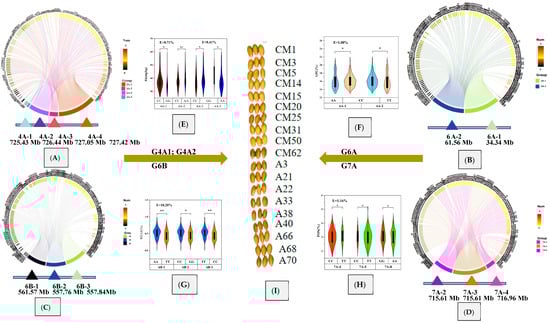
Figure 6.
Analysis of haplotypes and genetic effects on grain. Note: (A–D) represented the distribution of four favorable haplotypes among 170 germplasms; (E–H) represented the genetic effects of four different haplotypes, G4A, G6A, G6B, and G7A, among 170 germplasms; (I): germplasm resources with four advantageous haplotypes. * indicates p < 0.05; ** indicates p < 0.01.
4. Discussion
4.1. Comparative Study on the Genetic Diversity of Wheat Germplasm Resources
One hundred and seventy wheat germplasm resources from various countries and regions, including China, CIMMYT, Europe, the USA, Canada, Australia, were analyzed in this study, which revealed genetic diversity and nutritional quality in terms of fructan, water-soluble arabinoxylan, protein, wet gluten, sedimentation value, Zn content, and Fe content. The coefficient of variation ranged from 6.99% to 30.65%, while the genetic diversity index varied from 1.37 to 2.04, with an average of 1.87. These results are in contrast with those of Xu et al. [26], who reported an average genetic diversity index of 2.27 for 251 wheat germplasm resources based on agronomic and quality traits. However, these results are consistent with those of Han et al. [29] and Jin et al. [30], who observed quality trait variation of 5.08–58.18% and 1.61–13.21%, respectively. Jin et al. [30] also reported an average genetic diversity index of 1.98, which is similar to the current study. We suggest that these germplasm resources have considerable genetic potential and provide a valuable basis for wheat genetic improvement.
Based on the 17 KASP markers, an effective genotype was carried out on the 170 germplasm resources. The average GD and PIC were 0.388 and 0.308. According to Ouaja et al. [31], the average PIC of the genetic diversity analysis of 445 germplasm resources was 0.328. According to Alemu et al. [32], the 90K wheat SNP chip generated 15,338 polymorphic SNPs for analyzing the genetic diversity and population structure of 192 wheat germplasms. Across the whole genome, the average Nei’s gene diversity was 0.246, and the average polymorphic information content was 0.203. It can be seen that the findings of this study are consistent with those of Ouaja et al. [31] and Alemu et al. [32]. In addition, this study pointed out that the KASP-7B-2 marker on chromosome 7B exhibited the lowest PIC value of 0.215, indicating low polymorphism, whereas the KASP-7A-4 marker on chromosome 7A showed the highest PIC value of 0.374. These loci hold significant application value for the genetic improvement of wheat nutritional quality.
4.2. Research on the Identification of Germplasm Resources Using Molecular Markers, Advantageous Alleles, and Advantageous Haplotypes
In this study, five advantageous haplotypes were identified on chromosomes 4A, 6A, 6B, and 7A. These haplotypes comprised 12 SNP loci associated with various traits in the germplasm resources, and genetic effects ranged from 1% to 18.20%. Among these, five haplotypes demonstrated significant benefits for traits such as GPC, Zn, and FOS. Wang et al. [12] identified eighteen SNP markers on chromosomes 1B, 1D, 2B, 2D, 3B, 3D, 7A, and 7B, which accounted for 8.68–14.07% of the phenotypic variation. Haplotype analysis of colocalized SNPs indicated that 10 SNPs could categorize the tested materials into two haplotypes, with notable differences in root traits. In this study, the identification of germplasm resources was demonstrated using advantageous alleles and advantageous haplotypes. The frequency of favorable alleles can strengthen genetic improvement and trait optimization.
Wang et al. [33] designed KASP markers to perform haplotype detection on 42 wheat varieties (lines) developed in Yunnan Province and observed that only five varieties (lines) among the tested materials exhibited a high grain weight haplotype combination involving three thousand kernel weight genes: TaCwi-A1a/Hap-6A-A/Hap-H. Wu et al. [34] assessed drought tolerance during germination in 46 wheat varieties collected from the Huang-Huai-Hai wheat region, confirming the utility of three drought-related molecular markers. They also utilized molecular markers to examine the haplotype distribution of drought-related genes 1-feh-w3, TaDreb-B1, and TaN-RX-B1. Eventually, they identified 14 wheat varieties with enhanced drought tolerance, including Xumai 36, Zhongzhi 0914, Tunmai 127, Luomai 26, and Bainong 418. This study showed that integrating germplasm clustering with favorable haplotype analysis is effective in selecting superior breeding varieties. In this study, 19 germplasm resources were found to possess all five advantageous haplotypes, with notable examples including Biyumai, Yanda 1817, Beijing No. 8, YITPI, PROVENCE, CAILLOUX, Moro, and FYLGIA. These resources served as a basis for future quality breeding efforts. Moreover, this approach was consistent with Du’s [35] method. Thirty-two seedling-stage powdery mildew-resistant materials, thirty-six adult-stage disease-resistant materials, and 10 materials resistant across all growth stages were screened through SNP loci using Du’s method. Additionally, the comprehensive comparison of multiple traits using haplotypes was limited in previous studies. This study’s application of this method enabled the identification of several superior germplasm resources, establishing a robust foundation for the advancement and enhancement of wheat genetics.
4.3. Comprehensive Evaluation of Germplasm Resources Based on Molecular Markers and Phenotypic Analysis
This study used a 0/1 matrix derived from molecular markers to perform a cluster analysis of germplasm resources. The 170 germplasm resources were classified into five groups. The first group comprised 68 germplasm resources (e.g., Biyumai, Yanda 1817, and CAPA) from China and Europe, with the highest Zn content; its Fe content, GPC, and WE-AX content were also relatively higher. The second group included 20 germplasm resources (e.g., Chuanmai 47, PRL/2*PASTOR//KACHU, and Zernogradka 8) from CIMMYT and Europe, in which the fructan content, WE-AX content, GPC, WCG, SV, and Fe content were the highest. The third group consisted of 54 germplasm resources from China and CIMMYT (including Beijing 10, Nongda 139, and Siete Cerros T66), exhibiting relatively high WE-AX content and SV. The fourth group contained 22 germplasm resources concentrated in Europe, the USA, and Australia (e.g., YEKTAY 406, RED CHIEF, and WESTONIA), with relatively higher fructan content, GPC, WCG, and SV. The fifth group contained two germplasm resources (ZIMDAR and KANRED), which exhibited superior characteristics across all traits. The above results were in congruence with the research findings of Liu et al. [36]. Liu Yike et al. subjected 240 wheat varieties to whole-genome scanning and classified them into seven clusters through cluster analysis. Different clusters contained lineages from various regions. It was also consistent with the result of Lu et al. [37], who clustered 150 wheat germplasm resources into three groups. Evidently, the findings of this study were consistent with the research on the germplasm resources of 40 newly introduced CIMMYT materials conducted by Jin et al. [38]. From a regional perspective, certain patterns emerged in the cluster analysis; for example, germplasm resources from China, Mexico, and the USA were relatively concentrated in the first group. However, other groups showed a significant presence of germplasm resources from Europe, China, and the USA. These observations showed that wheat germplasm resources exhibit specific genetic differences but are similar among regions. Such findings offer valuable insights for future research and utilization.
Throughout the research process, the analysis of molecular markers and phenotypic traits effectively identified germplasm resources with distinct characteristics, offering a robust theoretical foundation for molecular marker-assisted selection breeding. The application of KASP markers facilitates more precise breeding of superior varieties, significantly enhancing the efficiency and accuracy of breeding efforts and further advancing the development of the wheat nutritional quality industry.
4.4. Advancing Wheat Breeding: Germplasm Evaluation and Targeted Improvement via KASP Markers and Haplotype Analysis
In this study, we utilized 170 wheat germplasm resources from different countries and regions. The H′ ranged from 1.70 to 2.04. These results aligned with previous reports by Xu et al. [26], who documented H′ values from 2.17 to 2.30 on 251 wheat germplasm resources. Meanwhile, to ensure data reliability and account for environmental variability, we conducted a two-year replicated phenotypic evaluation and analyzed the mean values across both growing seasons. This approach was consistent with the study by Li et al. [39], who also employed a two-year evaluation period in their genetic diversity analysis of 149 spring wheat germplasm. Ultimately, this study established a screening system of germplasm resources on the molecular marker–phenotype database using 17 KASP markers. This study implemented trait-specific selection by incorporating five markers associated with advantageous haplotypes, such as Hap-4A-2 and Hap-6A-3. The advantageous alleles were combined, including the favorable allele for grain protein content (GPC) on chromosome 6A (with a phenotypic effect of 1.00%), as well as the zinc-accumulating loci on chromosomes 4A1 and 4A2 (with phenotypic effects of 8.71% and 8.41%, respectively). A core germplasm was constructed based on the genetic clustering of advantageous haplotypes, which enabled the selection of superior germplasms adapted to specific geographical environments. These results were quite consistent with the study by Rubab M et al. [40], who combined eight KASP markers with nine different traits to evaluate the drought resistance of wheat genotypes.
5. Conclusions
In this study, we found a precision method to identify and evaluate seven nutritional quality traits (Zn, GPC, fructan, WE-AX) of germplasm resources by integrating genetic diversity analysis with KASP markers, advantageous alleles, and haplotype profiling in wheat. Five haplotypes, G4A1, G4A2, G6A, G6B, and G7A, were beneficial in molecular-assisted breeding to select new varieties with enriched nutritional quality traits for wheat biofortification. Through the integration of molecular markers and phenotypic analysis, 19 superior germplasm resources were ultimately selected, including Biyumai, Yanda 1817, Beijing 8, Bima 1, Bima 4, Abbondanz, Fan 6, Yumai 2, Lumai 1, SONALIKA, YITPI, PROVENCE, CAILLOUX, IG 43425, Moro, FYLGIA, NORDIC, RELIANCE, and Chinese Spring.
Supplementary Materials
The following supporting information can be downloaded at: https://www.mdpi.com/article/10.3390/agriculture15181986/s1, Table S1: Information s of 170 wheat germplasm resources; Table S2: 17 Sequences of polymorphic KASP primers and related information; Table S3: Phenotypic data of the 17 KASP markers.
Author Contributions
Conceptualization, J.L.; Methodology, J.L.; Validation, J.S. and Q.L.; Formal analysis, Q.Y. and Z.Z.; Investigation, Z.Z., C.L. and X.J.; Resources, J.S., Q.L. and Y.Z.; Data curation, Q.Y.; Writing—original draft, Q.Y.; Visualization, Y.Z.; Supervision, C.W.; Project administration, C.W.; Funding acquisition, C.W. All authors have read and agreed to the published version of the manuscript.
Funding
The authors wish to thank the wheat molecular breeding group of Henan University of Science and Technology for providing wheat seeds. This work was supported by Henan Province Major Science and Technology Project (251100110200), Key Research Project of the Shennong Laboratory (SN01-2022-01), National Natural Science Foundation of China (32401870), Henan Province Science and Technology Research Funding Project (242102111142).
Institutional Review Board Statement
Not applicable.
Data Availability Statement
The availability of the original data in the study is included in the article and Supplementary Materials. Further inquiries can be directed to the corresponding authors.
Conflicts of Interest
The authors declare that they have no conflicts of interest.
References
- Wei, Y.M. The origin, spread and evolution of wheat in China. J. Triticeae Crops 2021, 41, 305–309. [Google Scholar]
- Li, H.Y.; Yin, G.H. Discussion on the development trend of wheat breeding in China from the perspective of national food security. Jiangsu Agric. Sci. 2022, 50, 36–41. [Google Scholar] [CrossRef]
- Ragaee, S.; Guzar, I.; Dhull, N.; Seetharaman, K. Effects of fiber addition on antioxidant capacity and nutritional quality of wheat bread. LWT—Food Sci. Technol. 2011, 44, 2147–2153. [Google Scholar] [CrossRef]
- Iqbal, M.J.; Shams, N.; Fatima, K. Nutritional quality of wheat. In Wheat-Recent Advances; IntechOpen: London, UK, 2022. [Google Scholar] [CrossRef]
- Ambati, D.; Phuke, R.M.; Vani, V.; Prasad, S.V.S.; Singh, J.B.; Patidar, C.P.; Malviya, P.; Gautam, A.; Dubey, V.G. Assessment of genetic diversity and development of core germplasm in durum wheat using agronomic and grain quality traits. Cereal Res. Commun. 2020, 48, 375–382. [Google Scholar] [CrossRef]
- Yang, M.; Yang, Z.; Yang, W.; Yang, E. Genetic diversity assessment of the international maize and wheat Improvement center and Chinese wheat core germplasms by non-denaturing fluorescence in situ hybridization. Plants 2022, 11, 1403. [Google Scholar] [CrossRef]
- Kumar, S.; Jacob, S.R.; Mir, R.R.; Vikas, V.K.; Kulwal, P.; Chandra, T.; Kaur, S.; Kumar, U.; Kumar, S.; Sharma, S.; et al. Indian wheat genomics initiative for harnessing the potential of wheat germplasm resources for breeding disease-resistant, nutrient-dense, and climate-resilient cultivars. Front. Genet. 2022, 13, 834366. [Google Scholar] [CrossRef]
- Ye, X.; Han, F. Applications of fast breeding technologies in crop impro.vement and functional genomics study. Front. Plant Sci. 2024, 15, 1460642. [Google Scholar] [CrossRef]
- Ortiz, R.; Trethowan, R.; Ferrara, G.O.; Iwanaga, M.; Dodds, J.H.; Crouch, J.H.; Crossa, J.; Braun, H.-J. High yield potential, shuttle breeding, genetic diversity, and a new international wheat improvement strategy. Euphytica 2007, 157, 365–384. [Google Scholar] [CrossRef]
- Maanju, S.; Jasrotia, P.; Yadav, S.S.; Kashyap, P.L.; Kumar, S.; Jat, M.K.; Lal, C.; Sharma, P.; Singh, G.P. Deciphering the genetic diversity and population structure of wild barley germplasm against corn leaf aphid, Rhopalosiphum maidis (Fitch). Sci. Rep. 2023, 13, 17313. [Google Scholar] [CrossRef]
- Li, S.; Zhang, C.; Li, J.; Yan, L.; Wang, N.; Xia, L. Present and future prospects for wheat improvement through genome editing and advanced technologies. Plant Commun. 2021, 2, 100211. [Google Scholar] [CrossRef] [PubMed]
- Wang, Z.; Zhang, H.Z.; Gao, X.; Shi, J.; Wang, L.H.; Li, J.F.; Fan, Z.R.; Zhao, Q.; Zhang, Y.Q. KASP marker assays for functional genes of disease resistance traits in 458 wheat cultivars (lines). Xinjiang Agric. Sci. 2022, 59, 781–786. [Google Scholar] [CrossRef]
- Rabieyan, E.; Darvishzadeh, R.; Mohammadi, R.; Gul, A.; Rasheed, A.; Akhar, F.K.; Abdi, H.; Alipour, H. Genetic diversity, linkage disequilibrium, and population structure of tetraploid wheat landraces originating from Europe and Asia. BMC Genom. 2023, 24, 682. [Google Scholar] [CrossRef]
- Lei, M.; Liu, X.; Wang, Y.; Cui, G.; Mu, Z.; Liu, L.; Li, X.; Lu, L.; Li, X.L.; Zhang, X. Genetic Diversity Analysis of Winter Wheat Germplasm Resources in Shanxi Province Based on 55K SNP Array. Sci. Agric. Sin. 2024, 57, 1845–1856. [Google Scholar] [CrossRef]
- Kou, C. Screening of Pre-Harvest Sprouting Resistant Germplasmsscreening and Excellent Genes Discovery in Wheat (Triticum aestivum L.) of Henan Province. Ph.D. Thesis, Northwest A&F University, Shaanxi, China, 2023. [Google Scholar] [CrossRef]
- Lai, X.J. Identification of QTLs in Wheat Grain Protein and its Selection and Utilization in Modern Breeding. Master’s Thesis, Northwest A&F University, Shaanxi, China, 2023. [Google Scholar] [CrossRef]
- Dong, Y.F.; Ren, Y.; Cheng, Y.K.; Wang, R.; Zhang, Z.H.; Shi, X.L.; Geng, H.W. Genome-Wide Association Study of Grain Main Quality Related Traits in Winter Wheat. Sci. Agric. Sin. 2023, 56, 2047–2063. [Google Scholar] [CrossRef]
- Alipour, H.; Abdi, H.; Rahimi, Y.; Bihamta, M.R. Dissection of the genetic basis of genotype-by-environment interactions for grain yield and main agronomic traits in Iranian bread wheat landraces and cultivars. Sci. Rep. 2021, 11, 17742. [Google Scholar] [CrossRef]
- Rehman, S.U.; Sher, M.A.; Saddique, M.A.B.; Ali, Z.; Alam Khan, M.; Mao, X.; Irshad, A.; Sajjad, M.; Ikram, R.M.; Naeem, M.; et al. Development and exploitation of KASP assays for genes underpinning drought tolerance among wheat cultivars from Pakistan. Front. Genet. 2021, 12, 684702. [Google Scholar] [CrossRef]
- National Agricultural Technology Extension Service Center. Technical Regulations for Regional Testing of Crop Varieties; NATESC: Beijing, China, 2007; pp. 1301–2007. [Google Scholar]
- Erayman, M.; Ilhan, E.; Eren, A.H.; Güngör, H.; Akgöl, B. Diversity analysis of genetic, agronomic, and quality characteristics of bread wheat (Triticum aestivum L.) cultivars grown in Turkey. Turk. J. Agric. For. 2016, 40, 83–94. [Google Scholar] [CrossRef]
- Ren, P.; Zhao, D.; Zeng, Z.; Yan, X.; Zhao, Y.; Lan, C.; Wang, C. Pleiotropic effect analysis and marker development for grain zinc and iron concentrations in spring wheat. Mol. Breed. 2022, 42, 49. [Google Scholar] [CrossRef]
- Zeng, Z.; Wang, C.; Wang, Z.; Han, Z.; Wang, L.; Lan, C. Genetic analysis and gene detection of fructan content using DArT molecular markers in spring bread wheat (Triticum aestivum L.) grain. Mol. Breed. 2020, 40, 23. [Google Scholar] [CrossRef]
- Hong, Z.; Zeng, Z.; Li, J.; Yan, X.; Song, J.; Yan, Q.; Li, Q.; Zhao, Y.; Liu, C.; Jing, X.; et al. Gene Mining and Genetic Effect Analysis Reveal Novel Loci, TaZn-2DS Associated with Zinc Content in Wheat Grain. Agriculture 2025, 15, 124. [Google Scholar] [CrossRef]
- Li, Q.; Zeng, Z.; Zhao, Y.; Li, J.; Chen, F.; Wang, C. Genome-wide association study and linkage mapping reveal TaqW-6B associated with water-extractable arabinoxylan content in wheat grain. Theor. Appl. Genet. 2024, 137, 166. [Google Scholar] [CrossRef]
- Xu, N.L.; Wang, X.-H.; Ma, D.-H.; Yang, J.; Li, Q.-F.; Liu, F.-L.; Liu, C.-X.; Liu, G.-H.; Zhang, X.-G.; Wang, Z.-J. Genetic diversity analysis of main agronomic and quality traits of 251 wheat germplasm resources. J. South. Agric. 2021, 52, 2404–2416. [Google Scholar] [CrossRef]
- Xue, W.; Zhang, W.; Bi, J.; Tian, J.; Zhao, Y.; Tai, L. Comprehensive evaluation based on grey correlation degree analysis of wheat varieties of regional test. Anhui Agric. Sci. Bull. 2022, 28, 88–90. [Google Scholar] [CrossRef]
- Evanno, G.; Regnaut, S.; Goudet, J. Detecting the number of clusters of individuals using the software STRUCTURE: A simulation study. Mol. Ecol. 2005, 14, 2611–2620. [Google Scholar] [CrossRef]
- Han, X.; Yang, D.D.; Kong, X.X.; Zhang, P.F.; Jin, J.M.; Su, Y.Z.; Zhao, G.X.; Zhao, G.J. Genetic Diversity Analysis of Quality Traits and Gliadin in 200 Wheat Germplasm Resources. Crops 2024, 1–13. [Google Scholar] [CrossRef]
- Jin, Y.; Song, Q.; Song, J.; Chen, L.; Zhao, L.; Chen, J.; Bai, D.; Zhu, T. Comprehensive Evaluation of 69 Wheat Germplasm Resources. J. Agric. Sci. Technol. 2024, 26, 33–45. [Google Scholar] [CrossRef]
- Ouaja, M.; Bahri, B.A.; Aouini, L.; Ferjaoui, S.; Medini, M.; Marcel, T.C.; Hamza, S. Morphological characterization and genetic diversity analysis of Tunisian durum wheat (Triticum turgidum var. durum) accessions. BMC Genom. Data 2021, 22, 3. [Google Scholar] [CrossRef] [PubMed]
- Alemu, A.; Feyissa, T.; Letta, T.; Abeyo, B. Genetic diversity and population structure analysis based on the high density SNP markers in Ethiopian durum wheat (Triticum turgidum ssp. durum). BMC Genet. 2020, 21, 18. [Google Scholar] [CrossRef]
- Wang, M.; Dong, Q.F.; Gao, S.A.; Liu, D.Z.; Lu, S.; Qiao, P.F.; Chen, L.; Hu, Y.G. Genome-Wide Association Studies and Mining for Favorable Loci of Root Traits at Seedling Stage in Wheat. Sci. Agric. Sin. 2023, 56, 801–820. [Google Scholar] [CrossRef]
- Wu, X.J.; Jiang, H.; Song, L.T.; Fang, F.; Chen, X.D.; Hu, X.; Huang, Z.W.; Li, G.; Hu, T.Z.; Ru, Z.A. Comprehensive Evaluation on Drought Resistance of Some Wheat Cultivars in Huang-Huai-Hai Region and Validation of the Related Molecular Markers. J. Triticeae Crops 2023, 43, 270–278. [Google Scholar]
- Du, X.J. Powdery Mildew Resistant Germplasms Screening and Excellent Genes Discovery in Wheat (Triticum aestivum L.) of Henan Province. Ph.D. Thesis, Northwest A&F University, Shaanxi, China, 2021. [Google Scholar] [CrossRef]
- Zhang, Y.-Q.; Zou, J.; Liu, Y.-K.; He, W.-J.; Zhu, Z.-W.; Tong, H.-W.; Gao, C.-B.; Chen, L.; Zhu, G. Revealing the genetic diversity of wheat varieties(lines) in China based on SNP markers. Acta Agron. Sin. 2020, 46, 307–314. [Google Scholar] [CrossRef]
- Lu, M.A.; Peng, X.A.; Zhang, L.; Wang, J.L.; He, X.F.; Zhu, Y.L. Genetic diversity of wheat breeding parents revealed by 55K SNP-based microarray. Acta Agron. Sin. 2023, 49, 1708–1714. [Google Scholar]
- Jin, Y.; Ma, H.; Song, Q.; Song, J.; Zhao, L.; Chen, J.; Bai, D.; Zhou, B.; Zhu, T. Comprehensive evaluation of genetic diversity of CIMMYT wheat germplasm resources introduced into Huang-Huai wheat region. Jiangsu Agric. Sci. 2024, 52, 46–51. [Google Scholar] [CrossRef]
- Li, X.; Mu, L.; Ling, P. Genetic Diversity Analysis of 149 Spring Wheat Germplasm Resources. J. Cold-Arid. Agric. Sci. 2024, 3, 531–537. [Google Scholar] [CrossRef]
- Rubab, M.; Jannat, S.; Freeg, H.; Abbas, H.; Attia, K.A.; Fiaz, S.; Zahra, N.; Uzair, M.; Inam, S.; Shah, A.H.; et al. Evaluation of functional kompetitive allele-specific PCR (KASP) markers for selection of drought-tolerant wheat (Triticum aestivum) genotypes. Funct. Plant Biol. 2023, 51, FP23032. [Google Scholar] [CrossRef]
Disclaimer/Publisher’s Note: The statements, opinions and data contained in all publications are solely those of the individual author(s) and contributor(s) and not of MDPI and/or the editor(s). MDPI and/or the editor(s) disclaim responsibility for any injury to people or property resulting from any ideas, methods, instructions or products referred to in the content. |
© 2025 by the authors. Licensee MDPI, Basel, Switzerland. This article is an open access article distributed under the terms and conditions of the Creative Commons Attribution (CC BY) license (https://creativecommons.org/licenses/by/4.0/).