Abstract
This study presents an operational and robust method for detecting and dating cereal harvest events using temporal stacks of Copernicus Sentinel-2 imagery and crop and fields border information from ancillary records. The proposed approach is exempt from training data, thereby enabling its application across diverse geographical contexts. The method was used to generate 10 m resolution maps of harvest dates for all wheat and barley fields in 2021, 2022, and 2023 in Castilla y León, a major cereal-producing region of Spain. This work also investigates the use of a reference dataset derived from real time kinematic records (RTK) in agricultural machinery as an alternative source of large-scale in situ data reference as for Earth observation-based agricultural products. The initial comparison of annual harvest date maps with the RTK-based reference datasets revealed that the temporal lag in the detection of harvest events between Earth observation-derived maps and reference harvest dates was less than 10 days for 65.7% of fields, while the temporal lag was between 10 and 30 days for 26.1% of the fields. The 3-year average root mean square error of the lag between harvest dates in the reference dataset and maps was 16.1 days. An in-depth visual analysis of the Sentinel-2 temporal series was carried out to understand and evaluate the potential and limitations of the RTK-based reference dataset. The visual inspection of a representative sample of 668 fields with large temporal lags revealed that the date of harvest of 41.11% of these fields had been correctly identified in the Sentinel-2 based maps and 16.43% of them had been incorrectly identified. The visual inspection could not find evidence of harvest in 10.52% of the analyzed fields. Monte Carlo simulations were parameterized using the findings of the visual inspection to build a series of synthetic reference datasets. Accuracy metrics calculated from synthetic datasets revealed that the quality of the harvest maps was higher than what the initial comparison against the RTK-based reference dataset suggested. The date of harvest was registered within 10 days in both the maps and the synthetic reference datasets for 90.5% of the fields, the root mean squared error of the comparison was 9.5 days, and harvest dates were registered in the Sentinel-2 based maps 2 days (median) after the dates registered in the reference dataset. These results highlight the feasibility of mapping harvest dates in cereal fields with time series of high-resolution satellite imagery and expose the potential use of alternative sources of calibration and validation datasets for Earth observation products. More generally, these results contribute to defining plausible targets for monitoring of agricultural practices with Earth observation data.
1. Introduction
The continuous acquisition of information in agricultural ecosystems is crucial to enhance crop management, food security, and environmental sustainability. Since the 1980s, Earth observation (EO) has become an integral source of information for agricultural monitoring over large extents. EO based initiatives have demonstrated their value to provide information to assess essential agriculture characteristics including crop area [1,2,3,4], irrigation and drought management [5], disease and pest control, phenology monitoring [6,7,8], and ultimately yield and production assessment [9]. For a more detailed description, Weiss et al. [10] produced a comprehensive review of remote sensing initiatives for agriculture applications. The combination of satellite imagery and crop growth models has also been instrumental in generating more precise forecasts of yields [11,12,13] and other relevant agronomic variables such as crop phenology [14], carbon budget [15,16], nutrient content [17], and water use [14]. More comprehensive reviews of the integration of remote sensing and crop modelling are available in dedicated manuscripts [18,19,20].
Traditionally, agricultural monitoring of management practices has been constrained to moderate-resolution sensors that allowed high frequency of observations. Therefore, most research has focused on regions with large agricultural fields and where the requirement for high spatial granularity was not a limitation [2,4,21,22,23,24]. Today, several international initiatives operationally collect and analyze moderate resolution remote sensing data on a regular basis to provide global and regional crop production projections. Some examples include the Group on Earth Observations Global Agricultural Monitoring Initiative (GEOGLAM) [25], the JRC-EC Monitoring of Agricultural Resources (MARS) [26], and the Famine Early Warning Systems Network and the Anomaly Hotspot of Agricultural Production (ASAP) [27] or the Famine Early Warning System Network [28,29]. Over the years, the gradual increase in high-resolution sensors (10–30 m) and the subsequent higher temporal frequency of observations are enabling large scale EO-based agriculture monitoring in regions with more granular and heterogeneous agricultural landscapes [30,31,32,33,34,35,36].
Crucial to all these applications is the near real-time monitoring of agricultural practices. Indeed, there is a growing recognition of the role of agricultural management practices for the provision of ecosystem services, soil protection, and biodiversity conservation [37,38,39,40]. However, monitoring these practices using Earth Observation (EO) presents unique challenges. While annually stable variables like crop type can potentially be detected with images from multiple acquisition windows, events associated with management practices such as mowing and harvest operations often have short-lived spectral impacts on land surfaces, making their detection more difficult, as images at the right acquisition period are required.
Since 2014, the Copernicus program, the EO component of the European Union Space Programme, has provided high-resolution optical (Sentinel-2) and radar (Sentinel-1) data with five- to six-day revisit periods. This increased availability of EO data has stimulated research into crop monitoring and agricultural management applications. Initial efforts centred on crop mapping and the detection of various agricultural practices (e.g., mowing, green cover, etc.). Examples include early-season mapping of winter crops using Sentinel-2 optical imagery [41], crop type mapping with multitemporal optical imagery [42,43], or the combination of both Sentinel 1 and Sentinel 2 [44]; mowing and mowing intensity in grassland using Sentinel-2 imagery [45], Sentinel-1 C-band SAR [46], and the combination of Sentinel-1 and Sentinel-2 [47]; or cover crop detection [48]. The advancement of Earth Observation (EO) techniques in agricultural monitoring requires substantial quantities of accurate and current in situ data for calibration and validation purposes. Yet, in situ data are often scarce, limiting the scope of studies to relatively small geographical areas, and preventing scalability and deployment of local results. Some studies have successfully exploited existing large-scale in situ data sources for calibration and validation of EO products. For example, the Land Use and Land Cover Survey (LUCAS) [49,50] has been used as training data to create high-resolution pan-European crop type maps from Sentinel 1 [51] and Sentinel 2 [52] imagery. However, surveys like LUCAS do not take place on an annual basis, which limits their use or calibration and validation of annual features. At the national level, several programs have established frameworks to monitor crop development in situ over the season on a regular basis, such as the Germany National Meteorological Service [53] and Cere’Obs in France. Furthermore, several studies have explored alternative data sources such as phenocams as a potentially valuable tool for monitoring plant growth and health across Europe [54,55,56]. This study focuses on the identification of harvest dates in cereal fields. Cereals are a predominant crop type in numerous global regions and their cultivation significantly influences agricultural landscapes. Determining the harvest date of cereal fields is critical for several reasons. Traditionally, it was assumed that all sown land would be harvested at the end of the season. However, this assumption may be weakening due to factors such as geopolitical conflicts, climate change-induced droughts and extreme weather events [57], and market instability, which may result in some cultivated areas not being harvested. This uncertainty may cause bottlenecks in agricultural supply chains. Furthermore, the progression of harvest activities in cereal-dominated regions can significantly influence landscape configuration and associated ecosystem services. This study introduces a consistent approach to mapping cereal (wheat and barley) harvest dates in operational settings using dense Sentinel 2 image stacks. The method does not require training data and can be easily calibrated with existing data sources. Due to its simplicity, this approach is suitable for scaling up, and since agricultural operations in cereal fields exhibit high homogeneity across different latitudes, the method can be adapted to various geographical contexts. This work has three main objectives: (1) propose a robust, scalable, and traceable approach for detection of date of harvest in cereal fields; (2) explore the potential and limitations of alternative reference datasets for the validation of EO-based products on agricultural management practices; (3) improve our understanding of capabilities and the limitations of the analysis of dense stacks of Sentinel 2 data to monitor agricultural practices.
2. Materials and Methods
2.1. Study Area and Data
The area of the study is the region of Castilla y Leon (Spain). Castilla y Leon covers 94,222 km2 in the northern plateau of the Iberian Peninsula, with latitudinal and longitudinal ranges of 3.1 and 4 degrees, respectively. The average altitude over the sea level of the region is approximately 830 m, with the lowest elevation at 183 m and the highest peak at 2649 m above mean sea level (Figure 1). Castilla y León is a major agricultural region in Spain, and cereals like wheat, barley, rye, oats, and sunflowers are among the most common crops in the region. Cereals in Castilla y Leon cover on average an area of 16,750 km2 every year distributed across 1,149,829 fields. The study focused on winter wheat and winter barley fields, which account for 992,917 fields and comprise 86% of the cereal fields in the study area. The median field size of these two crops is 0.61 ha. The location and perimeters of the cereal fields were obtained from the geospatial applications (GSA) for 2021, 2022 and 2023. GSAs are part of the declarations farmers must submit to qualify for agricultural subsidies under the European Common Agricultural Policy (CAP) and include, among others, information about cultivated crops, field perimeters, and location.
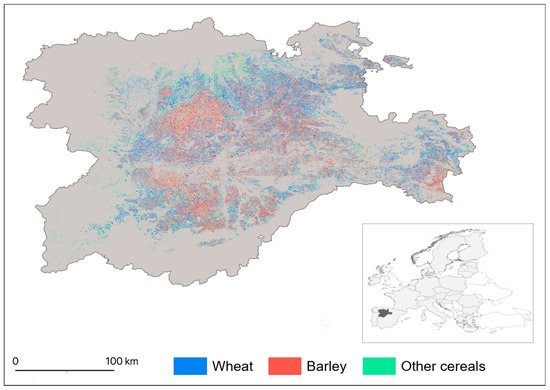
Figure 1.
Map of the spatial distribution of wheat, barley and other cereals in Castilla y Leon obtained from the GSA for year 2022. Inset map shows the location of Castilla y Leon (dark grey) in the European Union (light grey).
For each year of study, stacks of Sentinel-2 images were created for the period from 1 June to 30 August and Copernicus Sentinel-2 L2A imagery was obtained from Google Earth Engine Harmonized Sentinel-2 MSI collection [58]. The Google Earth Engine ‘Cloud Score+ S2_HARMONIZED’ dataset was used to mask out clouds and cloud shadows in the L2A Sentinel-2 images. Cloud Score+ is a quality assessment processor for medium-to-high resolution optical satellite imagery [59]. This dataset provides a cloud score that grades the usability of individual pixels based on a spectral distance between the observed pixel and a theoretical clear reference observation (e.g., 0 to 1). For this study, the cloud score value was set at 0.6. While the threshold selection may depend on the specific application, a value of 0.60 has been demonstrated a reasonable choice for most analyses [59]. Real-time kinematic positioning (RTK) coordinates were acquired by the Technical Agrarian Institute of Castilla y Leon (ITACyL). Real-time kinematic positioning (RTK) is a satellite navigation technique used to enhance the precision of position data derived from satellite-based positioning systems. For this, ITACyL relies on a network of fifty reference stations strategically located across the territory to provide corrections to signals from the Global Positioning System (GPS), the European GALILEO system, and the Russian GLONASS system. Based on these data, and to protect farmers’ privacy, ITACyL provided information in the form of single daily binary rasters with a spatial resolution of 10 m. These rasters indicated the presence or absence of agricultural machinery and encompassed the entire territory of Castilla y León for the months of June, July, and August in the years 2021, 2022, and 2023. RTK records are not exhaustive, as not all the agricultural machines operating in the region provide RTK records.
2.2. Methods
This study developed a method to detect harvest dates in cereal fields using dense stacks of Sentinel-2 imagery. The approach exploits changes in reflectance in the Sentinel-2 red wavelength (664.6–664.9 nm) throughout the cereal growing season. Vegetation indices, such as the Normalized Difference Vegetation Index (NDVI), have been widely employed in remote sensing for monitoring vegetation dynamics. However, the analysis of their temporal profiles encounters certain limitations when applied to crop monitoring. Distinguishing between senescence and harvest-related events based solely on vegetation indices can be challenging, as both processes may lead to similar changes in the vegetation index values. The temporal fluctuations in the spectral response of cereal fields in the red wavelength, however, provide valuable information to identify and date harvest events. Red reflectance, typically low during the growing season, gradually increases as chlorophyll content drops (senescence) and reaches a maximum immediately after harvesting due to the high reflectance of cereal stubble left by the harvester (Figure 2 and Figure 3).
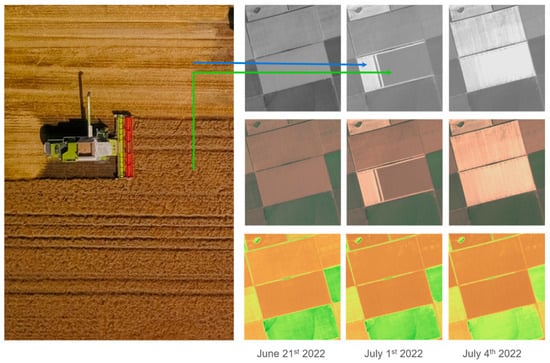
Figure 2.
Graphic description of the basis for the detection of harvest events with dense stacks of Sentinel 2 imagery. Harvested surfaces in cereal parcels have higher reflectance in the red wavelength (Sentinel 2A: 664.6, Sentinel 2B: 664.9 nm) than cereal parcels at senescence stage or parcels at different phenological stages (Top series of images). In the series of images in the middle the distinction is also apparent in the sequence of true colour images (blue bands: 492.4/492.1 nm, green bands: 559.8/559.0 nm, red bands: 664.6/664.9 nm), but not in the sequence of normalized difference vegetation (NDVI) images. The blue arrow in the image identifies an already harvested part of a cereal field. The green arrow marks the part of the same field that has not been harvested yet.
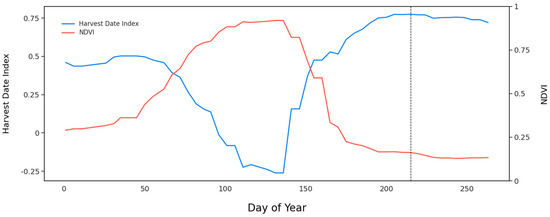
Figure 3.
Temporal profiles of normalized difference vegetation index (NDVI) and harvest date index for a field in 2022 cultivated with cereal in the study area. The vertical dashed black line represents the date of harvest as registered in the RTK records for the parcel. The NDVI profile displays the phenological cycle of the crop, with a peak value around May (DOY 120–150) and a subsequent senescence. The harvest date index profile shows a gradual increase after crop senescence, and a peak between mid-July and August (DOY 190–240), corresponding to the higher reflectance in the red wavelength associated with the presence of stalks in harvested fields.
A specific spectral index (harvest date index) was proposed to take advantage of this behaviour. This index calculates the normalized difference in the red wavelength at any given time and a pre-established reference period. The formula is as follows:
where HDI is the harvest date index; B4 is the surface reflectance in Sentinel 2 band 4 at a given point in time; B4ref is the surface reflectance in Sentinel 2 band 4 during the reference period. The reference period was defined as the median value composite of cloud-free observations during a predefined period at the peak of the vegetative season (a 30-day temporal window between April and May was adopted in this study).
The harvest date index was calculated for all cloud-free observations after the reference period. The date of harvest at pixel level was assigned to the acquisition date of the image with the highest harvest date index value. To eliminate local maxima due to undetected clouds, the maximum harvest date index value was defined as the 95th percentile of the index values during the growing season. The harvest date was assigned to the acquisition date of the first cloud-free observation equal to or greater than the seasonal maximum harvest date index value for a given pixel, according to the following formulas.
Let (T = {t_1, t_2, t_3…, t_n}) be an ordered sequence of image acquisition dates {i}, for i ∈ {1, 2, …, n}
where HDIt is the harvest date index at a given point in time; P95 is the 95th percentile of the harvest index values registered during the season; HDImax is the maximum harvest index registered during the season; HDImean and HDISTD are, respectively, the multiannual mean and standard deviation of the harvest date index during the summer months (June to August). These parameters were calibrated from the values of the index for cereal pixels in the crop maps of previous years [60]. Alternatively, additional tests indicated that historical calibration parameters could also be replaced by HDI mean and standard deviation values obtained from the population of wheat and barley fields in the year of analysis; doh is the date of harvest at pixel level; C1 is condition in formula [2]; C2 is condition in formula [3]. Finally, the harvest date for each field was estimated as the mode of the pixel values within the field (Figure 4).
doh = argmin {i: C1(t_i) ∧ C2(t_i), for i ∈ {1, 2, …, n}}
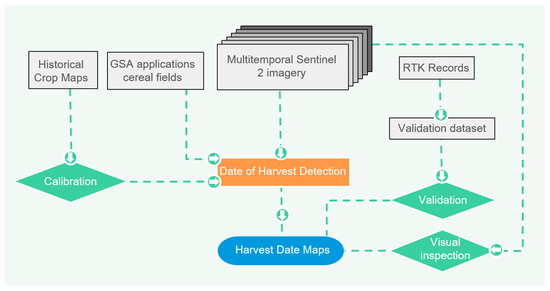
Figure 4.
Flowchart illustrating Sentinel-2 based date of harvest monitoring approach.
3. Results
The proposed method was employed to generate 10 m spatial resolution maps with harvest date information for each wheat and barley field in the study area for years 2021, 2022, and 2023. These maps, hereafter “DoH maps”, allowed the generation of a calendar of harvest operations in Castilla y Leon for the three study seasons (Figure 5). The annual curves indicate that harvest of cereal fields begins around DOY 140 and finishes around DOY 230. The seasonal distribution of the operations follows a bimodal curve, with a first lower peak at DOY 160 and a second main peak around DOY 200. The inter-annual variations between the curves can be attributed to the specific climatic conditions of each year. For instance, the curve for year 2022 results in an earlier peak, related to the drier conditions of that season (Figure 5).
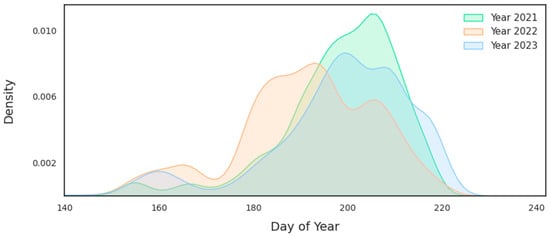
Figure 5.
Density histograms of the harvest calendar for years 2021, 2022, and 2023.
The DoH maps also exposed the spatial and temporal heterogeneity of harvest operations across the study area (Figure 6), with some locations in which harvest is concentrated within a few days, and others where harvest operations can span several weeks. These local patterns are also discernible at the regional level, where values aggregated on a 1 km grid illustrate a pattern in which cereal fields are first harvested in the warmer and lower altitude center, before gradually moving to the cooler high-altitude locations of the periphery (Figure 7). This general trend is subject to annual variations related to the specific meteorological conditions of each season. The annual DoH maps show that the length of the harvest campaign varies from year to year, without a clear spatial pattern, lasting between 5 and 15 days in more than 82% of the cultivated area (Figure 7), and more than 20 days in less than 8% of the cultivated area, often located in the less productive locations.
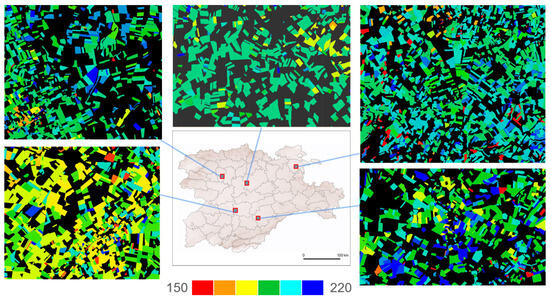
Figure 6.
Example date of harvest 10 m spatial resolution map at five locations. Each cereal parcel is assigned a single date.
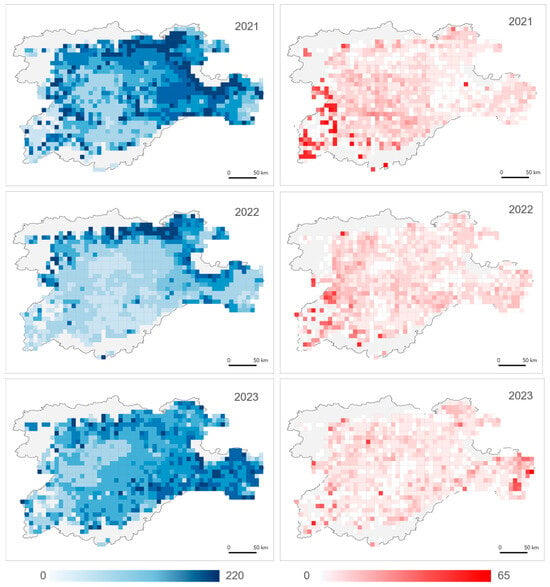
Figure 7.
Median date (day of year) of harvest maps (1 km grid) of study area in three consecutive years (left column) and time span of detected harvest dates (right column). Time span was defined as the number of days between the 95th and 5th percentiles of the dates of harvest detected for the parcels in a grid cell.
Figure 8 delineates the spatial distribution of Growing Degree Days (GDD) and their interannual variability within the designated study region. The GDD spatial distribution is primarily influenced by topographical variables, such as elevation and relief, manifesting discernible interannual differences consequent to the variability in annual meteorological conditions. Visual comparative analysis reveals that spatial patterns analogous to those observed in the progression of harvest campaigns, as depicted in Figure 7, can be tentatively recognized. Moreover, the temporal discrepancies in the initiation of harvest across consecutive years demonstrate a concomitant relationship with the fluctuations presented in the annual GDD charts. While operational and regulatory factors may contribute to some extent, it is predominantly the annual climatic patterns that govern the chronology of the harvesting period within the study area, as well as its interannual variations.

Figure 8.
Growing degree-day (GDD) estimated in July (DOY 210) for 2021, 2022, and 2023 in Castilla y Leon. GDD was computed from temperature of air at 2 m above the surface (11,132 m resolution) extracted from ERA5-Land reanalysis dataset of the European Centre for Medium Weather Forecast [61]. Calculations were carried out in Google Earth Engine.
Comparison with Reference Dataset
RTK positions of agricultural machinery recorded in the field were used to generate a reference dataset of cereal harvest dates. This dataset was developed under the initial working assumption that RTK positions recorded within cereal fields during the summer months (June, July, and August) were likely associated with harvest activities. The RTK records were organized in daily binary rasters covering the entire study area. Each raster contained the locations where the RTK positions had been recorded on that day. For each year, the daily rasters were consolidated into monthly single-band images. Fields with records in less than 30% of their area were excluded from the analysis to eliminate fields potentially contaminated with RTK readings along neighbouring roads or machinery movements within the field. The harvest date for each field was determined as the day with the highest number of RTK records within its boundaries (Figure 9). The resulting reference dataset comprised 167,589 fields (46,220 for 2021, 61,939 for 2022, and 59,430 for 2023), representing an average sampling of 5.5% for the three years.
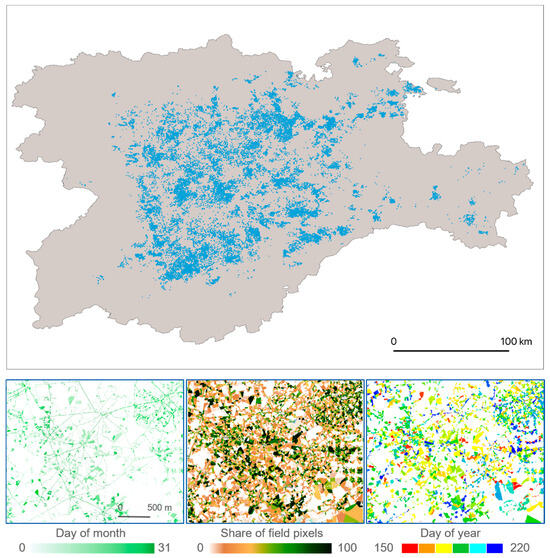
Figure 9.
Top panel: location of cereal fields in the reference dataset for year 2021 (46,220). Bottom panels: Sequence of steps for the generation of a reference dataset from Real Time Kinematic positioning data. Left panel: 10 m raster image of locations with RTK records; Centre panel: share of pixels with RTK records per parcel; Right panel: image of cereal parcels with dates of harvest assigned as the day with the higher number of RTK records within the field.
Figure 10 and Figure 11 illustrate the histograms depicting the temporal lags, hereafter “deltas”, between the harvest dates in the reference dataset and those derived from the DoH maps. On average, the harvest dates for the fields in the DoH maps were within a 10-day difference for 65.72% of the fields. For 26.1% of the fields, the deltas between the two sources ranged from 10 to 30 days, while for 8.2% of the fields, the disagreement was larger than 30 days. A right-skewed distribution was observed in the three-year histogram, indicating that the DoH maps generally detected the date of harvest with a delay compared to the reference dataset. The median delta for the three years was a 2-day delay, with the 25th and 75th percentiles corresponding to 4-day and 1-day delays, respectively. The average root mean square error (RMSE) of the delta for the three years was 16.10 days.
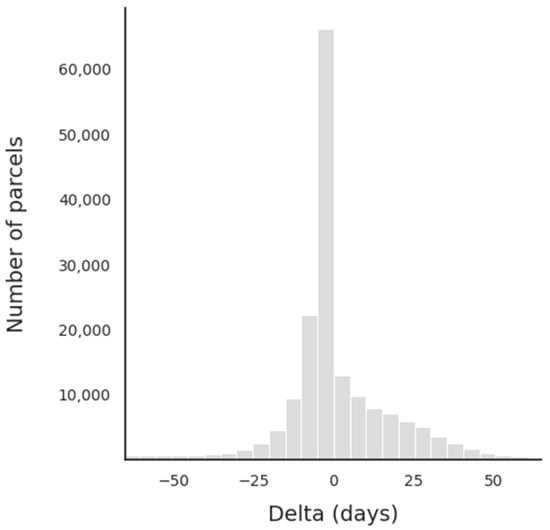
Figure 10.
Three-year histograms of time lags (Delta) between dates of harvest in reference dataset and Sentinel 2 based analysis for cereal parcels.

Figure 11.
Annual histograms of time lags (Delta) between dates of harvest in reference dataset and Sentinel 2 based analysis for cereal parcels.
A subset of fields was selected for visual inspection of the time series of Sentinel-2 images. The analysis aimed to better understand the reasons behind large deltas and ultimately evaluate the quality of the reference dataset. This subset included fields with deltas between the reference dataset and DoH maps larger than 10 days. These fields were drawn using a stratified random sampling, wherein four strata were established according to the magnitude of the deltas: fields with delta less than −30 days; fields with delta between −30 and 10 days; fields with delta between 10 and 30 days; and fields with delta larger than 30 days. A total of 668 fields were inspected, representing a sampling intensity of 1% per stratum and year of analysis. Copernicus Sentinel-2 L2A imagery from Google Earth Engine Harmonized Sentinel-2 MSI collection [58] was employed to construct the temporal image stacks for the scrutinized fields. However, unlike the automatic detection, cloud-contaminated observations were not filtered out from the analysis. The visual analyst sought evidence of the harvest event within the Sentinel-2 image stacks for the selected fields.
The results of the visual analysis showed a considerable heterogeneity across strata (Table 1). Agreement, defined as evidence of a harvest event found in the visual analysis of the Sentinel-2 images within five days of the date defined in the DoH maps, was observed for an average of 41.11% of cases. For 22.9% of the fields, visual evidence of harvest events was found beyond five days of the dates registered in the DoH maps. Visual inspection failed to yield conclusive evidence for 30.7% of the inspected fields. These inconclusive cases encompassed fields lacking cloud-free observations, those with irregular geometries or were very small in size, fields with several subdivisions, and fields displaying atypical seasonal phenological patterns. This analysis underscored that the initial assumption underpinning the construction of the RTK-based dataset was not universally applicable across all fields under examination. The substantial number of fields for which harvest dates in the visual inspection and the DoH maps agreed suggested that the RTK records used to generate the reference dataset may not always represent harvest events, and they could, instead, correspond to different agricultural operations. It also highlighted that the quality of the harvest maps was higher than what the initial comparison against the RTK-based reference dataset suggested.

Table 1.
Results of the visual analysis of Sentinel-2 imagery for a sample of cereal parcels with large discrepancies in date of harvest for cereal parcels for 2021, 2022, and 2023.
Monte Carlo simulations [62] were used to create synthetic reference datasets that incorporated the insights from the visual analysis, minimized the uncertainties associated with the original reference dataset, and isolated the contribution of the algorithm to the accuracy metrics. For each synthetic dataset, a subset of fields with large deltas was replaced with a random sample of fields extracted from those with low deltas of the same size. The size of this subset was established based on the percentage of fields with large deltas correctly mapped in the DoH maps identified during the visual inspection. Similarly, a subset of fields with large deltas, the size of the percentage of inconclusive fields in the visual inspection analysis, was removed from the analysis. This process was replicated to create 10,000 synthetic datasets, and the revised accuracy metrics were computed as the average of the resulting replicas (Figure 12). Based on these metrics, the median delta for the three years was a 3-day delay, and 95% of the fields were detected within 10 days of difference between the DoH maps and the synthetic reference datasets. The average RMSE of the delta for the three years was 9.5 days.
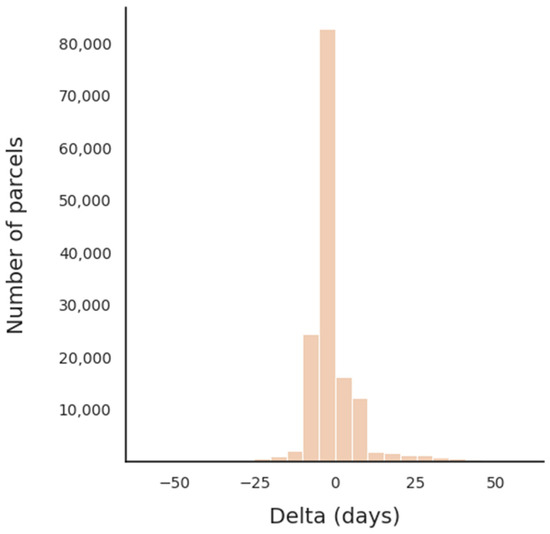
Figure 12.
Three-year histograms of time lags (Delta) between dates of harvest in adjusted reference dataset and Sentinel 2 based analysis for cereal parcels.
4. Discussion
This work presents a reliable method for post-season detection of harvest dates in cereal fields using dense Sentinel-2 satellite imagery. The approach examines variations in reflectance within the red wavelength during the growing season and identifies changes associated with harvesting events. This method does not require training data and can potentially be extended to other geographical contexts with minimal recalibration, given the uniformity of cereal harvest practices across different production regions. Advances in the automated detection of agricultural practices at the parcel level over large areas, as demonstrated in this study, hold value for diverse applications. This is relevant in the specific context of harvest detection. As climate change is expected to result in more frequent extreme events, harvest operations may exhibit yearly fluctuations and spatial variability contingent upon specific environmental conditions. Agricultural management will have to adapt to this evolving reality. A precise characterization of the harvest calendar across large cereal production regions will be key to identify and mitigate critical bottlenecks within agricultural supply chains and ultimately enhance the resilience of food systems. Furthermore, detailed monitoring of harvest season progression could inform the design and evaluation of targeted strategies to enhance and preserve environmental services within agricultural ecosystems, as pursued by initiatives under the Common Agricultural Policy or the Nature Restoration Law within the European framework. In the context of the European Union, where highly precise annual information on crop type and field limits exists, the primary benefit of Earth observation-based analysis lies in in-season analysis and practice detection. In-season assessments can provide additional information for control and verification of practices, as well as contribute to the development of precision agriculture, offering decision tools for adaptive planning of agricultural operations in response to short- and medium-term weather forecasts. Moreover, in-season assessments can help in planning harvest operations to maintain landscape structure within certain parameters that protect ecosystem service provision. The proposed method could potentially be adapted for in-season analyses with minor modifications. However, in-season assessments would require robust calibration based on historical EO and crop data, as well as the incorporation of the inherent uncertainties associated with in-season assessments. Continuous revision and update of estimates would be necessary as more data become available along the agricultural season.
Agricultural landscapes are highly dynamic systems, with large inter and intra annual variations driven by crop phenological cycles and management decisions. The organization of the harvest operations is particularly relevant at the local level, because, in regions where cereal cultivation is predominant, it can temporally shape the complexity of the landscape structure. These rapid transformations of the structure of agricultural landscapes may potentially impact the capacity of the ecosystem to supply food, shelter and passage to highly dependent fauna [63]. This connection is reflected, for instance, in the increasing environmental requirements of the European Common Agricultural Policy. The DoH maps effectively captured these dynamics, emphasizing the considerable variability in the progression of harvest activities over time across the study area and the changes in these patterns from year to year. Specifically, the maps were able to reveal a pattern that moves from lower altitude and warmer central locations towards higher altitude and cooler peripheral areas of the study area. This general centrifugal trend is also influenced by annual variations in the harvest calendar, likely linked to annual weather conditions and regulatory frameworks. At the local level, the maps reflect the progression of the harvest campaign throughout the landscape. In some locations, the harvest campaign is completed within a brief timeframe, while in others, cereal fields are harvested during a period that can extend several weeks.
Over the past decade, several studies have harnessed dense stacks of high-resolution satellite imagery to monitor agricultural practices. For instance, grassland management including mowing, mowing frequency detection, and mowing event timing has been explored using various sensors such as sensors SPOT [64], Sentinel-1 [65], Sentinel 2 [45] or a combination of optical sensors [66,67], or optical and radar [46,47,68]. These studies demonstrate that mowing events could be detected with temporal series of high-resolution satellite data in 60 to 88% of cases. Similarly, harvest events in cereal fields have been studied with Sentinel-1 [69,70,71], and Sentinel-1 and Sentinel-2 [72], with accuracies in the range of 4 to 7 days of RMSE. However, the scarcity of reference data for training, calibration and validation poses a challenge for the development of monitoring capabilities [67]. Consequently, most research has often been confined to relatively small study areas and their potential use beyond the initial extents has not been evaluated. Recent research has shown promising results exploring alternative in situ data sources, such as large expert-based networks of phenological observations, for the validation of several phenological stages in wheat fields [73]. The present work contributes to the expanding literature on the potential and limitations of dense stacks of high-resolution Earth observation (EO) imagery in the monitoring of agricultural practices. The reported accuracies align with those documented in the literature, and the size and geographical scope of the validation dataset provide additional certainties about the robustness of the results. However, while confirming the robustness of the detection methodology, the accuracy assessment also revealed limitations in resolving certain fields due to various reasons (e.g., field size and shape, lack of evidence of management, etc.). These limitations should also be considered to establish realistic expectations and set feasible targets for the monitoring of agricultural practices with time series of high-resolution EO data.
Historically, the validation of EO-based products monitoring agricultural practices has been hindered by the scarcity of adequate in situ data. This study utilized RTK positioning records from agricultural machinery for the evaluation of the generated maps. The RTK records enabled the creation of a large reference dataset, ensuring robust accuracy metrics across the study area. To the best of our knowledge, this is the first instance of using such information for the validation of an EO-based product. However, while RTK records hold promise as a source of validation data, their use is not without limitations. A detailed examination of the validation results through visual interpretation of Sentinel-2 imagery stacks revealed that the assigned harvest date for a substantial number of fields in the reference dataset did not correspond to actual harvest events but rather other activities such as straw collection and field preparations. Despite this, RTK records emerge as a promising source of reference dataset for training, calibration, and validation of EO-based agricultural monitoring activities. The RTK information used in this study provided daily information on machinery presence in a field and lacked details on the specific activities carried out in the fields. In addition to geographic location, RTK records contain valuable information that could potentially be used to derive additional characteristics of the agricultural activities conducted in the field (e.g., machinery speed). More detailed RTK information should lead to more robust reference datasets.
5. Conclusions
This study presents a robust, scalable, and traceable methodology for the detection of harvest dates in cereal crops employing temporal series of Sentinel-2 imagery. The approach hinges on the recognition of established temporal signatures within the Sentinel-2 spectral profiles, obviating the need for extensive training datasets. Furthermore, this research investigated the use of Real-Time Kinematic positioning records as alternative validation datasets. RTK positioning records constitute a potentially vast source of calibration and validation data for Earth observation analyses. Although not entirely devoid of noise, these records offer extremely valuable information that facilitates the scaling of analyses from local to extensive geographic extents. The findings of this study contribute significantly to the understanding of the potential and limitations inherent in the analysis of Sentinel-2 temporal series imagery, specifically in relation to the identification of harvest dates and, more broadly, to the monitoring of agricultural management practices. Notably, while this study demonstrates a post-season assessment, the findings of this study hint the feasibility of in-season detection of specific agricultural practices. This capability enables the implementation of more adaptive and responsive agricultural management strategies, which can accommodate environmental and logistical uncertainties, thereby enhancing the potential for climate-resilient and sustainable agricultural systems.
Author Contributions
Conceptualization, F.S., G.L., P.L., D.A.N. and F.J.R.-R.; methodology, F.S. and M.C.; validation, F.S., F.J.R.-R., V.P.-G. and M.C.; formal analysis, F.S. and M.C.; investigation, F.S.; data curation, F.J.R.-R., D.A.N. and V.P.-G.; writing—original draft preparation, F.S.; writing—review and editing, F.S., F.U., M.V.d.V., G.L., P.L. and F.J.R.-R.; supervision, D.B.; project administration, D.B. All authors have read and agreed to the published version of the manuscript.
Funding
This research received no external funding.
Data Availability Statement
Data available on request due to restrictions eg privacy or ethical The data presented in this study are available on request from the corresponding author. Restrictions apply to the availability of RTK records. RTK records were obtained from the Technical Agrarian Institute of Castilla and Leon (ITACyL) and are not publicly available due to privacy restrictions.
Acknowledgments
We would like to thank the anonymous reviewers for their constructive comments and suggestions, which have significantly improved the quality of this manuscript.
Conflicts of Interest
The authors declare no conflicts of interest.
References
- Becker-Reshef, I.; Justice, C.; Sullivan, M.; Vermote, E.; Tucker, C.; Anyamba, A.; Small, J.; Pak, E.; Masuoka, E.; Schmaltz, J.; et al. Monitoring global croplands with coarse resolution Earth observations: The Global Agriculture Monitoring (GLAM) Project. Remote Sens. 2010, 2, 1589–1609. [Google Scholar] [CrossRef]
- Pittman, K.; Hansen, M.C.; Becker-Reshef, I.; Potapov, P.; Justice, C.O. Estimating global cropland extent with multi-year MODIS data. Remote Sens. 2010, 2, 1844–1863. [Google Scholar] [CrossRef]
- Fritz, S.; See, L.; McCallum, I.; You, L.; Bun, A.; Moltchanova, E.; Duerauer, M.; Albrecht, F.; Schill, C.; Perger, C.; et al. Mapping global cropland and field size. Glob. Change Biol. 2015, 21, 1980–1992. [Google Scholar] [CrossRef]
- Skakun, S.; Franch, B.; Vermote, E.; Roger, J.-C.; Becker-Reshef, I.; Justice, C.; Kussul, N. Early season large-area winter crop mapping using MODIS NDVI data, growing degree days information and a Gaussian mixture model. Remote Sens. Environ. 2017, 195, 244–258. [Google Scholar] [CrossRef]
- Thenkabail, P.S.; Biradar, C.M.; Noojipady, P.; Dheeravath, V.; Li, Y.; Velpuri, M.; Gumma, M.; Gangalakunta, O.R.P.; Turral, H.; Cai, X.; et al. Global irrigated area map (GIAM), derived from remote sensing, for the end of the last millennium. Int. J. Remote Sens. 2009, 30, 3679–3733. [Google Scholar] [CrossRef]
- Zhang, X.; Friedl, M.A.; Schaaf, C.B.; Strahler, A.H.; Hodges, J.C.F.; Gao, F.; Reed, B.C.; Huete, A. Monitoring vegetation phenology using MODIS. Remote Sens. Environ. 2003, 84, 471–475. [Google Scholar] [CrossRef]
- Gao, F.; Anderson, M.C.; Zhang, X.; Yang, Z.; Alfieri, J.G.; Kustas, W.P.; Mueller, R.; Johnson, D.M.; Prueger, J.H. Toward mapping crop progress at field scales through fusion of landsat and MODIS imagery. Remote Sens. Environ. 2017, 188, 9–25. [Google Scholar] [CrossRef]
- Meroni, M.; D’ANdrimont, R.; Vrieling, A.; Fasbender, D.; Lemoine, G.; Rembold, F.; Seguini, L.; Verhegghen, A. Comparing land surface phenology of major European crops as derived from sar and multispectral data of sentinel-1 and -2. Remote Sens. Environ. 2021, 253, 112232. [Google Scholar] [CrossRef]
- Kamir, E.; Waldner, F.; Hochman, Z. Estimating wheat yields in Australia using climate records, satellite image time series and machine learning methods. ISPRS J. Photogramm. Remote Sens. 2020, 160, 124–135. [Google Scholar] [CrossRef]
- Weiss, M.; Jacob, F.; Duveiller, G. Remote sensing for agricultural applications: A meta-review. Remote Sens. Environ. 2020, 236, 111402. [Google Scholar] [CrossRef]
- de Wit, A.J.W.; van Diepen, C.A. Crop model data assimilation with the ensemble kalman filter for improving regional crop yield forecasts. Agric. For. Meteorol. 2007, 146, 38–56. [Google Scholar] [CrossRef]
- Huang, J.; Tian, L.; Liang, S.; Ma, H.; Becker-Reshef, I.; Huang, Y.; Su, W.; Zhang, X.; Zhu, D.; Wu, W. Improving winter wheat yield estimation by assimilation of the leaf area index from landsat tm and MODIS data into the WOFOST model. Agric. For. Meteorol. 2015, 204, 106–121. [Google Scholar] [CrossRef]
- Huang, J.; Sedano, F.; Huang, Y.; Ma, H.; Li, X.; Liang, S.; Tian, L.; Zhang, X.; Fan, J.; Wu, W. Assimilating a synthetic Kalman filter leaf area index series into the WOFOST model to improve regional winter wheat yield estimation. Agric. For. Meteorol. 2016, 216, 188–202. [Google Scholar] [CrossRef]
- Bandaru, V.; Yaramasu, R.; Jones, C.; Izaurralde, R.C.; Reddy, A.; Sedano, F.; Daughtry, C.S.; Becker-Reshef, I.; Justice, C. Geo-cropsim: A geo-spatial crop simulation modeling framework for regional scale crop yield and water use assessment. ISPRS J. Photogramm. Remote Sens. 2022, 183, 34–53. [Google Scholar] [CrossRef]
- Sus, O.; Williams, M.; Bernhofer, C.; Béziat, P.; Buchmann, N.; Ceschia, E.; Doherty, R.; Eugster, W.; Grünwald, T.; Kutsch, W.; et al. A linked carbon cycle and crop developmental model: Description and evaluation against measurements of carbon fluxes and carbon stocks at several European agricultural sites. Agric. Ecosyst. Environ. 2010, 139, 402–418. [Google Scholar] [CrossRef]
- Zhang, X.; Izaurralde, R.C.; Manowitz, D.H.; Sahajpal, R.; West, T.O.; Thomson, A.M.; Xu, M.; Zhao, K.; LeDuc, S.D.; Williams, J.R. Regional scale cropland carbon budgets: Evaluating a geospatial agricultural modeling system using inventory data. Environ. Modell. Software 2015, 63, 199–216. [Google Scholar] [CrossRef]
- Cheng, Z.; Meng, J.; Qiao, Y.; Wang, Y.; Dong, W.; Han, Y. Preliminary study of soil available nutrient simulation using a modified WOFOST model and time-series remote sensing observations. Remote Sens. 2018, 10, 64. [Google Scholar] [CrossRef]
- Dorigo, W.A.; Zurita-Milla, R.; De Wit, A.J.W.; Brazile, J.; Singh, R.; Schaepman, M.E. A review on reflective remote sensing and data assimilation techniques for enhanced agroecosystem modeling. Int. J. Appl. Earth Obs. Geoinf. 2007, 9, 165–193. [Google Scholar] [CrossRef]
- Huang, J.; Gómez-Dans, J.; Huang, H.L.; Ma, H.; Wu, Q.; Lewis, P.E.; Liang, S.; Chen, Z.; Xue, J.; Wu, Y.; et al. Assimilation of remote sensing into crop growth models: Current status and perspectives. Agric. For. Meteorol. 2019, 276, 107609. [Google Scholar] [CrossRef]
- Jin, X.; Kumar, L.; Li, Z.; Feng, H.; Xu, X.; Yang, G.; Wang, J. A review of data assimilation of remote sensing and crop models. Eur. J. Agron. 2018, 92, 141–152. [Google Scholar] [CrossRef]
- Wardlow, B.D.; Egbert, S.L. Large-area crop mapping using time-series MODIS 250 m NDVI data: An assessment for the U.S. Central Great Plains. Remote Sens. Environ. 2008, 112, 1096–1116. [Google Scholar] [CrossRef]
- Ozdogan, M.; Gutman, G. A new methodology to map irrigated areas using multi-temporal MODIS and ancillary data: An application example in the continental US. Remote Sens. Environ. 2008, 112, 3520–3537. [Google Scholar] [CrossRef]
- Ozdogan, M. The spatial distribution of crop types from MODIS data: Temporal unmixing using Independent Component Analysis. Remote Sens. Environ. 2010, 114, 1190–1204. [Google Scholar] [CrossRef]
- Gumma, M.K.; Thenkabail, P.S.; Maunahan, A.; Islam, S.; Nelson, A. Mapping seasonal rice cropland extent and area in the high cropping intensity environment of Bangladesh using MODIS 500m data for the year 2010. ISPRS J. Photogramm. Remote Sens. 2014, 91, 98–113. [Google Scholar] [CrossRef]
- Whitcraft, A.K.; Becker-Reshef, I.; Justice, C. A framework for defining spatially explicit Earth observation requirements for a global agricultural monitoring initiative (GEOGLAM). Remote Sens. 2015, 7, 1461–1581. [Google Scholar] [CrossRef]
- van der Velde, M.; van Diepen, C.; Baruth, B. The European crop monitoring and yield forecasting system: Celebrating 25 years of jrc mars bulletins. Agric. Syst. 2019, 168, 56–57. [Google Scholar] [CrossRef]
- Rembold, F.; Meroni, M.; Urbano, F.; Csak, G.; Kerdiles, H.; Perez-Hoyos, A.; Lemoine, G.; Leo, O.; Negre, T. Asap: A new global early warning system to detect anomaly hot spots of agricultural production for food security analysis. Agric. Syst. 2019, 168, 247–257. [Google Scholar] [CrossRef]
- McNally, A.; Arsenault, K.; Kumar, S.; Shukla, S.; Peterson, P.; Wang, S.; Funk, C.; Peters-Lidard, C.D.; Verdin, J.P. A land data assimilation system for sub-Saharan Africa food and water security applications. Sci. Data 2017, 4, 170012. [Google Scholar] [CrossRef]
- Funk, C.; Shukla, S.; Thiaw, W.M.; Rowland, J.; Hoell, A.; McNally, A.; Husak, G.; Novella, N.; Budde, M.; Peters-Lidard, C.; et al. Recognizing the famine early warning systems network: Over 30 years of drought early warning science advances and partnerships promoting global food security. Bull. Am. Meteorol. Soc. 2019, 100, 1011–1027. [Google Scholar] [CrossRef]
- Veloso, A.; Mermoz, S.; Bouvet, A.; Le Toan, T.; Planells, M.; Dejoux, J.-F.; Ceschia, E. Understanding the temporal behavior of crops using sentinel-1 and sentinel-2-like data for agricultural applications. Remote Sens. Environ. 2017, 199, 415–426. [Google Scholar] [CrossRef]
- Xiong, J.; Thenkabail, P.S.; Tilton, J.C.; Gumma, M.K.; Teluguntla, P.; Oliphant, A.; Congalton, R.G.; Yadav, K.; Gorelick, N. Nominal 30-m cropland extent map of continental Africa by integrating pixel-based and object-based algorithms using sentinel-2 and landsat-8 data on Google Earth Engine. Remote Sens. 2017, 9, 1065. [Google Scholar] [CrossRef]
- Cai, Y.; Guan, K.; Peng, J.; Wang, S.; Seifert, C.; Wardlow, B.; Li, Z. A high-performance and in-season classification system of field-level crop types using time-series landsat data and a machine learning approach. Remote Sens. Environ. 2018, 210, 35–47. [Google Scholar] [CrossRef]
- Defourny, P.; Bontemps, S.; Bellemans, N.; Cara, C.; Dedieu, G.; Guzzonato, E.; Hagolle, O.; Inglada, J.; Nicola, L.; Rabaute, T.; et al. Near real-time agriculture monitoring at national scale at parcel resolution: Performance assessment of the sen2-agri automated system in various cropping systems around the world. Remote Sens. Environ. 2019, 221, 551–568. [Google Scholar] [CrossRef]
- Gumma, M.K.; Thenkabail, P.S.; Teluguntla, P.G.; Oliphant, A.; Xiong, J.; Giri, C.; Pyla, V.; Dixit, S.; Whitbread, A.M. Agricultural cropland extent and areas of South Asia derived using landsat satellite 30-m time-series big-data using random forest machine learning algorithms on the Google Earth Engine cloud. GISci. Remote Sens. 2019, 57, 302–322. [Google Scholar] [CrossRef]
- Massey, R.; Sankey, T.T.; Yadav, K.; Congalton, R.G.; Tilton, J.C. Integrating cloud-based workflows in continental-scale cropland extent classification. Remote Sens. Environ. 2018, 219, 162–179. [Google Scholar] [CrossRef]
- Wolanin, A.; Camps-Valls, G.; Gómez-Chova, L.; Mateo-García, G.; van der Tol, C.; Zhang, Y.; Guanter, L. Estimating crop primary productivity with sentinel-2 and landsat 8 using machine learning methods trained with radiative transfer simulations. Remote Sens. Environ. 2019, 225, 441–457. [Google Scholar] [CrossRef]
- Fahrig, L.; Baudry, J.; Brotons, L.; Burel, F.G.; Crist, T.O.; Fuller, R.J.; Sirami, C.; Siriwardena, G.M.; Martin, J. Functional landscape heterogeneity and animal biodiversity in agricultural landscapes. Ecol. Lett. 2010, 14, 101–112. [Google Scholar] [CrossRef]
- Whittingham, M. The future of agri-environment schemes: Biodiversity gains and ecosystem service delivery? J. Appl. Ecol. 2011, 48, 509–513. [Google Scholar] [CrossRef]
- Kremen, C.; Miles, A. Ecosystem services in biologically diversified versus conventional farming systems: Benefits, externalities, and trade-offs. Ecol. Soc. 2012, 17, 40. [Google Scholar] [CrossRef]
- Macfadyen, S.; Cunningham, S.; Costamagna, A.; Schellhorn, N. Managing ecosystem services and biodiversity conservation in agricultural landscapes: Are the solutions the same? J. Appl. Ecol. 2012, 49, 690–694. [Google Scholar] [CrossRef]
- Tian, H.; Yong-Jiu, W.; Cui, T.; Zhang, L.; Qin, Y. Early-season mapping of winter crops using sentinel-2 optical imagery. Remote Sens. 2021, 13, 3822. [Google Scholar] [CrossRef]
- Tricht, K.V.; Gobin, A.; Gilliams, S.; Piccard, I. Synergistic use of radar sentinel-1 and optical sentinel-2 imagery for crop mapping: A case study for Belgium. Remote Sens. 2018, 10, 1642. [Google Scholar] [CrossRef]
- Blickensdörfer, L.; Schwieder, M.; Pflugmacher, D.; Nendel, C.; Erasmi, S.; Hostert, P. Mapping of crop types and crop sequences with combined time series of sentinel-1, sentinel-2 and landsat 8 data for Germany. Remote Sens. Environ. 2022, 269, 112831. [Google Scholar] [CrossRef]
- Pacifici, F. On the predictive value of the WorldView3 VNIR and SWIR spectral bands. In Proceedings of the IEEE International Geoscience and Remote Sensing Symposium (IGARSS 2016), Beijing, China, 10–15 July 2016; pp. 898–901. [Google Scholar] [CrossRef]
- Kolecka, N.; Ginzler, C.; Pazúr, R.; Price, B.; Verburg, P. Regional scale mapping of grassland mowing frequency with sentinel-2 time series. Remote Sens. 2018, 10, 1221. [Google Scholar] [CrossRef]
- Vroey, M.D.; Radoux, J.; Defourny, P. Grassland mowing detection using sentinel-1 time series: Potential and limitations. Remote Sens. 2021, 13, 348. [Google Scholar] [CrossRef]
- Reinermann, S.; Geßner, U.; Asam, S.; Ullmann, T.; Schucknecht, A.; Kuenzer, C. Detection of grassland mowing events for Germany by combining sentinel-1 and sentinel-2 time series. Remote Sens. 2022, 14, 1647. [Google Scholar] [CrossRef]
- Gao, F.; Anderson, M.C.; Hively, W.D. Detecting cover crop end-of-season using venµs and sentinel-2 satellite imagery. Remote Sens. 2020, 12, 3524. [Google Scholar] [CrossRef]
- Gallego, J.; Jacques, D. The European land use and cover area-frame statistical survey. In Agricultural Survey Methods; John Wiley & Sons, Ltd.: Chichester, UK, 2010; pp. 149–168. [Google Scholar] [CrossRef]
- D’Andrimont, R.; Yordanov, M.; Martinez-Sanchez, L.; Eiselt, B.; Palmieri, A.; Dominici, P.; Gallego, J.; Reuter, H.I.; Joebges, C.; Lemoine, G.; et al. Harmonised lucas in-situ land cover and use database for field surveys from 2006 to 2018 in the European Union. Sci. Data 2020, 7, 1–15. [Google Scholar] [CrossRef]
- D’aNdrimont, R.; Verhegghen, A.; Lemoine, G.; Kempeneers, P.; Meroni, M.; van der Velde, M. From parcel to continental scale—A first European crop type map based on sentinel-1 and lucas copernicus in-situ observations. Remote Sens. Environ. 2021, 266, 112708. [Google Scholar] [CrossRef]
- Ghassemi, B.; Dujakovic, A.; Żółtak, M.; Immitzer, M.; Atzberger, C.; Vuolo, F. Designing a European-wide crop type mapping approach based on machine learning algorithms using lucas field survey and sentinel-2 data. Remote Sens. 2022, 14, 541. [Google Scholar] [CrossRef]
- DWD. Climate Data Center (CDC): Phenological Observations of Crops from Sowing to Harvest (Annual Reporters, Historical), Version v007. 2022. Available online: https://opendata.dwd.de/climate_environment/CDC/observations_germany/phenology/annual_reporters/crops/recent/DESCRIPTION_obsgermany-phenology-annual_reporters-crops-recent_en.pdf (accessed on 20 July 2025).
- Richardson, A.; Hufkens, K.; Milliman, T.; Frolking, S. Intercomparison of phenological transition dates derived from the phenocam dataset v1.0 and MODIS satellite remote sensing. Sci. Rep. 2018, 8, 1–12. [Google Scholar] [CrossRef]
- Guo, Y.; Chen, S.; Fu, Y.H.; Xiao, Y.; Wu, W.; Wang, H.; de Beurs, K. Comparison of multi-methods for identifying maize phenology using phenocams. Remote Sens. 2022, 14, 244. [Google Scholar] [CrossRef]
- Taylor, S.D.; Browning, D.M. Classification of daily crop phenology in phenocams using deep learning and hidden Markov models. Remote Sens. 2022, 14, 286. [Google Scholar] [CrossRef]
- van der Velde, M.; Baruth, B.; Bussay, A.; Ceglar, A.; Condado, S.G.; Karetsos, S.; Lecerf, R.; Lopez, R.; Maiorano, A.; Nisini, L.; et al. In-season performance of European Union wheat forecasts during extreme impacts. Sci. Rep. 2018, 8, 15420. [Google Scholar] [CrossRef] [PubMed]
- European Space Agency. Sentinel-2 User Handbook; European Space Agency: Paris, France, 2018; Available online: https://sentinels.copernicus.eu/documents/247904/685211/Sentinel-2_User_Handbook (accessed on 20 July 2025).
- Pasquarella, V.J.; Brown, C.F.; Czerwinski, W.; Rucklidge, W.J. Comprehensive quality assessment of optical satellite imagery using weakly supervised video learning. In Proceedings of the IEEE/CVF Conference on Computer Vision and Pattern Recognition, Vancouver, BC, Canada, 17–24 June 2023; IEEE: New York, NY, USA, 2023; pp. 2124–2134. [Google Scholar]
- Paredes-Gómez, V.; Del Blanco Medina, V.; Bengoa, J.L.; Nafría García, D.A. Accuracy assessment of a 122 classes land cover map based on sentinel-2, landsat 8 and deimos-1 images and ancillary data. In Proceedings of the IGARSS 2018 IEEE International Geoscience and Remote Sensing Symposium, Valencia, Spain, 22–27 July 2018; IEEE: New York, NY, USA, 2018; pp. 5453–5456. [Google Scholar] [CrossRef]
- Muñoz Sabater, J. ERA5-Land monthly averaged data from 1981 to present. In Copernicus Climate Change Service (C3S) Climate Data Store (CDS); ECMWF: Reading, UK, 2019. [Google Scholar] [CrossRef]
- Metropolis, N.; Ulam, S. The Monte Carlo Method. J. Am. Stat. Assoc. 1949, 44, 335–341. [Google Scholar] [CrossRef]
- Carmona, N.E.; Sánchez, A.C.; Remans, R.; Jones, S.K. Complex agricultural landscapes host more biodiversity than simple ones: A global meta-analysis. Proc. Natl. Acad. Sci. USA 2022, 119, e2203385119. [Google Scholar] [CrossRef]
- Dusseux, P.; Vertès, F.; Corpetti, T.; Corgne, S.; Hubert-Moy, L. Agricultural practices in grasslands detected by spatial remote sensing. Environ. Monit. Assess. 2014, 186, 8249–8265. [Google Scholar] [CrossRef]
- Taravat, A.; Wagner, M.P.; Oppelt, N. Automatic grassland cutting status detection in the context of spatiotemporal sentinel-1 imagery analysis and artificial neural networks. Remote Sens. 2019, 11, 711. [Google Scholar] [CrossRef]
- Komisarenko, V.; Voormansik, K.; Elshawi, R.; Sakr, S. Exploiting time series of sentinel-1 and sentinel-2 to detect grassland mowing events using deep learning with reject region. Sci. Rep. 2022, 12, 1–15. [Google Scholar] [CrossRef] [PubMed]
- Griffiths, P.; Nendel, C.; Pickert, J.; Hostert, P. Towards national-scale characterization of grassland use intensity from integrated sentinel-2 and landsat time series. Remote Sens. Environ. 2020, 238, 111124. [Google Scholar] [CrossRef]
- Buhvald, A.P.; Račič, M.; Immitzer, M.; Oštir, K.; Veljanovski, T. Grassland use intensity classification using intra-annual sentinel-1 and -2 time series and environmental variables. Remote Sens. 2022, 14, 3387. [Google Scholar] [CrossRef]
- Kavats, O.; Khramov, D.; Sergieieva, K.; Vasyliev, V.V. Monitoring harvesting by time series of sentinel-1 sar data. Remote Sens. 2019, 11, 2496. [Google Scholar] [CrossRef]
- Nasrallah, A.; Baghdadi, N.; El Hajj, M.; Darwish, T.; Belhouchette, H.; Faour, G.; Darwich, S.; Mhawej, M. Sentinel-1 data for winter wheat phenology monitoring and mapping. Remote Sens. 2019, 11, 2228. [Google Scholar] [CrossRef]
- Schlund, M.; Erasmi, S. Sentinel-1 time series data for monitoring the phenology of winter wheat. Remote Sens. Environ. 2020, 246, 111814. [Google Scholar] [CrossRef]
- Harfenmeister, K.; Itzerott, S.; Weltzien, C.; Spengler, D. Detecting phenological development of winter wheat and winter barley using time series of sentinel-1 and sentinel-2. Remote Sens. 2021, 13, 5036. [Google Scholar] [CrossRef]
- Lobert, F.; Löw, J.; Schwieder, M.; Gocht, A.; Schlund, M.; Hostert, P.; Erasmi, S. A deep learning approach for deriving winter wheat phenology from optical and sar time series at field level. Remote Sens. Environ. 2023, 298, 113800. [Google Scholar] [CrossRef]
Disclaimer/Publisher’s Note: The statements, opinions and data contained in all publications are solely those of the individual author(s) and contributor(s) and not of MDPI and/or the editor(s). MDPI and/or the editor(s) disclaim responsibility for any injury to people or property resulting from any ideas, methods, instructions or products referred to in the content. |
© 2025 by the authors. Licensee MDPI, Basel, Switzerland. This article is an open access article distributed under the terms and conditions of the Creative Commons Attribution (CC BY) license (https://creativecommons.org/licenses/by/4.0/).