Article

Climatic and Topographic Controls on Soil Organic Matter Heterogeneity in Northeast China’s Black Soil Region: Implications for Sustainable Management

1
College of Geographical Sciences, Harbin Normal University, Harbin 150025, China
2
State Key Laboratory of Black Soils Conservation and Utilization, Northeast Institute of Geography and Agroecology, Chinese Academy of Sciences, Changchun 130102, China
*
Authors to whom correspondence should be addressed.
Agriculture 2025, 15(18), 1983; https://doi.org/10.3390/agriculture15181983
Submission received: 26 August 2025 / Revised: 16 September 2025 / Accepted: 18 September 2025 / Published: 20 September 2025
(This article belongs to the Section Agricultural Soils)

Abstract

Soil organic matter (SOM) plays a critical role in maintaining soil fertility, sustaining ecosystem stability, and mitigating climate change impacts, making its conservation essential for agricultural sustainability. However, systematic county-level assessments of SOM spatial heterogeneity and its drivers across Northeast China remain limited, constraining region-specific soil management strategies. Understanding the spatial distribution and drivers of SOM is therefore vital for effective black soil protection in Northeast China. This study investigated the spatial heterogeneity and driving mechanisms of SOM in Northeast China, covering 289 counties across Heilongjiang, Jilin, and Liaoning Provinces. High-resolution (10 m) SOM data combined with 15 natural, climatic, soil, vegetation, and socioeconomic variables were analyzed using spatial autocorrelation (global and local Moran’s I) and the Geodetector model. Results showed that SOM exhibited a clear spatial pattern of “higher in the north and east, lower in the south and west,” with significant spatial clustering (Moran’s I = 0.730, p < 0.001). At the regional scale, climate factors were the dominant drivers, with potential evapotranspiration (q = 0.810) and mean annual temperature (q = 0.794) exerting the strongest explanatory power. At the provincial scale, dominant factors varied: topographic controls in Liaoning, climate–topography interactions in Jilin, and climate dominance in Heilongjiang. Anthropogenic footprint had limited overall influence but showed amplifying effects in certain local areas. These findings highlight the multi-scale, multi-factor nature of SOM heterogeneity and underscore the need for region-specific management strategies.

1. Introduction

Soil organic matter (SOM) is a fundamental component for sustaining soil fertility and agricultural productivity, playing an irreplaceable role in the global carbon cycle and climate regulation [1,2]. As a critical indicator of soil quality, SOM improves soil physicochemical properties, enhances water retention, and supports ecosystem stability by influencing nutrient cycling and microbial activity [3]. In typical black soil regions, variations in SOM not only determine regional food production potential and sustainable land use but also have profound implications for national food security and the global carbon balance [4].
The formation, accumulation, and decomposition of SOM are jointly regulated by multiple natural and anthropogenic factors [5,6]. Traditional geostatistical methods, such as kriging interpolation, can effectively reveal the spatial continuity of SOM but show limitations in disentangling the complex mechanisms of multiple driving forces [7,8]. With growing research interest, spatial autocorrelation analysis (e.g., Moran’s I) has been widely applied to characterize SOM spatial clustering, reflecting both the degree of aggregation and its spatiotemporal dynamics [9]. Meanwhile, the Geodetector method has gained increasing attention in SOM studies because of its ability to detect both linear and nonlinear relationships and quantify variable interactions through spatial heterogeneity analysis [10,11]. These approaches not only provide quantitative assessments of the explanatory power of natural and socioeconomic factors but also uncover their interactive effects, offering a refined spatial perspective on soil carbon cycling.
Importantly, existing studies have highlighted scale-dependent effects of influencing factors on SOM spatial distribution. From plot to regional scales, both SOM patterns and their driving mechanisms vary considerably. At the micro scale, farm management practices such as fertilization, cropping systems, and tillage are key contributors to SOM heterogeneity [12]. At the county level, topographic factors exert decisive influences [13], whereas at the provincial scale, soil types and parent material have been identified as the primary determinants, as demonstrated in Shandong Province [14]. At broader regional and cross-regional scales, climate conditions and soil properties play dominant roles in shaping SOM patterns in the East Asian monsoon region [15]. Together, these findings reveal the multi-layered and multidimensional complexity of SOM distribution mechanisms, underscoring the necessity of cross-scale integrated analyses to clarify how natural and human factors interact across spatial hierarchies.
Against this background, this study focuses on Northeast China, one of the world’s most typical black soil regions. By integrating multi-source environmental and socioeconomic variables and applying spatial autocorrelation analysis and the Geodetector model, we systematically examine SOM spatial patterns and driving mechanisms at both regional and provincial scales. The specific objectives are (1) to characterize the spatial distribution and spatial dependence of SOM in Northeast China; (2) to quantify the explanatory power of different factors and their interactions; and (3) to compare dominant drivers among provinces. Through multi-scale and multi-factor analysis, this study aims to provide a scientific basis for black soil conservation and sustainable agricultural management in Northeast China, while also offering insights for understanding soil carbon dynamics in other global black soil regions, where similar climate–soil–land use interactions and SOM spatial patterns occur.

2. Materials and Methods

2.1. Study Area

The study area is located in Northeast China (Figure 1), encompassing Heilongjiang, Jilin, and Liaoning Provinces, and covering 289 county-level administrative units (including districts, counties, and county-level cities). The region exhibits diverse landform types, with elevations ranging from −281 m in low-lying areas to approximately 2681 m at the highest points. Overall, the landscape is dominated by extensive plains and low mountains, incorporating major geomorphic units such as the Liaohe Plain, Songnen Plain, and Sanjiang Plain. This area represents the core distribution zone of China’s black soils, characterized by high fertility and a long history of cultivation.
The climate is classified as a typical temperate humid to semi-humid continental monsoon climate, with long, cold winters and warm, rainy summers. Mean annual temperatures range from −5 °C to 10 °C, and annual precipitation generally falls between 400 and 800 mm, with the majority concentrated in summer months. Hydrothermal resources show a pronounced southeast–northwest declining gradient, influencing soil formation, vegetation distribution, and agricultural production patterns. The region is dominated by cropland, with maize, soybean, and rice being the principal staple crops, making it one of China’s most important commercial grain production bases and a key zone for safeguarding national food security.

2.2. Data Sources

The 10 m resolution SOM dataset for Northeast China was provided by the Northeast Institute of Geography and Agroecology, Chinese Academy of Sciences [16]. Accuracy assessments confirmed the high reliability and stability of this product (R2 = 0.674, RMSE = 1.098%), suggesting that while the dataset is generally reliable for regional analyses, the moderate R2 also implies that the precision of derived spatial patterns and factor detection results may be limited by dataset uncertainty. Vector data for national, provincial, municipal, and county-level administrative boundaries were obtained from the National Catalogue Service for Geographic Information (http://bzdt.ch.mnr.gov.cn/, accessed on 11 August 2025), ensuring the consistency and standardization of boundary information.

2.3. Data Sources of Influencing Factors

Fifteen influencing factors were selected to systematically examine the drivers of SOM spatial distribution in Northeast China, covering natural topography, climatic conditions, soil properties, vegetation cover, and human activities. Elevation (DEM) and slope (Slope) reflect terrain variation and geomorphological features, which strongly influence soil erosion, material deposition, and water retention [17,18]. Climatic variables include mean annual temperature (Temp), mean annual precipitation (Pre), potential evapotranspiration (pet), vapor pressure deficit (vpd), solar radiation (Srad), and runoff (q), which jointly determine regional hydrothermal regimes and thereby affect vegetation productivity, SOM decomposition rates, and stability [19,20]. Soil attributes such as cation exchange capacity (CEC), soil pH (pH), and soil moisture (Soil) characterize the physicochemical environment, shaping organic matter adsorption capacity, microbial activity, and carbon cycling processes [21]. The normalized difference vegetation index (NDVI) indicates vegetation cover and primary productivity, representing a major source of organic matter inputs [22]. Human activity was represented by the urbanization intensity index (UI), nighttime light index (NL), and population density (POP), which reflect the associations between land-use change, agricultural practices, and urban expansion on SOM distribution [23,24].
Together, these factors characterize key processes influencing SOM formation, accumulation, and decomposition from the perspective of the coupled natural–social system, providing a robust basis for analyzing the drivers of SOM spatial heterogeneity in Northeast China. All data were resampled to a spatial resolution of 10 m in ArcGIS 10.8 (Esri, Redlands, CA, USA) using the nearest-neighbor interpolation method to ensure consistency with the SOM dataset. Detailed descriptions and data sources of the selected factors are summarized in Table 1.

2.4. Geodetector Model

The Geodetector is a statistical method designed to quantify spatial heterogeneity and identify its driving factors [25]. Its core principle lies in comparing the variance within subregions to the total variance across the study area, thereby measuring the explanatory power of a factor on the spatial pattern of a dependent variable, while also detecting interactions between variables. Compared with traditional approaches, the Geodetector is capable of revealing nonlinear relationships and complex interaction effects, and has been widely applied in environmental sciences, socio-economic studies, and land-use research. In this study, the factor detection and interaction detection modules were employed to identify the dominant drivers of SOM spatial distribution in Northeast China and to uncover their interaction mechanisms. All explanatory variables were discretized into five categories using the natural breaks (Jenks) method. This approach minimizes within-class variance and maximizes between-class variance, making each stratum internally homogeneous and externally heterogeneous. It is particularly suitable for unevenly distributed spatial data and has been widely applied in geographical and environmental studies [26]. It should be noted that while some explanatory variables (e.g., Temp, pet, and vpd) may be correlated, the Geodetector method is robust to multicollinearity and can reliably quantify the explanatory power of individual factors and their interactions [27].
Factor detection: This module evaluates the explanatory power of an independent variable (influencing factor) on the dependent variable (SOM content), expressed by the q -statistic. The q value ranges from 0 to 1, with larger values indicating stronger explanatory power of factor X on variable Y. The q -statistic is calculated as
S S W = h = 1 L N h σ h 2 ,     S S T = N σ 2
q = 1 S S W S S T
where h = 1, 2, 3,…, L , with L denoting the number of strata (subregions or categories) of factor X; N h and N represent the number of units in stratum h and in the entire study area, respectively; σ h 2 and σ 2 denote the variance of Y within stratum h and across the entire area; and S S W and S S T represent the within-stratum sum of variances and the total variance of the region, respectively.
Interaction detection: This module evaluates the joint explanatory power of two influencing factors on SOM distribution by comparing their combined q value with that of individual factors. The results indicate whether the interaction between two factors enhances, weakens, or remains independent in terms of explanatory power. Interaction types are summarized in Table 2.
Table 2. Five types of interaction detection by the Geodetector.
Interactive FormsCriterion
Nonlinear attenuation:
q X 1 X 2 < M i n q X 1 , q X 2
Single factor nonlinear attenuation:
M i n q X 1 , q X 2 < q X 1 X 2 < M a x q X 1 , q X 2
Double factor enhancement:
q X 1 X 2 > M a x q X 1 , q X 2
Mutual independence:
q X 1 X 2 = q X 1 + q X 2
Nonlinear enhancement:
q X 1 X 2 > q X 1 + q X 2

2.5. Spatial Autocorrelation Analysis

To quantitatively assess the spatial dependence and clustering characteristics of SOM content in Northeast China, this study employed the Global Moran’s I index to evaluate the overall spatial distribution pattern of SOM (i.e., clustered, dispersed, or random). In addition, the Local Moran’s I was used to identify local clusters and outliers, thereby pinpointing the specific locations and types of spatial aggregation. The calculation formulas for Global Moran’s I and Local Moran’s I are provided in Equations (8) and (9), respectively, and are defined as follows:
I i = i = 1 n j = 1 n W i , j x i x ¯ x j x ¯ S 2 i = 1 n j = 1 n W i , j
I i = x i x ¯ S 2 j = 1 n W i , j x j x ¯
In Equations (8) and (9), S 2 represents the sample variance, W i , j is the spatial weight matrix, with elements i and j used to quantify the spatial relationship between regions i and j ; x i and x j denote the values of the respective spatial units; and x ¯ is the mean value across all spatial units.
In this study, a contiguity-based spatial weight matrix (queen criterion) was used to define the spatial relationships among counties. Under this scheme, W i , j equals 1 if counties i and j share a common boundary or vertex, and 0 otherwise. The matrix was row-standardized to ensure comparability across units. The contiguity-based approach is widely adopted in regional spatial analysis, as it reflects direct neighborhood interactions and is suitable for irregularly shaped administrative units, such as counties in Northeast China.

3. Results

3.1. Spatial Distribution Characteristics of SOM in Northeast China

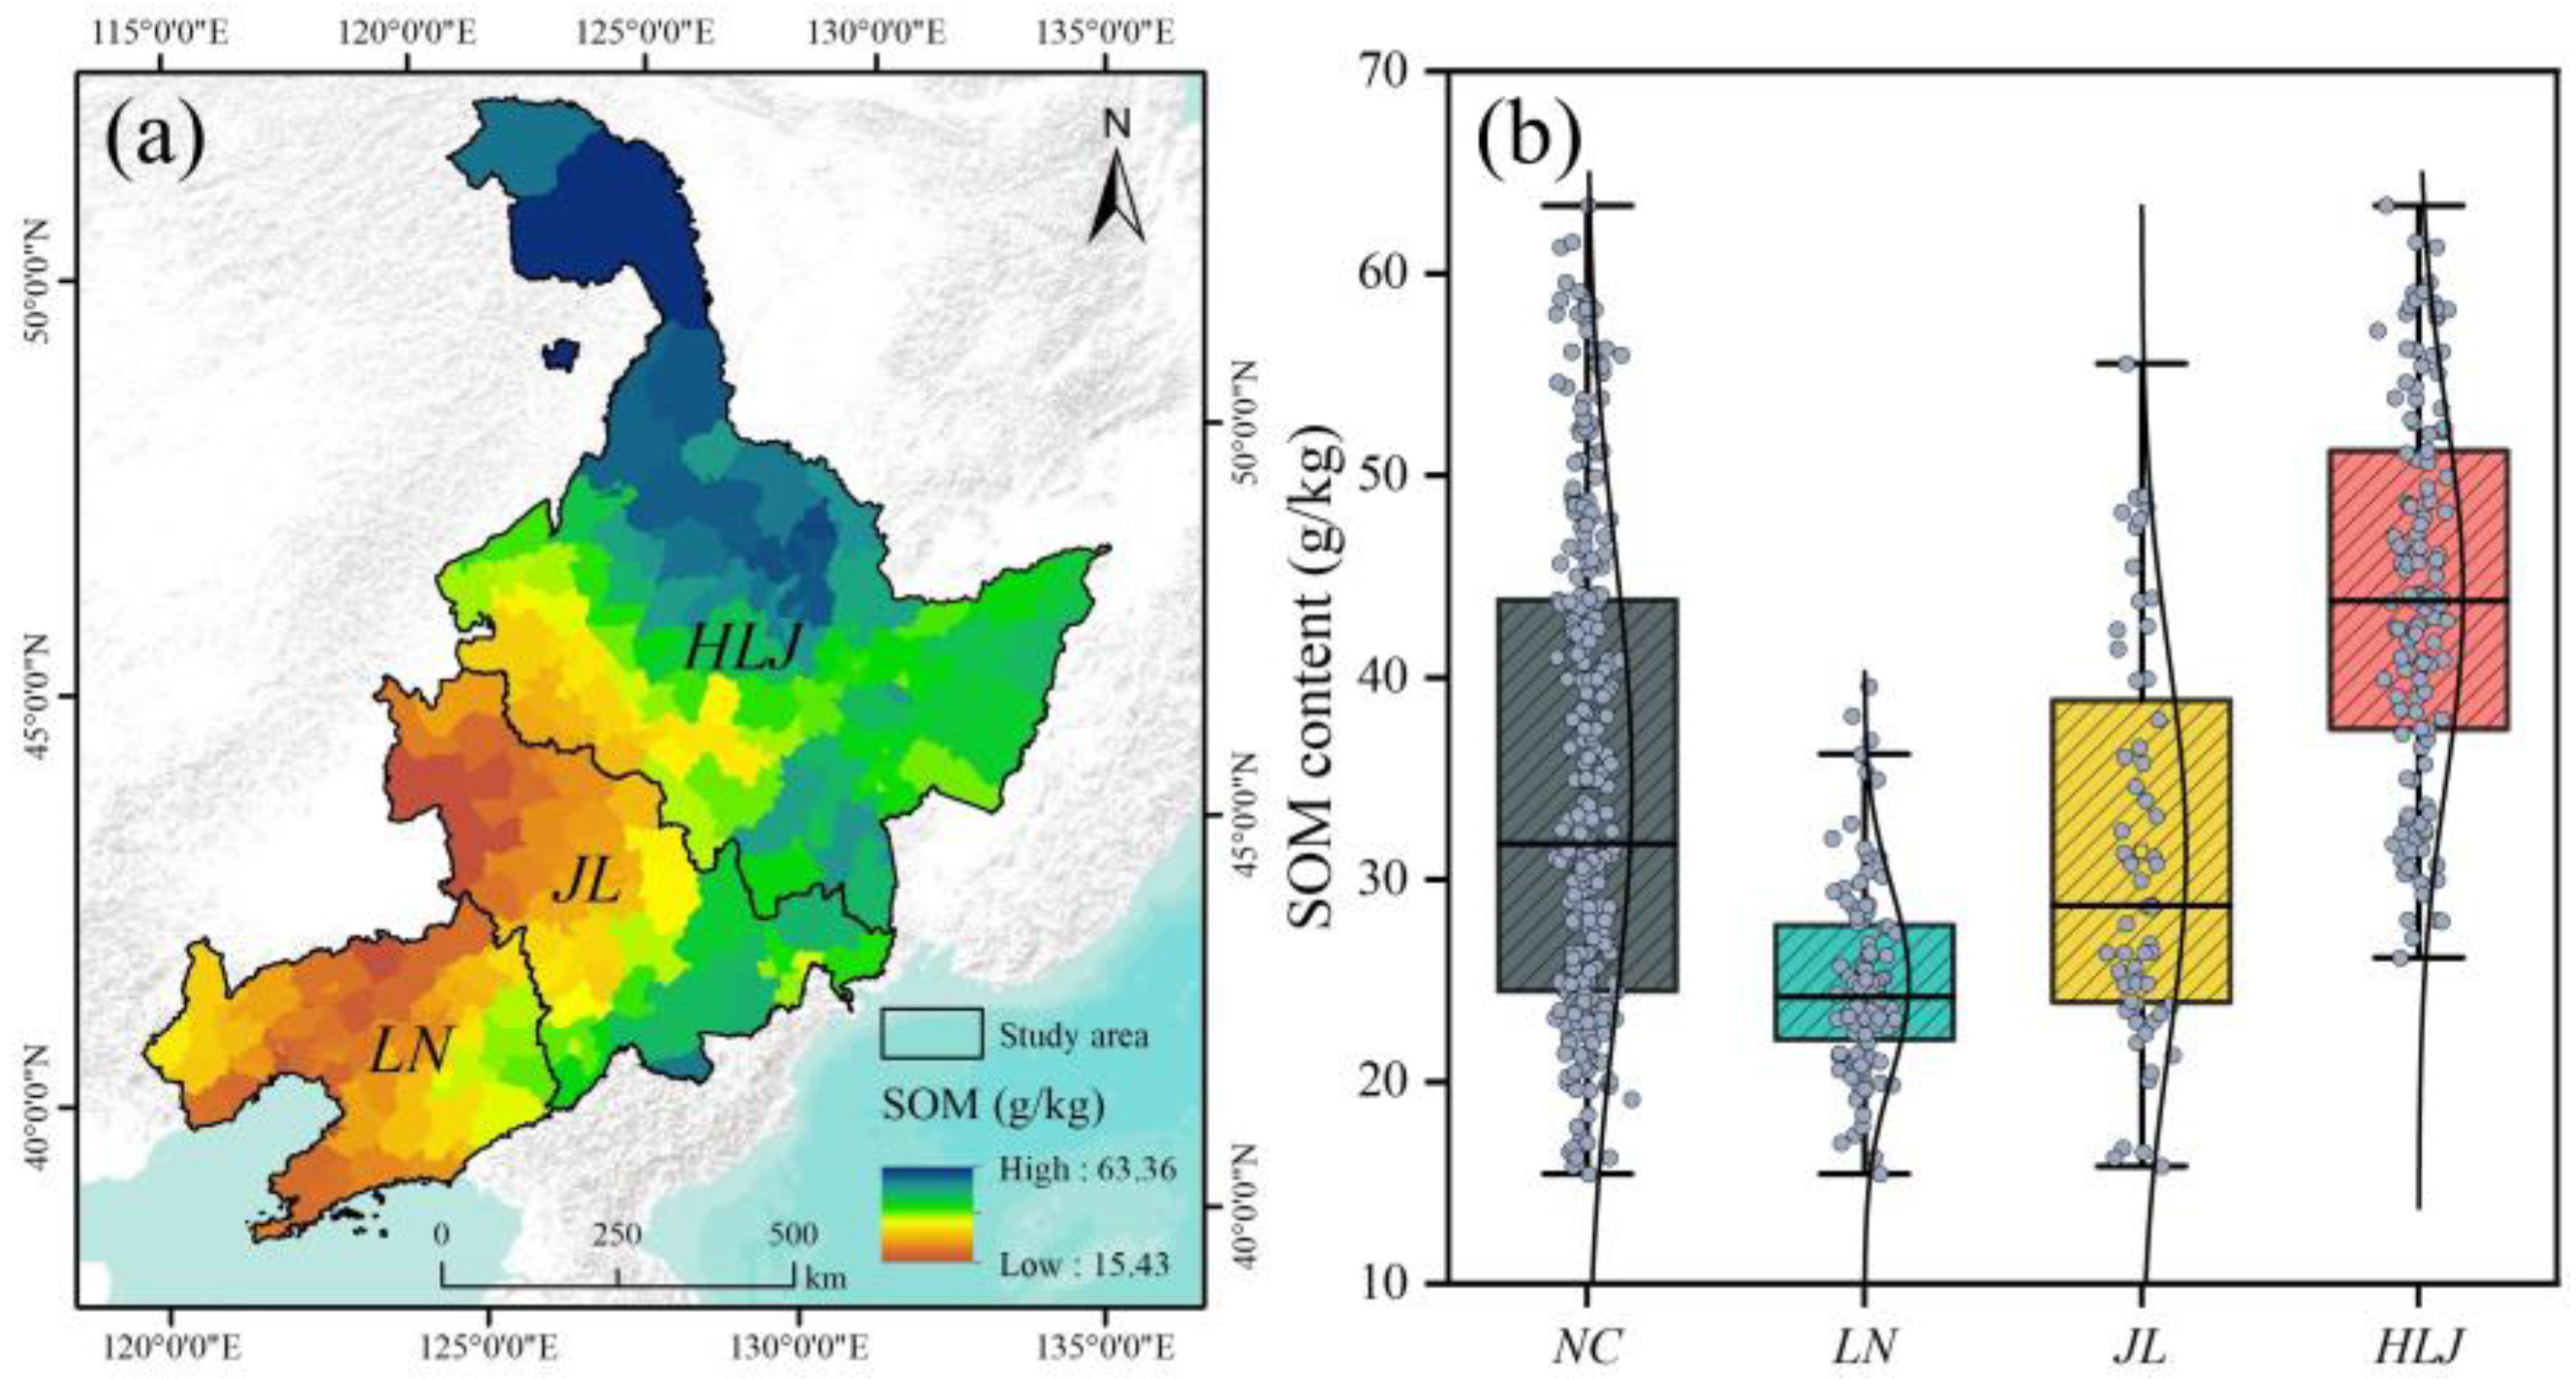
The spatial distribution of SOM content in Northeast China is illustrated in Figure 2a, showing a general increase from southwest to northeast. Specifically, higher SOM content was observed in the northern Greater and Lesser Khingan Mountains, the southern Changbai Mountain, and the eastern Sanjiang Plain, whereas central and western regions exhibited generally lower levels. At the provincial scale, Liaoning Province had the lowest overall SOM content compared with Heilongjiang and Jilin Provinces. Within Jilin Province, notable spatial variability was observed, with lower SOM levels in the northern regions and relatively higher values in the southern mountainous areas. In Heilongjiang Province, except for low-value areas in the west, most regions exhibited comparatively high SOM content. Boxplot analysis at the county scale (Figure 2b) indicated that the mean SOM content across Northeast China was 34.8 g/kg, with a median of 31.6 g/kg. At the provincial scale, Heilongjiang showed the highest mean SOM content (44.0 g/kg), followed by Jilin (31.4 g/kg) and Liaoning (25.0 g/kg). Median values followed a similar trend, with Heilongjiang (43.8 g/kg) significantly higher than Jilin (28.7 g/kg) and Liaoning (24.1 g/kg).

3.2. Spatial Autocorrelation of SOM in Northeast China

To reveal the intrinsic structural characteristics of SOM distribution, both global and local spatial autocorrelation analyses were conducted. The global results showed a Moran’s I of 0.730 for SOM content across Northeast China (p < 0.001, z = 34.334; Table 3), strongly rejecting the null hypothesis of spatial randomness at the 1% significance level. The high positive correlation indicates pronounced regional clustering, with high-value areas adjacent to other high-value areas and low-value areas neighboring low-value areas, reflecting strong spatial dependence and aggregation rather than random distribution.
To further identify the specific locations and types of SOM spatial clustering, the Local Moran’s I was applied for local cluster and outlier analysis (Figure 3). The results closely corresponded to the overall spatial distribution patterns described above. High–high clusters were predominantly concentrated in the northern Greater and Lesser Khingan Mountains and eastern Sanjiang Plain of Heilongjiang Province, as well as the southern Changbai Mountain area in Jilin Province, forming the core hotspots of SOM enrichment in Northeast China. Conversely, low–low clusters were mainly distributed across the southwestern Songnen Plain and most areas of Liaoning Province, creating large-scale SOM-poor cold spots. These findings highlight the pronounced regional clustering and local heterogeneity of SOM spatial patterns in Northeast China.

3.3. Drivers of SOM Spatial Distribution in Northeast China

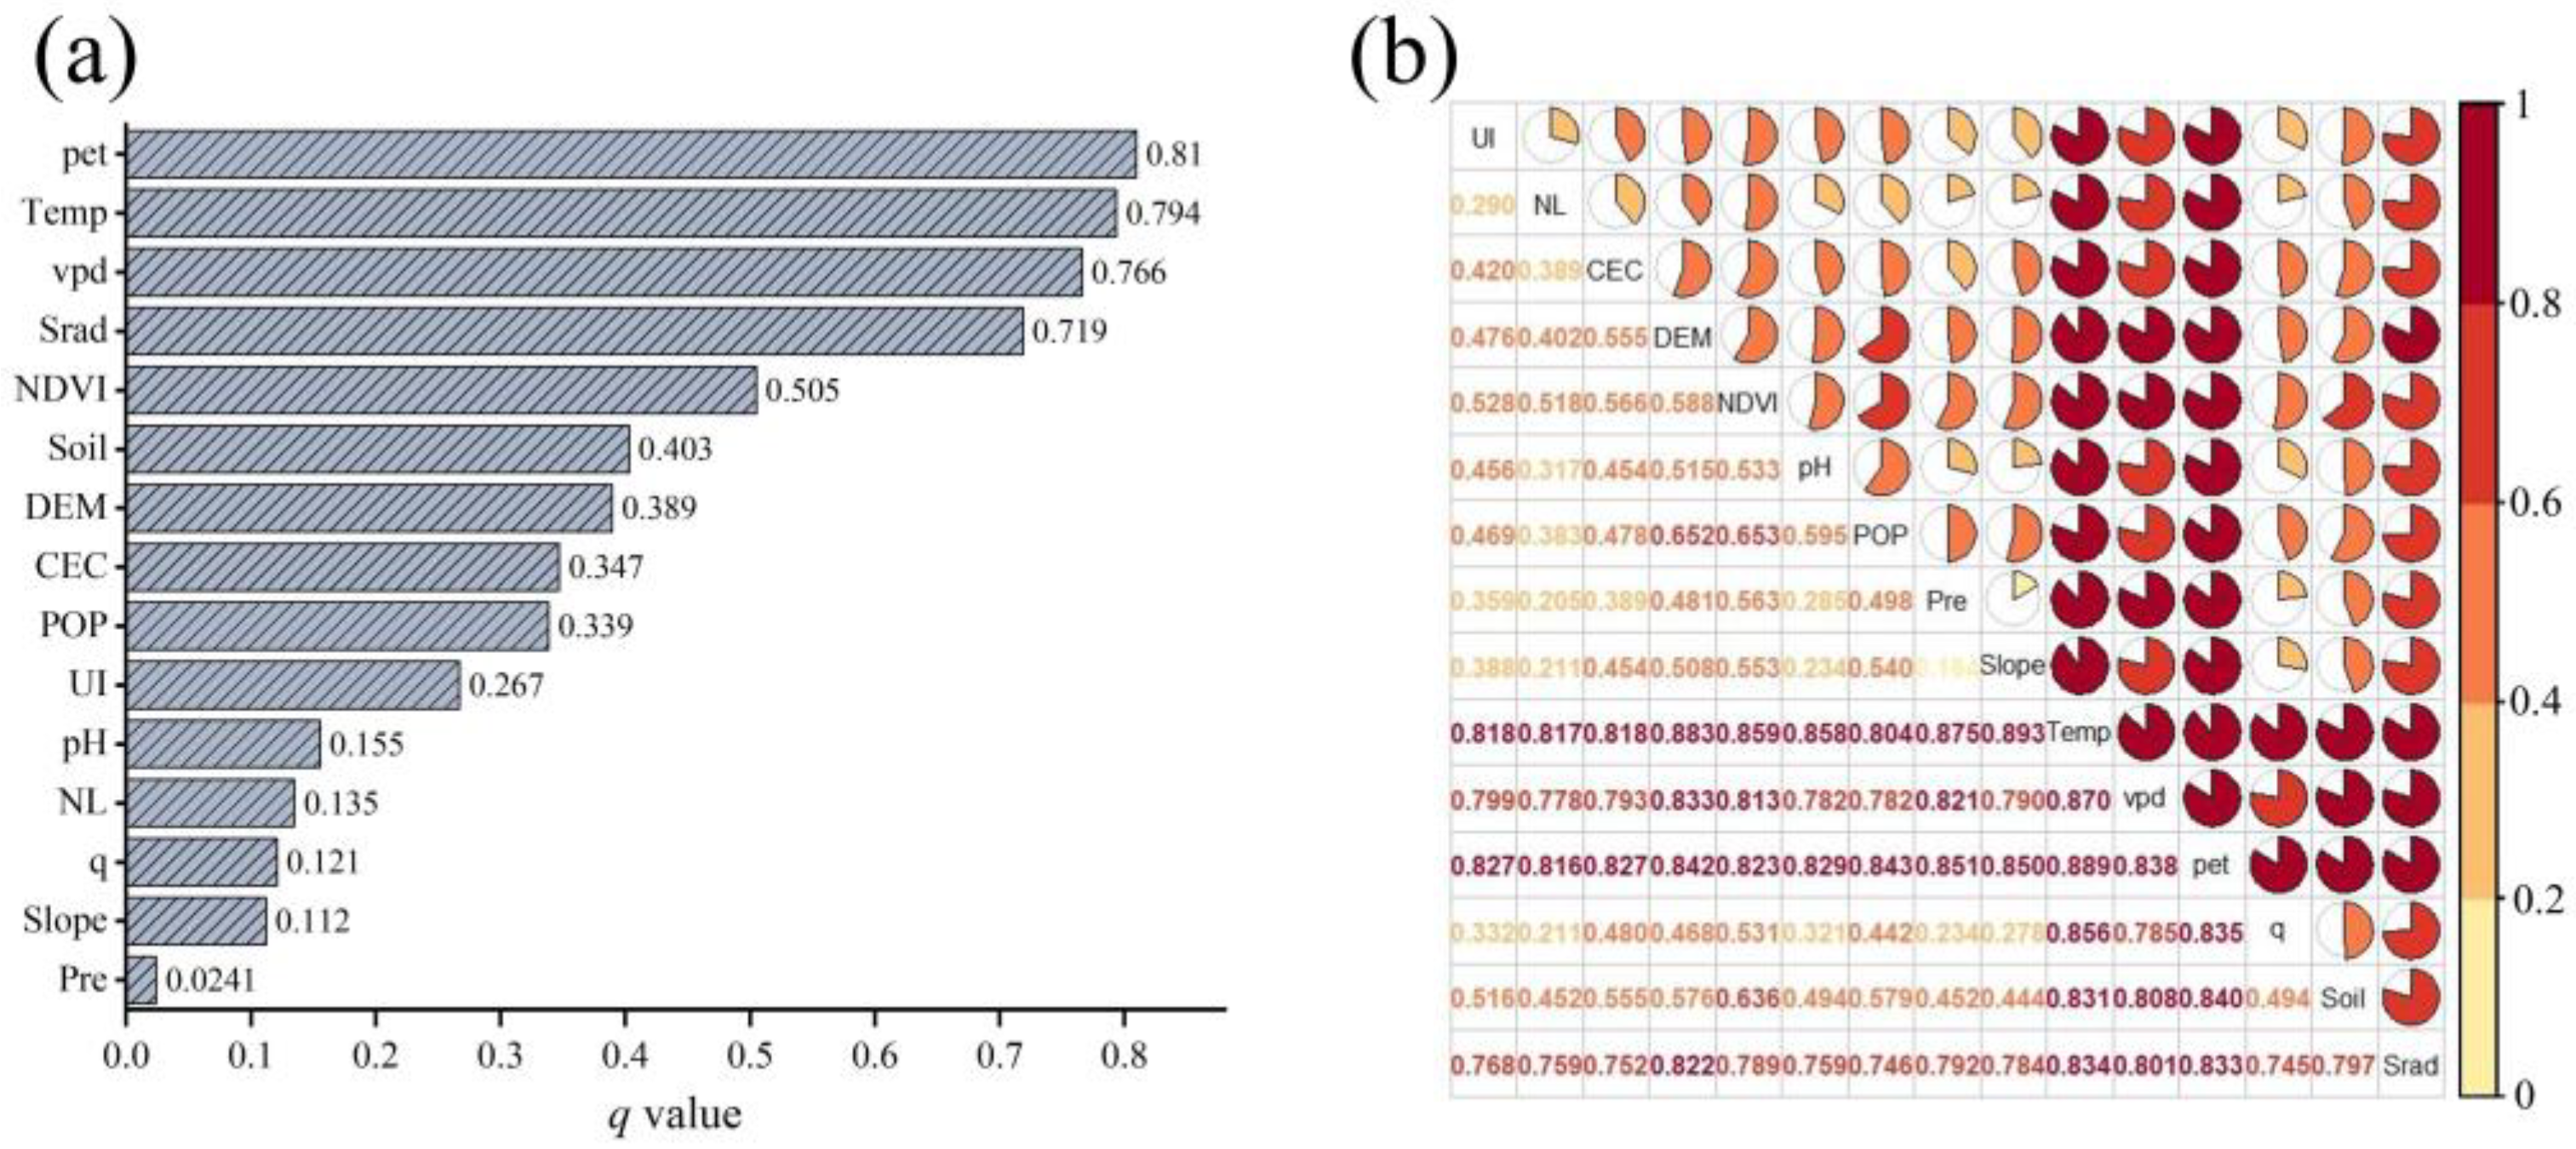
Across the entire study area (Figure 4a), climate factors exhibited the strongest explanatory power for SOM spatial patterns. In particular, pet (q = 0.810), Temp (q = 0.794), vpd (q = 0.766), and Srad (q = 0.719) were substantially higher than other factors. NDVI (q = 0.505) and Soil (q = 0.403) showed moderate explanatory power, whereas DEM (q = 0.389), CEC (q = 0.347), POP (q = 0.339), and UI (q = 0.267) had relatively lower contributions. pH (q = 0.155), NL (q = 0.135), and q (q = 0.121) were even weaker, with Pre contributing the least (q = 0.024). The low explanatory power of precipitation may be attributed to the relatively homogeneous annual precipitation across Northeast China and the overriding influence of other climate and topographic factors on SOM distribution.
Interaction analysis (Figure 4b) indicated that most factor combinations significantly enhanced the explanatory power of SOM distribution. Interactions among major climate and topographic factors generally exhibited nonlinear or bivariate enhancement, showing synergistic effects that exceeded the explanatory power of individual factors. By contrast, interactions involving factors with low individual explanatory power, including human activity and minor soil variables, were mostly weak or independent, with q values below 0.321. The strongest interaction was observed between Temp and Slope (q = 0.893), whereas the weakest was between Pre and Slope (q = 0.164).

3.4. Provincial Differences in Drivers of SOM Spatial Distribution

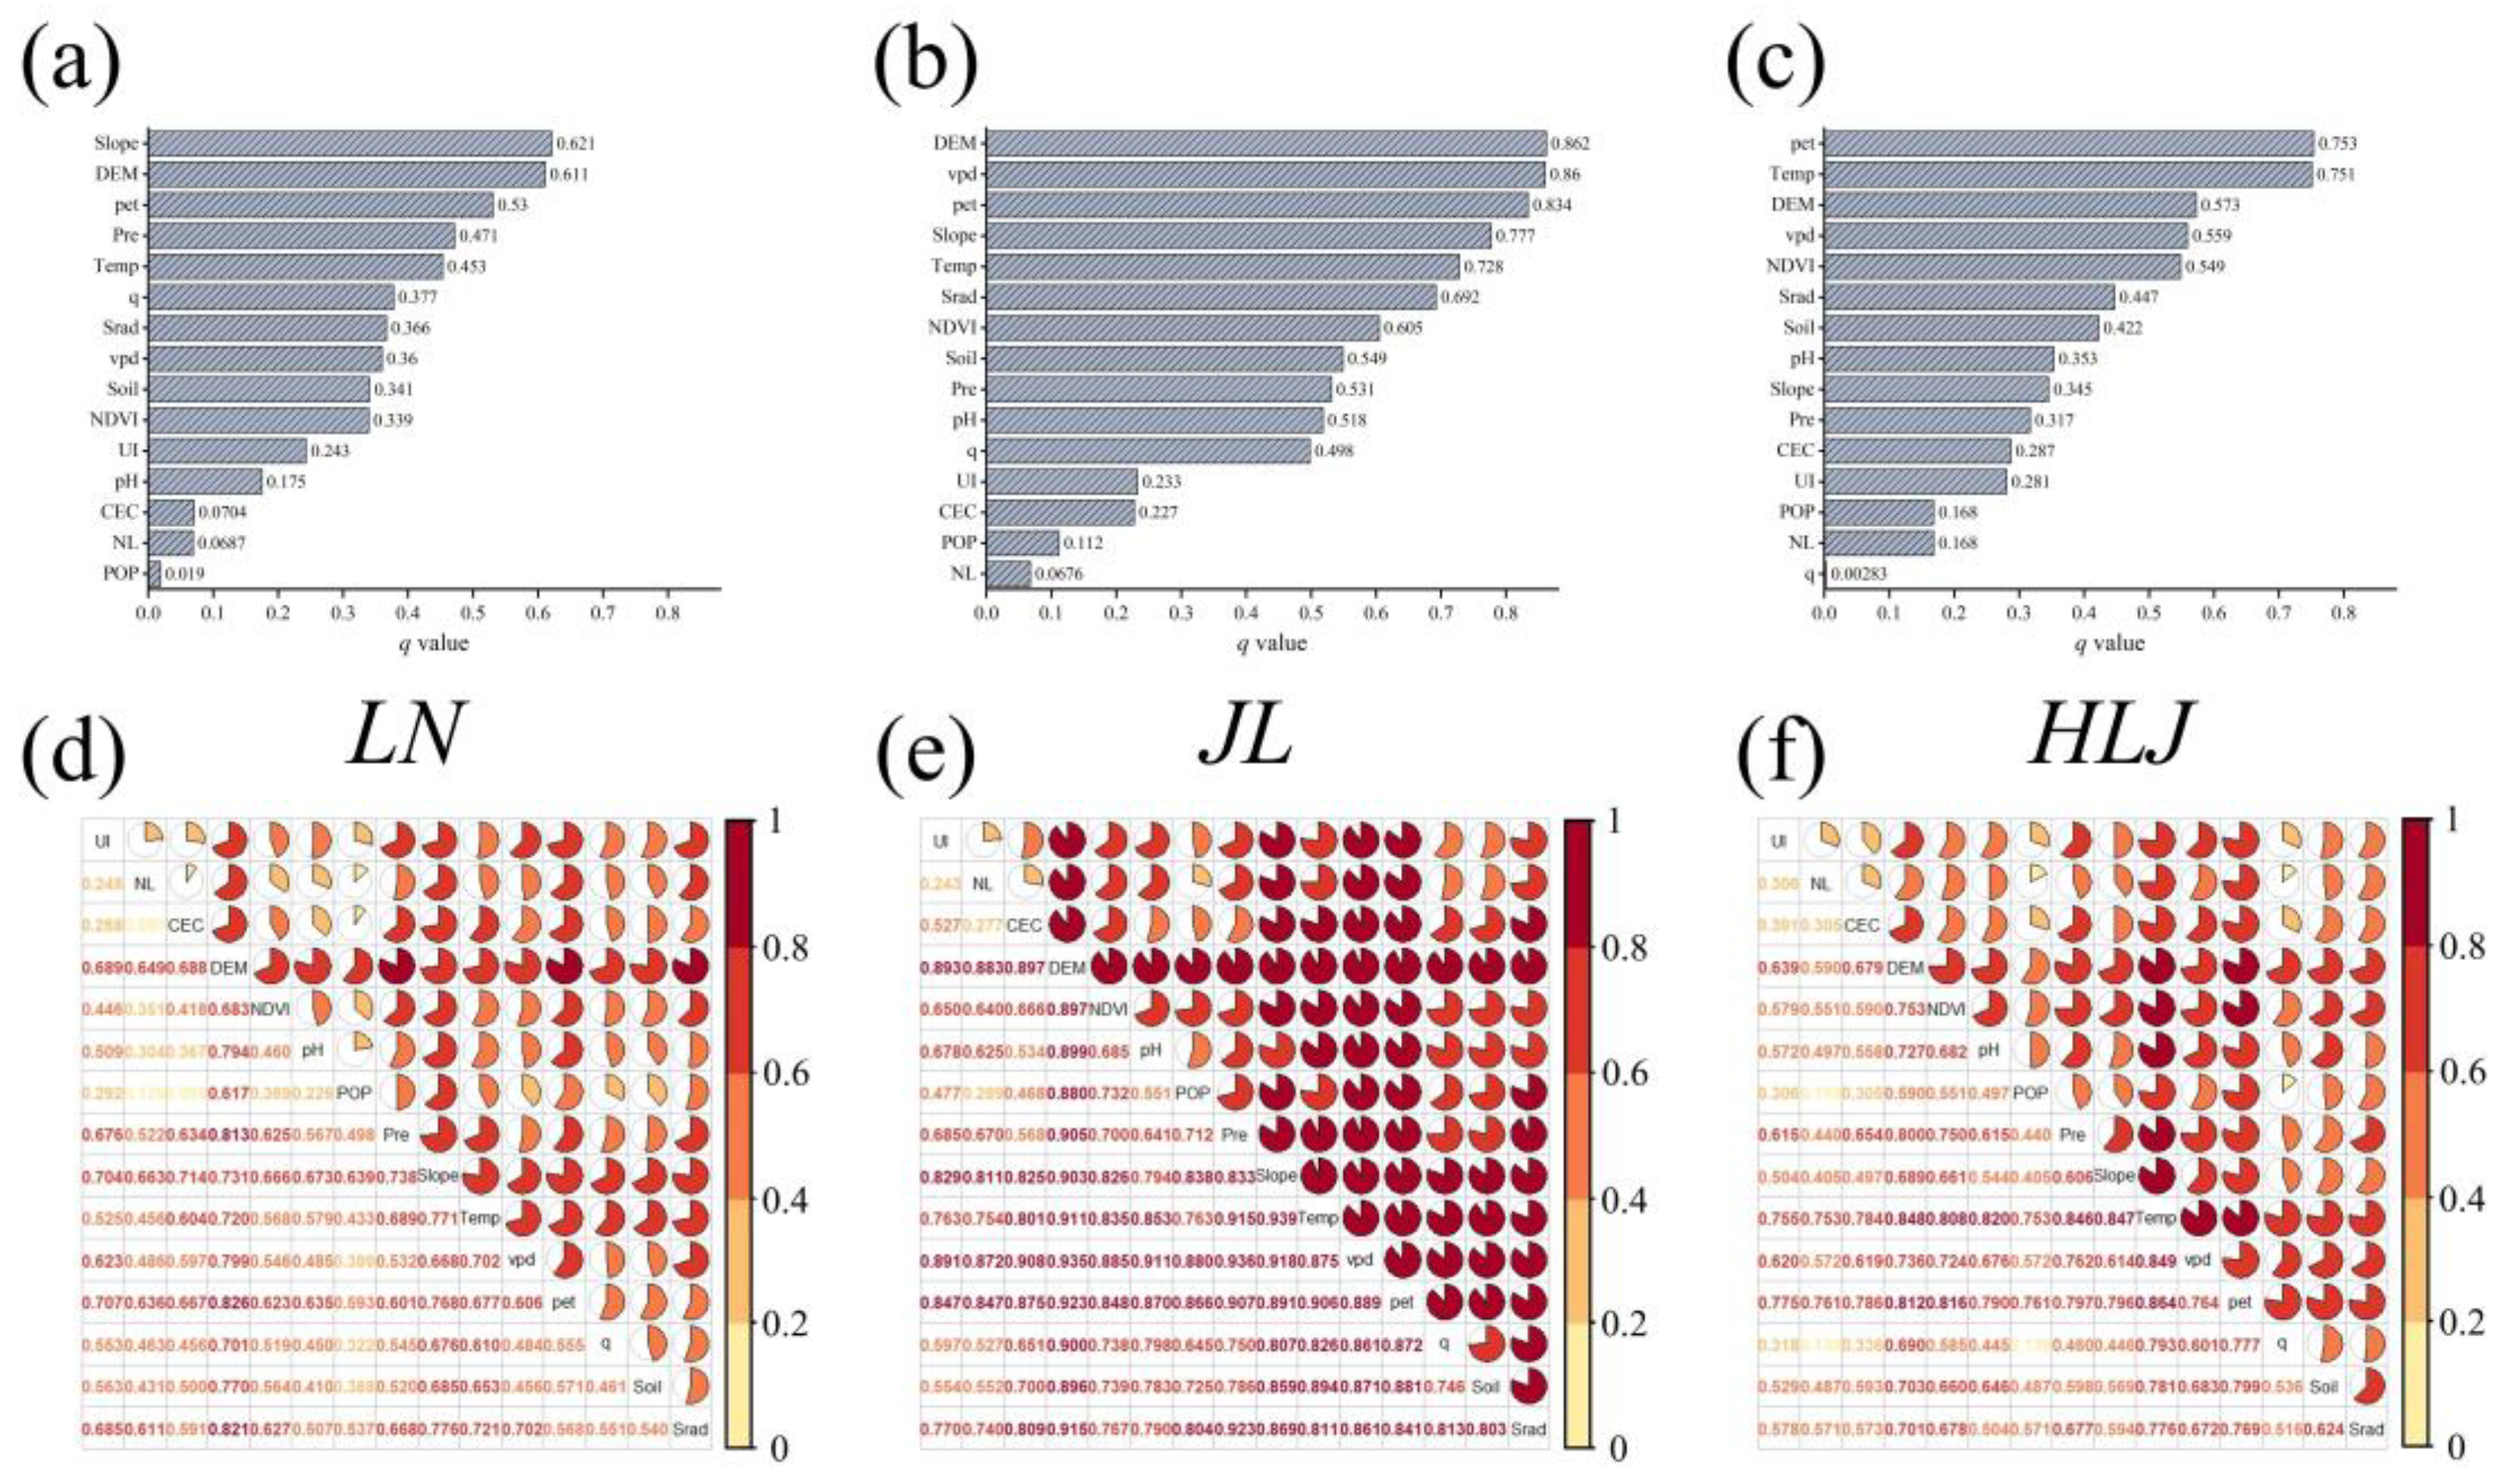
To explore provincial differences in the driving mechanisms of SOM spatial patterns, Geodetector analyses were further conducted for Liaoning, Jilin, and Heilongjiang Provinces (Figure 5). The results revealed marked differences in dominant factors and interaction patterns among the three provinces.
In Liaoning (Figure 5a,d), SOM spatial patterns were primarily controlled by topographic factors, with Slope (q = 0.621) and DEM (q = 0.611) contributing the most, followed by pet (q = 0.530) and Pre (q = 0.471). Human activity factors had limited influence, with POP contributing only 0.019. Interactions among major topographic and climate factors, such as DEM × pet (q = 0.826) and DEM × Srad (q = 0.821), generally exhibited bivariate enhancement, indicating moderate synergistic effects, whereas interactions involving low-contributing factors were mostly weak or independent.
In Jilin (Figure 5b,e), both climate and topography jointly dominated, with DEM (q = 0.862), vpd (q = 0.860), and pet (q = 0.834) ranking highest. NDVI (q = 0.605) also exhibited a substantially higher explanatory power than in Liaoning. Prominent interactions, such as Slope × Temp (q = 0.939) and Pre × vpd (q = 0.936), reflected nonlinear or bivariate enhancement, while combinations of minor factors contributed minimally.
In Heilongjiang (Figure 5c,f), climate factors dominated, with pet (q = 0.753) and Temp (q = 0.751) nearly tied for first place, markedly higher than the third-ranked DEM (q = 0.573). Interactions of major climatic factors, such as Temp × pet (q = 0.864) and Temp × vpd (q = 0.849), mainly exhibited nonlinear or bivariate enhancement, highlighting strong synergistic effects, whereas minor factor interactions were generally weak.
Overall, SOM distribution in Liaoning was mainly driven by topography, in Jilin by a topography–climate coupling, and in Heilongjiang primarily by climate factors. Human activity factors exerted relatively weak influence across all three provinces. The patterns of interaction across provinces align with the general trend that high-contribution factors tend to show stronger synergistic interactions, while low-contribution factors interact weakly or independently.

4. Discussion

4.1. Dominant Role of Climate Factors in Regional-Scale SOM Spatial Patterns

Results from the Geodetector analysis indicated that climate factors, including potential evapotranspiration (pet, q = 0.810), mean annual temperature (Temp, q = 0.794), vapor pressure deficit (vpd, q = 0.766), and solar radiation (Srad, q = 0.719), exhibited markedly higher explanatory power for SOM spatial distribution in Northeast China than other factor types. These findings highlight that, at the regional macro-scale, the spatial patterns of water and heat availability are the primary controls shaping SOM distribution in the Northeast China black soil region, primarily by regulating the “input–output” balance of SOM.
On the output side, climate factors directly influence microbial-driven SOM decomposition and mineralization through temperature and moisture stress [28,29]. The study area exhibits a southeast-to-northwest decreasing water–heat gradient (mean annual temperature ranging from ~10 °C to −5 °C), creating pronounced spatial variation in microbial activity. In the northern Greater and Lesser Khingan Mountains and the eastern Sanjiang Plain, relatively low temperatures and higher soil moisture effectively suppress microbial metabolic rates [30,31], slowing organic matter decomposition and promoting SOM accumulation. Moreover, the interactions between pet and Temp or vpd highlight the importance of hydrothermal coupling. Areas with higher soil moisture can amplify the effects of Temp and vpd on microbial activity and SOM decomposition, indicating synergistic effects of water and heat availability on SOM accumulation across the landscape. Conversely, in the central Songnen Plain, comparatively higher temperatures and potential seasonal drought (reflected by higher pet and vpd values) provide more favorable conditions for microbial activity, accelerating organic matter mineralization and contributing to SOM low-value areas [32].
On the input side, Srad serves as the energy basis for vegetation photosynthesis and indirectly determines the input of litter and root exudates [33]. Although NDVI exhibited moderate explanatory power (q = 0.505), its spatial distribution closely corresponded with Srad [34]. Generally, higher Srad enhances net primary productivity, providing more organic matter to the soil carbon pool [35]. However, the high explanatory power of Srad (q = 0.719) in this study suggests that, in this cold-temperate agricultural ecosystem, the climate-imposed limitation on decomposition may be more critical than its promotion of organic matter input. In other words, SOM accumulation is likely more dependent on reduced decomposition than on increased inputs [5].
These results are consistent with studies from other typical black soil regions, such as the Pampas, where climate factors dominate the prediction of SOM stocks at large scales [36]. In addition, recent studies in the North American Great Plains [37], the Pampas of Argentina [38], and European croplands [39] highlight that temperature, precipitation, and evapotranspiration are primary controls on SOM distribution globally, influencing microbial decomposition and carbon input dynamics. This indicates that the mechanisms identified in Northeast China—such as the dominant role of water–heat availability in regulating the “input–output” balance of SOM—are broadly consistent with patterns observed in other agricultural regions worldwide. Our findings further demonstrate that, even in agricultural landscapes with intense human activity, management practices (e.g., fertilization and tillage) may significantly affect SOM at field scales but are insufficient to override the dominant influence of natural climate gradients at the regional scale.

4.2. Divergent Drivers of SOM Spatial Differentiation: Unveiling Province-Specific Mechanisms

A key finding of this study is that, although climate factors dominate SOM distribution at the regional scale in Northeast China, province-level spatial differentiation is governed by distinct mechanisms in Liaoning, Jilin, and Heilongjiang. This “uniform yet heterogeneous” pattern highlights how intra-regional geographic heterogeneity reshapes the influence pathways of macro-scale water–heat factors, resulting in province-specific dominant drivers.
In Liaoning, topographic factors (Slope and DEM) exhibited the highest explanatory power, emerging as the primary controlling forces. This is closely related to the province’s physiography, dominated by low mountains and hills with high topographic fragmentation. Steep slopes significantly enhance runoff and erosion processes, causing SOM loss from hilltops and upper slopes while promoting accumulation in foot slopes and valley bottoms [40]. Consequently, topographic processes in Liaoning not only obscure the effects of relatively weak climate gradients but also demonstrate that, in historically cultivated and topographically fragmented regions, SOM spatial patterns are more susceptible to topography-driven redistribution.
Jilin exhibits a characteristic coupled influence of climate and topography. Located at the transition zone between the Songnen Plain and the Changbai Mountains, the province features an interleaved natural landscape. On one hand, significant topographic variation modulates micro-scale SOM distribution by altering local water–heat conditions (e.g., aspect-driven temperature and moisture differences) and material transport [41]. On the other hand, Jilin lies within a humid–semi-humid transitional climate zone, where macro-scale gradients in vpd and pet remain pronounced. Their combined effect manifests as strong interactive enhancement (e.g., Pre × vpd interaction q = 0.936), indicating that SOM spatial patterns in Jilin are primarily shaped by nonlinear coupling between macro-climate gradients and meso-scale topographic heterogeneity.
In Heilongjiang, a typical climate-dominated pattern prevails. The province is characterized by vast, continuous plains (Songnen and Sanjiang Plains) with highly homogeneous topography and gentle relief, providing a uniform background that allows climate gradients to fully exert their influence. In this context, Temp and pet directly regulate microbial decomposition rates and vegetation productivity, thereby driving the large-scale northward increase in SOM across the province.

4.3. Implications for Black Soil Conservation and Agricultural Management

The spatial differentiation patterns of SOM and the province-specific driving mechanisms revealed in this study provide critical scientific guidance for implementing differentiated and precise management strategies for black soil conservation. These findings emphasize the need to develop management frameworks tailored to the dominant processes in each province.
In Heilongjiang, where extensive plains prevail and climate factors are overwhelmingly dominant, SOM levels are high but extremely sensitive to warming. Management efforts should therefore focus on maintaining the stability of existing soil carbon stocks. Specific measures include promoting conservation tillage, returning crop residues to the soil, and adopting no-till or reduced-till practices to regulate soil temperature and moisture and suppress excessive decomposition [42], while rational crop rotation can enhance carbon inputs to protect soil carbon reservoirs [43]. Given projected warming and altered precipitation patterns, these adaptive strategies will be increasingly important to mitigate future SOM losses.
Jilin exhibits a coupled influence of climate and topography, where SOM distribution is regulated not only by water–heat conditions but also significantly constrained by erosion processes induced by hilly terrain [44]. Management strategies in this region must therefore balance carbon sequestration and loss prevention. On flat lands, conservation tillage should be maintained, whereas in hilly areas, contour planting, terrace construction, and protective forest establishment can mitigate SOM loss. These interventions should be integrated with slope- and aspect-based management to optimize local water–heat conditions [45,46]. Such integrated approaches can serve as examples for other hilly black soil regions globally, where erosion and climate interactions influence SOM dynamics.
In contrast, Liaoning is dominated by low mountains and hills, where topographic factors exert the strongest control over SOM distribution, and soil erosion and deposition processes largely govern organic matter redistribution [47]. Conservation strategies should focus on controlling water and soil loss and preventing SOM displacement. In addition to contour and strip planting, engineering measures such as terraces and check dams, combined with ecological restoration projects like returning farmland to forest or grassland, are essential to reduce erosion at its source [48,49,50]. Considering future land-use and climate changes, proactive erosion control is critical to sustain SOM stocks in topographically complex regions.
Overall, these province-specific differences demonstrate that SOM conservation cannot treat the entire region as homogeneous. Limited management resources should be prioritized in areas where dominant processes are most pronounced, such as erosion-prone zones in Liaoning or carbon stock stabilization areas in Heilongjiang. Furthermore, although the strategies are developed for Northeast China, the principles of integrating climate, topography, and land management considerations are applicable to other major black soil regions worldwide, such as the North American Great Plains, the Pampas of Argentina, and the Chernozem regions of Eastern Europe. This zoning-based management not only improves efficiency and effectiveness but also provides a solid basis for implementing the national “Black Soil Protection Law” and the “grain-in-soil” strategy, while contributing proactively to climate resilience and food security.

4.4. Limitations and Future Perspectives

Despite revealing the multi-factorial drivers of SOM spatial differentiation in Northeast China and their province-specific characteristics, this study has several limitations, which also indicate directions for future research. First, data heterogeneity cannot be ignored. The multi-source geospatial datasets integrated in this study vary in spatial resolution (ranging from 30 m to 4 km). Although the Geodetector method is robust to multicollinearity, mismatched resolutions may introduce uncertainties in the integrated analysis, particularly limiting the fine-scale characterization of local patterns and factor interactions. While we did not conduct a formal sensitivity analysis in this study, we acknowledge that such analyses using harmonized resolutions will be essential in future work to better assess the robustness of our findings. In addition, future studies could employ statistical downscaling and data assimilation approaches to construct consistent high-resolution datasets of key driving factors, thereby improving model accuracy and stability.
Second, the characterization of human activities in this study remains indirect. While NL, POP, and UI reflect macro-scale human activity, they do not capture specific agricultural management practices such as fertilizer application (chemical and organic), tillage methods and frequency, or crop rotation systems—all of which are direct and critical drivers of SOM dynamics [51]. Future research should integrate farmer surveys, agricultural statistics, and high-resolution remote sensing data to capture field-level management information and more precisely quantify anthropogenic impacts. It should also be noted that urban areas were not excluded in this analysis. Although NL, POP, and UI capture macro-scale human activity, the presence of urban regions may influence SOM patterns differently than rural areas. Future studies could consider excluding urban areas or explicitly accounting for urban effects to refine the analysis of SOM spatial distribution. In addition, some key soil attributes, such as soil texture and bulk density, were not included in the current analyses due to data limitations. Incorporating these variables in future models could further improve understanding and prediction of SOM spatial distribution. It should be noted that all analyses in this study are conducted at the county level, representing a macro-scale perspective. Therefore, the identified patterns and driving mechanisms of SOM distribution are applicable only at this regional scale, and caution should be taken to avoid ecological fallacy when interpreting these results at finer scales.
Furthermore, this study provides a cross-sectional (i.e., static) snapshot of SOM spatial patterns, whereas SOM is inherently a dynamic pool subject to significant temporal lags under climate change and human activities [52]. Cross-sectional analyses cannot reveal temporal evolution or dynamic driving mechanisms. Therefore, constructing long-term time-series SOM datasets, coupled with temporal or spatiotemporal Geodetector analyses, will be an important future direction. This approach will deepen understanding of the long-term evolution of SOM in black soil regions and provide more robust scientific support for scenario-based predictions and policy evaluations.

5. Conclusions

This study revealed the spatial patterns and driving mechanisms of SOM in Northeast China at both regional and provincial scales. The results indicate that (1) SOM exhibits a general “higher in the north and east, lower in the south and west” distribution pattern, with Heilongjiang showing significantly higher SOM contents than Jilin and Liaoning, and notable spatial clustering observed at the regional scale; (2) climate factors serve as the primary drivers at the macro-scale, with pet and Temp showing the strongest explanatory power; (3) the driving mechanisms vary significantly among provinces: SOM in Liaoning is mainly controlled by topographic factors and Jilin is governed by a coupled effect of topography and climate, whereas in Heilongjiang, climate factors dominate; and (4) human activity factors exhibit relatively weak explanatory power at the regional scale, although they may exert amplifying effects in localized areas.
These findings not only provide quantitative evidence for understanding the spatial patterns and controlling mechanisms of SOM in Northeast China, but also highlight the potential impacts of future climate and land-use changes on SOM stability. Management strategies tailored to local conditions, integrating climate, topography, and land-use considerations, are essential to sustain soil carbon stocks.
Furthermore, the principles derived from this study have broader relevance for global black soil regions, including the North American Great Plains, the Pampas of Argentina, and the Chernozem regions of Eastern Europe. By demonstrating the multi-scale and multi-factor drivers of SOM heterogeneity, this study contributes to the global understanding of soil carbon dynamics and offers guidance for black soil conservation and sustainable agricultural management worldwide.

Author Contributions

Conceptualization, D.K. and N.C.; methodology, D.K.; software, D.K.; validation, D.K., N.C. and C.L.; formal analysis, D.K.; investigation, N.C.; resources, C.L.; data curation, D.K.; writing—original draft preparation, D.K.; writing—review and editing, C.L.; visualization, D.K.; supervision, C.L.; project administration, N.C.; funding acquisition, N.C. All authors have read and agreed to the published version of the manuscript.

Funding

This study was supported by Heilongjiang Provincial Natural Science Foundation of China (YQ2024D012); Innovative Research Project for Postgraduates of Harbin Normal University (HSDSSCX2024-06).

Data Availability Statement

Data will be made available on request.

Acknowledgments

We thankfully acknowledge the support of all the team members for their valuable discussions. We greatly appreciate the contributions of all authors.

Conflicts of Interest

The authors declare no conflicts of interest.

References

  1. Neely, C.; Bunning, S.; Wilkes, A. Review of Evidence on Drylands Pastoral Systems and Climate Change; FAO: Rome, Italy, 2009. [Google Scholar]
  2. Kong, D.; Luo, C.; Liu, H. Integrative remote sensing and machine learning approaches for SOC and TN spatial distribution: Unveiling C: N ratio in Black Soil region. Soil Tillage Res. 2026, 255, 106809. [Google Scholar] [CrossRef]
  3. Meena, R.S. Significance of Soil Organic Matter to Soil Quality and Evaluation of Sustainability. In Sustainable Agriculture; Scientific Publishers: Jodhpur, India, 2019; pp. 357–381. [Google Scholar]
  4. Kong, D.; Chu, N.; Luo, C.; Liu, H. Analyzing spatial distribution and influencing factors of soil organic matter in cultivated land of northeast China: Implications for black soil protection. Land 2024, 13, 1028. [Google Scholar] [CrossRef]
  5. Schmidt, M.W.; Torn, M.S.; Abiven, S.; Dittmar, T.; Guggenberger, G.; Janssens, I.A.; Kleber, M.; Kögel-Knabner, I.; Lehmann, J.; Manning, D.A. Persistence of soil organic matter as an ecosystem property. Nature 2011, 478, 49–56. [Google Scholar] [CrossRef]
  6. Dungait, J.A.; Hopkins, D.W.; Gregory, A.S.; Whitmore, A.P. Soil organic matter turnover is governed by accessibility not recalcitrance. Glob. Change Biol. 2012, 18, 1781–1796. [Google Scholar] [CrossRef]
  7. Azadmard, B.; Mosaddeghi, M.R.; Ayoubi, S.; Chavoshi, E.; Raoof, M. Spatial variability of near-saturated soil hydraulic properties in Moghan plain, North-Western Iran. Arab. J. Geosci. 2018, 11, 452. [Google Scholar] [CrossRef]
  8. Marchetti, A.; Piccini, C.; Francaviglia, R.; Mabit, L. Spatial distribution of soil organic matter using geostatistics: A key indicator to assess soil degradation status in central Italy. Pedosphere 2012, 22, 230–242. [Google Scholar] [CrossRef]
  9. Li, Y.; Zheng, S.; Wang, L.; Dai, X.; Zang, D.; Qi, B.; Meng, X.; Mei, X.; Luo, C.; Liu, H. Systematic identification of factors influencing the spatial distribution of soil organic matter in croplands within the black soil region of Northeastern China across multiple scales. Catena 2025, 249, 108633. [Google Scholar] [CrossRef]
  10. Zhang, B.; Niu, L.; Jia, T.; Yu, X.; She, D. Spatial variability of soil organic matter and total nitrogen and the influencing factors in Huzhu County of Qinghai Province, China. Acta Agric. Scand. Sect. B—Soil Plant Sci. 2022, 72, 576–588. [Google Scholar] [CrossRef]
  11. Du, Z.; Gao, B.; Ou, C.; Du, Z.; Yang, J.; Batsaikhan, B.; Dorjgotov, B.; Yun, W.; Zhu, D. A quantitative analysis of factors influencing organic matter concentration in the topsoil of black soil in northeast China based on spatial heterogeneous patterns. ISPRS Int. J. Geo-Inf. 2021, 10, 348. [Google Scholar] [CrossRef]
  12. Hu, K.; Wang, S.; Li, H.; Huang, F.; Li, B. Spatial scaling effects on variability of soil organic matter and total nitrogen in suburban Beijing. Geoderma 2014, 226, 54–63. [Google Scholar] [CrossRef]
  13. Xie, E.; Zhang, Y.; Huang, B.; Zhao, Y.; Shi, X.; Hu, W.; Qu, M. Spatiotemporal variations in soil organic carbon and their drivers in southeastern China during 1981–2011. Soil Tillage Res. 2021, 205, 104763. [Google Scholar] [CrossRef]
  14. Zhao, X.; Zhang, Z.; Zhao, M.; Song, X.; Liu, X.; Zhang, X. The quantified and major influencing factors on spatial distribution of soil organic matter in provincial-scale farmland—A case study of shandong province in Eastern China. Appl. Sci. 2023, 13, 3738. [Google Scholar] [CrossRef]
  15. Wu, X.; Cai, C.; Yuan, Z.; Li, D.; Zhou, J.; Huang, C. Contributions of climate and soil properties to geographic variations of soil organic matter across the East Asian monsoon region. Soil Tillage Res. 2023, 234, 105845. [Google Scholar] [CrossRef]
  16. Luo, C.; Zhang, W.; Zhang, X.; Liu, H. Mapping soil organic matter content using Sentinel-2 synthetic images at different time intervals in Northeast China. Int. J. Digit. Earth 2023, 16, 1094–1107. [Google Scholar] [CrossRef]
  17. Li, M.; Shi, X.; Shen, Z.; Yang, E.; Bao, H.; Ni, Y. Effect of hillslope aspect on landform characteristics and erosion rates. Environ. Monit. Assess. 2019, 191, 598. [Google Scholar] [CrossRef] [PubMed]
  18. Singh, S. Understanding the role of slope aspect in shaping the vegetation attributes and soil properties in Montane ecosystems. Trop. Ecol. 2018, 59, 417–430. [Google Scholar]
  19. von Lützow, M.; Kögel-Knabner, I. Temperature sensitivity of soil organic matter decomposition—What do we know? Biol. Fertil. Soils 2009, 46, 1–15. [Google Scholar] [CrossRef]
  20. Cui, Y.; Fang, L.; Deng, L.; Guo, X.; Han, F.; Ju, W.; Wang, X.; Chen, H.; Tan, W.; Zhang, X. Patterns of soil microbial nutrient limitations and their roles in the variation of soil organic carbon across a precipitation gradient in an arid and semi-arid region. Sci. Total Environ. 2019, 658, 1440–1451. [Google Scholar] [CrossRef]
  21. Delgado, A.; Gómez, J.A. The Soil: Physical, Chemical, and Biological Properties. In Principles of Agronomy for Sustainable Agriculture; Springer: Berlin/Heidelberg, Germany, 2024; pp. 15–30. [Google Scholar]
  22. Pettorelli, N. The Normalized Difference Vegetation Index; Oxford University Press: Oxford, MS, USA, 2013. [Google Scholar]
  23. Zhao, M.; Tian, Y.; Dong, N.; Hu, Y.; Tian, G.; Lei, Y. Spatial and temporal dynamics of habitat quality in response to socioeconomic and landscape patterns in the context of urbanization: A case in Zhengzhou City, China. Nat. Conserv. 2022, 48, 185–212. [Google Scholar] [CrossRef]
  24. Bürgi, M.; Turner, M.G. Factors and processes shaping land cover and land cover changes along the Wisconsin River. Ecosystems 2002, 5, 184–201. [Google Scholar] [CrossRef]
  25. Wang, J.; Xu, C.D. Geodetector: Principle and prospective. Acta Geogr. Sin. 2017, 72, 116–134. [Google Scholar]
  26. Li, F.; Nan, T.; Zhang, H.; Luo, K.; Xiang, K.; Peng, Y. Evaluating Ecological Vulnerability and Its Driving Mechanisms in the Dongting Lake Region from a Multi-Method Integrated Perspective: Based on Geodetector and Explainable Machine Learning. Land 2025, 14, 1435. [Google Scholar] [CrossRef]
  27. Wang, Q.; Jiang, D.; Gao, Y.; Zhang, Z.; Chang, Q. Examining the driving factors of SOM using a multi-scale GWR model augmented by geo-detector and GWPCA analysis. Agronomy 2022, 12, 1697. [Google Scholar] [CrossRef]
  28. Khan, M.T.; Supronienė, S.; Žvirdauskienė, R.; Aleinikovienė, J. Climate, Soil, and Microbes: Interactions Shaping Organic Matter Decomposition in Croplands. Agronomy 2025, 15, 1928. [Google Scholar] [CrossRef]
  29. Li, S.; Delgado-Baquerizo, M.; Ding, J.; Hu, H.; Huang, W.; Sun, Y.; Ni, H.; Kuang, Y.; Yuan, M.M.; Zhou, J. Intrinsic microbial temperature sensitivity and soil organic carbon decomposition in response to climate change. Glob. Change Biol. 2024, 30, e17395. [Google Scholar] [CrossRef]
  30. Feng, J.; Zeng, X.-M.; Zhang, Q.; Zhou, X.-Q.; Liu, Y.-R.; Huang, Q. Soil microbial trait-based strategies drive metabolic efficiency along an altitude gradient. ISME Commun. 2021, 1, 71. [Google Scholar] [CrossRef]
  31. Cruz-Paredes, C.; Tájmel, D.; Rousk, J. Can moisture affect temperature dependences of microbial growth and respiration? Soil Biol. Biochem. 2021, 156, 108223. [Google Scholar] [CrossRef]
  32. De Silva, S.; Kariyawasam Hetti Gamage, L.; Thapa, V.R. Impact of Drought on Soil Microbial Communities. Microorganisms 2025, 13, 1625. [Google Scholar] [CrossRef] [PubMed]
  33. Zhang, L.; Ding, Y.; He, Y.; Yan, S.; Jiang, X.; Guo, Y.; Ran, L. The Response and Attribution of Vegetation Productivity Sensitivity to Drought in Northwest China. SSRN 2025, SSRN 5346798. [Google Scholar]
  34. Wang, C.; Li, Z.; Chen, Y.; Li, Y.; Ouyang, L.; Zhu, J.; Sun, F.; Song, S.; Li, H. Changes in global heatwave risk and its drivers over one century. Earth’s Future 2024, 12, e2024EF004430. [Google Scholar] [CrossRef]
  35. Zhou, P.; Tian, L.; Graham, N.; Song, S.; Zhao, R.; Siddique, M.S.; Hu, Y.; Cao, X.; Lu, Y.; Elimelech, M. Spatial patterns and environmental functions of dissolved organic matter in grassland soils of China. Nat. Commun. 2024, 15, 6356. [Google Scholar] [CrossRef]
  36. Alvarez, R.; Lavado, R.S. Climate, organic matter and clay content relationships in the Pampa and Chaco soils, Argentina. Geoderma 1998, 83, 127–141. [Google Scholar] [CrossRef]
  37. Trujillo, W.; Fonte, S.J.; Schipanski, M.E.; Peterson, G.A. Managing Soil Organic Matter for Alleviating Drought Stress in Dryland Farming in North American Great Plains. In Soil Organic Carbon and Feeding the Future; CRC Press: Boca Raton, FL, USA, 2021; pp. 253–272. [Google Scholar]
  38. Fernández, D.S.; Puchulu, M.E.; Rostagno, C.M.; La Manna, L.; Becker, A.R.; Grumelli, M.d.T.; Schiavo, H.F. Agricultural land degradation in Argentina. In Impact of Agriculture on Soil Degradation I: Perspectives from Africa, Asia, America and Oceania; Springer: Cham, Switzerland, 2022; pp. 1–47. [Google Scholar]
  39. Lisetskii, F.N.; Buryak, Z.A.; Marinina, O.A.; Ukrainskiy, P.A.; Goleusov, P.V. Features of soil organic carbon transformations in the Southern area of the East European plain. Geosciences 2023, 13, 278. [Google Scholar] [CrossRef]
  40. Geremew, B.; Tadesse, T.; Bedadi, B.; Gollany, H.T.; Tesfaye, K.; Aschalew, A. Impact of land use/cover change and slope gradient on soil organic carbon stock in Anjeni watershed, Northwest Ethiopia. Environ. Monit. Assess. 2023, 195, 971. [Google Scholar] [CrossRef]
  41. Fang, Q.; Hong, H.; Algeo, T.J.; Huang, X.; Sun, A.; Churchman, G.J.; Chorover, J.; Chen, S.; Liu, Y. Microtopography-mediated hydrologic environment controls elemental migration and mineral weathering in subalpine surface soils of subtropical monsoonal China. Geoderma 2019, 344, 82–98. [Google Scholar] [CrossRef]
  42. Du, C.; Li, L.; Effah, Z. Effects of straw mulching and reduced tillage on crop production and environment: A review. Water 2022, 14, 2471. [Google Scholar] [CrossRef]
  43. King, A.E.; Blesh, J. Crop rotations for increased soil carbon: Perenniality as a guiding principle. Ecol. Appl. 2018, 28, 249–261. [Google Scholar] [CrossRef] [PubMed]
  44. Sharma, S.; Singh, P.; Chauhan, S.; Choudhary, O. Landscape position and slope aspects impacts on soil organic carbon pool and biological indicators of a fragile ecosystem in high-altitude cold arid region. J. Soil Sci. Plant Nutr. 2022, 22, 2612–2632. [Google Scholar] [CrossRef]
  45. Sharma, S.; Bala, N.; Sharma, P.; Singh, J.; Bahel, S.; Katnoria, J.K. Integrated Remedial and Management Strategies for Sustaining Mountainous Soil. In Understanding Soils of Mountainous Landscapes; Elsevier: Amsterdam, The Netherlands, 2023; pp. 43–57. [Google Scholar]
  46. Arnhold, S.; Lindner, S.; Lee, B.; Martin, E.; Kettering, J.; Nguyen, T.T.; Koellner, T.; Ok, Y.S.; Huwe, B. Conventional and organic farming: Soil erosion and conservation potential for row crop cultivation. Geoderma 2014, 219, 89–105. [Google Scholar] [CrossRef]
  47. de Nijs, E.A.; Cammeraat, E.L. The stability and fate of Soil Organic Carbon during the transport phase of soil erosion. Earth-Sci. Rev. 2020, 201, 103067. [Google Scholar] [CrossRef]
  48. Wade, M.R.; Gurr, G.M.; Wratten, S.D. Ecological restoration of farmland: Progress and prospects. Philos. Trans. R. Soc. B—Biol. Sci. 2008, 363, 831–847. [Google Scholar] [CrossRef] [PubMed]
  49. Saturday, A. Restoration of degraded agricultural land: A review. J. Environ. Health Sci. 2018, 4, 44–51. [Google Scholar]
  50. Thapa, B.; Cassel, D.; Garrity, D.P. Ridge tillage and contour natural grass barrier strips reduce tillage erosion. Soil Tillage Res. 1999, 51, 341–356. [Google Scholar] [CrossRef]
  51. Jiang, Y.; Zhang, J.; Manuel, D.-B.; De Beeck, M.O.; Shahbaz, M.; Chen, Y.; Deng, X.; Xu, Z.; Li, J.; Liu, Z. Rotation cropping and organic fertilizer jointly promote soil health and crop production. J. Environ. Manag. 2022, 315, 115190. [Google Scholar] [CrossRef] [PubMed]
  52. Campbell, E.E.; Paustian, K. Current developments in soil organic matter modeling and the expansion of model applications: A review. Environ. Res. Lett. 2015, 10, 123004. [Google Scholar] [CrossRef]
Figure 1. Overview of the study area. (a) Geographic location of the study area in China; (b) field photograph taken within the study area in April 2025; (c) elevation of the study area.
Agriculture 15 01983 g001
Figure 2. Spatial distribution characteristics of SOM in the study area. (a) Spatial distribution of SOM content across Northeast China; (b) boxplot showing the county-scale mean SOM content in Northeast China and the three provinces. NC: Northeast China; LN: Liaoning Province; JL: Jilin Province; HLJ: Heilongjiang Province.
Agriculture 15 01983 g002
Figure 3. Local spatial clustering and outlier patterns of SOM content across Northeast China, based on Local Moran’s I.
Agriculture 15 01983 g003
Figure 4. Explanatory power of factors for SOM spatial distribution in Northeast China. (a) factor detection results; (b) interaction detection results.
Agriculture 15 01983 g004
Figure 5. Factor and interaction detection results for SOM spatial distribution across provinces. (ac) Single-factor detection results for Liaoning, Jilin, and Heilongjiang, respectively; (df) interaction detection results for Liaoning, Jilin, and Heilongjiang, respectively. Color and arc size represent the magnitude of the interaction q values, with darker colors and larger areas indicating stronger explanatory power.
Agriculture 15 01983 g005
Table 1. Description and sources of the influencing factors.
CodeNameResolutionSource
UIUrbanization intensity index1 kmhttps://www.geodata.cn (accessed on 11 August 2025)
NLNighttime light index500 mhttps://www.geodata.cn (accessed on 11 August 2025)
CECCation exchange capacity250 mhttps://www.geodata.cn (accessed on 11 August 2025)
NDVINormalized difference vegetation index250 mhttps://data.tpdc.ac.cn (accessed on 11 August 2025)
DEMElevation30 mhttps://earthengine.google.com (accessed on 11 August 2025)
SlopeSlope30 mhttps://earthengine.google.com (accessed on 11 August 2025)
pHSoil pH30 mhttps://www.geodata.cn (accessed on 11 August 2025)
POPPopulation density100 mhttps://www.geodata.cn (accessed on 11 August 2025)
TempMean annual temperature1 kmhttps://www.geodata.cn (accessed on 11 August 2025)
PreMean annual precipitation1 kmhttps://www.geodata.cn (accessed on 11 August 2025)
vpdVapor pressure deficit4 kmhttps://www.climatologylab.org/ (accessed on 11 August 2025)
petPotential evapotranspiration4 kmhttps://www.climatologylab.org/ (accessed on 11 August 2025)
qRunoff4 kmhttps://www.climatologylab.org/ (accessed on 11 August 2025)
SoilSoil moisture4 kmhttps://www.climatologylab.org/ (accessed on 11 August 2025)
SradSolar radiation4 kmhttps://www.climatologylab.org/ (accessed on 11 August 2025)
Table 3. Global Moran’s I and associated statistics for SOM content in Northeast China.
IndexMoran’s IExpectation Indexz Scorep Value
Value0.730−0.00334.334<0.001
The theoretical range of Moran’s I is [−1, 1]. A p-value < 0.001 indicates significance at the 99.9% confidence level.
Disclaimer/Publisher’s Note: The statements, opinions and data contained in all publications are solely those of the individual author(s) and contributor(s) and not of MDPI and/or the editor(s). MDPI and/or the editor(s) disclaim responsibility for any injury to people or property resulting from any ideas, methods, instructions or products referred to in the content.