Article

Simulation and Experiment on Parameters of an Airflow-Guiding Device for a Centrifugal Air-Assisted Sprayer

1
College of Mechanical and Electrical Engineering, Hebei Agricultural University, Baoding 071000, China
2
Hebei Province Smart Agriculture Equipment Technology Innovation Center, Baoding 071001, China
*
Author to whom correspondence should be addressed.
Agriculture 2025, 15(18), 1969; https://doi.org/10.3390/agriculture15181969
Submission received: 19 August 2025 / Revised: 13 September 2025 / Accepted: 15 September 2025 / Published: 18 September 2025
(This article belongs to the Section Agricultural Technology)

Abstract

Orchard air-assisted sprayers have become key equipment for the prevention and control of fruit tree diseases and pests. However, centrifugal fans are rarely used in orchard air-assisted sprayers. To address the issue that the airflow generated by single-duct centrifugal air-assisted sprayers is insufficient to cover the lower canopy, a flow-guiding device for the lower canopy of fruit trees was designed. The Flow Simulation software of SOLIDWORKS 2021 was used to simulate the airflow field, and various structural parameters of the air outlet were analyzed to determine the optimal configuration of the upper edge inclination angle, the position of the upper air outlet, and the length of the upper air outlet. The results showed that the position of the upper air outlet had the most significant impact on the uniformity of the external flow field, followed by the upper edge inclination angle and the length of the upper air outlet. The optimal parameter settings for the air supply guiding device were determined as follows: upper edge inclination angle of 79°, upper air outlet position of 307 mm, and upper air outlet length of 190 mm. The verification test showed that the relative error between the simulated and actual airflow velocity measurements did not exceed 10%, confirming the accuracy of the simulation. The orchard field test showed that the average deposition density in the inner canopy of fruit trees was 78 particles/cm2, indicating strong penetration ability; the distribution of spray droplets in the vertical direction of the canopy was uniform, meeting the requirements of fruit tree pesticide application operations. This technology provides a new approach for the application of centrifugal fans in fruit tree pesticide spraying.

1. Introduction

In 2024, China’s total apple output reached 51.2851 million tons, showing an increasing trend year by year [1]. Plant diseases and insect pests will lead to the deterioration of the appearance and internal quality of fruits [2]. The prevention and control of orchard diseases and insect pests is a key link to ensure the yield and quality of fruits [3], and its workload accounts for more than 30% of the total workload of orchard management [4].
Air-assisted spraying technology uses high-velocity airflow to assist droplets in penetrating the fruit tree canopy. The high-velocity rotation of the fan generates airflow, which further atomizes the pesticide solution into finer droplets [5,6]. It enhances the uniformity of droplet deposition in the canopy by disturbing the canopy structure and improves the uniformity of pesticide deposition on the front and back of leaves [7]. Optimizing the air-assisted structural device can improve the pesticide deposition rate and reduce pesticide drift [8]. Centrifugal fans have the characteristics of low noise and large air volume; however, they are rarely used in orchard spraying operations. The reason is that the high-velocity airflow generated by centrifugal fans is relatively concentrated and difficult to cover the entire fruit tree. Although the combined use of centrifugal fans and flexible air ducts can solve the above problem, multiple ducts cause high pressure and energy loss [9].
Significant progress has been made in the theory and application of air-assisted spraying technology [10,11,12]. Peng et al. [13] used the maximum entropy principle to predict droplet size, and the correlation coefficients between the predicted droplet size distribution and the experimental values were all higher than 0.96, with root mean square errors all lower than 0.135. Ding et al. [14] built a droplet size testing device and a droplet deposition distribution testing device to study the spatial deposition of fan nozzles under different spraying methods, and found that spray pressure, airflow velocity, and spray angle have a great impact on reducing droplet drift, with cross airflow velocity having a particularly significant impact. Li et al. [15] designed an umbrella-shaped wind field anti-drift device, which reduced the droplet drift rate, mass center distance, and coefficient of variation of droplet deposition distribution by 27.5%, 16.2%, and 7%, respectively, compared with ordinary airflow.
Designing flow-guiding devices to influence the distribution of airflow fields has become a research focus among many scholars [16]. Huang et al. [17] developed an air-assisted sprayer for citrus orchards, and by installing a converging tube, they expanded the range of usable airflow velocity airflow. Khot et al. [18] developed a sprayer using an axial flow fan to provide airflow. This device is equipped with adjustable shutters, and by adjusting the opening degree of the shutters, it can change the airflow angle and airflow rate, thus achieving precise spraying in citrus orchards. Xu et al. [19] designed an air-assisted strawberry sprayer. By developing a duckbill-shaped cover, a 60° operating airflow field was formed, which meets the operational requirements.
CFD (Computational Fluid Dynamics) technology has become the core technology for optimizing air-assisted structures [20,21]. Chen et al. used CFD-DPM (Computational Fluid Dynamics–Discrete Phase Model) technology to simulate the working scenario of sprayers in cigar tobacco. The average absolute errors between the front and back test values and the simulated values were both less than 0.25, indicating that the simulation model can accurately simulate droplet deposition characteristics [22]. Li et al. [23] developed a CFD model to study UAV pesticide spraying, and the results showed that droplet deposition fluctuates with the increase in propeller speed, and both temperature and relative humidity affect droplet deposition. Cui et al. [24] proposed a two-stage CFD simulation method for air-assisted spray droplet deposition, considering the impact of leaf deformation on droplet movement and deposition, and found that increased droplet deposition and drift risk were observed under strong airflow and high spray flow rates. Lü et al. [25] obtained the deflector parameters with the highest degree of fit between the wind field and the fruit tree canopy by setting the deflector angle. It was found that for orchard spraying with a row spacing of 4 m and a tree height of 3.0–3.2 m, the angles of both upper and lower deflectors are 30°; for trellised orchards, the upper deflector angle is 90° (or the upper deflector is removed) and the lower deflector angle is 30°, achieving the best profiling effect. Hong et al. [26] developed a comprehensive CFD model to predict airflow distribution and pesticide deposition in apple canopies by treating the canopy as a virtual porous medium. The CFD model can accurately predict the peak airflow velocity and airflow pressure inside the canopy, with root mean square errors of 1.68 m/s and 0.89 kg/m2, and relative errors of 29.2% and 20.2%, respectively.
In high-spindle dense-planted orchards, traditional air-assisted sprayers generally have problems such as uneven airflow distribution [27], insufficient droplet penetration [28], and significant differences in deposition effects in the vertical direction of the canopy. The existing air duct outlet structure often has unreasonable parameter design, leading to the phenomenon of “high in the middle and low on both sides” in airflow distribution [29]. The lower canopy of fruit trees is the area with the highest leaf area index of the whole fruit tree, so improving the pesticide deposition rate in the lower layer of fruit trees is crucial.
To solve the above problems, this paper proposes an air duct structure installed on a centrifugal fan for pest control in the lower canopy of fruit trees. A combination of simulation and experimental verification is used to study the impact of air outlet parameters on the airflow field, then determine the structure of the air duct, and carry out field tests to verify that it meets the requirements of orchard pest control. This study provides a new idea for improving the pesticide deposition rate in the lower canopy of fruit trees.

2. Materials and Methods

2.1. Working Principle of Centrifugal Air-Assisted Sprayer

The centrifugal air-assisted sprayer is mainly composed of working components such as a centrifugal fan, an air supply guiding device, a pesticide tank, a transmission, a belt drive structure, a spray head, and a diaphragm pump, as shown in Figure 1a, Detailed parameters are presented in Table 1. The working process of the centrifugal air-assisted sprayer is as follows: The rear output shaft of the tractor drives the diaphragm pump through a coupling and transmits power to the gearbox. The power output by the gearbox is accelerated through belt transmission to drive the centrifugal fan to rotate. The impeller of the centrifugal fan rotates to generate high-velocity airflow, which is sent into the fruit tree canopy through the air supply guiding device. The pesticide solution is pressurized by the diaphragm pump, and the pressurized pesticide solution forms uniform droplets through the nozzle via the pesticide tube and enters the airflow field. The high-velocity airflow carries the small droplets to the fruit tree canopy. With the power of the airflow, it penetrates the fruit tree canopy and disturbs the leaves, achieving uniform coverage of the pesticide solution on the front and back of the leaves in the sprayed area of the fruit tree canopy. Figure 1b shows the working process of the centrifugal air-assisted sprayer.

2.2. Structural Analysis of Flow-Guiding Device

The height of the tall spindle-shaped fruit tree is 3.0–4.0 m, with a unilateral branch spread of 0.4–0.9 m, with branches beginning about 0.5 m above the ground. In this study, the median tree height is 3.5 m, and the unilateral branch spread is 0.65 m. The lower canopy is 0.5–1.5 m from the ground, the middle canopy 1.5–2.5 m, and the upper canopy 2.5–3.5 m.
Orchard sprayers with multiple air ducts and directional air supply using centrifugal fans as the air source have obvious advantages: according to the research by Jiang Honghua in 2020 [30], multi-duct air-assisted sprayers have better droplet penetration and coverage, and the loss of liquid spray product is further reduced. However, during the operation of the multi-duct structure, due to the frictional resistance existing on the wall of each air duct, the static pressure of the system will increase significantly. This phenomenon puts forward higher requirements for the performance of the centrifugal fan. It not only requires the fan to have a stronger static pressure output capacity to overcome the resistance, but also causes energy waste due to additional energy consumption. Reducing the number of air ducts can reduce resistance. As shown in Figure 2a, a single air duct on one side can significantly reduce the system static pressure. However, due to the characteristics of the centrifugal fan and the characteristics of fluid movement, the airflow often flows out through the outlet far from the centrifugal fan, as shown in Figure 2b. It is difficult for the airflow to cover the lower crown of the fruit tree. An airless zone is formed near the lower canopy of fruit trees, and no airflow generated by the centrifugal fan flows through this airless zone, so a separate diversion device should be designed for the lower canopy to direct the airflow into the lower canopy. As shown in Figure 2c, the designed flow-guiding device directs the airflow generated by the centrifugal fan into the lower canopy of the fruit tree.
The flow-guiding device is an important component of the centrifugal air-assisted sprayer. As shown in Figure 3a, the flow-guiding device is composed of an air inlet, an arc-shaped air duct, a side air outlet, an upper air outlet, etc. As shown in Figure 3b, the high-speed airflow generated by the centrifugal fan flows in through the air inlet, and part of it flows out through the upper air outlet through the arc-shaped air duct, while the other part flows out through the side air outlet. The flow-guiding device is designed as a model without sudden cross-sectional changes to reduce energy loss. It is equipped with lateral air outlets and upper air outlets to increase the width of the air field and improve the liquid medicine deposition rate.
The size and shape of the air inlet of the flow-guiding device are the same as those of the air outlet of the centrifugal fan. The selected fan is Jiuzhou Puhui 11–62 multi-blade centrifugal fan (FOSHAN NANHAI POPULA FAN, Shanghai, China). The overall design of the air duct is compact, and the height of the air outlet is relatively low. According to the principle of air volume replacement, a smaller air duct size can reduce the demand for air volume during spraying operations. A shorter air duct structure can reduce energy loss, thereby achieving energy conservation and reducing noise.

2.3. Selection of Key Parameters for the Flow-Guiding Device

The area of the air outlet affects the flow of air. The upper edge inclination angle and lower edge inclination angle jointly control the air jet angle and air outlet area of the side air outlet. The position of the upper air outlet determines the airflow distribution ratio, which directly affects the coverage width of the air field. The length and width of the upper air outlet jointly define the cross-sectional area of the upper air outlet, regulating the flow distribution and thus affecting the distribution of the external flow field. Therefore, this paper selects the upper edge inclination angle, lower edge inclination angle, position of the upper air outlet, length of the upper air outlet, and position of the upper air outlet as key parameters.
As shown in Figure 3c, the angles between the upper and lower edges of the lateral air outlet of the air duct and the vertical line are the upper and lower edge inclination angles α and β, respectively. The distance D between the projection of the upper air outlet on the horizontal plane and the right edge of the air outlet represents the position of the upper air outlet. The length L and width W of the projection of the upper air outlet on the horizontal plane represent the length and width of the upper air outlet.

2.4. Airflow Field Simulation Based on CFD Technology

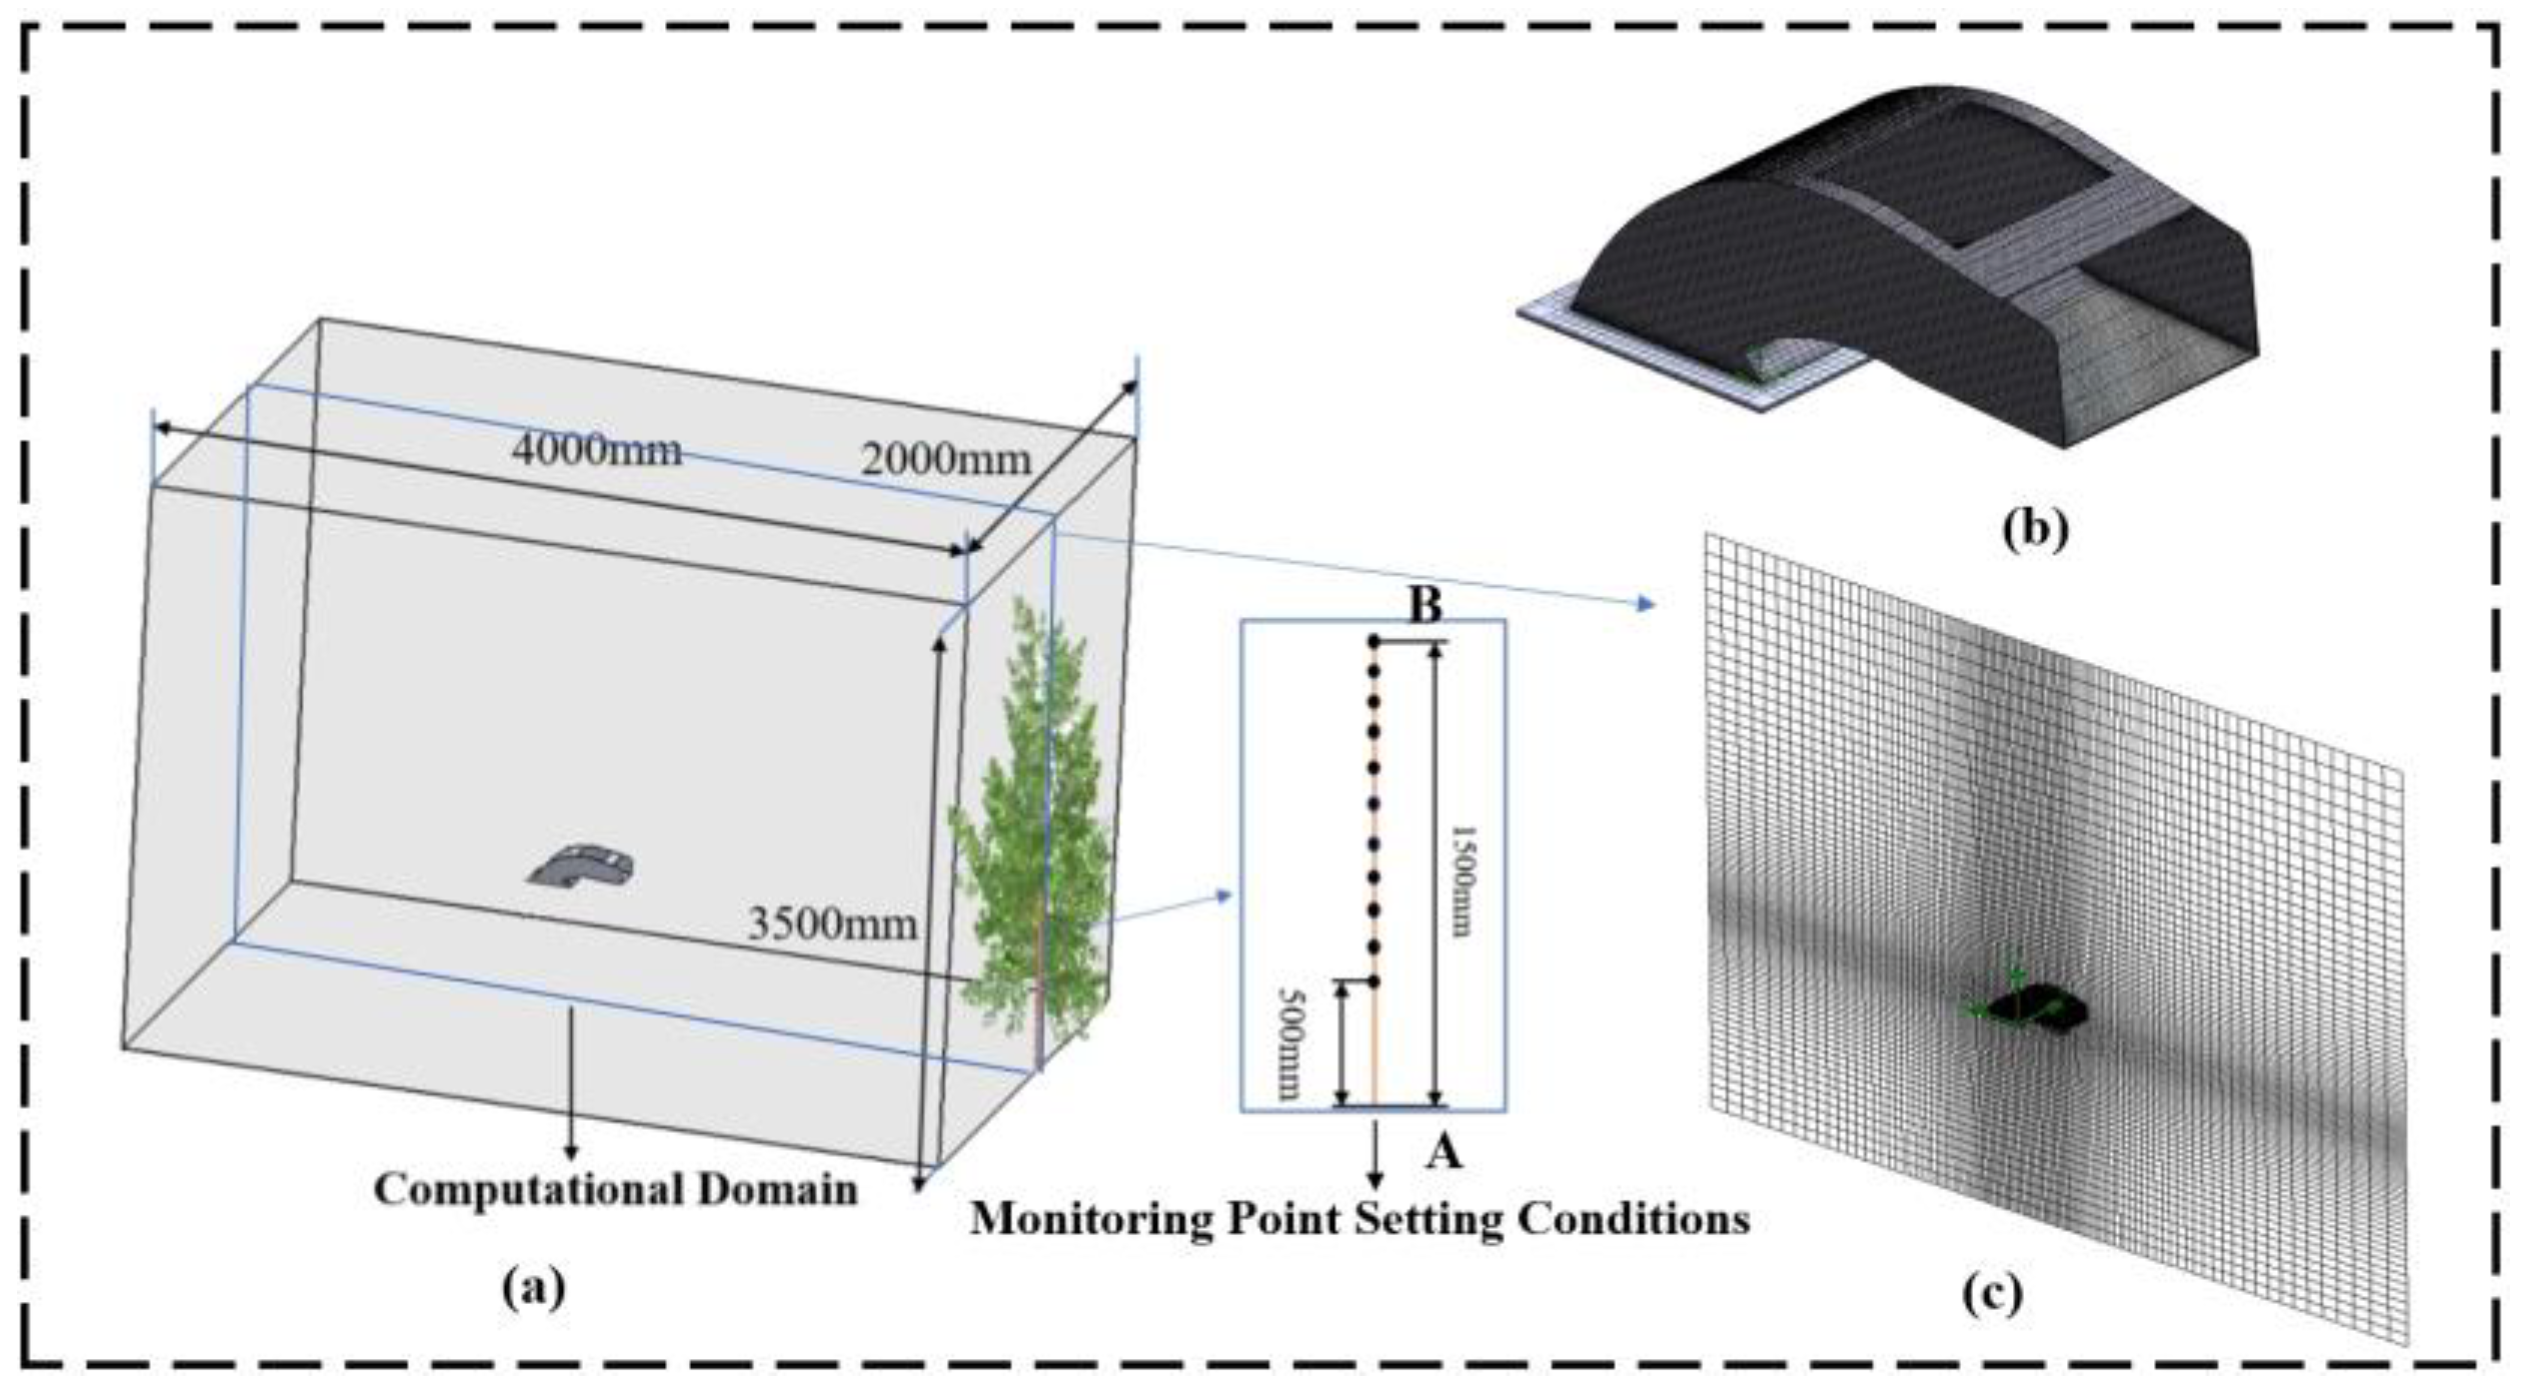
In this paper, the CFD software Flow Simulation of SOLIDWORKS 2021 is used to conduct finite element analysis on the flow-guiding device, and a three-dimensional model of the structure of the flow-guiding device is established. The relevant settings for the airflow field simulation are shown in Figure 4. According to the requirements of mechanical operation in the dwarf-rootstock dense-planting apple orchard, the calculation domain is set as a cuboid with a length (L) of 4000 mm, a width (W) of 2000 mm, and a height (H) of 3500 mm. The size and quantity of the mesh have a great influence on the calculation time and accuracy. The fluid domain is divided by combining global mesh division and local mesh division, generating 286,126 calculation meshes. The setting of sampling points is based on the fact that the tree shape in the dwarf dense-planting orchard is mainly the tall spindle tree shape. A straight line AB coinciding with the tree trunk is taken. The first measuring point is introduced 500 mm away from point A, and then a measuring point is introduced every 100 mm upward. Up to 1500 mm away from point A, a total of 11 measuring points are inserted.

2.4.1. Governing Equations

To study the wind field formed by the airflow generated by the high-speed rotation of the centrifugal fan after passing through the air duct, the external flow field is selected for analysis. The Navier–Stokes equations and the standard k-ε turbulence model are adopted [31].
(1)
The mass conservation equation is as follows:
u x + v y + w z = 0
(2)
The momentum conservation equation is as follows:
ρ ( u u x + v u y + w u z ) = ρ F x ρ x + μ ( 2 u x 2 + 2 u y 2 + 2 u z 2 )
ρ ( u v x + v v y + w v z ) = ρ F y ρ y + μ ( 2 v x 2 + 2 v y 2 + 2 v z 2 )
ρ ( u w x + v w y + w w z ) = ρ F z ρ z + μ ( 2 w x 2 + 2 w y 2 + 2 w z 2 )
In the formula, x, y, and z are the lengths of the abscissas, m; u, v, w are the velocities corresponding to the three coordinate axes, m/s; ρ is the density, kg/m3; F x , F y , and F z are the components of the unit mass force acting on the unit fluid element in the three coordinate axes, N.
(3)
The energy conservation equation is as follows:
ρ T t + d i v ρ U T = d i v ( k c p g r a d T ) + S T
In the formula, T is the temperature (°C); k is the heat transfer coefficient; c p is the specific heat capacity; and ST is the viscous dissipation term.
(4)
The turbulent kinetic energy equation is as follows:
ρ k u i x i = x j ( ( μ + μ t δ k ) k x j ) + G k ρ ε
(5)
The turbulent dissipation rate equation is as follows:
ρ ε u i x i = x j ( ( μ + μ t δ ε ) ε x j ) + C 1 ε ε k G k C 2 ε ρ ε 2 k
In the formula, μ t is the turbulent viscosity coefficient (Pa·s); x i   and x j are the length distances in two directions (m); G k is the turbulent kinetic energy production term caused by the mean velocity gradient; C1ε and C2ε are empirical constants; δ k and δ ε are the Prandtl numbers corresponding to the turbulent kinetic energy k and the dissipation rate ε, respectively; and u i is the velocity (m/s). The standard wall function is used for processing near the wall. The calculation convergence conditions are the average velocities in X, Y, Z directions and the static pressure. The ambient temperature is set to 298.5 K, and the pressure is 101.125 kPa (standard atmospheric pressure). The external flow field is set with a wind speed opposite to the actual operation direction, and its magnitude is the same as the operation velocity, which is 0.6 m/s.

2.4.2. Evaluation Indicators

Excessively high or low velocity of the airflow reaching the target will have an adverse impact on the spray effect. Too low airflow velocity will cause the airflow to fail to effectively penetrate the fruit tree canopy, resulting in uneven distribution of spray droplets in the canopy, insufficient deposition of spray droplets inside the canopy, and excessive deposition of spray droplets outside the canopy, which lead to poor spray effect and also cause poor drift of spray droplets. When the airflow velocity is excessively high, spray droplets are prone to being blown away from the target area, which leads to the waste of liquid pesticide and increases environmental risks [32]. The horizontal airflow velocity u 2 of the spray droplet group reaching the inner part of the canopy is 1.0–2.0 m/s, and the airflow has a certain energy to disturb the branches. By equating the canopy to a porous medium model and ignoring the velocity perpendicular to the flow direction, the velocity u1 reaching the periphery of the canopy and the velocity u2 reaching the inner part of the fruit tree satisfy the following formula [9]:
u 2 u 1 = 1 2 C f u 1
In the formula, Cf is the drag coefficient, which is determined by the canopy permeability value, and the measured canopy permeability value is 1.8. The velocity u 1 reaching the periphery of the canopy is 10–20 m/s. When the velocity reaching the periphery of the canopy is greater than 12 m/s, It causes significant damage to the branches of fruit trees. Therefore, u 1 should be set to 10–12 m/s. In this paper, the mean velocity of 11 monitoring points is used to characterize the velocity reaching the periphery of the canopy. The monitoring points are on AB, and the velocity of the airflow decays from the periphery of the canopy to the tree trunk. The airflow type is a plane free jet, which is in the far field and satisfies the following formula:
u 3 = L 2 L 1 u 1
In the formula, u 3 is the target velocity at the monitoring point; L1 is the distance from the air outlet to the tree trunk, m; L2 is the distance from the air outlet to the outer canopy, m. The parameter values are set as L1 = 2.3 m and L2 = 1.65 m. Substituting into the formula, we can obtain u 3 = 8.45 m/s∼10.16 m/s. A uniform wind field can make the deposition distribution of spray droplets in the fruit tree canopy more uniform, help the spray droplets penetrate into the interior of the canopy, and reduce the loss of liquid medicine on the ground. The velocity unevenness coefficient is introduced to measure the uniformity of the flow field. A smaller non-uniformity coefficient indicates better uniformity of the flow field; conversely, it indicates worse uniformity of the flow field. The calculation formula of the velocity unevenness coefficient is as follows:
C V = S V V ¯ = 1 n 1 i = 1 n V i V ¯ 2 V ¯
CV—Velocity unevenness coefficient;
SV—Standard deviation of airflow velocity at monitoring points, m/s;
V ¯ —Average airflow velocity at monitoring points;
Vi—Airflow velocity at each monitoring point, m/s;
n—Number of monitoring points.

3. Results

3.1. Single-Factor Experiment

Through pre-experiments, the upper edge inclination angle was initially determined to be 79°, the lower edge angle to be 75°, the upper air outlet position to be 315 mm, the length to be 215 mm, and the width to be 200 mm. Through single-factor experiments, the influence of each variable on the wind field was analyzed. For each factor, multiple different working conditions were set. Under the condition that the airflow velocity at the air inlet was fixed at 18.2 m/s, the mean velocity and velocity of 11 sampling points under each working condition were read, with the standard deviation used as the error bar. Furthermore, the velocity unevenness coefficient was calculated to evaluate the quality and uniformity of the airflow field.

3.1.1. Influence of Upper Edge Inclination Angle on Airflow Field

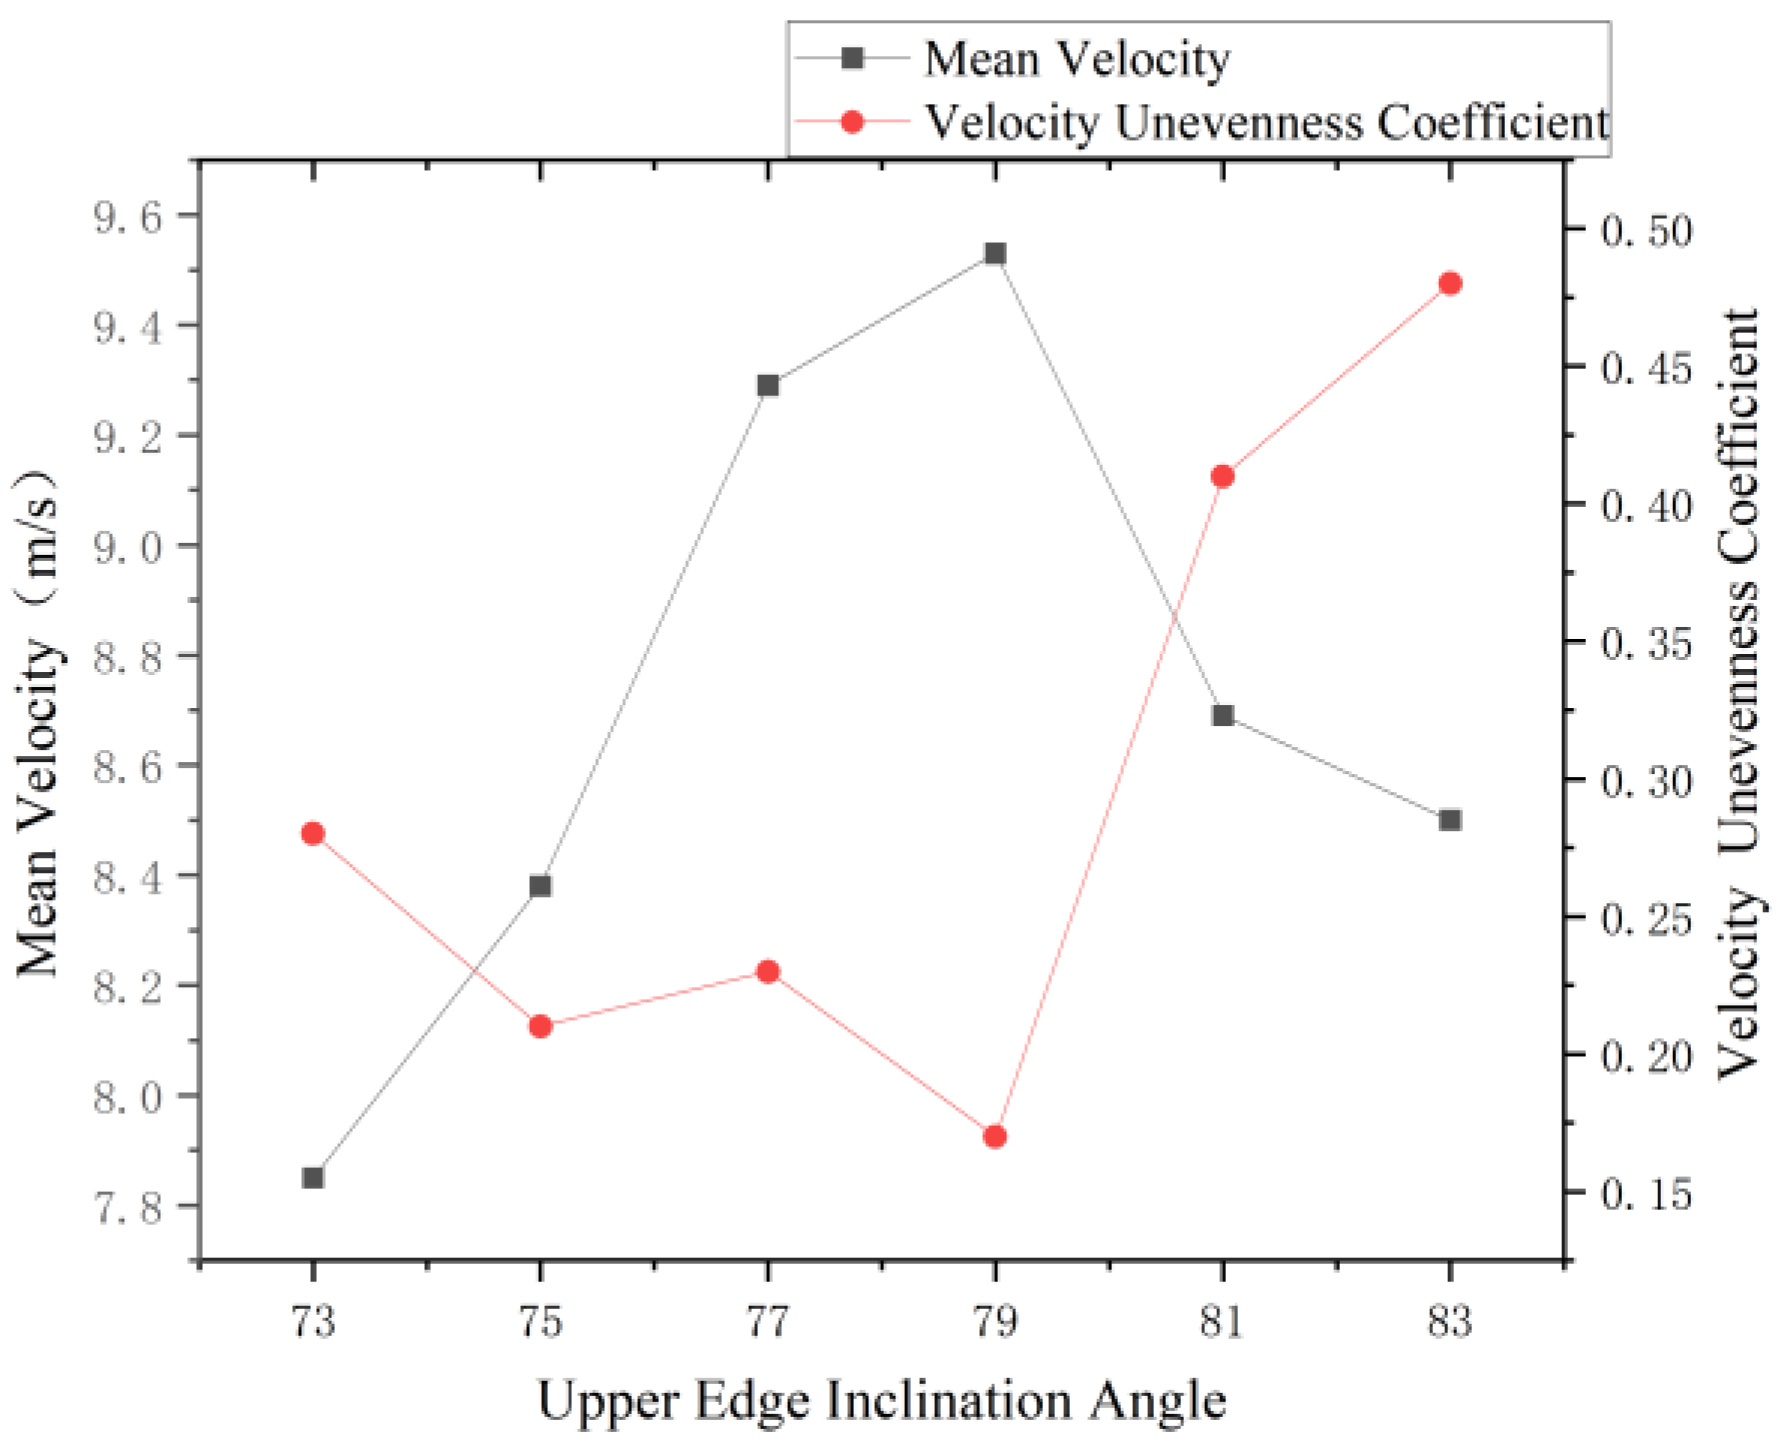
Under the conditions of a lower edge inclination angle of 75°, an air outlet position of 315 mm, a length of 215 mm, and a width of 200 mm, a single-factor experiment was conducted with the upper edge inclination angles set to 73°, 75°, 77°, 79°, 81°, and 83°. Analysis of Figure 5 shows that the mean velocity ranges from 7.85 to 8.51 m/s, and the velocity unevenness coefficient ranges from 0.17 to 0.48. The velocity fluctuation is opposite to the pressure fluctuation, and the range of velocity fluctuation is small. The upper edge inclination angle has a relatively obvious impact on both the velocity at the monitoring points and the velocity unevenness coefficient. As the upper edge inclination angle increases, the mean velocity first rises and then falls, while the velocity unevenness coefficient first decreases and then increases, with a rapid increase when the angle is greater than 79°. The mean velocity at an upper edge inclination angle of 73° has a large deviation from the target velocity. The velocity cloud diagrams of the external flow field under different upper edge inclination angles are shown in Figure 6. When the upper edge inclination angle is between 75° and 83°, the airflow has a good coverage of the monitoring point area. Therefore, the upper edge inclination angle is initially determined to be in the range of 75° to 83°.

3.1.2. Influence of Lower Edge Inclination Angle on Airflow Field

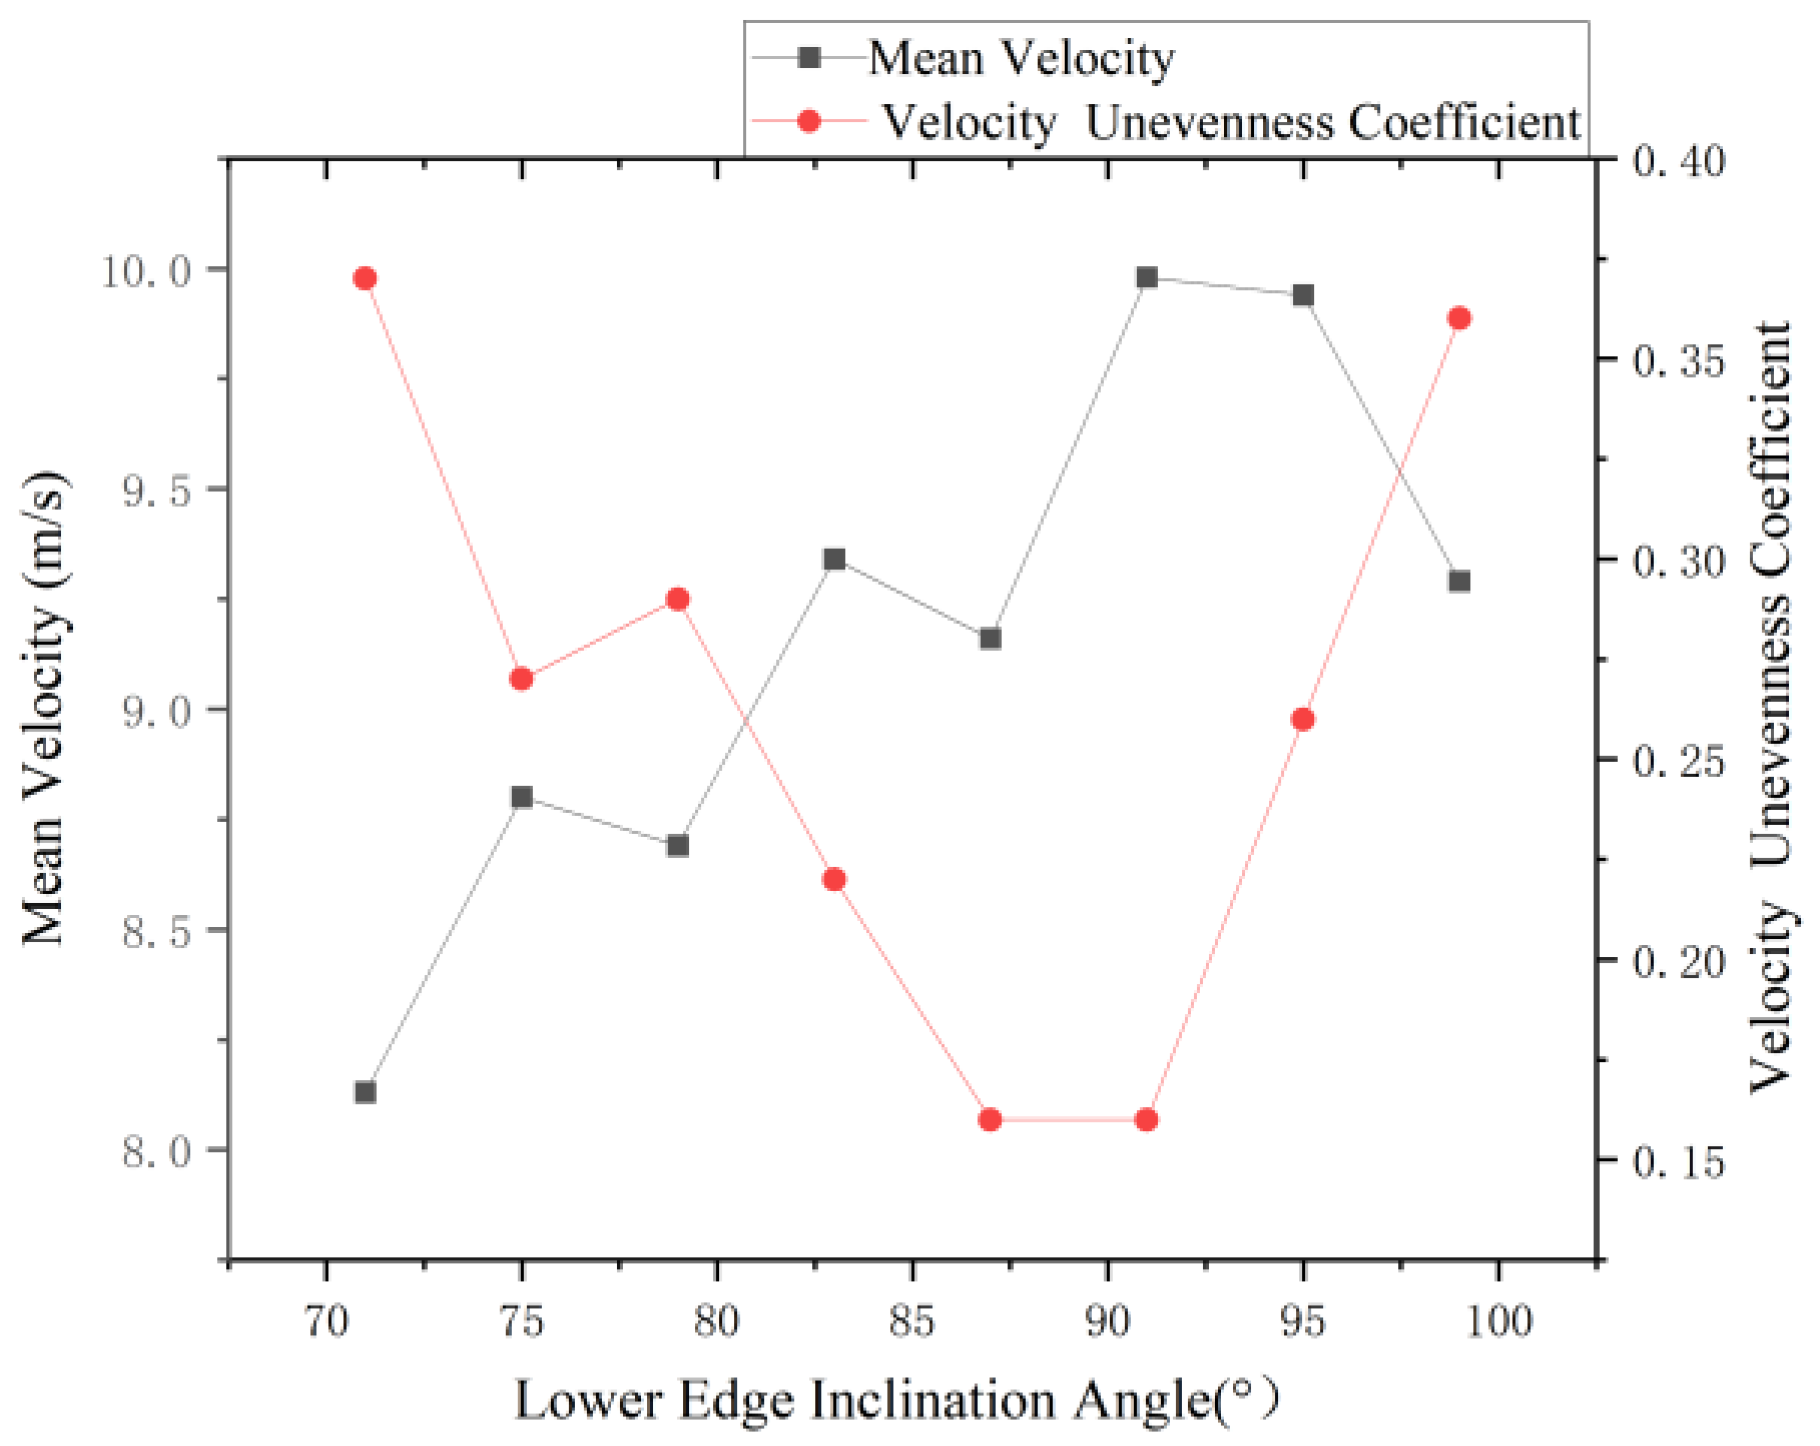
Under the conditions of an upper edge inclination angle of 79°, an air outlet position of 315 mm, a length of 215 mm, and a width of 200 mm, a single-factor experiment was conducted with the lower edge inclination angles set to 71°, 75°, 79°, 83°, 87°, 91°, 95°, and 99°. Analysis of Figure 7 shows that the mean velocity ranges from 8.13 to 9.29 m/s, and the velocity unevenness coefficient ranges from 0.16 to 0.18. The mean velocity increases stepwise when the lower edge inclination angle is between 71° and 91°, and decreases when the angle exceeds 91°. The velocity unevenness coefficient shows a trend of first decreasing and then increasing. The minimum value of the velocity unevenness coefficient is 0.16, which occurs at 87°. The velocity cloud diagrams of the external flow field under different lower edge inclination angles are shown in Figure 8. When the lower edge inclination angle is 87°, the airflow provides good coverage of the monitoring point area. A comprehensive analysis of the upper edge inclination angle and lower edge inclination angle reveals that they interact to affect the air outlet area and air outlet direction of the lateral air outlet, thereby influencing the airflow velocity. Therefore, in the multi-factor experiment, the lower edge inclination angle is fixed, and the optimal parameter combination is obtained by adjusting the upper edge inclination angle. Hence, the lower edge inclination angle corresponding to the minimum velocity unevenness coefficient is 87°.

3.1.3. Influence of Upper Air Outlet Position on Airflow Field

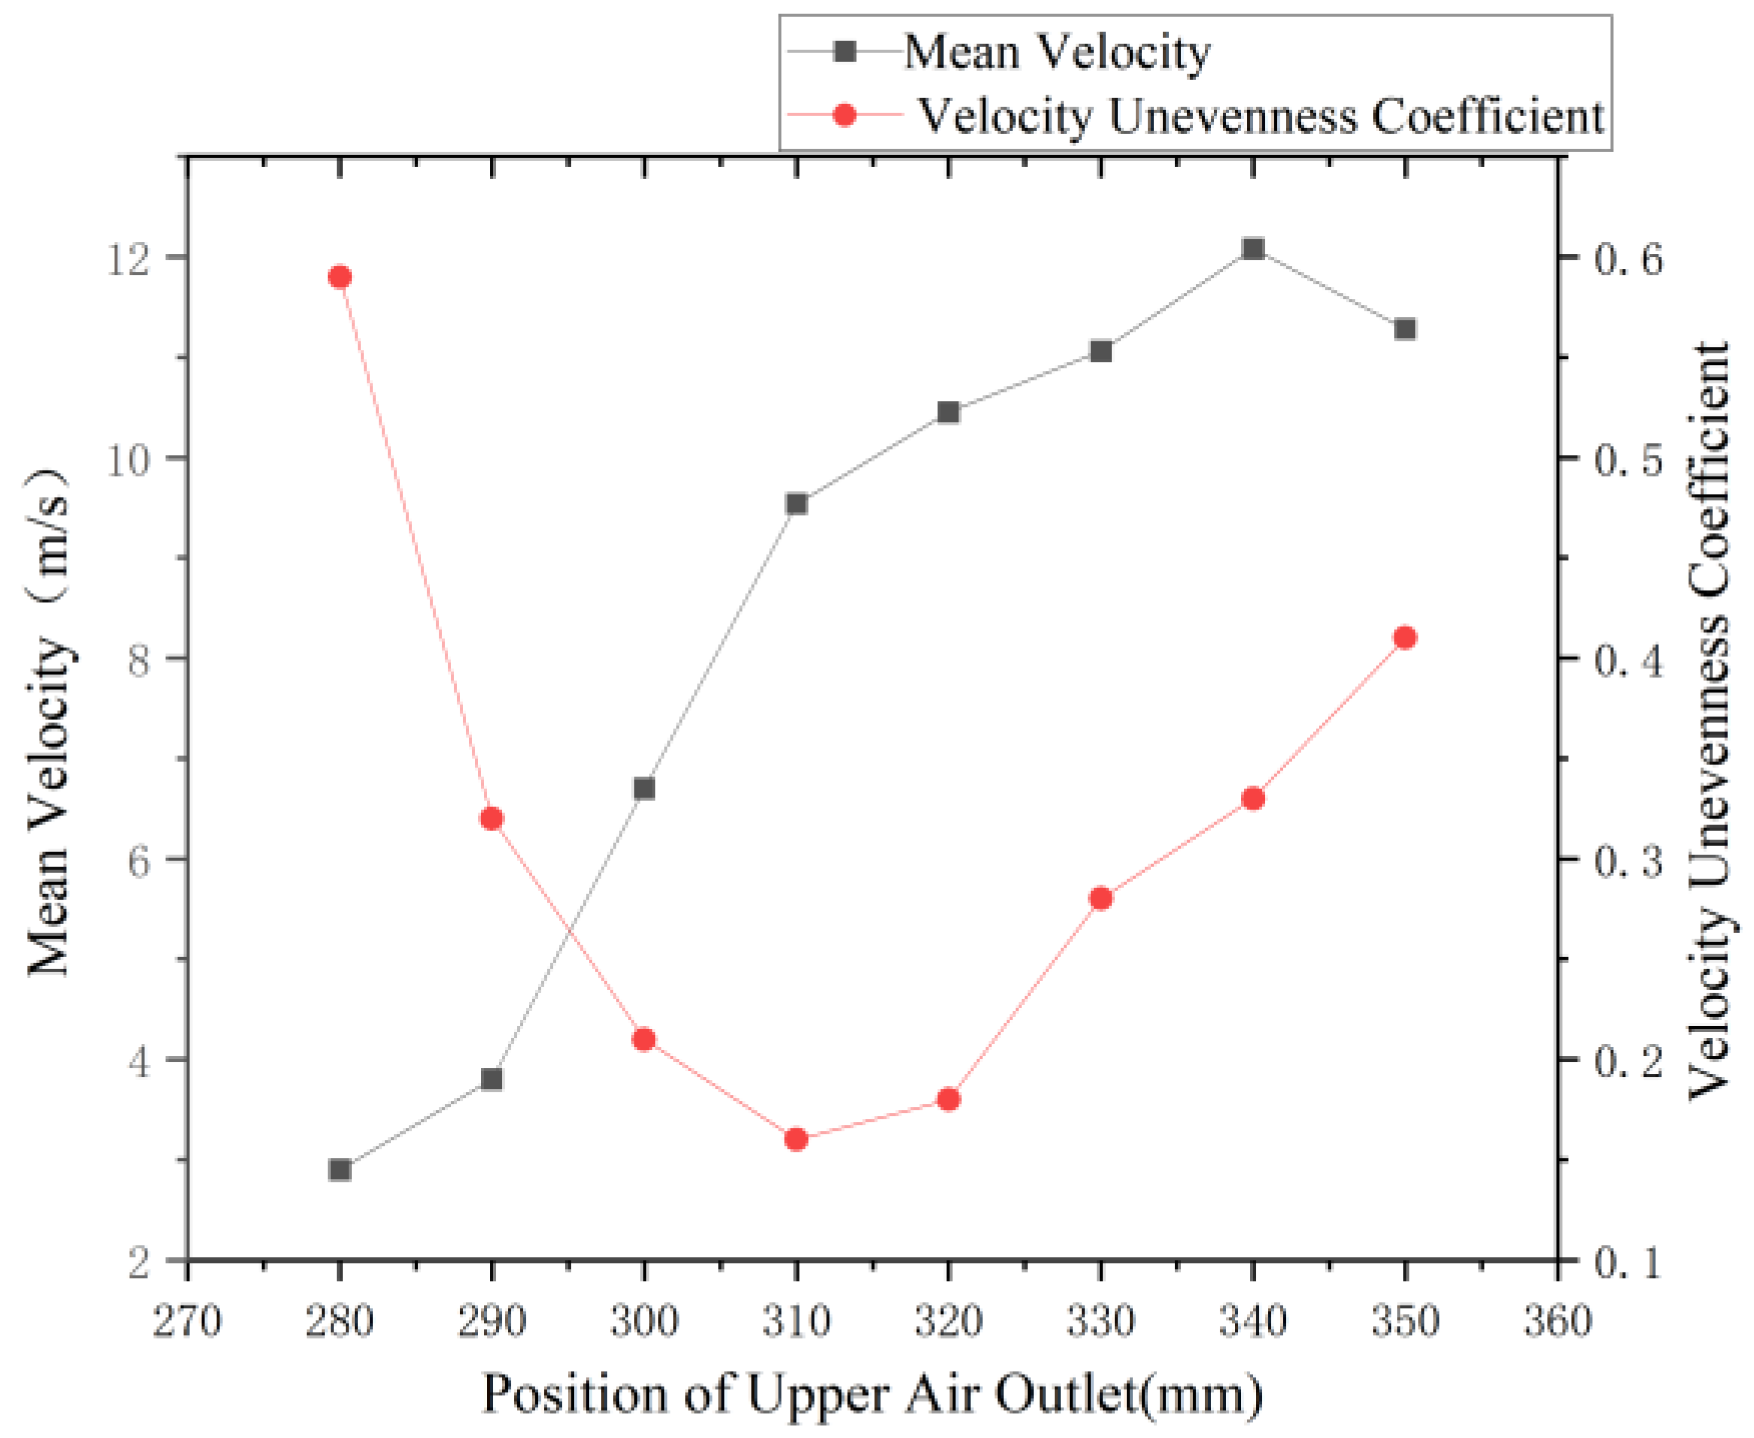
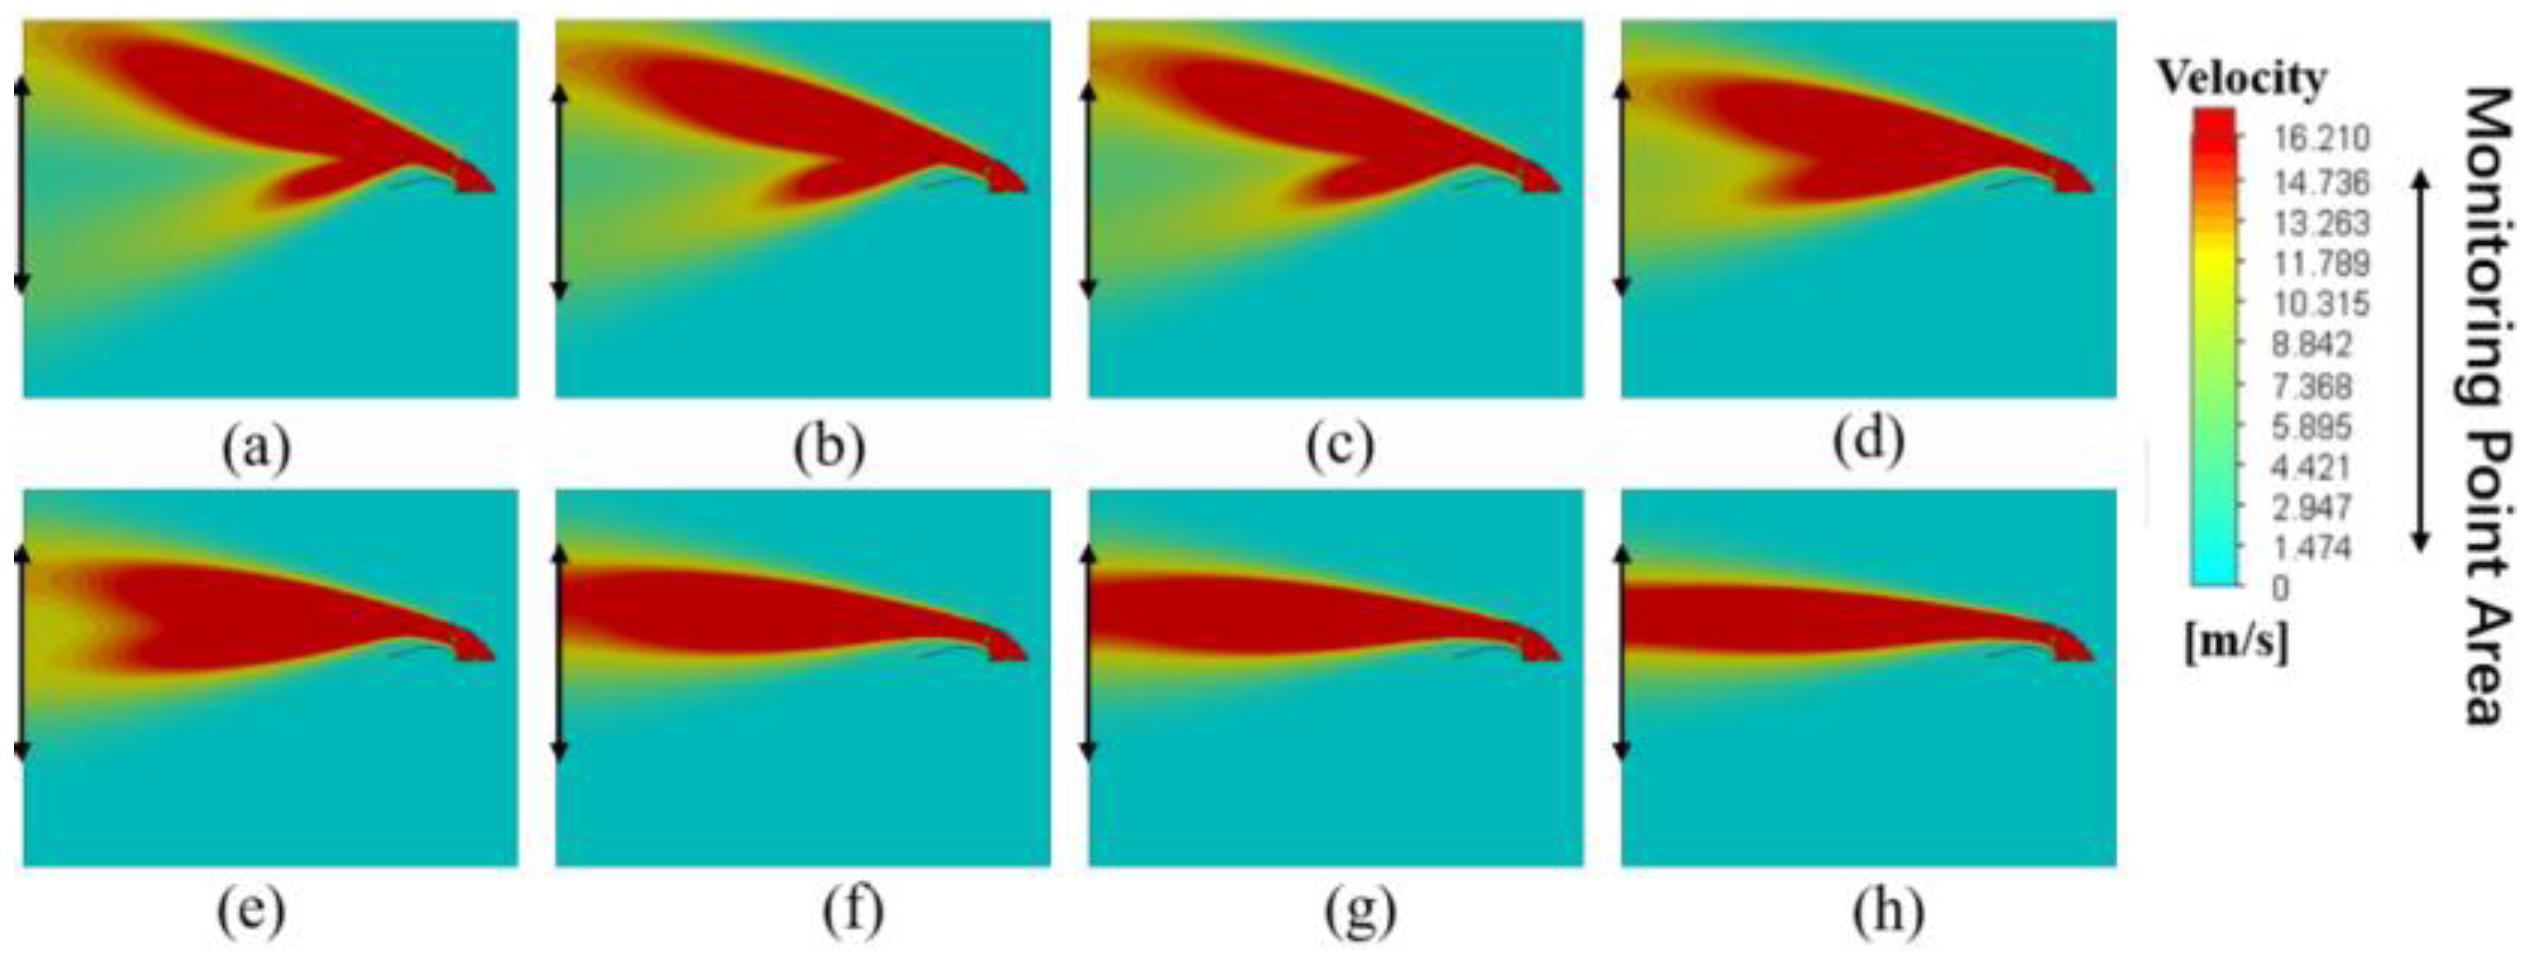
Under the conditions of an upper edge inclination angle of 79°, a lower edge inclination angle of 75°, a length of 215 mm, and a width of 200 mm, a single-factor experiment was conducted with the upper air outlet positions set to 280, 290, 300, 310, 320, 330, 340, and 350 mm. Analysis of Figure 9 shows that the mean velocity ranges from 2.9 to 12.08 m/s, and the velocity unevenness coefficient ranges from 0.16 to 0.59. The mean velocity shows an overall upward trend. The mean velocity at positions 280–300 mm are below the target velocity of the airflow, while positions 340–350 mm are above the target velocity, so that good operation effect was limited to the 300–330 mm range. The 300–330 mm range is also where the velocity unevenness coefficient is minimal. The velocity cloud diagrams of the external flow field under different upper air outlet positions are shown in Figure 10. When the upper air outlet position is in the range of 300–330 mm, the airflow provides good coverage of the monitoring point area, so the best positions for the upper outlet are determined to be 300–330 mm.

3.1.4. Influence of Upper Air Outlet Length on Airflow Field

Under the conditions of an upper edge inclination angle of 79°, a lower edge inclination angle of 75°, an air outlet position of 315 mm, and a width of 200 mm, simulations were conducted with the upper air outlet lengths set to 140, 150, 160, 170, 180, 190, 200, 210, 220, and 230 mm. The mean velocity and velocity unevenness coefficient obtained are shown in Figure 11. It can be seen from the figure that the mean velocity ranges from 6.72 to 9.56 m/s, and the velocity unevenness coefficient ranges from 0.15 to 0.7. The mean velocity fluctuates gently in the range of 140–190 mm, stabilizing at around 9.5 m/s; after 200 mm, it gradually decreases, with the mean velocity being 8.56 m/s at 210 mm, and all mean velocity values being lower than the target velocity when the length is greater than 210 mm. The velocity unevenness coefficient shows a trend of first decreasing and then increasing in the range of 140–210 mm, all below 0.3, and rises rapidly when the length is greater than 210 mm. The velocity cloud diagrams of the external flow field under different upper air outlet lengths are shown in Figure 12. When the upper air outlet length is in the range of 190–210 mm, the airflow provides good coverage of the monitoring point area. Therefore, the range of the upper air outlet length is determined to be 190–210 mm.

3.1.5. Influence of Upper Air Outlet Width on Airflow Field

Under the conditions of an upper edge inclination angle of 79°, a lower edge inclination angle of 75°, an air outlet position of 315 mm, and a length of 200 mm, a single-factor experiment was conducted with the upper air outlet widths set to 140, 160, 180, 200, 220, and 240 mm to obtain the mean velocity and velocity unevenness coefficient. As shown in Figure 13, the mean velocity ranges from 8.86 to 9.33 m/s, and the velocity unevenness coefficient ranges from 0.17 to 0.48. The mean velocity fluctuates gently, all within the target velocity range or with a small deviation from it. The velocity unevenness coefficient shows a trend of first decreasing and then increasing, and rises rapidly when the upper air outlet width is greater than 210 mm. A comprehensive analysis indicates that the upper air outlet length and width jointly determine the upper air outlet area, thereby affecting the outflow of airflow. The change in upper air outlet width results in a small variation in mean velocity; therefore, it is chosen to fix the upper air outlet width and change the upper air outlet length to adjust the upper air outlet area. As can be seen from Figure 14, when the upper air outlet width is 200 mm, the airflow provides good coverage of the monitoring point area; therefore, the upper air outlet width is fixed at 200 mm.

3.2. Multi-Factor Experiment

3.2.1. Test Results and Analysis of Variance

Based on the single-factor experiments, the upper edge inclination angle, upper air outlet length, and upper air outlet width were selected as the three factors for the multi-factor experiment. To systematically evaluate the impact of each key factor on the airflow velocity and uniformity of the airflow field, a three-factor and three-level orthogonal experiment was designed, with the mean velocity of monitoring points (Y1) and the velocity unevenness coefficient (Y2) chosen as the response values. The coding of experimental factors is shown in Table 2.
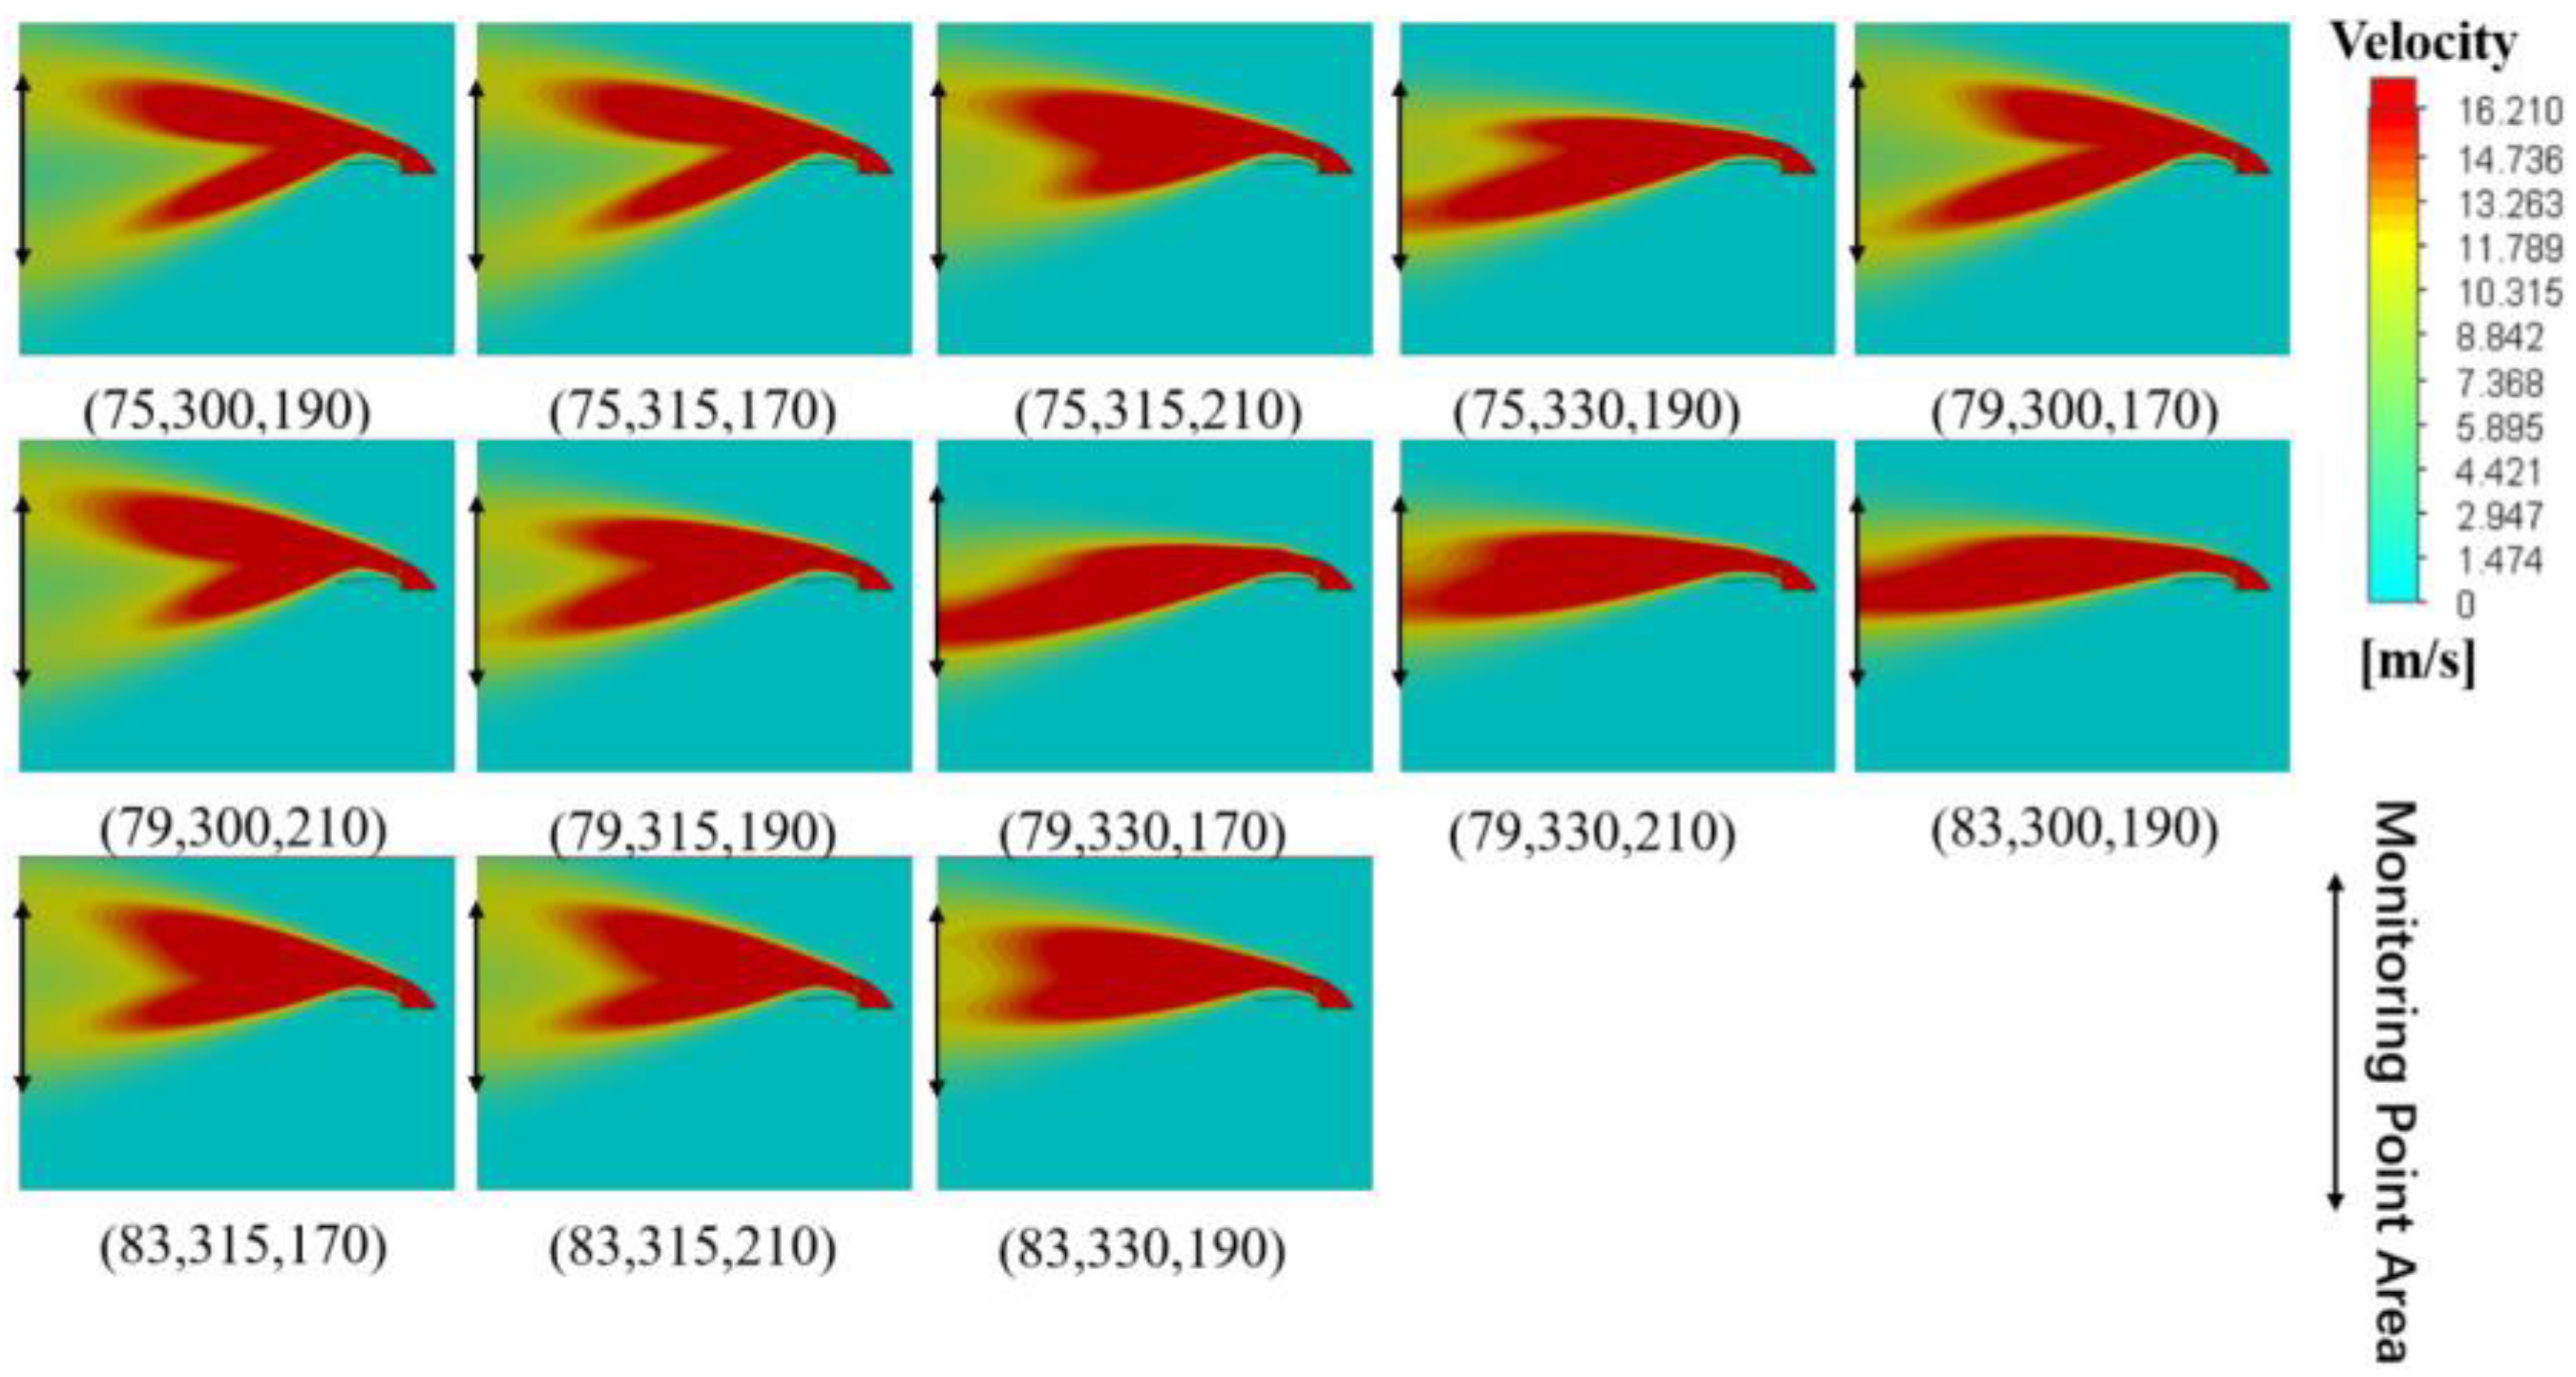
On the basis of single-factor simulation experiments, the response surface analysis experiment was conducted using Design-Expert 13 software. Table 3 presents the experimental schemes and results, while Table 4 and Table 5 are the analysis of variance tables for mean velocity and velocity unevenness coefficient, respectively, where X1, X2, and X3 are the factor coding values. Figure 15 shows the velocity cloud diagram. Regression fitting was performed on the upper edge inclination angle, upper air outlet position, and upper air outlet length, and the quadratic polynomial regression fitting models for the mean velocity Y1 and the velocity unevenness coefficient Y2 were obtained as follows:
Y 1 = 10.12 + 0.1013 X 1 + 1.21 X 2 0.0975 X 3 0.42 X 1 X 2 0.4925 X 1 X 3 + 0.0525 X 2 X 3 0.2070 X 1 2 0.767 X 2 2 + 0.1355 X 3 2
Y 2 = 0.1 + 0.035 X 1 + 0.055 X 2 0.0075 X 3 + 0.09 X 1 X 2 + 0.035 X 1 X 3 0.02 X 3 + 0.085 X 1 2 + 0.095 X 2 2 + 0.08 X 3 2
For the analysis of variance on the mean velocity, as shown in Table 4, the model’s p < 0.0001, indicating that the regression equation is extremely significant and can describe the relationship between each factor and the response value; the p-value of the lack-of-fit term is greater than 0.05, meaning the lack-of-fit term is not significant, which suggests there are no factors causing lack of fit and the error is small; the fitting statistic R2 = 0.9804, indicating that the experimental error is small and the model fitting degree is high. X2, X1X2, X1X3, and X22 have extremely significant effects. The order of influence of each factor on the mean velocity is upper air outlet position > upper edge inclination angle > upper air outlet length.
For the analysis of variance on the velocity unevenness coefficient, as shown in Table 5, the model’s p < 0.0001, indicating that the regression equation is extremely significant and can describe the relationship between each factor and the response value; the p-value of the lack-of-fit term is greater than 0.05, meaning the lack-of-fit term is not significant, which suggests there are no factors causing lack of fit and the error is small; the fitting statistic R2 = 0.9833, indicating that the experimental error is small and the model fitting degree is high. X1, X2, X1X2, X12, X22, and X32 have extremely significant effects, and X1X3 has a significant effect. The order of influence of each factor on the velocity unevenness coefficient is upper air outlet position > upper edge inclination angle > upper air outlet length.

3.2.2. Influence of Interaction Between Experimental Factors on Velocity Unevenness Coefficient

The influence of factor interaction on the velocity unevenness coefficient is shown in Figure 16. It can be seen from the figure that when the upper air outlet position is constant, the velocity unevenness coefficient first decreases and then increases with the increase in the upper edge inclination angle; when the upper edge inclination angle is constant, the velocity unevenness coefficient first decreases and then increases as the upper air outlet position increases. As can be seen from the figure, when the upper air outlet position is fixed, the velocity unevenness coefficient first decreases and then increases with the increase in the upper edge inclination angle; when the upper edge inclination angle is fixed, the velocity unevenness coefficient first decreases and then increases as the upper air outlet position increases; as shown in the figure, when the upper air outlet position is constant, the velocity unevenness coefficient first decreases and then increases with the increase in the upper air outlet length; when the air outlet length is fixed, the velocity unevenness coefficient first decreases and then increases as the upper air outlet position increases.

3.3. Optimization of Air Outlet Parameters Based on the Itertools Library

The regression equation for the actual values obtained from the response surface experiment is as follows:
Y 1 = 679.221 + 5.44412 A + 2.74793 B + 0.297619 C 0.007 A B 0.00615625 A C + 0.000175 B C 0.0129375 A 2 0.00340889 B 2 + 0.00033875 C 2
Y 2 = 120.5 1.38625 A 0.368167 B 0.0899375 C + 0.0015 A B + 0.0004375 A C 6.66667 e 5 B C + 0.0053125 A 2 + 0.000422222 B 2 + 0.0002 C 2
The itertools library in Python 3.13.7 was used to create the parameter matrix and optimize the two objective functions. Considering both the accuracy of the regression equation and the manufacturing precision, the parameter matrix M was determined as follows:
75 77 79 81 83 300 307 315 327 330 170 180 190 200 210
The optimization objectives are as follows:
8.45 Y 1 ( M ) 10.16 min Y 2 ( M )
The optimization process is shown in Figure 17, and the distribution of all solutions is presented in Figure 18. The optimal solution is as follows: the upper air outlet position angle is 79°, and the upper air outlet width is 200 mm. The optimal solution (indicated by the star in Figure 18) provides a velocity unevenness coefficient of 0.087 and a mean velocity of 9.3 m/s.

4. Experimental Verification and Result Analysis

4.1. Test Materials and Equipment

To verify the structural reliability and droplet penetration of the optimal air supply diversion, a prototype spray machine was fabricated based on the parameters obtained from the simulation. The Dongfanghong ME604 tractor (YTO Group Corporation, Luoyang, China) was used as the power source, the UT363S digital anemometer (UNI-T Technology Instruments, Suzhou, China) was employed to measure airflow velocity, droplets test card (produced by Chongqing Liuliu Shanxia Plant Protection Technology Co., Ltd., Chongqing, China) was used to collect droplet deposition data, and the Image Master Droplet Analysis Software (Version 3.6.1) was utilized for data reading and analysis. External flow field tests and field tests of the sprayer were carried out.

4.2. Verification and Analysis of the Diversion Device Model

Each monitoring point was monitored for 10 s, and each test was repeated three times. The average of these three values was used as the final index. To ensure data accuracy, each group of tests was repeated three times. Figure 19 shows the arrangement of monitoring points: the first monitoring point from top to bottom is point 1, and the last one is point 11. The bar chart in Figure 20 shows the simulated values and the experimental values, with the error between the two being no more than 10% at all monitoring points, so the simulated values can be considered relatively accurate.

4.3. Droplet Deposition Test

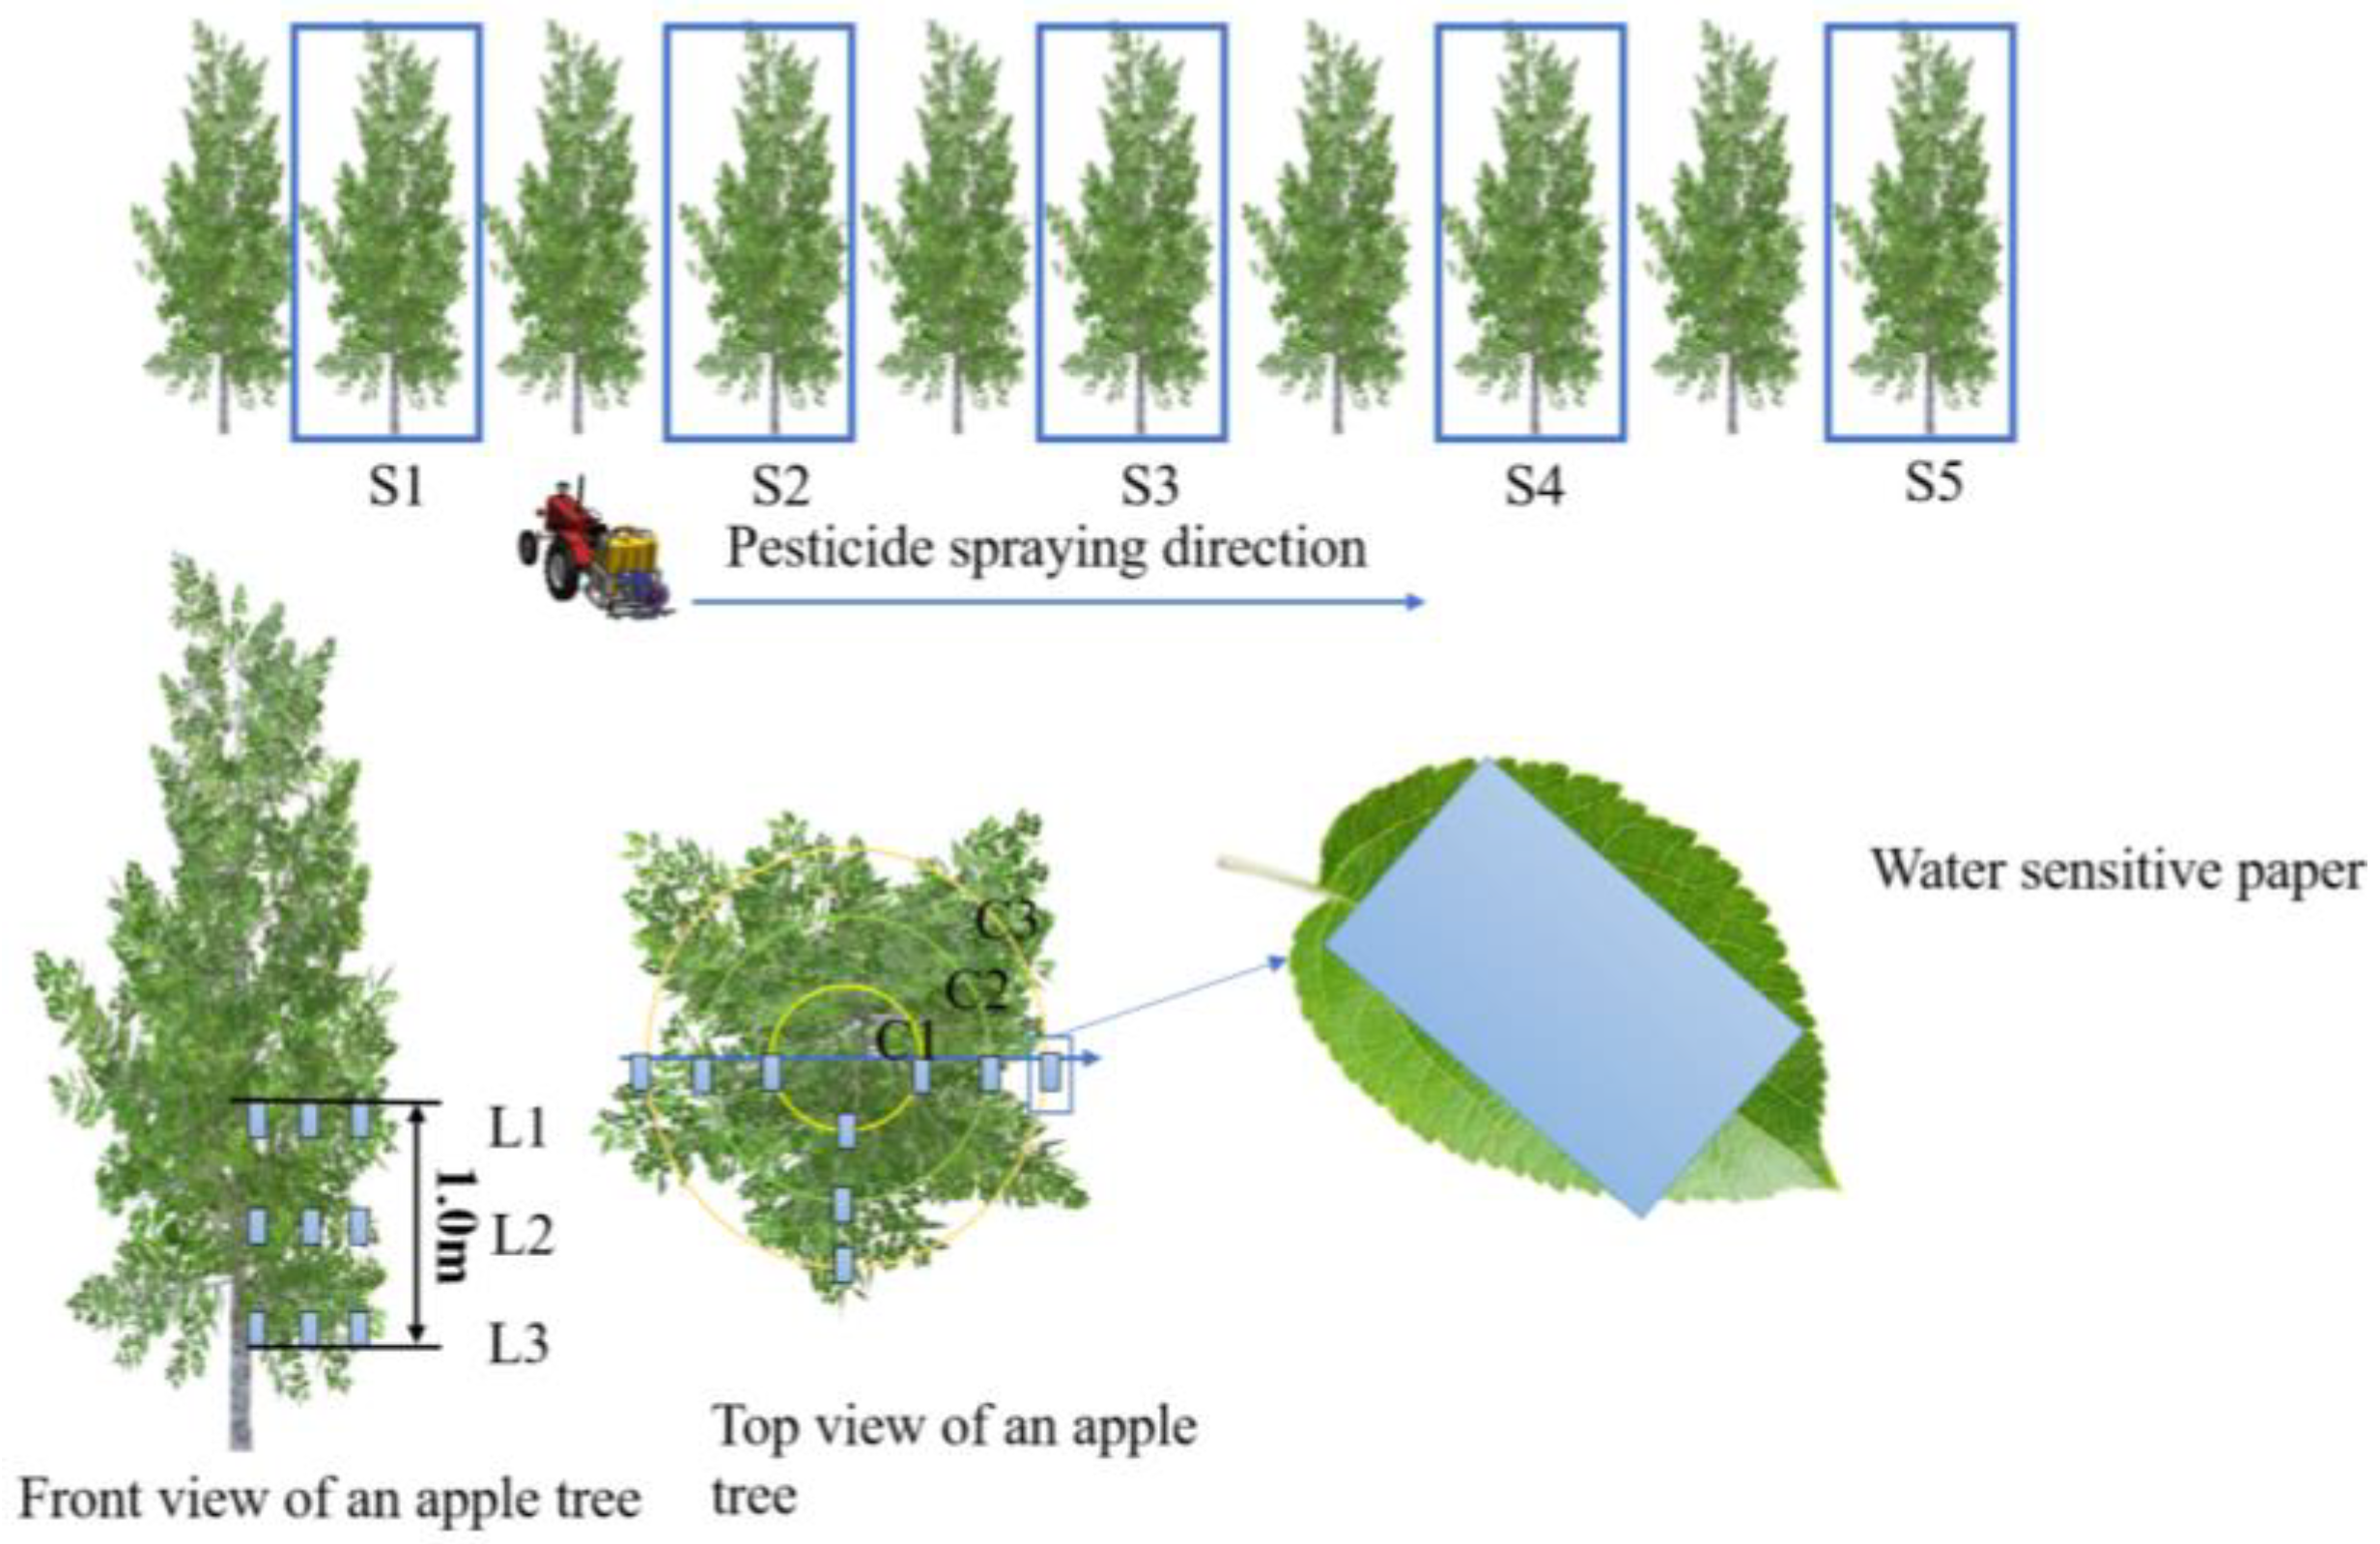
To verify the spraying effect of the pesticide applicator equipped with the flow-guiding device, a field test was conducted on 30 May 2025, at the Baoding Comprehensive Experimental Station of the National Apple Industry Technology System (located in Xiyujiazhuang Village, Pushang Town, Shunping County, Baoding, China). The test subjects were 6-year-old Fuji apple trees. The temperature was 32 °C. The ambient wind is a southerly wind with a speed of 0.32 m/s. The tree height was 3.5 m, the crown width was 1.6 m, and the plant spacing was 2 m × 4 m. Five typical fruit trees on one side of the orchard were selected and marked as S1, S2, S3, S4, and S5, and a total of three groups of parallel tests were carried out. The pesticide application device was equipped with 4 Qiangyu QY65 nozzles, with a spray operation pressure of 1 MPa and a flow rate of 1.2 L/min. The operation speed of the tractor was 1 m/s, which met the requirements of NY/T 650-2013 Quality of Sprayer Operation. The droplets test card was arranged as shown in Figure 21. Water-sensitive papers were arranged on both the abaxial and adaxial surfaces of the leaves. After the test, the droplets test card was collected and processed, the data read, and the mean value and standard deviation of droplet deposition density calculated. The error bars represent the standard deviation. The test site is shown in Figure 22.
(1) Analysis of Droplet Penetration
To explore the droplet penetration effect of the optimized centrifugal air-assisted sprayer during operation, a comparative analysis was conducted on the droplet deposition amount and droplet coverage rate in the inner, middle, and outer parts of the fruit tree canopy. As shown in Figure 23a, the standard deviation of droplet deposition density shows a trend where it is the smallest in the outer canopy, followed by the middle canopy, and the largest in the inner canopy. The reason may be that the leaves in the inner canopy are mostly shielded, resulting in uneven distribution of droplet deposition density in the inner canopy. Additionally, the difference in droplet deposition density between the upper and lower surfaces of the leaves contributes to the large standard deviation. The overall trend of droplet deposition density in the inner, middle, and outer parts of the fruit tree canopy is that the outer canopy is the largest, followed by the middle canopy, and the inner canopy is the smallest. The average deposition density in the inner canopy is 78 droplets/cm2, which is higher than the orchard sprayer operation standard of 70 droplets/cm2 for the inner canopy. The average coverage rate of droplets in the inner canopy is 36.6%, which is higher than the orchard sprayer operation standard of 33%. This indicates that the centrifugal air-assisted sprayer has good droplet penetration and can meet the operation requirements.
(2) Analysis of Uniformity of Vertical Distribution of Droplets
To explore the law of droplet deposition in the vertical direction of the lower canopy of fruit trees, the droplet deposition density and droplet deposition coverage rate in the L1, L2, and L3 layers of fruit trees were compared, as shown in Figure 23b. There is no significant difference in the standard deviation of droplet deposition density among the L1, L2, and L3 layers. The average droplet deposition densities in the L1, L2, and L3 layers are 93.4, 94.6, and 96.2 droplets/cm2, respectively, all of which are higher than the orchard pesticide application standards. The difference in the vertical distribution of droplets is small. The average coverage rates of the L1, L2, and L3 layers are 39.2%, 39.4%, and 40%, respectively, which meet the orchard pesticide application requirements.

5. Discussion

Based on the optimal parameter configuration, this study introduces the design of a flow-guiding device applied to the lower canopy of fruit trees, as well as the construction and testing of the subsequent air supply system. The test results show that the average deposition density in the inner canopy exceeds the industry standard, indicating that the airflow generated by the flow-guiding device has strong penetration capability. In addition, the droplets are uniformly deposited in the vertical direction of the canopy. These results demonstrate that the device effectively meets the technical requirements for applying chemicals to the canopy of high-spindle fruit trees. Compared with existing studies, This sprayer and the centrifugal multi-duct sprayer are at the same level in terms of core indicators such as droplet deposition density. However, through structural improvements, this spray equipment has eliminated the lengthy ducts, reduced air pressure loss, lowered the performance requirements for the centrifugal fan, and thereby cut down costs. This device provides a new method for the application of centrifugal fans in orchard air-assisted spray equipment. It performs very well in terms of droplet penetration and deposition uniformity, which is crucial for improving the efficiency of pesticide application and reducing environmental pollution.
This device achieves good operation results on tall spindle-shaped fruit trees. However, the current device parameters are fixed and cannot be dynamically adjusted according to the changes in canopy morphology during different growth stages of fruit trees. Notably, the canopy height and leaf area index vary significantly across different growth stages, and fixed parameters may lead to fluctuations in pesticide application efficiency. It should be noted that this device only conducts feasibility verification on the air supply and diversion device of the centrifugal air-assisted sprayer, and only single-sided spraying tests have been carried out. In subsequent stages, it will be necessary to install the air supply and diversion device on the other side in a mirrored manner to improve operation efficiency.
In the future, LiDAR can be introduced to collect real-time 3D morphological data of the canopy, and an AI algorithm can be combined to build a dynamic parameter adjustment model to realize real-time matching between “canopy morphology and airflow parameters”. Conducting double-sided spraying tests and comparative tests with other types of air-assisted sprayers to further explore their operation effect and efficiency.

6. Conclusions

(1) A flow-guiding device was designed, and the air outlet parameters of the air duct were optimized. Through analysis with Flow Simulation software, it was determined that the order of influence of air outlet parameters on airflow velocity from largest to smallest is upper air outlet position, upper edge inclination angle, and upper air outlet length. The optimal parameters for the air outlet were determined as follows: upper edge inclination angle of 79°, upper air outlet position of 307 mm, and upper air outlet length of 190 mm.
(2) The airflow velocity test results of the spray device showed that the distribution patterns of the actual values and simulated values at 11 monitoring points were basically consistent, and the relative error of airflow velocity at each monitoring point was less than10%. This proves that the simulation results are reliable, the velocity of the airflow field is uniform, and the structural design of the air duct is reasonable.
(3) Field spray tests showed that the droplet deposition amounts in the inner, middle, and outer parts of the lower canopy of high-spindle fruit trees all exceeded the requirements of national standards, and the vertical distribution uniformity of droplets was good, meeting the pest control requirements for high-spindle fruit trees.

Author Contributions

Conceptualization, S.T. and H.G.; methodology, J.L.; software, S.T. and Z.Z.; validation, S.T., H.G. and J.L.; formal analysis, S.T.; investigation, S.T. and H.G.; resources, J.L.; data curation, S.T. and H.G.; writing—original draft preparation, S.T.; writing—review and editing, S.T., Y.L. and J.L.; visualization, P.W.; supervision, P.W.; project administration, J.L. All authors have read and agreed to the published version of the manuscript.

Funding

This research was supported by the earmarked fund for Hebei Agriculture Research System (HBCT2024150202) and supported by the earmarked fund for CARS-27.

Institutional Review Board Statement

Not applicable.

Data Availability Statement

The data presented in this study are available on request from the corresponding author.

Conflicts of Interest

The authors declare no conflicts of interest.

References

  1. Cheng, J.; Yu, J.; Tan, D.; Wang, Q.; Zhao, Z. Life Cycle Assessment of Apple Production and Consumption under Different Sales Models in China. Sustain. Prod. Consum. 2025, 55, 100–116. [Google Scholar] [CrossRef]
  2. Boualleg, N.J.; Salomon, M.V.; Vilardell, P.; Aramburu, B.; Cabrefiga, J. Control of Apple Scab in Commercial Orchards Through Primary Inoculum Management. Agriculture 2024, 14, 2125. [Google Scholar] [CrossRef]
  3. Li, B.-H.; Zhang, Z.-F.; Xu, X.-M. Developing and Implementing an Integrated Pest/Disease Management in Apple for Smallholder Farms in Yantai, China. Crop Prot. 2024, 182, 106668. [Google Scholar] [CrossRef]
  4. Zheng, Y.J.; Chen, B.T.; Lyu, H.T.; Kang, F.; Jiang, S.J. Research Progress of Orchard Plant Protection Mechanization Technology and Equipment in China. Trans. Chin. Soc. Agric. Eng 2020, 36, 110–124. [Google Scholar]
  5. Zhou, L.; Xue, X.; Zhou, L.; Zhang, L.; Ding, S.; Chang, C.; Zhang, X.; Chen, C. Research Situation and Progress Analysis on Orchard Variable Rate Spraying Technology. Trans. Chin. Soc. Agric. Eng. 2017, 33, 80–92. [Google Scholar]
  6. Liu, T.; Zhang, S.; Sun, T.; Ma, C.; Xue, X. Review of Active Plant Frost Protection Equipment and Technologies: Current Status, Challenges, and Future Prospects. Agronomy 2025, 15, 1164. [Google Scholar] [CrossRef]
  7. Bahlol, H.Y.; Chandel, A.K.; Hoheisel, G.-A.; Khot, L.R. The Smart Spray Analytical System: Developing Understanding of Output Air-Assist and Spray Patterns from Orchard Sprayers. Crop Prot. 2020, 127, 104977. [Google Scholar] [CrossRef]
  8. Jing, S.; Ren, L.; Zhang, Y.; Han, X.; Gao, A.; Liu, B.; Song, Y. A Simulation and Experiment on the Optimization Design of an Air Outlet Structure for an Air-Assisted Sprayer. Agriculture 2023, 13, 2277. [Google Scholar] [CrossRef]
  9. Qiu, W.; Sun, H.; Sun, Y.H.; Liao, Y.Y.; Zhou, L.F.; Wen, Z.J. Design and Test of Circulating Air-Assisted Sprayer for Dwarfed Orchard. Trans. CSAE 2021, 37, 18–25. [Google Scholar]
  10. Endalew, A.M.; Debaer, C.; Rutten, N.; Vercammen, J.; Delele, M.A.; Ramon, H.; Nicolaï, B.M.; Verboven, P. A New Integrated CFD Modelling Approach towards Air-Assisted Orchard Spraying. Part I. Model Development and Effect of Wind Speed and Direction on Sprayer Airflow. Comput. Electron. Agric. 2010, 71, 128–136. [Google Scholar] [CrossRef]
  11. Hong, S.-W.; Zhao, L.; Zhu, H. CFD Simulation of Airflow inside Tree Canopies Discharged from Air-Assisted Sprayers. Comput. Electron. Agric. 2018, 149, 121–132. [Google Scholar] [CrossRef]
  12. Badules, J.; Vidal, M.; Boné, A.; Llop, J.; Salcedo, R.; Gil, E.; García-Ramos, F.J. Comparative Study of CFD Models of the Air Flow Produced by an Air-Assisted Sprayer Adapted to the Crop Geometry. Comput. Electron. Agric. 2018, 149, 166–174. [Google Scholar] [CrossRef]
  13. Yanxiang, P.; Hua, Z.; Guicheng, H.E. Prediction of Spray Droplet Size Distribution Based on Maximum Entropy. Nongye Jixie Xuebao/Trans. Chin. Soc. Agric. Mach. 2023, 54. [Google Scholar] [CrossRef]
  14. Ding, S.; Xue, X.; Dong, X.; Gu, W.; Zhou, Q.Q. Effects of Spraying Parameters on Droplet Deposition Performance. Trans. Chin. Soc. Agric. Mach. 2020, 5, 308–315. [Google Scholar]
  15. Li, J.P.; Li, S.B.; Yu, S.M.; Wang, P.; Yang, X.; Liu, H. Deposition Characteristics of Umbrella Wind Field Type Anti-Drift Spray Device. Trans. Chin. Soc. Agric. Mach. 2023, 54, 80–91. [Google Scholar]
  16. Li, T.; Qi, P.; Wang, Z.; Xu, S.; Huang, Z.; Han, L.; He, X. Evaluation of the Effects of Airflow Distribution Patterns on Deposit Coverage and Spray Penetration in Multi-Unit Air-Assisted Sprayer. Agronomy 2022, 12, 944. [Google Scholar] [CrossRef]
  17. Huang, X.; Li, Y.; Chen, L.; Wang, K. CFD-Based Flow Field Characteristics of Air-Assisted Sprayer in Citrus Orchards. Agriculture 2025, 15, 1103. [Google Scholar] [CrossRef]
  18. Khot, L.R.; Ehsani, R.; Albrigo, G.; Larbi, P.A.; Landers, A.; Campoy, J.; Wellington, C. Air-Assisted Sprayer Adapted for Precision Horticulture: Spray Patterns and Deposition Assessments in Small-Sized Citrus Canopies. Biosyst. Eng. 2012, 113, 76–85. [Google Scholar] [CrossRef]
  19. Xu, S.; Feng, Y.; Han, L.; Ran, X.; Zhong, Y.; Jin, Y.; Song, J. Evaluation of the Wind Field and Deposition Effect of a Novel Air-Assisted Strawberry Sprayer. Agriculture 2023, 13, 230. [Google Scholar] [CrossRef]
  20. Lee, I.-B.; Bitog, J.P.P.; Hong, S.-W.; Seo, I.-H.; Kwon, K.-S.; Bartzanas, T.; Kacira, M. The Past, Present and Future of CFD for Agro-Environmental Applications. Comput. Electron. Agric. 2013, 93, 168–183. [Google Scholar] [CrossRef]
  21. Hu, Y.; Chen, Y.; Wei, W.; Hu, Z.; Li, P. Optimization Design of Spray Cooling Fan Based on CFD Simulation and Field Experiment for Horticultural Crops. Agriculture 2021, 11, 566. [Google Scholar] [CrossRef]
  22. Chen, Z.; Zhou, Z.; Wang, S.; Chen, R.; Wang, Y.; Liao, Q.; Yang, J.; Yang, C.; Zhang, Q. Simulation Study on the Spraying Performance of a Sprayer for the Middle and Lower Leaves of Cigar Tobacco Plants Based on CFD-DPM. Comput. Electron. Agric. 2025, 238, 110787. [Google Scholar] [CrossRef]
  23. Li, W.; Wu, B. Computational Fluid Dynamics Investigation of Pesticide Spraying by Agricultural Drones. Comput. Electron. Agric. 2024, 227, 109506. [Google Scholar] [CrossRef]
  24. Cui, H.; Wang, C.; Yu, S.; Xin, Z.; Liu, X.; Yuan, J. Two-Stage CFD Simulation of Droplet Deposition on Deformed Leaves of Cotton Canopy in Air-Assisted Spraying. Comput. Electron. Agric. 2024, 224, 109228. [Google Scholar] [CrossRef]
  25. Lü, X.; Zhang, M.; Chang, Y.; Lei, X.; Yang, Q. Influence of Deflector Angles for Orchard Air-Assisted Sprayer on 3D Airflow Distribution. Trans. Chin. Soc. Agric. Eng. 2017, 33, 81–87. [Google Scholar]
  26. Hong, S.-W.; Zhao, L.; Zhu, H. CFD Simulation of Pesticide Spray from Air-Assisted Sprayers in an Apple Orchard: Tree Deposition and off-Target Losses. Atmos. Environ. 2018, 175, 109–119. [Google Scholar] [CrossRef]
  27. Guo, J.; Wang, P.; Li, X.; Yang, X.; Li, J.; Bian, Y.; Xue, C. Design Optimization and Test of Air Supply System for Multi-Duct Sprayer. Smart Agric. 2022, 4, 75. [Google Scholar]
  28. Zhang, Z.; Wang, D.; Li, J.; Wang, P.; Guo, Y.; Tian, S. Design and Experiment of Dual Flexible Air Duct Spraying Device for Orchards. Agriculture 2025, 15, 1031. [Google Scholar] [CrossRef]
  29. Chen, J.; Song, S.; Sun, D.; Hong, T.; Zhang, L. Test on Airflow Field and Spray Characteristics for Long-Range Air-Blast Sprayer. Trans. Chin. Soc. Agric. Eng. 2017, 33, 72–79. [Google Scholar]
  30. Jiang, H.; Niu, Z.; Liu, L.; Wang, W.; Wang, J.; Mao, J. Design and Experiment of Air Volume Control System of Orchard Multi-Pipe Air Sprayer. Trans. Chin. Soc. Agric. Mach. 2020, 51, 298–307. [Google Scholar]
  31. Qi, F.; Zhao, X.; Shi, Z.; Rong, L.; Zhang, G.; Li, H. Applicability Evaluation of Innovative Simplified Methods of Slatted Floor in Pig Houses—A CFD Study. Comput. Electron. Agric. 2024, 216, 108532. [Google Scholar] [CrossRef]
  32. Li, J.; Li, Z.; Ma, Y.; Cui, H.; Yang, Z.; Lu, H. Effects of Leaf Response Velocity on Spray Deposition with an Air-Assisted Orchard Sprayer. Int. J. Agric. Biol. Eng. 2021, 14, 123–132. [Google Scholar] [CrossRef]
Figure 1. Centrifugal air-assisted sprayer. (a) Overall structure: 1—Centrifugal fan; 2—Flow-guiding device; 3—Nozzle; 4—Water tank; 5—Frame; 6—Diaphragm pump; 7—Gearbox; 8—Belt drive mechanism. (b) Working process.
Agriculture 15 01969 g001
Figure 2. Design purposes of the lower canopy diversion structure: (a) Single-air-duct structure on one side; (b) external flow field distribution of the single-air-duct structure on one side; (c) working scenario of the lower canopy diversion device.
Agriculture 15 01969 g002
Figure 3. The flow-guiding device. (a) Structure of the flow-guiding device: (1) Lateral air outlet; (2) Upper air outlet; (3) Arc-shaped air duct; (4) Air inlet. (b) Flow of air in the flow-guiding device. (c) Optimized parameters of the air outlet.
Agriculture 15 01969 g003
Figure 4. Settings related to airflow field simulation: (a) Calculation domain; (b) mesh division of the air duct; (c) mesh division of the fluid region.
Agriculture 15 01969 g004
Figure 5. Mean velocity and velocity unevenness coefficient of monitoring points under different upper edge inclination angles.
Agriculture 15 01969 g005
Figure 6. Velocity contour maps of the external flow field under different upper edge inclination angles: (a) 73°; (b) 75°; (c) 77°; (d) 79°; (e) 81°; (f) 83°.
Agriculture 15 01969 g006
Figure 7. Mean velocity and velocity unevenness coefficient of monitoring points under different lower edge inclination angles.
Agriculture 15 01969 g007
Figure 8. Velocity contour maps of the external flow field under different lower edge inclination angles: (a) 71°; (b) 75°; (c) 79°; (d) 83°; (e) 87°; (f) 91°; (g) 95°; (h) 99°.
Agriculture 15 01969 g008
Figure 9. Mean velocity and velocity unevenness coefficient of monitoring points at different upper air outlet positions.
Agriculture 15 01969 g009
Figure 10. Velocity contour of the external flow field under different positions of the upper air outlet (a) 280 mm; (b) 290 mm; (c) 300 mm; (d) 310 mm; (e) 320 mm; (f) 330 mm; (g) 340 mm; (h) 350 mm.
Agriculture 15 01969 g010
Figure 11. Mean velocity and velocity unevenness coefficient of monitoring points with different upper air outlet lengths.
Agriculture 15 01969 g011
Figure 12. Velocity contour maps of the external flow field under different upper air outlet lengths: (a) 140 mm; (b) 150 mm; (c) 160 mm; (d) 170 mm; (e) 180 mm; (f) 190 mm; (g) 200 mm; (h) 210 mm; (i) 220 mm; (j) 230 mm.
Agriculture 15 01969 g012
Figure 13. Mean velocity and velocity unevenness coefficient of monitoring points under different upper air outlet widths.
Agriculture 15 01969 g013
Figure 14. Velocity contour maps of the external flow field under different upper air outlet widths: (a) 140 mm; (b) 160 mm; (c) 180 mm; (d) 200 mm; (e) 220 mm; (f) 240 mm.
Agriculture 15 01969 g014
Figure 15. Velocity contour of orthogonal experiment.
Agriculture 15 01969 g015
Figure 16. Response surface plots of velocity unevenness coefficient–factor interaction: (a) response surface of the interaction between upper edge inclination angle and upper air outlet position; (b) response surface of the interaction between upper edge inclination angle and upper air outlet length; (c) response surface of the interaction between upper air outlet position and upper air outlet length.
Agriculture 15 01969 g016
Figure 17. Optimization flow chart.
Agriculture 15 01969 g017
Figure 18. Scatter plot of all solutions.
Agriculture 15 01969 g018
Figure 19. Distribution diagram of airflow velocity measuring points in the external flow field.
Agriculture 15 01969 g019
Figure 20. Comparison diagram of experimental values and simulated values.
Agriculture 15 01969 g020
Figure 21. Diagram of selection of test fruit trees and arrangement of water-sensitive paper.
Agriculture 15 01969 g021
Figure 22. On-site operation and operation effect diagram.
Agriculture 15 01969 g022
Figure 23. Comparison diagram of droplet products: (a) droplet penetration; (b) uniformity of vertical distribution of droplets.
Agriculture 15 01969 g023
Table 1. Main structural parameters of the spray device.
Technical ParametersNumerical Value
Hitching typeSuspended
Power inputPTO
Air volume of centrifugal fan4270 m3/h
Rotation speed of centrifugal fan1450 r/min
Power of centrifugal fan1.5 kW
Overall dimension (length × width × height)1600 × 1400 × 1500 mm
Medicine tank capacity400 L
Diaphragm pump pressure1–4.5 Mpa
Table 2. Factors and levels of outlet parameter optimization test.
CodingFactors
X1, Upper Edge Inclination Angle/°X2, Position of Upper Air Outlet/mmX3, Length of Upper Air Outlet/mm
−175300170
079315190
193330210
Table 3. Experiment and results of air outlet parameter optimization.
Serial NumberFactor Levels Y 1 Y 2
X1X2X3
1−1−107.190.29
21−108.480.18
3−11010.660.20
411010.270.45
5−10−19.580.26
610−110.520.26
7−10110.570.20
81019.540.34
90−1−18.640.21
1001−110.740.38
110−118.140.21
1201110.450.30
1300010.230.12
1400010.150.11
1500010.120.08
160009.980.09
1700010.140.1
Table 4. Analysis of variance for factors affecting mean velocity.
SourceSquare
Sum
Degrees of
Freedom
Mean SquareFp
Model16.3091.8139.81<0.0001
X10.082010.08201.790.2260
X211.69111.69251.18<0.0001
X30.076110.07611.630.2419
X1X20.705610.705615.160.0059
X1X30.970210.970220.850.0059
X2X30.011010.01100.24690.6412
X 1 2 0.180410.18043.880.0986
X 2 2 2.4812.4858.230.0002
X 3 2 0.077310.07731.660.2384
Lack of Fit0.292830.097611.860.0185
Pure error0.032940.0082
Sum16.6216
Table 5. Analysis of variance for velocity unevenness coefficient.
SourceSquare
Sum
Degrees of
Freedom
Mean SquareFp
Model0.179990.020045.86<0.0001
X10.009810.009822.490.0021
X20.024210.024255.540.0001
X30.000510.00051.030.3433
X1X20.032410.032474.36<0.0001
X1X30.004910.004911.250.0122
X2X30.001610.00163.670.0969
X 1 2 0.030410.030469.86<0.0001
X 2 2 0.038010.038087.21<0.0001
X 3 2 0.026910.026961.850.0001
Lack of Fit0.002130.00072.730.1780
Pure error0.001040.0002
Sum0.182916
Disclaimer/Publisher’s Note: The statements, opinions and data contained in all publications are solely those of the individual author(s) and contributor(s) and not of MDPI and/or the editor(s). MDPI and/or the editor(s) disclaim responsibility for any injury to people or property resulting from any ideas, methods, instructions or products referred to in the content.