Article

Microbial Load, Physical–Chemical Characteristics, Ammonia, and GHG Emissions from Fresh Dairy Manure and Digestates According to Different Environmental Temperatures

Department of Veterinary Medicine and Animal Science, Università degli Studi di Milano, Via dell’Università 6, 26900 Lodi, Italy
*
Author to whom correspondence should be addressed.
Agriculture 2025, 15(18), 1931; https://doi.org/10.3390/agriculture15181931
Submission received: 14 July 2025 / Revised: 5 September 2025 / Accepted: 8 September 2025 / Published: 11 September 2025
(This article belongs to the Section Farm Animal Production)

Abstract

This study evaluated chemical and physical parameters, volatile fatty acids (VFAs), pathogens indicators, ammonia, and greenhouse gas (GHG: CO2, CH4, N2O) emissions from fresh and digested dairy manure under controlled laboratory conditions, simulating storage at 18 °C and 28 °C. Manure and digestate samples were collected during summer 2023 from three dairy farms in Northern Italy, all operating similar mono-substrate, mesophilic anaerobic digesters at 42 °C with short hydraulic retention times (HRT) of ~30 days, instead of the longer HRTs commonly used (up to 90 days). Gas emissions were measured using a static chamber method over 40 min sessions, and cumulative GHG losses were converted to CO2 equivalents. Anaerobic digestion significantly increased ammonia emissions (p < 0.001), in comparison with fresh manure samples. Anaerobic digestion affected pH variations, while reducing CH4 and N2O emissions by up to 67% and 50%, respectively. Storage at 28 °C increased total GHG fluxes by 74% for fresh manure and 66% for digestate. Residual methane emissions suggest incomplete digestion, likely due to short HRT and low digestion temperatures. Among pathogens, only clostridia showed significant reduction post-digestion. Overall, anaerobic digestion effectively lowers the global warming potential (GWP) of dairy manure, but higher environmental temperatures exacerbate ammonia and GHG emissions during storage, highlighting the need for optimized post-digestion handling in warm climates.

1. Introduction

In Northern Italy, the Po Valley (Pianura Padana) is one of the most intensively farmed regions, with high concentrations of animal husbandry and associated agricultural practices. The Lombardy Region, which covers a significant portion of the Po Valley, hosts a dense population of livestock within a limited area of 24,000 km2, including mountainous zones where extensive farming predominates [1].
Animal slurry, traditionally considered a resource, when not properly managed can lead to serious environmental issues contributing to soil and water contamination [2]. From an atmospheric perspective, manure and slurry emissions negatively impact air quality through the release of ammonia (NH3) and greenhouse gases (GHGs) at various stages, including livestock housing, storage, and land application.
Ammonia is primarily produced by the microbial decomposition of urea and contributes to soil acidification, nitrogen over-enrichment in ecosystems, and the formation of secondary particulate matter (PM) [3,4,5]. Its main sources include animal housing, manure storage, slurry spreading, and the use of nitrogen fertilizers for agronomic purposes. The magnitude of emissions is closely tied to farm-level management practices [6].
Livestock production is also a substantial source of GHG emissions, both direct and indirect. Direct emissions derive from enteric fermentation, manure decomposition, and on-farm energy use (e.g., heating, machinery). Indirect emissions are linked to the production and transport of feed, additives, and veterinary products [7]. While CO2 emissions are partially offset by plant photosynthesis, methane (CH4) and nitrous oxide (N2O) induce greater climate challenges due to their higher global warming potentials (GWPs)—about 27 and 273 CO2 equivalents (CO2-eq) respectively, over a 100-year horizon [8,9].
CH4 is primarily emitted through enteric fermentation in ruminants and the anaerobic decomposition of manure, depending on the content of volatile solids [10]. N2O is produced through nitrification and denitrification processes under oxygen-limited conditions, particularly during manure storage and following land application [11,12]. These emissions not only contribute to climate change but also represent a loss of valuable nutrients.
According to national data, agriculture is responsible for approximately 94% of total ammonia emissions, 50% of N2O emissions, and 37% of CH4 emissions in Italy [13]. These values underline the environmental burden posed by agro-zootechnical systems and the urgent need for mitigation strategies.
In recent decades, the adoption of Best Available Techniques (BATs) has focused primarily on reducing NH3 emissions from swine and poultry operations. These include structural improvements in buildings [14,15], technological upgrades to manure storage and treatment facilities [16,17], and the adoption of improved management practices [18]. Despite these advances, the increasing levels of GHGs in the atmosphere remain alarming, with CO2, CH4, and N2O concentrations now at their highest levels in at least 800,000 years [8]. Between 2011 and 2020, the Earth’s average surface temperature rose by 1.1 °C compared to the pre-industrial baseline [8].
Moreover, gas emissions have been shown to be climate sensitive. Sutton et al. [19] estimated that global NH3 emissions could increase by up to 42% under a 5 °C warming scenario, potentially neutralizing mitigation efforts. This issue is particularly relevant in the Po Valley, where the combination of high livestock density and unfavorable atmospheric conditions (i.e., stagnant air due to surrounding mountains) leads to persistent ammonia accumulation [20]. Satellite-based mapping has identified over 248 ammonia “hot spots” larger than 50 km in diameter, confirming the region’s chronic exposure to ammonia pollution [21].
In response to the need for sustainable waste management, Lombardy has seen the development of over 400 agricultural biogas plants (approximately 300 MW), representing more than 60% of Italy’s agricultural biogas capacity. Anaerobic digestion (AD) offers a dual benefit: it enables energy recovery and stabilizes manure, potentially reducing environmental risks [6,22]. During AD, biodegradable organic matter is transformed into biogas—mainly composed of CH4 and CO2—through microbial activity in oxygen-free environments. The resulting digestate is rich in ammoniacal nitrogen and is often reused as fertilizer, which has the positive aspect of being a safer product when spread on land, due to the reduction in potentially infectious microorganisms’ content obtained through the anaerobic treatment [18]. However, its emission behavior differs markedly from untreated slurry due to physicochemical changes during digestion [23,24]. Digestate typically shows increased pH and mineral nitrogen content (NH4+ and NH3), which directly influence volatilization potential. Regulatory frameworks, such as the EU Nitrate Directive, categorize digestate as slurry, subjecting it to the same application limits.
Studies have highlighted that environmental conditions, particularly storage temperatures, strongly influence post-digestion emissions [25,26]. With climate change intensifying, and temperatures in the region already showing an upward trend of +1.2 °C since the pre-industrial era [8], understanding how storage temperature affects emissions from both untreated and digested manure becomes increasingly urgent.
Given the expected increase in emissions due to rising temperatures associated with climate change, this study aims to assess how storage temperature influences the emission potential of untreated and digested dairy manure.
To this end, the present study investigated the physicochemical characteristics, microbial indicators, and the emission profiles of ammonia (NH3) and greenhouse gases (GHGs) from both raw manure and digestate samples characterized by limited hydraulic retention times. Emissions were measured under controlled laboratory conditions at two representative environmental temperatures—18 °C and 28 °C—to evaluate their changes during the temperature variations of the warmest days, and to simulate current and future climate scenarios.

2. Materials and Methods

2.1. Locations of Manure Sampling

This study was conducted during the summer of 2023 on three commercial dairy farms located in the Province of Lodi (Northern Italy), in the Po Valley. The three farms reared Friesian Holstein cows (around 150 lactating cows each) and operated mono-substrate, mesophilic anaerobic digesters running at 42 °C with a short hydraulic retention time (HRT) of approximately 30 days. Farms were selected as representative of the small–medium dairy farms category, due to the short HRT associated with the relatively low digestion temperature, which are generally around 90 days and 48 °C, as reported in an internal survey conducted by the authors. In these farms, fresh manure and digestate were usually stored in uncovered tanks before being applied to agricultural fields for corn, soybean, and alfalfa cultivation.
The recent deliberation 2634, 26 June 2024, by Regione Lombardia, requires that farms that produce and store excreted nitrogen between 3000 and 25,000 kg/year are obliged to cover existing storage using techniques able to guarantee an ammonia emission reduction efficiency equal to or greater than 40% by 1 January 2025. The deliberation requests a further emission reduction efficiency equal to or greater than 60% by 31 December 2029
Manure sampling was carried out over the summer months (June–August 2023) to reflect typical high-temperature conditions during storage. For each farm, fresh manure was collected from storage tanks prior to digestion, while digestates were sampled immediately after discharge from the biogas plant.

2.2. Sampling Procedure

Sampling was performed monthly, totaling three campaigns per farm. During each session, the internal temperature of the manure was measured at a depth of 80 cm using a temperature probe (HHWT-SD1-ATC connected to PHH222 pH meter, OMEGA Engineering, Norwalk, CT, USA). Daily environmental temperatures ranged from 30 °C to 35 °C, with average values from 27 °C to 30 °C across the sampling period.
For each matrix (manure and digestate), six sub-samples of 5 L were collected at mid-depth from different points of the tank (central and lateral areas), pooled, and homogenized to obtain a representative composite sample. A composite 7 L sample per matrix per farm was brought to the laboratory for immediate processing. The 7 L volume was subdivided into sub-samples as follows:
  • 2 sub-samples of 1 L: physical–chemical analysis;
  • 2 sub-samples of 500 mL: microbiological analysis;
  • 8 sub-samples of 500 mL: gas emission trials designed to compare manure vs. digestate emissions and to assess the effect of temperature (18 °C and 28 °C) on gas release, with 4 samples per temperature. This allows evaluation of the impact of anaerobic digestion on greenhouse gas emissions and the influence of summer-like storage temperatures.

2.3. Physical–Chemical Analyses

Parameters assessed included total solids (TS), volatile solids (VS), pH, total Kjeldahl nitrogen (TKN), total ammoniacal nitrogen (TAN), C/N ratio, total phosphorus (P), potassium (K), and volatile fatty acids (VFA), including Lactic, Iso butyric, N-butyric, Iso-valeric, Valeric, Acetic, Propionic acid, and Total VFAs.
TAN and TKN were detected in fresh samples. TS, VS, and C were determined by gravimetric methods, after drying the samples 24 h at 40 °C and a further for 24 h at 105 °C, then ground and sieved to 1 mm [27]. P and K were measured by ICP spectrometry (Varian Inc., Palo Alto, CA, USA) trough acid digestion [28]. VFA concentrations were determined using isocratic HPLC [29]. Calibration was performed using certified standards and blanks.

2.4. Microbiological Analysis

Microbial indicators were analyzed to assess hygienic quality and the impact of anaerobic digestion. The following bacterial groups were quantified:
  • Coliforms (Gram-negative facultative anaerobes)
  • Enterococci (Gram-positive facultative anaerobes)
  • Lactobacilli (Gram-positive facultative anaerobes)
  • Clostridia (Gram-positive, spore-forming anaerobes)
A 1 mL aliquot of each sample was diluted in 9 mL of sterile water and serially diluted (10−1 to 10−7). 0.1 mL aliquots were plated in triplicate on selective agars. The composition of the media (in g/L of distilled water) used to enumerate pathogen indicators is reported as follows.
MacConkey Agar was used for coliforms; the composition was 17 g peptone, 3 g of proteose peptone, 10 g lactose monohydrate, 1.5 g of bile salt, 5 g sodium chloride, 0.03 g neutral red, 0.001 g crystal violet, and 13.5 g agar.
Slanetz–Bartley Agar was utilized to isolate enterococci, it was composed of 20 g tryptose, 5 g yeast extract, 2 g glucose, 4 g dipotassium phosphate, 0.4 g sodium azide, 0.1 g of 2, 3, 5 triphenyltetrazolium chloride, and 10 g bacteriological agar.
Rogosa Agar, used for the isolation and enumeration of lactobacilli was composed of 10 g casein peptone, 5 g yeast extract, 20 g glucose, 6 g potassium dihydrogen phosphate, 2 g ammonium citrate, 15 g sodium acetate, 0.575 g magnesium sulfate, 0.034 g ferrous sulfate, 0.12 g manganous sulfate, and 15 g agar.
Iron Sulphite Agar, used to isolate Clostridia, was composed of 15.0 g casein peptone, 10 g yeast extract, 0.5 g sodium sulfite, and 15 g agar. Incubation conditions followed established protocols [6]. Colony counts were expressed as CFU/g wet weight and log10-transformed prior to analysis.

2.5. Gas Emissions Measurement

Gas emissions from manure and digestate were measured using the static chamber method to simulate storage conditions in a controlled laboratory environment. Each 500 mL sample was placed in 2.5 L Pyrex chambers connected via Teflon tubing (0.048 m diameter) to a multi-gas photoacoustic analyzer (INNOVA 1512, Lumasense Tecbnologies, Fort Collins, CO, USA). The analyzer presents a 7% error, its detection limit is 0.1 ppb, and its accuracy is 0.25 ppb. Two temperatures (18 °C and 28 °C) were applied to simulate typical summer storage conditions and to assess the effect of temperature on emissions. A thermostatic bath (Model M828-BA, Colaver, Vimodrone, Italy) was used to maintain the target environmental temperature. Samples were pre-equilibrated in the bath for 5 h before measurements. Each measurement session lasted 40 min, during which gas concentrations were continuously recorded to capture flux dynamics.
The static chamber method relies on air saturation within the chamber. Exhaust air from the analyzer was returned to the chamber to maintain a closed system. The specific flux (F), defined also as emissivity (mg m−2 h−1), was calculated, for the monitored gases for each sample, using the following equation:
F = δC/δt × V/A
where
δC = variation in the concentration of the monitored gas in the time interval (mg m−3)
δt = time interval (h)
V = chamber inner volume (m3)
A = chamber base area (m2), or the emitting area
Only regressions with a determination coefficient (R2) ≥ 0.60 were retained. Cumulative losses were converted to CO2 equivalents (CO2 eq) using 100-year GWP factors, with: CH4 as 27 CO2 eq, and N2O as 273 CO2 eq [8].

2.6. Statistical Analysis

All data were analyzed using SAS 9.4 [30]. Bacterial counts were log10-transformed. Gas emissions were individually analyzed using linear regression (PROC REG) to calculate fluxes.
A two-way ANOVA (PROC GLM) tested the effects of treatment (manure vs. digestate), temperature, farm, and their interactions on emission rates and chemical properties. Correlation analysis (PROC CORR) was conducted to explore associations among physical–chemical parameters and emission data. A significance threshold of p < 0.05 was applied throughout.

3. Results

3.1. Physical–Chemical Composition of Manure and Digestate Samples

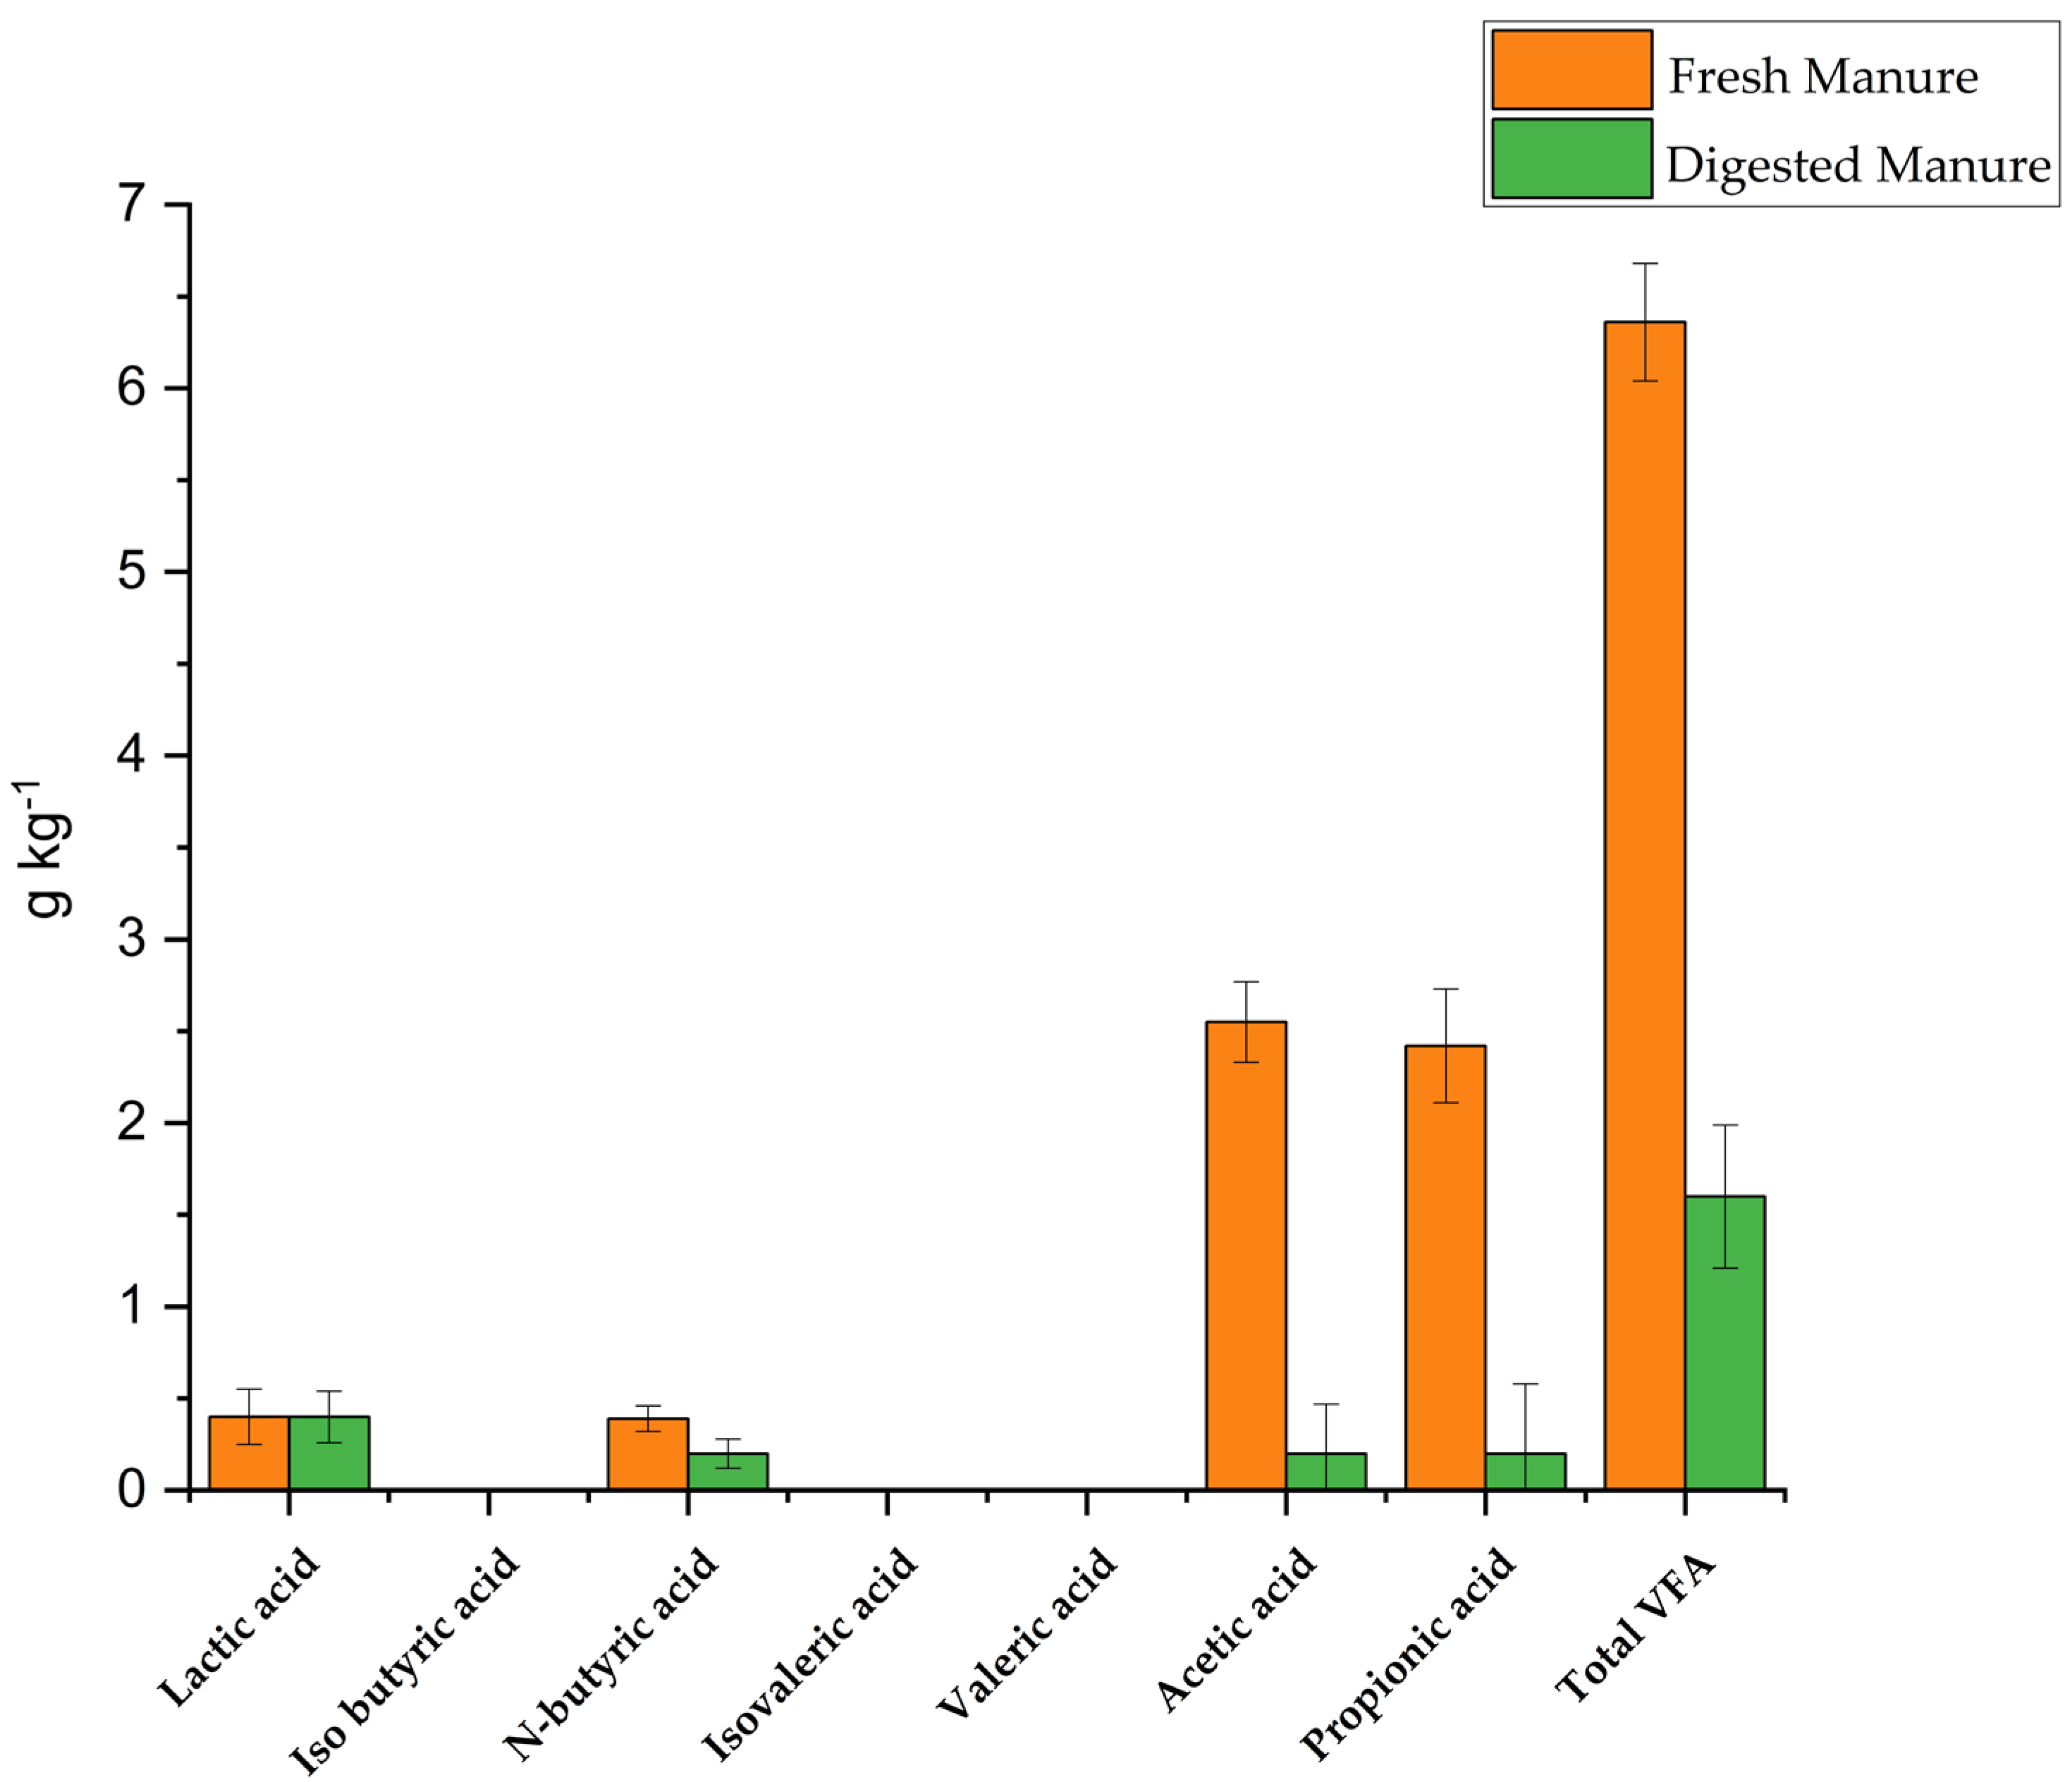
Results related to physical–chemical composition of samples according to the treatment are reported in Table 1 and Figure 1. Table 1 shows the results regarding mean values (LS means ± Standard Error of Means, SEM) of physical–chemical characteristics of the samples.
The day of sampling and farm identity had no significant effects on the physicochemical parameters (p > 0.05); therefore, they were excluded from the model.
Anaerobic digestion significantly altered several parameters in comparison with the values measured in fresh samples, increasing total Kjeldahl nitrogen (TKN, p < 0.001), pH (p < 0.05), and total ammoniacal nitrogen (TAN, p < 0.05), while decreasing volatile solids (VS, p < 0.01). The ratio C/N remained almost unvaried after the anerobic process.
Figure 1 shows the mean values of VFAs (±Standard Error of Means, SEM) measured in the samples. Anaerobic digestion significantly decreased concentrations of acetic acid (p < 0.001), propionic acid (p < 0.01), and total VFA (p < 0.001). Acetic and propionic acids were the main VFA detected after the anaerobic digestion, in general VFA content was reduced by 75%.
Table 1. Chemical and physical properties of manure and digestate samples Values of TKN, TAN, P, K and ashes are measured on fresh matter.
Fresh ManureDigested Manure
TS, g kg−19.2 ± 0.38.25 ± 0.37
VS, %81 ± 1.8 a72 ± 2.2 b
TKN, g kg−13.18 ± 0.09 A3.71 ± 0.11 B
TAN, g kg−11.5 ± 0.1 a1.9 ± 0.1 b
P, g kg−10.57 ± 0.181.15 ± 0.22
K, g kg−12.51 ± 0.122.55 ± 0.14
C/N19.8 ± 0.9517 ± 0.67
pH7.08 ± 0.11 a7.53 ± 0.13 b
Ashes, g kg−11.78 ± 0.192.44 ± 0.23
Values in the same column differ for p < 0.05 (a, b); p < 0.001 (A, B).
Figure 1. Volatile fatty acids, VFAs, measured on fresh matter in cattle manure and digestate samples, including lactic, iso-butyric, n-butyric, isovaleric, valeric, acetic, propionic acids, and total VFA.
Agriculture 15 01931 g001

3.2. Pathogen Indicators

The mean concentrations (±Standard Error of Means, SEM) of coliforms, enterococci, lactobacilli, and clostridia in fresh manure and digestate samples are presented in Figure 2. Among these, only clostridia showed a significant increase in digestate compared to raw manure (p < 0.01), consistent with their ability to survive under anaerobic conditions. No significant treatment effects were observed for the other indicator bacteria, showing the inefficiency of anerobic digestion on reducing the microbial load of samples.

3.3. Ammonia and GHG Emissions

Gas fluxes were calculated using linear regressions from time-series concentration data. Only regressions with R2 > 0.60 were retained in the dataset. The mean values (±standard deviations) of determination coefficients (R2) of gas emission fluxes for each gas at the two temperatures are reported in Table 2.
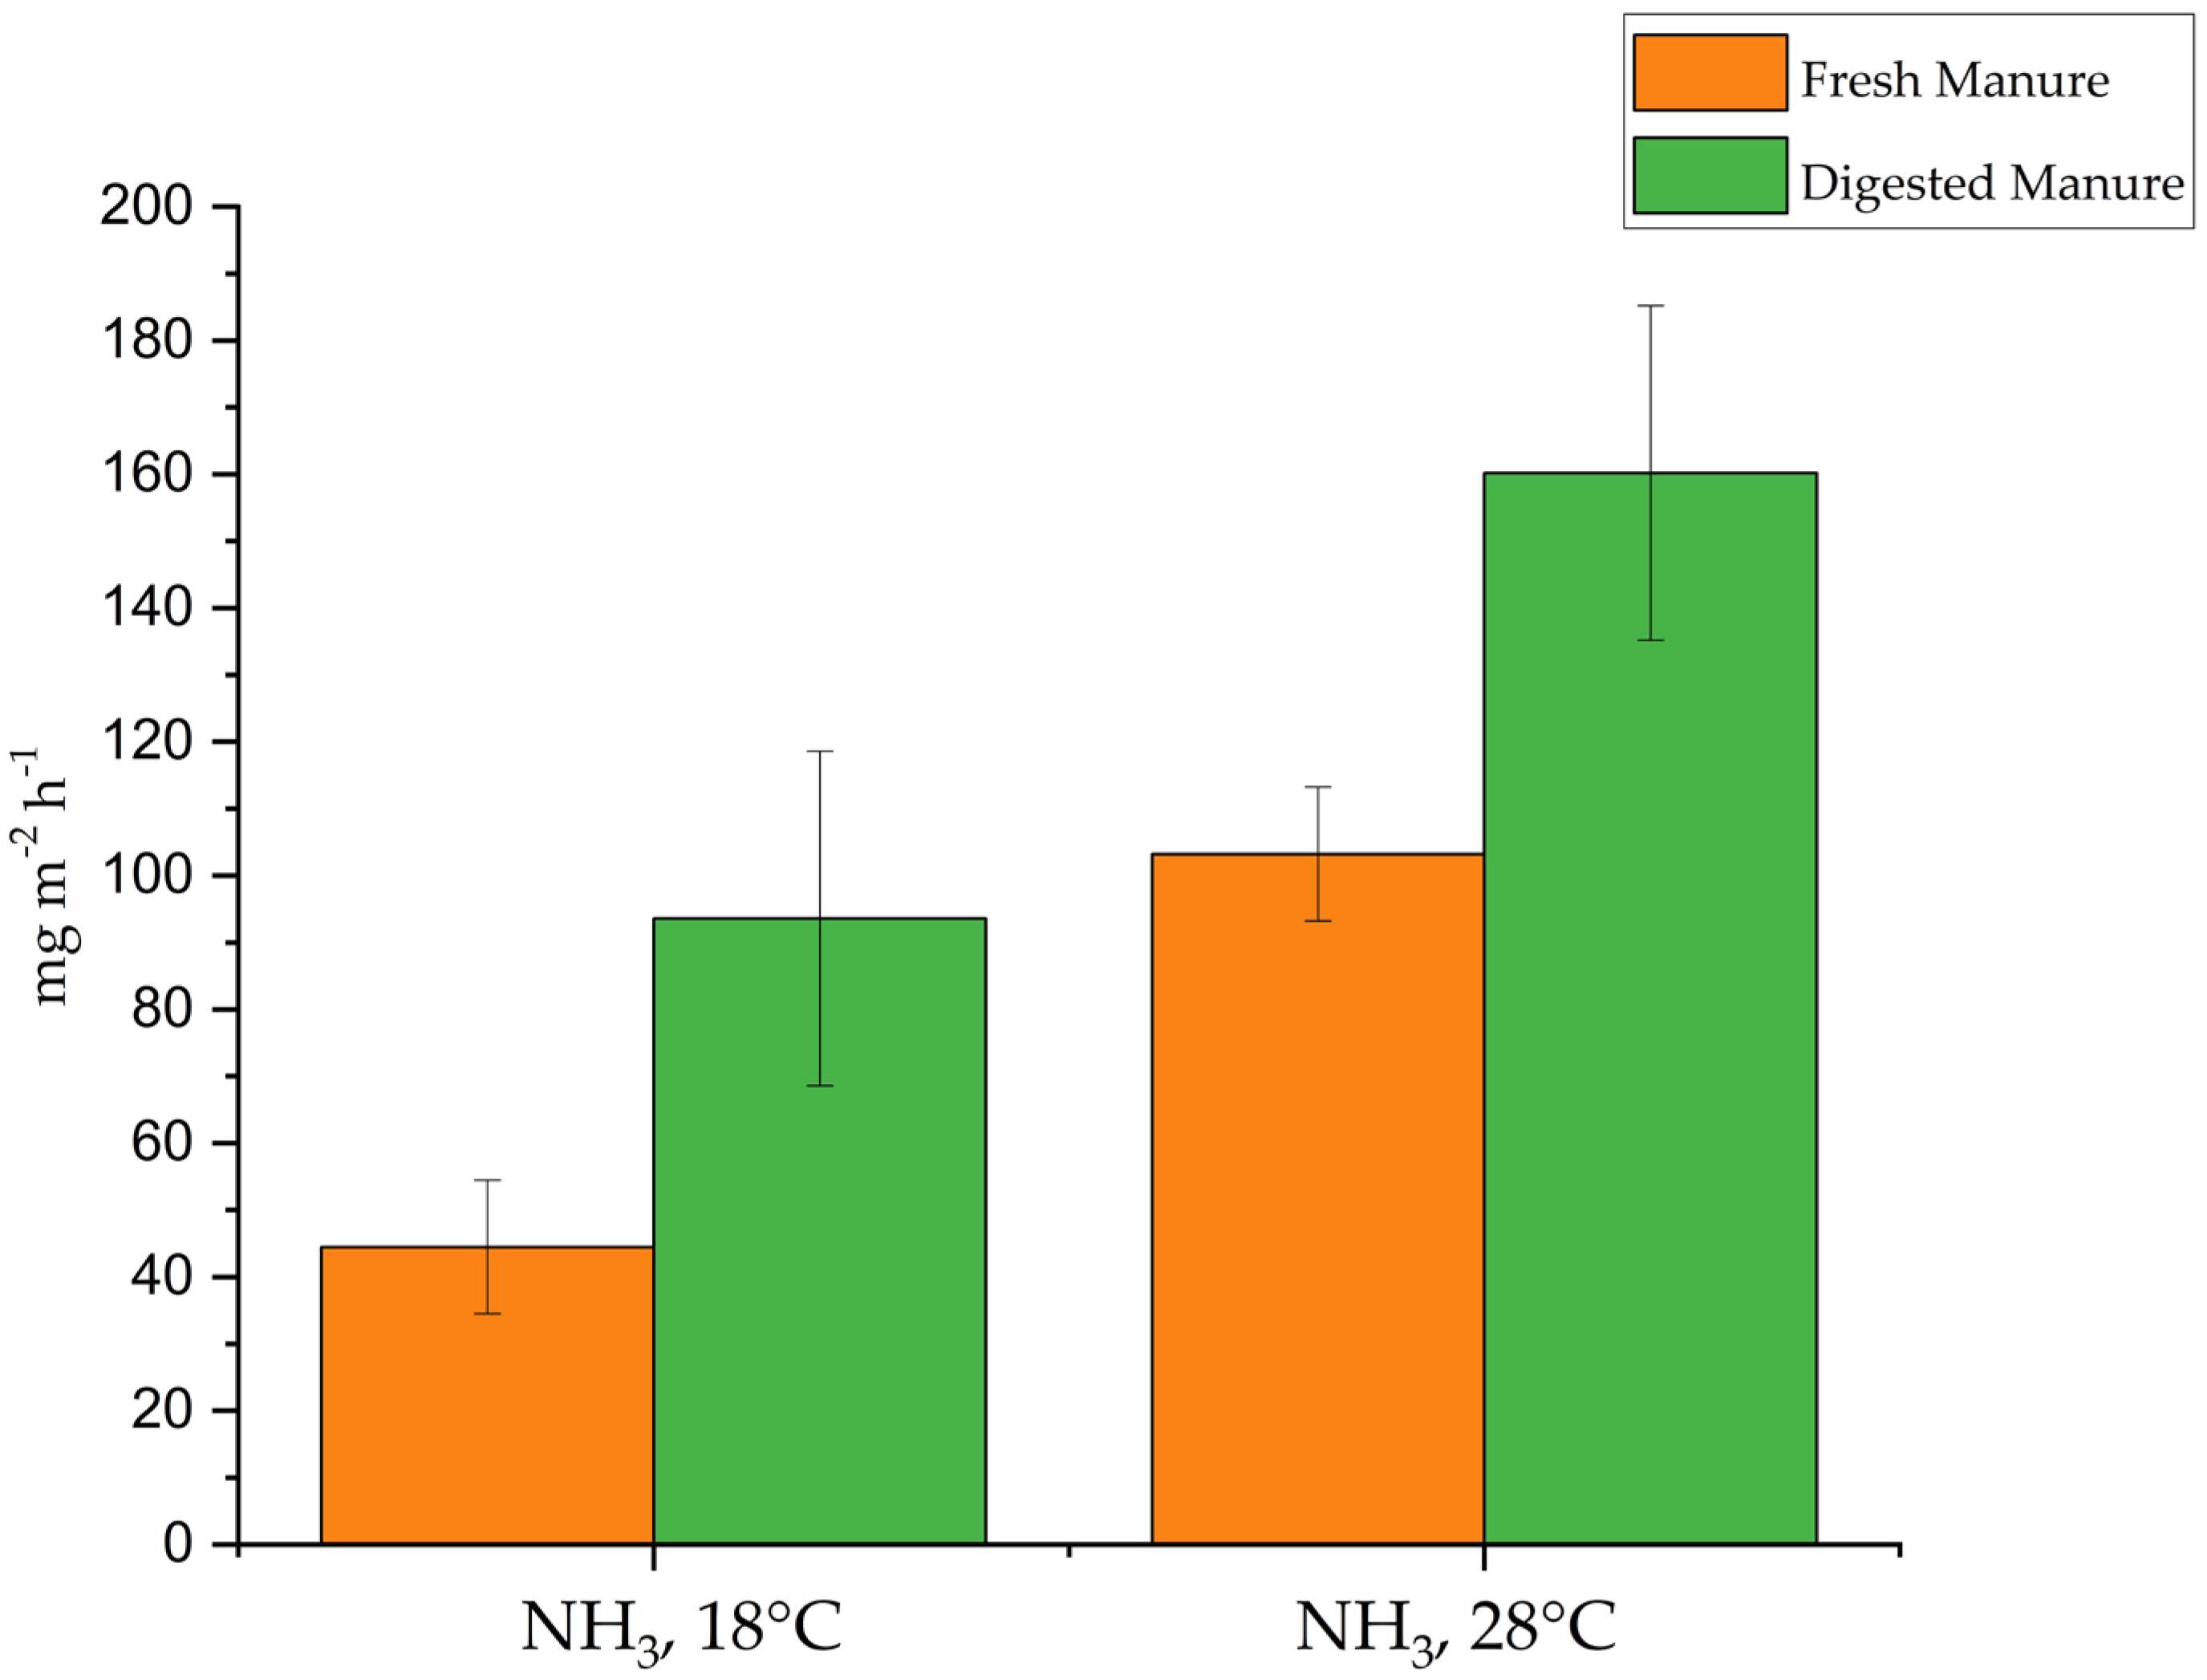
Emission data are presented in Figure 3, Figure 4, Figure 5 and Figure 6 as mean values (±standard error of means, SEM). Anaerobic digestion significantly increased NH3 emissions (see Figure 3, p < 0.05). Fresh manure consistently emitted less NH3 than digestate, but both treatments were strongly affected by 28 °C temperature (p < 0.01).
CO2 emissions (Figure 4) were similar between treatments but significantly increased with temperature (p < 0.01).
Figure 4. Carbon dioxide (CO2) emission fluxes (mg m−2 h−1) measured from cattle manure and digestate at 18 °C and 28 °C using the static chamber method under laboratory conditions.
Agriculture 15 01931 g004
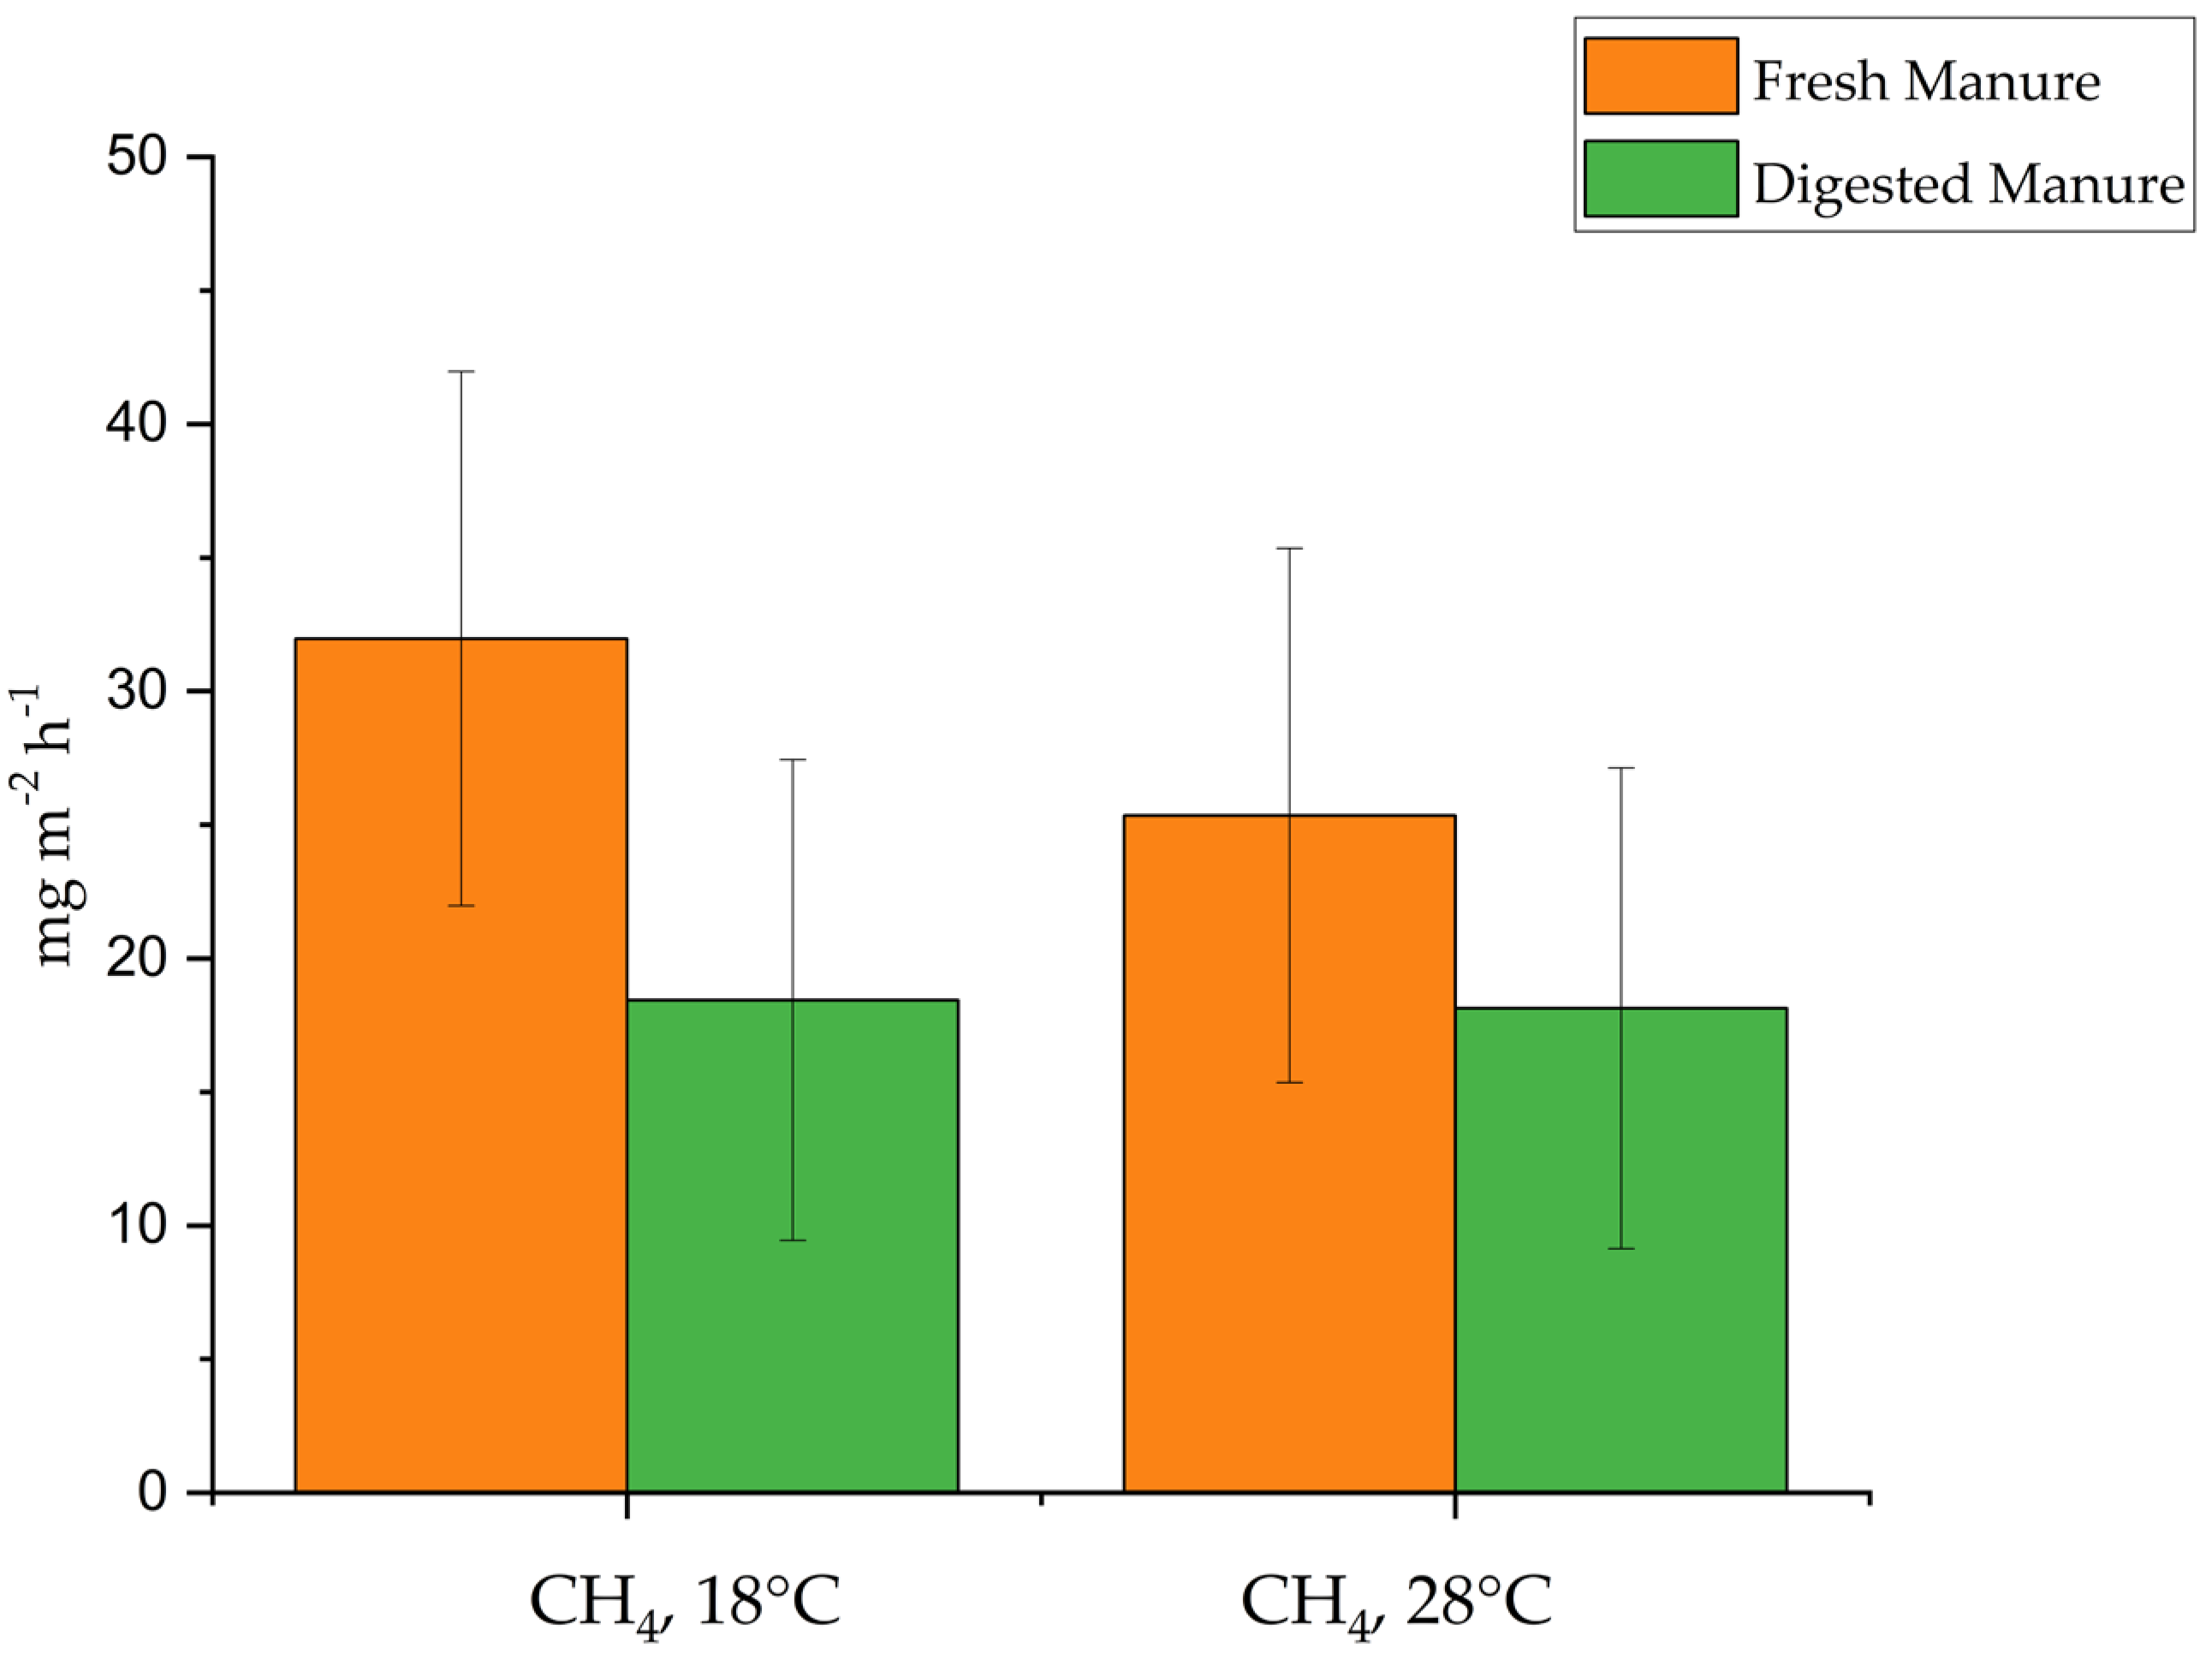
CH4 fluxes (Figure 5) were slightly lower in digestate than in raw manure, as expected, but this difference was not statistically significant. However, all digestate retained residual CH4 production potential.
Figure 5. Methane (CH4) emission fluxes (mg m−2 h−1) measured from cattle manure and digestate at 18 °C and 28 °C using the static chamber method under laboratory conditions.
Agriculture 15 01931 g005
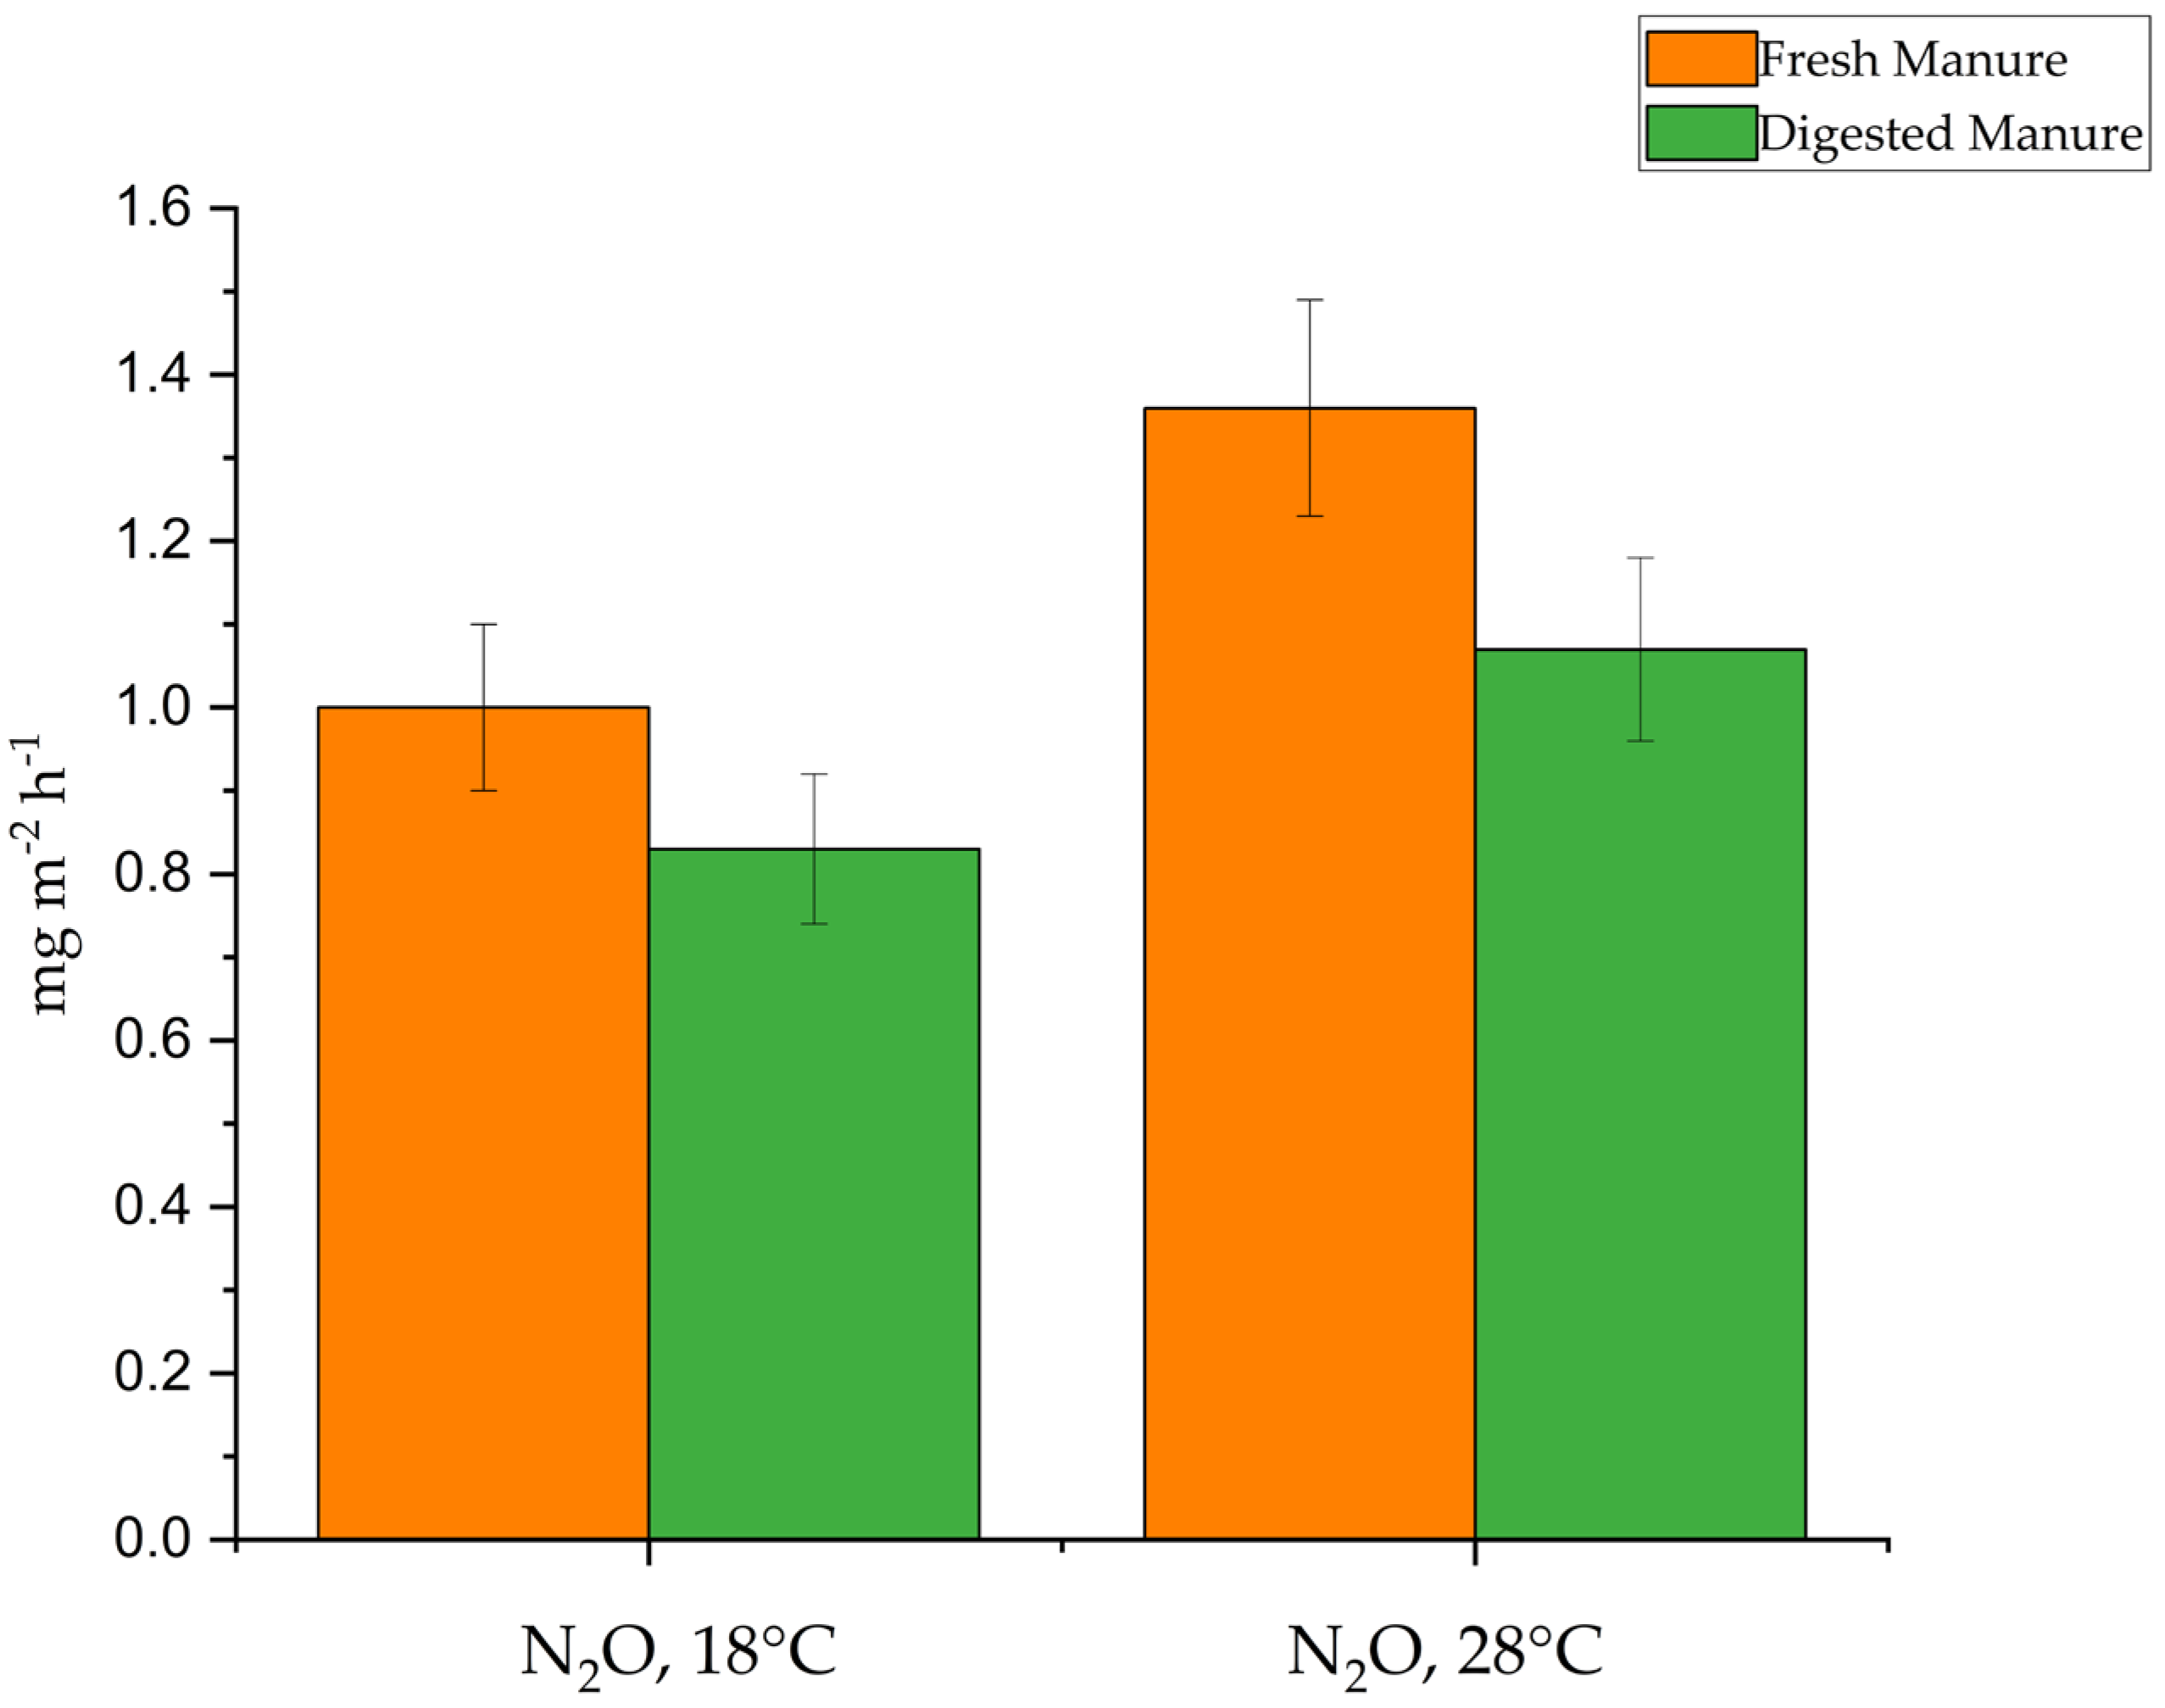
N2O emissions (Figure 6) were generally low but increased at higher temperatures for both manure types. Digestate emitted slightly less N2O than raw manure at both temperatures.
Figure 6. Nitrous oxide (N2O) emission fluxes (mg m−2 h−1) measured from cattle manure and digestate at 18 °C and 28 °C using the static chamber method under laboratory conditions.
Agriculture 15 01931 g006

3.4. GHG Emissions as CO2 Equivalents

NH3 was excluded from CO2 eq calculations, in line with IPCC guidelines, although its indirect N2O contribution is acknowledged. At 28 °C, cumulative emissions of GHG calculated over one-hour incubation, expressed as CO2 eq, were substantially higher for both fresh manure (3614 CO2 eq vs. 2657 CO2 eq) and digestate (2943 CO2 eq vs. 1935 CO2 eq), due to the volatilization induced by temperature and microbial activity.
Digestate samples emitted less CH4 and N2O than untreated manure, reducing total GWP by 50–67%. However, increasing temperature from 18 °C to 28 °C raised overall GHG fluxes by 66–74%.

3.5. Pearson Correlations Among Parameters

Pearson correlation analysis confirmed significant relationships: the anaerobic treatment resulted positively correlated with TKN (r = 0.80, p < 0.01), pH (r = 0.68, p < 0.05), and clostridia (r = 0.76, p < 0.05). Temperature was positively correlated with NH3 flux (r = 0.58, p < 0.01), and NH3 flux was correlated with treatment (r = 0.65, p < 0.01).
The treatment resulted negatively correlated with total VFA (r = −0.96, p < 0.001), in particular way with acetic acid (r = −0.84, p < 0.01). Clostridia concentration resulted negatively correlated with total VFAs content (r = −0.85, p < 0.001). Enterobacteriaceae were correlated with acetic acid (r = 0.74, p < 0.05). Ammonia emission flux showed a negative correlation with acetic acid content (r = −0.78, p< 0.05).

4. Discussion

The physical–chemical values observed in this study are consistent with the literature for dairy manure and digestate [3,25,31,32]. Digestate TS showed a modest decrease (8.25 g/kg), likely due to the short HRT of 30 days. This relatively short hydraulic retention time (HRT) may have limited the complete stabilization of organic matter, as optimal HRT values for mesophilic anaerobic digestion typically range around 90 days, ensuring sufficient time for methanogenic bacteria to fully metabolize volatile solids [33].
The rise in TKN and TAN after anaerobic digestion, along with the increase in pH, indicates the expected mineralization of organic N and urea hydrolysis [34,35,36]. This finding supports the important role of pH in regulating enzymatic activity and microbial growth: methanogenic bacteria are most active within the optimal pH range of 6.8–7.2, whereas lower pH levels can inhibit methanogenesis [37,38].
The reduction in VFAs further confirms the stabilization of organic matter [39], especially acetic and propionic acids, which indicates effective digestion, whereas the persistence of n-butyric acid and residual total VFAs suggests ongoing fermentative potential, producing precursors for CH4 during storage. Indeed, low concentrations of VFAs combined with high biogas production denote process stability, whereas accumulating VFAs may signal a shift from methanogenic to acidogenic processes [40,41].
The relatively modest variation in C/N ratio indicates incomplete organic degradation, aligning with the short HRT compared to the typical 90-day retention times generally used. Maintaining an appropriate C/N ratio (20–30) is crucial for microbial growth and stability; deviations may lead to either insufficient biomass production or ammonia inhibition [42].
Regarding microbiological indicators, only clostridia concentrations varied after digestion, with limited increases. This was expected, given their spore-forming ability and resistance to anaerobic conditions [6,39]. The lack of reduction in coliforms, enterococci, and lactobacilli suggests that the 30-day HRT, combined with the low digestion temperature, may be insufficient for pathogen suppression, as demonstrated in a previous study, which showed significant reduction in aerobic microorganisms after anaerobic digestion conducted at 48 °C for 90 days of HRT [18].
This finding aligns with the well-known temperature dependency of microbial activity: mesophilic conditions (25–45 °C) support a wider microbial community and efficient biogas production, whereas lower temperatures may reduce enzymatic activity and fermentation efficiency [43,44,45,46]. These results may also depend on the limited pH shifts in the samples following the digestion process [6,47,48,49,50].
Importantly, the limited reduction in microbial loads influences emission dynamics. Residual fermentative bacteria can generate precursors for methane formation during storage, explaining observed fluxes. However, elevated NH3 concentrations may suppress certain microbial populations, potentially restricting methanogenic activity, while still contributing to overall NH3 emissions [38].
Elevated TAN and pH in digestate enhanced ammonia volatilization, particularly at 28 °C, consistent with the well-known sensitivity of NH3 release to both chemical equilibrium and microbial ureolysis [24,51,52,53,54]. Although emission fluxes (up to 1.4 kg NH3 m−2 yr−1) are not directly comparable to field studies, due to methodological differences, they still reflect typical responses to pH and temperature. The temperature increase caused a 170–230% rise in NH3 flux, supporting other research findings [19,54,55] and emphasizing the combined influence of physicochemical factors and microbial activity. As noted, temperature control is vital, since even minor fluctuations (recommended ≤0.5 °C) can affect methanogenic efficiency and VFA conversion rates, thereby influencing overall process performance [44].
CH4 emissions were slightly lower in digestate, which may reflect partial degradation of volatile solids. However, residual CH4 emissions indicate incomplete methanogenesis, most likely due to insufficient HRT [56,57]. This highlights the importance of optimizing management practices to reduce fugitive CH4 losses during storage and spreading. Hydraulic retention time and sludge retention time are key design parameters, as they determine the contact time between substrate and methanogens, ultimately influencing methane yield [33].
N2O emissions generally remained low but rose with temperature. Anaerobic digestion often reduces N2O precursors by decreasing nitrate and nitrite levels [55,58], and our results confirm a lower N2O flux from digestate. These findings are consistent with studies that report increased N2O emissions under warm conditions [51,55] and negligible emissions under cooler or covered conditions [59].
The CO2-equivalent analysis confirms that anaerobic digestion can lower the overall GHG footprint of dairy manure under laboratory conditions, mainly by reducing CH4 and N2O emissions. However, the benefit is greatly influenced by storage temperature, highlighting the role of climate in emission patterns [60,61,62]. At 28 °C, total GHG fluxes rose by 66–74% compared with 18 °C, primarily due to increased NH3 and residual CH4 emissions. This demonstrates that microbial survival and physicochemical interactions during storage can negate the climate mitigation advantages of anaerobic digestion. Although these results are from controlled laboratory conditions, the observed trends are likely applicable to dairy operations in warmer climates, such as the Po Valley, offering practical insights into emission reduction strategies.
These findings highlight the importance of considering the entire manure management process. During anaerobic digestion, emissions are usually reduced because of organic matter stabilization and lower availability of N2O precursors. However, during storage, emissions of NH3, residual CH4, and N2O persist, influenced by temperature, pH, and active microbial activity. After application to the soil, there is further contribution to NH3 volatilization and N2O formation. Therefore, assessing the climate mitigation potential of anaerobic digestion requires integrating all stages—digestion, storage, and land application—while taking into account temperature, pH, HRT, and C/N ratios [43,63].
These results have practical implications: anaerobic digestion remains a promising mitigation strategy, but its success depends on integrated management. Extending HRT to more effective durations, applying post-treatments (e.g., covering, as requested), and adopting low-emission spreading techniques (e.g., injection rather than surface application [64] are recommended. Particularly in warm climates such as the Po Valley, failure to address microbial survival and chemical interactions during storage could undermine the sustainability benefits of digestion, emphasizing the importance of holistic manure management throughout all stages of the manure-digestate chain.

5. Conclusions

Anaerobic digestion remains a valuable strategy to reduce the greenhouse gas emissions associated with livestock manure, particularly methane and nitrous oxide. However, this study demonstrates that the environmental benefits of digestion may be partially offset by increasing emissions of ammonia, especially under high ambient temperatures. The digested samples emitted up to 67% less CH4 and 50% less N2O, but with higher NH3 losses, in comparison with fresh manure samples. A 10 °C increase in incubation temperature raised total GHG fluxes by 74% for fresh manure and 66% for digestate, and residual methane emissions were observed, likely due to incomplete digestion associated with the short HRT and moderate digestion temperature. This interpretation is supported by the modest change in C/N ratio and by the non-significant pathogen-indicator reduction, except for the persistence of Clostridia.
To maximize the environmental benefits, management strategies after digestion are essential, including low-emission storage and field application practices. Furthermore, adequate HRT and process temperature are recommended, particularly for their safe use as fertilizer, to enhance methane extraction and minimize residual methane emissions.

Author Contributions

Conceptualization, A.C. and E.B.; methodology, A.C., E.B. and E.I.; validation, A.C., E.B. and E.I.; formal analysis, A.C., E.B. and E.I.; investigation, A.C., E.B. and E.I.; resources, A.C.; data curation, A.C. and E.B.; writing—original draft preparation, A.C.; writing—review and editing, A.C. and E.B.; visualization, A.C. and E.B.; supervision, A.C. All authors have read and agreed to the published version of the manuscript.

Funding

This research received no external funding.

Institutional Review Board Statement

Not applicable.

Data Availability Statement

Data is contained within the article.

Conflicts of Interest

The authors declare that there are no other conflicts of interest.

Abbreviations

The following abbreviations are used in this manuscript:
VFAVolatile fatty acid
GHGGreen House Gases
HRTHydraulic retention time
TSTotal solids
VSVolatile solids
TKNTotal Kjeldahl nitrogen
TANTotal ammoniacal nitrogen
KPotassium
CFUColony Forming Units
CO2 eqCO2 equivalent

References

  1. Regione Lombardia. Lombardy. In the North of Italy, in the Heart of Europe. Available online: https://www.en.regione.lombardia.it/wps/portal/site/en-regione-lombardia/discover-lombardy/territory-and-population (accessed on 10 June 2025).
  2. Clarisse, L.; Clerbaux, C.; Dentener, F.; Hurtmans, D.; Coheur, P.F. Global ammonia distribution derived from infrared satellite observations. Nat. Geosci. 2009, 2, 479–483. [Google Scholar] [CrossRef]
  3. Pain, B. Gaseous pollutants from organic waste use in agriculture. In Proceedings of the Eighth International Conference of the European Cooperative Research Network on Recycling of Agricultural Municipal and Industrial Residuals in Agriculture, Rennes, France, 26–29 May 1998; pp. 233–246. [Google Scholar]
  4. Costa, A.; Domeneghini, C. Pollutants in livestock buildings: Ammonia and dust interplay with the respiratory tract. In Air Quality and Livestock Farming; Banhazi, T., Aland, A., Hartung, J., Eds.; CRC Press: London, UK, 2018; pp. 49–58. ISBN 9781138027039. [Google Scholar]
  5. Renard, J.J.; Calidonna, S.E.; Henley, M.V. Fate of ammonia in the atmosphere—A review for applicability to hazardous releases. J. Hazard. Mater. 2004, 130, 29–60. [Google Scholar] [CrossRef]
  6. Costa, A. Ammonia Concentrations and Emissions from Finishing Pigs Reared in Different Growing Rooms. J. Environ. Qual. 2017, 46, 255–260. [Google Scholar] [CrossRef] [PubMed]
  7. Danev, V.; Atanasova, T.; Dineva, K. Multi-Sensor Platform in Precision Livestock Farming for Air Quality Measurement Based on Open-Source Tools. Appl. Sci. 2024, 14, 8113. [Google Scholar] [CrossRef]
  8. IPCC. Climate Change 2021: The Physical Science Basis. Contribution of Working Group I to the Sixth Assessment Report of the Intergovernmental Panel on Climate Change; Masson-Delmotte, V., Zhai, P., Pirani, A., Connors, S.L., Péan, C., Berger, S., Caud, N., Chen, Y., Goldfarb, L., Gomis, M.I., et al., Eds.; Cambridge University Press: Cambridge, UK; New York, NY, USA, 2021; p. 2391. [Google Scholar] [CrossRef]
  9. Heng, K.; Tan, K.; Chan, A.; Lee, C.C.C. Food Waste Valorization: Leveraging Singapore’s Zero Waste Master Plan and 30-by-30 Goal. Sustainability 2024, 16, 7321. [Google Scholar] [CrossRef]
  10. Milich, L. The role of methane in global warming: Where might mitigation strategies be focused? Glob. Environ. Change 1999, 9, 179–201. [Google Scholar] [CrossRef]
  11. Jalota, S.K.; Vashisht, B.B.; Sharma, S.; Kaur, S. (Eds.) Emission of greenhouse gases and their warming effect. In Understanding Climate Change Impacts on Crop Productivity and Water Balance; Academic Press: Cambridge, MA, USA, 2018; pp. 1–53. [Google Scholar] [CrossRef]
  12. Møller, H.B.; Sørensen, P.; Olesen, J.E.; Petersen, S.O.; Nyord, T.; Sommer, S.G. Agricultural Biogas Production—Climate and Environmental Impacts. Sustainability 2022, 14, 1849. [Google Scholar] [CrossRef]
  13. ISPRA. Italian Emission Inventory 1990–2014. Informative Inventory Report 2016. Available online: https://www.isprambiente.gov.it/ (accessed on 1 July 2025).
  14. Costa, A.; Guarino, M. Particulate Matter Concentration and Emission Factor in Three Different Laying Hen Housing Systems. J. Agric. Eng. 2009, 3, 15–24. [Google Scholar] [CrossRef]
  15. Costa, A.; Ferrari, S.; Guarino, M. Yearly emissions factors of ammonia and particulate matter from three laying hens housing systems. Anim. Prod. Sci. 2012, 52, 1089–1098. [Google Scholar] [CrossRef]
  16. Buoio, E.; Cialini, C.; Cafiso, A.; Aidos, L.; Mazzola, S.M.; Rossi, R.; Livolsi, S.; Di Giancamillo, A.; Moretti, V.M.; Selli, E.; et al. From Photocatalysis to Photo-Electrocatalysis: An Innovative Water Remediation System for Sustainable Fish Farming. Sustainability 2022, 14, 9067. [Google Scholar] [CrossRef]
  17. Buoio, E.; Cialini, C.; Costa, A. Air Quality Assessment in Pig Farming: The Italian Classyfarm. Animals 2023, 13, 2297. [Google Scholar] [CrossRef]
  18. Costa, A.; Gusmara, C.; Gardoni, D.; Zaninelli, M.; Tambone, F.; Sala, V.; Guarino, M. The effect of anaerobic digestion and storage on indicator microorganisms in swine and dairy manure. Environ. Sci. Pollut. Res. 2017, 24, 24135–24146. [Google Scholar] [CrossRef]
  19. Sutton, M.A.; Reis, S.; Riddick, S.N.; Dragosits, U.; Nemitz, E.; Theobald, M.R.; Tang, Y.S.; Braban, C.F.; Vieno, M.; Dore, A.J.; et al. Towards a climate-dependent paradigm of ammonia emission and deposition. Philos. Trans. R. Soc. Lond. B Biol. Sci. 2013, 368, 20130166. [Google Scholar] [CrossRef]
  20. Colombi, C.; D’Angelo, L.; Biffi, B.; Cuccia, E.; Dal Santo, U.; Lanzani, G. Monitoring ammonia concentrations in more than 10 stations in the Po Valley for the period 2007–2022 in relation to the evolution of different sources. Front. Environ. Health 2024, 3, 1249457. [Google Scholar] [CrossRef]
  21. Van Damme, M.; Clarisse, L.; Coheur, P.F. Industrial and agricultural ammonia point sources exposed. Nature 2018, 564, 99–103. [Google Scholar] [CrossRef]
  22. Kreidenweis, U.; Breier, J.; Herrmann, C.; Libra, J.; Prochnow, A. Greenhouse gas emissions from broiler manure treatment options are lowest in well-managed biogas production. J. Clean. Prod. 2021, 280, 124969. [Google Scholar] [CrossRef]
  23. Walsh, J.J.; Jones, D.L.; Edwards-Jone, G.; PrysorWilliams, A. Replacing inorganic fertilizer with anaerobic digestate may maintain agricultural productivity at less environmental cost. J. Plant. Nutr. Soil Sci. 2012, 175, 840–845. [Google Scholar] [CrossRef]
  24. Kuhn, E. Kofermentation; Arbeitspapier 249; Kuratorium für Technik und Bauwesen in der Landwirtschaft (KTBL): Darmstadt, Germany, 1998; ISBN 3-7843-1971-8. [Google Scholar]
  25. Rodhe, L.K.K.; Ascue, J.; Willen, A.; Vegerfors, B. Greenhouse gas emissions from storage and field application of anaerobically digested and non-digested cattle slurry. Agric. Ecosyst. Environ. 2015, 199, 358–368. [Google Scholar] [CrossRef]
  26. Maldaner, L.; Wagner-Riddle, C.; VanderZaag, A.C.; Gordon, R.; Duke, C. Methane emissions from storage of digestate at a dairy manure biogas facility. AFM 2018, 258, 96–107. [Google Scholar] [CrossRef]
  27. APHA. Standard Methods for the Examination of Water and Wastewater, 21st ed.; American Public Health Association/American Water Works Association/Water Environment Federation: Washington, DC, USA, 2005. [Google Scholar]
  28. EPA. Method EPA 3051: Microwave Assisted Acid Digestion of Sediments, Sludges, Soils and Oils; EPA: Washington, DC, USA, 1998. [Google Scholar]
  29. Canale, A.; Valente, M.E.; Ciotti, A. Determination of volatile carboxylic acids (C1–C5i) and lactic acid in aqueous acid extracts of silage by high performance liquid chromatography. J. Sci. Food Agric. 1984, 35, 1178–1182. [Google Scholar] [CrossRef]
  30. SAS Statistical Package, Version 9.4; SAS Institute: Cary, NC, USA, 2022.
  31. Balde, H.; VanderZaag, A.C.; Burtt, S.D.; Wagner-Riddle, C.; Crolla, A.; Desjardins, R.L.; MacDonald, D.J. Methane emissions from digestate at an agricultural biogas plant. Bioresour. Technol. 2016, 216, 914–922. [Google Scholar] [CrossRef]
  32. Møller, H.B.; Sommer, S.G.; Ahring, B.K. Methane productivity of manure, straw and solid fractions of manure. Biomass Bioenergy 2003, 26, 485–495. [Google Scholar] [CrossRef]
  33. Fang, H.H.; Yu, H.Q. Effect of HRT on mesophilic acidogenesis of dairy wastewater. J. Environ. Eng. 2000, 126, 1145–1148. [Google Scholar] [CrossRef]
  34. Messner, H. Düngewirkung Anaerob Fermentierter und Unbehandelter Gülle. Master’s Thesis, Universität München-Weihenstephan, Freising, Germany, 1988. [Google Scholar]
  35. Sung, S.W.; Liu, T. Ammonia inhibition on thermophilic anaerobic digestion. Chemosphere 2003, 5, 43–52. [Google Scholar] [CrossRef]
  36. Zhuang, M.; Shan, N.; Wang, Y.; Caro, D.; Fleming, R.M.; Wang, L. Different characteristics of greenhouse gases and ammonia emissions from conventional stored dairy cattle and swine manure in China. Sci. Total Environ. 2020, 722, 137693. [Google Scholar] [CrossRef] [PubMed]
  37. Getabalew, M.; Alemneh, T.; Bzuneh, E. Review on Methanogenesis and its Role. World J. Agric. Soil Sci. 2020, 6, 1–7. [Google Scholar] [CrossRef]
  38. Bucci, L.; Ghiotto, G.; Zampieri, G.; Raga, R.; Favaro, L.; Treu, L.; Campanaro, S. Adaptation of anaerobic digestion microbial communities to high ammonium levels: Insights from strain-resolved metagenomics. Environ. Sci. Technol. 2023, 57, 580–590. [Google Scholar] [CrossRef]
  39. Vergote, T.L.I.; Bodè, S.; Dobbelaere, d.A.E.J.; Buysse, J.; Meers, E.; Volcke, E.I.P. Monitoring methane and nitrous oxide emissions from digestate storage following manure mono-digestion. Biosyst. Eng. 2020, 196, 159–171. [Google Scholar] [CrossRef]
  40. Cecchi, F.; Battistoni, P.; Pavan, P.; Bolzonella, D.; Innocenti, L. Digestione Anaerobica della Frazione Organica dei Rifiuti Solidi. Aspetti Fondamentali, Progettuali, Gestionali, di Impatto Ambientale ed Integrazione con la Depurazione delle Acque Reflue; Manuali e linee guida 13/2005; APAT, Agenzia per la Protezione dell’Ambiente e per i Servizi Tecnici o le persone: Roma, Italy, 2005. Available online: https://www.isprambiente.gov.it/contentfiles/00003400/3482-manuali-linee-guida-2005.pdf (accessed on 1 July 2025).
  41. Rusanowska, P.; Zielinski, M.; Kisielewska, M.; Dudek, M.; Paukszto, Ł.; Debowski, M. Methane Production, Microbial Community, and Volatile Fatty Acids Profiling During Anaerobic Digestion Under Different Organic Loading. Energies 2025, 18, 575. [Google Scholar] [CrossRef]
  42. Rajlakshmi, J.; Jadhav, D.A.; Dutta, S.; Sherpa, K.C.; Jayaswal, K.; Saravanabhupathy, S.; Mohanty, K.T.; Banerjee, R.; Kumar, J.; Rajak, R.C. Co-digestion processes of waste: Status and perspective. In Advanced Zero Waste Tools, Bio-Based Materials and Waste for Energy Generation and Resource Management; Hussain, C.M., Kushwaha, A., Bharagava, R.N., Goswami, L., Eds.; Elsevier: Amsterdam, The Netherlands, 2023; Volume 5, pp. 207–241. [Google Scholar]
  43. Speece, R.E. Anaerobic Biotechnology for Industrial Wastewaters; ArchaePress: Nashville, TN, USA, 1996. [Google Scholar]
  44. Colonna, N.; Alfano, V.; Gaeta, M. La Stima del Potenziale di Biogas da Biomasse di Scarto del Settore Zootecnico in Italia; Report Ricerca Sistema Elettrico, RSE/2009/201; 2009. Available online: https://www.researchgate.net/publication/265279702_La_stima_del_potenziale_di_biogas_da_biomasse_di_scarto_del_settore_zootecnico_in_Italia (accessed on 1 July 2025).
  45. Wu, J.; Zhang, H.; Zhao, Y.; Yuan, X.; Cui, Z. Characteristics of Biogas Production Activity and Microbial Community during Sub-Moderate Temperature Anaerobic Digestion of Wastewater. Fermentation 2023, 9, 903. [Google Scholar] [CrossRef]
  46. Hirsh, D.C.; Zee, Y.C. Veterinary Microbiology; Blackwell Science, Inc.: Oxford, UK, 1999. [Google Scholar]
  47. McFeters, G.A.; Stuart, D.G. Survival of coliform bacteria in natural waters: Field and laboratory studies with membrane-filter chambers. Appl. Microbiol. 1972, 24, 805–811. [Google Scholar] [CrossRef]
  48. Parhad, N.M.; Rao, U.N. Effect of pH on survival of Escherichia coli. J. Water Pollut. Control Fed. 1974, 46, 980–986. [Google Scholar]
  49. Sahlström, L. A review of survival of pathogenic bacteria in organic waste used in biogas plants. Bioresour. Technol. 2003, 87, 161–166. [Google Scholar] [CrossRef] [PubMed]
  50. Lin, M.; Wang, A.; Ren, L.; Qiao, W.; Wandera, S.M.; Dong, R. Challenges of pathogen inactivation in animal manure through anaerobic digestion: A short review. Bioengineered 2022, 13, 1149–1161. [Google Scholar] [CrossRef] [PubMed]
  51. Sommer, S.G. Ammonia volatilization from farm tanks containing anaerobically digested animal slurry. Atmos. Environ. 1997, 31, 863–868. [Google Scholar] [CrossRef]
  52. Möller, K. Effects of anaerobic digestion on soil carbon and nitrogen turnover, N-emissions, and soil biological activity. A review. Agron. Sustain. Dev. 2015, 35, 1021–1041. [Google Scholar] [CrossRef]
  53. Nartey, O.D.; Liu, D.; Uwamungu, J.Y.; Luo, J.; Lindser, S.; Di, H.J.; Chen, Z.; Yuan, J.; Ding, W. Corn cobs efficiently reduced ammonia volatilization and improved nutrient value of stored dairy effluents. Sci. Total Environ. 2021, 769, 144712. [Google Scholar] [CrossRef]
  54. Efosa, N.; Häni, C.; Kupper, T.; Krause, H.-M.; Six, J.; Bünemann, E.K. Ammonia emissions after trailing hose application of digestates and cattle slurry. Nutr. Cycl. Agroecosyst. 2025, 130, 419–426. [Google Scholar] [CrossRef]
  55. Denmead, O.; Freney, L.; Simpson, J. Dynamics of ammonia volatilization during furrow irrigation of maize. Soil Sci. Soc. Am. J. 1982, 46, 149–155. [Google Scholar] [CrossRef]
  56. Wang, Y.; Zhu, Z.; Li, X.; Yang, J.; Liang, L.; Sui, Q.; Wang, B.; Dong, H. NH3, N2O, and NO emissions from digested pig slurry stored under different temperatures: Characteristics and microbial mechanisms. J. Clean. Prod. 2021, 319, 128560. [Google Scholar] [CrossRef]
  57. Hüther, L. Entwicklung Analytischer Methoden und Untersuchung von Einflußfaktoren auf Ammoniak-, Methan- und Distickstoffmonoxidemissionen aus Flussig- und Festmist; Landbauforschung Volkenrode, Sonderheft: Braunschweig, Germany, 1999. [Google Scholar]
  58. Sommer, S.G.; Petersen, S.O.; Sogaard, H.T. Greenhouse gas emission from stored livestock slurry. J. Environ. Qual. 2000, 29, 744–751. [Google Scholar] [CrossRef]
  59. Kebreab, E.; Clark, K.; Wagner-Riddle, C.; France, J. Methane and nitrous oxide emissions from Canadian animal agriculture: A review. Can. J. Anim. Sci. 2006, 86, 135–158. [Google Scholar] [CrossRef]
  60. Wulf, S.; Maeting, M.; Clemens, J. Effect of application technique on the emission of trace gases (NH3, N2O, CH4) after spreading cofermented slurry on arable and grassland. Part II. Greenhouse gas emissions. J. Environ. Qual. 2002, 31, 1795–1801. [Google Scholar]
  61. Cárdenas, A.; Ammon, C.; Schumacher, B.; Stinner, W.; Herrmann, C.; Schneider, M.; Weinrich, S.; Fischer, P.; Amon, T.; Amon, B. Methane emissions from the storage of liquid dairy manure: Influences of season, temperature and storage duration. Waste Manag. 2021, 121, 393–402. [Google Scholar] [CrossRef] [PubMed]
  62. Im, S.; Petersen, S.O.; Lee, D.; Kim, D.H. Effects of storage temperature on CH4 emissions from cattle manure and subsequent biogas production potential. Waste Manag. 2020, 101, 35–43. [Google Scholar] [CrossRef] [PubMed]
  63. Ward, A.J.; Hobbs, P.J.; Holliman, P.J.; Jones, D.L. Optimisation of the anaerobic digestion of agricultural resources. Bioresour. Technol. 2008, 99, 7928–7940. [Google Scholar] [CrossRef] [PubMed]
  64. Kim, M.S.; Lee, Y.S.; Min, H.G.; Kim, J.G. Applicability of the dynamic chamber-capture system (DCS) for estimating the flux of ammonia emission during liquid fertilizer spreading. Atmos. Pollut. Res. 2020, 11, 723729. [Google Scholar] [CrossRef]
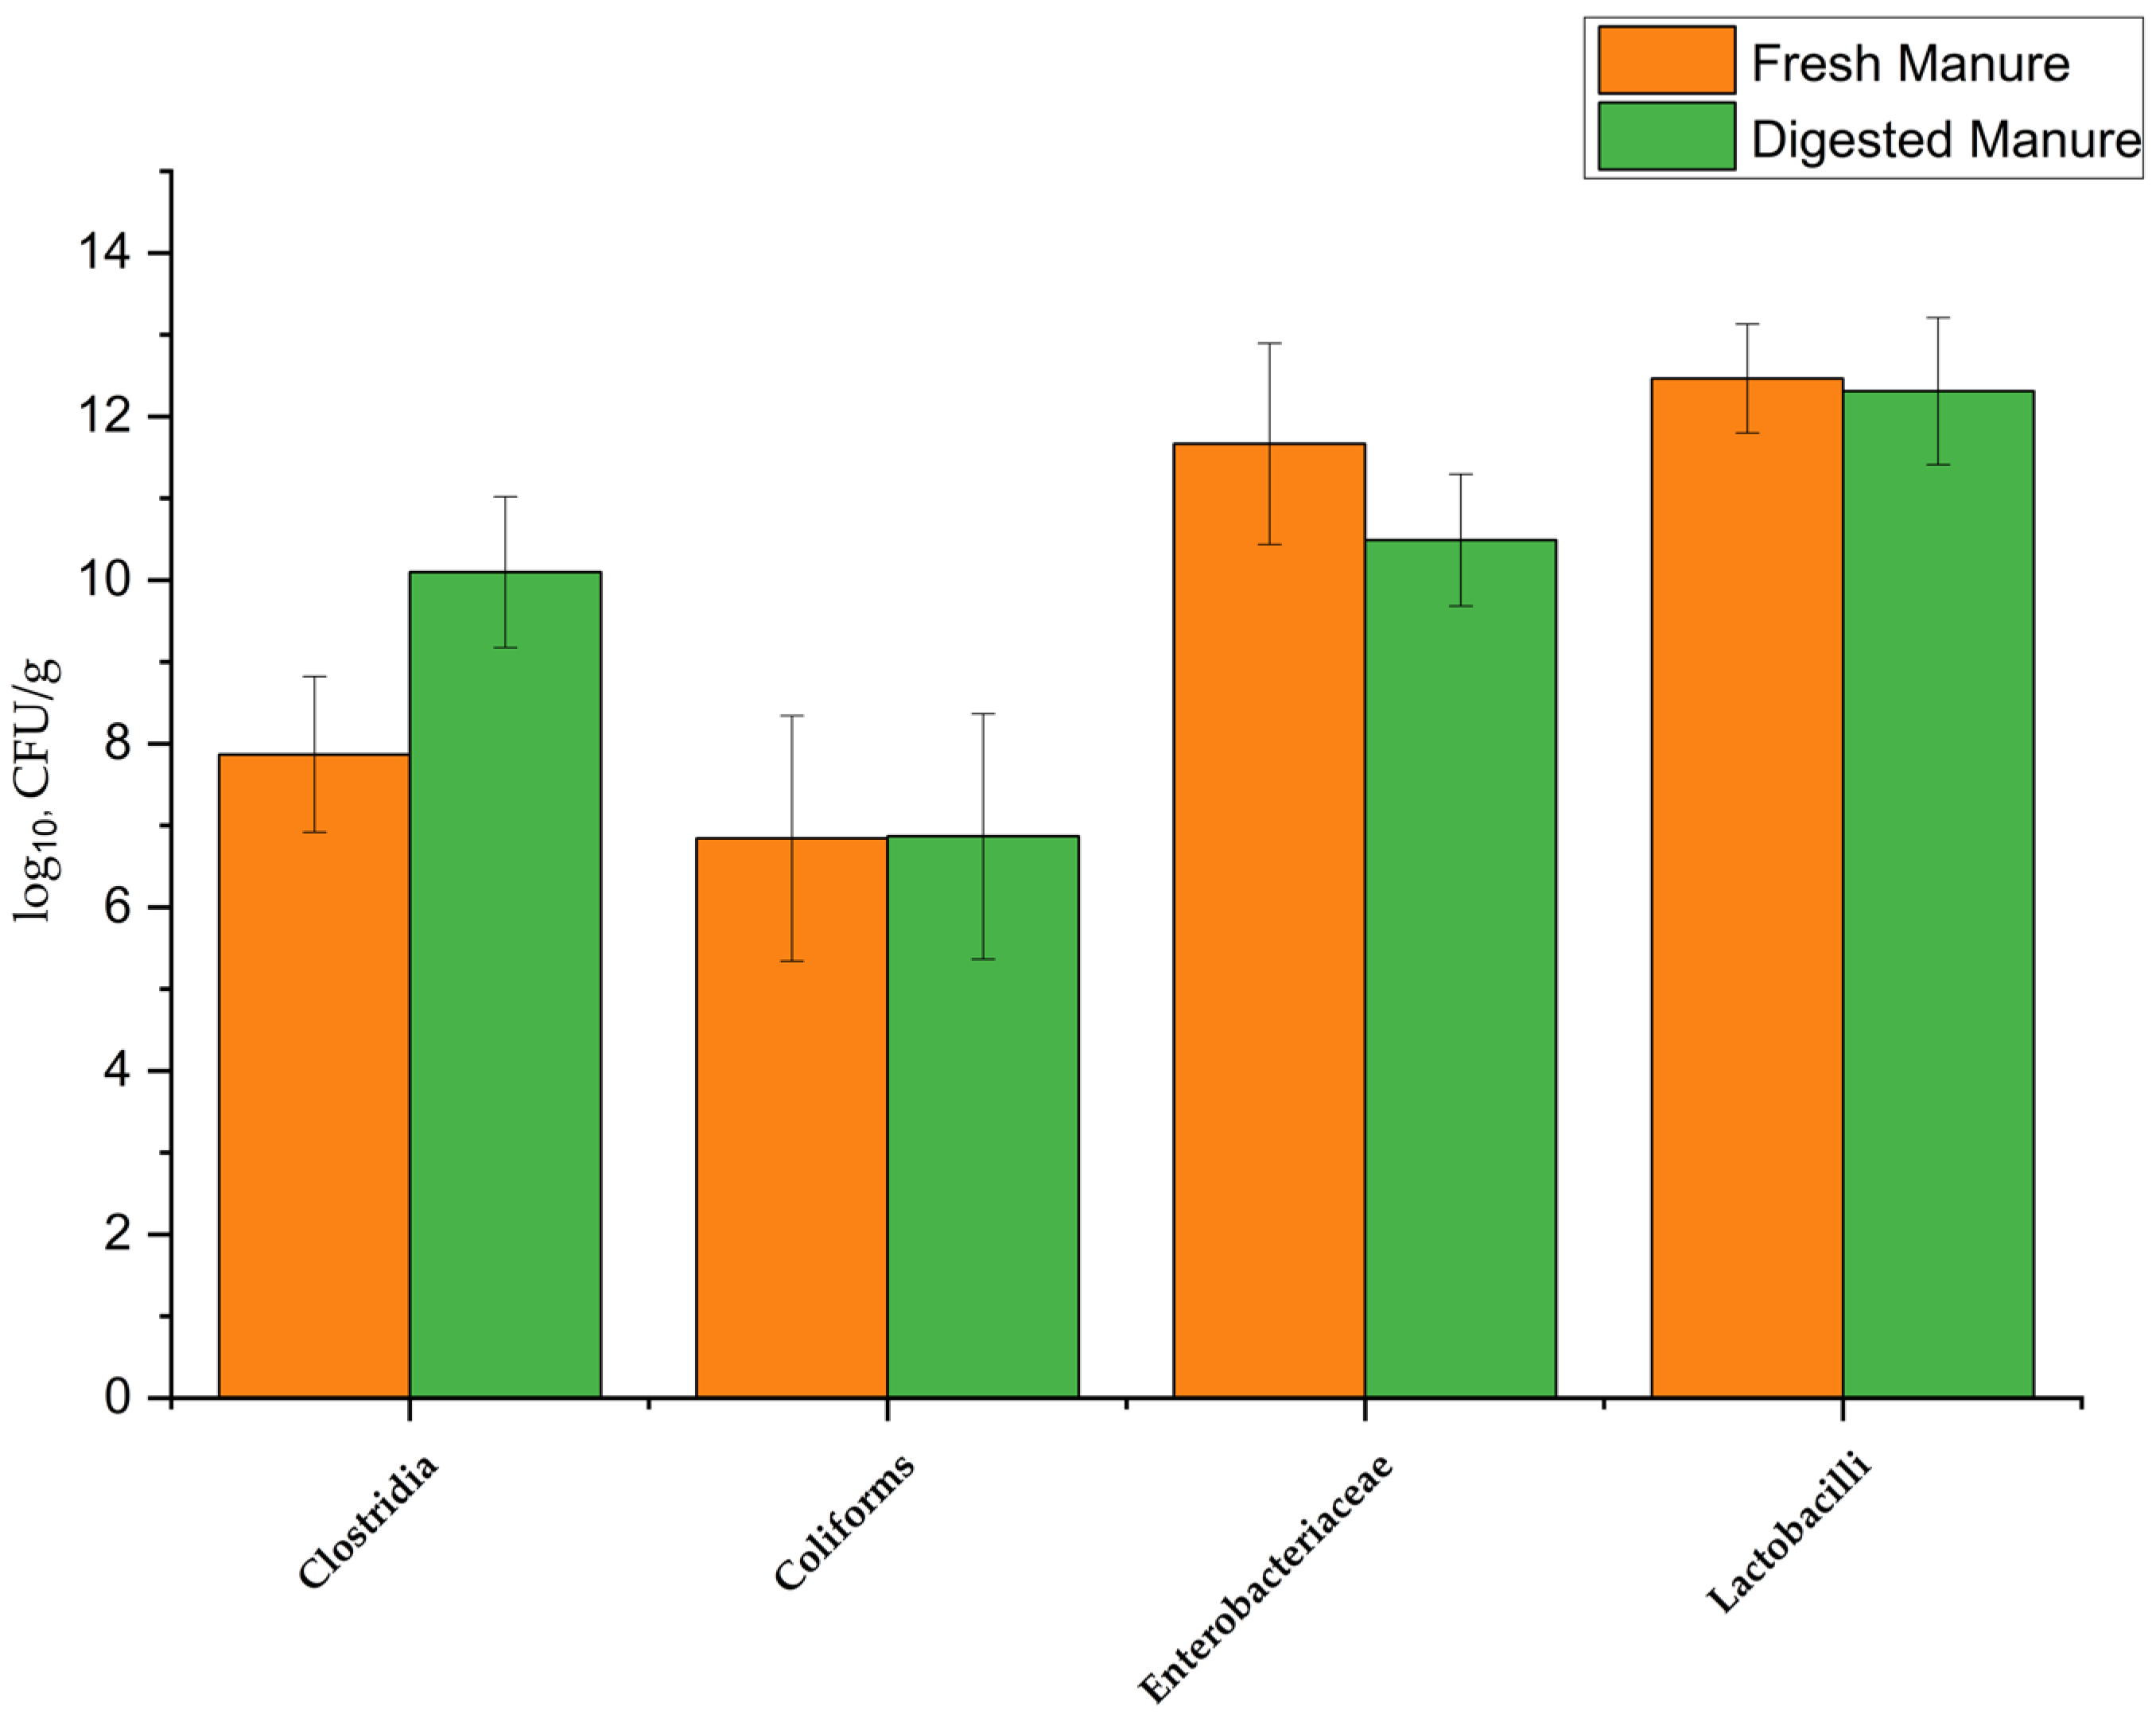
Figure 2. Concentrations (CFU/g on fresh matter) of clostridia, coliforms, enterococci, and lactobacilli in cattle manure before and after anaerobic digestion, values are expressed as Log10.
Agriculture 15 01931 g002
Figure 3. Ammonia (NH3) emission fluxes (mg m−2 h−1) measured from cattle manure and digestate at 18 °C and 28 °C using the static chamber method under laboratory conditions.
Agriculture 15 01931 g003
Table 2. Mean values of determination coefficients (R2) for emission fluxes of ammonia (NH3), methane (CH4), carbon dioxide (CO2), and nitrous oxide (N2O) measured from fresh manure and digestate at the two investigated temperatures (18 °C and 28 °C).
Temperature NH3CH4CO2N2O
18 °CFresh manure0.71 ± 0.110.87 ± 0.150.99 ± 0.010.98 ± 0.01
Digested manure0.77 ± 0.100.76 ± 0.040.99 ± 0.010.98 ± 0.01
28 °CFresh manure0.65 ± 0.060.74 ± 0.120.96 ± 0.000.94 ± 0.03
Digested manure0.65 ± 0.120.84 ± 0.030.88 ± 0.120.96 ± 0.01
Disclaimer/Publisher’s Note: The statements, opinions and data contained in all publications are solely those of the individual author(s) and contributor(s) and not of MDPI and/or the editor(s). MDPI and/or the editor(s) disclaim responsibility for any injury to people or property resulting from any ideas, methods, instructions or products referred to in the content.