Article

Dynamics and Determinants of Maize Sap Flow Under Soil Compaction in the Black Soil Region of Northeast China

State Key Laboratory of Black Soils Conservation and Utilization, Northeast Institute of Geography and Agroecology, Chinese Academy of Sciences, Harbin 150081, China
*
Author to whom correspondence should be addressed.
Agriculture 2025, 15(18), 1911; https://doi.org/10.3390/agriculture15181911
Submission received: 3 August 2025 / Revised: 5 September 2025 / Accepted: 6 September 2025 / Published: 9 September 2025
(This article belongs to the Special Issue Innovative Conservation Cropping Systems and Practices—2nd Edition)

Abstract

Soil compaction is considered as one of the main factors limiting plant growth. Understanding the variation in sap flow affected by soil compaction is of vital importance for precision agriculture. In this study, a two-year field experiment with three levels of soil compaction (i.e., NC, no compaction; MC, moderate compaction; and SC, severe compaction) was conducted in the black soil region of Northeast China. Results revealed that soil compaction had a significant impact on soil properties, soil water content, and plant growth parameters, which ultimately affected the sap flow rate of maize. The average daily sap flow rates of MC and SC decreased by 15.89% and 29.12% in comparison to those of NC in 2023, and decreased by 51.53% and 57.11% in comparison to those of NC in 2024, respectively. Net radiation and vapor pressure deficit were the two most important meteorological variables affecting sap flow rate. In addition, the relationship between sap flow rate and meteorological variables was independent of the level of soil compaction stress. Daily sap flow rate exhibited a strong linear relationship with leaf area index and stem diameter, but showed no significant correlation with plant height. Additionally, daily sap flow rate was well correlated with root length density in the 0–60 cm soil layer. Furthermore, daily sap flow rate was significantly affected by soil water content of the 0–60 cm soil layer, but there was no significant correlation between daily sap flow rate and penetration resistance. Moreover, cumulative sap flow rate was negatively correlated with soil bulk density in both the top layer (0–20 cm) and sub-layer (20–40 cm). Our results provide a scientific basis for understanding the relationship between maize sap flow and soil compaction. More precise and systematic characterization of soil compaction, especially in relation to root growth, is needed to explore the underlying mechanisms of soil compaction on plant sap flow in the future.

1. Introduction

Plant transpiration serves as the core element in water transport within the Soil–Plant–Atmosphere Continuum (SPAC) [1]. It is closely related to crop productivity since it directly governs key physio-ecological processes, including root water uptake, stomatal aperture regulation, photosynthesis, and respiration [1,2,3]. Therefore, the quantitative characterization of transpiration holds critical importance in precision agriculture, particularly for optimizing water management strategies and enhancing crop productivity.
However, it remains challenging to measure transpiration directly, especially in the field. Due to the strong correlation between transpiration and sap flow, sap flow measurement of whole plants has been used in a wide range of plant species and sizes to evaluate transpiration [4,5,6]. The heat balance method is one of the commonly used techniques that can measure sap flow rate at an instantaneous interval [7,8], which employs a constant-power thermal equilibrium gauge to determine xylem mass flow rate [9].
As a complicated physiological process of plants, sap flow is affected by many factors. Many previous studies have shown that sap flow rate was mainly controlled by meteorological factors [10,11], plant growth parameters [12,13], and soil water status [14]. But the relationships between sap flow rates and these controlling factors demonstrated significant variability across study area, plant species, and growth stages. For instance, most studies indicated that net radiation (Rn) was the key meteorological variable affecting the sap flow rate of Artemisia ordosica [13,15,16], while vapor pressure deficit (VPD) was found to be more important than Rn for Caragana korshinskii [17]. Dynamic variations in sap flow rate were also detected over the growing season due to the changes in leaf area index (LAI) and stem diameter [18]. The effects of plant height on sap flow rate of maize have also been observed [1]; however, little is known about the effect of root length density (RLD) on sap flow rate, which is a crucial metric in soil water uptake. Moreover, Zhang et al. [13] reported that soil water content (SWC) was the more important controlling variable on sap flow rate than Rn and VPD in the arid region of Northwest China. However, no significant correlation was found between sap flow rate and SWC (0–20 cm layer) in the semi-humid region of Northeast China [19]. Such discrepancies reflect that the relationship between sap flow rate and SWC remains unclear.
The black soil region of Northeast China, which is characterized by a dark surface, plays a vital role in ensuring the nation’s food security [20]. Besides the rich soil organic matter of the black soil, the high mechanization rate has greatly contributed to the improvement of crop productivity in this region [21,22]. However, the increase in mechanization rate has been accompanied by the growing weight of machinery, which in turn leads to soil compaction [23,24]. Soil compaction is a growing global concern that limits crop performance and threatens soil health. Soil compaction causes a series of physical modifications, such as an increase in bulk density (BD) and penetration resistance (PR), reduction in porosity, and hydraulic conductivity. These modifications consequently affect the infiltration of rain/snowmelt into the soil profile, which ultimately affects soil water storage and distribution [25,26]. In addition, many previous studies have reported that soil compaction profoundly alters root proliferation and distribution [27,28,29]. In general, as soil compaction increases, root elongation rate decreases, and root diameter increases. However, the effect of soil compaction on root architecture varies a lot among plant species [29]. In theory, all these changes under soil compaction stress would affect sap flow rate. However, the effects of soil compaction on the sap flow rate of maize are yet inconclusive in the black soil region of Northeast China.
To comprehensively understand the impacts of soil compaction stress on variation in sap flow rate, a two-year field experiment in the black soil region of Northeast China was conducted. Sap flow rate, soil properties affected by soil compaction, and plant growth parameters were extensively observed. We aimed to (1) assess the responses of sap flow rate at hourly and daily scales as affected by soil compaction; and (2) explore the relationships among sap flow rate and meteorological variables, plant growth parameters, and soil properties affected by soil compaction.

2. Materials and Methods

2.1. Study Site

The field experiment was carried out at Hailun (47°26′ N, 126°47′ E), Heilongjiang Province, in Northeast China in both 2023 and 2024. The study area has a temperate semi-humid continental monsoon climate, characterized by a mean annual temperature of 1.5 °C and precipitation of 550 mm [30]. The soil at the study site is typical black soil (Mollisols in USDA classification), composed of 67.62 g kg−1 organic matter, 1.83 g kg−1 total nitrogen, 0.74 g kg−1 total phosphorus, 17.29 g kg−1 total potassium, and pH 6.79 (0–20 cm soil layer) [29]. No-tillage management has been practiced for the past 5 years at the study site. And the field has been under a continuous maize cropping system for the past decade.

2.2. Experimental Design

The soil compaction experiment was established in the spring of 2023. Three levels of soil compaction were considered: no compaction (NC), moderate compaction (MC), and severe compaction (SC). All treatments were arranged following a randomized complete block design with three replicates. Each plot was 3.9 m wide (6 rows) and 10 m long. The soil compaction treatments were performed through different passes of a tracked vehicle in the entire plot area in early May of 2023. The tracked vehicle had a total weight of 8 Mg, and the inflation pressures of the tracks were 230 kPa. The number of vehicle passes was determined based on the maximum penetration resistance in the 0–45 cm soil layer measured during pre-experiment. The maximum penetration resistance in this layer was approximately 1100, 1500, and 2100 kPa after 0, 2, and 6 passes. Since 2000 kPa is widely recognized as a critical threshold that restricts root growth, the vehicle passes for NC, MC, and SC treatments were set to 0, 2, and 6 times, respectively.
Maize was sown manually using a held-hold seeder directly after soil compaction. The base fertilizer was simultaneously applied at a rate of 260 kg ha−1 N, 110 kg ha−1 P2O5, and 60 kg ha−1 K2O, respectively. Maize was rain-fed, and no irrigation was provided in all treatment plots. Other field management practices were maintained in accordance with local farmers.

2.3. Data Collection

2.3.1. Meteorological Data Collection

In this study, meteorological data, including precipitation (P), air temperature (Ta), wind speed at 2 m height (U2), net radiation (Rn), and relative humidity (RH), were automatically recorded from a standard weather station installed near the experimental site at a frequency of every 30 min. Vapor pressure deficit (VPD) was used to reflect the combined effects of Ta and RH as follows [31]:
VPD =   0.611   e 17.27 T a / ( T a + 237.7 ) × ( 1 RH / 100 )

2.3.2. Determination of Soil Properties

During harvest of 2023 and 2024, six undisturbed soil cores (5.0 cm in height and 5.0 cm in diameter) of each plot were randomly taken from depths of 7.5–12.5 cm and 27.5–32.5 cm to represent 0–20 cm and 20–40 cm soil layers. Three soil cores were dried at 105 °C for 48 h to a constant weight to determine soil BD. Simultaneously, the other three replicated bulk soil cores were sampled to determine soil saturated hydraulic conductivity (Ks). The soil cores were saturated from the bottom with degassed water and then measured using the constant water head method [32]. The outflow was gathered, and Ks values were calculated utilizing Darcy’s law. PR was measured using a hand-held soil compaction meter (Field ScoutTM SC900, Spectrum Technologies Inc., Aurora, IL, USA) at intervals of 2.5 cm in a maximum soil depth of 45 cm, with 10 replications in each plot. PR measurement was performed about every 30 days, corresponding to key stages: shooting, heading, filling, and the maturity stage. A total of four time measurements were conducted during the growing season of 2023 and 2024.

2.3.3. Determination of Maize Morphological Variables

Five plants of each plot were fixed to measure LAI, stem diameter, and plant height at approximately every 25–30 days, corresponding to key stages: heading, tasseling, filling, and maturity stage. LAI and stem diameter at 20–25 cm above the soil surface were measured using the Li-3100A canopy analyzer (Li-COR, Lincoln, NE, USA) and a vernier caliper, respectively. The height from the ground surface to the plant apex was measured as the plant height. Root length density (RLD) was measured using the minirhizotron method [33] at a time interval of 20–25 days during the maize growth season. After sowing, one clear plexiglass minirhizotron access tube with sealed bottoms (100 cm in length and 5.0 in inner diameter) was installed between two seedlings at a 45° angle at each plot. The installation process followed the methods outlined by Liao et al. [34]. Root images were scanned by the CI-602 minirhizotron system (CID Bio-Science, Camas, WA, USA) at four vertical depths (0–15 cm, 15–30 cm, 30–45 cm, 45–60 cm). The collected root images were then analyzed with the WinRHIZO MF software package (Regent Instruments Inc., Quebec, QC, Canada) for root length (RL). RLD was calculated as follows [35]:
RLD =   RL A × DOF
where A is the area of the root image and DOF is the distance between minirhizotron and soil, DOF = 0.2 cm in this study [36].

2.3.4. Monitoring of Soil Water Content and Sap Flow Rate

Soil water content during the maize growth season was measured using the TRIME-PICO-IPH sensor (Imko, Ettlingen, Germany) at a time interval of 15–20 days and a depth interval of 10 cm. The PC tubes (100 cm in height and 4.2 cm in inner diameter) equipped with TRIME-PICO-IPH sensor were vertically installed in the middle of two maize seedlings after sowing. Each plot was installed with one tube for soil water monitoring. Within each soil compaction treatment, one of the three replicates was randomly selected for monitoring sap flow rate. Two maize plants of each treatment were chosen for continuous measurement using the Flow32-1K sap flow system (Dynamax, Houston, TX, USA) at a time interval of 30 min based on the heat balance method [37]. The installation followed the instructions of Dynamax [38]. These sensors were connected to a CR1000X data logger (Campbell, Bountiful, UT, USA) for automated monitoring. Since the stems of the maize plant grew slowly from tasseling to maturity, this period (21 August to 28 September 2023 and 3 August to 27 September 2024) was taken as the monitoring period to ensure data is continuous and reliable [1].

2.4. Statistical Analysis

The F-test was applied to identify the homoscedasticity of the data. The significant difference in soil properties and plant morphological parameters was analyzed by one-way ANOVA, with the least significant difference (LSD) test at p < 0.05. Mann–Kendall test was performed to identify the changing tendency of SWC with depth. The averaged sap flow rate per plant in an hour was calculated as the hourly sap flow rate, and the sum of hourly sap flow rates in a day was calculated as the daily sap flow rate. Meteorological factors were calculated in the same way. Pearson’s correlation analysis was employed to evaluate the relationship between hourly and daily sap flow rate and meteorological variables with 95% and 99% confidence. The statistical analysis was performed using SPSS software (Version 19.0; SPSS Inc., Chicago, IL, USA), and the figures were drawn with Origin software (Version 2019b; OriginLab, Northampton, MA, USA).

3. Results

3.1. Soil Properties and Water Content as Related to Soil Compaction

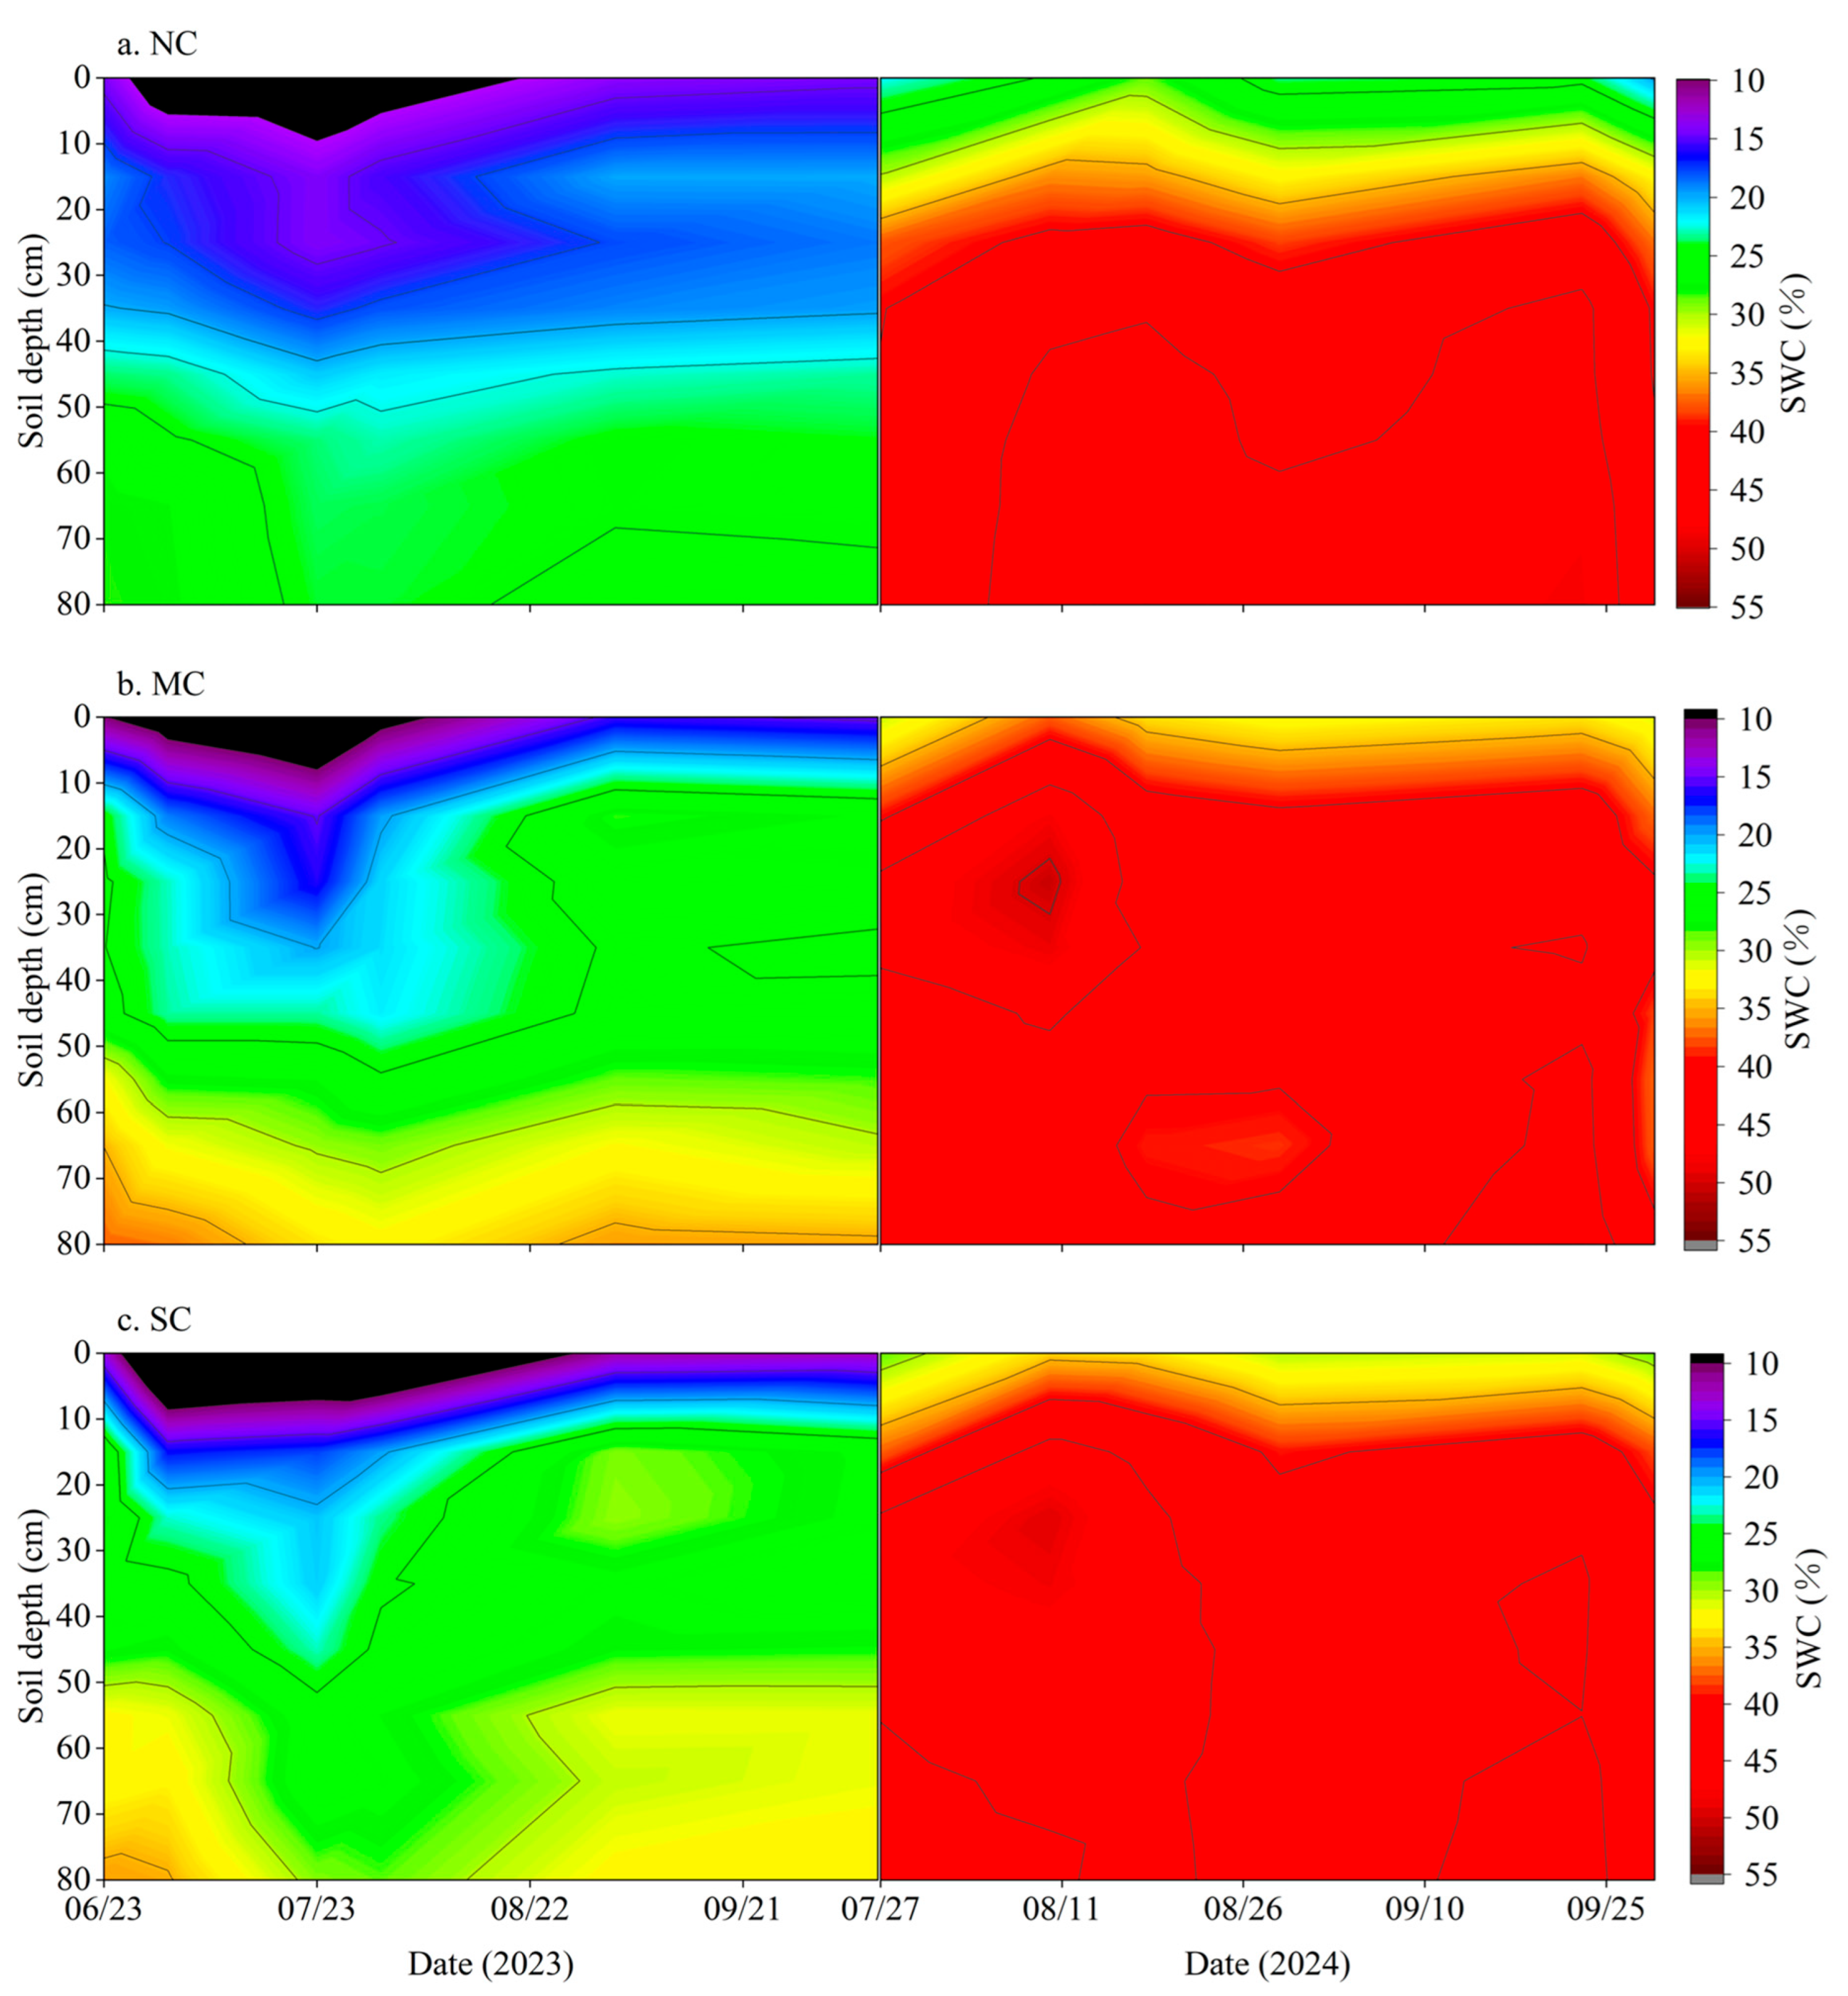
Soil BD, Ks, and PR varied significantly among the three treatments in both the top layer (0–20 cm) and the sub-layer (20–40 cm) in 2023 and 2024 (Table 1 and Figure 1). Compared to NC and MC, SC significantly increased BD in both years, especially in the sub-layer. However, there was no significant difference in BD between NC and MC. By contrast, with an increase in soil compaction levels, Ks decreased significantly in both layers and both years. For instance, Ks decreased from 13.79 × 10⁻² to 0.10 × 10⁻² cm min−1 and from 7.53 × 10⁻² to 0.04 × 10⁻² cm min−1 in the top layer under NC treatment, compared to SC in 2023 and 2024, respectively. Similarly, PR also exhibited a general increase with increasing soil compaction stress, especially in the top layer (Figure 1). But most values of PR were less than 2000 kPa, which was generally considered as the negative threshold value for root growth [39]. As demonstrated in Figure 2, SWC in 2024 was significantly higher than that of 2023. Moreover, in the top layer, SWC generally increased with the increase in soil compaction in 2023 (p < 0.05), whereas no significant trend was observed in the deeper layer in both years (p > 0.05).

3.2. Maize Morphological Variables as Related to Soil Compaction

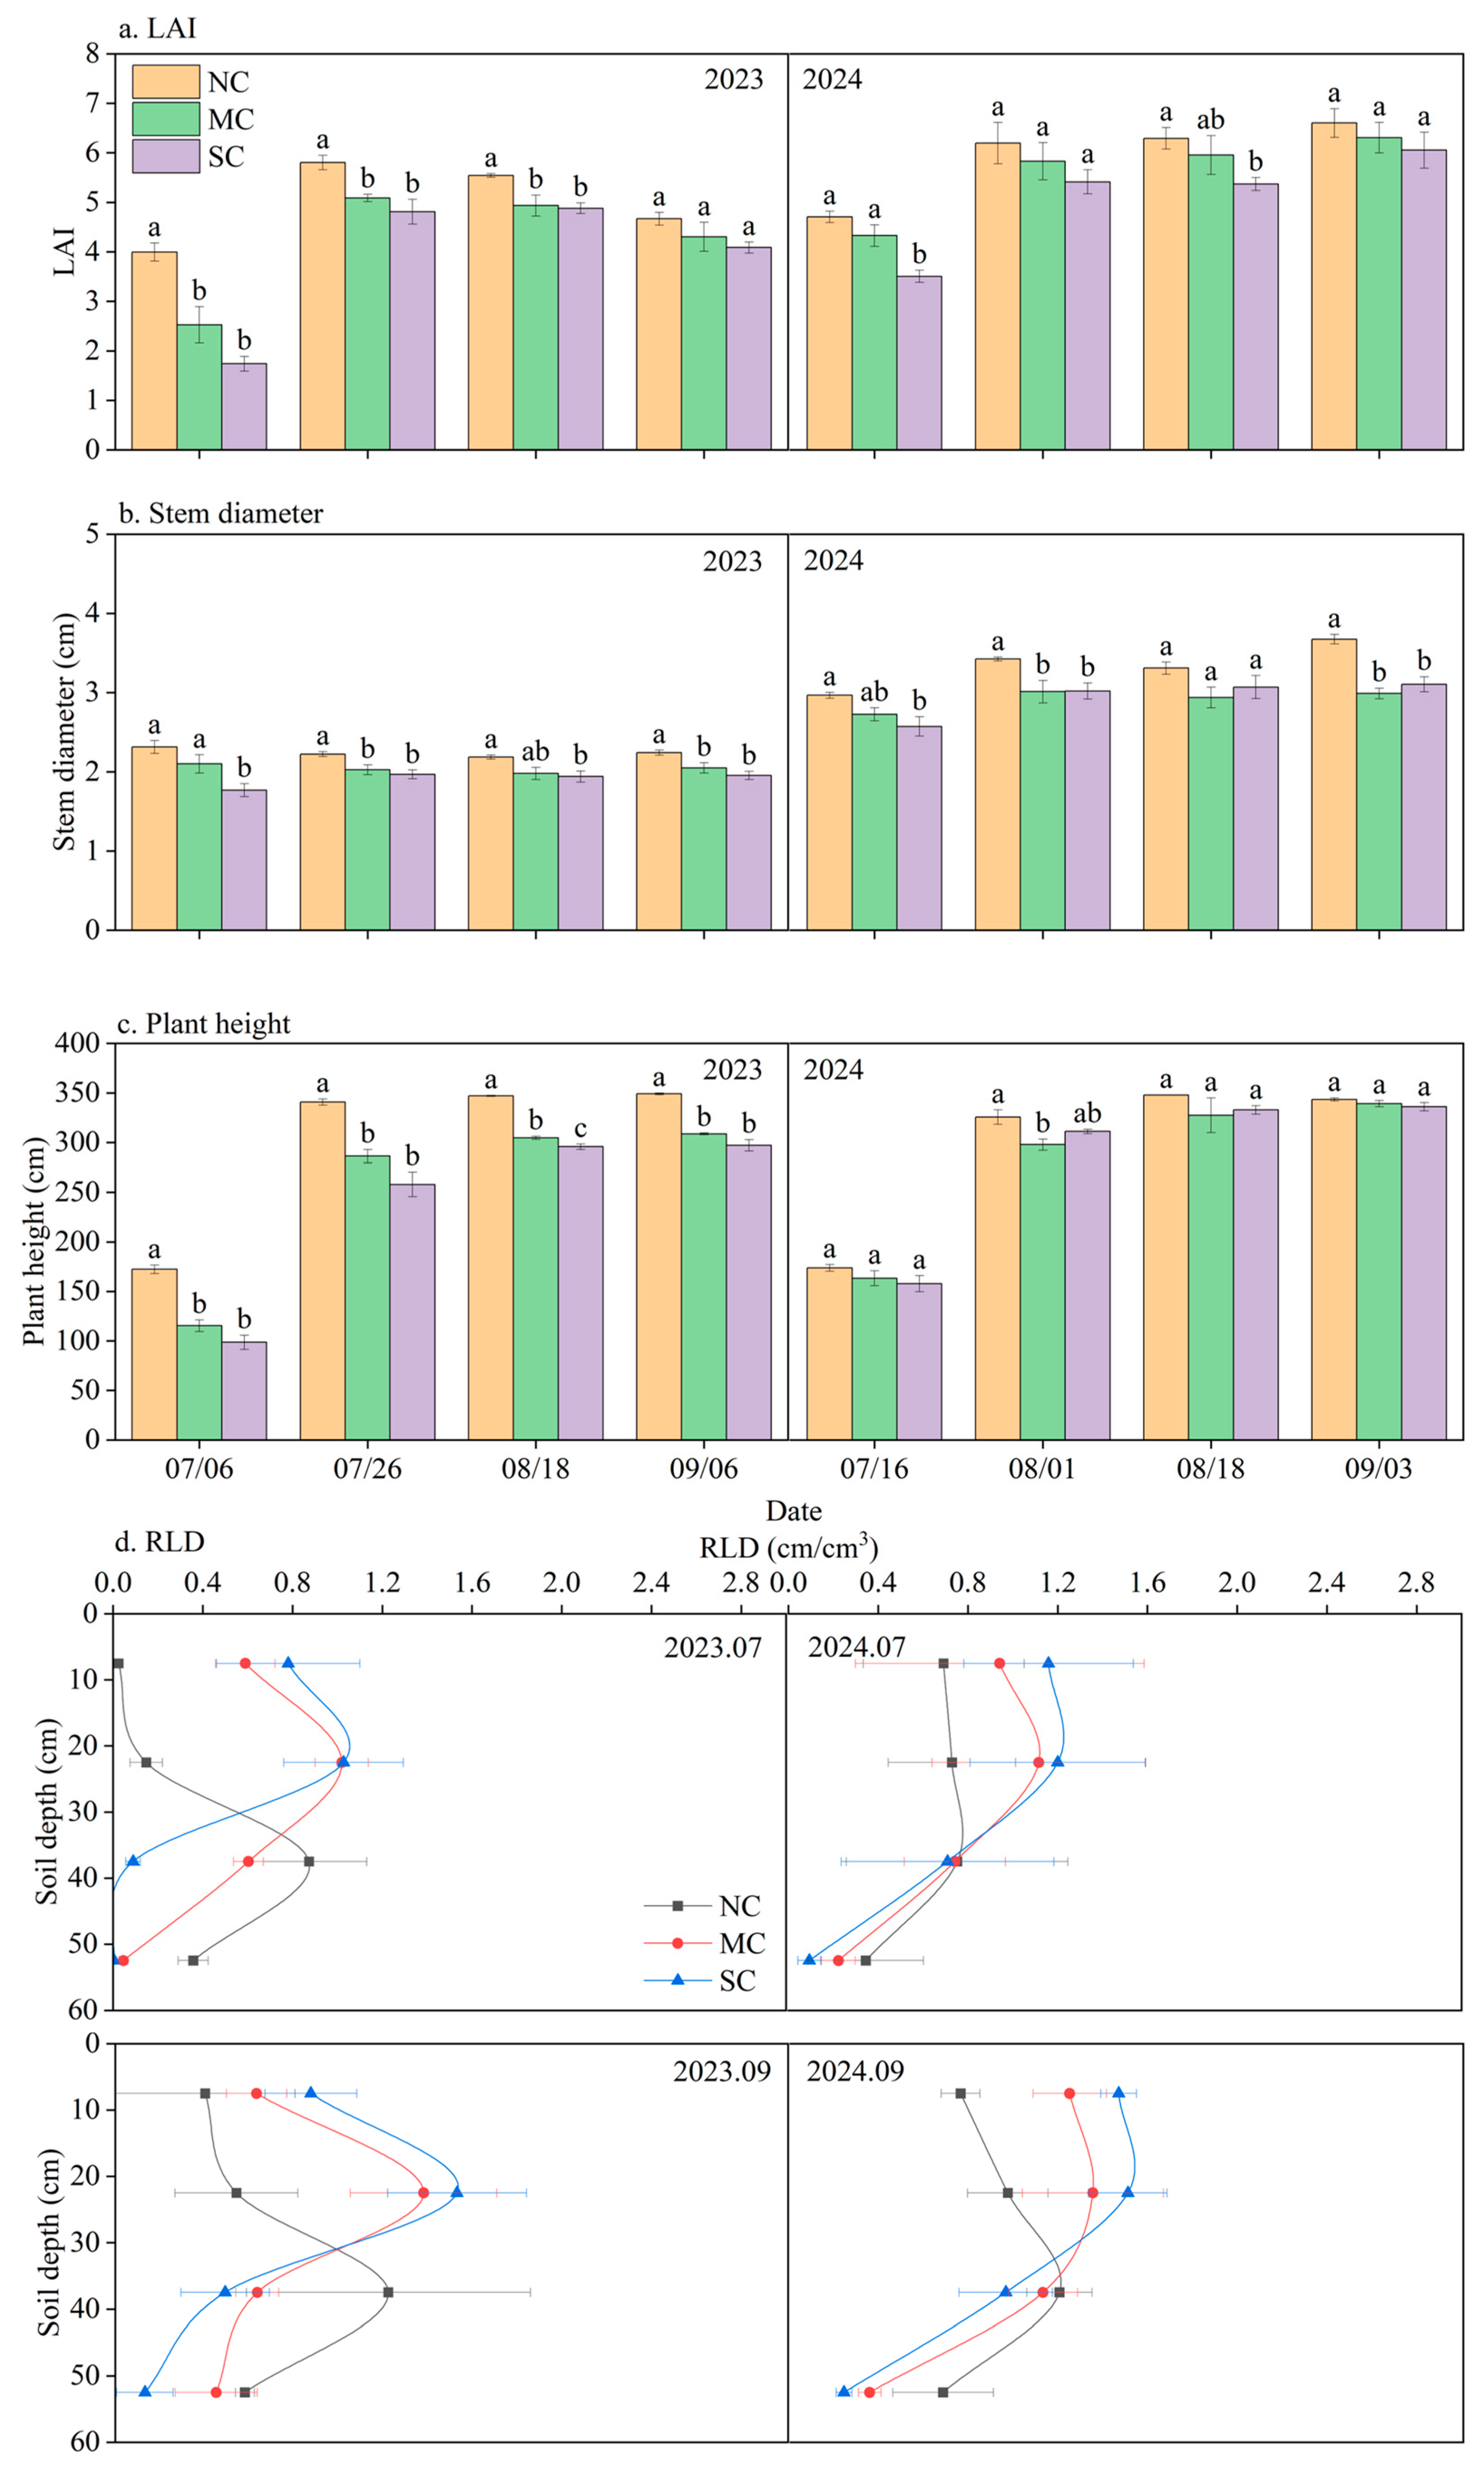
In general, soil compaction had a significant impact on LAI, stem diameter, plant height, and RLD in both 2023 and 2024 (Figure 3). For LAI, NC treatment had significantly higher values than those of MC and SC treatments in most growth periods (p < 0.05) (Figure 3a). A similar trend was also found in stem diameter, with the highest values in NC among all treatments (Figure 3b). However, LAI increased dramatically from early July to mid-August and then decreased in September, while stem diameter increased from early July to early August and remained stable from early August to September. Similarly to stem diameter, plant height decreased significantly with the increase in soil compaction level, especially in 2023 (Figure 3c). Since the distribution of RLD among all treatments during the whole growth stage was similar, only the distribution of RLD in July (heading) and September (maturity) was shown in Figure 3d. RLD of the whole soil profile increased as maize grew from heading to maturity in both 2023 and 2024. In the top layer, RLD increased with the increasing soil compaction level, whereas it generally declined with the increasing soil compaction level in the deeper layer.

3.3. Relationship Between Sap Flow Rates and Meteorological Variables

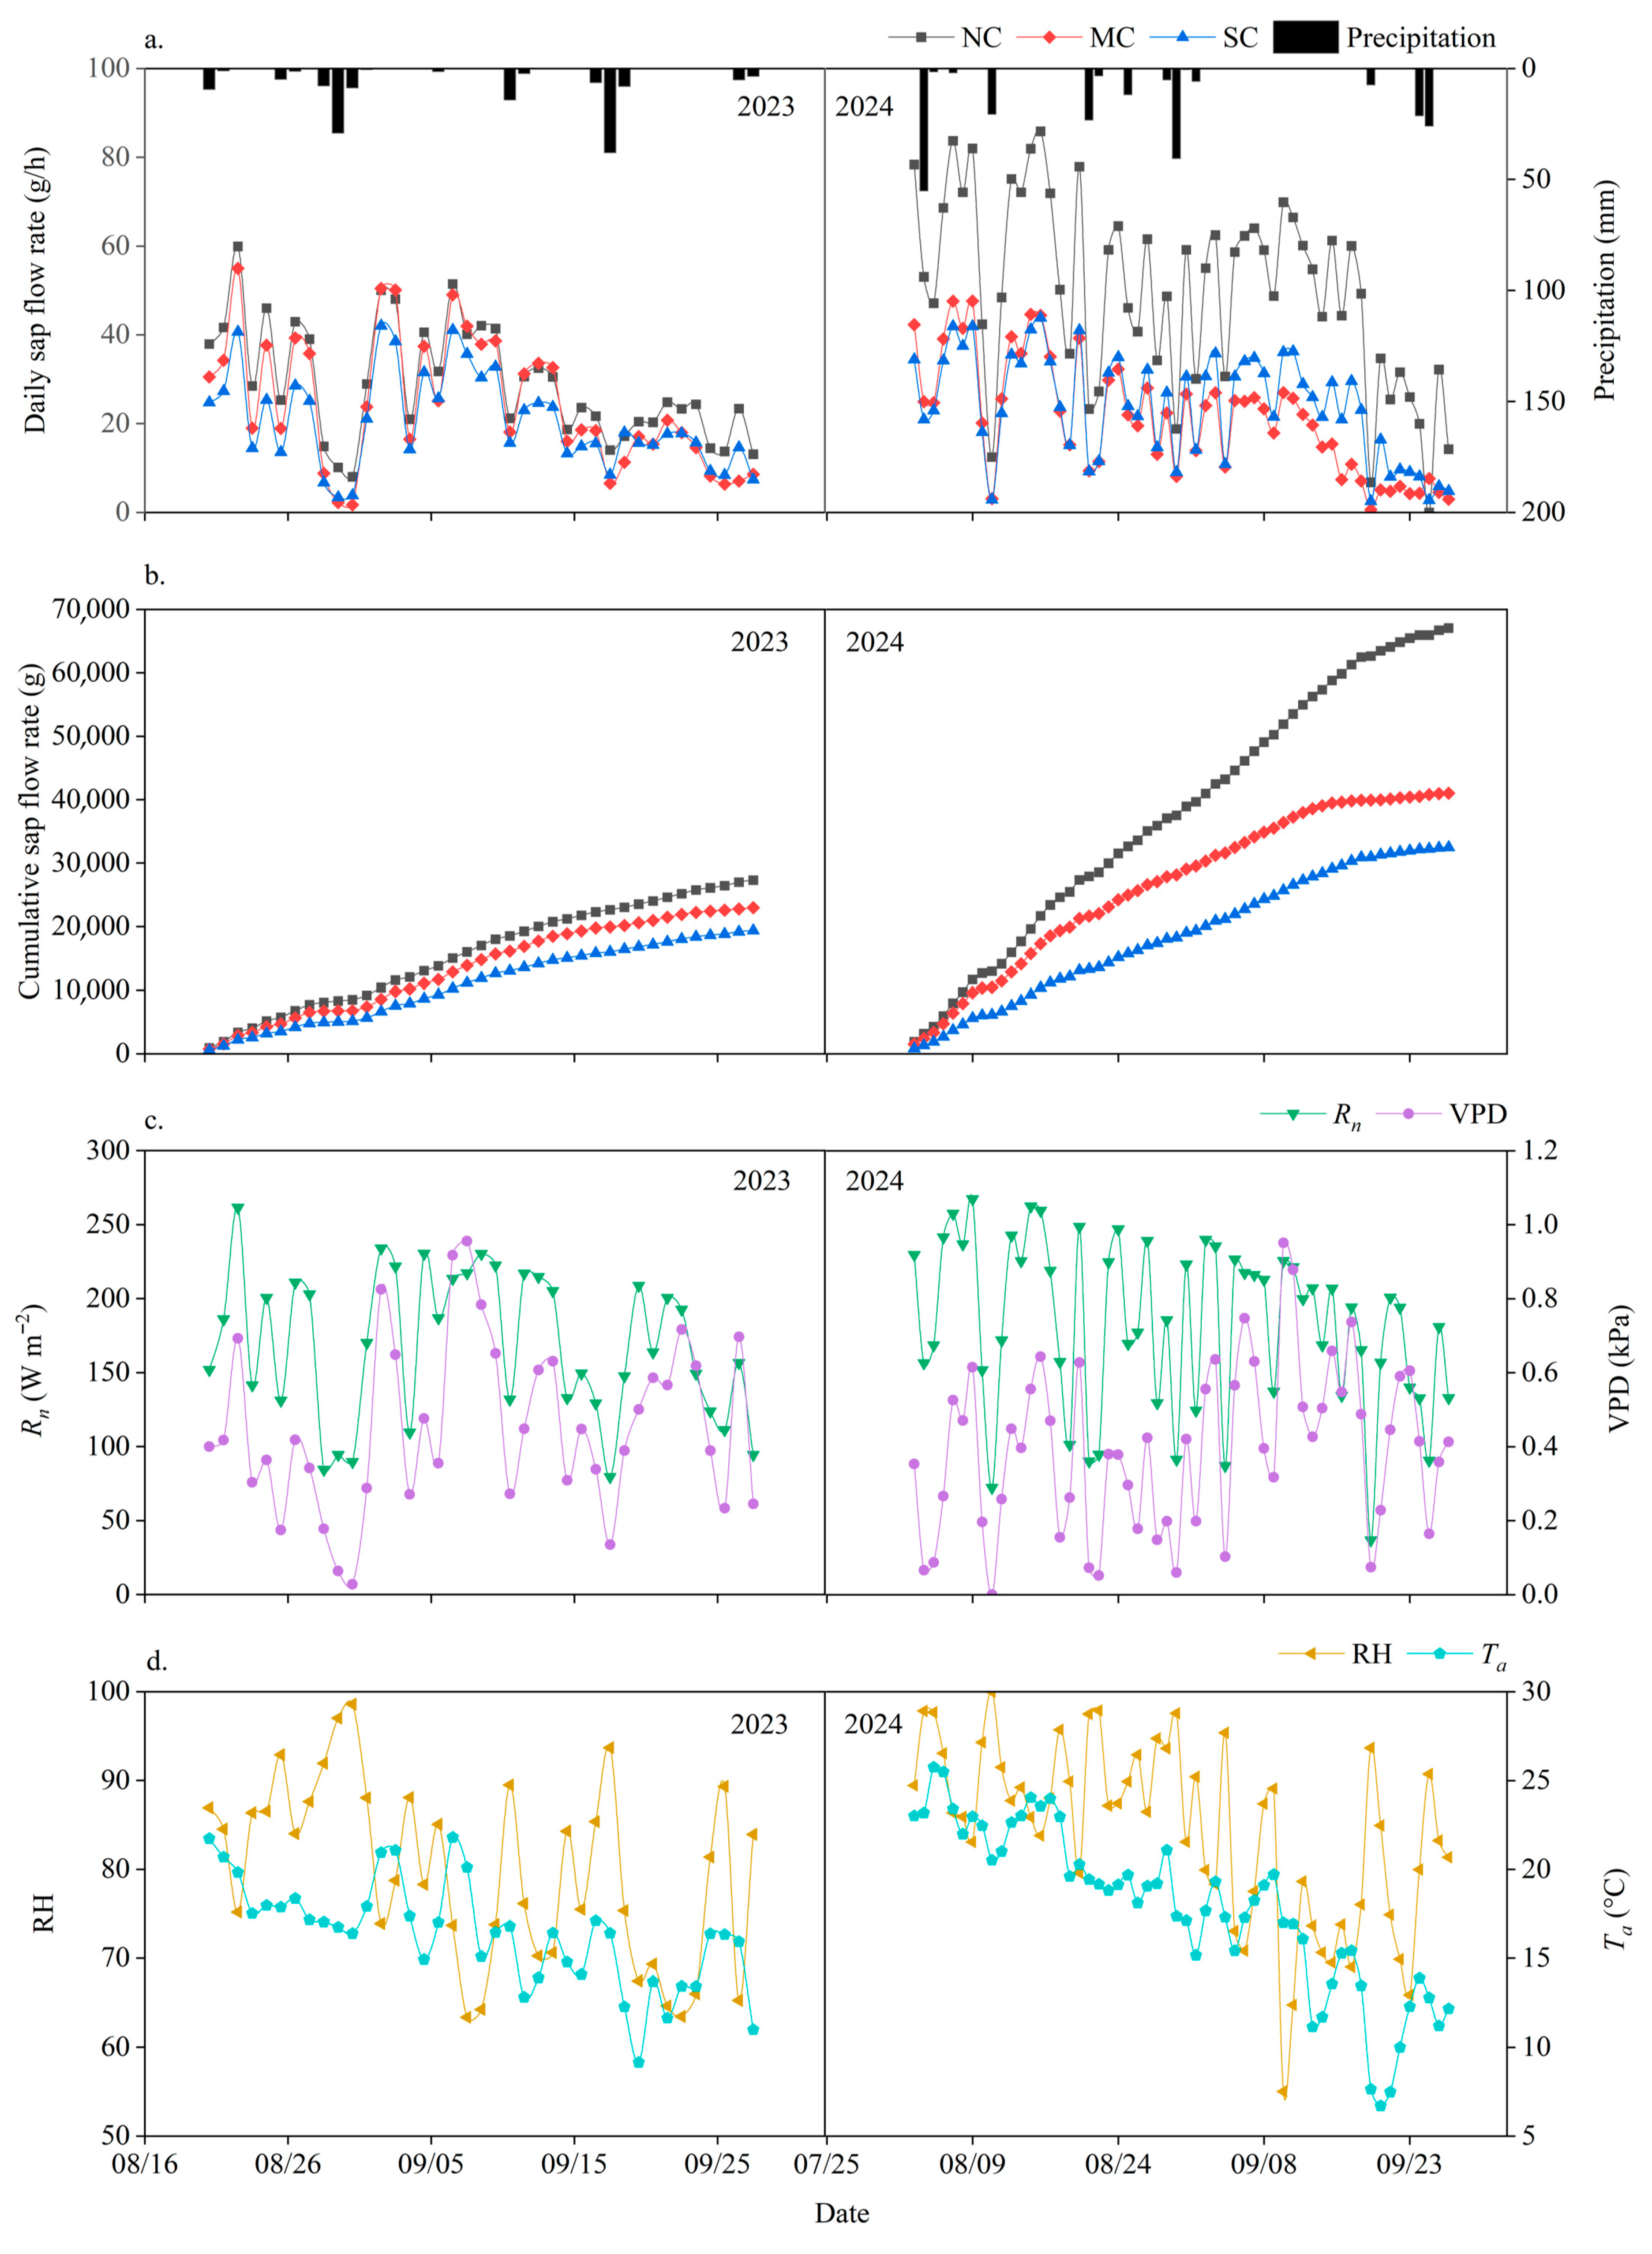
Daily sap flow rate showed a similar fluctuating feature between 2023 and 2024 (Figure 4a). Daily sap flow rate showed considerable variation over the growing season and demonstrated an overall decreasing trend from tasseling to maturity stage in both years. In addition, the daily sap flow rate and cumulative sap flow rate generally decreased with the increase in soil compaction level (Figure 4a,b). Specifically, the average daily sap flow rates of MC and SC decreased by 15.89% and 29.12% in comparison to those of NC in 2023, and decreased by 51.53% and 57.11% in comparison to those of NC in 2024, respectively.
During the sap flow monitoring period, the rainfall in 2024 was higher than that in 2023, while other meteorological variables (Rn, VPD, RH, and Ta) exhibited similar temporal trends aligned with maize growth in 2023 and 2024 (Figure 4). Pearson’s correlation analysis between sap flow rate and meteorological variables showed that most meteorological variables were significantly correlated with hourly or daily sap flow rate (Table 2). Among them, Rn, VPD, Ta, and U2 were all significantly positively correlated with hourly sap flow rate in both 2023 and 2024 (p < 0.01) (Table 2 and Figure 4). Meanwhile, RH was significantly negatively correlated with hourly sap flow rate in both 2023 and 2024 (p < 0.01), but RH was not significantly correlated with daily sap flow rate in 2024 (Table 2). Furthermore, the absolute values of the correlation coefficient (r) between hourly sap flow rate and meteorological variables were generally higher than those between daily sap flow rate and meteorological variables. According to Table 2, the relative influence of meteorological variables on daily sap flow rate generally decreased in the order: Rn > VPD > Ta > RH > U2. Additionally, precipitation was usually accompanied by low daily or hourly sap flow rate (Figure 4a). For example, the daily sap flow rate of NC, MC, and SC on 18 September 2023 was only 14.03, 6.57, and 8.49 g h−1, respectively, much lower than on September 17 and 19 September, because there was a heavy rainfall (41 mm) on that day (Figure 4a).

3.4. Relationship Between Sap Flow Rate and Maize Morphological Variables

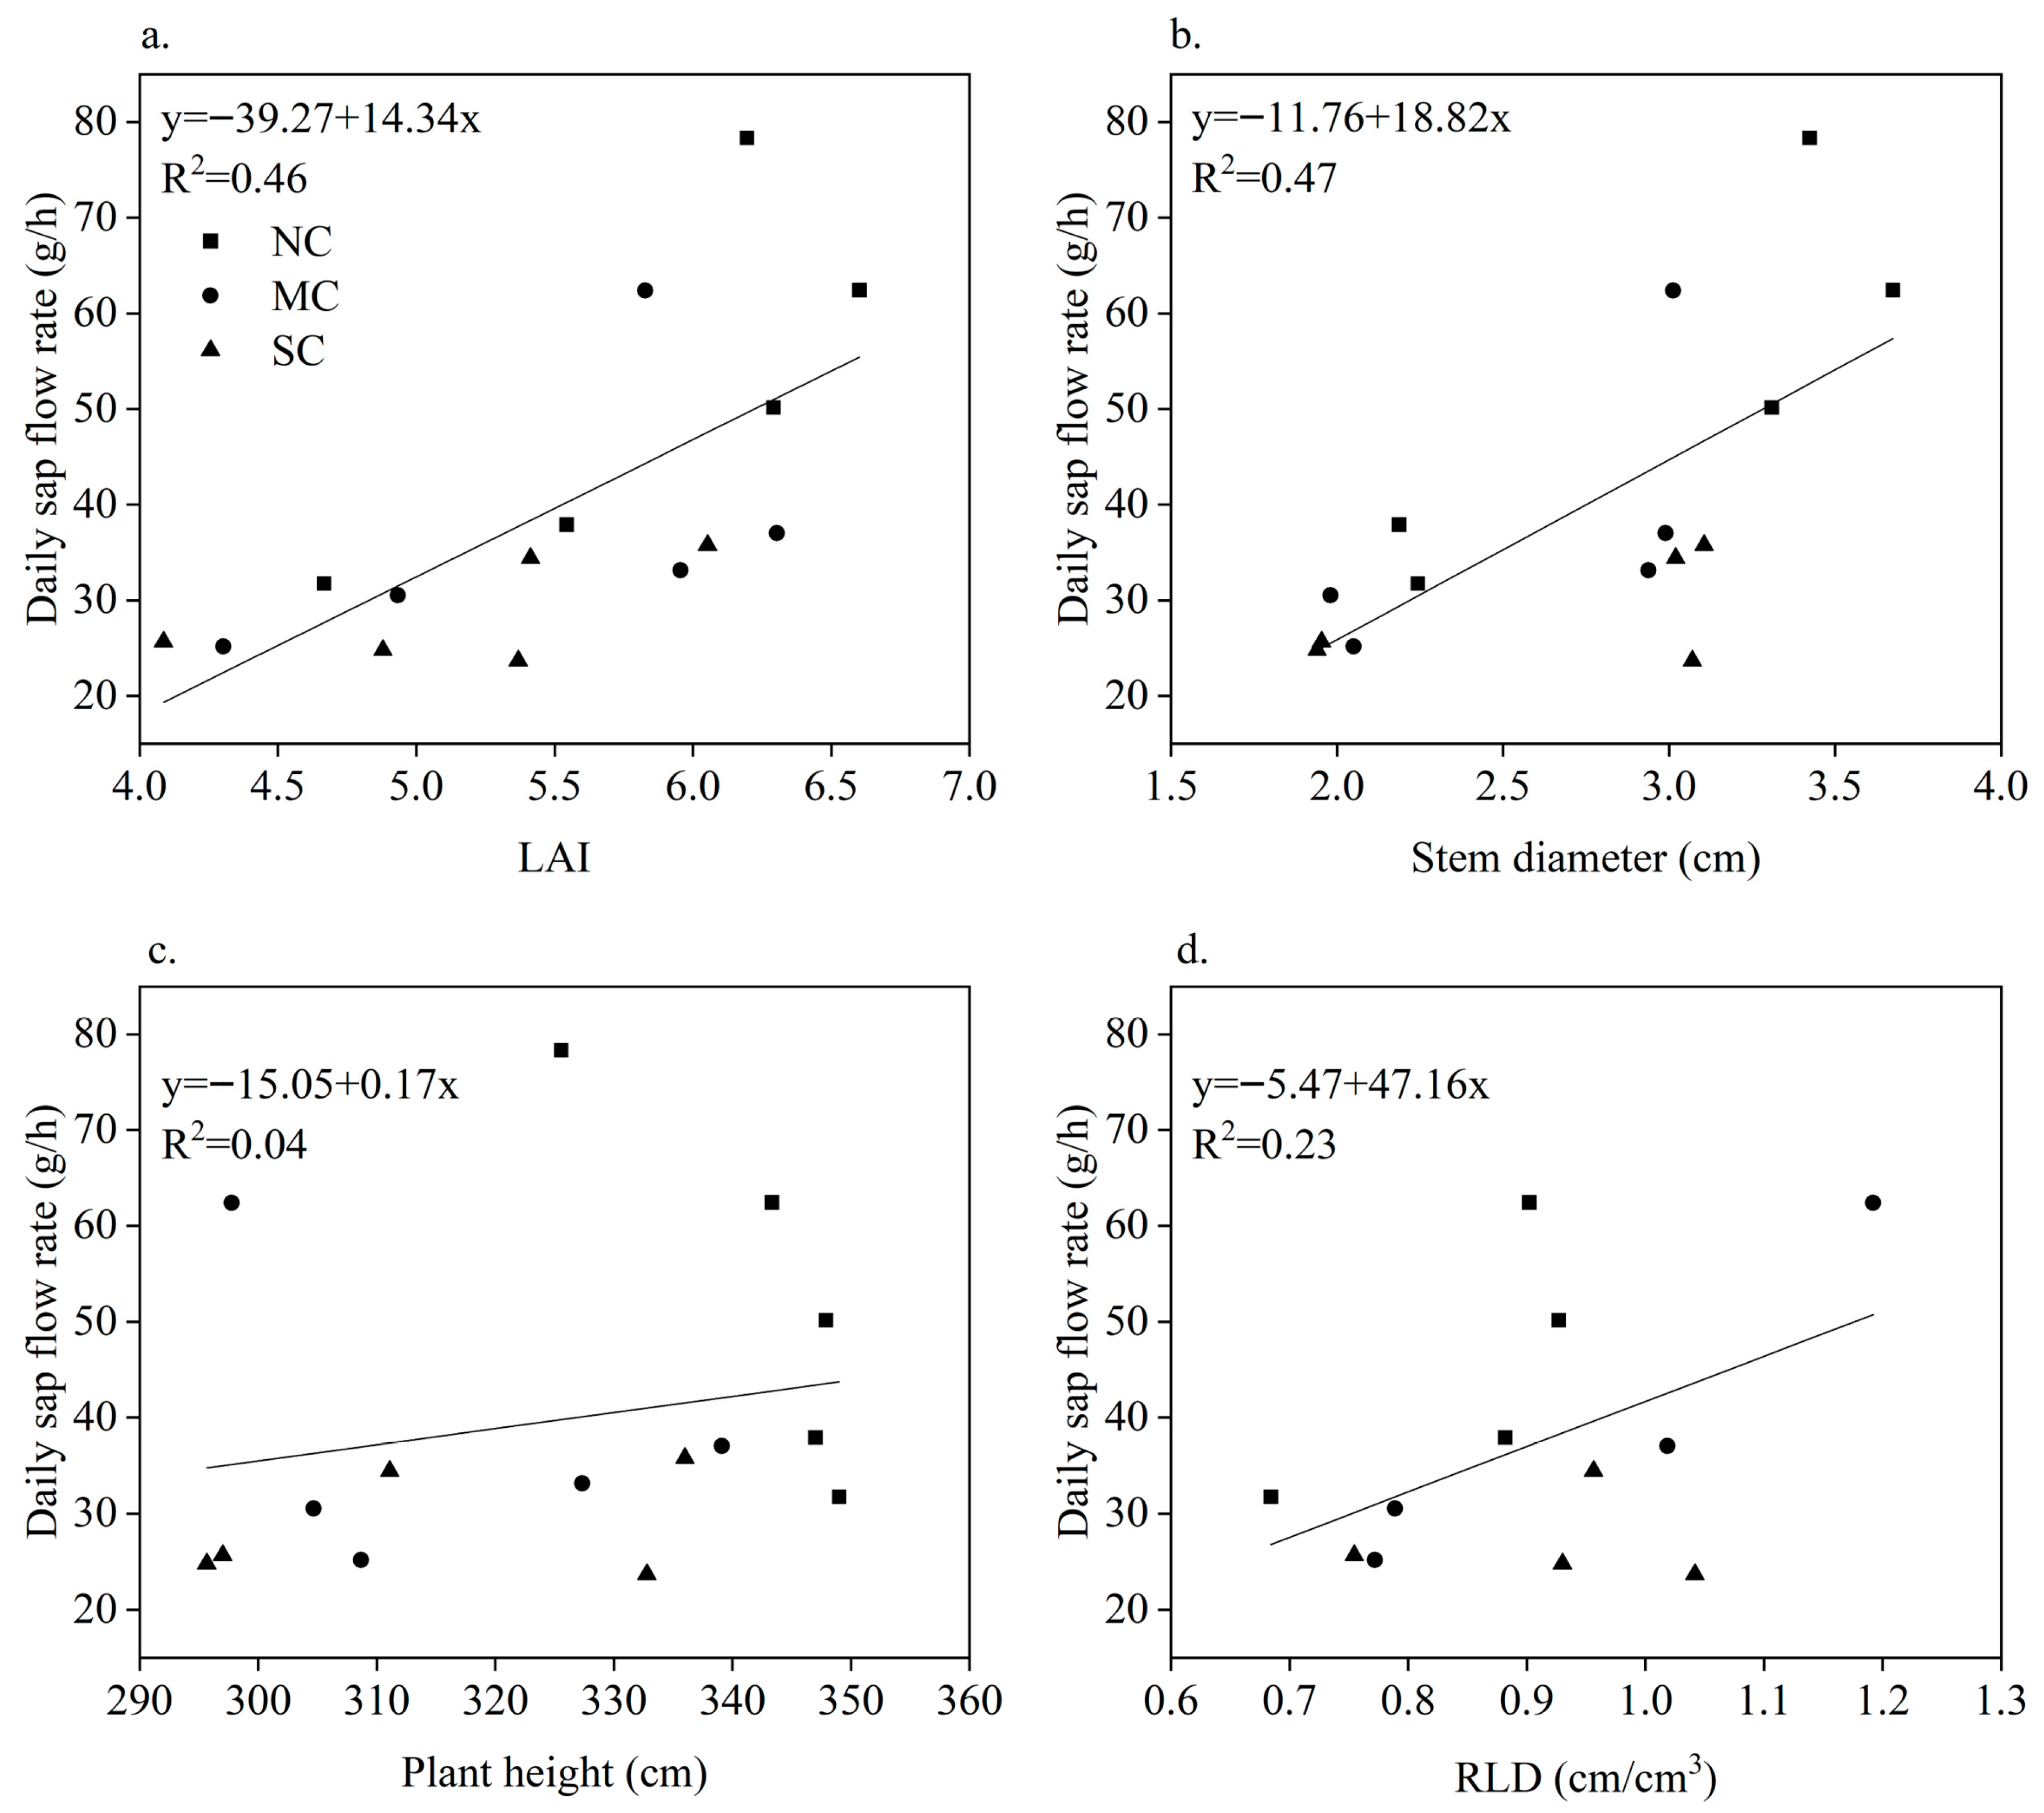
Overall, the daily sap flow rate increased with the increasing values of maize morphological variables. Among them, the daily sap flow rate exhibited a linear relationship with LAI and stem diameter (R2 = 0.46, p < 0.05; R2 = 0.47, p < 0.05) (Figure 5a,b). However, there was no significant correlation between daily sap flow rate and plant height (Figure 5c). Similarly to LAI and stem diameter, there was also a close correlation between daily sap flow rates and RLD of 0–60 cm soil layer (Figure 5d).

3.5. Relationship Between Sap Flow Rate and Soil Compaction-Related Properties

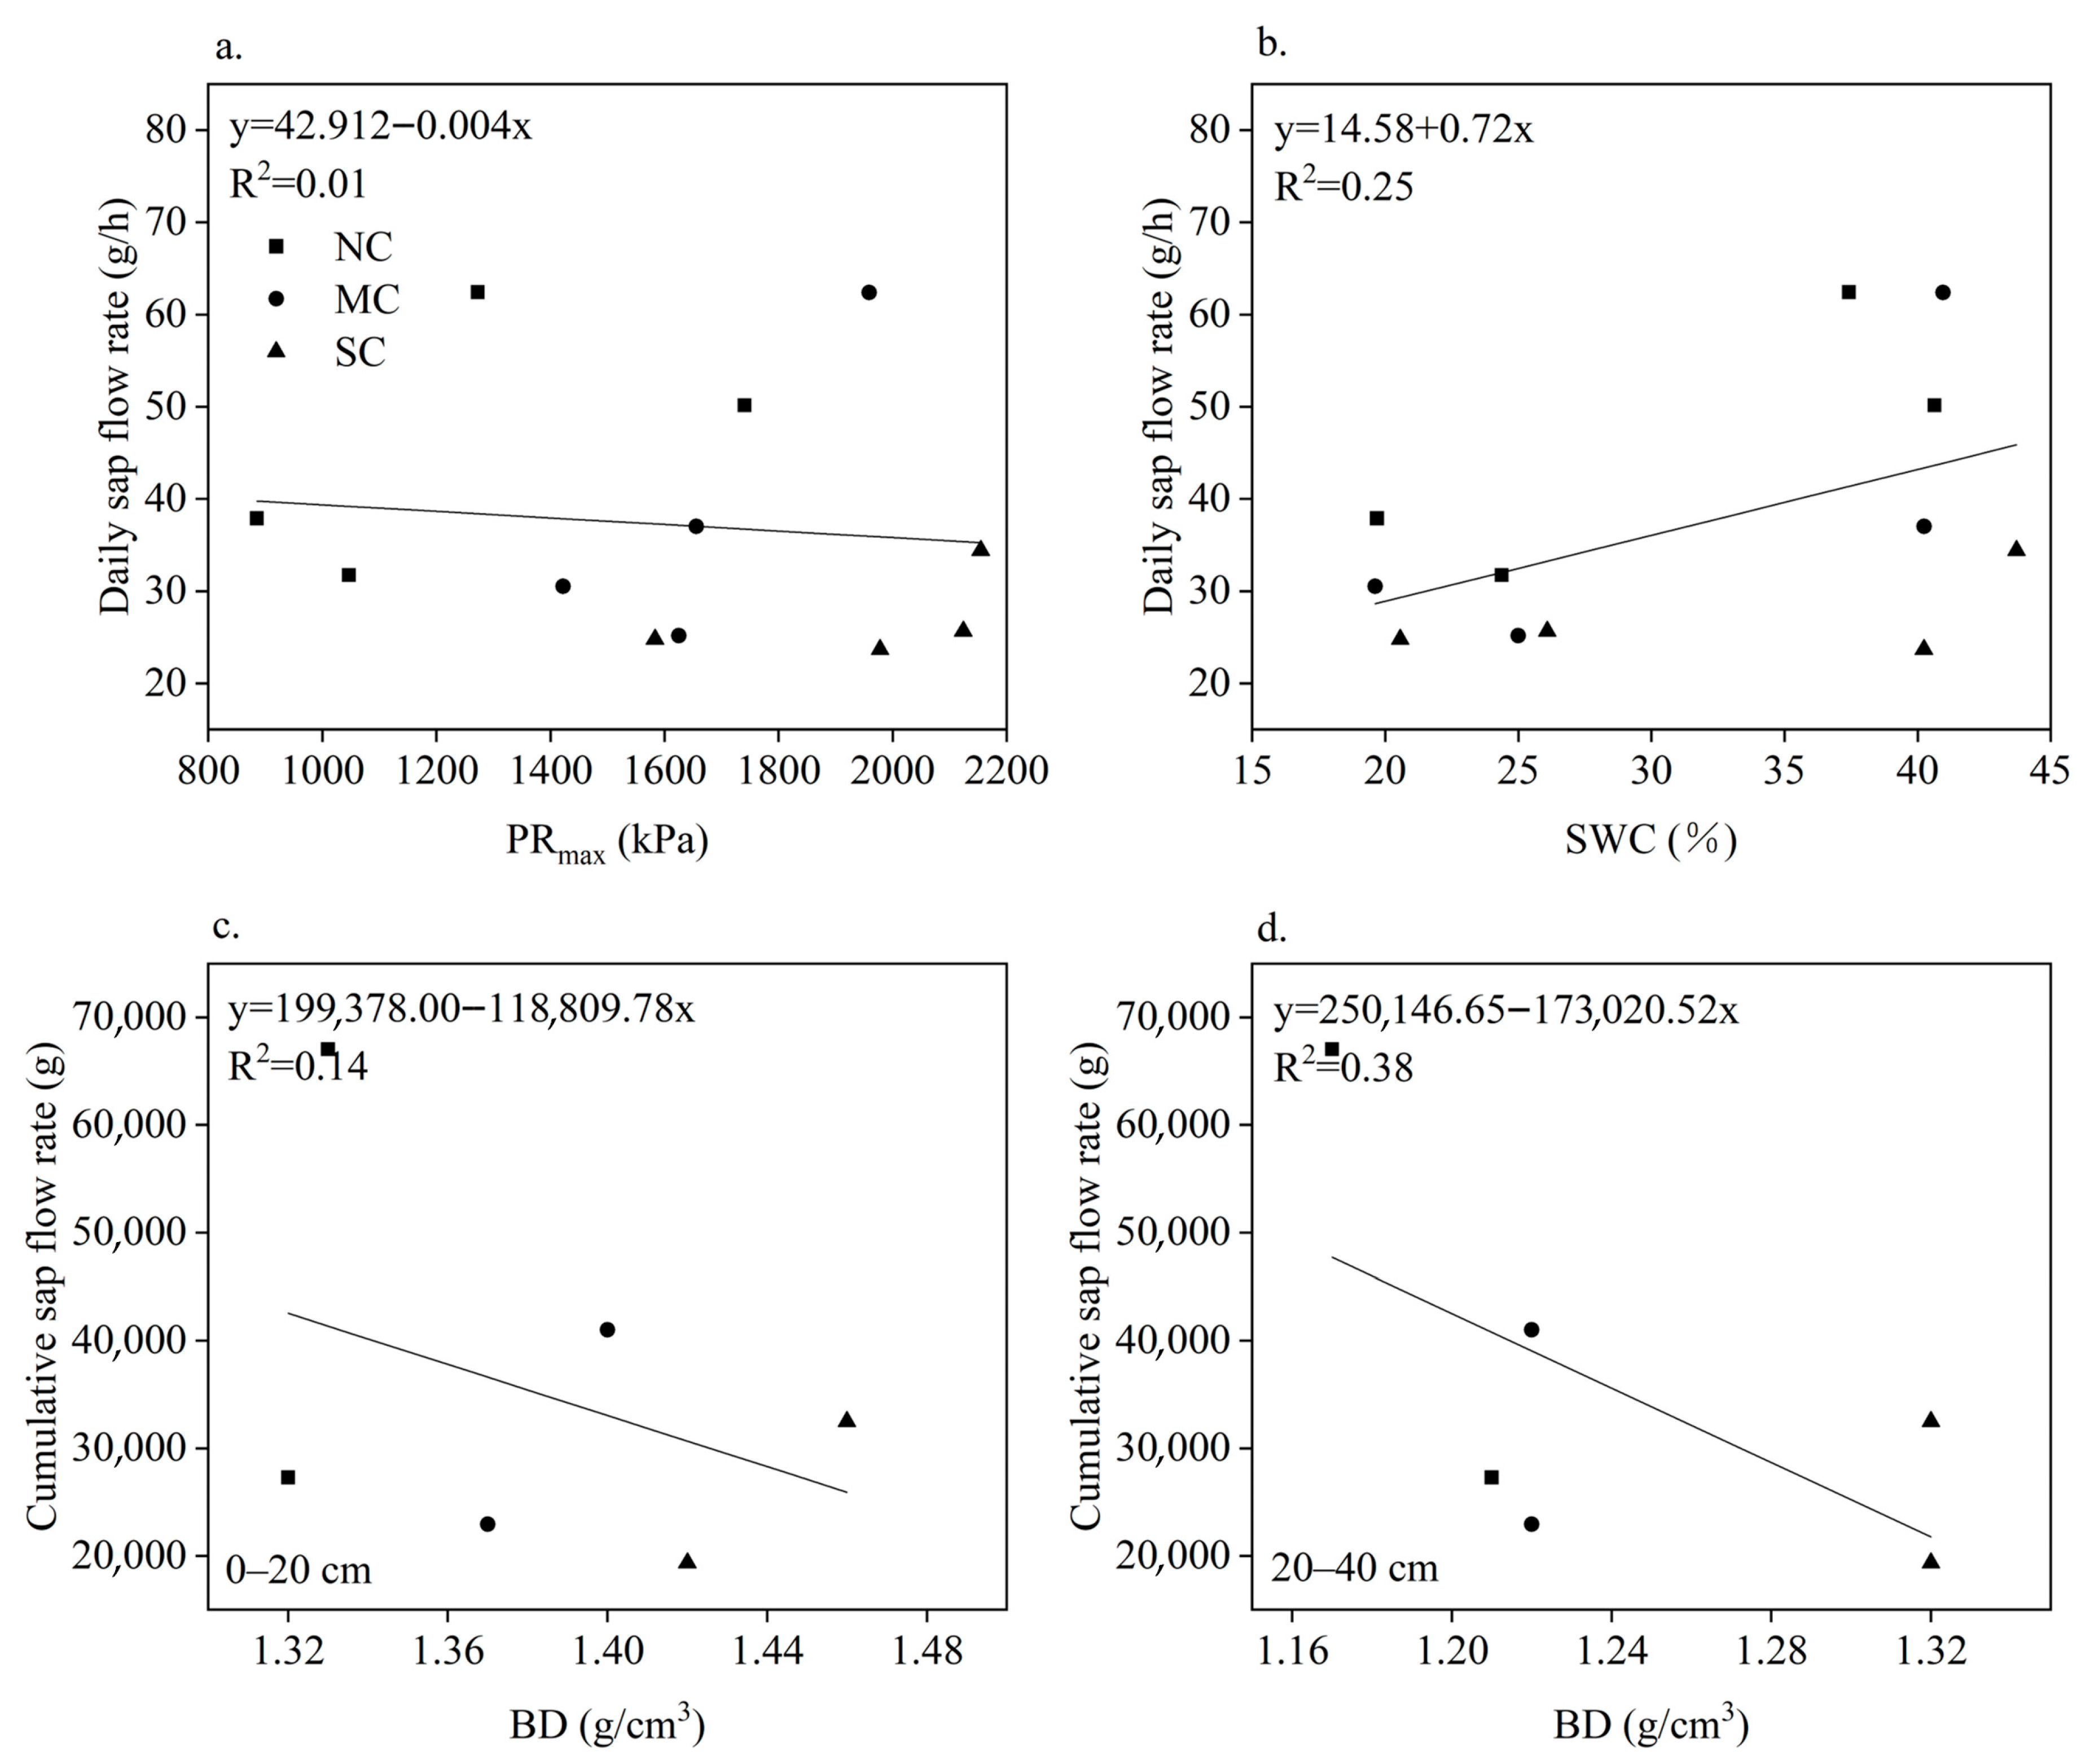
Since root elongation is mainly affected by maximum PR in the soil profile, the mean maximum PR (PRmax) was used to explore the relationship between daily sap flow rate and PR. As shown in Figure 6a, there was a weak negative correlation between daily sap flow rates and PRmax. Due to the maximum rooting depth of all treatments being no more than 60 cm in this study, the SWC of the 0–60 cm soil layer was averaged as the mean SWC. Unlike PRmax, daily sap flow rate was positively correlated with the mean SWC of the 0–60 cm soil layer. To demonstrate the relationship between sap flow rate and BD, the cumulative sap flow rate of the monitoring period was used. The cumulative sap flow rate decreased with the increasing BD in both the top layer and the sub-layer (Figure 6c,d). Additionally, the determination coefficient (R2) between the cumulative sap flow rate and BD in the sub-layer was larger than that in the top layer.

4. Discussion

4.1. Effect of Meteorological Variables on Sap Flow Rate

In our study, sap flow rate had a close correlation with most meteorological variables in both 2023 and 2024 (Table 2 and Figure 4), which was consistent with previous studies [7,11,37]. Similar to many other studies, Rn was the most important meteorological parameter affecting hourly and daily sap flow rate (Table 2). This is mainly because Rn can directly affect the photosynthetic physiological characteristics of crops, thereby regulating the opening and closure of stomata and effectively changing the transpiration rate of crops [40]. From the hourly scale to the daily scale, the absolute values of r between sap flow rate and meteorological variables decreased, which implied that there was a certain timescale effect on the relationship between sap flow rate and meteorological variables. VPD, RH, and Ta were also significantly correlated with hourly sap flow rate, which was in agreement with other observations [1,37]. Additionally, precipitation had a significant limiting effect on sap flow rate (Figure 4a), which was mainly because precipitation was usually accompanied by lower Rn. However, there were no significant differences in correlation coefficient (r) among different soil compaction treatments, which indicated that the relationship between sap flow rate and meteorological variables was independent of the degree of soil compaction.

4.2. Effect of Maize Morphological Variables on Sap Flow Rate Under Different Soil Compaction Treatments

As shown in Figure 3, soil compaction not only had significant effects on shoot performance (such as LAI, stem diameter, and plant height) but also restricted root growth and distribution. Because crop transpiration mainly occurs through the stomata of leaves, sap flow rate is always closely related to LAI [14]. In our study, daily sap flow rate increased linearly with LAI (Figure 5a), which agreed well with the results of Zhang et al. [13] and Jiang et al. [37]. The stem diameter also demonstrated a linear relationship with daily sap flow rate (Figure 5b). And the stem diameter had even higher R2 than LAI with sap flow rate, which was a little different from the results of Jiang et al. [37]. The possible reason for this was that the results of Jiang [37] were based on the data from different growth stages, while our results were mainly based on data from different soil compaction treatments. In their study, the stem diameter remained stable at the maturity stage. By contrast, the stem diameter exhibited considerable variation due to soil compaction in our study (Figure 3b). For plant height, the correlation with daily sap flow rate was not significant (p > 0.05) (Figure 5c). The finding aligns with previous studies, possibly because plant height ceased in the later stage of maize development. However, RLD demonstrated a close relationship with daily sap flow rate (Figure 5d), which confirmed that roots played a critical role in acquiring water for plants.

4.3. Effect of Soil Compaction-Related Properties on Sap Flow Rate Under Different Soil Compaction Treatments

Soil compaction is accompanied by a series of changes in soil physical properties, which ultimately affect the development of plants. In this study, the state of soil compaction was characterized by PR, BD, and SWC, which were closely related to maize growth. Numerous studies have shown that soils with PR greater than 2000 kPa severely restrict root penetration capacity [39,41]. However, there was no significant correlation between daily sap flow rate and PRmax (Figure 6a). The possible explanation is that PR is an integrated parameter influenced by multiple variables and varies greatly with SWC. Conversely, daily sap flow rate was significantly affected by SWC of 0–60 cm soil layer (Figure 6b). Additionally, the cumulative sap flow rate in 2024 was larger than that in 2023 (Figure 4b), which was mainly due to higher SWC in 2024 than in 2023 (Figure 2). The results were consistent with other studies [13,42]. In the top layer, the SWC of MC and SC was higher than that of NC (Figure 2). The possible explanation is that soil compaction enhances crust formation and modifies pore structure, which ultimately reduces soil evaporation. Higher SWC can promote cytokinin synthesis, which suppresses stomatal closure, whereas root-derived ABA accumulation in response to soil drying induces stomatal closure [37]. The negative correlation between cumulative sap flow rate and BD implies that soil compaction can inhibit sap flow rate by modifying soil pore structure.

5. Conclusions

Soil compaction had a pronounced influence on soil properties (BD, Ks, and PR), SWC, maize growth characteristics, and sap flow rate. With the increase in soil compaction stress, sap flow rate significantly decreased during the monitoring period in 2023 and 2024. The relative influence of meteorological variables on daily sap flow rate generally decreased in the order: Rn > VPD > Ta > RH > U2. Additionally, the relationship between sap flow rate and meteorological variables was independent of the level of soil compaction stress. Daily sap flow rate exhibited a strong linear relationship with LAI and stem diameter, but showed no significant correlation with plant height. Additionally, the daily sap flow rate was well correlated with RLD in the 0–60 cm soil layer. These results indicate that LAI, stem diameter, and RLD are good indicators of maize sap flow rate. There was no significant correlation between daily sap flow rate and PRmax, which indicated that PR alone was inadequate for characterizing the state of soil compaction. However, daily sap flow rate was significantly affected by SWC of 0–60 cm soil layer, which suggested that proper soil water content might mitigate the negative effects of soil compaction on sap flow. Moreover, cumulative sap flow rate was negatively correlated with BD in both the top layer and the sub-layer. Owing to the complexity of soil compaction, more systematic characterization of soil compaction, especially in relation to root growth, is needed to explore the underlying mechanisms of it on plant sap flow in the future.

Author Contributions

Conceptualization, X.Z. (Xiangming Zhu); methodology, E.R. and W.P.; software, E.R.; validation, W.P.; investigation, E.R., W.P., X.Z. (Xiangyu Zhao) and T.W.; formal analysis, E.R., W.P. and Q.X.; data curation, E.R. and W.P.; writing—original draft preparation, X.Z. (Xiangming Zhu); writing—review and editing, Q.X.; funding acquisition, X.Z. (Xiangming Zhu). All authors have read and agreed to the published version of the manuscript.

Funding

This research was granted by the National Key Research and Development Program of China (2024YFD1500101), the Strategic Priority Research Program of the Chinese Academy of Sciences (Grant No. XDA28010401), and the International Partnership Program of the Chinese Academy of Sciences (Grant No. 131323KYSB20210004).

Data Availability Statement

The raw data supporting the conclusions of this article will be made available by the authors on request.

Acknowledgments

The authors would like to thank Meiling Fu, Yu Zhang, and Haipeng Lu for their help in the field experiment.

Conflicts of Interest

The authors declare no conflicts of interest.

References

  1. Zhao, L.; He, Z.; Zhao, W.; Yang, Q. Extensive investigation of the sap flow of maize plants in an oasis farmland in the middle reach of the Heihe River, Northwest China. J. Plant Res. 2016, 129, 841–851. [Google Scholar] [CrossRef]
  2. Pieruschka, R.; Huber, G.; Berry, J.A. Control of transpiration by radiation. Proc. Natl. Acad. Sci. USA 2010, 107, 13372–13377. [Google Scholar] [CrossRef] [PubMed]
  3. Zhao, L.; Zhao, W. Canopy transpiration obtained from leaf transpiration, sap flow and FAO-56 dual crop coefficient method. Hydrol. Process. 2014, 29, 2983–2993. [Google Scholar] [CrossRef]
  4. Han, M.; Zhang, H.; DeJonge, K.C.; Comas, L.H.; Gleason, S. Comparison of three crop water stress index models with sap flow measurements in maize. Agric. Water Manag. 2018, 203, 366–375. [Google Scholar] [CrossRef]
  5. Cammalleri, C.; Rallo, G.; Agnese, C.; Ciraolo, G.; Minacapilli, M.; Provenzano, G. Combined use of eddy covariance and sap flow techniques for partition of ET fluxes and water stress assessment in an irrigated olive orchard. Agric. Water Manag. 2013, 120, 89–97. [Google Scholar] [CrossRef]
  6. Zhao, P.; Li, S.; Li, F.; Du, T.; Tong, L.; Kang, S. Comparison of dual crop coefficient method and Shuttleworth–Wallace model in evapotranspiration partitioning in a vineyard of northwest China. Agric. Water Manag. 2015, 160, 41–56. [Google Scholar] [CrossRef]
  7. Hou, L.; Wenninger, J.; Shen, J.; Zhou, Y.; Bao, H.; Liu, H. Assessing crop coefficients for Zea mays in the semi-arid Hailiutu River catchment, northwest China. Agric. Water Manag. 2014, 140, 37–47. [Google Scholar] [CrossRef]
  8. Capurro, M.C.; Ham, J.M.; Kluitenberg, G.J.; Comas, L.; Andales, A.A. A novel sap flow system to measure maize transpiration using a heat pulse method. Agric. Water Manag. 2024, 301, 108963. [Google Scholar] [CrossRef]
  9. Dugas, W.A. Comparative measurement of stem flow and transpiration in cotton. Theor. Appl. Climatol. 1990, 42, 215–221. [Google Scholar] [CrossRef]
  10. Dragoni, D.; Caylor, K.K.; Schmid, H.P. Decoupling structural and environmental determinants of sap velocity: Part II. Observational application. Agric. For. Meteorol. 2009, 149, 570–581. [Google Scholar] [CrossRef]
  11. Liu, B.; Zhao, W.; Jin, B. The response of sap flow in desert shrubs to environmental variables in an arid region of China. Ecohydrology 2011, 4, 448–457. [Google Scholar] [CrossRef]
  12. Xu, X.; Tong, L.; Li, F.; Kang, S.; Qu, Y. Sap flow of irrigated Populus alba var. pyramidalis and its relationship with environmental factors and leaf area index in an arid region of Northwest China. J. For. Res. 2011, 16, 144–152. [Google Scholar] [CrossRef]
  13. Zhang, Y.; Kang, S.; Ward, E.J.; Ding, R.; Zhang, X.; Zheng, R. Evapotranspiration components determined by sap flow and microlysimetry techniques of a vineyard in northwest China: Dynamics and influential factors. Agric. Water Manag. 2011, 98, 1207–1214. [Google Scholar] [CrossRef]
  14. Rankoth, L.M.; Udawatta, R.P.; Gantzer, C.J.; Jose, S.; Nelson, K.A. Cover crop effects on corn plant sap flow rates and soil water dynamics. Crop Sci. 2019, 59, 2227–2236. [Google Scholar] [CrossRef]
  15. He, Y.; Qiu, Z.; Liu, R.; Tang, M.; Wu, P. Impact of mulching on soil moisture and sap flow characteristics of jujube trees. Agronomy 2023, 13, 2799. [Google Scholar] [CrossRef]
  16. Qu, Y.; Kang, S.; Li, F.; Zhang, J.; Xia, G.; Li, W. Xylem sap flows of irrigated Tamarix elongata Ledeb and the influence of environmental factors in the desert region of Northwest China. Hydrol. Process. 2007, 21, 1363–1369. [Google Scholar] [CrossRef]
  17. Xia, G.; Kang, S.; Li, F.; Zhang, J.; Zhou, Q. Diurnal and seasonal variations of sap flow of Caragana korshinskii in the arid desert region of north–west China. Hydrol. Process. 2008, 22, 1197–1205. [Google Scholar] [CrossRef]
  18. Zhang, Z.; Tian, F.; Hu, H.; Yang, P. A comparison of methods for determining field evapotranspiration: Photosynthesis system, sap flow, and eddy covariance. Hydrol. Earth Syst. Sci. 2014, 18, 1053–1072. [Google Scholar] [CrossRef]
  19. Zhu, X.M.; Peng, W.; Ran, E.H.; Fu, M.L.; Zheng, Y.H.; Zhang, Y. Characteristics of spring maize sap flow and its environmental influencing factors in typical mollisol area. Chin. J. Appl. Ecol. 2023, 34, 921–927. [Google Scholar] [CrossRef]
  20. Xiao, D.; Yang, X.; Bai, H.; Tang, J.; Tao, F. Trends and climate response in the yield of staple crops across Northeast China. Front. Sustain. Food Syst. 2024, 7, 1246347. [Google Scholar] [CrossRef]
  21. An, T.; Schaeffer, S.; Zhuang, J.; Radosevich, M.; Li, S.; Li, H.; Pei, J.; Wang, J. Dynamics and distribution of 13 C-labeled straw carbon by microorganisms as affected by soil fertility levels in the Black Soil region of Northeast China. Biol. Fertil. Soils 2015, 51, 605–613. [Google Scholar] [CrossRef]
  22. Tang, Z.; Song, W.; Zou, J. Farmland protection and fertilization intensity: Empirical evidence from preservation policy of Heilongjiang’s black soil. J. Environ. Manag. 2024, 356, 120629. [Google Scholar] [CrossRef]
  23. Keller, T.; Sandin, M.; Colombi, T.; Horn, R.; Or, D. Historical increase in agricultural machinery weights enhanced soil stress levels and adversely affected soil functioning. Soil Tillage Res. 2019, 194, 104293. [Google Scholar] [CrossRef]
  24. Keller, T.; Or, D. Farm vehicles approaching weights of sauropods exceed safe mechanical limits for soil functioning. Proc. Natl. Acad Sci. USA 2022, 119, e2117699119. [Google Scholar] [CrossRef]
  25. He, H.; Dyck, M.F.; Si, B.C.; Zhang, T.; Lv, J.; Wang, J. Soil freezing–thawing characteristics and snowmelt infiltration in Cryalfs of Alberta, Canada. Geoderma Reg. 2015, 5, 198–208. [Google Scholar] [CrossRef]
  26. Starkloff, T.; Larsbo, M.; Stolte, J.; Hessel, R.; Ritsema, C. Quantifying the impact of a succession of freezing-thawing cycles on the pore network of a silty clay loam and a loamy sand topsoil using X-ray tomography. Catena 2017, 156, 365–374. [Google Scholar] [CrossRef]
  27. Mossadeghi-Björklund, M.; Arvidsson, J.; Keller, T.; Koestel, J.; Lamandé, M.; Larsbo, M.; Jarvis, N. Effects of subsoil compaction on hydraulic properties and preferential flow in a Swedish clay soil. Soil Tillage Res. 2016, 156, 91–98. [Google Scholar] [CrossRef]
  28. Obour, P.B.; Schjønning, P.; Peng, Y.; Munkholm, L.J. Subsoil compaction assessed by visual evaluation and laboratory methods. Soil Tillage Res. 2017, 173, 4–14. [Google Scholar] [CrossRef]
  29. Zhu, X.; Peng, W.; Xie, Q.; Ran, E. Effects of soil compaction stress combined with drought on soil pore structure, root system development, and maize growth in early stage. Plants 2024, 13, 3185. [Google Scholar] [CrossRef]
  30. Zhou, M.; Xiao, Y.; Li, Y.; Zhang, X.; Wang, G.; Jin, J.; Ding, G.; Liu, X. Soil quality index evaluation model in responses to six-year fertilization practices in Mollisols. Arch. Agron. Soil. Sci. 2020, 68, 180–194. [Google Scholar] [CrossRef]
  31. Campbell, G.S.; Norman, J.M. An Introduction to Environmental Biophysics; Springer: New York, NY, USA, 1998. [Google Scholar] [CrossRef]
  32. Klute, A. Methods of Soil Analysis. Part 1: Physical and Mineralogical Methods, 2nd ed.; American Society of Agronomy and Soil Science Society of America: Madison, WI, USA, 1986. [Google Scholar] [CrossRef]
  33. Merrill, S.D.; Black, A.L.; Bauer, A.; Upchurch, D.R. Theory of minirhizotron root directionality observation and application to wheat and corn. Soil Sci. Soc. Am. J. 1994, 58, 664–671. [Google Scholar] [CrossRef]
  34. Liao, R.; Bai, Y.; Liang, H.; An, S.; Ren, S.; Cao, Y.; Le, Z.; Lu, J.; Liu, J. Root growth of maize as studied with minirhizotrons and monolith methods. Arch. Agron. Soil. Sci. 2015, 61, 1343–1356. [Google Scholar] [CrossRef]
  35. Zhou, C.; Gu, D.; Zhao, P.; Huang, K.; He, W.; Yao, Y.; Zhu, L.; Huang, Y. Effect of sap flow radial variation on daily transpiration estimation of Eucalyptus urophylla× Eucalyptus grandis. Chin. J. Appl. Ecol. 2017, 28, 2445–2451. [Google Scholar] [CrossRef]
  36. Luo, H.; Dewitte, K.; Landschoot, S.; Sigurnjak, I.; Robles-Aguilar, A.A.; Michels, E.; Neve, S.D.; Haesaert, G.; Meers, E. Benefits of biobased fertilizers as substitutes for synthetic nitrogen fertilizers: Field assessment combining minirhizotron and UAV-based spectrum sensing technologies. Front. Environ. Sci. 2022, 10, 988932. [Google Scholar] [CrossRef]
  37. Jiang, X.; Kang, S.; Li, F.; Du, T.; Tong, L.; Comas, L. Evapotranspiration partitioning and variation of sap flow in female and male parents of maize for hybrid seed production in arid region. Agric. Water Manag. 2016, 176, 132–141. [Google Scholar] [CrossRef]
  38. Dynamax Flow 32-1K Sap Flow System. Available online: https://dynamax.com/products/transpiration-sap-flow/flow32-1k-sap-flow-system (accessed on 14 January 2016).
  39. Bengough, A.G.; McKenzie, B.M.; Hallett, P.D.; Valentine, T.A. Root elongation, water stress, and mechanical impedance: A review of limiting stresses and beneficial root tip traits. J. Exp. Bot. 2011, 62, 59–68. [Google Scholar] [CrossRef] [PubMed]
  40. Si, J.; Feng, Q.; Yu, T.; Zhao, C. Nighttime sap flow and its driving forces for Populus euphratica in a desert riparian forest, Northwest China. J. Arid Land. 2015, 7, 665–674. [Google Scholar] [CrossRef]
  41. Oliveira, P.D.; Sato, M.K.; Lima, H.V.; Rodrigues, S.; Silva, A.P. Critical limits of the degree of compactness and soil penetration resistance for the soybean crop in N Brazil. J. Plant Nutr. Soil Sci. 2016, 179, 78–87. [Google Scholar] [CrossRef]
  42. Chen, D.; Wang, Y.; Liu, S.; Wei, X.; Wang, X. Response of relative sap flow to meteorological factors under different soil moisture conditions in rainfed jujube (Ziziphus jujuba Mill.) plantations in semiarid Northwest China. Agric. Water Manag. 2014, 136, 23–33. [Google Scholar] [CrossRef]
Figure 1. Dynamic changes in penetration resistance (PR) during the monitoring period of 2023 and 2024. Note: No compaction (NC), moderate compaction (MC), and severe compaction (SC).
Agriculture 15 01911 g001
Figure 2. Dynamic changes in soil water content (SWC) in 0–80 cm soil layers during the monitoring period of 2023 and 2024. Note: No compaction (NC), moderate compaction (MC); and severe compaction (SC).
Agriculture 15 01911 g002
Figure 3. Dynamic changes in (a) leaf area index (LAI), (b) stem diameter, (c) plant height, and (d) root length density (RLD) during the monitoring period of 2023 and 2024. Note: No compaction (NC); moderate compaction (MC); and severe compaction (SC). Different letters indicate a significant difference between compaction stress treatments in the same soil layer at p < 0.05.
Agriculture 15 01911 g003
Figure 4. Dynamic changes in (a) daily sap flow rate and precipitation, (b) cumulative sap flow rate, (c) net radiation (Rn) and VPD, and (d) relative humidity (RH) and air temperature (Ta). Note: No compaction (NC); moderate compaction (MC); and severe compaction (SC).
Agriculture 15 01911 g004
Figure 5. Relationships among daily sap flow rate and (a) LAI, (b) stem diameter, (c) plant height, and (d) RLD. Note: No compaction (NC); moderate compaction (MC); and severe compaction (SC).
Agriculture 15 01911 g005
Figure 6. Relationships among (a) daily sap flow rate and maximum penetration resistance (PRmax), (b) daily sap flow rate and soil water content (SWC), (c) cumulative sap flow rate and bulk density (BD) in 0–20 cm soil layer, and (d) cumulative sap flow rate and BD in 20–40 cm soil layer. Note: No compaction (NC); moderate compaction (MC); and severe compaction (SC).
Agriculture 15 01911 g006
Table 1. Soil bulk density (BD) and saturated hydraulic conductivity (Ks) in the 0–20 and 20–40 cm soil layers under different compaction levels in 2023 and 2024.
YearSoil Layer (cm)TreatmentsBD (g cm−3)Ks (10−2 cm min−1)
20230–20NC1.32 ± 0.02 b13.79 ± 0.11 a
MC1.37 ± 0.02 ab0.16 ± 0.03 b
SC1.42 ± 0.01 a0.10 ± 0.04 b
20–40NC1.21 ± 0.01 b7.70 ± 0.05 a
MC1.22 ± 0.01 b0.29 ± 0.08 b
SC1.32 ± 0.02 a0.06 ± 0.01 c
20240–20NC1.33 ± 0.04 b7.53 ± 0.73 a
MC1.40 ± 0.01 ab0.11 ± 0.00 b
SC1.46 ± 0.02 a0.04 ± 0.00 b
20–40NC1.17 ± 0.02 b7.60 ± 0.44 a
MC1.22 ± 0.03 b0.33 ± 0.01 b
SC1.32 ± 0.03 a0.02 ± 0.00 c
Note: No compaction (NC), moderate compaction (MC), and severe compaction (SC). Different letters indicate a significant difference between compaction stress treatments in the same soil layer at p < 0.05.
Table 2. Correlation coefficients (r) between sap flow rate and meteorological factors in 2023 and 2024.
YearTime ScaleTreatmentsU2
(m s−1)
Ta
(°C)
RHVPD
(kPa)
Rn
(W m−2)
N
2023HourlyNC0.412 **0.693 **–0.703 **0.817 **0.886 **936
MC0.363 **0.622 **–0.624 **0.747 **0.865 **
SC0.395 **0.628 **–0.660 **0.758 **0.902 **
DailyNC–0.1410.573 **–0.325 *0.649 **0.851 **39
MC–0.1520.525 **–0.347 *0.666 **0.874 **
SC–0.0710.510 **–0.441 **0.754 **0.885 **
2024HourlyNC0.411 **0.586 **–0.646 **0.747 **0.886 **1344
MC0.344 **0.613 **–0.526 **0.688 **0.870 **
SC0.408 **0.590 **–0.662 **0.786 **0.918 **
DailyNC–0.2150.579 **–0.2540.584 **0.892 **56
MC–0.2170.747 **–0.0450.333 *0.800 **
SC–0.2020.562 **–0.2650.600 **0.886 **
Note: No compaction (NC); moderate compaction (MC); and severe compaction (SC). Wind speed at 2 m height (U2); air temperature (Ta); relative humidity (RH); vapor pressure deficit (VPD); net radiation (Rn); sample number (N). The symbols * and ** show significant correlations at p < 0.05 and at p < 0.01, respectively.
Disclaimer/Publisher’s Note: The statements, opinions and data contained in all publications are solely those of the individual author(s) and contributor(s) and not of MDPI and/or the editor(s). MDPI and/or the editor(s) disclaim responsibility for any injury to people or property resulting from any ideas, methods, instructions or products referred to in the content.