Abstract
The article focuses on verifying the potential of using cellulose obtained from waste cardboard to improve the soil’s water retention capacity, depending on its texture and type, in accordance with the principles of the circular economy. The study compares reference cellulose (RFC) and waste carton-extracted cellulose (WCC) in terms of their structure and water-holding capacity (WHC), using FTIR spectroscopy and experiments across various soil types. Results showed that WCC has a significantly higher WHC (12.6 g/g) than RFC (0.75 g/g) due to its greater proportion of amorphous sections and the presence of lignin and hemicellulose. In contrast, the high crystalline content of RFC limits its water sorption capabilities. Soil texture and soil organic matter (SOM) play a crucial role in water retention. The highest WHC values were observed in fine-grained soils classified as silt loam. The study confirms that SOM has a stronger influence on WHC than texture alone. Applying WCC led to a linear increase in WHC across different soil types. Even soils with initially low WHC showed notable improvement with low doses of WCC (1%). The findings highlight the potential of waste carton-extracted cellulose as a soil amendment to enhance water retention in agricultural soils, especially in adapting to climate variability and drought conditions.
1. Introduction
Climate change is causing shifts in both the intensity and distribution of precipitation and temperature, which negatively affect the physical properties of soil [1]. Agriculture is intricately connected with the climate—it impacts climatic patterns and is highly susceptible to their variability. One of the main manifestations of climate stress is erosion due to torrential rainfall and the subsequent loss of soil fertility. The lack of moisture for plant growth, referred to as agricultural drought, accelerates soil degradation and poses a major obstacle to the development of sustainable farming practices.
Measures to mitigate the adverse impacts of drought were adopted in the Czech Republic on 24 July 2017, by Government Resolution No. 528/2017. Agricultural land in the Czech Republic covers more than 50% of the country’s total area, forestry landscapes account for 34%, water bodies make up 2%, and built-up areas comprise 11% [2]. While droughts in the past were primarily caused by a lack of precipitation, rising temperatures and the associated increase in evaporation now play a key role. The soil’s inability to retain water threatens agricultural productivity and is unsustainable in the long term. Soil water-holding capacity (WHC) refers to the soil’s ability to retain moisture and indicates how much water a given soil type can hold per gram of its mass [3].
One of the most effective strategies to enhance WHC is increasing the content of organic matter, which significantly improves soil moisture retention. The amount of soil organic matter is influenced by both natural soil development and farming practices. WHC is a critical hydraulic property affecting ecosystem soil functionality [4]. It is primarily determined by porosity, pore size and distribution, organic matter content, and soil texture [5], while factors like pH and microbial activity also play important roles [6].
Increasing the soil’s water-holding capacity (WHC) can be achieved by adding suitable amendments, especially in light sandy soils [7]. Effective organic additives include compost, bark, and manure, with WHC values ranging from 0.83 to 1.51 g of water per gram of material. Biochar is another promising option, though its effectiveness depends on the source material and production technology [8]. Cellulose also positively affects soil structure, porosity, and compaction reduction [9]. Beyond these benefits, its application influences additional physical and mechanical soil properties, such as strength improvement and extended water infiltration duration [10]. Some authors also report increased resistance to wind erosion when cellulose or cellulose fibres from natural sources are applied to soils [11,12].
The water-holding capacity (WHC) of pure cellulose ranges from 0.40 to 1.0 g of water per 1 g of cellulose, depending on its type, particle size, chemical modification, and degree of crystallinity. Higher WHC values, between 3.5 and 10 g of water per 1 g of cellulose, have been observed in longer fibres [13]. Similarly, Mat Zain et al. [14] report a value of 8.9 ± 0.2 g/g. The amorphous phase of cellulose binds more water than its crystalline phase.
Cellulose derivatives, such as carboxymethyl cellulose (CMC), exhibit increased WHC due to the presence of ionic groups. CMC enhances the hydraulic properties of soil by retaining water and gradually releasing moisture [15]. In sandy soils, it also promotes particle aggregation and improves water retention [16]. Cellulose nanofibres (CNFs) contribute to improved soil water retention, reduce evaporation, and support soil aggregate stability [17]. WHC values of CNFs range from 20 to 30 g of water per 1 g of CNFs [18]. This exceptional water-holding ability is mainly due to hydrophilic molecular groups and the unique particle morphology of CNFs, which facilitates efficient water absorption. Even a 1% CNFs addition significantly increases soil WHC [18].
This study aims to verify the potential of using cellulose obtained from waste cardboard to improve the WHC of agricultural soils. The novelty of this study lies in three key contributions that distinguish it from existing research on improving soil water-holding capacity (WHC):
- I.
- Innovative use of waste cardboard (WCC) as a cellulose source for agriculture: Utilisation of fibrous cellulose prepared from waste cardboard using a simple, low-cost, and environmentally friendly technology. This approach supports circular economy principles and offers a practical solution for converting common municipal waste into a valuable soil amendment.
- II.
- Comparative analysis of physical and structural properties: the research provides a detailed comparison between cellulose derived from WCC and commercially available microcrystalline cellulose, highlighting how production processes influence water retention capabilities.
- III.
- First systematic evaluation of WCC’s impact on WHC across diverse soil types: Unlike previous studies that focused on cellulose derivatives or paper sludge [19,20,21], this work is the first to quantify the effect of direct WCC application on soils with varying texture, type, and organic matter content. Laboratory results show that even a modest 1% addition of WCC leads to a statistically significant increase in WHC (average of 8.2 ± 1.6%), demonstrating its potential to enhance soil resilience against drought.
2. Materials and Methods
2.1. Materials
2.1.1. Soil Samples
Soil samples were collected from the eastern part of the Czech Republic (Figure 1). The geological structure of this area (Moravia) consists of crystalline rocks of the Bohemian Massif and Paleozoic sediments in the west, and sedimentary rocks of the Western Carpathians (Cretaceous to Paleogene) in the east. These two units are separated by the Carpathian Foredeep, filled with Tertiary sediments and covered in the north by glacial deposits (Pleistocene).
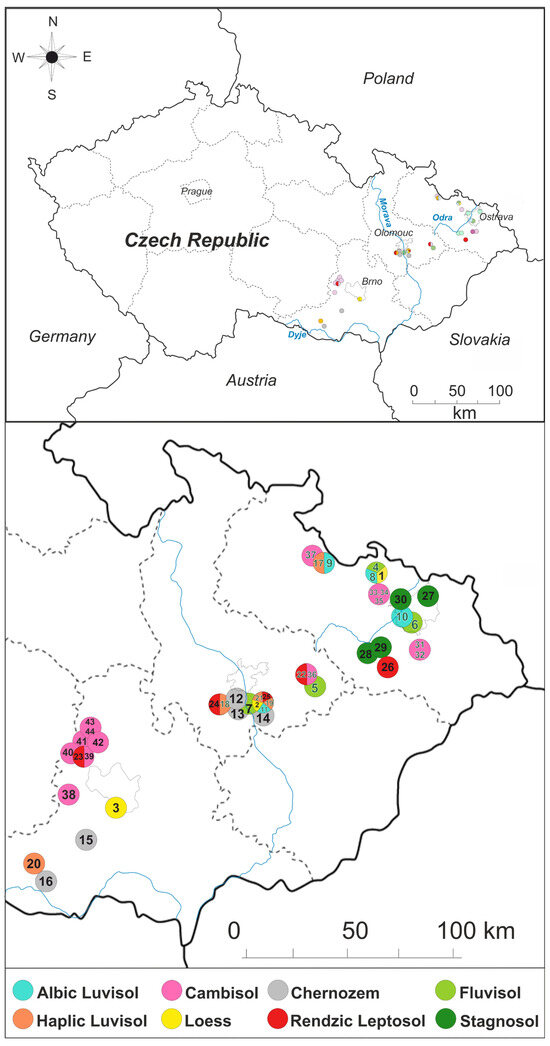
Figure 1.
Sampling locations in the Moravia area. A solid black number indicates a sample containing only one soil horizon. A green number with a white outline signifies a sample with both A and B horizons.
The most widespread agricultural soil types in this region are Cambisols, which account for up to 45% of the analysed area, followed by Haplic Luvisols (12.7%), Chernozems (11.3%), Fluvisols (5.9%), Albic Luvisols (5.1%), and Rendzic Leptosols (3.7%). Samples were collected to cover all major soil units in the region. Additionally, three samples of loess (aeolian clastic sediments), which form the geological substrate in a large part of the studied area, were included (Supplementary Table S1).
A total of 63 samples were analysed (60 soils + 3 loess). Cambisols used for agricultural purposes were most represented (11 samples), followed by forest Cambisols (10), Haplic Luvisols (9), Albic Luvisols (8), Fluvisols (7), Chernozems (5), Stagnosols (4), Rendzic Leptosols under agricultural use (4), and forest Rendzic Leptosols (2). The locations of sampling sites are shown in Figure 1. Table S1 includes additional information such as coordinates, geological substrate, and cultivated crops.
2.1.2. Cellulose
The cellulose sample was prepared from waste cardboard (WCC) supplied by SMOLO (Třinec, Czech Republic), a company specialising in waste management. The cardboard was cut into smaller pieces (approx. 1 cm). To remove carbonates—making up approximately 10–12% of the cardboard filler—a mixture of 20 g of cardboard and 500 mL of 0.12 M acetic acid (CH3COOH) (Penta Chemicals Unlimited, Prague, Czech Republic) solution was used. Decomposition was carried out in a Vorwerk Thermomix TM6 device (Vorwerk Engineering, Wuppertal, Germany) for one minute. The sample was rinsed with distilled water, and cellulose was then separated by centrifugation at 8000 rpm using a Beckman Avanti JXN-26 centrifuge (Beckman Coulter, Brea, CA, USA). Cellulose purity—especially the removal of dyes, adhesives, and other additives—was verified using the TD-GC-MS method (Gerstel GmbH & Co. KG, Mülheim an der Ruhr, Germany). The total concentrations of 66 identified organic compounds in the cardboard were 8.34 ± 1.27 g/kg. After extraction with 0.2 M acetic acid (CH3COOH) followed by rinsing with distilled water (AQUAL 25, MERCI s.r.o., Brno, Czech Republic), the concentrations of organic compounds in the separated cellulose decreased to 1.66 g/kg, representing an 80% reduction. Of these compounds, only eight, which were detected in the WCC, were originally present in the raw carton sample. Three compounds were likely formed during the extraction process via acetylation, while 19 compounds were released from the original carton matrix and presumably adsorbed onto the liberated cellulose fibres. For comparison, reference cellulose (RFC) from MERCK-Supelco, SU-22182 (Merck KGaA, Darmstadt, Germany) (cellulose acid washed, from spruce for column chromatography), was used.
2.2. Methods
2.2.1. Sampling of Soil and Preparation for Soil Analysis
The trial pit method was selected for soil sampling, performed by hand digging to a depth of approximately 0.5 m, allowing separate collection of samples from the A and B horizons. This approach was chosen to ensure that material from the humus-enriched horizon could be obtained, which was essential for assessing the impact of waste cellulose addition on water-holding capacity (WHC). Collected samples were air-dried in the laboratory at room temperature and homogenised. Particles larger than 2 mm (gravel) were removed by sieving using a RETSCH AS 200 Basic laboratory sieve shaker (Retsch GmbH, Haan, Germany).
2.2.2. Methods Used for Soil Analysis
To determine soil organic matter (SOM), the standardised method “EN 15935—Soils, Waste, Treated Biowaste and Sludge: Loss on Ignition” [22] was applied. Each sample was analysed twice, and the average value was used. SOM content was determined by measuring the weight loss of the dry soil matter after ignition at 550 °C. Before SOM analysis, the dry matter content of the soil samples was established according to “EN 15934—Sludge, Treated Biowaste, Soils and Waste: Calculation of Dry Matter Based on Residue after Drying or Moisture Content” [23].
The concentration of soil organic carbon () was calculated from using the Formula (1) provided by Nelson and Sommers [24]:
Cation exchange capacity (CEC), the total capacity of the soil to retain and exchange cations, was determined according to “EN ISO 11260 (836225)—Soil Quality: Determination of Cation Exchange Capacity and Exchangeable Cations Using a Barium Chloride Solution at Soil pH” [25].
The maximum water-holding capacity of the soil was determined according to “ISO 14238, Annex A” [26]. WHC refers to the amount of hygroscopic, film-bound, and capillary water that soil can retain under natural conditions within its capillary pores. The principle involves saturating the sample with water, followed by passive water loss until equilibrium is reached. WHC is calculated based on the difference in mass, considering the dry matter content. The relative measurement error was <3%.
A glass tube with an inner diameter of 20 mm and a length of 100 mm was sealed at the bottom using filter paper and weighed to determine the tare mass (mT). The tube was then filled with soil to a depth of 5–7 cm, corresponding to approximately 30 g of soil. The filled tube was reweighed (ms) and placed upright on a rack in a water bath. Water was gradually added until the level rose above the top of the soil column but remained below the upper rim of the tube. The sample was left to saturate for approximately three hours. To remove gravitational water that cannot be retained by capillary forces, the tube was subsequently placed for two hours on a layer of very wet, finely ground quartz sand to allow drainage. The sample was then dried at 105 °C to constant mass and reweighed to determine the dry mass of the substrate (). The water-holding capacity (WHC) was calculated using the following Formula (2):
where water-holding capacity, expressed as a percentage of dry mass, %; mass of water-saturated soil plus the mass of the tube plus the mass of the filter paper, in grams; tare (mass of tube plus mass of filter paper), in grams; and is the dry mass of substrate, in grams.
To ensure uniform distribution of fibrous cellulose within the soil matrix prior to WHC determination, a mixture of 28.5 g of air-dried soil and 1.5 g of fibrous cellulose (average fibre length ~3 mm) was prepared. The soil was lightly moistened to approximately 5–10% of its dry weight to reduce dust and improve fibre adhesion. The components were initially blended manually in a wide laboratory dish using a spatula to disperse the fibres evenly throughout the soil. The pre-mixed sample was then transferred into a sealed container and subjected to mechanical homogenisation using an orbital shaker (IKA KS 130 basic, IKA®-Werke GmbH & Co. KG Staufen im Breisgau, Germany) at 250–400 rpm for 15–30 min. This step ensured thorough mixing without damaging the fibrous structure. Due to the fibre length, sieving was not performed, as it would have excluded cellulose from the mixture and compromised sample integrity. The homogenised substrate was then used for subsequent WHC measurements.
Samples were prepared by manual homogenisation without subsequent moisture equilibration. The soil compaction density in the tubes corresponded to natural laboratory compaction without mechanical pressure, in order to simulate typical conditions, such as those following ploughing.
WHC determination was performed twice for each soil sample. If the relative difference between the results exceeded 5%, a third measurement was conducted. The Supplement presents the average value. The WHC error (<3%), reported in Section 2.2.2, was determined based on 10 repetitions of a single sample (Cambisol 35A) to assess method variability.
Due to the expected higher heterogeneity of soil samples following WCC addition, WHC determination was carried out in three replicates. The Supplement includes the corresponding standard deviation values. The coefficient of variation for the 5% WCC addition ranged from 1.81% to 9.28%, with an average value of 5.45%.
After removing particles >2 mm, particle size distribution was analysed using a MALVERN laser granulometer Mastersizer 2000 (Malvern Panalytical Ltd, Malvern, Worcestershire, United Kingdom), following “ISO 13320:2020-Particle Size Analysis—Laser Diffraction Methods” [27]. Results were evaluated according to European soil classification systems, primarily in a geotechnical context according to “EN ISO 14688-2:2017” [28]. They correspond to the requirements of the “Directive of the European Parliament and Council on Soil Monitoring and Resilience (P9 TA (2024) 0204)” [29]. Soil particle size fractions were defined as: clay < 0.002 mm, silt 0.002–0.063 mm, and sand 0.063–2 mm.
Soil texture classification was based on analysis results presented in the summary table (Table S1) and visualised using the soil texture triangle created with specialised software.
2.2.3. Methods for Cellulose Analysis
Analysis of Merck-Supelco cellulose (Merck KGaA, Darmstadt, Germany) included particle size measurement using laser diffraction. The separated cellulose particle size was evaluated using scanning electron microscopy SEM; model FEI Quanta-650 FEG (FEI Company, Hillsboro, OR, USA). Elemental composition (carbon, hydrogen, and oxygen) was determined using a Thermo Scientific FlashSmart Elemental Analyzer (Thermo Fisher Scientific, Waltham, MA, USA). Methionine OAS (Cat. No. B2045 & B2100, Certificate No. 444723, supplied by Elemental Microanalysis Ltd, Okehampton, UK) was used as the standard.
The chemical composition of both the cardboard-derived and commercial cellulose samples was analysed using an FTIR spectrometer (FT-IR Nicolet 6700 Thermo Scientific). Measurements using the ATR technique were performed in the spectral range of 4000 cm−1 to 525 cm−1 with a resolution of 4 cm−1. Each sample was scanned 64 times, and the resulting spectra were compared.
To identify organic compounds (micropollutants) originating from cardboard production, virgin wood, printing inks, solvents, and adhesives, a thermal desorption method coupled with gas chromatography–mass spectrometry (TD-GC-MS) was employed. The method is described in Růžičková et al. [30].
The crystallinity index of cellulose () quantifies the relative proportion of crystalline regions within a cellulose sample as compared to amorphous domains. This parameter is widely used to assess the structural organisation of cellulose. was calculated based on the intensity of the characteristic diffraction signals, according to the following relationship (3) [31]:
where corresponds to the maximum intensity of the crystalline peak, typically observed near 2θ ≈ 22°, representing the ordered cellulose structure, and denotes the minimum intensity between diffraction peaks, generally near 2θ ≈ 18°, reflecting the contribution of amorphous cellulose.
Crystallinity analysis was performed using a Bruker AXS D8 Advance diffractometer with a θ/2θ geometry and equipped with a LynxEye position-sensitive semiconductor detector (Bruker AXS GmbH, Karlsruhe, Germany). The system utilised a CuKα radiation source with a Ni filter, operated at 35 kV and 35 mA. Measurements were conducted in step-scan mode with a step size of 0.014° 2θ. Peak deconvolution was performed using the Pearson VII (PVII) function to separate crystalline and amorphous contributions. For X-ray diffraction analysis, a cellulose tablet was prepared from WCC by compression moulding using a Trystom H–62 press (Trystom spol. s r.o., Olomouc, Czech Republic). The pressing procedure lasted 30 min, during which the pressure was gradually increased to 30 kN, in increments of 10 kN every 10 min. This process yielded a compact cellulose tablet with a diameter of 24 mm and a thickness of approximately 1–2 mm, using a sample mass of 0.5 g.
3. Results and Discussion
3.1. Cellulose
The commercial product cellulose Merck-Supelco (RFC) has a median particle size of d(05) 136.35 µm, d(01) 33.6 µm, and d(09) 304.43 µm. The fibre size of WCC is determined by sample disintegration and ranges from 0.88 to 5.93 mm, with an average fibre length of 2.87 ± 1.38 mm and a fibre width ranging from 0.05 to 0.21 mm, with an average value of 0.11 ± 0.04 mm.
Elemental analysis (Table 1) shows that cellulose obtained from cardboard contains 1% more carbon than commercial cellulose, which is compensated by an increase in oxygen. WCC more closely resembles the concentration calculated from the chemical formula of cellulose (C6H10O5)n. The particle characteristics of WCC are illustrated in Figure 2.

Table 1.
Comparison of the basic parameters of commercial cellulose Merck-Supelco (RFC)and cellulose obtained from cardboard (WCC).
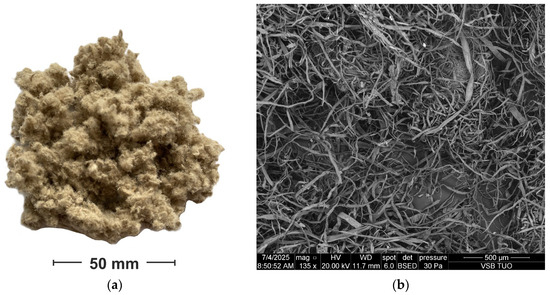
Figure 2.
(a) Fibrous nature of the separated cellulose from cardboard, WCC; (b) fibres documented in a scanning electron microscope.
3.1.1. FTIR Analysis
FTIR spectra of WCC and RFC show strong similarities in regions characteristic of cellulose structures; however, they differ in the presence of bands indicating lignin, hemicellulose, or other impurities in the cardboard sample (Table 2). Both samples have absorption bands in the regions 3300–3340 cm−1 (O–H stretching of hydroxyl groups), 2900 cm−1 (C–H aliphatic vibrations), and especially within the range 1030–1160 cm−1, where C–O and C–O–C vibrations typical of glucopyranose units of cellulose occur [32,33].
A distinct diagnostic feature of the reference cellulose is the absorption band at a wavenumber of ~896 cm−1, attributed to the out-of-plane deformation of the β-1,4-glycosidic bond (C1–O–C4) within the ring structure of cellulose. This band is widely recognised as a marker of native cellulose type I [32,34]. In the WCC spectrum, this band is absent, which may indicate partial degradation or modification of the crystalline structure due to chemical or mechanical processing. On the other hand, the WCC spectrum displays specific bands that are not present in the reference cellulose spectrum. The band at ~1730 cm−1 is associated with C=O stretching vibrations of ester or carboxyl groups and may indicate residual hemicellulose, lignin, or adhesives [32]. Another prominent band around 1600 cm−1 corresponds to aromatic C=C vibrations and is commonly linked to the presence of lignin. In the 2340–2360 cm−1 region, an absorption band was detected that is attributed to asymmetric CO2 vibrations, which may originate from atmospheric contamination or impurities in the paper material [35].
Table 2.
Characteristic wavenumbers of the FTIR spectra of cellulose (RFC—reference cellulose Merck-Supelco, WCC—cellulose obtained from cardboard).
Table 2.
Characteristic wavenumbers of the FTIR spectra of cellulose (RFC—reference cellulose Merck-Supelco, WCC—cellulose obtained from cardboard).
| Wavenumber (cm−1) | Vibrations/Functional Groups | Occurrence | Reference |
|---|---|---|---|
| 896 | Vibrations of β-glycosidic bonds | RFC | [32,33,34] |
| 1030 | C–O (polysaccharides) → C–O bond vibrations in polysaccharides | WCC, RFC | [32,33,34] |
| 1105 | C–O (primary alcohol—C6) → C–O stretching vibration of the primary alcohol group at carbon position 6 | WCC, RFC | [32,33] |
| 1160 | C–O–C (β-1,4 glycosidic bond) → C–O–C stretching vibration of the β-1,4 glycosidic linkage | WCC, RFC | [32,33,34,36] |
| 1600 | C=C (aromatic vibrations—lignin) → C=C stretching vibrations of aromatic rings in lignin | WCC | [32,35] |
| 1730 | C=O (carboxyl / ester) → C=O stretching vibration of carboxyl and ester groups | WCC | [32,34,35] |
| 2340–2360 | CO2 asymmetric stretch (contamination/fillers) → Asymmetric stretching vibration of CO2 (indicative of contamination or filler presence) | WCC | [34,35,36] |
| 2900 | C–H (aliphatic chain) → C–H stretching vibrations of aliphatic chains | WCC, RFC | [32,33] |
| 3300–3340 | O–H (hydroxyl groups) → O–H stretching vibration of hydroxyl functional groups | WCC, RFC | [32,33,36] |
Based on the intensity ratios of selected functional group absorption bands relative to the reference C–O–C band (~1050 cm−1), relative values were calculated (e.g., 1730/1050 ≈ 0.997 and 1600/1050 ≈ 1.003). These ratios confirm a significant presence of ester and aromatic structures in the WCC sample (Table 3). In mildly acidic conditions, esterification may occur, for example, the formation of cellulose acetate under the influence of acetic acid [37].
Table 3.
Selected absorption band intensity ratios for identifying cellulose crystallinity.
In contrast, the lower ratio of 896/1050 in WCC indicates reduced crystallinity and a higher amorphous fraction compared to the highly ordered structure of the RFC sample.
3.1.2. Crystallinity of Cellulose
The resulting CrI value serves as an indicator of cellulose’s degree of crystallinity. The results presented in Table 1 indicate that RFC exhibits a higher crystallinity index (CrI) than WCC, reflecting more ordered microfibrillar arrangements. The lower crystallinity of WCC was also confirmed by FTIR analysis (Table 3). This structural distinction helps explain the high value of water-holding capacity (WHC) observed in WCC, as its lower crystallinity implies a predominance of amorphous regions capable of accommodating more hydrogen bonding sites and physical water retention.
3.1.3. Water-Holding Capacity of Cellulose
A significantly higher WHC (Water-Holding Capacity) value was observed in the WCC sample compared to RFC (see Table 1). This difference can be attributed to the higher content of amorphous regions and lower crystallinity of WCC (Table 3). The amorphous structure of cellulose tends to retain more water, as polymer chains are looser and more accessible to water molecules. The presence of amorphous or paracrystalline domains can greatly contribute to the increased WHC value [39]. FTIR analysis results of WCC further confirm the presence of aromatic structures corresponding to lignin (Table 2), which may also support greater water retention capacity due to their hydrophilic nature. The WHC value is also influenced by the physical structure of the fibres. Cardboard-derived cellulose may exhibit higher porosity or a larger surface area than commercial crystalline cellulose; additionally, the fibre structure may allow for water retention between individual fibrils, similar to the function of a sponge. Nishimura and Otsuka [40] report that sulphated cellulose can achieve a WHC increase of up to 3000% due to its swollen fibre structure. Although acetic acid does not produce such a pronounced effect, it can also cause partial swelling of the fibres or changes in cellulose microstructure, leading to the opening of amorphous regions and subsequent WHC enhancement.
To monitor the effect of WCC addition on water-holding capacity (WHC), two soil types with different organic matter content were used as follows: Stagnosol (sample No. 30) and forest Cambisol (sample No. 31). Various concentrations of cellulose (0%, 1%, 2.5%, 5%, and 10%) in the form of WCC and RFC were added to these samples. In Stagnosols, WHC increased linearly with the addition of both cellulose types. In contrast, the forest soil already exhibited a high WHC value without any additive (1.9 g/g), and its increase after applying 5% WCC was lower (50%) than in Stagnosol (60%). For RFC, a linear trend was observed only up to a concentration of 5%. At higher amounts, WHC growth halted and even decreased in the forest Cambisols. The maximum WHC increase at a 5% addition of RFC reached 15% in both soil types. This effect was also observed in another matrix, compost. Its WHC (2.45 g/g) increased by 23% after adding 5% WCC, whereas RFC caused only a 9% increase. A linear relationship between the amount of WCC and the WHC increase was confirmed here as well.
The lower efficiency of RFC at higher concentrations may be related to changes in soil structure, such as a reduction in capillary space, which limits the soil’s ability to retain water. Another factor is the high crystallinity of RFC, which reduces structural flexibility and decreases the available volume for water sorption.
Crystalline regions of cellulose are inaccessible to water; interactions occur only via polar groups within the amorphous domains [41]. While WCC, due to its amorphous and paracrystalline character, enables greater sorption, RFC at higher doses reaches saturation of sorption sites, resulting in a decline in effectiveness [42].
3.2. Soils
3.2.1. Soil Texture
Soil texture significantly influences its ability to retain water (WHC). As particle fineness increases, water-holding capacity also increases in the following order: sand < loam < silt < clay. For soil classification based on particle size, the USDA soil texture triangle was used (Figure 3). Of all analysed samples, 73% were classified as silt loam, which is characterised by a high proportion of silt particles (54% were agricultural soils and 19% forest soils). Another 21% of soils were classified as silt, and only 6% as sandy loam.
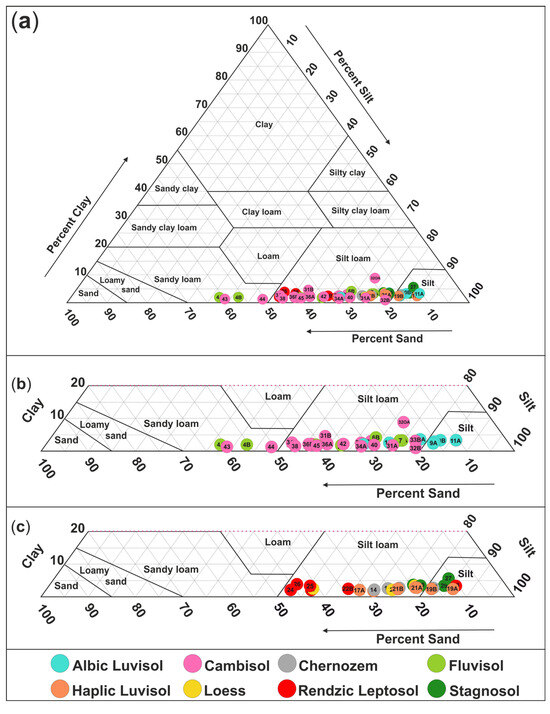
Figure 3.
(a) Analysed samples in the USDA soil texture triangle; (b) detailed USDA soil texture triangle for Cambisols, Fluvisols, and Albic Luvisols; (c) detailed USDA soil texture triangle for Rendzic Leptosols, Haplic Luvisols, Chernozems, Stagnosols, and loess.
3.2.2. Soil Organic Matter and Water-Holding Capacity
One of the key parameters influencing water-holding capacity (WHC) is the amount of soil organic matter (SOM) [6]. SOM can retain water up to 20 times its weight, primarily through two mechanisms: (i) physical binding of soil particles by fungal mycelium, which forms stable aggregates, and (ii) chemical activity of natural organic polymers, which bind mineral particles and enhance soil water retention capacity [5,43]. These processes improve soil structure and support the formation of soil aggregates, significantly increasing water retention. The organic carbon content (SOC) in agricultural soils in the Czech Republic ranges widely from 0.60% C to 3.23% C, corresponding to approximately 1.03% to 5.56% soil organic matter [44], with an average value of 1.96% [45]. The highest SOM values (Figure 4) were found in Rendzic Leptosols (11.41 ± 1.71%), influenced by high levels of organic acids and intensive humification, as well as the possible formation of calcium–humate complexes [46]. This was followed by Chernozem (6.28 ± 1.24% SOM), Fluvisols, Haplic Luvisols, and Cambisols containing comparable SOM levels (5.64%), while the lowest SOM content was recorded in Albic Luvisols (3.09 ± 1.30% SOM).
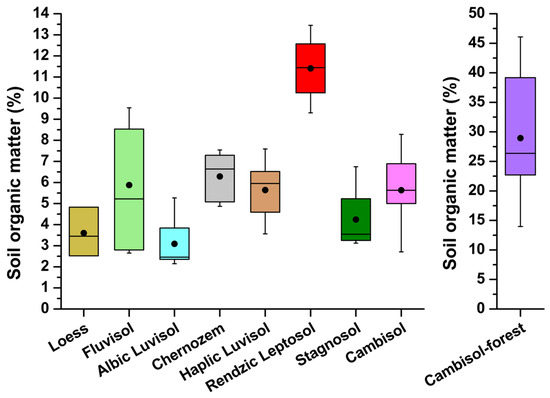
Figure 4.
Box plot of soil organic matter concentrations for individual soil types.
WHC values are relatively consistent across the dataset. The average for arable soil reaches 0.46 ± 0.07 g/g, while forest Cambisols exhibit nearly double that value at approximately 0.92 ± 0.52 g/g. The highest WHC (Figure 5) is shown by Rendzic Leptosols (0.60 ± 0.12 g/g), and Chernozems present a slightly higher value than other soil types at 0.50 ± 0.11 g/g. For Chernozems, the measured WHC falls within the range of 0.4 to 0.6 g of water per 1 g of dry soil, corresponding with the data reported by Bekhovykh et al. [47]. These values are influenced by factors such as soil structure, compaction level, and organic matter content.
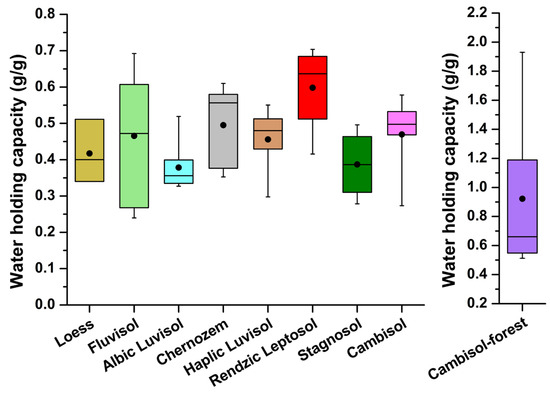
Figure 5.
Water-holding capacity box plot.
A statistically significant positive correlation between soil organic matter content (SOM) and water-holding capacity (WHC) was confirmed across the entire dataset of analysed soils, with a Pearson correlation coefficient of r = 0.94 (α = 0.05; n = 63). A similarly significant linear relationship was found for agricultural soils, though with a lower correlation coefficient of r = 0.84 (α = 0.05; n = 51). In cases where the clay fraction is low, organic matter plays a primary role in soil water retention [48,49]. In the analysed soils, clay content was very low, ranging from 0.75% to 5.71%, with a mean value of 2.59 ± 1.14%. For the study of SOM dependency, the entire dataset was divided into two groups based on SOM content: >10% and <10%. The <10% SOM group included 51 samples, while the >10% group (mostly forest soils) comprised 12 samples. This threshold was based on (i) the natural distribution of the analysed samples, where mineral agricultural soils predominantly contained <10% SOM, while forest soils and organic-rich soils exceeded this value, and (ii) soil classification criteria (e.g., United States Department of Agriculture—Natural Resources Conservation Service; International Union of Soil Sciences—World Reference Base for Soil Resources), which often use ~10–12% SOM as a boundary between mineral and organic soil properties. Regression diagnostics showed a significant change in the slope of the WHC–SOM relationship above this threshold, indicating an increased effect of SOM on WHC in organic-rich soils, consistent with previous reports [48,49]. The impact of SOM on WHC is not uniformly linear across the full range—at higher SOM values, the effect intensifies. In soils with very high organic matter content, water retention capacity is markedly enhanced (Figure 6).
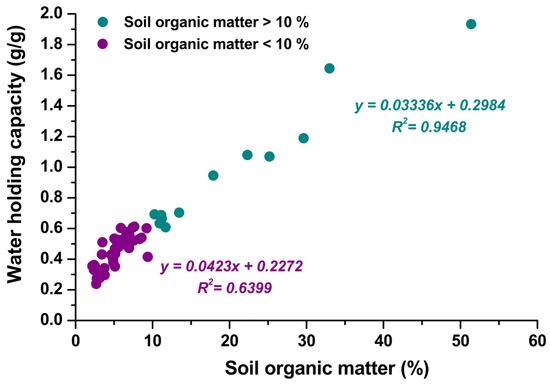
Figure 6.
The relationship between water-holding capacity and soil organic matter grouped by SOM content.
The increase in WHC with rising SOM concentration is illustrated by the box plot (Figure 7). According to the literature, a 1% increase in SOM enhances available water-holding capacity (AWHC) by 1 to 5% depending on the nature of the SOM and soil texture [49]. These findings are derived from the USDA Natural Resources Conservation Service (NRCS) soils database. AWHC represents the portion of water that is accessible to plant roots and is always lower than total WHC. The average WHC increase for soils containing 3% to >8% SOM was 10.59 ± 6.83%. SOM levels also influenced the WHC rise following WCC addition. The most significant WHC increase was observed in soils with <3% SOM, averaging up to 175%, whereas the lowest increase, up to a maximum of 100%, occurred in soils with >7% SOM.
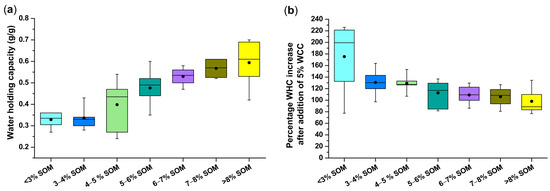
Figure 7.
(a) Variation in water-holding capacity (WHC) values across soils with different soil organic matter (SOM) content; (b) percentage increase in WHC following the addition of 5% waste carton-extracted cellulose (WCC) to soils.
The benefit of WCC addition is more pronounced in soils with low organic matter content (SOM), as it introduces new sorption sites previously lacking in the substrate. Owing to its amorphous structure rich in polar functional groups, WCC significantly enhances the soil’s water retention capacity. In contrast, soils with high SOM already possess a substantial number of sorption sites, and therefore the additional contribution of cellulose has a limited effect. These results align with findings by [7], who reported that the magnitude of the effect of SOM additives is lower when the substrate has a previous high water-holding capacity. Furthermore, structural changes such as a reduction in capillary volume or saturation of sorption domains may further diminish the efficiency of WCC supplementation. The highest increase in WHC after cellulose addition was observed in soils with SOM content below 3%.
3.2.3. Soil Texture and WHC
According to the available literature, soil texture significantly affects water-holding capacity (WHC) [5], with WHC increasing as clay content rises [6]. However, in terms of available water-holding capacity (AWHC), silt content shows a statistically stronger correlation with AWHC than clay [49]. Sandy soils exhibit low WHC values: for sandy loam, AWHC ranges between 0.18 and 0.23 g/g; for silt loam, 0.35–0.45 g/g; and silt, 0.28–0.42 g/g [50]. WHC values vary significantly with the texture of agricultural soils. In the analysed dataset, the highest average WHC was found in soils classified as silt loam (0.52 ± 0.08 g/g). This high water retention value relates to the fine texture and optimal pore distribution that support capillary retention. Silt soils showed moderate water retention (0.34 ± 0.03 g/g), while sandy loam exhibited the lowest WHC (0.26 ± 0.02 g/g), reflecting the dominance of coarse particles and rapid water infiltration. Within the silt loam group, Rendzic Leptosols were distinct, reaching the highest organic matter content (SOM) of 11–13% (Figure 8). Differences in average values across soil types are attributed to variations in SOM content. A statistically significant positive correlation between SOM and WHC was also confirmed within the agricultural silt loam group (r = 0.82, α = 0.05, n = 33) and in forest soils (r = 0.98, α = 0.05, n = 12). In contrast, for soils classified as silt (SOM = 3.20 ± 1.00%) and sandy loam (SOM = 2.79 ± 0.15%), no statistically significant correlation between SOM and WHC was observed. These findings suggest that SOM’s impact on WHC is not universal but only becomes evident beyond a specific threshold concentration and in conjunction with a texture that provides a suitable microstructure. In this study, we evaluated the maximum water-holding capacity (WHC) determined after full saturation followed by gravitational drainage. This parameter does not allow for the derivation of the complete soil water retention curve (SWRC), nor does it enable calculation of the available water-holding capacity (AWHC), defined as the difference between field capacity (FC) and wilting point (WP). Therefore, our interpretation of WCC effects is limited to the enhancement of overall water retention rather than a direct quantitative assessment of drought adaptation potential.
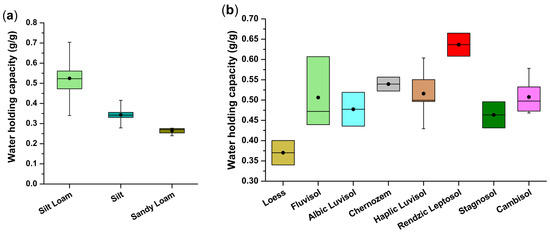
Figure 8.
(a) Influence of soil texture on water-holding capacity (WHC); (b)WHC values for individual agricultural soil types classified as silt loam.
The addition of 5% cellulose (WCC) to soils led to an increase in water-holding capacity (WHC) above 1.00 g/g, except for Albic Luvisols and Stagnosols, where WHC remained below this threshold (Figure 9). The collected data indicate that SOM content significantly affects the WHC increase after WCC application. The percentage increase in WHC following 5% WCC supplementation across different soil types can be described in terms of SOM content using the following second-degree polynomial regression Equation (4):
where x represents SOM content in %.
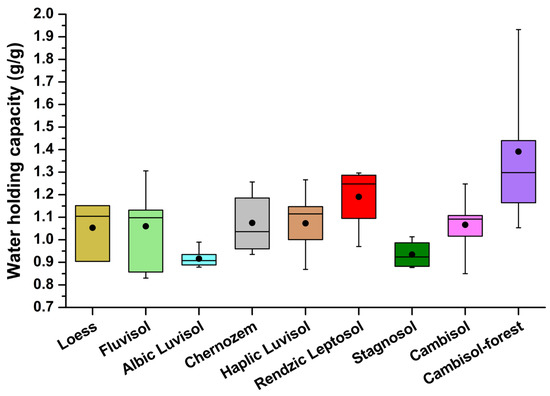
Figure 9.
Water-holding capacity values after 5% waste carton-extracted cellulose addition across individual soil types.
This equation demonstrates that the soil’s response to WCC addition is non-linear. Initially, WHC increases with rising SOM concentration, but beyond a certain threshold (typically >5% SOM), the effectiveness of WCC supplementation may be attenuated. It corresponds with the observation that soils such as Albic Luvisols and Stagnosols did not exceed WHC values of >1.00 g/g following WCC application (Figure 8), likely due to lower initial sorption capacity or a distinct pore structure configuration.
The lowest average SOM content was observed in soils classified as Albic Luvisols and Stagnosols (0.32–0.36 g/g). Following the addition of 1% WCC, WHC increased to 0.52–0.59 g/g, corresponding to a gain of 0.23 g/g (>60% improvement). These findings indicate that even a 1% WCC amendment in Albic Luvisols and Stagnosols can raise WHC to 0.45–0.50 g/g, which, according to Hudson [50], is considered an excellent water-holding capacity for agricultural soils. The WHC value of 0.59 g/g achieved after WCC application is above-standard and, from a drought mitigation perspective, entirely sufficient—especially in soils initially showing WHC values below 0.35 g/g. In our study, the addition of 1% WCC increased the maximum water-holding capacity (WHC) after saturation in Albic Luvisol/Stagnosol soils by more than 60% compared to the control variant. However, WHC also includes water that is inaccessible to plants (e.g., retained in micropores), and therefore does not directly correspond to available water (AWHC), which is critical for agronomic evaluation.
The study by Ngo et al. [51] demonstrated that the addition of 1% cellulose nanofibres (CNFs) increased soil volumetric moisture, extended water availability for up to 22 days, and simultaneously improved plant-available water (PAW) in both sandy and loamy soils. Although CNFs exhibit different physicochemical properties compared to conventional WCC, the results of this study suggest the potential of low doses of cellulose-based materials to enhance water availability. Moreover, the authors reported positive effects on crop growth and irrigation water use efficiency under water deficit conditions. A 1% WCC addition proves adequate, as excessive WHC can have adverse effects. Excessive water retention may lead to soil saturation, limited oxygen access to roots, and reduced microbial activity, thereby negatively impacting soil health [52].
In soil environments, longer cellulose fibres can contribute to the formation of macropores and improve structural stability. However, excessive macropore formation may reduce water retention due to increased drainage. In contrast, shorter fibres tend to intermix more effectively with fine-grained soils, enhancing microporosity and thereby improving the soil’s capacity to retain water.
3.2.4. Cation Exchange Capacity
Cation exchange capacity (CEC) refers to the ability of soil to bind and retain nutrients in the form of positively charged ions such as Ca2+, Mg2+, K+, Na+, and others. The relationship between soil hygroscopic moisture and CEC was described by Torrent et al. [53]. The measured CEC values for individual soil types (Figure 10) are consistent with the ranges provided by the USDA, except for Chernozems and Rendzic Leptosols. In our dataset, values are markedly higher, likely influenced by the elevated soil organic matter (SOM) content and, in Rendzic Leptosols, by the presence of reactive CaCO3. The highest CEC levels were observed in the following order: silt loam > silt > sandy loam, as a higher clay fraction increases the negative charge [54].
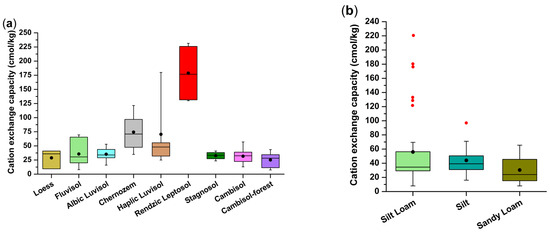
Figure 10.
(a) Cation exchange capacity values for individual soil types and loess; (b) cation exchange capacity values by soil texture classification.
After excluding extreme cation exchange capacity (CEC) values (CEC > 100 cmol/kg), the relationship between soil organic matter (SOM), water-holding capacity (WHC), and clay fraction was analysed using multiple linear regression, resulting in the following Equation (5):
where is the intercept, representing baseline at zero values for all variables.
Model statistics: Coefficient of determination (R2) = 0.74 (explaining 74% of WHC variability); p-values: SOM < 0.0001; CEC = 0.018; particle concentration < 2 µm = 0.0004.
The model indicates that SOM contributes most to WHC, followed by clay-sized particles (<2 µm), and finally CEC. Notably, a 1% increase in SOM raises WHC by approximately 0.028 g/g.
4. Conclusions
FTIR analysis confirmed structural differences between reference cellulose (RFC) and cellulose derived from waste cardboard (WCC). WCC exhibits a higher proportion of amorphous regions, as well as the presence of lignin and hemicellulose. These features contribute to significantly higher water-holding capacity (WHC) compared to RFC, whose high crystallinity limits sorption capacity, especially at higher concentrations.
Soil texture plays a critical role in WHC; the highest values were measured in soils classified as silt loam, while sandy loam soils showed substantially lower WHC due to coarser texture and rapid infiltration. Soil organic matter (SOM) significantly affects WHC. WCC addition enhanced WHC across all soil types, including those with low SOM. Soils with initially low retention capacity—such as Albic Luvisols and Stagnosols—showed >60% improvement in WHC with just a 1% WCC amendment. Based on laboratory measurements of WHC after saturation, it can be stated that low doses of WCC (e.g., 1%) may significantly increase the overall water retention capacity of certain soils with low organic matter content. Although the results suggest potential for improving soil water dynamics, their impact on available water (AWHC) and crop yield requires further verification under field conditions.
The results demonstrate that combining favourable texture and SOM content with cellulose-based additives can markedly enhance soil water retention. Validation of WCC potential in the context of drought management requires targeted measurements of available water-holding capacity (AWHC) and long-term field yield trials.
Although the short-term effects of WCC application on soil structure and porosity were evaluated, the present study does not quantify decomposition dynamics, potential nitrogen immobilisation, or microbial responses. These factors may significantly influence long-term soil health and nutrient cycling. Their absence represents a limitation of this study and highlights the need for future field-based research to assess the sustainability of WCC use in agricultural systems.
Supplementary Materials
The following supporting information can be downloaded at: https://www.mdpi.com/article/10.3390/agriculture15171880/s1. Table S1: Basic soil properties of the analysed samples from different locations.
Author Contributions
Conceptualization, H.R. and K.R.; methodology, H.R., K.R., M.Š., D.M. and P.K.; software, M.K., D.M. and B.Š.; validation, H.R. and K.R.; formal analysis, M.Š., M.K. and B.Š.; investigation, H.R. and M.Š.; resources, H.R.; data curation, P.K. and K.R.; writing—original draft, K.S., K.R., H.R. and M.Š.; writing—review and editing, K.S. and K.R.; visualisation, M.K. and B.Š.; supervision, H.R. and K.R. All authors have read and agreed to the published version of the manuscript.
Funding
This publication was supported by the National Centre for Energy II, project TN02000025/001N—Innovative Solutions for Sustainable Energy and the project The European Just Transition Fund supported this work within the Operational Programme Just Transition under the aegis of the Ministry of the Environment of the Czech Republic, project CirkArena, number CZ.10.03.01/00/22_003/0000045.
Institutional Review Board Statement
Not applicable.
Data Availability Statement
The original contributions presented in this study are included in the article/Supplementary Material. Further inquiries can be directed to the corresponding author.
Conflicts of Interest
The authors declare no conflicts of interest.
Abbreviations
The following abbreviations are used in this manuscript:
| ATR | Attenuated total reflectance |
| AWHC | Available water-holding capacity |
| CEC | Cation exchange capacity |
| CMC | Carboxymethyl cellulose |
| CNFs | Cellulose nanofibres |
| CrI | Crystallinity index of cellulose |
| FTIR | Fourier-transform infrared spectroscopy |
| NRCS | Natural Resources Conservation Service |
| OAS | Organic analytical standard |
| RFC | Reference cellulose |
| SEM | Scanning electron microscopy |
| SOC | Soil organic carbon |
| SOM | Soil organic matter |
| TD-GC-MS | Thermal desorption–Gas chromatography–Mass spectrometry |
| USDA | United States Department of Agriculture |
| WCC | Waste carton-extracted cellulose |
| WHC | Water-holding capacity |
References
- Kang, M.W.; Yibeltal, M.; Kim, Y.H.; Oh, S.J.; Lee, J.C.; Kwon, E.E.; Lee, S.S. Enhancement of Soil Physical Properties and Soil Water Retention with Biochar-Based Soil Amendments. Sci. Total Environ. 2022, 836, 155746. [Google Scholar] [CrossRef]
- Bednář, M.; Pavelková, R.; Netopil, P.; Šarapatka, B. Czech Farmers’ Perspectives on Sustainable Agriculture and Water Management: Implications for Climate Change Adaptation. Agric. Water Manag. 2025, 313, 109470. [Google Scholar] [CrossRef]
- Blažka, P.; Fischer, Z. Moisture, Water Holding, Drying and Wetting in Forest Soils. Open J. Soil Sci. 2014, 4, 174–184. [Google Scholar] [CrossRef]
- Werner, W.J.; Sanderman, J.; Melillo, J.M. Decreased Soil Organic Matter in a Long-term Soil Warming Experiment Lowers Soil Water Holding Capacity and Affects Soil Thermal and Hydrological Buffering. J. Geophys. Res. Biogeosciences 2020, 125, e2019JG005158. [Google Scholar] [CrossRef]
- Lin, H.; Duan, X.; Dong, Y.; Zhong, R.; Rong, L.; Huang, J. Responses of Soil Water-Holding Capacity to Environmental Changes in Alpine Ecosystems across the Southern Tibetan Plateau in the Past 35–40 Years. Catena 2023, 222, 106840. [Google Scholar] [CrossRef]
- Nelson, J.T.; Adjuik, T.A.; Moore, E.B.; VanLoocke, A.D.; Ramirez Reyes, A.; McDaniel, M.D. A Simple, Affordable, Do-It-Yourself Method for Measuring Soil Maximum Water Holding Capacity. Commun. Soil Sci. Plant Anal. 2024, 55, 1190–1204. [Google Scholar] [CrossRef]
- Paradelo, R.; Basanta, R.; Barral, M.T. Water-Holding Capacity and Plant Growth in Compost-Based Substrates Modified with Polyacrylamide, Guar Gum or Bentonite. Sci. Hortic. 2019, 243, 344–349. [Google Scholar] [CrossRef]
- Adhikari, S.; Timms, W.; Mahmud, M.A.P. Optimising Water Holding Capacity and Hydrophobicity of Biochar for Soil Amendment—A Review. Sci. Total Environ. 2022, 851, 158043. [Google Scholar] [CrossRef]
- Fu, F.; Luo, J.; Zhao, L.; Yang, F.; Wang, N. Impact of Cellulose and Lignin on Restoration of Vegetation and Soil Chemical Properties for Saline-Alkali Soil of Songnen Plain. PLoS ONE 2024, 19, e0296366. [Google Scholar] [CrossRef] [PubMed]
- Sujatha, E.R.; Kannan, G. An Investigation on the Potential of Cellulose for Soil Stabilization. Sustainability 2022, 14, 16277. [Google Scholar] [CrossRef]
- Ishak, M.I.S.; Al Manasir, Y.; Nor Ashikin, N.S.S.; Md Yusuff, M.S.; Zuknik, M.; Abdul Khalil, H.P.S. Application of Cellulosic Fiber in Soil Erosion Mitigation: Prospect and Challenges. BioResources 2021, 16, 4474–4522. [Google Scholar]
- Owji, R.; Habibagahi, G.; Nikooee, E.; Afzali, S.F. Wind Erosion Control Using Carboxymethyl Cellulose: From Sand Bombardment Performance to Microfabric Analysis. Aeolian Res. 2021, 50, 100696. [Google Scholar] [CrossRef]
- Ang, J.F. Water Retention Capacity and Viscosity Effect of Powdered Cellulose. J. Food Sci. 1991, 56, 1682–1684. [Google Scholar] [CrossRef]
- Mat Zain, N.F.; Mohamad Yusop, S.; Ahmad, I. Preparation and Characterization of Cellulose and Nanocellulose from Pomelo (Citrus Grandis) Albedo. J. Nutr. Food Sci. 2015, 5, 34213. [Google Scholar] [CrossRef]
- Shao, F.; Zeng, S.; Wang, Q.; Tao, W.; Wu, J.; Su, L.; Yan, H.; Zhang, Y.; Lin, S. Synergistic Effects of Biochar and Carboxymethyl Cellulose Sodium (CMC) Applications on Improving Water Retention and Aggregate Stability in Desert Soils. J. Environ. Manag. 2023, 331, 117305. [Google Scholar] [CrossRef]
- Zheng, M.; Mu, W.; Wang, Q.; Zhang, J.; Bai, Y.; Sun, Y.; Lu, Z.; Wei, X. Case Study on the Effects of Sodium Carboxymethyl Cellulose and Biostimulants on Physiological and Photosynthetic Characteristics, Yield, and Quality of Apples. Agronomy 2024, 14, 1403. [Google Scholar] [CrossRef]
- Barajas-Ledesma, R.M.; Hossain, L.; Wong, V.N.L.; Patti, A.F.; Garnier, G. Effect of the Counter-Ion on Nanocellulose Hydrogels and Their Superabsorbent Structure and Properties. J. Colloid Interface Sci. 2021, 599, 140–148. [Google Scholar] [CrossRef]
- Ngo, A.T.; Mori, Y.; Bui, L.T. Effects of Cellulose Nanofibers on Soil Water Retention and Aggregate Stability. Environ. Technol. Innov. 2024, 35, 103650. [Google Scholar] [CrossRef]
- Räty, M.; Termonen, M.; Soinne, H.; Nikama, J.; Rasa, K.; Järvinen, M.; Lappalainen, R.; Auvinen, H.; Keskinen, R. Improving Coarse-Textured Mineral Soils with Pulp and Paper Mill Sludges: Functional Considerations at Laboratory Scale. Geoderma 2023, 438, 116617. [Google Scholar] [CrossRef]
- Rasa, K.; Tähtikarhu, M.; Miettinen, A.; Kähärä, T.; Uusitalo, R.; Mikkola, J.; Hyväluoma, J. A Large One-Time Addition of Organic Soil Amendments Increased Soil Macroporosity but Did Not Affect Intra-Aggregate Porosity of a Clay Soil. Soil Tillage Res. 2024, 242, 106139. [Google Scholar] [CrossRef]
- Keskinen, R.; Nikama, J.; Kostensalo, J.; Räty, M.; Rasa, K.; Soinne, H. Methodological Choices in Size and Density Fractionation of Soil Carbon Reserves—A Case Study on Wood Fiber Sludge Amended Soils. Heliyon 2024, 10, e24450. [Google Scholar] [CrossRef]
- EN 15935:2021; Sludge, Treated Biowaste, Soil and Waste—Determination of Loss on Ignition. CEN: Brussels, Belgium, 2021.
- EN 15934:2012; Sludge, Treated Biowaste, Soil and Waste—Calculation of Dry Matter Fraction after Determination of Dry Residue or Water Content. CEN: Brussels, Belgium, 2012.
- Nelson, D.W.; Sommers, L.E. Total Carbon, Organic Carbon, and Organic Matter. In Methods of Soil Analysis, Part 3: Chemical Methods; Soil Science Society of America; American Society of Agronomy: Madison, WI, USA, 1996; pp. 961–1010. ISBN 978-0-89118-894-5. [Google Scholar]
- ISO 11260:2018; Soil Quality—Determination of Effective Cation Exchange Capacity and Base Saturation Level Using Barium Chloride Solution. ISO: Geneva, Switzerland, 2018.
- ISO 14238:2012; Soil Quality—Biological Methods—Determination of Nitrogen Mineralization and Nitrification in Soils and the Influence of Chemicals on These Processes. ISO: Geneva, Switzerland, 2012.
- ISO 13320:2020; Particle Size Analysis—Laser Diffraction Methods. 2nd ed. ISO: Geneva, Switzerland, 2020.
- ISO 14688-2:2017; Geotechnical Investigation and Testing—Identification and Classification of Soil—Part 2: Principles For a Classification. 2nd ed. ISO: Geneva, Switzerland, 2017.
- European Parliament and Council of the European Union. P9_TA(2024)0204—Soil Monitoring and Resilience (Soil Monitoring Directive). Official Journal of the European Union, C 2025/1312. 13 March 2025. [Google Scholar]
- Růžičková, J.; Raclavská, H.; Kucbel, M.; Pfeifer, C.; Juchelková, D.; Hrbek, J.; Šafář, M.; Slamová, K.; Švédová, B.; Kantor, P. Incidence and Spread of Additives from Co-Combustion of Plastic Waste in Domestic Boilers in Indoor and Outdoor Environments around the Family House. Energy 2023, 285, 129357. [Google Scholar] [CrossRef]
- Park, S.; Baker, J.O.; Himmel, M.E.; Parilla, P.A.; Johnson, D.K. Cellulose Crystallinity Index: Measurement Techniques and Their Impact on Interpreting Cellulase Performance. Biotechnol. Biofuels 2010, 3, 10. [Google Scholar] [CrossRef]
- Md Salim, R.; Asik, J.; Sarjadi, M.S. Chemical Functional Groups of Extractives, Cellulose and Lignin Extracted from Native Leucaena Leucocephala Bark. Wood Sci. Technol. 2021, 55, 295–313. [Google Scholar] [CrossRef]
- Hospodarova, V.; Singovszka, E.; Stevulova, N. Characterization of Cellulosic Fibers by FTIR Spectroscopy for Their Further Implementation to Building Materials. Am. J. Anal. Chem. 2018, 9, 303–310. [Google Scholar] [CrossRef]
- Kačík, F.; Jurczyková, T.; Bálintová, M.; Kmeťová, E.; Výbohová, E.; Kačíková, D. Saccharide Alterations in Spruce Wood Due to Thermal and Accelerated Aging Processes. Polymers 2025, 17, 1265. [Google Scholar] [CrossRef] [PubMed]
- Gupta, B.S.; Jelle, B.P.; Hovde, P.J.; Rüther, P. FTIR Spectroscopy as a Tool to Predict Service Life of Wooden Cladding. In Proceedings of the CIB World Congress 2010—Building a Better World, Salford, UK, 10–13 May 2010; International Council for Building Research Studies and Documentation (CIB): Salford, UK, 2010; pp. 345–356. [Google Scholar]
- Otenda, B.V.; Kareru, P.G.; Madivoli, E.S.; Salim, A.M.; Gichuki, J.; Wanakai, S.I. Starch-Hibiscus-Cellulose Nanofibrils Composite Films as a Model Antimicrobial Food Packaging Material. J. Nat. Fibers 2022, 19, 12371–12384. [Google Scholar] [CrossRef]
- Hu, Y.; Thalangamaarachchige, V.D.; Acharya, S.; Abidi, N. Role of Low-Concentration Acetic Acid in Promoting Cellulose Dissolution. Cellulose 2018, 25, 4389–4405. [Google Scholar] [CrossRef]
- O’Connor, R.T.; DuPré, E.F.; Mitcham, D. Applications of Infrared Absorption Spectroscopy to Investigations of Cotton and Modified Cottons: Part I: Physical and Crystalline Modifications and Oxidation. Text. Res. J. 1958, 28, 382–392. [Google Scholar] [CrossRef]
- Agarwal, U.P. Beyond Crystallinity: Using Raman Spectroscopic Methods to Further Define Aggregated/Supramolecular Structure of Cellulose. Front. Energy Res. 2022, 10, 857621. [Google Scholar] [CrossRef]
- Nishimura, A.; Otsuka, S. Sulfated Cellulose Pulp with High Water Retention and a Swollen Fiber Structure for the Preparation of Completely Dispersed Cellulose Nanofibers. Cellulose 2024, 31, 3561–3571. [Google Scholar] [CrossRef]
- Ioelovich, M. Study of Hydrophilic Properties of Polysaccharides. Org. Polym. Mater. Res. 2021, 3, 12–23. [Google Scholar] [CrossRef]
- Simon, M.; Fulchiron, R.; Gouanvé, F. Water Sorption and Mechanical Properties of Cellulosic Derivative Fibers. Polymers 2022, 14, 2836. [Google Scholar] [CrossRef] [PubMed]
- Sun, F.; Xiao, B.; Li, S.; Kidron, G.J. Towards Moss Biocrust Effects on Surface Soil Water Holding Capacity: Soil Water Retention Curve Analysis and Modeling. Geoderma 2021, 399, 115120. [Google Scholar] [CrossRef]
- Kubát, J. Methodology for Assessing the Quantity and Quality of Organic Matter in Agricultural Soil; The Crop Research Institute: Praha-Ruzyně, Czech Republic, 2008; ISBN 978-80-86666-93-5. (In Czech) [Google Scholar]
- Poláková, J.; Holec, J.; Janků, J.; Maitah, M.; Soukup, J. Effects of Agri-Environment Schemes in Terms of the Results for Soil, Water and Soil Organic Matter in Central and Eastern Europe. Agronomy 2022, 12, 1585. [Google Scholar] [CrossRef]
- Thai, S.; Pavlů, L.; Tejnecký, V.; Vokurková, P.; Nozari, S.; Borůvka, L. Comparison of Soil Organic Matter Composition under Different Land Uses by DRIFT Spectroscopy. Plant Soil Environ. 2021, 67, 255–263. [Google Scholar] [CrossRef]
- Bekhovykh, Y.; Bekhovykh, L.; Lyoevin, A.; Sizov, E. Changes in Maximum Water Holding Capacity of Chernozem Soil Caused by Soil Compaction. E3S Web Conf. 2021, 262, 03003. [Google Scholar] [CrossRef]
- Rawls, W.J.; Pachepsky, Y.A.; Ritchie, J.C.; Sobecki, T.M.; Bloodworth, H. Effect of Soil Organic Carbon on Soil Water Retention. Geoderma 2003, 116, 61–76. [Google Scholar] [CrossRef]
- Libohova, Z.; Seybold, C.; Wysocki, D.; Wills, S.; Schoeneberger, P.; Williams, C.; Lindbo, D.; Stott, D.; Owens, P.R. Reevaluating the Effects of Soil Organic Matter and Other Properties on Available Water-Holding Capacity Using the National Cooperative Soil Survey Characterization Database. J. Soil Water Conserv. 2018, 73, 411–421. [Google Scholar] [CrossRef]
- Hudson, B.D. Soil Organic Matter and Available Water Capacity. J. Soil Water Conserv. 1994, 49, 189–194. [Google Scholar] [CrossRef]
- Ngo, A.T.; Nguyen, M.C.; Maeda, M.; Mori, Y. Cellulose Nanofibers Boost Soil Water Availability, Plant Growth, and Irrigation Water Use Efficiency under Deficit Irrigation. Catena 2025, 254, 108998. [Google Scholar] [CrossRef]
- Ghezzehei, T.A.; Sulman, B.; Arnold, C.L.; Bogie, N.A.; Berhe, A.A. On the Role of Soil Water Retention Characteristic on Aerobic Microbial Respiration. Biogeosciences 2019, 16, 1187–1209. [Google Scholar] [CrossRef]
- Torrent, J.; Del Campillo, M.C.; Barrón, V. Short Communication: Predicting Cation Exchange Capacity from Hygroscopic Moisture in Agricultural Soils of Western Europe. Span. J. Agric. Res. 2015, 13, e11SC01. [Google Scholar] [CrossRef]
- Ye, C.; Zheng, G.; Tao, Y.; Xu, Y.; Chu, G.; Xu, C.; Chen, S.; Liu, Y.; Zhang, X.; Wang, D. Effect of Soil Texture on Soil Nutrient Status and Rice Nutrient Absorption in Paddy Soils. Agronomy 2024, 14, 1339. [Google Scholar] [CrossRef]
Disclaimer/Publisher’s Note: The statements, opinions and data contained in all publications are solely those of the individual author(s) and contributor(s) and not of MDPI and/or the editor(s). MDPI and/or the editor(s) disclaim responsibility for any injury to people or property resulting from any ideas, methods, instructions or products referred to in the content. |
© 2025 by the authors. Licensee MDPI, Basel, Switzerland. This article is an open access article distributed under the terms and conditions of the Creative Commons Attribution (CC BY) license (https://creativecommons.org/licenses/by/4.0/).