Author Contributions
Conceptualization, W.Z., H.G. and Y.Z.; methodology, W.Z.; software, W.Z.; validation, W.Z., H.G., X.G. and C.Y.; formal analysis, W.Z.; investigation, W.Z., X.G., C.Y. and T.W.; resources, H.G. and Y.Z.; data curation, W.Z.; writing—original draft preparation, W.Z.; writing—review and editing, H.G.; supervision, H.G. and Y.Z.; project administration, H.G.; funding acquisition, H.G. All authors have read and agreed to the published version of the manuscript.
Figure 1.
Schematic diagram of the relevant parameters of the contact model: (a) The Bonding contact mechanics model; (b) the JKR contact mechanics model.
Figure 1.
Schematic diagram of the relevant parameters of the contact model: (a) The Bonding contact mechanics model; (b) the JKR contact mechanics model.
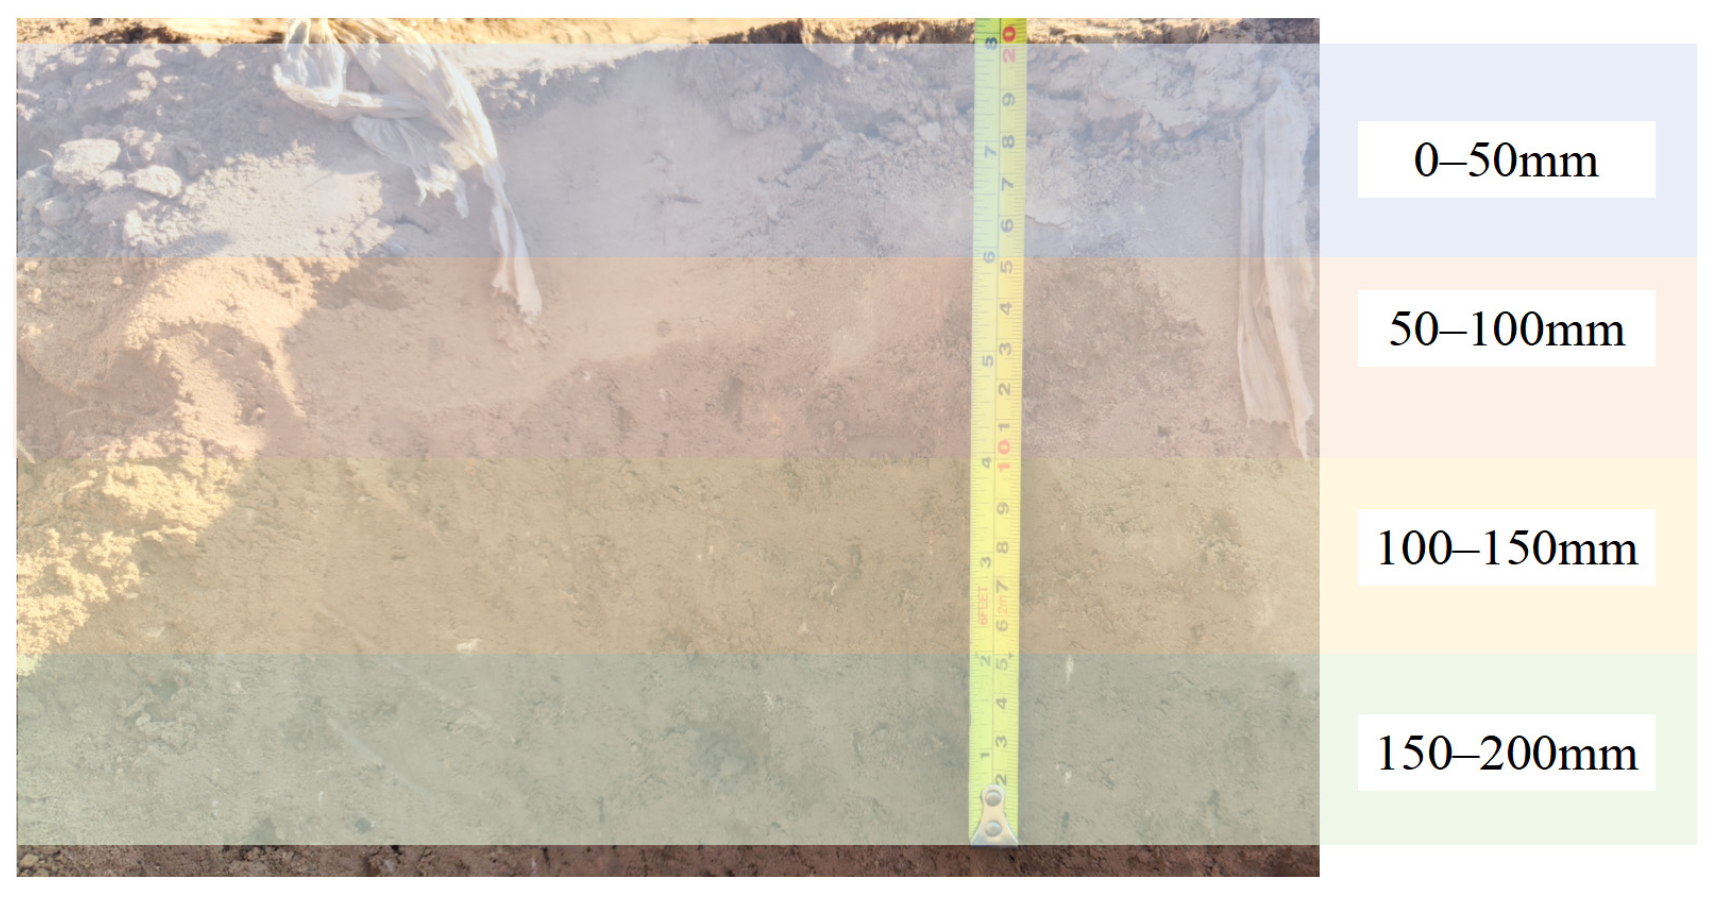
Figure 2.
Schematic diagram of soil sampling depth.
Figure 2.
Schematic diagram of soil sampling depth.
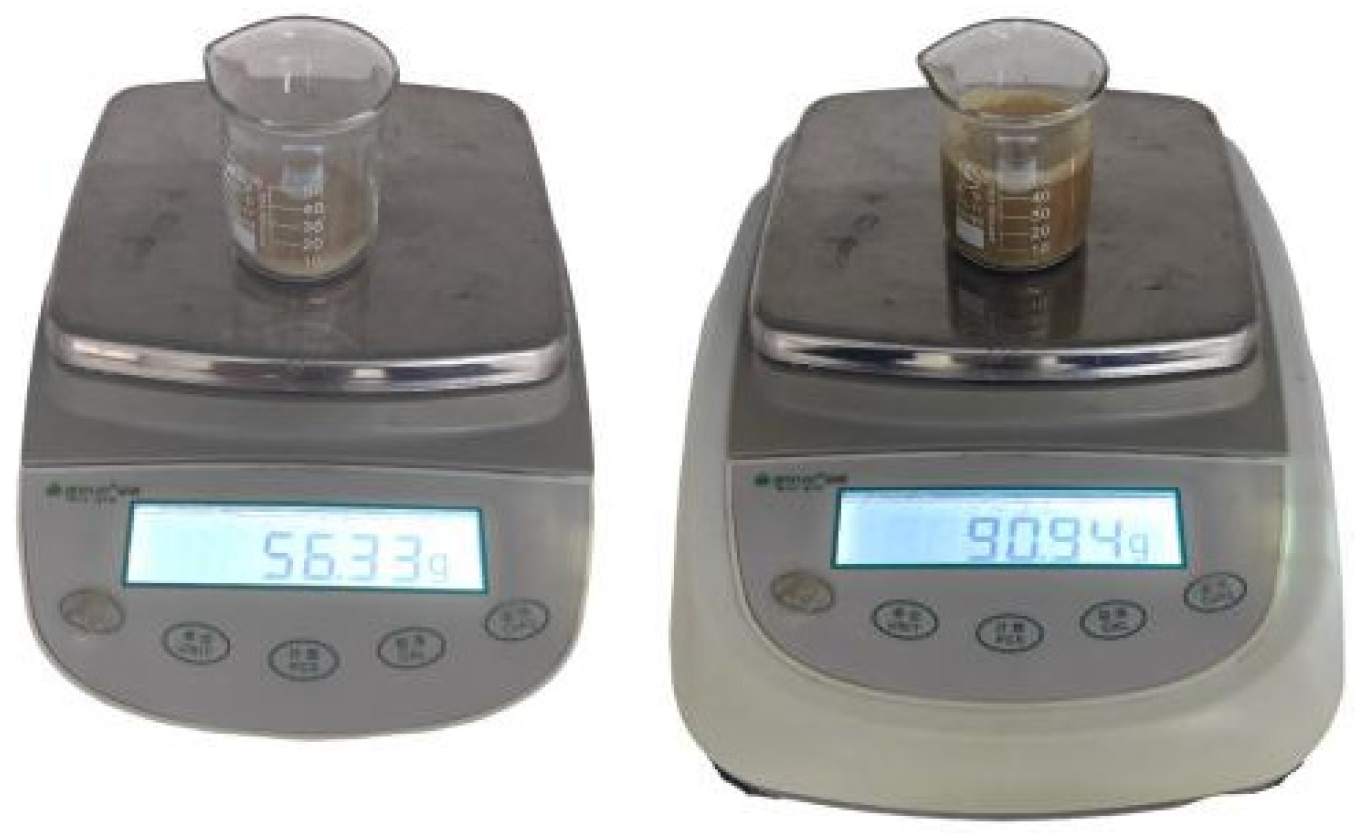
Figure 3.
Determination of soil particle density by volume displacement method.
Figure 3.
Determination of soil particle density by volume displacement method.
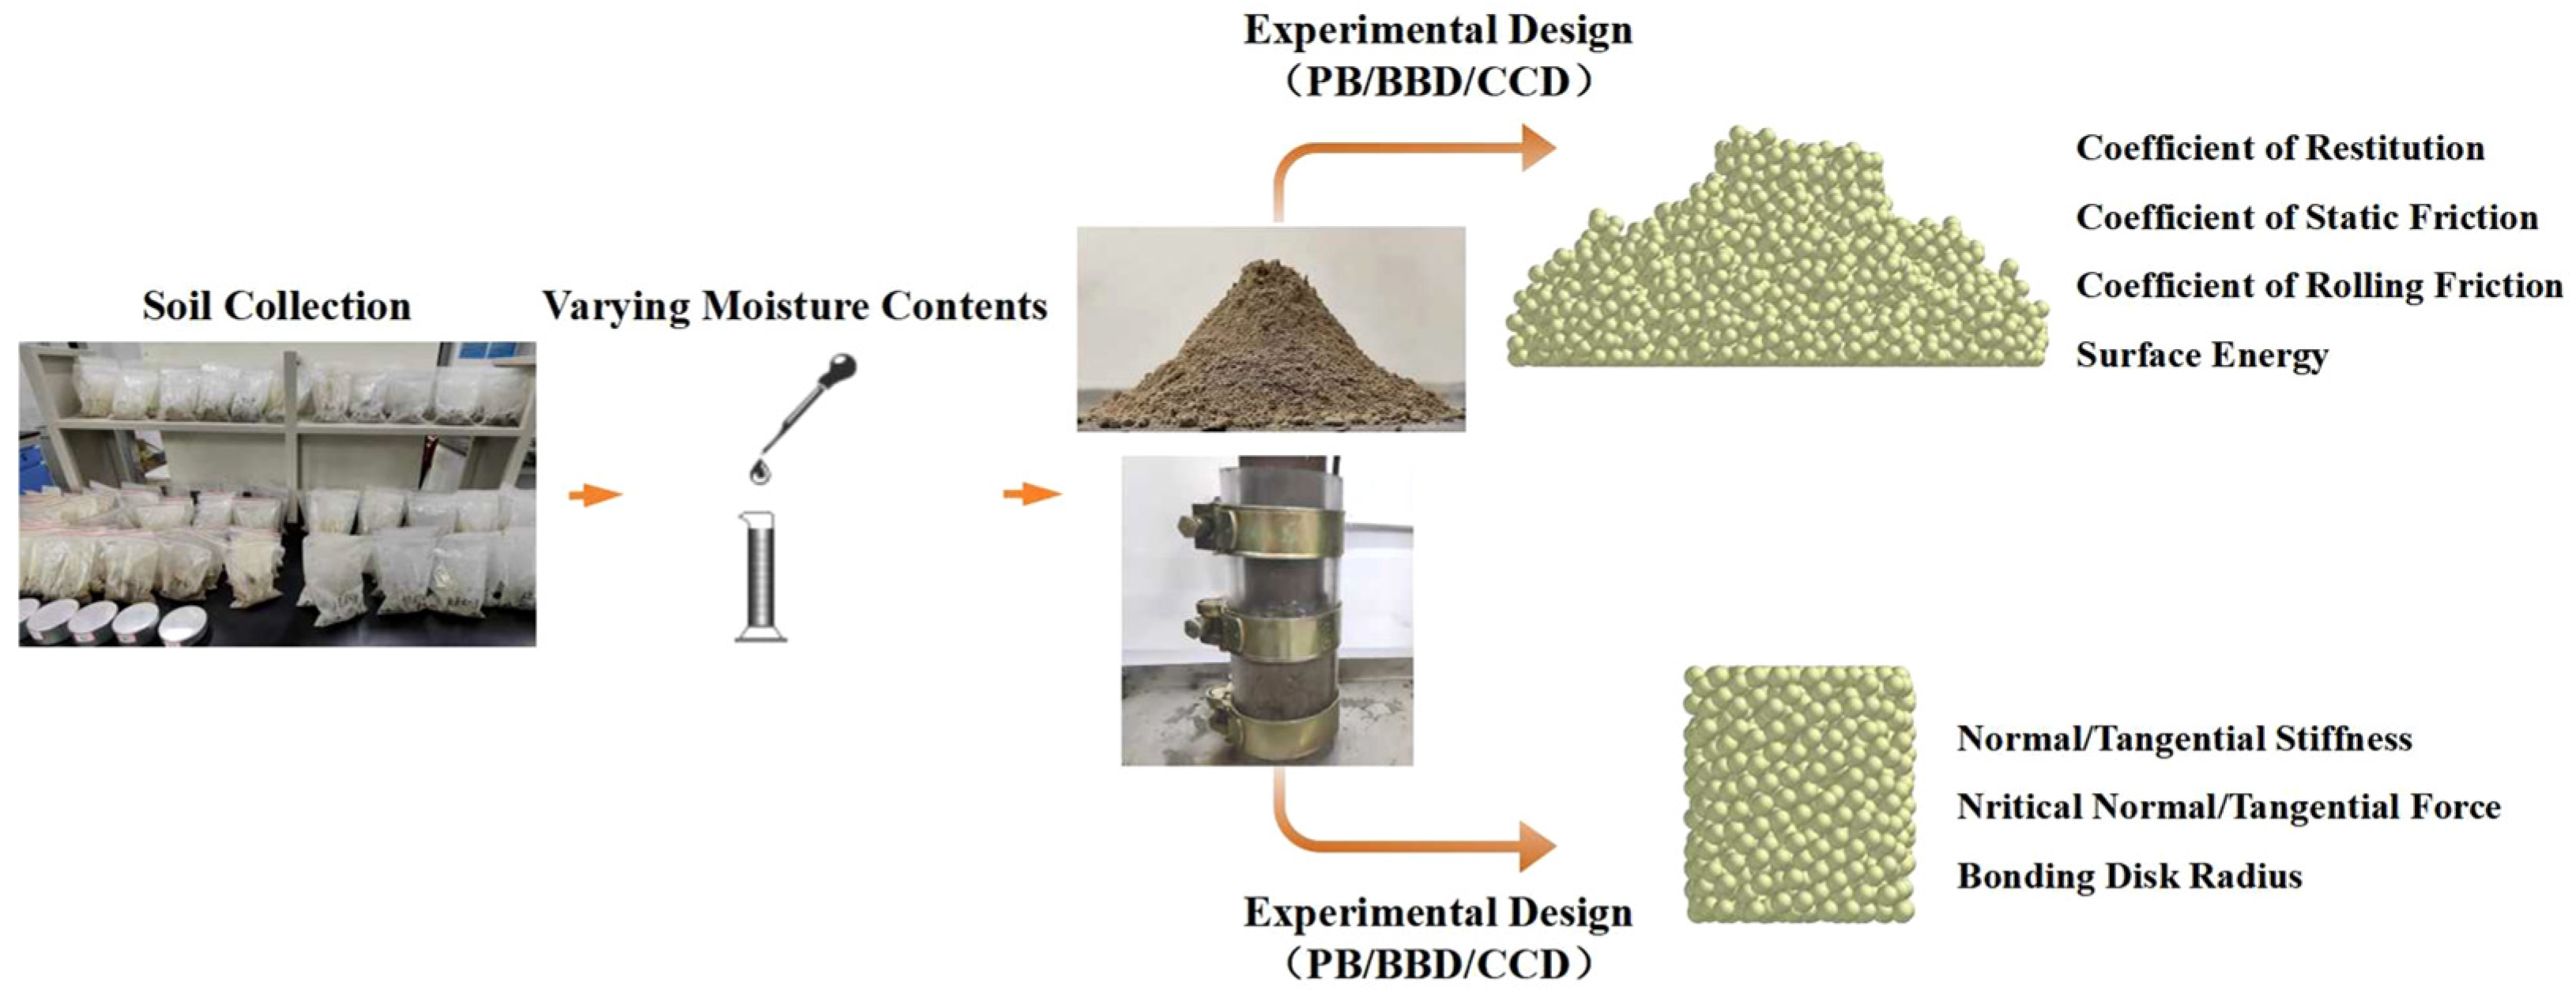
Figure 4.
The specific experimental procedures and methodologies.
Figure 4.
The specific experimental procedures and methodologies.
Figure 5.
SAOR with different moisture contents: (a) Moisture content 1 ± 1%, SAOR 39.71°; (b) Moisture content 4 ± 1%, SAOR 37.129°; (c) Moisture content 8 ± 1%, SAOR 35.995°; (d) Moisture content 12 ± 1%, SAOR 35.786°; (e) Moisture content 16 ± 1%, SAOR 31.853°; (f) Moisture content 20 ± 1%, SAOR 28.684°.
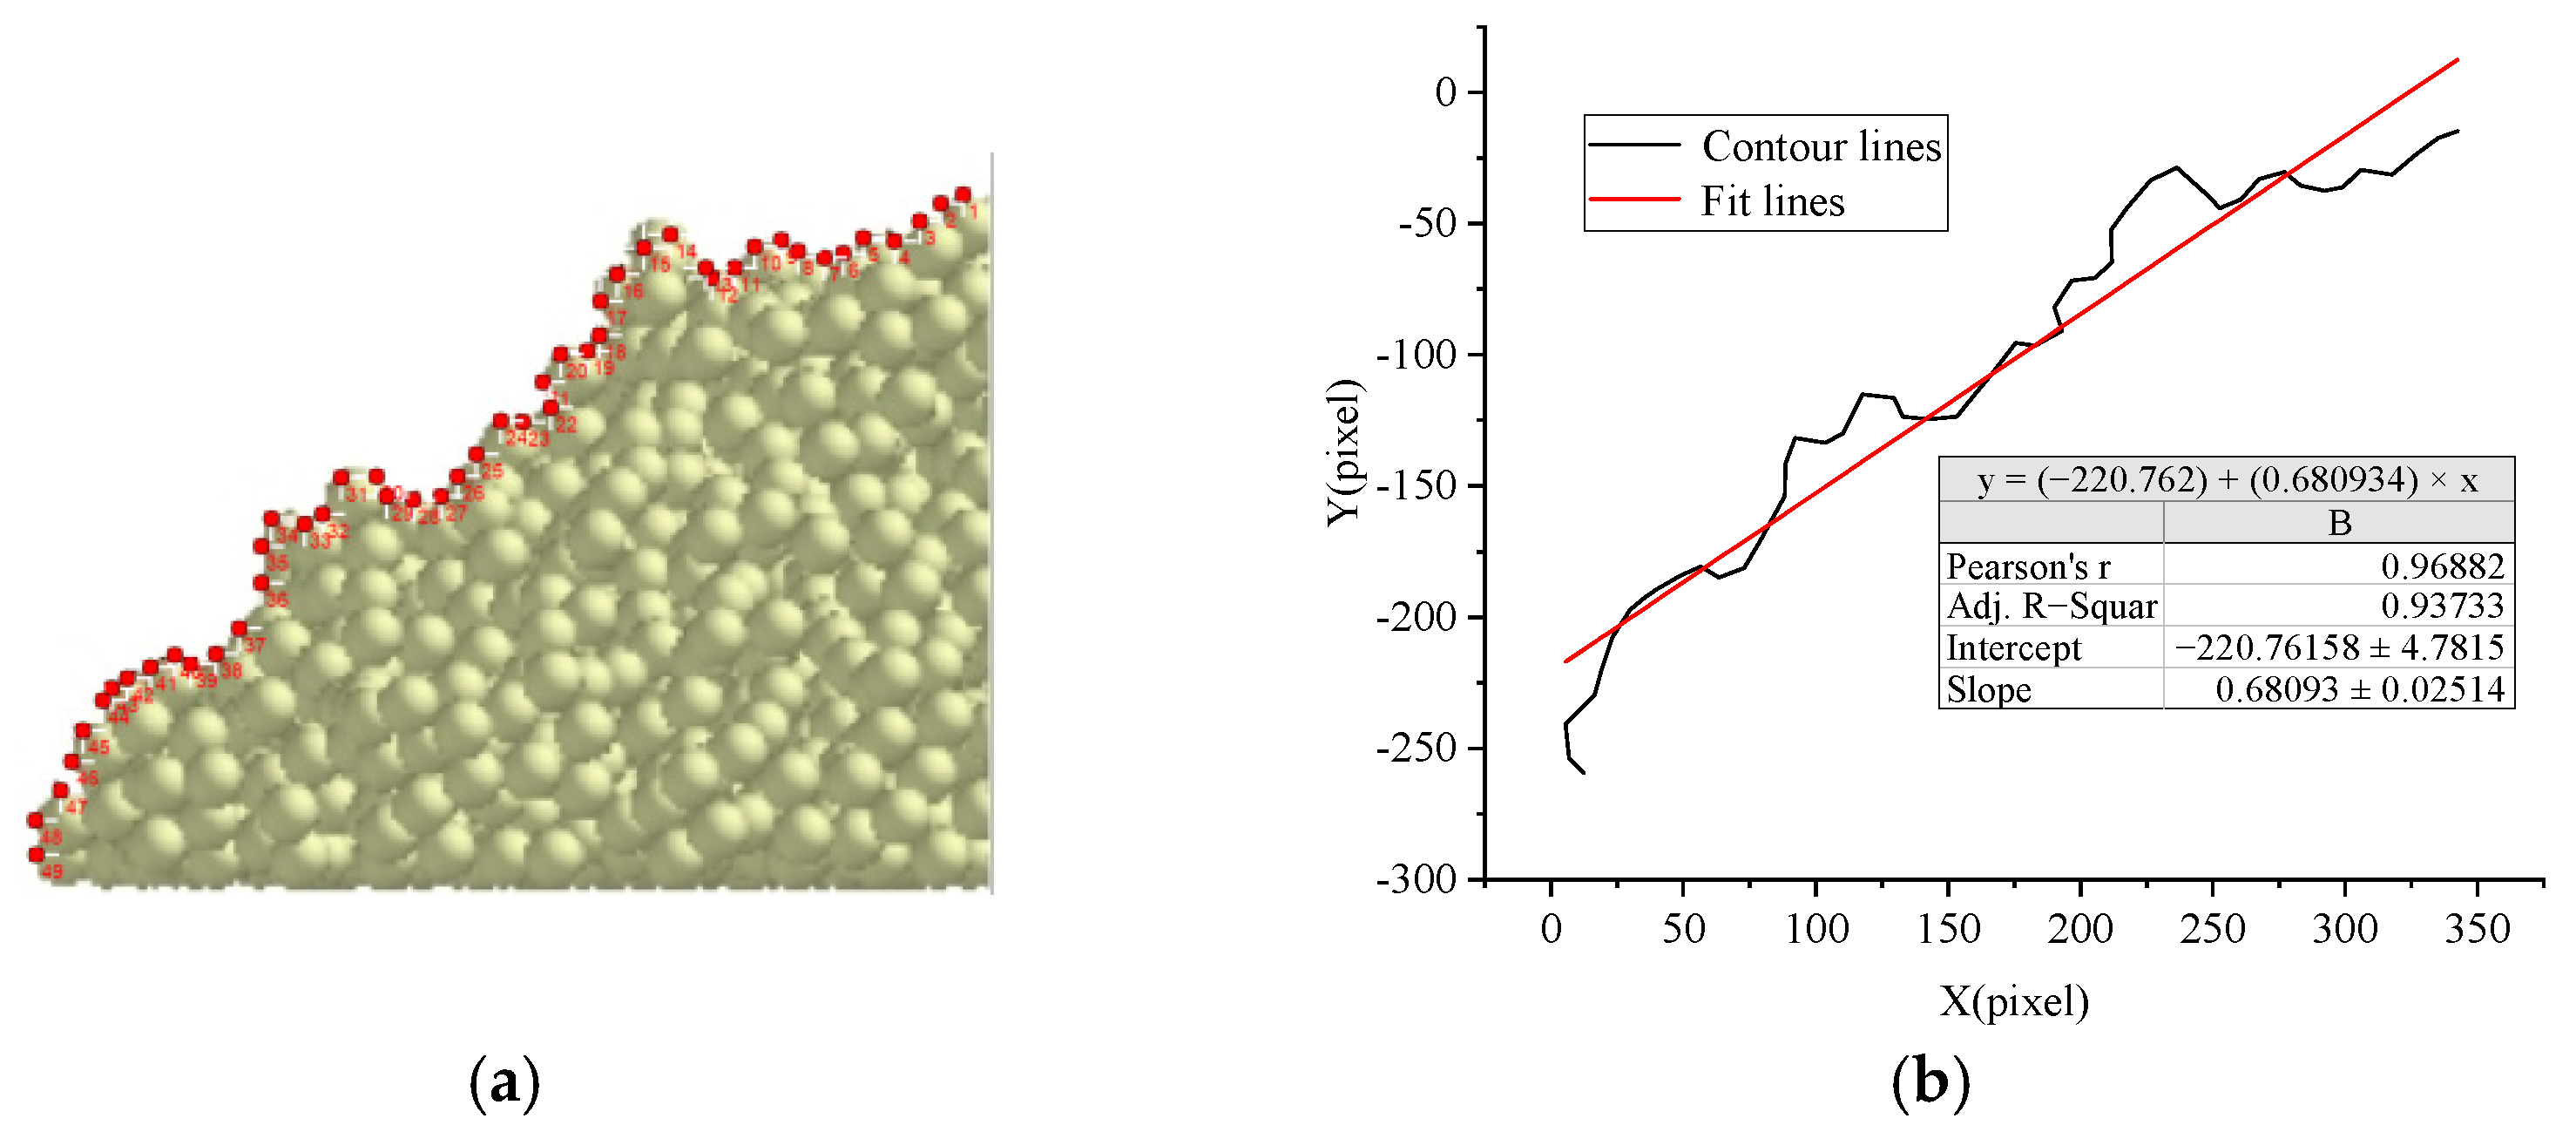
Figure 6.
Extraction and fitting of soil SAOR contour line in simulated environment: (a) simulated soil SAOR profile extraction; (b) SAOR contour fitting.
Figure 6.
Extraction and fitting of soil SAOR contour line in simulated environment: (a) simulated soil SAOR profile extraction; (b) SAOR contour fitting.
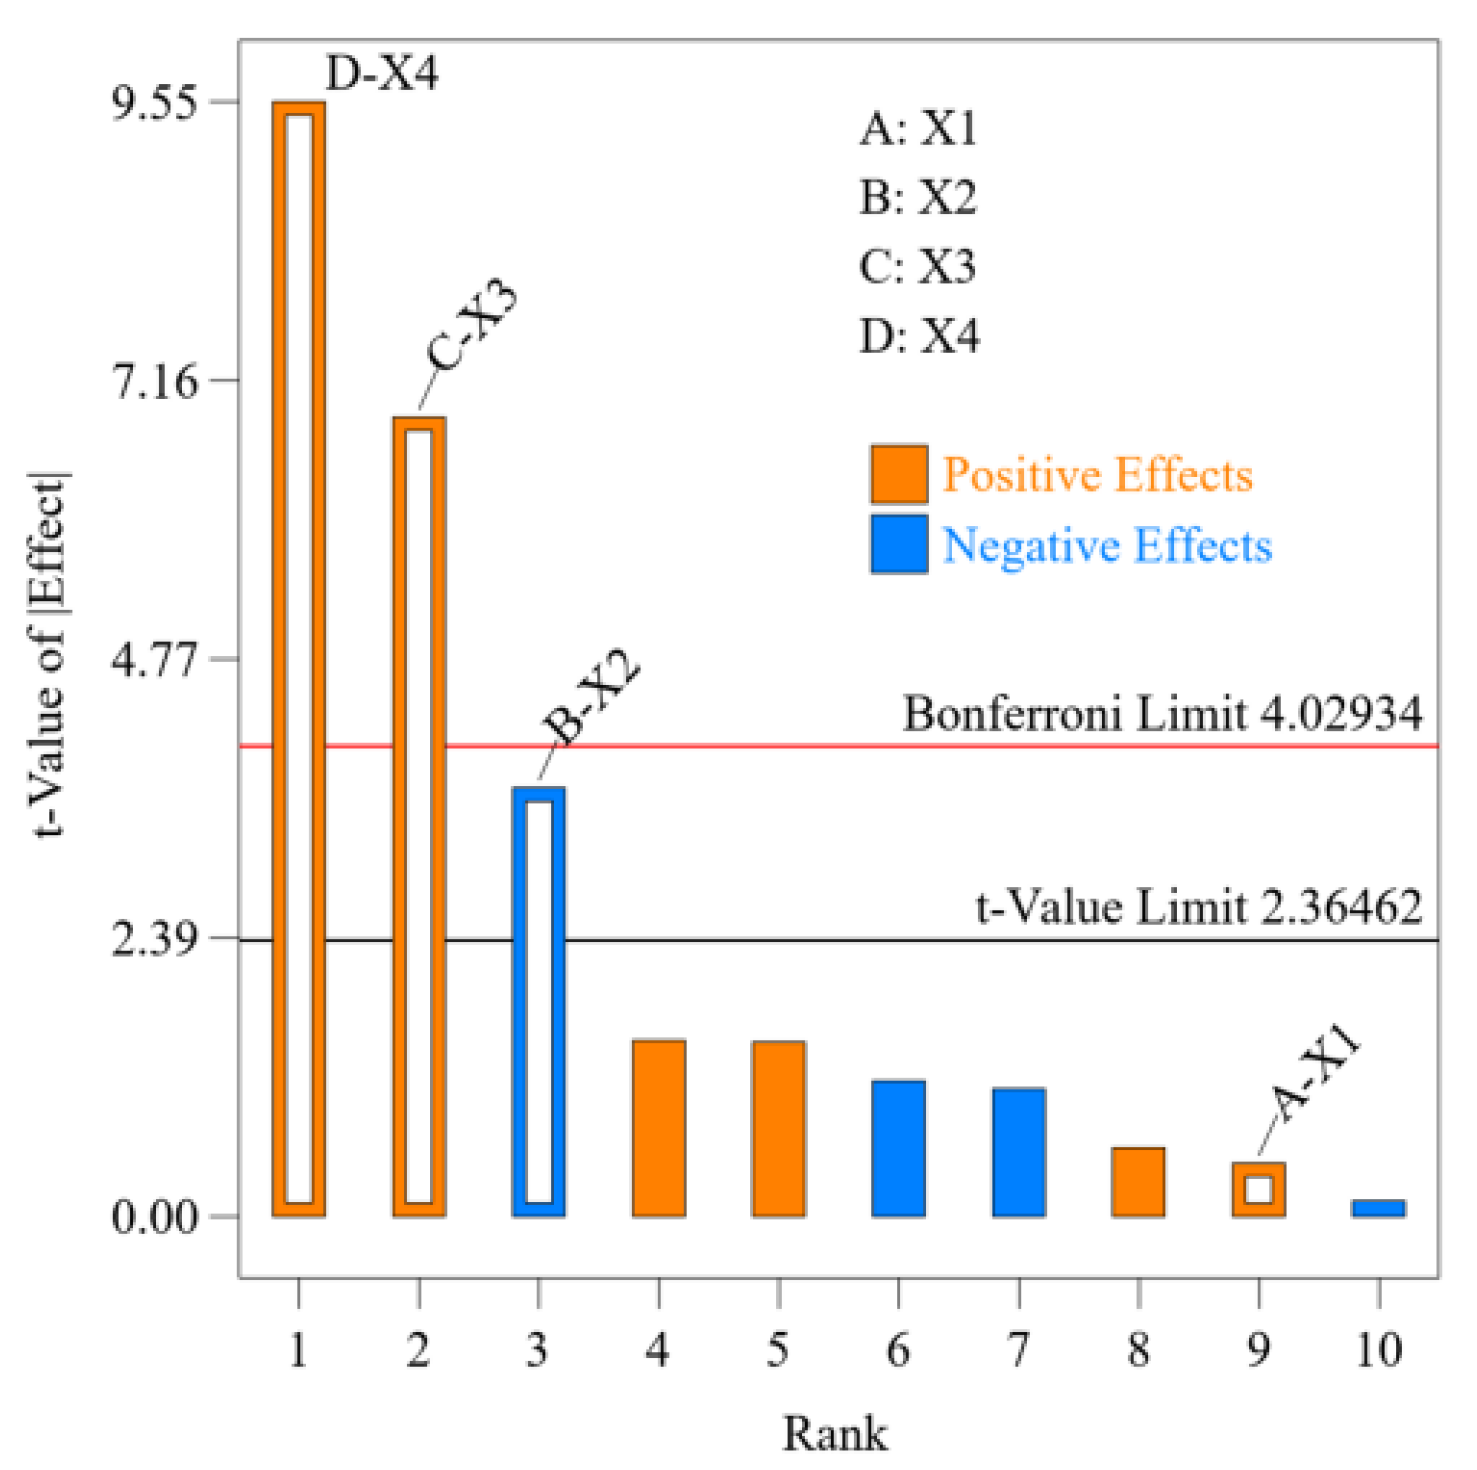
Figure 7.
Pareto diagram of the significance of factors influencing the SAOR.
Figure 7.
Pareto diagram of the significance of factors influencing the SAOR.
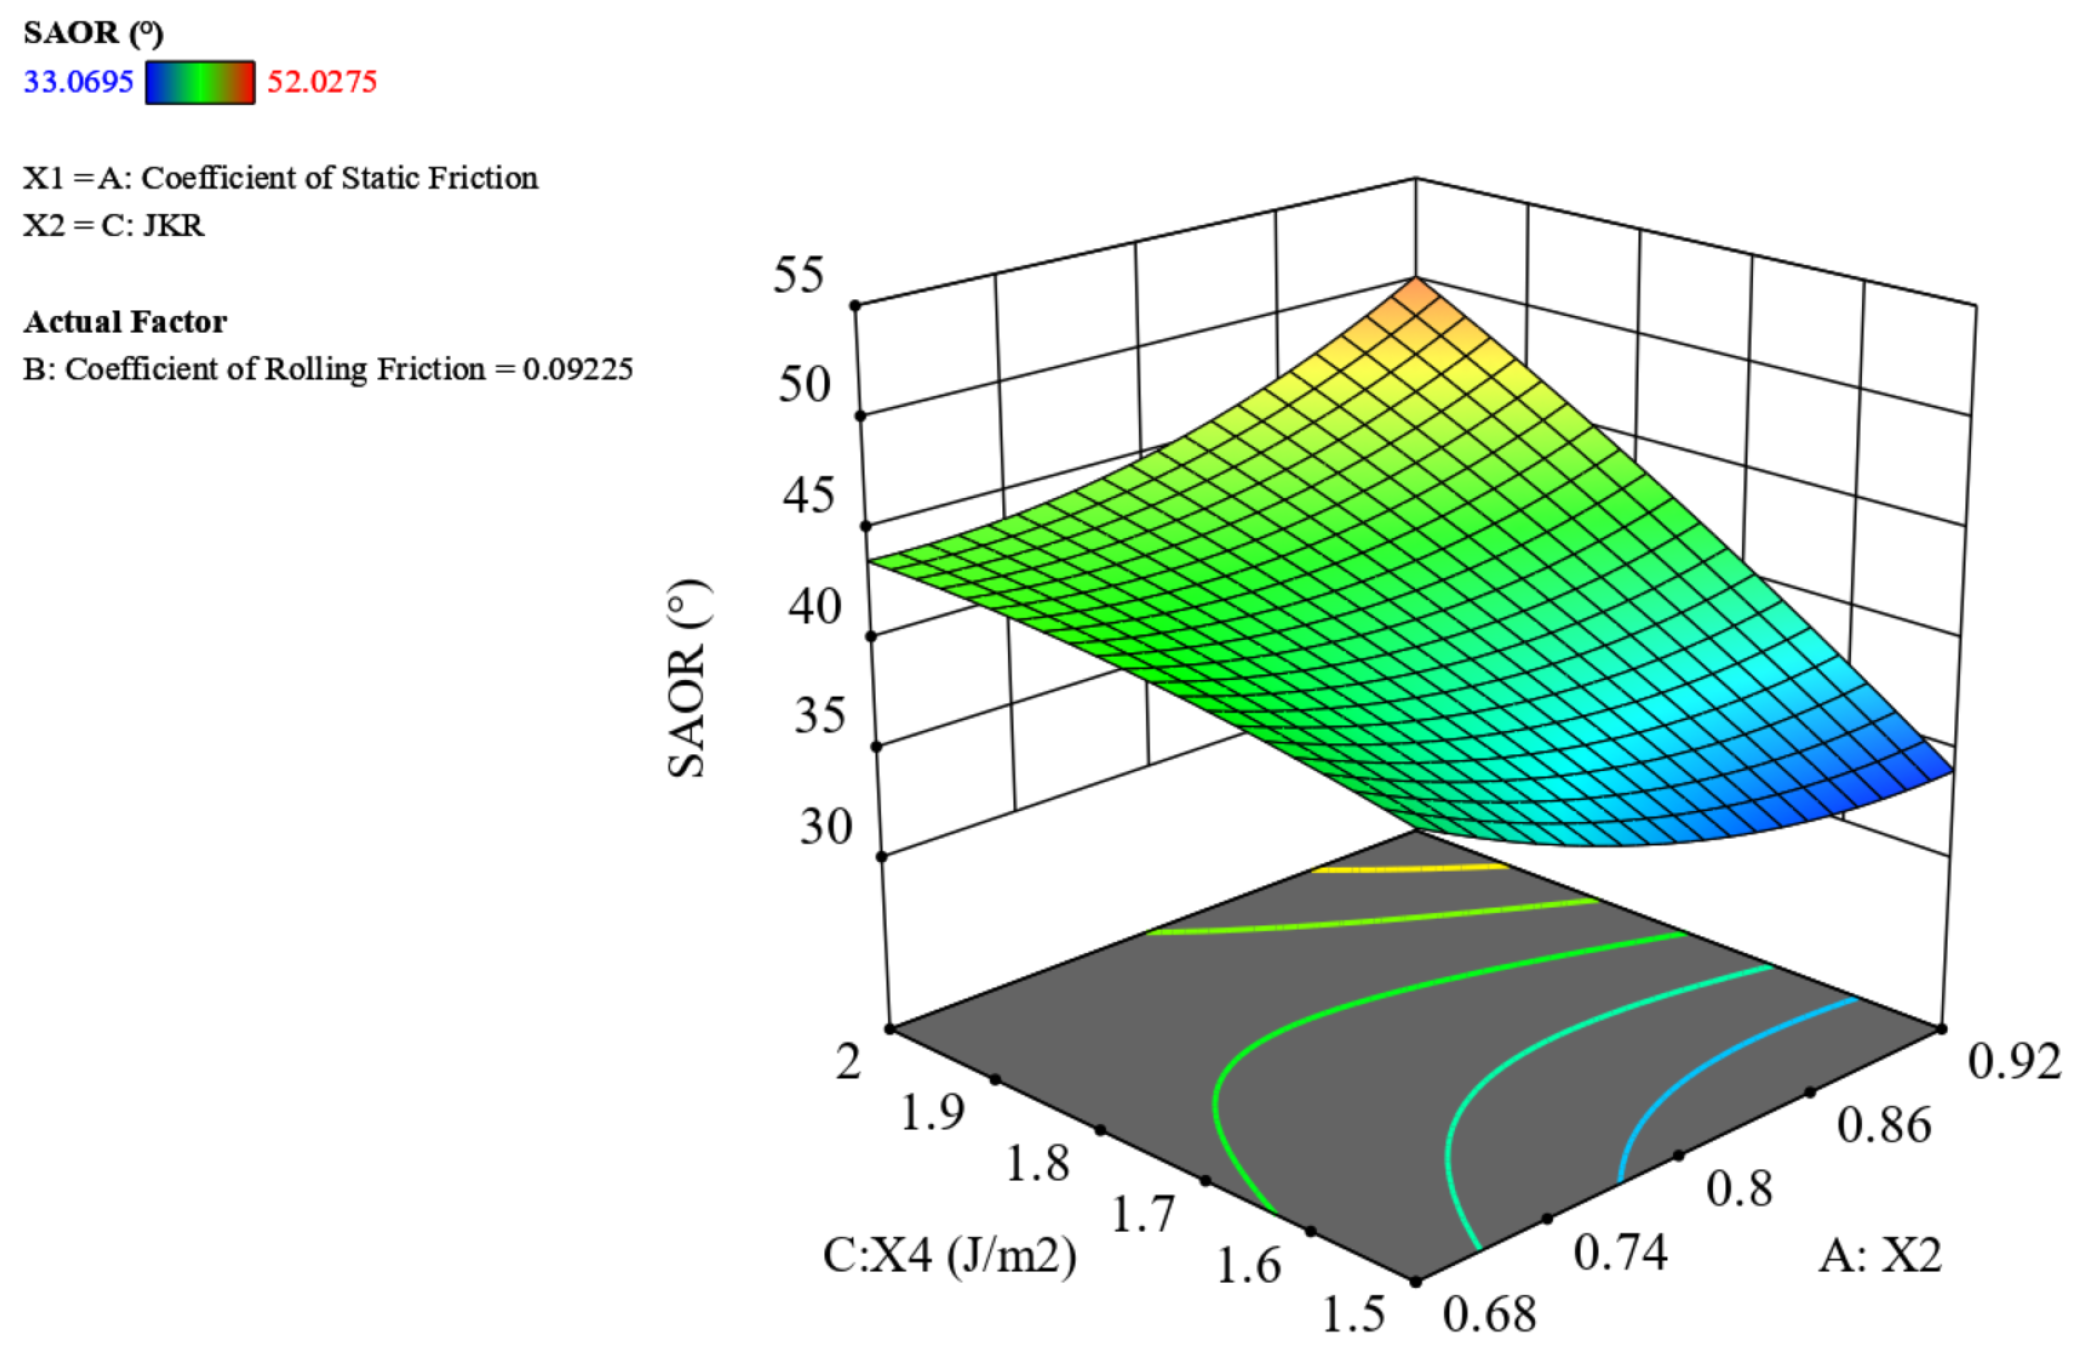
Figure 8.
Surface diagram of the response of the interaction term X2X3 to the SAOR.
Figure 8.
Surface diagram of the response of the interaction term X2X3 to the SAOR.
Figure 9.
Unconfined pressure resistance of soil with different moisture contents.
Figure 9.
Unconfined pressure resistance of soil with different moisture contents.
Figure 10.
Variation trend of interparticle forces in soil with varying moisture contents: (a) dry soil (moisture content 1~4%); (b) soil with intermediate moisture content (moisture content 4~12%); (c) soil with elevated moisture content (moisture content 12~20%).
Figure 10.
Variation trend of interparticle forces in soil with varying moisture contents: (a) dry soil (moisture content 1~4%); (b) soil with intermediate moisture content (moisture content 4~12%); (c) soil with elevated moisture content (moisture content 12~20%).
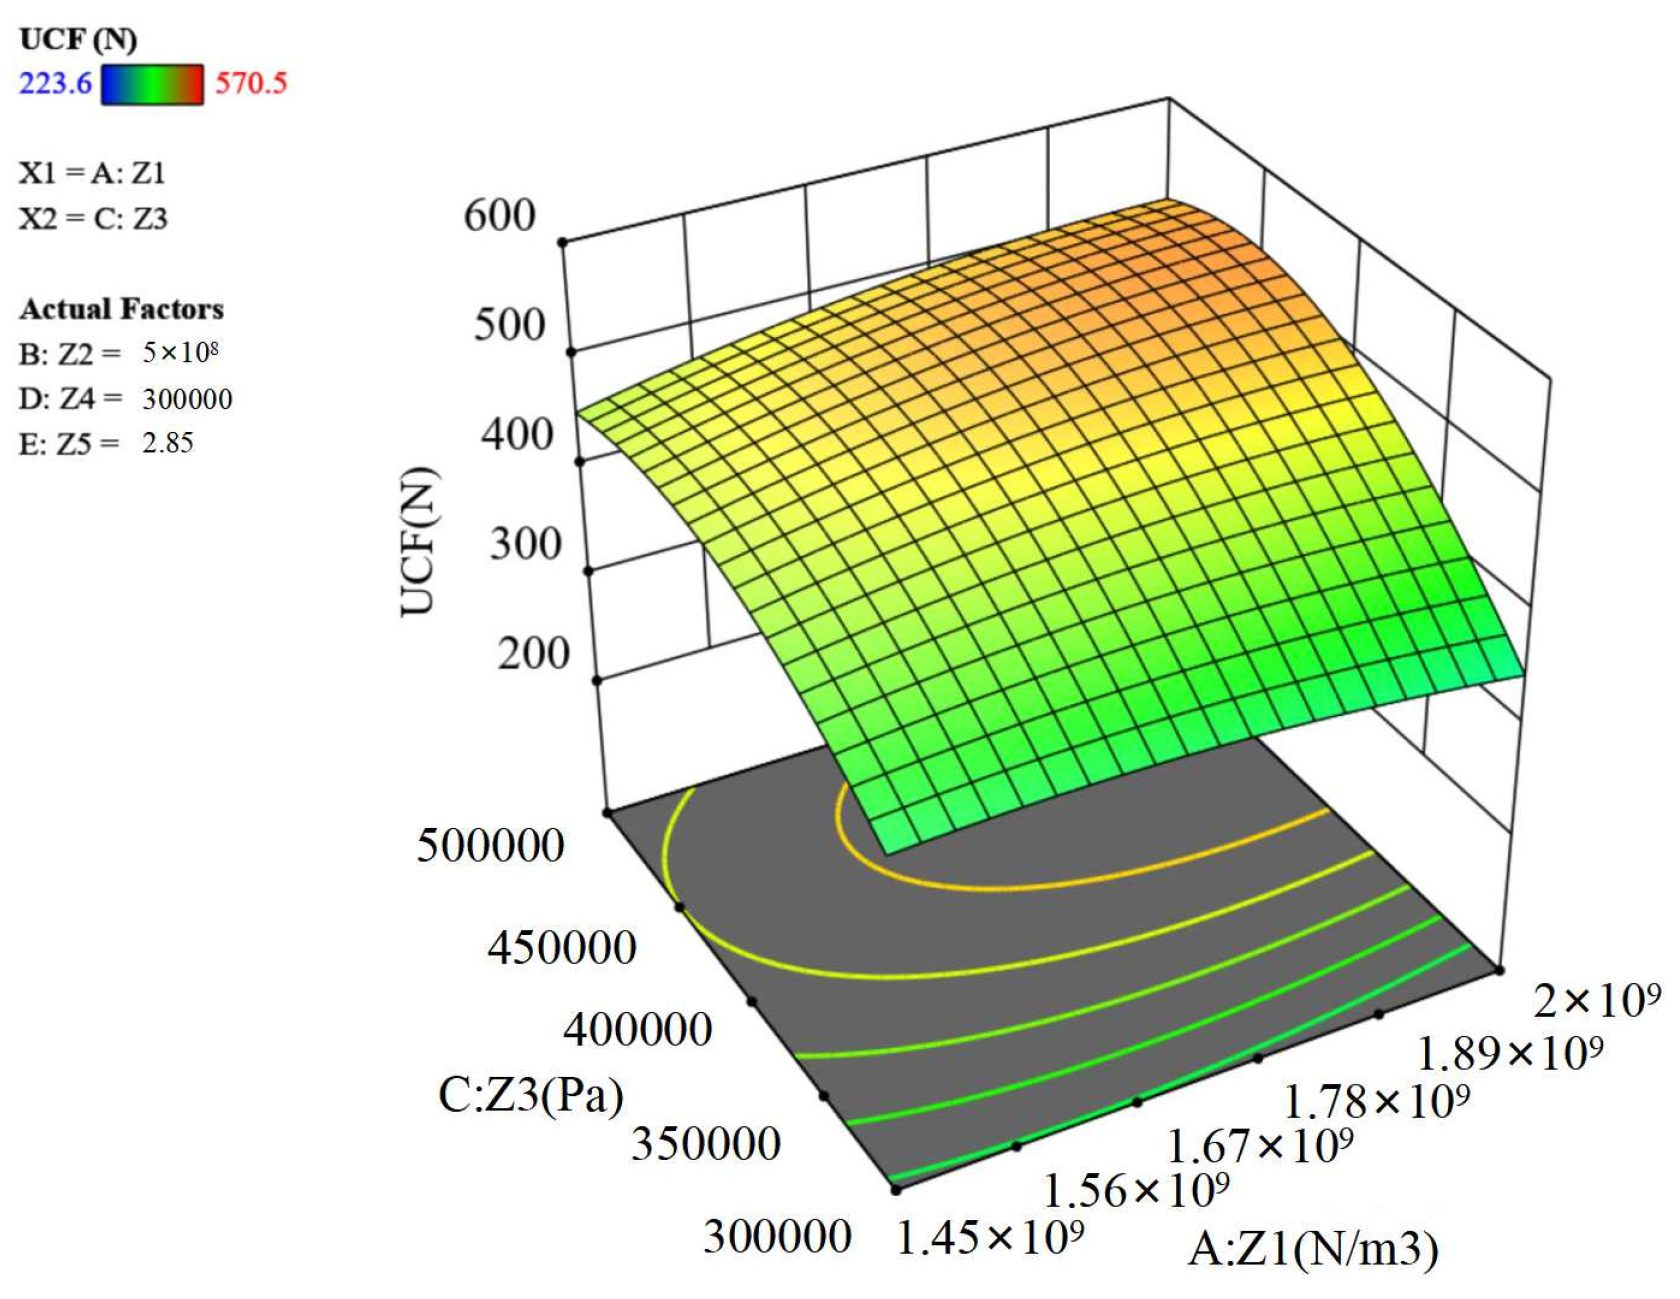
Figure 11.
Interaction of Z1Z3 on axial force.
Figure 11.
Interaction of Z1Z3 on axial force.
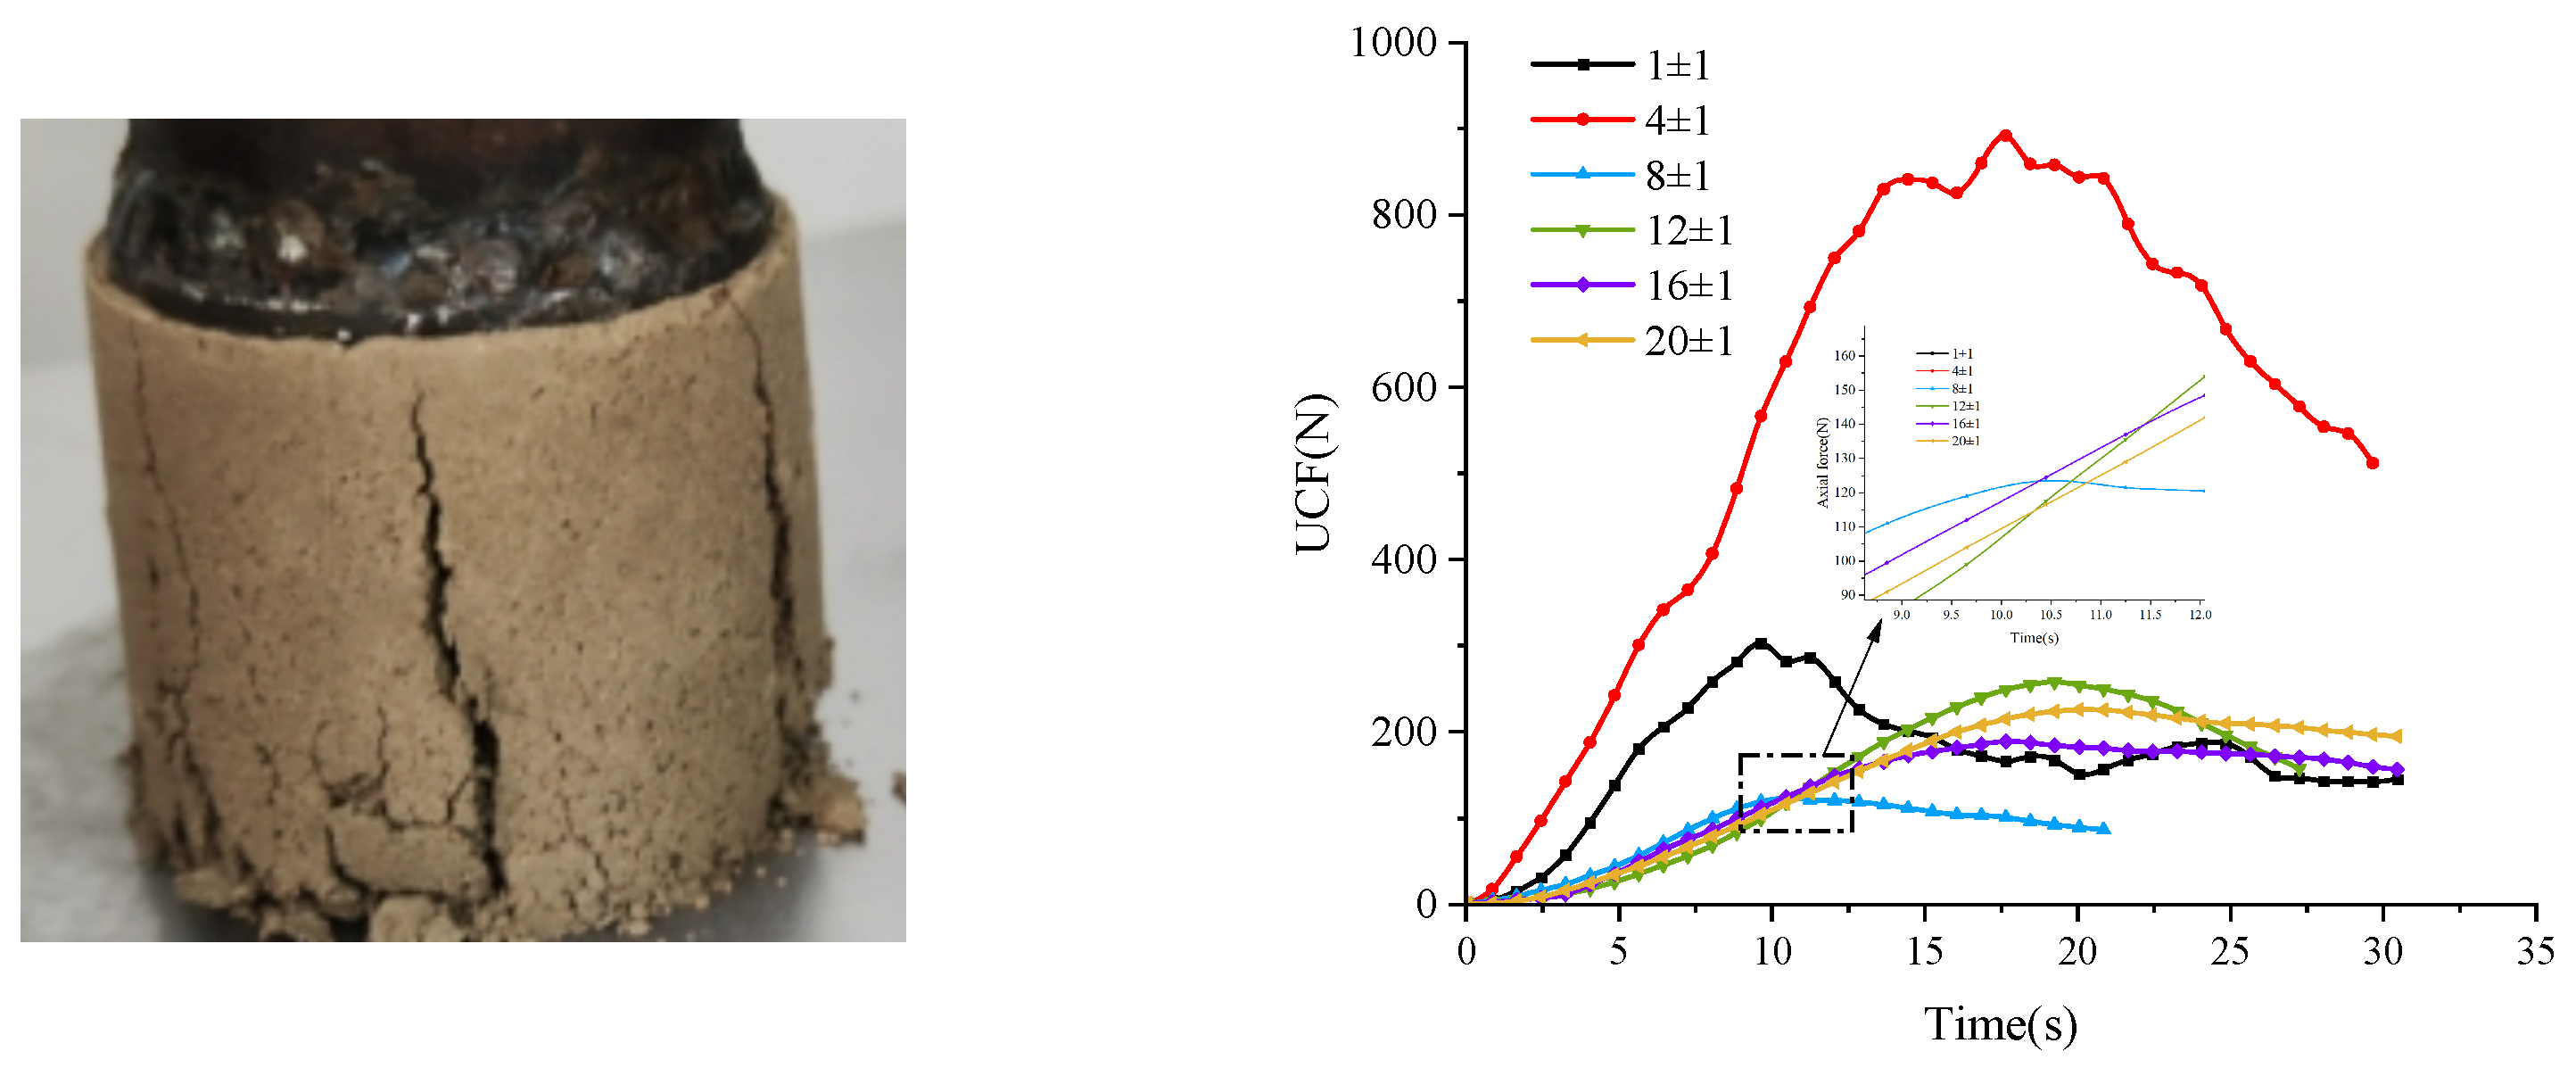
Figure 12.
UCF Testing in simulation frameworks: (a) Cylindrical soil specimen modeling in simulation frameworks; (b) Schematic illustration of unconfined compression numerical simulation; (c) UCF curves of soils with varied moisture content.
Figure 12.
UCF Testing in simulation frameworks: (a) Cylindrical soil specimen modeling in simulation frameworks; (b) Schematic illustration of unconfined compression numerical simulation; (c) UCF curves of soils with varied moisture content.
Figure 13.
Interparticle bond contact states in discrete element soil simulation frameworks: (a) construction of soil particulate bed; (b) post-operational soil particulate bed configuration after shovel interaction; (c) bonding state of soil particles in simulated environments.
Figure 13.
Interparticle bond contact states in discrete element soil simulation frameworks: (a) construction of soil particulate bed; (b) post-operational soil particulate bed configuration after shovel interaction; (c) bonding state of soil particles in simulated environments.
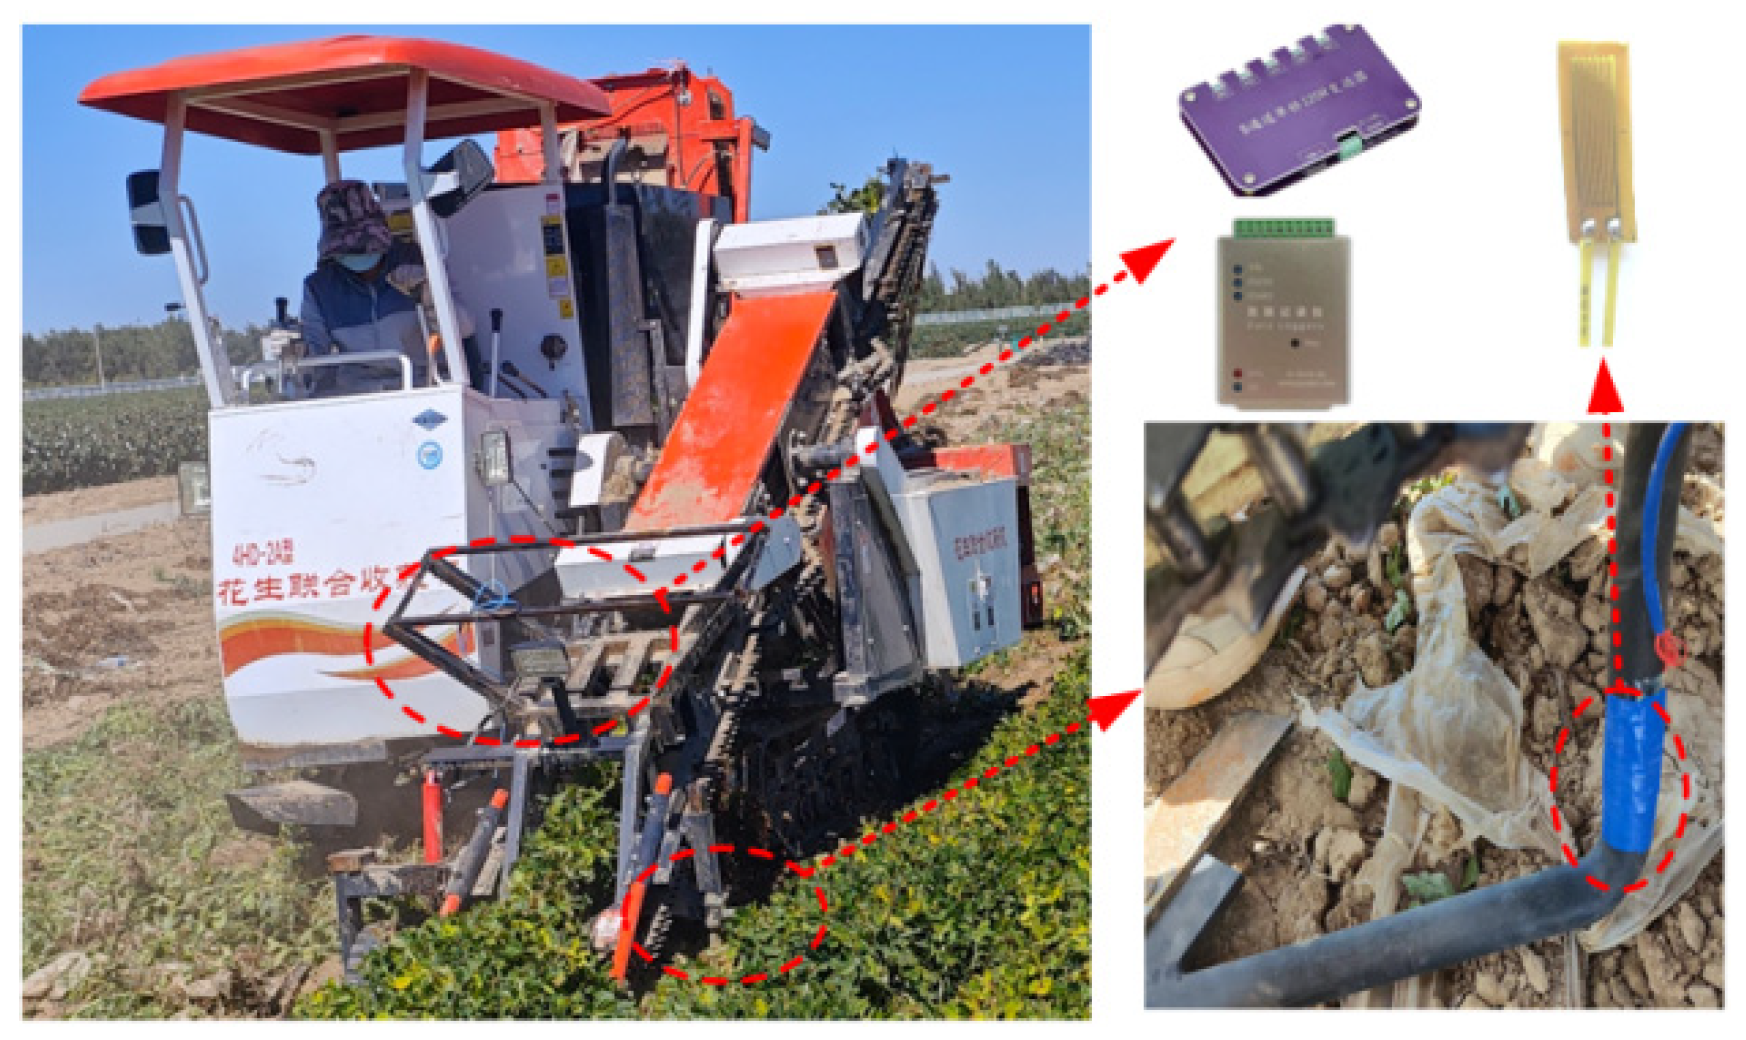
Figure 14.
Sensor placement positions.
Figure 14.
Sensor placement positions.
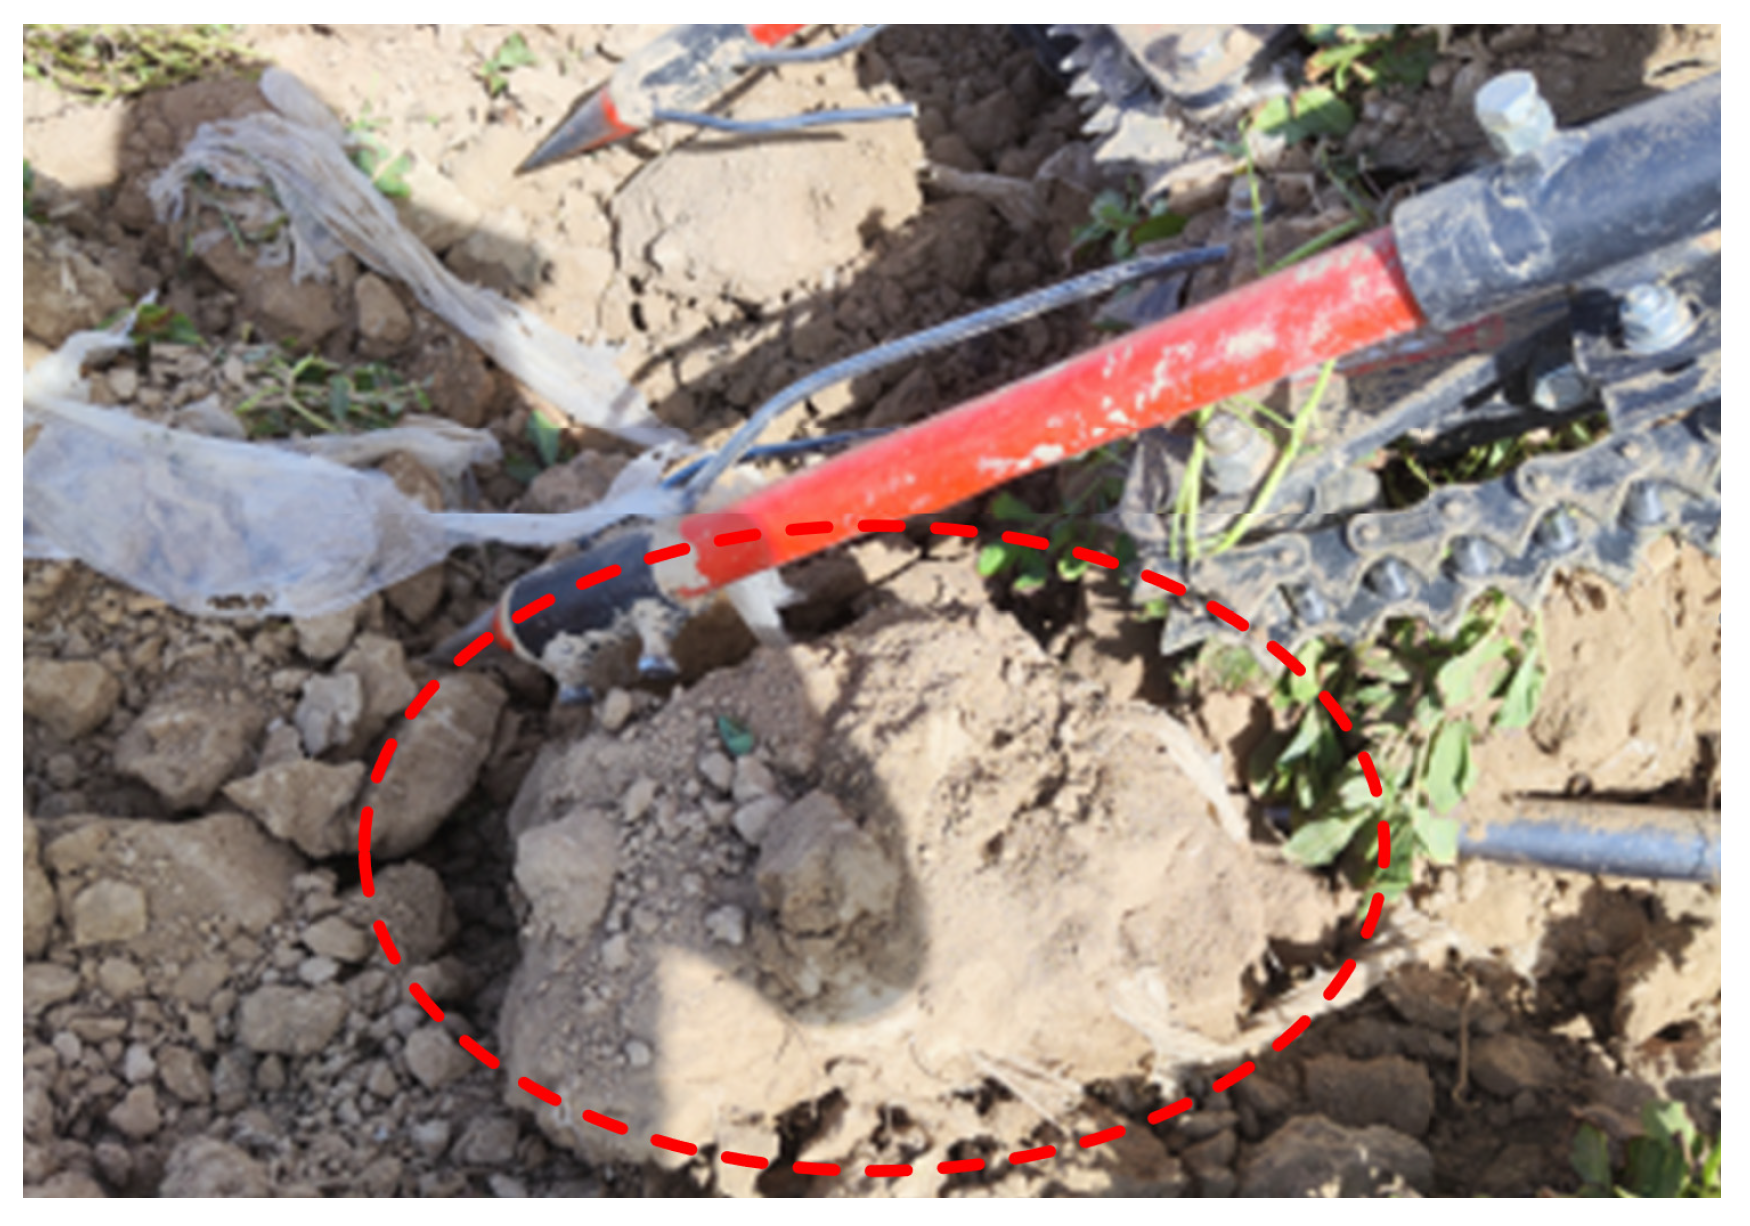
Figure 15.
Field validation experiments.
Figure 15.
Field validation experiments.
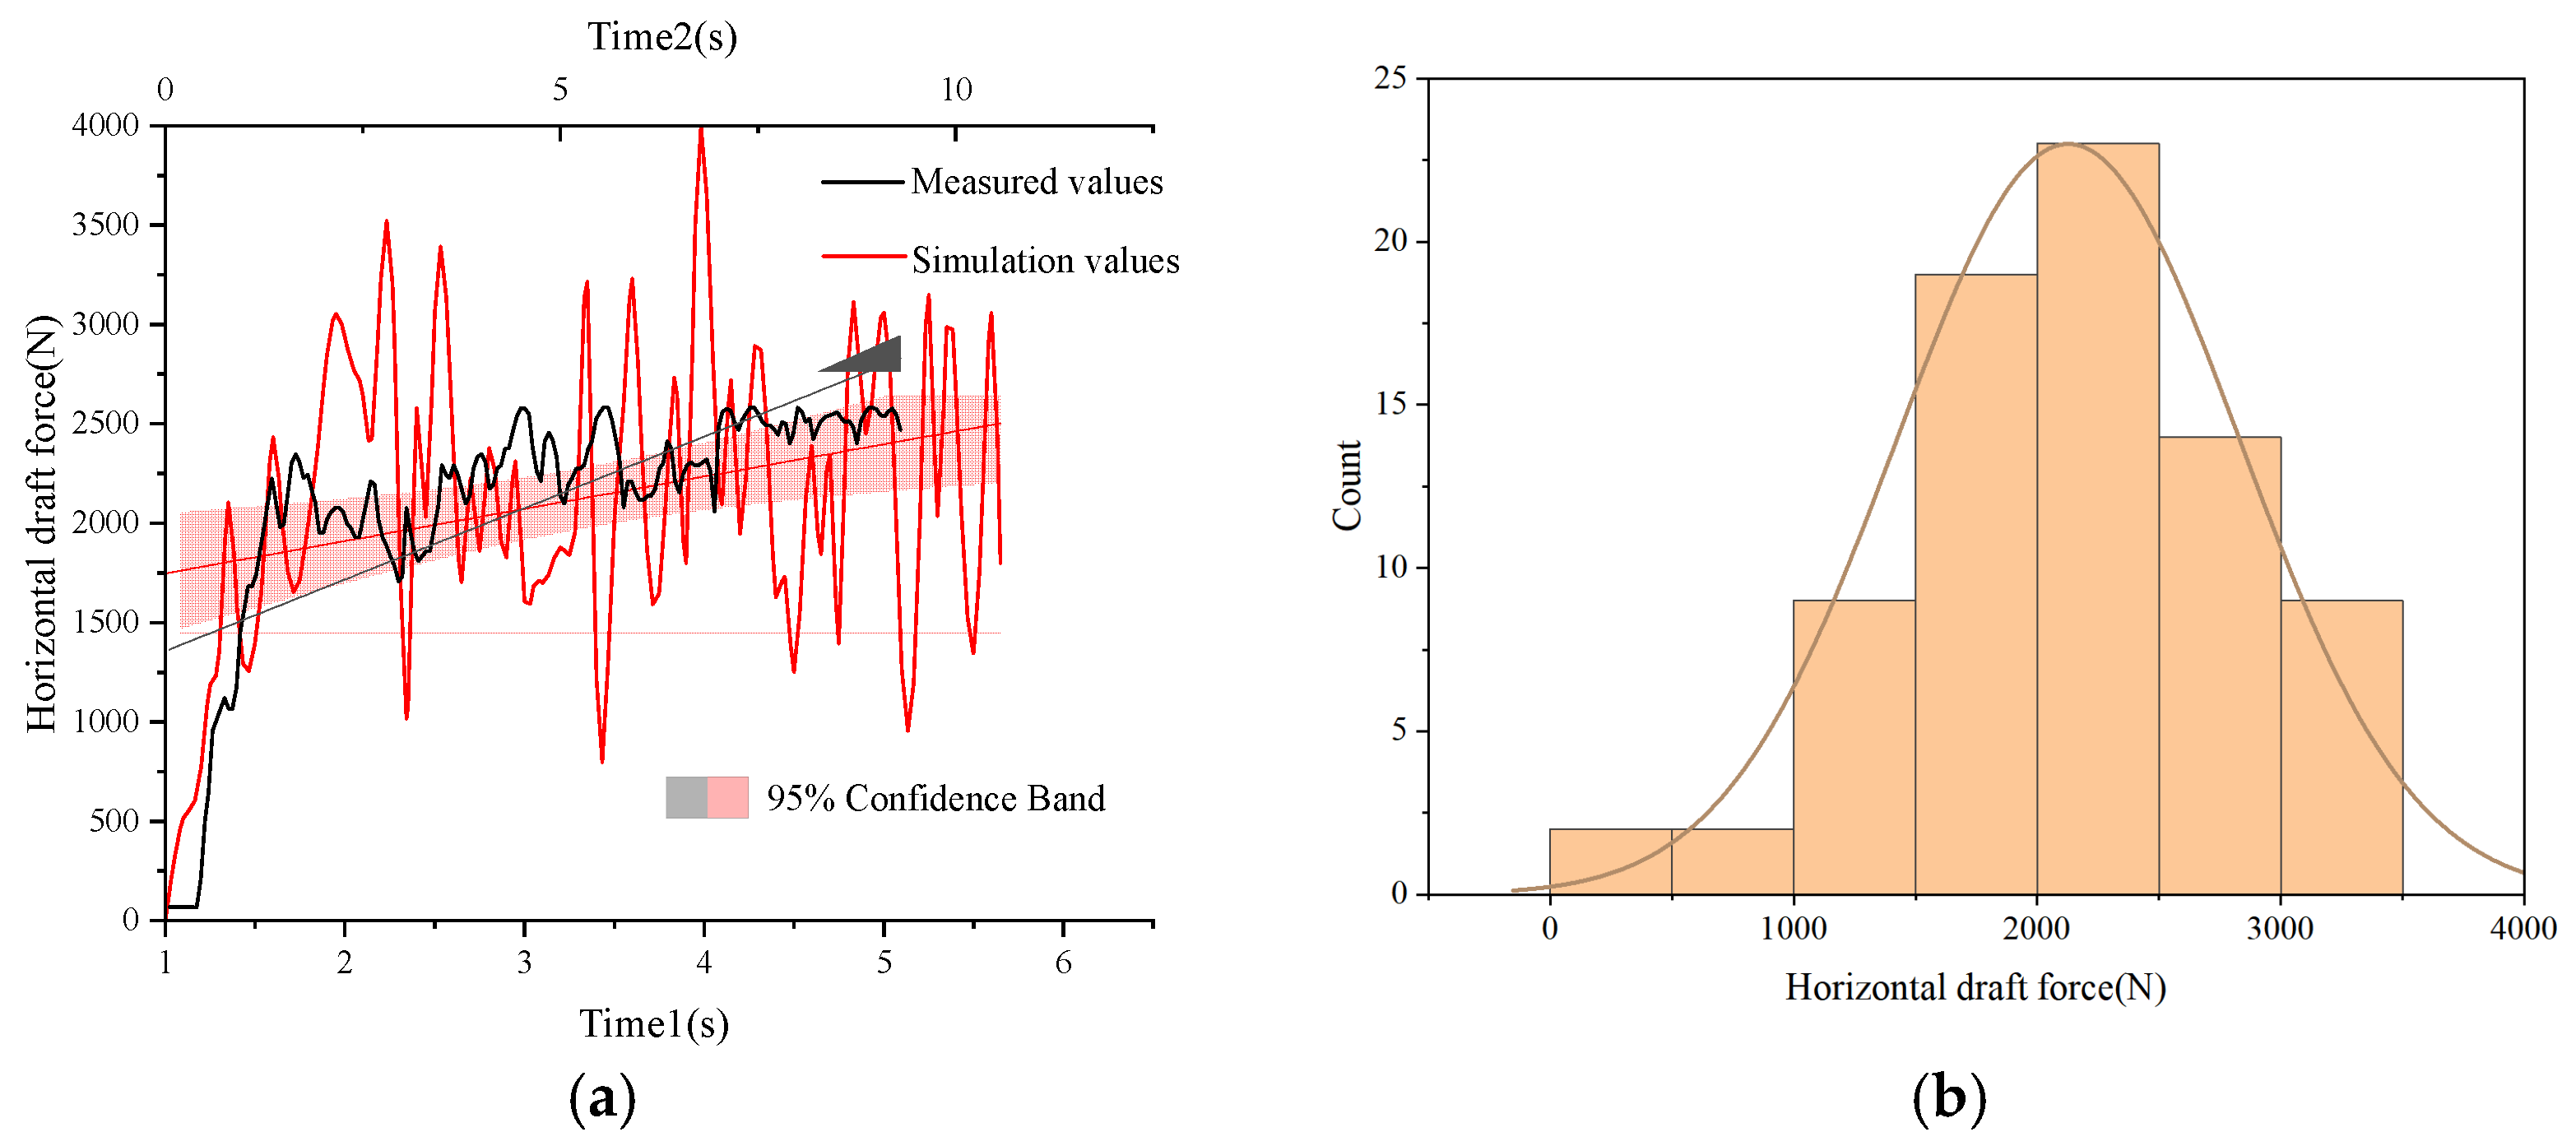
Figure 16.
Diagram of change of test parameters: (a) comparison of simulation and field experiment data; (b) normal distribution of simulation parameters.
Figure 16.
Diagram of change of test parameters: (a) comparison of simulation and field experiment data; (b) normal distribution of simulation parameters.
Table 1.
Bulk density distribution of soil at a depth of 0–200 mm in Tumshuk area.
Table 1.
Bulk density distribution of soil at a depth of 0–200 mm in Tumshuk area.
| Sampling Depth/(mm) | Bulk Density/(g·cm−3) |
|---|
| Sampling Point 1 | Sampling Point 2 | Sampling Point 3 | Sampling Point 4 | Sampling Point 5 |
|---|
| 0~50 | 1.4285 | 1.4500 | 1.3670 | 1.3393 | 1.4592 |
| 50~100 | 1.4284 | 1.4643 | 1.3930 | 1.3522 | 1.4550 |
| 100~150 | 1.4293 | 1.4939 | 1.4022 | 1.3814 | 1.4717 |
| 150~200 | 1.4702 | 1.5109 | 1.4032 | 1.3978 | 1.4857 |
Table 2.
Soil particle distribution.
Table 2.
Soil particle distribution.
| Particle Size/(mm) | Average Mass/(g) | Percentage/(%) |
|---|
| >0.4 | 9.86 | 10.90 |
| 0.315~0.4 | 7.24 | 8.00 |
| 0.2~0.315 | 15.16 | 16.76 |
| 0.154~0.2 | 10.32 | 11.41 |
| 0.1~0.154 | 15.17 | 16.77 |
| 0.056–0.1 | 26.03 | 28.77 |
| <0.056 | 6.69 | 7.39 |
Table 3.
Determination of soil simulation parameters under the JKR model.
Table 3.
Determination of soil simulation parameters under the JKR model.
| Parameter Type | Parameters | Value | Source |
|---|
| Intrinsic parameters | Soil Poisson’s Ratio | 0.5 | [14] |
| Soil Particle Density | 2500 kg·m−3 | Determination |
| Soil Shear Modulus | 1 × 10⁶ Pa/1 × 108 Pa | [11,15] |
| Steel Poisson’s Ratio | 0.3 | [16] |
| Steel Particle Density | 7850 kg·m−3 | Determination |
| Steel Shear Modulus | 7.9 × 10¹⁰ Pa | [17] |
| Contact parameters | Soil-Steel Coefficient of Restitution | 0.3 | [18,19,20,21] |
| Soil-Steel Coefficient of Static Friction | 0.5 | [18,19,20,21] |
| Soil-Steel Coefficient of Rolling Friction | 0.05 | Bibliographic |
Table 4.
Parameters to be calibrated for the JKR model.
Table 4.
Parameters to be calibrated for the JKR model.
| Factors Type | Factors | Range | Source |
|---|
| Contact parameters | Soil-Soil Coefficient of Restitution/X1 | 0.15–0.75 | Pending calibration |
| Soil-Soil Coefficient of Static Friction/X2 | 0.2–1.16 | Pending calibration |
| Soil-Soil Coefficient of Rolling Friction/X3 | 0.005–0.105 | Pending calibration |
| Model parameters | Surface Energy/X4 | 0.5–2.5 J·m−2 | Pending calibration |
Table 5.
Determination of the level of factors in the stacking angle test.
Table 5.
Determination of the level of factors in the stacking angle test.
| Levels | Factors |
|---|
| X1 | X2 | X3 | X4/J·m−2 |
|---|
| −2 | 0.15 | 0.2 | 0.005 | 0.5 |
| −1 | 0.3 | 0.44 | 0.03 | 1 |
| 0 | 0.45 | 0.68 | 0.055 | 1.5 |
| 1 | 0.6 | 0.92 | 0.08 | 2 |
| 2 | 0.75 | 1.16 | 0.105 | 2.5 |
Table 6.
Soil SAOR Central Composite test scheme and results.
Table 6.
Soil SAOR Central Composite test scheme and results.
| Test No. | Factors | SAOR/(°) | Relative Error/(%) |
|---|
| X1 | X2 | X3 | X4 |
|---|
| 1 | −1 | −1 | −1 | −1 | 14.776 | 62.7902 |
| 2 | 1 | −1 | −1 | −1 | 9.917 | 75.0264 |
| 3 | −1 | 1 | −1 | −1 | 14.439 | 63.6389 |
| 4 | 1 | 1 | −1 | −1 | 12.335 | 68.9373 |
| 5 | −1 | −1 | 1 | −1 | 23.887 | 39.8464 |
| 6 | 1 | −1 | 1 | −1 | 14.92 | 62.4276 |
| 7 | −1 | 1 | 1 | −1 | 29.729 | 25.1347 |
| 8 | 1 | 1 | 1 | −1 | 13.789 | 65.2757 |
| 9 | −1 | −1 | −1 | 1 | 21.752 | 45.2229 |
| 10 | 1 | −1 | −1 | 1 | 16.059 | 59.5593 |
| 11 | −1 | 1 | −1 | 1 | 29.542 | 25.6056 |
| 12 | 1 | 1 | −1 | 1 | 21.869 | 44.9282 |
| 13 | −1 | −1 | 1 | 1 | 51.78 | −30.3954 |
| 14 | 1 | −1 | 1 | 1 | 25.057 | 36.9000 |
| 15 | −1 | 1 | 1 | 1 | 48.183 | −21.3372 |
| 16 | 1 | 1 | 1 | 1 | 40.957 | −3.1403 |
| 17 | −2 | 0 | 0 | 0 | 6.631 | 83.3014 |
| 18 | 2 | 0 | 0 | 0 | 15.462 | 61.0627 |
| 19 | 0 | −2 | 0 | 0 | 18.538 | 53.3165 |
| 20 | 0 | 2 | 0 | 0 | 22.133 | 44.2634 |
| 21 | 0 | 0 | −2 | 0 | 10.666 | 73.1403 |
| 22 | 0 | 0 | 2 | 0 | 37.202 | 6.3158 |
| 23 | 0 | 0 | 0 | −2 | 13.2 | 66.7590 |
| 24 | 0 | 0 | 0 | 2 | 51.76 | −30.3450 |
| 25 | 0 | 0 | 0 | 0 | 19.708 | 50.3702 |
| 26 | 0 | 0 | 0 | 0 | 23.761 | 40.1637 |
| 27 | 0 | 0 | 0 | 0 | 18.466 | 53.4979 |
| 28 | 0 | 0 | 0 | 0 | 21.542 | 45.7517 |
| 29 | 0 | 0 | 0 | 0 | 24.98 | 37.0939 |
| 30 | 0 | 0 | 0 | 0 | 23.354 | 41.1886 |
Table 7.
Factors and horizontal design of the Plackett–Burman test.
Table 7.
Factors and horizontal design of the Plackett–Burman test.
| Levels | Factors |
|---|
| X1 | X2 | X3 | X4/(J·m−2) |
|---|
| −1 | 0.45 | 0.68 | 0.08 | 1.5 |
| 1 | 0.6 | 0.92 | 0.105 | 2 |
Table 8.
Statistical results of SAOR in the Plackett–Burman test.
Table 8.
Statistical results of SAOR in the Plackett–Burman test.
| Test No. | Factors | SAOR/(°) | Relative Error/(%) |
|---|
| X1 | X2 | X3 | X4 |
|---|
| 1 | 1 | 1 | −1 | 1 | 34.6155 | 12.829 |
| 2 | −1 | 1 | 1 | −1 | 31.292 | 21.199 |
| 3 | 1 | −1 | 1 | 1 | 54.0405 | −36.088 |
| 4 | −1 | 1 | −1 | 1 | 39.188 | 1.315 |
| 5 | −1 | −1 | 1 | −1 | 37.9275 | 4.489 |
| 6 | −1 | −1 | −1 | 1 | 42.4835 | −6.984 |
| 7 | 1 | −1 | −1 | −1 | 28.3945 | 28.495 |
| 8 | 1 | 1 | −1 | −1 | 27.602 | 30.491 |
| 9 | 1 | 1 | 1 | −1 | 36.004 | 9.333 |
| 10 | −1 | 1 | 1 | 1 | 47.543 | −19.726 |
| 11 | 1 | −1 | 1 | 1 | 52.4755 | −32.147 |
| 12 | −1 | −1 | −1 | −1 | 30.9735 | 22.001 |
Table 9.
ANOVA of soil SAOR regression model.
Table 9.
ANOVA of soil SAOR regression model.
| Source | Sum of Squares | df | Mean Square | F-Value | p-Value |
|---|
| Model | 846.96 | 4 | 211.45 | 37.92 | <0.0001 ** |
| X1 | 1.16 | 1 | 1.16 | 0.2070 | 0.6629 |
| X2 | 75.25 | 1 | 75.25 | 13.48 | 0.0080 ** |
| X3 | 261.57 | 1 | 261.57 | 46.84 | 0.0002 ** |
| X4 | 508.98 | 1 | 508.98 | 91.15 | >0.0001 ** |
| Residual | 39.09 | 7 | 5.58 | | |
| Cor Total | 886.05 | 11 | | | |
| R2 | | | | 0.9674 | |
Table 10.
Factor-level design of the SAOR Box–Behnken test.
Table 10.
Factor-level design of the SAOR Box–Behnken test.
| Levels | Factors |
|---|
| X2 | X3 | X4/J·m−2 |
|---|
| −1 | 0.68 | 0.08 | 1.5 |
| 0 | 0.80 | 0.0925 | 1.8 |
| 1 | 0.92 | 0.105 | 2 |
Table 11.
Box–Behnken protocol and results.
Table 11.
Box–Behnken protocol and results.
| Test No. | Factors | SAOR/(°) | Relative Error/(%) |
|---|
| X2 | X3 | X4 |
|---|
| 1 | −1 | −1 | 0 | 41.6625 | −4.92 |
| 2 | 1 | −1 | 0 | 37.586 | 5.35 |
| 3 | −1 | 1 | 0 | 42.6035 | −7.29 |
| 4 | 1 | 1 | 0 | 45.0225 | −13.38 |
| 5 | −1 | 0 | −1 | 39.6105 | 0.25 |
| 6 | 1 | 0 | −1 | 34.431 | 13.29 |
| 7 | −1 | 0 | 1 | 43.005 | −8.30 |
| 8 | 1 | 0 | 1 | 52.0275 | −31.02 |
| 9 | 0 | −1 | −1 | 33.0695 | 16.72 |
| 10 | 0 | 1 | −1 | 34.8475 | 12.25 |
| 11 | 0 | −1 | 1 | 40.7365 | −2.58 |
| 12 | 0 | 1 | 1 | 44.1315 | −11.13 |
| 13 | 0 | 0 | 0 | 44.737 | −12.66 |
| 14 | 0 | 0 | 0 | 38.1165 | 4.01 |
| 15 | 0 | 0 | 0 | 40.787 | −2.71 |
| 16 | 0 | 0 | 0 | 42.981 | −8.24 |
| 17 | 0 | 0 | 0 | 43.476 | −9.48 |
Table 12.
Analysis of variance of the SAOR Box–Behnken test.
Table 12.
Analysis of variance of the SAOR Box–Behnken test.
| Source | Sum of Squares | df | Mean Square | F-Value | p-Value |
|---|
| Model | 305.59 | 9 | 33.95 | 6.13 | 0.0130 ** |
| X2 | 0.0296 | 1 | 0.0296 | 0.0053 | 0.9438 |
| X3 | 21.27 | 1 | 21.27 | 3.84 | 0.0909 |
| X4 | 179.95 | 1 | 179.95 | 32.49 | 0.0007 ** |
| X2X3 | 10.55 | 1 | 10.55 | 1.90 | 0.2100 |
| X2X4 | 45.68 | 1 | 45.68 | 8.25 | 0.0239 * |
| X3X4 | 0.9200 | 1 | 0.9200 | 0.1661 | 0.6958 |
| 14.97 | 1 | 14.97 | 2.70 | 0.1441 |
| 20.13 | 1 | 20.13 | 3.63 | 0.0983 |
| 1.95 | 1 | 1.95 | 0.3526 | 0.5713 |
| X2X3X4 | 0.0000 | 0 | | | |
| Residual | 38.77 | 7 | 5.54 | | |
| Lack of Fit | 11.58 | 3 | 3.86 | 0.5682 | 0.6649 |
| Pure Error | 27.18 | 4 | 6.80 | | |
| Cor Total | 344.36 | 16 | | | |
| R2 | | | | 0.8874 | |
Table 13.
SAOR size under soil simulation conditions with different moisture contents.
Table 14.
Values of each parameter of the bonding model.
Table 14.
Values of each parameter of the bonding model.
| Type | Parameters | Range | Source |
|---|
Model
Parameters | Normal Stiffness per unit area Z1 | 3.5 × 10⁸–2.55 × 10⁹ N·m−3 | Pending calibration |
| Shear Stiffness per unit area Z2 | 1 × 10⁸–9 × 10⁸ N·m−3 | Pending calibration |
| Critical Normal Stress Z3 | 1 × 10⁵–9 × 10⁵ Pa | Pending calibration |
| Critical Shear Stress Surface Energy Z4 | 1 × 10⁵–9 × 10⁵ Pa | Pending calibration |
| Bonded Disk Radius Z5 | 2–4 mm | Pending calibration [24,25,26,27,28,29,30,31,32,33] |
Table 15.
Levels of factors in bonding model experiments.
Table 15.
Levels of factors in bonding model experiments.
| Levels | Factors |
|---|
| Z1/(N·m−3) | Z2/(N·m−3) | Z3/(Pa) | Z4/(Pa) | Z5/(mm) |
|---|
| −2.378 | 3.5 × 10⁸ | 1 × 10⁸ | 1 × 10⁵ | 1 × 10⁵ | 2 |
| −1 | 9 × 10⁸ | 3 × 10⁸ | 3 × 10⁵ | 3 × 10⁵ | 2.5 |
| 0 | 1.45 × 10⁹ | 5 × 10⁸ | 5 × 10⁵ | 5 × 10⁵ | 3 |
| 1 | 2 × 10⁹ | 7 × 10⁸ | 7 × 10⁵ | 7 × 10⁵ | 3.5 |
| 2.378 | 2.55 × 10⁹ | 9 × 10⁸ | 9 × 10⁵ | 9 × 10⁵ | 4 |
Table 16.
Simulation test scheme and results of Central Composite without confined compression.
Table 16.
Simulation test scheme and results of Central Composite without confined compression.
| Test No. | Factors | UCF/(N) | Relative Error/(%) |
|---|
| Z1 | Z2 | Z3 | Z4 | Z5 |
|---|
| 1 | −1 | −1 | −1 | −1 | 1 | 766 | 152.81 |
| 2 | 1 | −1 | −1 | −1 | −1 | 314.3 | 3.73 |
| 3 | −1 | 1 | −1 | −1 | −1 | 336.8 | 11.16 |
| 4 | 1 | 1 | −1 | −1 | 1 | 658.5 | 117.33 |
| 5 | −1 | −1 | 1 | −1 | −1 | 555 | 83.17 |
| 6 | 1 | −1 | 1 | −1 | 1 | 990.2 | 226.80 |
| 7 | −1 | 1 | 1 | −1 | 1 | 734 | 142.24 |
| 8 | 1 | 1 | 1 | −1 | −1 | 420.4 | 38.75 |
| 9 | −1 | −1 | −1 | 1 | −1 | 472.4 | 55.91 |
| 10 | 1 | −1 | −1 | 1 | 1 | 548.6 | 81.06 |
| 11 | −1 | 1 | −1 | 1 | 1 | 818.3 | 170.07 |
| 12 | 1 | 1 | −1 | 1 | −1 | 387.2 | 27.79 |
| 13 | −1 | −1 | 1 | 1 | 1 | 1598.6 | 427.59 |
| 14 | 1 | −1 | 1 | 1 | −1 | 788.2 | 160.13 |
| 15 | −1 | 1 | 1 | 1 | −1 | 737 | 143.23 |
| 16 | 1 | 1 | 1 | 1 | 1 | 1335.9 | 340.89 |
| 17 | −2.378 | 0 | 0 | 0 | 0 | 606 | 100.00 |
| 18 | 2.378 | 0 | 0 | 0 | 0 | 895.2 | 195.45 |
| 19 | 0 | −2.378 | 0 | 0 | 0 | 672.9 | 122.08 |
| 20 | 0 | 2.378 | 0 | 0 | 0 | 815.6 | 169.17 |
| 21 | 0 | 0 | −2.378 | 0 | 0 | 65.5 | −78.38 |
| 22 | 0 | 0 | 2.378 | 0 | 0 | 947.4 | 212.67 |
| 23 | 0 | 0 | 0 | −2.378 | 0 | 255.8 | −15.58 |
| 24 | 0 | 0 | 0 | 2.378 | 0 | 840.6 | 177.43 |
| 25 | 0 | 0 | 0 | 0 | −2.378 | 478.2 | 57.82 |
| 26 | 0 | 0 | 0 | 0 | 2.378 | 1276.7 | 321.35 |
| 27 | 0 | 0 | 0 | 0 | 0 | 866.1 | 185.84 |
| 28 | 0 | 0 | 0 | 0 | 0 | 866.1 | 185.84 |
| 29 | 0 | 0 | 0 | 0 | 0 | 866.1 | 185.84 |
| 30 | 0 | 0 | 0 | 0 | 0 | 866.1 | 185.84 |
| 31 | 0 | 0 | 0 | 0 | 0 | 866.1 | 185.84 |
| 32 | 0 | 0 | 0 | 0 | 0 | 866.7 | 186.04 |
Table 17.
Factor-level design of the UCF Box–Behnken test.
Table 17.
Factor-level design of the UCF Box–Behnken test.
| Levels | Factors |
|---|
| Z1/(N·m−3) | Z2/(N·m−3) | Z3/(Pa) | Z4/(Pa) | Z5/(mm) |
|---|
| −1 | 1.45 × 10⁹ | 3 × 10⁸ | 300,000 | 100,000 | 2.5 |
| 0 | 1.73 × 10⁹ | 4 × 10⁸ | 400,000 | 200,000 | 2.75 |
| 1 | 2.00 × 10⁹ | 5 × 10⁸ | 500,000 | 300,000 | 3 |
Table 18.
Results of Box–Behnken test.
Table 18.
Results of Box–Behnken test.
| Test No. | Factors | UCF/(N) | Relative Error/(%) |
|---|
| Z1 | Z2 | Z3 | Z4 | Z5 |
|---|
| 1 | −1 | −1 | 0 | 0 | 0 | 429.2 | 41.65 |
| 2 | 1 | −1 | 0 | 0 | 0 | 431.6 | 42.44 |
| 3 | −1 | 1 | 0 | 0 | 0 | 380.9 | 25.71 |
| 4 | 1 | 1 | 0 | 0 | 0 | 374.5 | 23.60 |
| 5 | 0 | 0 | −1 | −1 | 0 | 271 | −10.56 |
| 6 | 0 | 0 | 1 | −1 | 0 | 338.4 | 11.68 |
| 7 | 0 | 0 | −1 | 1 | 0 | 376.3 | 24.19 |
| 8 | 0 | 0 | 1 | 1 | 0 | 523.3 | 72.71 |
| 9 | 0 | −1 | 0 | 0 | −1 | 378 | 24.75 |
| 10 | 0 | 1 | 0 | 0 | −1 | 389.5 | 28.55 |
| 11 | 0 | −1 | 0 | 0 | 1 | 473.8 | 56.37 |
| 12 | 0 | 1 | 0 | 0 | 1 | 457.2 | 50.89 |
| 13 | −1 | 0 | −1 | 0 | 0 | 394.6 | 30.23 |
| 14 | 1 | 0 | −1 | 0 | 0 | 331.7 | 9.47 |
| 15 | −1 | 0 | 1 | 0 | 0 | 428.6 | 41.45 |
| 16 | 1 | 0 | 1 | 0 | 0 | 440 | 45.21 |
| 17 | 0 | 0 | 0 | −1 | −1 | 223.6 | −26.20 |
| 18 | 0 | 0 | 0 | 1 | −1 | 420.6 | 38.81 |
| 19 | 0 | 0 | 0 | −1 | 1 | 301.8 | −0.40 |
| 20 | 0 | 0 | 0 | 1 | 1 | 544.9 | 79.83 |
| 21 | 0 | −1 | −1 | 0 | 0 | 350.9 | 15.81 |
| 22 | 0 | 1 | −1 | 0 | 0 | 341.1 | 12.57 |
| 23 | 0 | −1 | 1 | 0 | 0 | 460.3 | 51.91 |
| 24 | 0 | 1 | 1 | 0 | 0 | 410 | 35.31 |
| 25 | −1 | 0 | 0 | −1 | 0 | 262.2 | −13.47 |
| 26 | 1 | 0 | 0 | −1 | 0 | 289.6 | −4.42 |
| 27 | −1 | 0 | 0 | 1 | 0 | 500.7 | 65.25 |
| 28 | 1 | 0 | 0 | 1 | 0 | 554.5 | 83.00 |
| 29 | 0 | 0 | −1 | 0 | −1 | 305.4 | 0.79 |
| 30 | 0 | 0 | 1 | 0 | −1 | 374.7 | 23.66 |
| 31 | 0 | 0 | −1 | 0 | 1 | 390 | 28.71 |
| 32 | 0 | 0 | 1 | 0 | 1 | 477.9 | 57.72 |
| 33 | −1 | 0 | 0 | 0 | −1 | 345.4 | 13.99 |
| 34 | 1 | 0 | 0 | 0 | −1 | 349.1 | 15.21 |
| 35 | −1 | 0 | 0 | 0 | 1 | 457.9 | 51.12 |
| 36 | 1 | 0 | 0 | 0 | 1 | 464.3 | 53.23 |
| 37 | 0 | −1 | 0 | −1 | 0 | 342.9 | 13.17 |
| 38 | 0 | 1 | 0 | −1 | 0 | 227.9 | −24.79 |
| 39 | 0 | −1 | 0 | 1 | 0 | 570.5 | 88.28 |
| 40 | 0 | 1 | 0 | 1 | 0 | 481.6 | 58.94 |
| 41 | 0 | 0 | 0 | 0 | 0 | 394 | 30.03 |
| 42 | 0 | 0 | 0 | 0 | 0 | 411.9 | 35.94 |
| 43 | 0 | 0 | 0 | 0 | 0 | 393.9 | 30.00 |
| 44 | 0 | 0 | 0 | 0 | 0 | 404.1 | 33.37 |
| 45 | 0 | 0 | 0 | 0 | 0 | 412 | 35.97 |
| 46 | 0 | 0 | 0 | 0 | 0 | 409.7 | 35.21 |
Table 19.
Analysis of variance of the UCF Box–Behnken test.
Table 19.
Analysis of variance of the UCF Box–Behnken test.
| Source | Sum of Squares | df | Mean Square | F-Value | p-Value |
|---|
| Model | 185.69 | 19 | 9.77 | 63.07 | <0.0001 ** |
| Z1 | 0.0025 | 1 | 0.0025 | 0.0161 | 0.8999 |
| Z2 | 0.3045 | 1 | 0.3045 | 1.97 | 0.1728 |
| Z3 | 19.16 | 1 | 19.16 | 123.64 | <0.0001 ** |
| Z4 | 110.76 | 1 | 110.76 | 714.77 | <0.0001 ** |
| Z5 | 24.20 | 1 | 24.20 | 156.19 | <0.0001 ** |
| Z1Z2 | 0.0124 | 1 | 0.0124 | 0.0799 | 0.7797 |
| Z1Z3 | 0.9268 | 1 | 0.9268 | 5.98 | 0.0215 * |
| Z1Z4 | 0.0300 | 1 | 0.0300 | 0.1937 | 0.6635 |
| Z2Z4 | 0.5487 | 1 | 0.5487 | 3.54 | 0.0711 |
| Z3Z4 | 0.5958 | 1 | 0.5958 | 3.84 | 0.0607 |
| 0.1030 | 1 | 0.1030 | 0.6647 | 0.4223 |
| 0.5223 | 1 | 0.5223 | 3.37 | 0.0778 |
| 1.04 | 1 | 1.04 | 6.69 | 0.0157 * |
| 2.62 | 1 | 2.62 | 16.90 | 0.0003 ** |
| Z2 | 0.5662 | 1 | 0.5662 | 3.65 | 0.0670 |
| Z1 | 0.3500 | 1 | 0.3500 | 2.26 | 0.1449 |
| Z1 | 0.6181 | 1 | 0.6181 | 3.99 | 0.0564 |
| Z2 | 3.50 | 1 | 3.50 | 22.57 | <0.0001 ** |
| Z4 | 4.21 | 1 | 4.21 | 27.14 | <0.0001 ** |
| Residual | 4.03 | 26 | 0.1550 | | |
| Lack of Fit | 3.80 | 21 | 0.1812 | | |
| Pure Error | 0.2238 | 5 | 0.0448 | 4.05 | 0.0634 |
| Cor Total | 189.72 | 45 | | | |
| R2 | | | | 0.9788 | |
| | | | 0.9632 | |
| | | | 0.9009 | |
Table 20.
Summary of model response value suitability.
Table 20.
Summary of model response value suitability.
| Soil Type | Source | Sequential
p-Value | Lack of Fit
p-Value | Adjusted R2 | Predicted R2 | |
|---|
| 4 ± 1 | Linear | 0.0241 | 0.1415 | 0.4304 | 0.1391 | Suggested |
| 2FI | 0.3066 | 0.1365 | 0.4402 | −0.1314 | |
| Quadratic | 0.0923 | 0.2419 | 0.6356 | −0.0547 | |
| Cubit | 0.1129 | 0.6041 | 0.7868 | 0.4552 | Aliased |
| 8 ± 1 | Linear | 0.0015 | 0.0023 | 0.6724 | 0.5494 | |
| 2FI | 0.5182 | 0.0019 | 0.6535 | 0.4821 | |
| Quadratic | <0.0001 | 0.1998 | 0.9734 | 0.9196 | Suggested |
| Cubit | 0.3611 | 0.1296 | 0.9752 | 0.6768 | Aliased |
| 12 ± 1 | Linear | <0.0001 | 0.0420 | 0.8677 | 0.8425 | Suggested |
| 2FI | 0.9850 | 0.0252 | 0.8378 | 0.7237 | |
| Quadratic | 0.1108 | 0.0339 | 0.8613 | 0.7004 | |
| Cubit | 0.1170 | 0.0621 | 0.9169 | 0.0286 | Aliased |
| 16 ± 1 | Linear | <0.0001 | 0.0011 | 0.8207 | 0.6954 | |
| 2FI | 0.0374 | 0.0022 | 0.8801 | 0.8169 | |
| Quadratic | 0.0005 | 0.0664 | 0.9823 | 0.9376 | Suggested |
| Cubit | 0.3623 | 0.0359 | 0.9834 | 0.6846 | Aliased |
| 20 ± 1 | Linear | 0.0015 | 0.0023 | 0.6724 | 0.5494 | |
| 2FI | 0.5182 | 0.0019 | 0.6535 | 0.4821 | |
| Quadratic | <0.0001 | 0.1998 | 0.9734 | 0.9196 | Suggested |
| Cubit | 0.3611 | 0.1296 | 0.9752 | 0.6768 | Aliased |
Table 21.
Comparison of simulated and measured pressure resistance of soils with different moisture contents.
Table 21.
Comparison of simulated and measured pressure resistance of soils with different moisture contents.
| Moisture Content /(%) | Factors | UCF/(N) | Relative Error/(%) |
|---|
| Z1/(N·m−3) | Z2/(N·m−3) | Z3/(Pa) | Z4/(Pa) | Z5/(mm) | Measured Values | Simulation Values |
|---|
| 1 ± 1 | 1.8 × 10⁹ | 4.89 × 10⁸ | 315,298 | 157,644 | 2.751 | 303 | 303.2 | 0.06 |
| 4 ± 1 | 1.72 × 10⁹ | 5 × 10⁸ | 541,703 | 500,000 | 3 | 892 | 893 | 0.11 |
| 8 ± 1 | 1.45 × 10⁹ | 5 × 10⁸ | 140,800 | 151,000 | 3 | 123.5 | 125.3 | 1.46 |
| 12 ± 1 | 1.69 × 10⁹ | 4.01 × 10⁸ | 339,308 | 104,379 | 2.724 | 258 | 260.7 | 1.04 |
| 16 ± 1 | 1.45 × 10⁹ | 5 × 10⁸ | 161,048 | 172,073 | 3 | 189 | 192 | 1.69 |
| 20 ± 1 | 1.45 × 10⁹ | 5 × 10⁸ | 179,380 | 176,998 | 3 | 226 | 226.6 | 0.265 |

