Article

GLL-YOLO: A Lightweight Network for Detecting the Maturity of Blueberry Fruits

1
College of Information and Technology, Jilin Agricultural University, Changchun 130118, China
2
College of Engineering and Technology, Jilin Agricultural University, Changchun 130118, China
*
Author to whom correspondence should be addressed.
Agriculture 2025, 15(17), 1877; https://doi.org/10.3390/agriculture15171877
Submission received: 6 August 2025 / Revised: 31 August 2025 / Accepted: 1 September 2025 / Published: 3 September 2025
(This article belongs to the Section Artificial Intelligence and Digital Agriculture)

Abstract

The traditional detection of blueberry maturity relies on human experience, which is inefficient and highly subjective. Although deep learning methods have improved accuracy, they require large models and complex computations, making real-time deployment on resource-constrained edge devices difficult. To address these issues, a GLL-YOLO method based on the YOLOv8 network is proposed to deal with problems such as fruit occlusion and complex backgrounds in mature blueberry detection. This approach utilizes the GhostNetV2 network as the backbone. The LIMC module is suggested to substitute the original C2f module. Meanwhile, a Lightweight Shared Convolution Detection Head (LSCD) module is designed to build the GLL-YOLO model. This model can accurately detect blueberries at three different maturity stages: unripe, semi-ripe, and ripe. It significantly reduces the number of model parameters and floating-point operations while maintaining high accuracy. Experimental results show that GLL-YOLO outperforms the original YOLOv8 model in terms of accuracy, with mAP improvements of 4.29%, 1.67%, and 1.39% for unripe, semi-ripe, and ripe blueberries, reaching 94.51%, 91.72%, and 93.32%, respectively. Compared to the original model, GLL-YOLO improved the accuracy, recall rate, and mAP by 2.3%, 5.9%, and 1%, respectively. Meanwhile, GLL-YOLO reduces parameters, FLOPs, and model size by 50%, 39%, and 46.7%, respectively, while maintaining accuracy. This method has the advantages of a small model size, high accuracy, and good detection performance, providing reliable support for intelligent blueberry harvesting.

1. Introduction

Blueberry is an important agricultural economic crop that originated in North America and parts of Asia. It is now widely cultivated, particularly in China. Studies indicate that blueberries are rich in anthocyanins, vitamin C, polyphenols, and dietary fiber, which contribute to antioxidation, promote cardiovascular health, enhance immunity, and effectively prevent various chronic diseases [1]. During the planting period, the color of the blueberry peel serves as a crucial indicator for assessing the maturity of the fruit. Throughout the ripening process, the levels of endogenous hormones and soluble sugars in the fruit increase; the decomposition rate of chlorophyll accelerates; its synthesis is hindered; and the concentrations of chlorophyll and carotenoids decrease. Meanwhile, anthocyanins continue to accumulate, resulting in a color transition from initial green to red, and ultimately to blue [2]. Blueberry fruits have a short harvest cycle, with multiple stages of ripeness coexisting. Furthermore, blueberry products at different ripeness levels exhibit significant variations in taste and nutritional content. Therefore, accurate identification of ripeness is essential. Currently, traditional manual detection methods are employed to assess the ripeness of blueberries. However, this approach is not only time-consuming and inefficient but also leads to considerable fruit waste during the actual picking process. Consequently, there is an urgent need for an efficient method to detect the maturity of blueberry fruits.
In recent years, algorithms for detecting fruit maturity based on traditional image processing techniques have exhibited a trend toward diversification. For instance, Liu et al. developed a method for detecting partially red apples by utilizing color and shape features and employing Histogram of Oriented Gradient (HOG) features in conjunction with a linear Support Vector Machine (SVM) classifier to assess apple ripeness [3]. Wan et al. introduced a tomato maturity detection approach that integrates color feature values with a Back Propagation Neural Network (BPNN) classifier, achieving an accuracy rate of 99.31% on tomato samples [4]. Ripardo et al. proposed a technique for melon maturity detection based on the prediction of the Soluble Solids Content (SSC) from digital images, where a Multilayer Perceptron (MLP) model combined with RGB features yielded the highest accuracy [5]. Additionally, Li et al. applied an integrated approach combining Non-Negative Matrix Factorization (NMF) filtering and Root Mean Square (RMS) normalization alongside an SVM learning model to classify watermelons at varying stages of maturity [6]. Despite the effectiveness of these traditional fruit recognition algorithms under specific conditions, they generally suffer from limitations such as limited environmental adaptability, high computational complexity, and slow processing speeds. Moreover, their recognition accuracy tends to decline significantly when confronted with complex backgrounds or fruit occlusions, thereby hindering their applicability in dynamic real-world environments.
With the advancement of deep learning techniques, methods for detecting fruit maturity in natural environments have been extensively investigated. For instance, Huang et al. introduced a fuzzy Mask R-CNN model to automatically identify the ripeness of cherry tomatoes. Their approach involved converting RGB images into the HSV color space to extract color features from the tomato surface and subsequently detecting different ripening stages by integrating fuzzy inference rules [7]. Similarly, Jing et al. developed the Slim Neck paradigm, leveraging MobileNetv3 to efficiently assess the maturity of melons, achieving promising results on a greenhouse dataset [8]. Momeny et al. employed a fine-tuned ResNet-50 model to classify four types of citrus fruits according to maturity, demonstrating accurate detection even in fruits exhibiting black spots [9]. Additionally, Pisharody et al. proposed SegLoRA, a novel segmentation framework designed to precisely estimate tomato maturity and predict yield [10]. Collectively, these studies underscore the significant potential of deep learning approaches for fruit maturity detection in natural settings and offer valuable insights for advancing maturity assessment techniques in blueberry fruits.
Previous research has extensively investigated blueberry fruit analysis. For instance, Tan et al. introduced a computer vision approach for recognizing blueberries at various ripening stages using color images. This technique integrates Histogram of Oriented Gradient (HOG) features with color information to differentiate ripeness levels; the average accuracy for immature, medium, and mature fruits is 86.0%, 94.2% and 96.0, respectively [11]. To address the complex environmental challenges of dense aggregation and occlusion of blueberries in natural environments, Yang et al. developed a lightweight recognition model based on the enhanced YOLOv5 architecture [12]. To tackle issues arising from the small size and dense distribution of blueberries during detection, Gai et al. proposed the TL-YOLOv8 algorithm, which leverages transfer learning to improve the model’s generalization capabilities and training efficiency [13]. Additionally, MacEachern et al. constructed six deep learning convolutional neural network (CNN) models aimed at determining the maturity stages of wild blueberries and estimating yield [14]. The above research provides a powerful and effective crop recognition model for blueberry fruit detection, which is an important technical foundation of this paper. However, it still faces triple challenges when facing practical deployment. High-precision models are often accompanied by huge computing and storage overheads, and it is difficult to meet the stringent resource constraints of embedded platforms. In addition, the effectiveness of many methods is easily influenced by the complex field environment (such as changes in illumination, occlusion, and background interference), and the generalization ability and robustness need to be improved.
Despite advancements in blueberry fruit detection research, challenges persist in balancing model complexity with detection accuracy, particularly regarding small target identification and occlusion resilience. Blueberries are characteristically small and densely clustered, and their detection is complicated by factors such as complex backgrounds, variable lighting conditions, and fruit occlusion in natural settings. These factors pose significant obstacles to the precision and robustness of deep learning-based models. Although prior studies have addressed some issues by enhancing the YOLO architecture, employing transfer learning, and utilizing convolutional neural networks, these approaches often entail substantial computational demands and exhibit limited adaptability to complex real-world environments. Consequently, this study seeks to develop a lightweight yet highly accurate method for blueberry fruit detection and ripeness recognition, specifically designed to address challenges including dense small target distribution and intricate background interference. The proposed approach aims to facilitate precise maturity assessments, enabling efficient harvesting and real-time monitoring, thereby contributing to improved operational efficiency, quality assurance, loss reduction, and the sustainable and intelligent advancement of the blueberry industry.

2. Materials and Methods

2.1. Image Data Acquisition

In this study, blueberry sample data were collected intermittently over a 30-day period from June to July 2024 at the Small Berry Genetic Breeding Center of Jilin Agricultural University, located in the Nanguan District of Changchun City, Jilin Province, China. The blueberry variety selected in this study was “Ruizhu”, which belongs to the very early ripening type, and the fruit ripened in late June under open cultivation conditions. Its shape is compact, the fruit is large, and it is dark blue when ripe. The average weight of each fruit is 2.09 g, and the maximum weight is 2.37 g. The taste is sweet and sour, and the flavor is excellent, as a new variety of blueberries. To enhance the dataset’s robustness, blueberry samples were obtained at various sites during different times of the day, including the morning, afternoon, evening, and other routine operational periods. The study site is characterized by a typical temperate continental sub-humid monsoon climate, featuring four distinct seasons, including a mild climate, abundant rainfall, and ample sunshine, thereby providing favorable conditions for blueberry cultivation. Images were captured using a built-in high-resolution digital camera of an iPhone 12 Pro Max (Apple Inc., Cupertino, CA, USA), with an exposure time of 1/26 s and a focal length of 26 mm. Ultimately, a total of 2584 blueberry fruit images, each with a resolution of 3024 × 3024 pixels, were acquired at a shooting distance ranging from 20 to 60 cm. In this paper, the blueberry fruits depicted in the collected images are categorized into three maturity stages: immature, medium, and ripe. Figure 1 illustrates the maturity levels, where Figure 1a corresponds to unripe blueberries, Figure 1b corresponds to semi-ripe blueberries, and Figure 1c corresponds to fully ripe blueberries.

2.2. Image Annotation and Dataset Construction

To construct the dataset, Labelimg software (Version: 1.8.6) was used for manual annotation, where a single person annotated the fruit’s position and its maturity in each image according to a unified standard. Blueberry fruits were classified into one of three categories: ripe, semi-ripe, or unripe. The 2584 labeled blueberry images were divided into a training set, test set, and validation set according to the ratio of 7:2:1. After annotation, each blueberry fruit image obtained an Extensible Markup Language (XML) file containing its category and coordinate information.
The blueberry fruit dataset was divided into a training set, test set, and validation set, and the data distribution is shown in Table 1. The training set contains 1809 blueberry fruit images, which include 21,164 target blueberry fruits. Of these fruits, 7334 were immature blueberries, 5182 were semi-ripe blueberries, and 8648 were immature blueberries. The validation set contained 516 blueberry fruit images, including 6218 target blueberry fruits. In these images, there were 2310 unripe blueberry fruits, 1695 semi-ripe blueberry fruits, and 2213 ripe blueberry fruits. In the validation set, 259 blueberry fruit images were included. Among them, there were 1119 unripe blueberries, 687 semi-ripe blueberries, and 1049 ripe blueberries.
In order to improve the generalization and robustness of the model and prevent overfitting in the training process, the dataset was expanded using data enhancement techniques such as the random enhancement of image brightness, random rotation, and random inversion for the labeled blueberry fruits in the training set. The 1809 blueberry images in the training set were expanded to 5427 images by data augmentation. Randomly increasing the brightness of the image allowed the model to adapt to different lighting conditions and increase its sensitivity to color. Random flip transformed the original blueberry fruit image randomly along the horizontal and vertical directions to expand the diversity of occluded samples from different angles of blueberry fruits. The sample image after data enhancement is shown in Figure 2, where Figure 2a is the original image obtained by direct shooting; Figure 2b is the random brightness-enhanced image; Figure 2c is the effect image after adding random flipping; and Figure 2d is the effect image after adding random rotation. Image enhancement not only improves the detection ability of the model for different angles and different lighting conditions of the fruit, but also enhances its robustness to fruit occlusion, thereby improving the accuracy and stability of detection. These augmented images will help the model achieve more accurately and reliably in practice.

3. GLL-YOLO Network Model

3.1. Improved GLL-YOLO

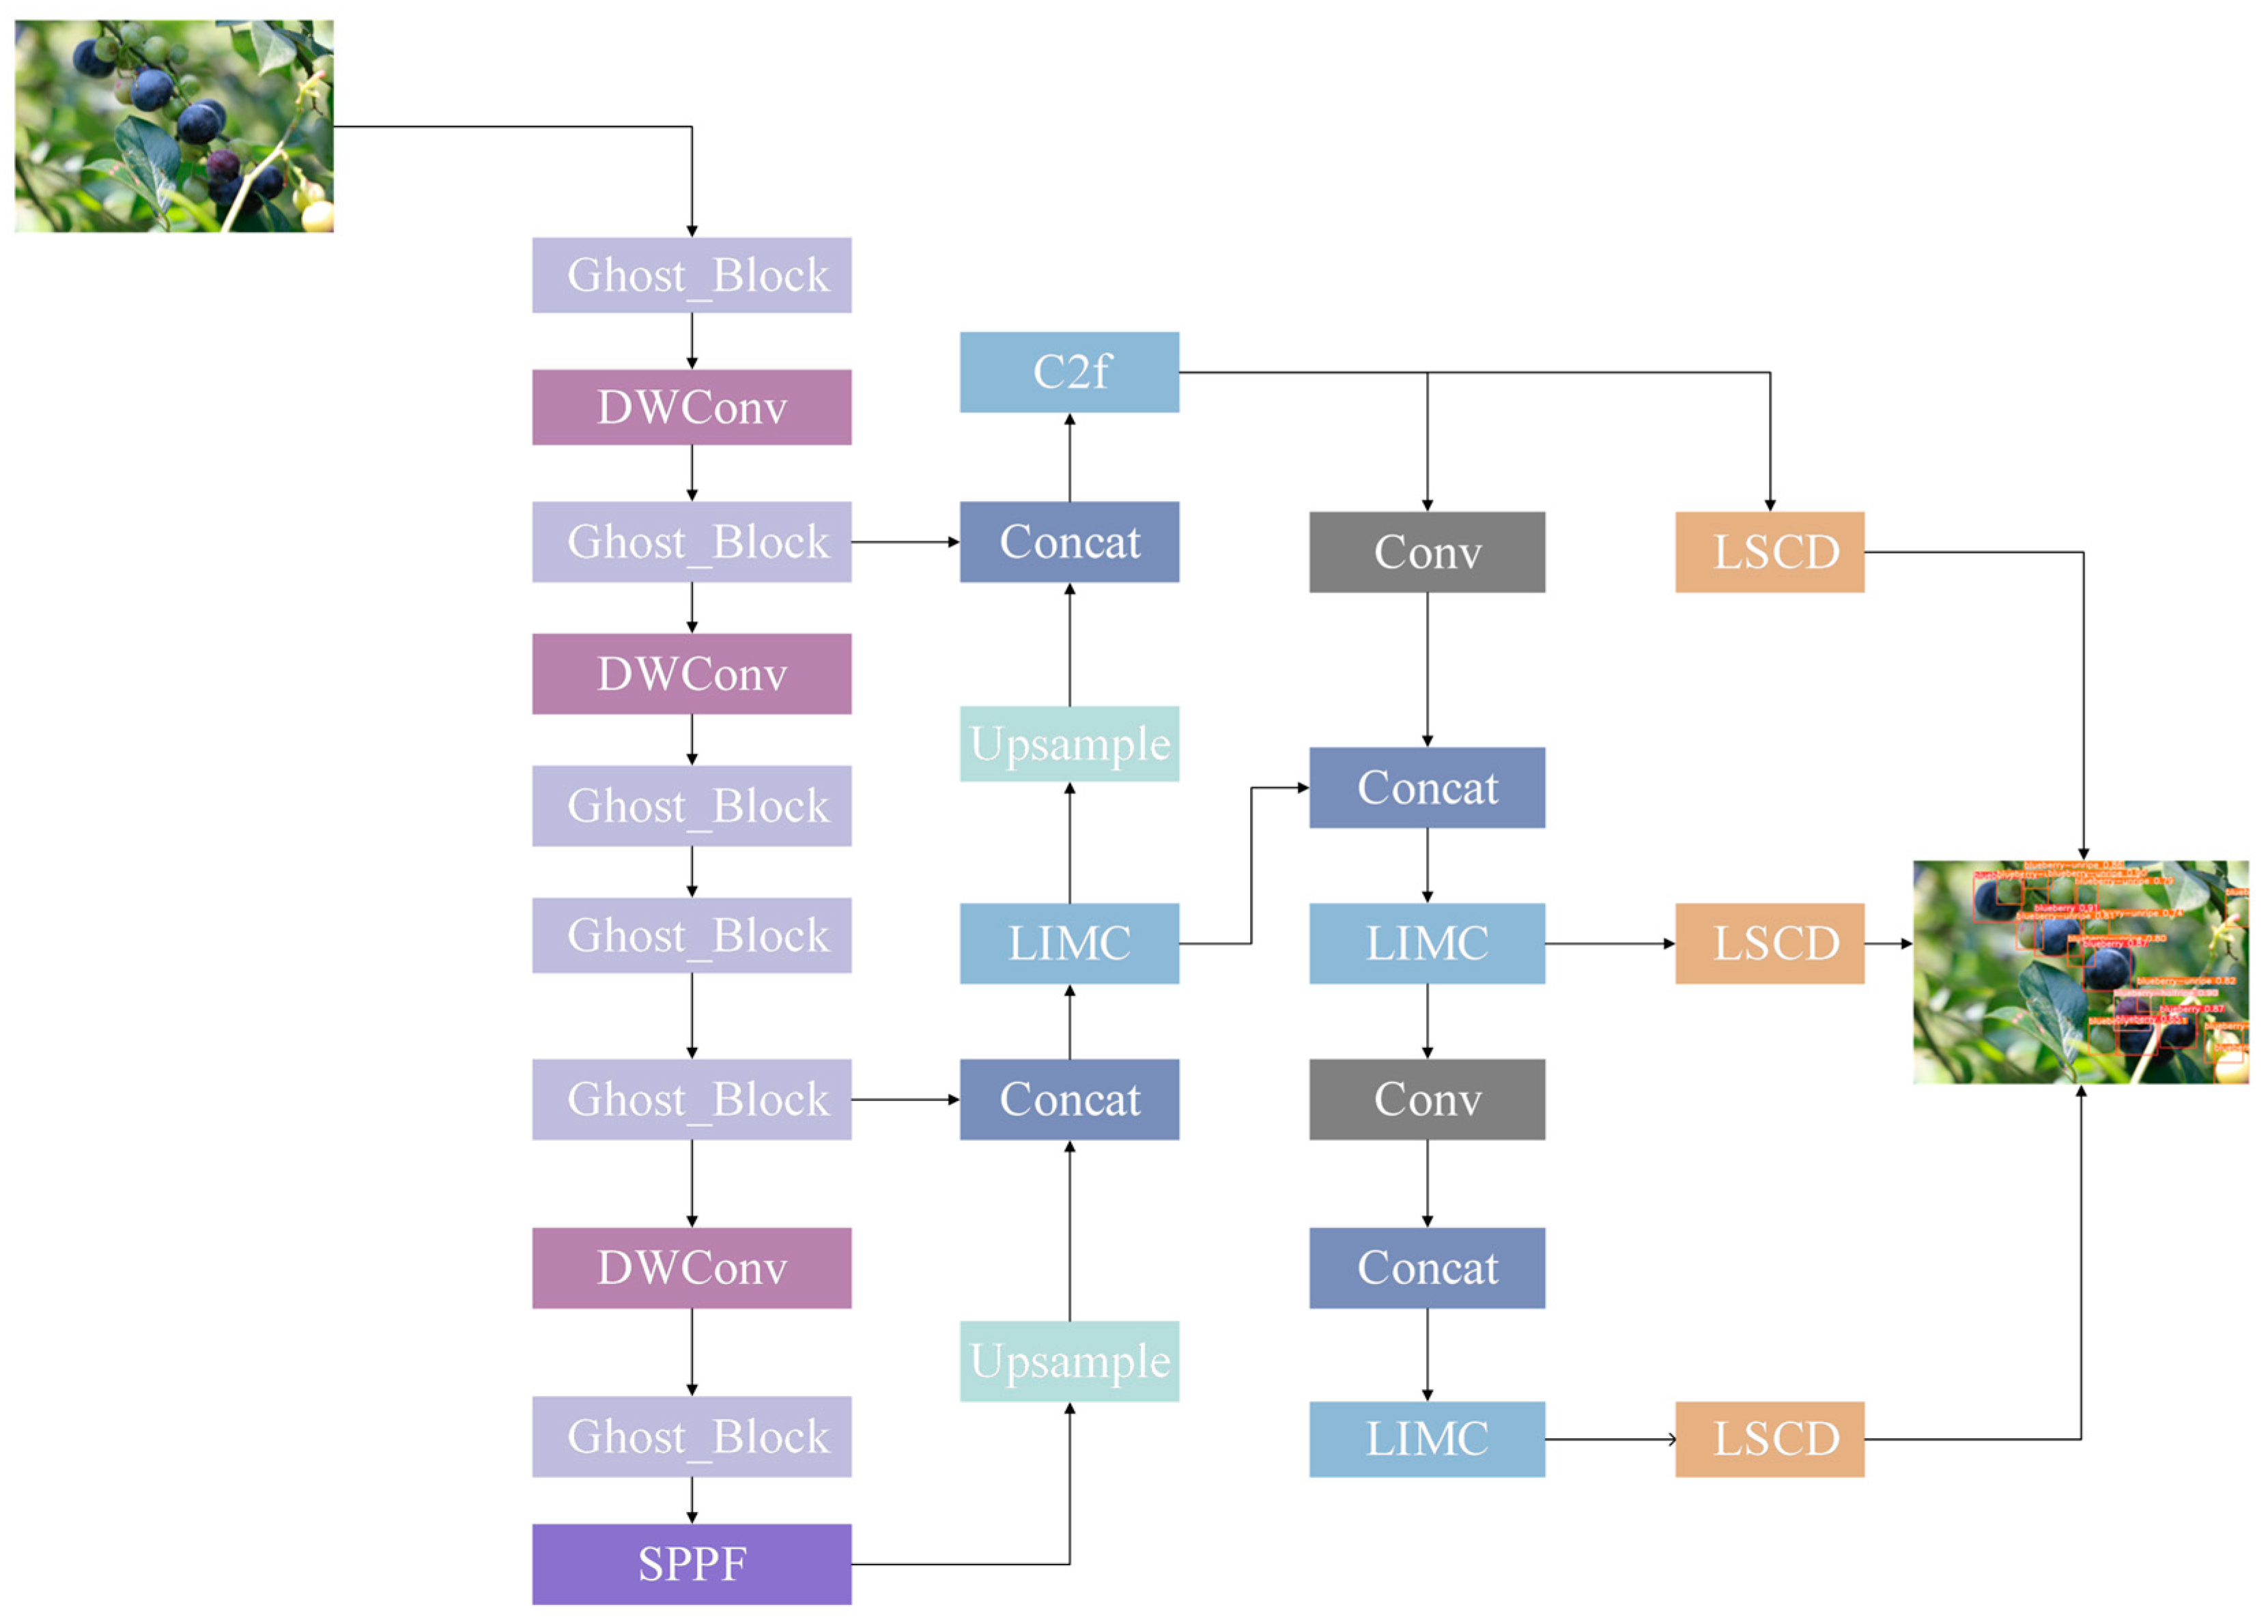
YOLOv8 [15] is one of the object detection models launched by the YOLO series, which includes YOLOv8n, YOLOv8s, YOLOv8m, YOLOv8l, and YOLOv8x5 versions. Although the recognition accuracy is slightly lower, YOLOv8n has the lightest model architecture and fastest detection speed, which is suitable for practical deployment. Therefore, in this study, YOLOv8n was selected as the basic model for the blueberry fruit maturity recognition task. However, for the actual detection of blueberry fruit maturity, YOLOv8n produced incorrect detections and also missed detections for overlapping blueberry fruits and leaf occlusion. The size of the model is still too large for the actual production environment, and it is difficult to directly apply it to orchards against complex environmental backgrounds. In order to solve these problems, the original YOLOv8n model was improved, and the GLL-YOLO model was proposed for the detection of blueberry fruit maturity in the actual environment. Figure 3 shows the framework diagram of the overall network model of GLL-YOLO. To make the model lightweight, this study used the GhostNetv2 module to replace the YOLOv8 backbone network. Specific details of the GhostNetv2 network module are presented in Section 3.2. In addition, to enable the model to simultaneously maintain accuracy and reduce complexity, the LIMC convolution module is proposed. The specific details of LIMC will be introduced in Section 3.3. This study also proposes the LSCD (Lightweight Shared Convolutional Detection Head) detection head to improve the utilization of parameters, and the specific principle of LSCD will be introduced in Section 3.4.

3.2. GhostNetv2 Network Module

When deploying models on edge devices, both the performance and the efficiency of the model, especially the actual inference speed, should be considered. However, when the original YOLOv8 uses large-sized convolution kernels to process images, the computational cost is high. To this end, the GhostNetv2 network module is used to replace the YOLOv8 backbone network and achieve the purpose of reducing the calculation cost. The GhostNetv2 network [16] is a lightweight convolutional neural network designed for applications in mobile devices with faster inference speeds. GhostNetv2 proposes an improved architecture for mobile applications and its core component: the DFC attention mechanism. The DFC attention mechanism is mainly based on the fully connected layer (FC), which can be efficiently executed on general hardware. At the same time, it can capture the long-distance dependencies between pixels at different spatial locations, thereby significantly enhancing the expressiveness of the model. For a given feature tensor z R H W C (height H; width W; number of channels C), the Ghost module of GhostNetv2 can efficiently use standard convolution by sharing part of its transformation weights, and avoiding tensor remodeling and transpose operations that affect the actual inference speed. The direct implementation of the DFC attention mechanism is shown in Equation (1). In addition to processing input images with different resolutions and maintaining efficiency, DFC uses the general form shown in Equations (2) and (3) to aggregate pixel information along horizontal and vertical directions, respectively. In practice, this can be achieved efficiently by successively applying two decoupled deep convolutions with kernel sizes of 1 × K H and K W × 1, respectively. Theoretically, the computational complexity of DFC attention is O ( K H H W + K W H W ) .
a h w = h ,   w F h w , h w z h w ,
a h w = h = 1 H F h , h w H z h w , h = 1 , 2 , , H , w = 1 , 2 , , W
a h w = w = 1 W F w , h w W a h w , h = 1 ,   2 ,   ,   H , w = 1 ,   2 ,   ,   W  
Figure 4 shows the overall structure of GhostNetv2 when integrated with DFC attention. Firstly, the DFC attention branch processes the input features in parallel with the first Ghost module. Second, the attention map generated by the DFC branch is used to augment (e.g., via dot multiplication) the output features of the first Ghost module. Finally, these enhanced features are fed into the second Ghost module to produce the final output features.
This study integrates six groups of GhostNetv2 modules with Depthwise Separable Convolution (DWConv) and incorporates the DFC attention mechanism to augment the model’s feature extraction capabilities for blueberry fruits in complex environments. The DFC module enhances detection accuracy by efficiently aggregating pixel information along both horizontal and vertical axes. Table 2 presents the effects of using the GhostNetv2 architecture with DFC attention enabled and DFC attention disabled. Compared with the original YOLOv8 model, the proposed GhostNetv2 backbone network has achieved significant improvements in reducing the number of model parameters and computational complexity. The number of parameters and model size of the GhostNetv2 framework model have decreased significantly. By introducing DFC attention, the accuracy, recall rate, and precision of the improved model can be improved while slightly increasing the model size.

3.3. The LIMC Module

In computer vision tasks, the size of the target object varies greatly. The traditional model has a good detection effect on large individuals. However, due to the small target and complex background of blueberry fruit, the traditional algorithm is not effective in detection. Therefore, the ability of the model to perform small object individual detection is the key issue to be addressed in this paper. In this study, we improved the deep convolution model to further advance the feature extraction ability. In addition, the LIMC module was innovated and developed to be applied to the individual detection of blueberry fruits to achieve fast and accurate detection of blueberry fruits. The LIMC module utilizes the principle of grouped convolution and uses convolution kernels of different sizes to process in parallel while capturing feature information of different scales. Figure 5 shows the LIMC module structure diagram. Firstly, the input information is divided into two channels, and part of the data information is input directly through the ordinary convolution layer, and, at the same time, through the EMSConv convolution block. Finally, a 1 × 1 convolution is used to fuse the features of three different scales. A new EMSConv convolution block is proposed in the LIMC module. The EMSConv convolutional block is composed of three channels, and the extracted feature data are divided into three parts, occupying 50%, 25% and 25% of the original channels, respectively. In the model, a convolution operation involving multiple convolution kernels of different sizes is used to capture features of different scales. In practical work, 1/2 of the original data is output directly, and then two groups of 1/4 channels are used with 3 × 3 and 5 × 5 convolution kernels to obtain blueberry feature information at different scales. Finally, a 1 × 1 convolution is used to fuse the features of three different scales. Using the above methods, multi-scale features can be effectively extracted, which helps improve the generalization ability and detection performance of the model.
In terms of model design, the proposed network module uses 50% of the original channel to feed back through the 1 × 1 convolution in LIMC; at the same time, 25% of the channel number is processed by the 3 × 3 convolution, and the other 25% is processed by the 5× 5 convolution. Finally, the three outputs are concatenated. This design allows the network model to maintain the same number of output channels as the C2f module in the original YOLOv8 model. At the same time, the multi-scale feature extraction ability is introduced to effectively capture the feature information of different scales in blueberry images through convolution kernels of different sizes. When the network model calculates the number of parameters and the type of convolution operation, it needs to consider the kernel width, kernel height, the number of input channels, and the width and height of the output feature map for each output feature map. This can be expressed as the kernel_width (Kw), kernel_height (Kh), input_channels (Ci), output_channels (Co), output_width (W), and output_height (H), as shown in Equation (4). When the input is a standard square feature map, the number of parameters is reduced to the kernel size and the number of channels, as shown in Equation (5).
p a r a m s = C o × k w × k h × C i + 1 F L O P s = C i × k w × k h + C i × k w × k h 1 + 1 × C o × W × H  
p a r a m s = C o × k 2 × C i + 1 F L O P s = 2 × C i × k 2 × C o × W × H  
For the assessment of blueberry maturity, single-scale convolutional kernels are limited to capturing local features of small targets, such as edges and textures, but they struggle to discern the relationships between these small targets and their surrounding environment or contextual information. Conversely, larger convolutional kernels offer an expanded receptive field, enabling the capture of the environmental context around small targets. To enhance the model’s adaptability on embedded devices or UAV platforms with constrained computational resources, this study replaced the 3 × 3 convolutional block within the C2f module of YOLOv8 with the multi-scale convolutional approach of the LIMC module. LIMC is added after the Concat layer, and the input and output channels are kept consistent with the original YOLOv8. Table 3 shows the effect of the demonstration on the model using the original C2f module of YOLOv8 and the LIMC module proposed in this paper. In terms of model size, the parameter of YOLOv8 (LIMC) is 2193177, which is 27% less than the 3,011,433 size of the original YOLOv8 using C2f. On GFLOPs (G), the model uses LIMC to reach 6.2 G, which reduces the computational complexity by 24% compared with the original 8.2 G.

3.4. LSCD Module

In actual blueberry fruit maturity detection, the module faces the challenge of accuracy degradation caused by leaf and fruit occlusion. In addition, each detection head (P3, P4, P5) in YOLOv8 processes the input feature map independently, lacking information interaction, which can lead to information loss and affect the detection effect. To address these challenges, this paper proposes a Lightweight Shared Convolutional Detection Head (LSCD). Figure 6 shows the schematic diagram of the LSCD structure. Firstly, the original P3, P4 and P5 layer outputs of YOLOv8 are uniformly input into a 1 × 1 Conv-GN module (convolution + group normalization) for channel adjustment and preliminary feature fusion. Then, a 3 × 3 Conv-GN module is used to extract shared features. Subsequently, the shared features are fed into three sets of parallel branches, each containing Conv-Reg (regression convolution) and Conv-Cls (classification convolution) modules, which are output to the corresponding scale layer for object box prediction and classification, respectively.
Group normalization (GN) is used in the LSCD module to enhance the performance of detection head positioning and classification [17]. GN [18] was proposed by He Kaiming in 2018, aiming to address the issue of Batch Normalization (BN)’s dependence on batch size. GN divides the channels of a sample into multiple groups and normalizes each group. By using shared convolution, the number of parameters can be significantly reduced.
The LSCD module can determine the feature points corresponding to each Ground Truth Box through the Conv-Reg and Conv-Cls sections in Figure 6. After obtaining these feature points, the predicted box corresponding to the position of the feature point can be extracted. The IOU’s loss calculated using the real box and the prediction box can be used as an important part of the loss of the Conv-Reg (regression) part and the Conv-Cls (classification) part, respectively. It effectively improves the accuracy of the model by judging the object categories in the prediction frame, so that the model can still better identify and locate individual blueberry fruits in the face of the common problem of leaf occlusion and fruit occlusion in blueberry detection. At the same time, in order to solve the problem caused by the inconsistency of the detection target scale of multiple shared convolutional heads, the scale layer (scale layer) is introduced after Conv-Reg (the convolutional layer for regression). This layer regards the scaling function as a layer connected to the neural network input and scales the feature data with different scales passed from the upper layer through mathematical calculations, and finally unifies the target scale of these feature data. Aiming to solve the serious leaf and fruit occlusion problem in the blueberry scene, LSCD can significantly improve the model’s ability to identify and locate individual fruits under complex occlusion conditions through its shared feature extraction layer (Conv-GN) and enhanced loss mechanism based on IoU and cross-entropy. At the same time, LSCD can overcome the problem of information fragmentation and potential missed detections caused by the original detection head of YOLOv8 by independently processing the feature map, and its shared convolutional structure forces the P3, P4, and P5 hierarchical information to be fused at the front end of the detection head, which can improve the feature utilization efficiency. In addition, the Conv-Scale layer integrated by LSCD is designed to deal with the problem of different detection level (P3/P4/P5) target scales and ensures that the model can maintain robust detection performance for blueberry fruits of all sizes through feature scaling.

4. Experimental and Results Analysis

4.1. Test Equipment

To ensure the fairness of the experiments for detecting the ripeness of blueberry fruits, all experiments involved in this study were performed using the same equipment. As shown in Table 4, the specific hardware configuration and software environment of the device are given. In the model parameters setting, the initial learning rate is set to 0.01; the batch size is set to 24; the learning rounds are set to 200; the momentum is set to 0.937; and the weight decay rate is set to 0.0005. Table 5 shows the experimental results using the SGD and AdamW optimizers in the same experimental environment. Under the same experimental environment, different optimizers are basically consistent in terms of model accuracy, precision, recall rate, etc. However, it should be considered that when the number of images processed by the model exceeds 2000, the number of iterations exceeds 10,000. More iterations cause AdamW to consume more memory. Considering that the core objective of this study is to design a lightweight model suitable for edge device deployment, we ultimately chose SGD as the optimizer for all experiments, and subsequent experiments were also based on the SGD optimizer.

4.2. Main Comparison Parameter Quantity

In the model training effect evaluation, a multi-dimensional performance evaluation system was constructed through three core indicators: precision (P), recall (R), and mean average precision (mAP). The precision, P, reflects the proportion of positive samples correctly predicted by the model in all the predicted positive samples, which is often used in scenarios that emphasize a reduction in the risk of misjudgment. The recall, R, focuses on measuring the comprehensiveness of the model to capture true positive samples, and is calculated as the proportion of correctly predicted positive samples in all the actual positive samples. Average precision (AP) is the proportion of the area enclosed by the model’s P-R curve and the coordinate axis, and the default Intersection over Union (IoU), which is 0.5, expresses the average precision of the model. The mean average precision (mAP) is the average of APs across multiple classes, and mAP50 means that the calculated IoU is 0.5, which measures the average performance of the model using different classes. The calculation formula of accuracy precision is shown in Equation (6). The formula for calculating the recall rate, R, is shown in Equation (7). The calculation formula of average precision, AP, is shown in Equation (8). The formula for calculating the average accuracy rate, mAP, of the whole class is shown in Equation (9).
P = T P T P + F P
R = T P T P + F N
A P = 0 1 P r d r
m A P = I = 1 N A P i N
Among them, TP is the number of true positives for blueberry fruit ripeness correctly identified by the model; FN is the number of positive samples predicted as negative by the model; and FP represents the number of negative blueberry fruits incorrectly identified as positive. M denotes the total number of maturity levels, and N denotes the total number of images in the test set.

4.3. Test Results

4.3.1. Analysis of Blueberry Fruit Ripeness Detection Results

In order to meet the lightweight design and improve the detection accuracy, this study evaluates the performance of the GLL-YOLO model for the detection of blueberry maturity and compares the improved GLL-YOLO model with the YOLOv8 model. The detection results are shown in Table 6. The experimental results show that compared with YOLOv8, GLL-YOLO improves the accuracy, recall, and mAP by 2.3%, 5.9%, and 1%, respectively. Compared with the original YOLOv8, the parameters, FLOPs, and model size of GLL-YOLO are significantly reduced while maintaining the accuracy effect, and the parameters, FLOPs, and model size are reduced by 50%, 39%, and 46.7%, respectively. Table 7 shows the maturity detection performance index values of GLL-YOLO and YOLOv8 for each maturity level. It can be seen from the results that the mAP of immature, semi-ripe, and ripe blueberry fruits detected by GLL-YOLO reaches 94.51%, 91.72%, and 93.32%, respectively, which is 4.29%, 1.67%, and 1.39% higher than that of YOLOv8, respectively. At this time, Figure 7 shows the PR plots for YOLOV8 and GLL-YOLO as well as the PR curve comparison of the improved GLL-YOLO model and the YOLOv8 model. On the whole, the area ratio of our proposed model on the PR curve is larger than that of the original model, which has better attention for TP samples, and our proposed model has a better effect on mAP.

4.3.2. Visual Evaluation of the Improved Model GLL-YOLO by Grad-CAM

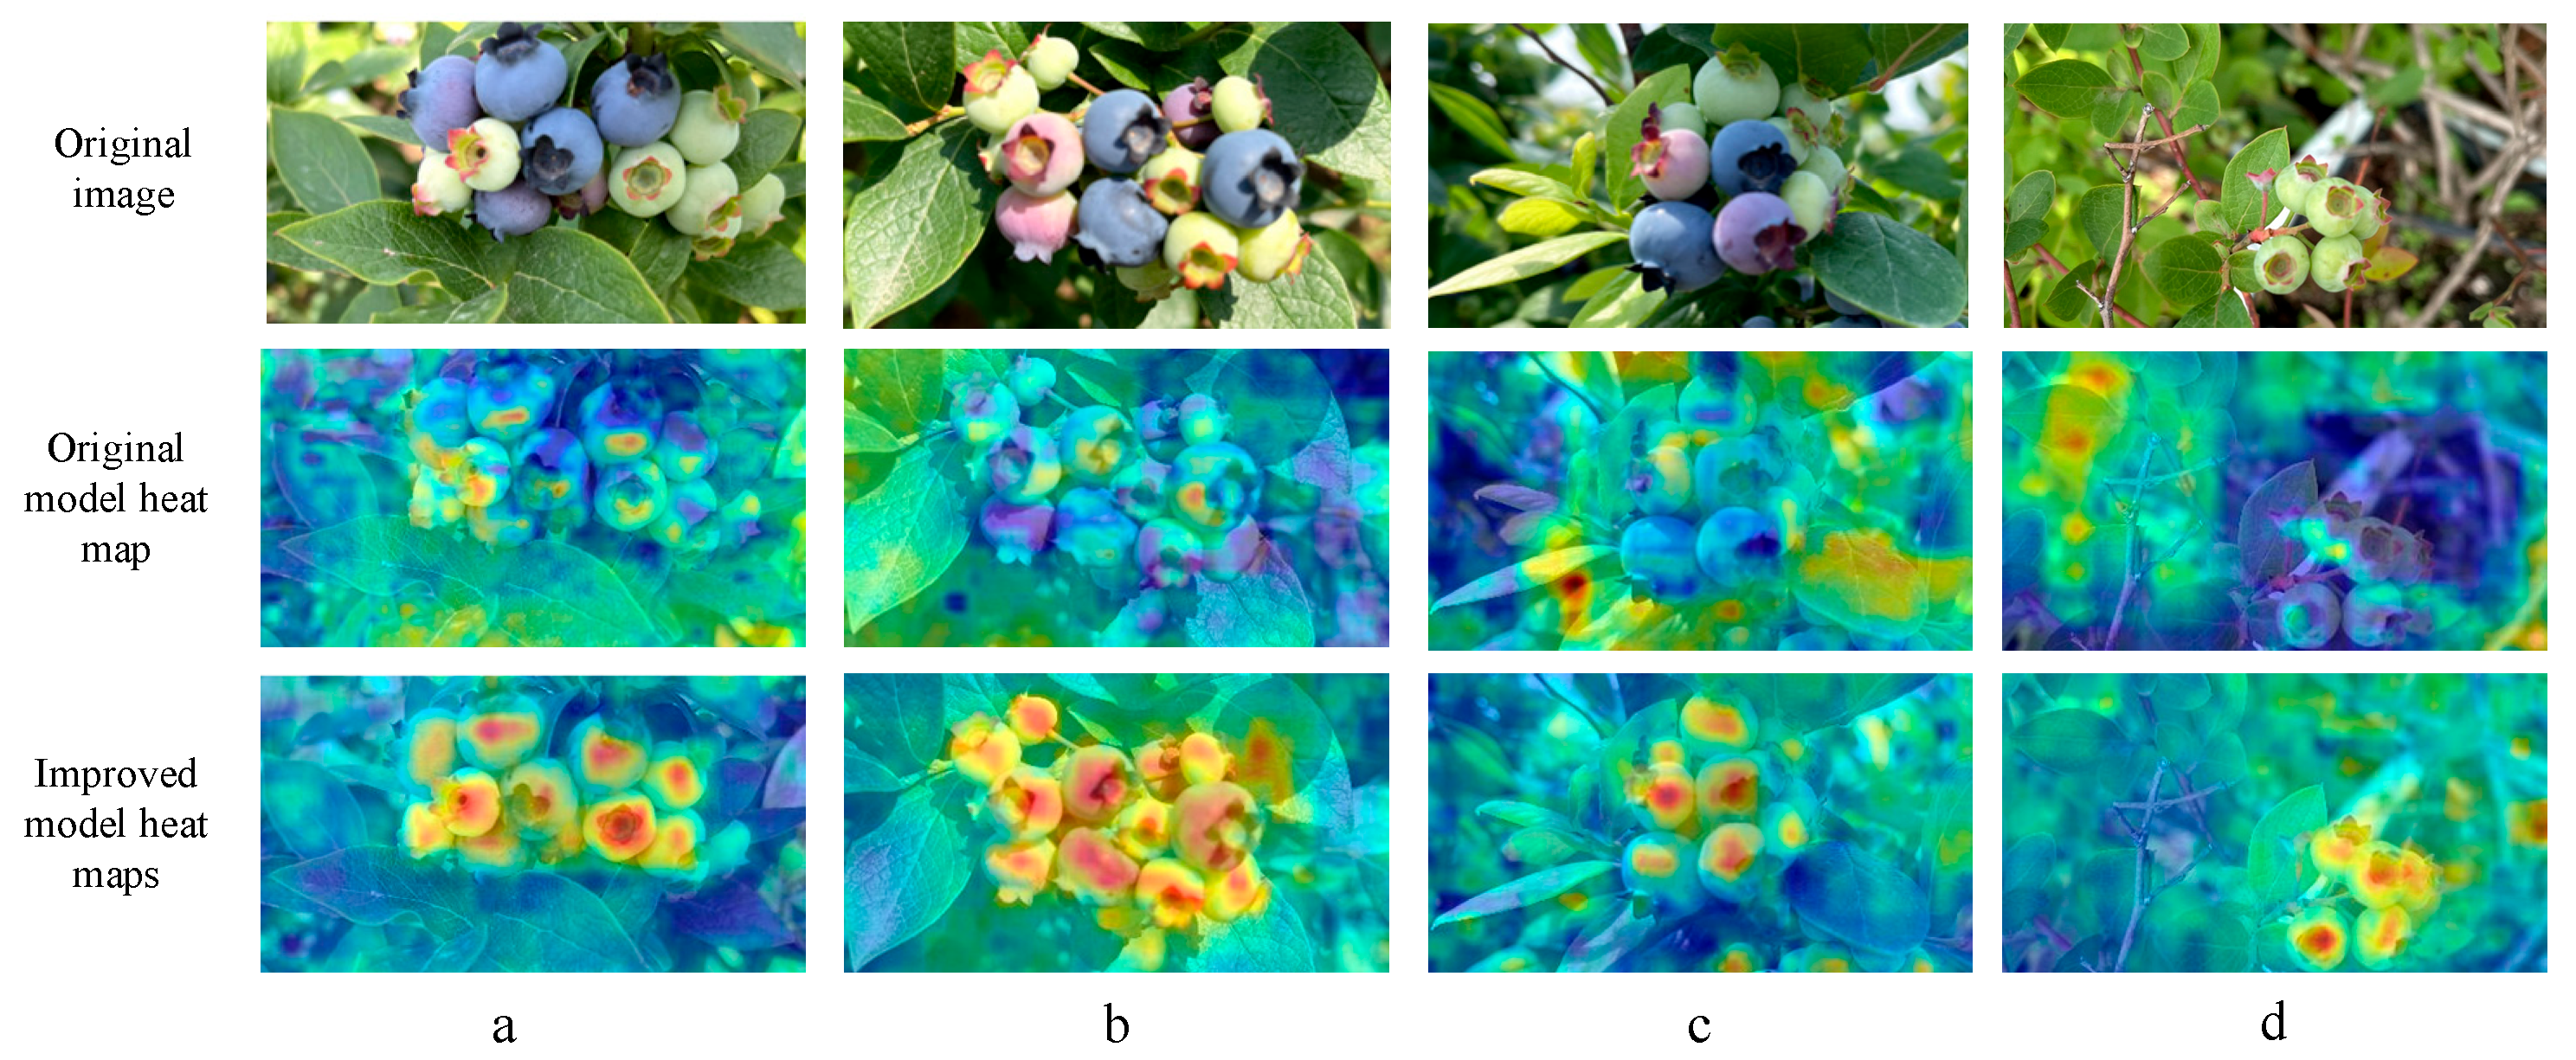
In order to intuitively show the detection performance of the GLL-YOLO model for blueberry fruit maturity in a natural orchard environment, the Gradient-Weighted Class Activation Mapping (Grad-CAM) method was used to verify the performance. The heat map visualization results of the YOLOv8 model and the GLL-YOLO model generated by Grad-CAM are shown in Figure 8. All blueberry fruit images in Figure 8 are from the test set of the blueberry fruit ripeness detection dataset, and the ripeness levels decrease from left to right. Blue and cyan colors in the heat map indicate that the region has low attention compared to the maturity detection results, while red and orange colors in the heat map indicate that there are more contributions to the maturity detection results within the region.
As shown in Figure 8a,b, YOLOv8 was used to detect blueberry fruit maturity in a natural orchard environment. Under the interference of a complex orchard background, YOLOv8 paid less attention to blueberry fruits. However, the attention of the GLL-YOLO model to the blueberry fruit region was significantly enhanced, while the irrelevant background could be suppressed. Through these visualization results, it was initially confirmed that the proposed method is effective at enhancing attention to the blueberry fruit and reducing background interference. In addition, as shown in Figure 8c,d, the original YOLOv8 model has poor detection performance for dense fruits and occluded leaves when detecting blueberry fruit maturity, which is also the main reason for fruit omission and wrong detection. From the heat map of GLL-YOLO, it can be seen that this problem is adequately solved, allowing the model to exhibit high detection accuracy for small fruits. The above results indicate that the proposed GLL-YOLO is suitable for detecting blueberry fruit maturity in natural orchard environments.

4.3.3. Ablation Experiment

To further prove the advantages of the GLL-YOLO model, ablation experiments were carried out on the GLL-YOLO model. GLL-YOLO uses a lightweight network model (GhostNetV2) to replace the original backbone network and adopts the LSCD small object detection head and LIMC module proposed in this paper. In addition, to ensure the correctness of the ablation experiments, they are carried out under the same environment and use the same hyperparameters. The ablation experiment results of the GLL-YOLO model are shown in Table 8. Note that “√” represents enabled modules.
As can be seen from the results in Table 5, the LIMC module, the LSCD module, and the GhostNetV2 backbone network used in this study all provide positive feedback on the performance of YOLOv8 on specific tasks. Among them, after introducing the LIMC module into the YOLOv8 backbone network, the accuracy (predict), recall (recall), and mAP are increased by 1.9%, −0.2% (with a slight decrease), and 0.4%, respectively. The average parameter number and GFLOPs are reduced to 2.19 M and 6.2 G, respectively, and the model is lighter. Compared with YOLOv8, the precision of YOLOv8 + LSCD is increased by 2.4; the recall rate is significantly increased by 4.3%; the mAP is increased by 1.7%; and the parameter number and GFLOPs are also reduced to 2.30 M and 6.5 G. In addition, compared with YOLOv8, using only the GhostNetV2 backbone network significantly improves the recall rate (+5.9%); the precision rate increases by 2.3%; and the mAP increases by 1%. At the same time, the number of parameters (−0.8 M) and GFLOPs (−2.0 G) are greatly reduced, which are 27.7% and 24.4% lower than the original model, respectively.
For YOLOv8 + LSCD + GhostNetv2, we combined the LSCD module and GhostNetv2 module backbone network into YOLOv8, and the precision, recall, and mAP reached 85%, 88.9% and 92.2%, respectively. Although the accuracy decreased, the parameter number and GFLOPs of YOLOv8 + LSCD + GhostNetv2 were lower than those of the YOLOv8 + LSCD combination. Combined with the LIMC module, LSCD module, and GhostNetv2 backbone network, the YOLOv8 + LIMC + LSCD + Ghos-tNetv2 model is constructed. Compared with YOLOv8, the accuracy, recall rate, and mAP increased by 2.3%, 5.9% and 1.0%, respectively. Adequate results were obtained from all the experiments of blueberry fruit maturity detection. Meanwhile, the number of parameters and GFLOPs of YOLOv8 + LIMC+ Ghost Netv2 were only 1.66 M and 5.0 G. Compared with the original model, the number of parameters reduced by about 44.7%, and the computational efficiency improved by about 39.0%. The ablation experiment results verified the effectiveness of the LIMC module, LSCD module, and GhostNetv2 module of the GLL-YOLO model.

4.3.4. Experimental Comparison of Mainstream Standard Object Detection Models

To further evaluate the performance of GLL-YOLO, this paper compared GLL-YOLO with mainstream standard object detection models based on the same dataset, including YOLOv3, Faster R-CNN (VGG16), YOLOv5, YOLOv6n, YOLOv8n, YOLOv9, and YOLOv10 [19,20,21,22,23,24,25]. The statistical results of the blueberry fruits’ ripeness detection performance of different mainstream standard object detection models and the GLL-YOLO model are shown in Table 9.
From the data in Table 9, we found that GLL-YOLO has better performance in detecting blueberry fruit maturity. Compared with other mainstream detection models, GLL-YOLO has higher advantages for accuracy, recall rate, and mAP. Compared with the two-stage object detection Faster-RCNN model, the number of parameters, FLOPs, and model size of GLL-YOLO were significantly reduced. The accuracy of GLL-YOLO was 4.8%, 2.0%, and 2.3% higher than that of YOLOv3, YOLOv5, and YOLOv8n object detection models, respectively. In terms of model size, GLL-YOLO outperformed YOLOv3, YOLOv5, and YOLOv8n with only 1.5 MB.
Figure 9 shows the radar chart analysis results based on the data in Table 9, which compares the GLL-YOLO model with several current mainstream standard target detection models in a multi-dimensional, intuitive, and comprehensive way. Each axis of the radar chart represents a key evaluation index. Including precision (P), recall (R), mean average precision (mAP), model size parameters, and model calculation GFLOPs, GLL-YOLO occupies the leading position in the radar chart. It forms a fuller and more prominent polygonal area than other mainstream standard object detection models. Based on the above results and analysis, it can be seen that the proposed GLL-YOLO model has significant advantages in accuracy, model size, and efficiency compared with the mainstream standard object detection models in the blueberry fruit maturity detection task.

4.3.5. Comparison Experiments of Mainstream Lightweight Object Detection Models

In addition to the mainstream standard object detection models, this paper also compares GLL-YOLO with mainstream lightweight object detection models, including starnet_50, EfficientViT_M0, mobilenetv4, fasternet, timm, and HGNetV2 [26,27,28,29,30]. The statistical results of the blueberry fruit ripeness detection performance between different mainstream lightweight object detection models and the GLL-YOLO model are shown in Table 10.
From Table 10, we can see that GLL-YOLO outperforms other mainstream lightweight object detection models in terms of precision, recall, and mAP. The precision, recall, and mAP of GLL-YOLO reach 86.90%, 88.70%, and 91.90%, respectively. Compared with other lightweight object detection models, the maturity detection accuracy and mAP of GLL-YOLO are 1.10% and 1.80% higher than those of the starnet_50 model with the best lightweight effect. The model size is reduced by 33.30%, and the number of parameters is reduced by 23.07%. Compared with the timm model with the highest accuracy, the accuracy is increased by 0.40%, and the model size and floating-point amounts are significantly reduced, decreasing by 85.75% and 88.73%, respectively.
Figure 10 presents the radar chart analysis results based on the data in Table 10. The graph synthetically presents the performance comparison of five core evaluation metrics: Precision (P), Recall (R), mean Average Precision (mAP), model parameters (Params), and computational complexity (GFLOPs). The analysis shows that the GLL-YOLO model undertakes comprehensive performance advantages in comparison with the current mainstream lightweight object detection models: It not only obtains the highest mean average precision (mAP) and the best recall (R), but also performs well in lightweight models, with the smallest number of model parameters (Params) and the lowest computational complexity (GFLOPs). This excellent synergy for the key indicators of detection accuracy and model efficiency is intuitively reflected in the polygon area corresponding to GLL-YOLO in the radar map, which covers a significantly larger area than other comparison models and has the fullest shape. Based on the above results, it can be concluded that in the context of the specific task of blueberry fruit maturity detection, compared with other mainstream lightweight models, GLL-YOLO achieved significant improvements in key accuracy indicators (especially mAP and R) and model lightweighting (Params and GFLOPs), as well as a better comprehensive balance. This result verifies the strong comprehensive strength of the GLL-YOLO model in multi-dimensional performance and highlights its significant potential in resource-constrained scenarios (such as edge device deployment).

4.3.6. Results and Analysis of Blueberry Detection Experiment

In the growing environment of blueberries, there are often dense branches and leaves, background interference with similar colors, and mutual occlusion between fruits, which put forward extremely high requirements for the performance of object detection models.
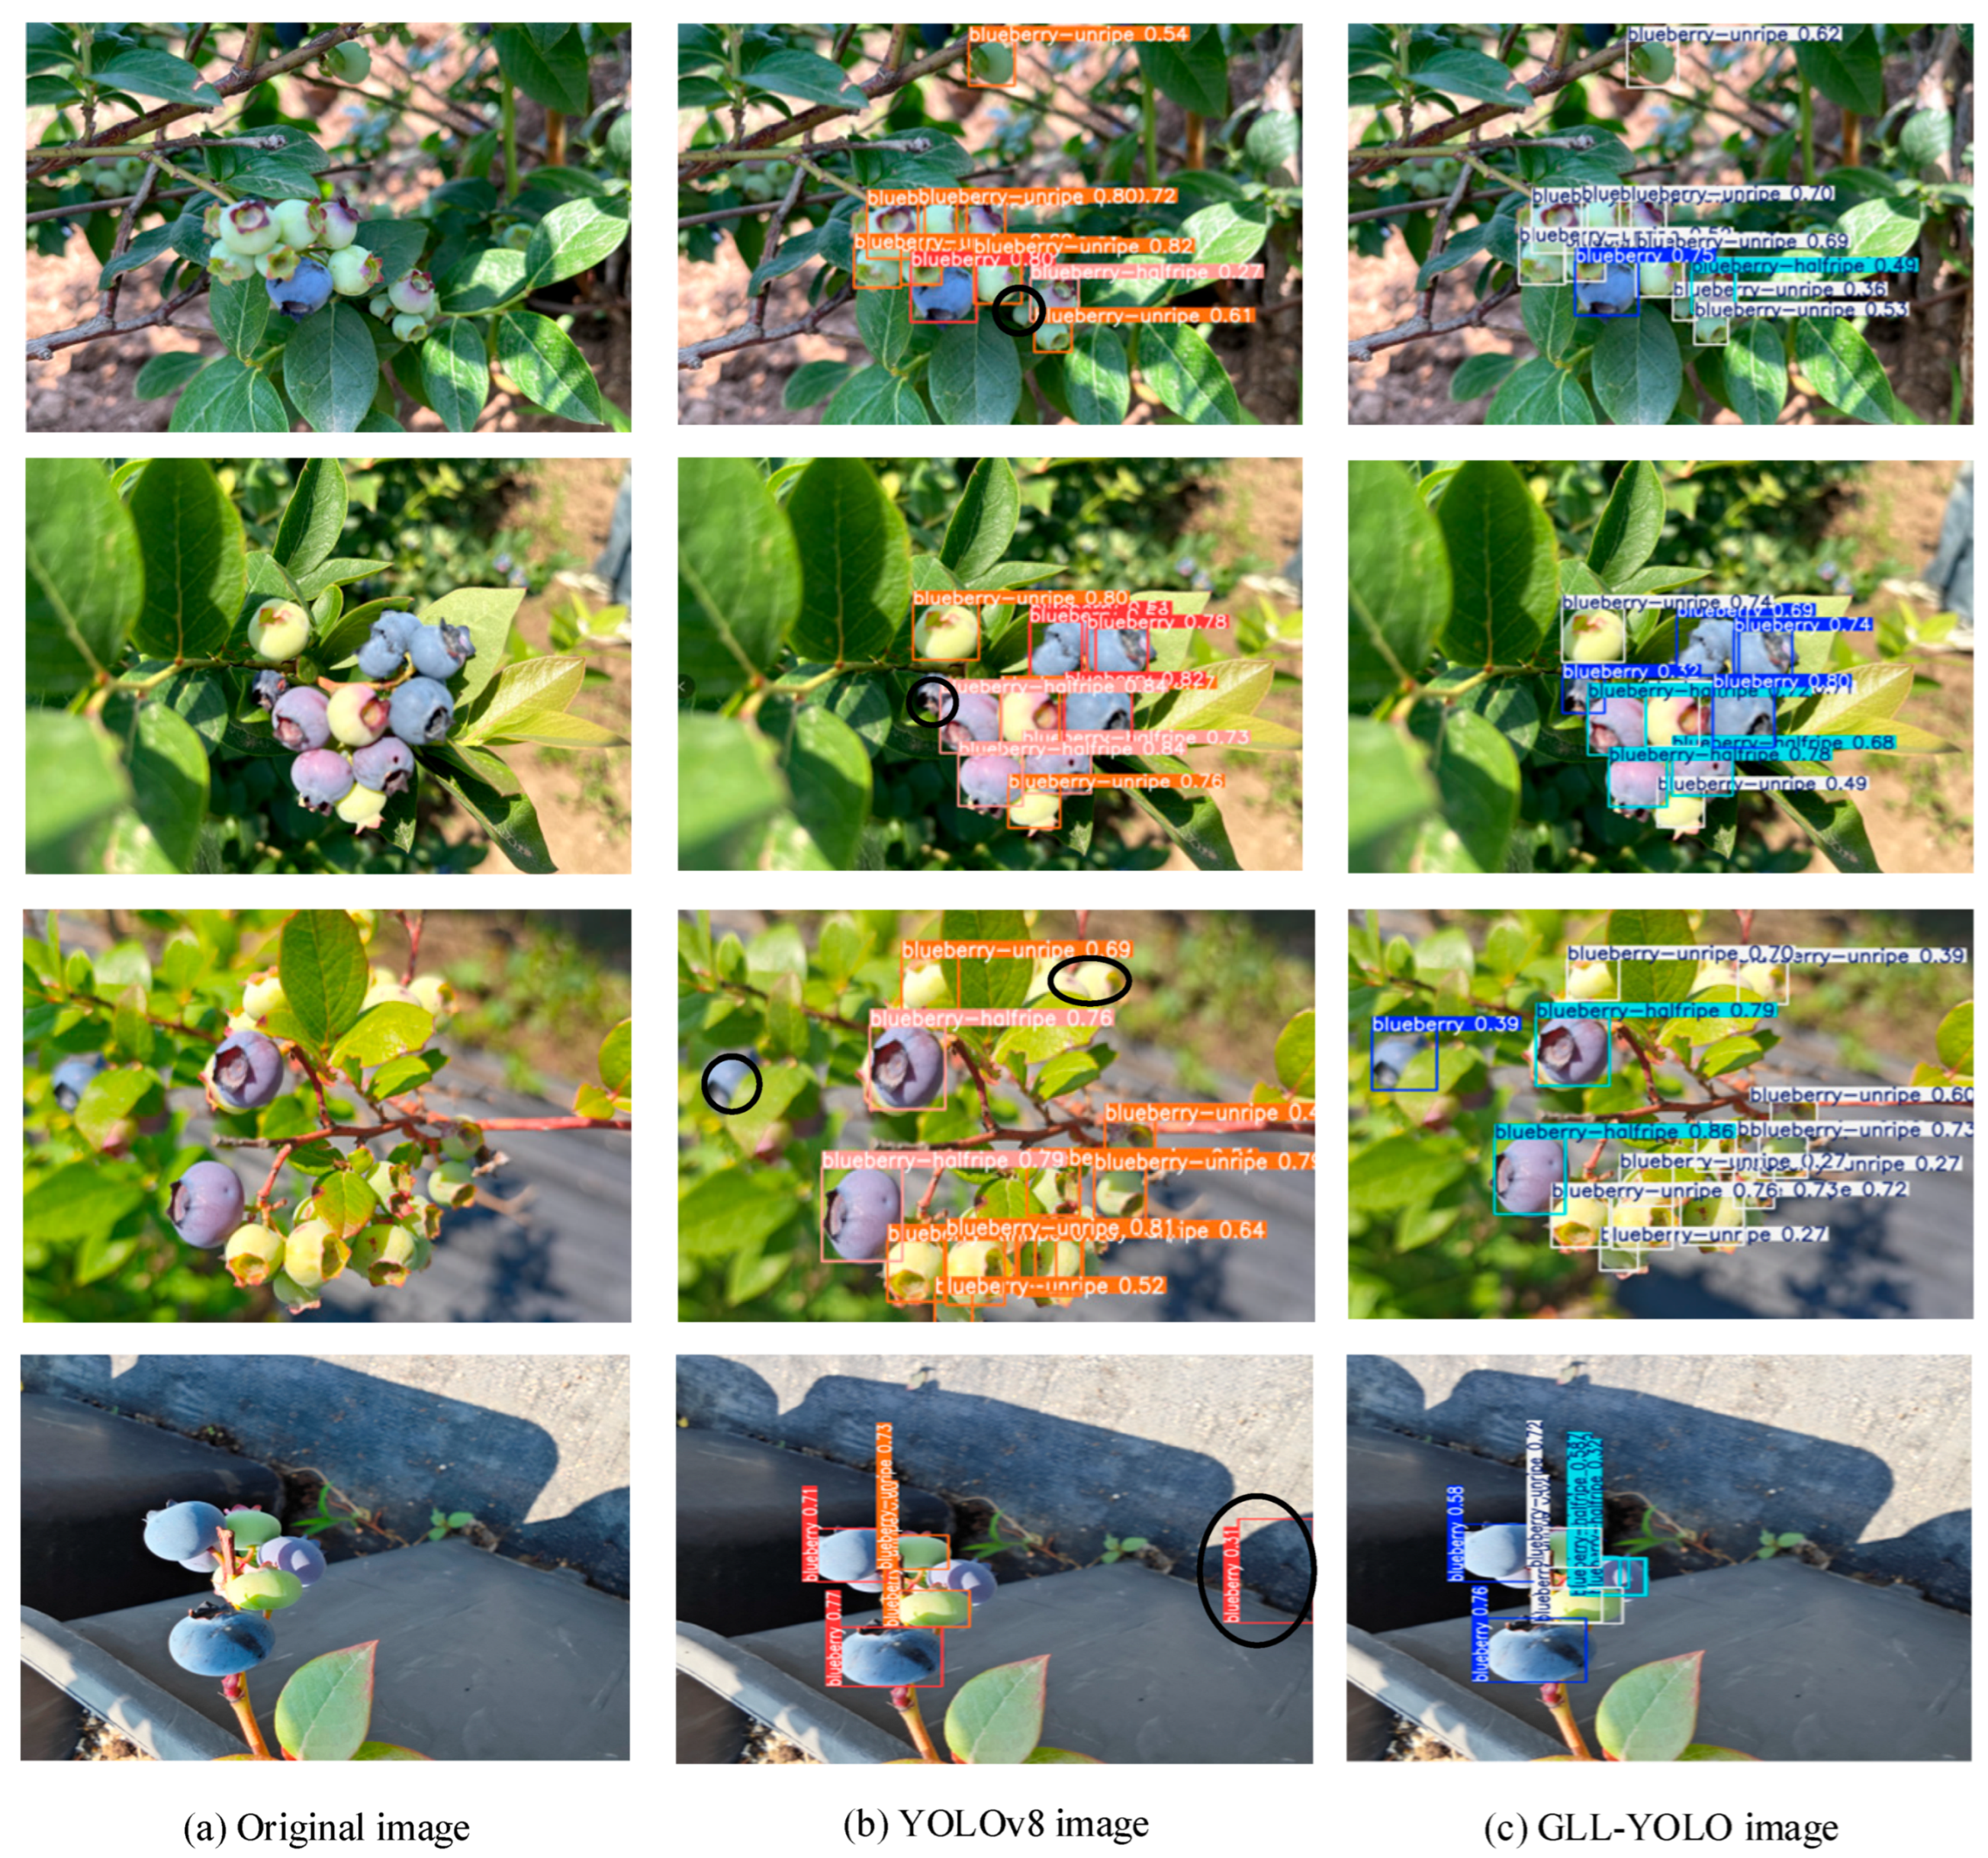
Figure 11 shows the detection results of blueberry fruit maturity based on YOLOv8 and GLL-YOLO. In Figure 11, panel a is the original image; panel b is the image detected by YOLOv8; and panel c is the image detected by GLL-YOLO. Analysis of the detection results of YOLOv8 in Figure 11b shows that there is a significant detection bias in the model, which is characterized by the coexistence of missed detection (that is, failure to identify part of the target) and false detection (that is, mistakenly recognizing the background or other non-target objects, such as blueberry fruits). In the areas marked with specific markers (such as circled parts), YOLOv8 fails to identify blueberry fruits partially occluded by branches and leaves or in dense clusters, and at the same time, misidentifies some background interference as targets, which directly affects the integrity and accuracy of its detection under complex backgrounds. In contrast, the detection results of GLL-YOLO in Figure 11c show higher robustness and accuracy. This model not only successfully recognizes and detects the maturity of most blueberry fruits in the image but can also maintain high accuracy when dealing with complex situations with significant overlap and partial occlusion between targets, which effectively overcomes the problem that traditional models are susceptible to fruit occlusion interference.
The experimental results in Figure 11 confirm the excellent performance of the GLL-YOLO model in the detection task of blueberry fruit maturity, especially in responding to challenging problems such as complex backgrounds and target occlusion; its performance is significantly better than YOLOv8n, which provides strong support for accurate detection in a complex agricultural environment.

4.3.7. Embedded System Experiment

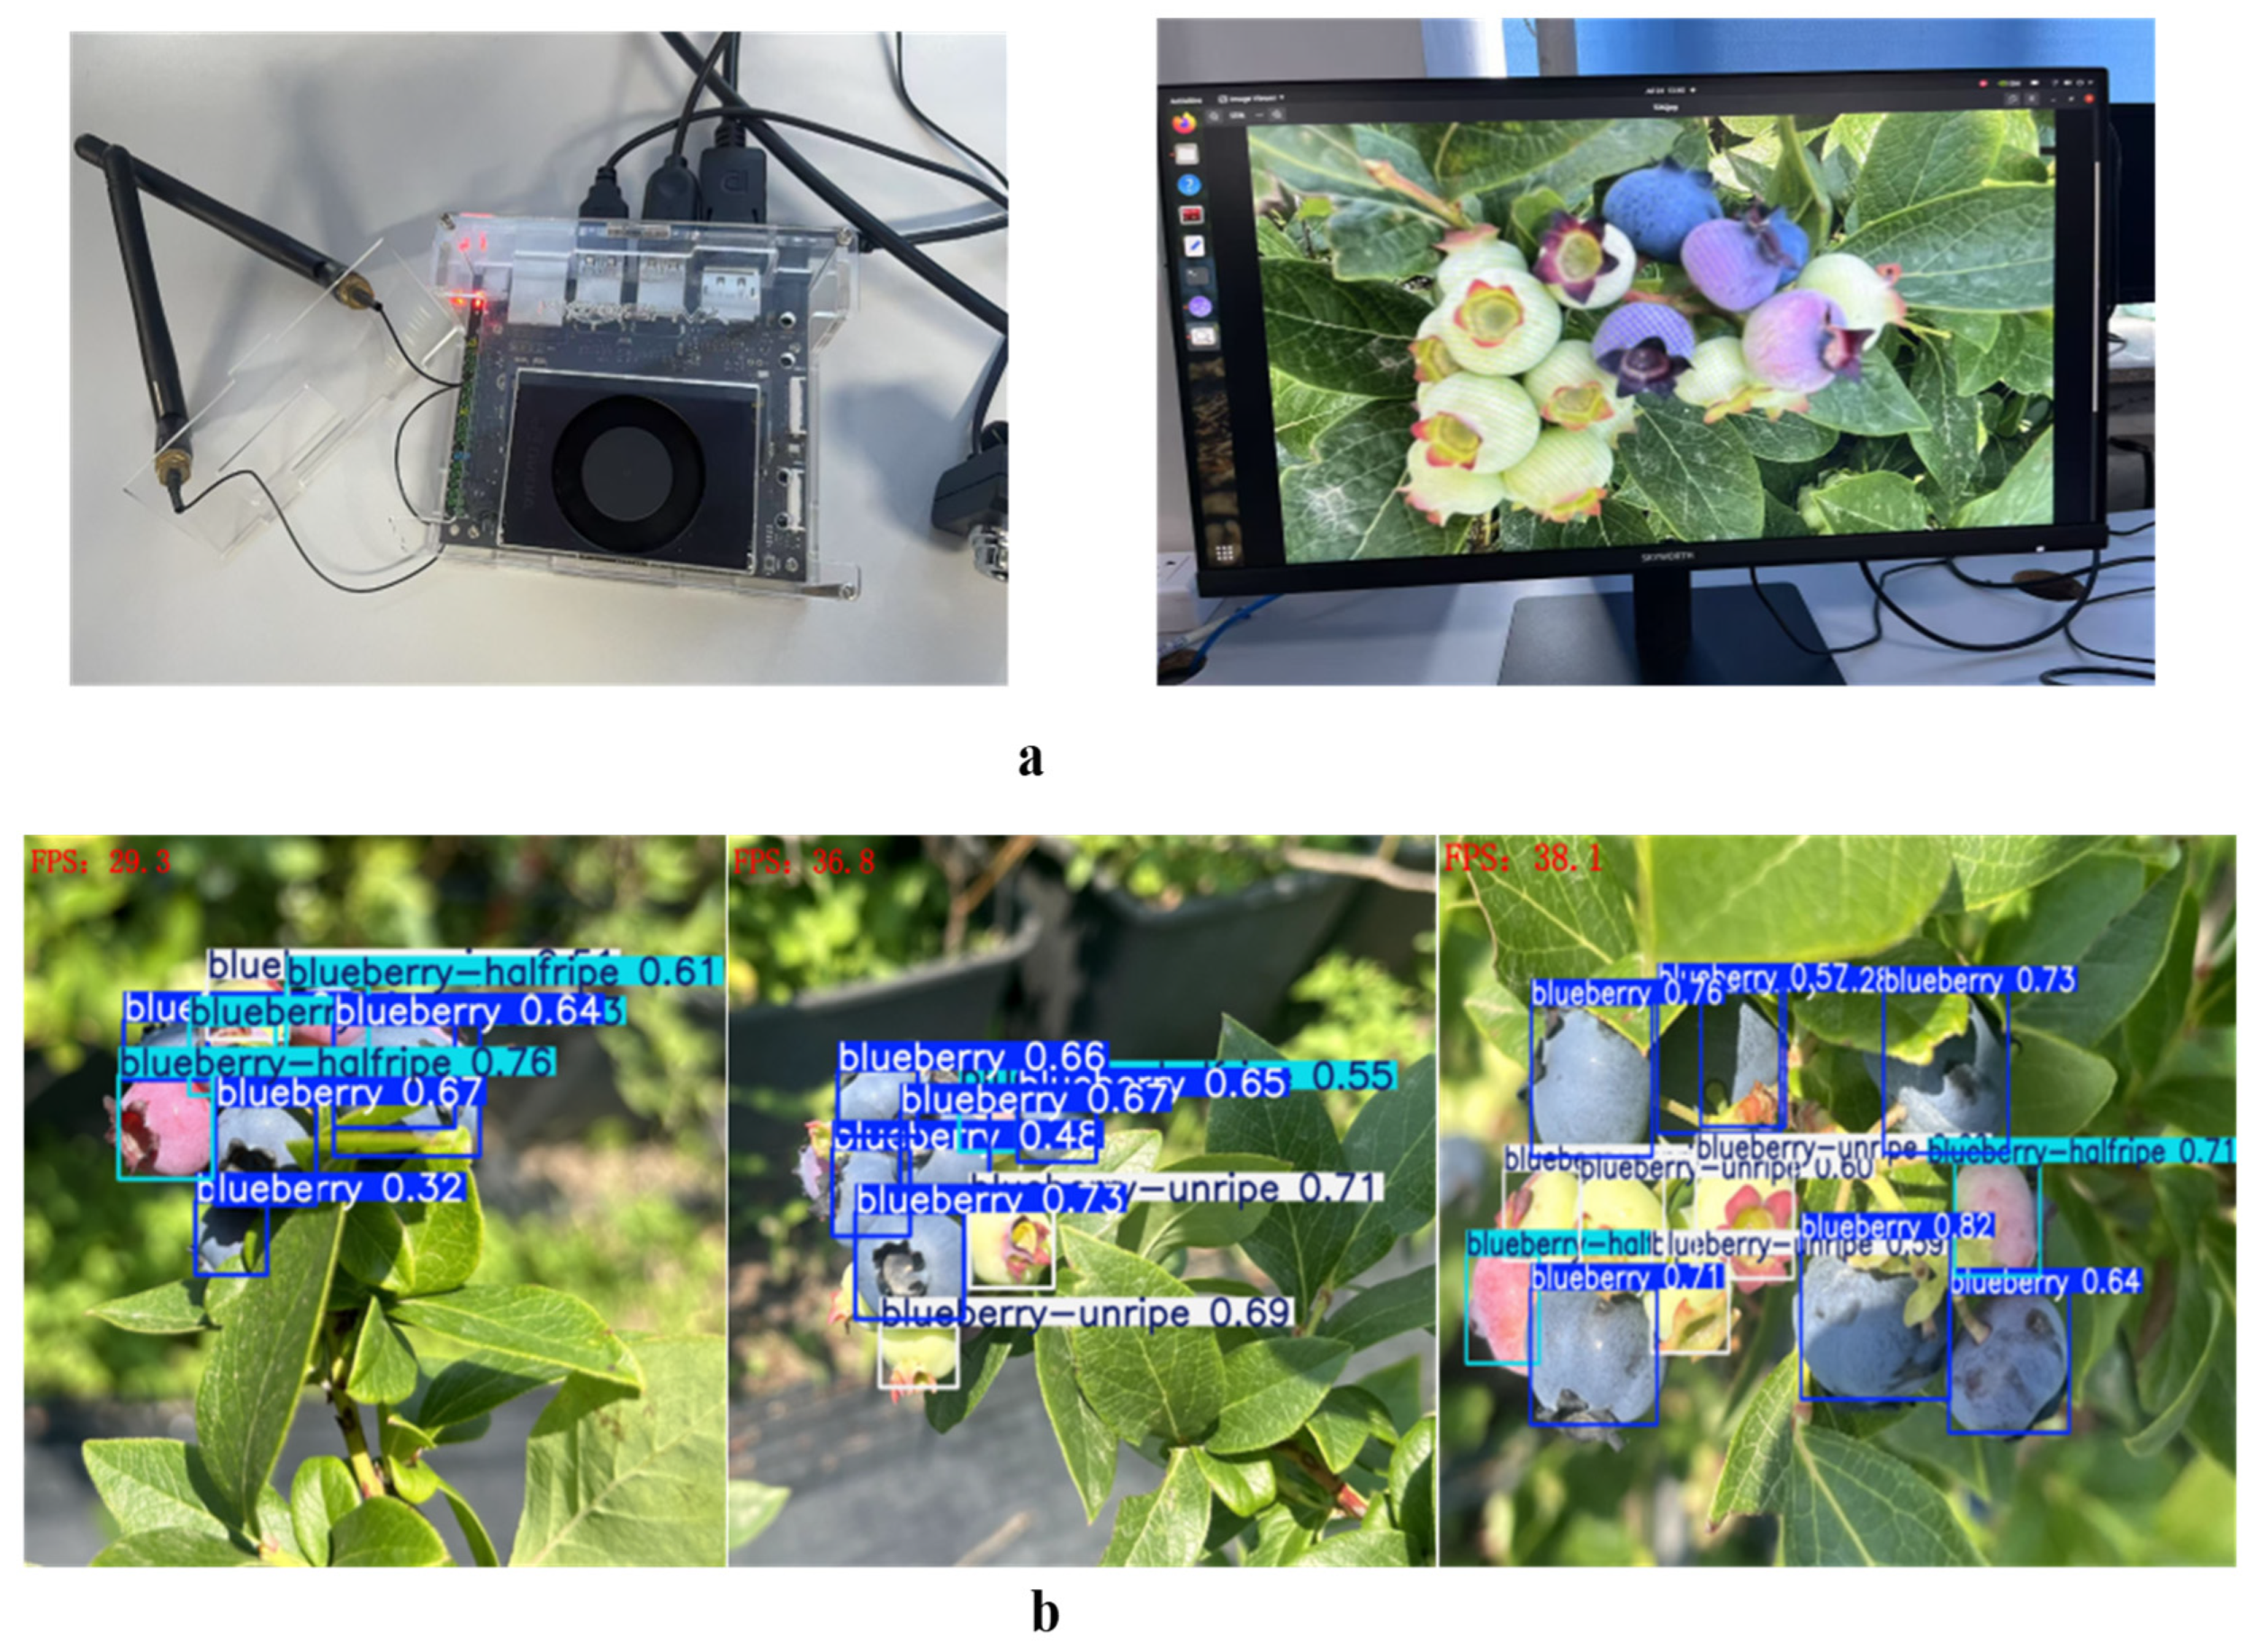
In order to verify the feasibility of our proposed GLL-YOLO model in practical applications, especially the evaluation of the efficiency and stability of its deployment on resource-constrained edge devices, this study deploys the Jetson Orin Nano device for modeling and performance testing, and its hardware is shown in Figure 12a. Jetson Orin Nano runs on Ubuntu 20.04.5 LTS with Python 3.8 and PyTorch 1.8.0 configured as the software environment. It is equipped with an Arm Cortex-A78AE CPU and NVIDIA Amperage architecture with a 32-tensor core GPU that provides the necessary computational power for model inference. This trial focused on the inference speed of the model and was measured in frames per second (FPS), which is crucial to determine whether the method can meet the needs of real-time application scenarios such as smart picking. As shown in Figure 12b, the detection effect deployed on Jetson Orin Nano is good, the maturity detection is accurate, and the FPS fluctuates between 25 and 40. This speed range fully proves the significant advantages of the model in real-time performance, which is sufficient to meet the needs of most real-time detection applications.
The GLL-YOLO algorithm proposed in this paper runs stably on resource-constrained edge devices, further indicating that the response delay of the algorithm is controlled within an acceptable range and will not significantly affect real-time applications. At the same time, the utilization of CPU and GPU resources is at a reasonable level, which not only ensures performance, but also avoids the unnecessary wasting of resources. In addition, its power consumption performance also meets the operating requirements of edge devices and does not result in too high an energy burden. Together, these positive features provide a solid foundation and strong technical support for the further deployment, optimization, and large-scale application of our algorithm in edge scenarios such as smart harvesting devices.

5. Discussion

At present, our experiment has mainly been carried out based on the “Ruizhu” variety of blueberry at the Small Berry Genetic Center of Jilin Agricultural University. Although the pilot area has good experimental conditions and complete equipment, due to the single variety and controlled environment, the adaptability and robustness of the model under diverse varieties, different phenology stages, and complex field conditions still need to be fully verified. In addition, weather conditions and seasonal changes will also affect the performance of the model. Future work will carry out cross-regional and multi-growth cycle image data acquisition and annotation for typical blueberry-producing areas in China. By systematically integrating blueberry fruit phenotypic data from multiple origins and varieties, we will focus on optimizing the recognition accuracy and stability of the model against different backgrounds.

6. Conclusions

Accurate detection of blueberry fruit maturity in natural orchard environments is fundamental to the development of selective harvesting robots. To address this challenge, this study involved first building a comprehensive blueberry fruit ripeness dataset specifically designed to enhance the robustness of the model in complex environments such as dense foliage, similar colored backgrounds, and fruit occlusions. Based on this, we propose an improved lightweight detection model called GLL-YOLO. This model utilizes GhostNetV2 as a more effective backbone for YOLOv8 and is further optimized by combining our proposed LIMC and LSCD modules. Our experimental results verify the effectiveness of the proposed method. The detection accuracy of the GLL-YOLO model in three different maturity stages reached 95.37%, 91.31%, and 89.03%, respectively. Crucially, our model is highly efficient, with its parameters and GFLOPs compressed to 1.5 M and 5.0 G on average, resulting in a model size of 3.3 MB. Compared with other existing methods, GLL-YOLO has significant advantages in terms of detection accuracy and model efficiency, making it suitable for real-time applications in embedded devices.

Author Contributions

Conceptualization, Y.X. and H.L.; Methodology, Y.X. and H.L.; Validation, H.L. and Y.Z. (Yang Zhou); Formal analysis, H.L. and Y.Z. (Yuting Zhai); Data curation, Y.Y. and D.F.; Writing—original draft preparation, H.L.; Writing—review and editing, Y.X., Y.Z. (Yang Zhou) and D.F.; Supervision, Y.Z. (Yuting Zhai), Y.X. and Y.Z. (Yang Zhou); Project administration, Y.X. and D.F.; Funding acquisition, D.F. All authors have read and agreed to the published version of the manuscript.

Funding

This research was funded by the Science and Technology Development Plan Project of Jilin Province (NO.20250202014NC).

Data Availability Statement

The original contributions presented in the research are included in the article; further inquiries can be directed to the corresponding author.

Conflicts of Interest

The authors declare no conflicts of interest.

References

  1. Kalt, W.; Cassidy, A.; Howard, L.R.; Krikorian, R.; Stull, A.J.; Tremblay, F.; Zamora-Ros, R. Recent Research on the Health Benefits of Blueberries and Their Anthocyanins. Adv. Nutr. 2020, 11, 224–236. [Google Scholar] [CrossRef]
  2. Luchese, C.L.; Pavoni, J.M.F.; Spada, J.C.; Tessaro, I.C. Influence of blueberry and jaboticaba agroindustrial residue particle size on color change of corn starch based films submitted to different pH values solutions. J. Renew. Mater. 2019, 7, 235–243. [Google Scholar] [CrossRef]
  3. Liu, X.; Zhao, D.; Jia, W.; Ji, W.; Sun, Y. A detection method for apple fruits based on color and shape features. IEEE Access 2019, 7, 67923–67933. [Google Scholar] [CrossRef]
  4. Wan, P.; Toudeshki, A.; Tan, H.; Ehsani, R. A methodology for fresh tomato maturity detection using computer vision. Comput. Electron. Agric. 2018, 146, 43–50. [Google Scholar] [CrossRef]
  5. Calixto, R.R.; Neto, L.G.P.; Cavalcante, T.d.S.; Lopes, F.G.N.; de Alexandria, A.R.; Silva, E.d.O. Development of a computer vision approach as a useful tool to assist producers in harvesting yellow melon in northeastern Brazil. Comput. Electron. Agric. 2022, 192, 106554. [Google Scholar] [CrossRef]
  6. Li, Y.; Cao, C.; Cao, M.; Guo, W. Transient sound signal analysis for watermelon ripeness detection using HHT and NMF. Comput. Electron. Agric. 2025, 237, 110543. [Google Scholar] [CrossRef]
  7. Huang, Y.P.; Wang, T.H.; Basanta, H. Using fuzzy mask R-CNN model to automatically identify tomato ripeness. IEEE Access 2020, 8, 207672–207682. [Google Scholar] [CrossRef]
  8. Jing, X.; Wang, Y.; Li, D.; Pan, W. Melon ripeness detection by an improved object detection algorithm for resource constrained environments. Plant Methods 2024, 20, 127. [Google Scholar] [CrossRef]
  9. Momeny, M.; Jahanbakhshi, A.; Neshat, A.A.; Hadipour-Rokni, R.; Zhang, Y.-D.; Ampatzidis, Y. Detection of citrus black spot disease and ripeness level in orange fruit using learning-to-augment incorporated deep networks. Ecol. Inform. 2022, 71, 101829. [Google Scholar] [CrossRef]
  10. Pisharody, S.N.; Duraisamy, P.; Rangarajan, A.K.; Whetton, R.L.; Herrero-Langreo, A. Precise Tomato Ripeness Estimation and Yield Prediction using Transformer Based Segmentation-SegLoRA. Comput. Electron. Agric. 2025, 233, 110172. [Google Scholar] [CrossRef]
  11. Tan, K.; Lee, W.S.; Gan, H.; Wang, S. Recognising blueberry fruit of different maturity using histogram oriented gradients and colour features in outdoor scenes. Biosyst. Eng. 2018, 176, 59–72. [Google Scholar] [CrossRef]
  12. Yang, W.; Ma, X.; Hu, W.; Tang, P. Lightweight blueberry fruit recognition based on multi-scale and attention fusion NCBAM. Agronomy 2022, 12, 2354. [Google Scholar] [CrossRef]
  13. Gai, R.; Liu, Y.; Xu, G. TL-YOLOv8: A blueberry fruit detection algorithm based on improved YOLOv8 and transfer learning. IEEE Access 2024, 12, 86378–86390. [Google Scholar] [CrossRef]
  14. MacEachern, C.B.; Esau, T.J.; Schumann, A.W.; Hennessy, P.J.; Zaman, Q.U. Detection of fruit maturity stage and yield estimation in wild blueberry using deep learning convolutional neural networks. Smart Agric. Technol. 2023, 3, 100099. [Google Scholar] [CrossRef]
  15. Yaseen, M. What is YOLOv8: An in-depth exploration of the internal features of the next-generation object detector. arXiv 2024, arXiv:2408.15857. [Google Scholar]
  16. Tang, Y.; Han, K.; Guo, J.; Xu, C.; Xu, C.; Wang, Y. GhostNetv2: Enhance cheap operation with long-range attention. Adv. Neural Inf. Process. Syst. 2022, 35, 9969–9982. [Google Scholar]
  17. Tian, Z.; Shen, C.; Chen, H.; He, T. Fcos: Fully convolutional one-stage object detection. In Proceedings of the IEEE/CVF International Conference on Computer Vision, Seoul, Republic of Korea, 27 October–2 November 2019; pp. 9627–9636. [Google Scholar]
  18. Wu, Y.; He, K. Group normalization. In Proceedings of the European Conference on Computer Vision (ECCV), Munich, Germany, 8–14 September 2018; pp. 3–19. [Google Scholar]
  19. Redmon, J.; Farhadi, A. Yolov3: An incremental improvement. arXiv 2018, arXiv:1804.02767. [Google Scholar] [CrossRef]
  20. Ren, S.; He, K.; Girshick, R.; Sun, J. Faster r-cnn: Towards real-time object detection with region proposal networks. IEEE Trans. Pattern Anal. Mach. Intell. 2017, 39, 1137–1149. [Google Scholar] [CrossRef]
  21. Zhang, Y.; Guo, Z.; Wu, J.; Tian, Y.; Tang, H.; Guo, X. Real-time vehicle detection based on improved yolo v5. Sustainability 2022, 14, 12274. [Google Scholar] [CrossRef]
  22. Li, C.; Li, L.; Jiang, H.; Weng, K.; Geng, Y.; Li, L.; Ke, Z.; Li, Q.; Cheng, M.; Nie, W.; et al. YOLOv6: A single-stage object detection framework for industrial applications. arXiv 2022, arXiv:2209.02976. [Google Scholar] [CrossRef]
  23. Wang, G.; Chen, Y.; An, P.; Hong, H.; Hu, J.; Huang, T. UAV-YOLOv8: A small-object-detection model based on improved YOLOv8 for UAV aerial photography scenarios. Sensors 2023, 23, 7190. [Google Scholar] [CrossRef] [PubMed]
  24. Wang, C.Y.; Yeh, I.H.; Mark Liao, H.Y. Yolov9: Learning what you want to learn using programmable gradient information. In Proceedings of the European Conference on Computer Vision, Milan, Italy, 29 September–4 October 2024; Springer Nature: Cham, Switzerland, 2024; pp. 1–21. [Google Scholar]
  25. Wang, A.; Chen, H.; Liu, L.; Chen, K.; Lin, Z.; Han, J.; Ding, G. Yolov10: Real-time end-to-end object detection. Adv. Neural Inf. Process. Syst. 2024, 37, 107984–108011. [Google Scholar]
  26. Ma, X.; Dai, X.; Bai, Y.; Wang, Y.; Fu, Y. Rewrite the stars. In Proceedings of the IEEE/CVF Conference on Computer Vision and Pattern Recognition, Seattle, WA, USA, 17–21 June 2024; pp. 5694–5703. [Google Scholar]
  27. Liu, X.; Peng, H.; Zheng, N.; Yang, Y.; Hu, H.; Yuan, Y. Efficientvit: Memory efficient vision transformer with cascaded group attention. In Proceedings of the IEEE/CVF Conference on Computer Vision and Pattern Recognition, Vancouver, BC, Canada, 17–24 June 2023; pp. 14420–14430. [Google Scholar]
  28. Qin, D.; Leichner, C.; Delakis, M.; Fornoni, M.; Luo, S.; Yang, F.; Wang, W.; Banbury, C.; Ye, C.; Akin, B.; et al. MobileNetV4: Universal models for the mobile ecosystem. In Proceedings of the European Conference on Computer Vision, Milan, Italy, 29 September–4 October 2024; Springer Nature: Cham, Switzerland, 2024; pp. 78–96. [Google Scholar]
  29. Chen, J.; Kao, S.-H.; He, H.; Zhuo, W.; Wen, S.; Lee, C.-H.; Chan, S.-H.G. Run, don’t walk: Chasing higher FLOPS for faster neural networks. In Proceedings of the IEEE/CVF Conference on Computer Vision and Pattern Recognition, Vancouver, BC, Canada, 17–24 June 2023; pp. 12021–12031. [Google Scholar]
  30. Zhao, Y.; Lv, W.; Xu, S.; Wei, J.; Wang, G.; Dang, Q.; Liu, Y.; Chen, J. Detrs beat yolos on real-time object detection. In Proceedings of the IEEE/CVF Conference on Computer Vision and Pattern Recognition, Seattle, WA, USA, 17–21 June 2024; pp. 16965–16974. [Google Scholar]
Figure 1. Data samples of blueberries at various stages of ripeness. Figure (a) represents images of unripe blueberries; Figure (b) represents images of semi-ripe blueberries; and Figure (c) represents images of ripe blueberries.
Agriculture 15 01877 g001
Figure 2. Data-enhanced images. (a) is the original image obtained by direct shooting; (b) is the random brightness-enhanced image; (c) is the effect image after adding random flipping; and (d) is the effect image after adding random rotation.
Agriculture 15 01877 g002
Figure 3. Framework of the GLL-YOLO overall network model.
Agriculture 15 01877 g003
Figure 4. Network structure diagram of GhostNetv2.
Agriculture 15 01877 g004
Figure 5. Figure (a) represents the overall LIMC module diagram, and Figure (b) represents the EMSConv convolution module diagram.
Agriculture 15 01877 g005
Figure 6. LSCD module.
Agriculture 15 01877 g006
Figure 7. PR plots for YOLOV8 and GLL-YOLO.
Agriculture 15 01877 g007
Figure 8. Visualization results of YOLOv8 and GLL-YOLO heat maps. The heat maps illustrate the model’s attention, where warmer colors (red/yellow) indicate higher focus. (a) A scenario with dense fruit clusters where the original model’s attention is scattered onto leaves, while the improved model accurately focuses on each fruit. (b) A case of overlapping fruits where the improved model maintains precise focus. (c) A scenario with partial leaf occlusion, where the improved model successfully suppresses background interference. (d) A challenging scenario with small, unripe green fruits, where the original model shows weak attention, but the improved model demonstrates significantly enhanced sensitivity and accurate localization.
Agriculture 15 01877 g008
Figure 9. Comparison of different models.
Agriculture 15 01877 g009
Figure 10. Comparison diagram of lightweight model.
Agriculture 15 01877 g010
Figure 11. Detection result diagram. (a) is the original image, (b) is the effect of YOLOv8 detection, and (c) is the effect of GLL-YOLO detection.
Agriculture 15 01877 g011
Figure 12. Effect diagram of embedded device. (a) shows the Jetson Orin Nano device, and (b) the detection results on the Nano device.
Agriculture 15 01877 g012
Table 1. Data distribution.
DatasetsNumber of Blueberry Fruit ImagesNumber of Target Blueberry Fruits
TotalTypesNumber
training180921164Blueberry—unripe7334
Blueberry—halfripe5182
Blueberry8648
test5166218Blueberry—unripe2310
Blueberry—halfripe1695
Blueberry2213
val2592855Blueberry—unripe1119
Blueberry—halfripe687
Blueberry1049
Table 2. GhostNetv2 model effect.
ModelPredict (%)Recall (%)mAP (%)Parameter (M)GFLOPs (G)
YOLOv884.682.890.93.008.2
+GhostNetv285.884.291.32.186.0
+GhostNetv2 + DFC86.988.791.92.206.2
Table 3. LIMC and C2f model data.
ModelPredict (%)Recall (%)mAP (%)ParametersGFLOPs (G)
YOLOv8 (C2f)84.682.890.930114338.2
YOLOv8 (LIMC)86.582.691.321931776.2
Table 4. Test equipment.
Environment ConfigurationParameter
Operating systemWindows11
CPUIntel(R) Core(TM) i5-12600KF
GPUNVIDIA GeForce RTX 4070 super
Development environmentPyCharm 2023.2.5
LanguagePython 3.9.6
FrameworkPyTorch 2.0.1
Operating platformCUDA 12.1
Table 5. Comparison of AadmW and SGD data.
Predict (%)Recall (%)mAP (%)
AdamW84.9 ± 0.782.7 ± 1.090.8 ± 0.7
SGD84.6 ± 0.682.8 ± 0.890.9 ± 0.5
Table 6. Comparison results with the original model.
Predict (%)Recall (%)mAP (%)Parameter (M)FLOPs (G)Size (MB)
YOLOv884.6 ± 0.682.8 ± 0.890.9 ± 0.53.08.26.2
GLL-YOLO86.9 ± 0.388.7 ± 0.791.9 ± 0.61.55.03.3
Table 7. Detection results of three maturity levels.
ModelBlueberry-UnripeBlueberry-HalfripeBlueberry
Predict (%)Recall (%)mAP (%)Predict (%)Recall (%)mAP (%)Predict (%)Recall (%)mAP (%)
YOLOv884.90 ± 0.582.89 ± 0.788.02 ± 0.583.49 ± 0.381.51 ± 0.590.34 ± 1.785.1 ± 0.483.99 ± 0.794.34 ± 0.3
GLL-YOLO87.23 ± 0.389.23 ± 0.689.03 ± 0.685.01 ± 0.387.01 ± 0.691.31 ± 1.385.01 ± 0.689.86 ± 0.695.37 ± 0.4
Table 8. Model ablation tests.
Base ModelLIMCLSCDGhostNetV2Predict (%)Recall (%)mAP (%)Parameter (M)GFLOPs (G)
YOLOv8 84.682.890.93.008.2
86.582.691.32.196.2
87.087.192.62.306.5
86.988.791.92.206.2
85.088.992.21.665.3
86.086.192.22.216.3
82.385.691.22.166.0
86.988.791.91.505.0
Table 9. Comparative experiments of mainstream object detection models.
ModelPredict (%)Recall (%)mAP (%)Params (M)GFLOPs (G)
YOLOv382.186.991.5103.66282.2
Faster-RCNN85.387.292.0136.15521.6
YOLOv584.987.492.79.1123.8
YOLOv6n84.086.690.84.2311.8
YOLOv8n84.682.890.93.008.2
YOLOv984.088.191.97.1626.7
YOLOv1078.474.281.92.266.5
GLL-YOLO86.988.791.91.505.0
Table 10. Detection results of different lightweight network models.
ModelPredict (%)Recall (%)mAP (%)Param (s)GFLOPs (G)
starnet_5085.881.990.12.256.50
EfficientViT_MO87.682.491.44.009.40
mobilenetv487.383.791.35.7022.5
fasternet84.886.891.94.1710.7
timm86.584.691.813.3235.1
HGNetV285.485.091.62.356.90
GLL-YOLO86.9 88.791.91.505.00
Disclaimer/Publisher’s Note: The statements, opinions and data contained in all publications are solely those of the individual author(s) and contributor(s) and not of MDPI and/or the editor(s). MDPI and/or the editor(s) disclaim responsibility for any injury to people or property resulting from any ideas, methods, instructions or products referred to in the content.